


Next-LCD
User Manual
Multifunctional Portative Spectrum Analyzer
2015
Kirill Berezin
Spl-Lab
20.02.2015

2
Table of Contents
Table of Contents ............................................................................................................................ 2
General Information ........................................................................................................................ 3
Ergonomics .................................................................................................................................. 4
Package Contents ......................................................................................................................... 4
Working with the device.................................................................................................................. 5
Important safety information: ...................................................................................................... 5
Identifying the functional parts of the device: ............................................................................. 6
Charging the battery of the device ............................................................................................... 7
Starting work and configuring the device .................................................................................... 7
Connecting to PC via the USB port ............................................................................................. 8
Connecting to PC via the Wireless network ................................................................................ 8
Operation modes .......................................................................................................................... 9
The generator mode GEN .............................................................................................................. 10
SPL Measuring Mode .................................................................................................................... 11
Spectrum .................................................................................................................................... 11
Signal waveform ........................................................................................................................ 12
Digitized data ............................................................................................................................. 12
AVG Measuring Mode .................................................................................................................. 14
RTA Measuring Mode ................................................................................................................... 15
Spectrum .................................................................................................................................... 15
Signal waveform ........................................................................................................................ 16
PWR Measuring Mode .................................................................................................................. 17
Description of the CD tracks ......................................................................................................... 18

3
General Information
The Next-LCD is a completely autonomous, all-purpose measuring device. All measured
characteristics are displayed as digits and graphs on-screen. The closed software environment of
the device eliminates inaccurate readings. The device has two Lab-Bus digital bus ports to which
the pressure sensors, microphones or power sensors can be connected. All this makes Next-LCD
an all-purpose and completely cascadable tool. When a user purchases, for example, the set for
measuring sound pressure, in the future, they can supplement it with the microphone for
measuring AFC or with the power sensor for measuring current and voltage. Simultaneous work
with two signal sources is possible. The internal sound signal generator of different waveforms
(sine, white noise, pink noise) works in background mode alongside the process of measuring.
The Next-LCD can be connected to a PC for controlling the device and transmitting data via
USB, for example, when it is necessary to display the measurement results on a big screen. The
device can be fitted with the built-in Wi-Fi module for connecting to Wireless networks which
allows transmitting the measurement data for long distances via the Internet in real time mode.

4
Ergonomics
The Next-LCD device is performed as a monoblock that has graphic display with back light, 8
control buttons, USB port for connecting to a PC and charging the device, two Lab-Bus ports for
connecting sensors, two RCA type outputs of the sound signal generator, feed switch and threecoloured LED for indicating status and extent of battery charge. The device can be supplied with
the built-in Wi-Fi module for connecting and managing via the local network. The case of the
device is made of shockproof plastic material.
Package Contents
Main unit
USB connection cable for charging and connecting it to a PC
Spl-Lab Measuring Center software for Windows
Audio-CD with audio tracks for tuning (sine, sweep-tones, noise)
Case for carrying around and storing (optional)

5
Working with the device
Important safety information:
! The manufacturer does not bear responsibility for damage caused directly or indirectly as a
result of improper device use.
! Before using the device, examine its case for cracks and splits, because any depressurization
of the device will result in it’s possible failure.
! To avoid the risk of electric shock, all the connector cables should not have insulation defects.
! Avoid measuring load beyond the maximum limit.
! All operations of connecting and disconnecting connection cables should be performed with
equipment switched off.
! Do not use or store the device in areas with high humidity or heat, as well as, close to the
devices, generating strong magnetic field.
! During preventive maintenance of the device, do not use synthetic detergents and do not apply
solvents. Using wet wipes is more preferable.
! Before starting the device and a system on the whole, ensure that all the connection cables are
switched correctly.

6
Identifying the functional parts of the device:

7
No.
Element
Assignment
1
Display
Graphic display with automatic dimming of display backlight
2
Power indicator
three-coloured LED for indicating status of the device
3
Feed switch
the slide switch for switching the device on/off.
4
MODE button
for switching the device operation modes
6
LIGHT button
switching the display backlight on/off. Using the display
backlight decreases the device running time.
5
7
8
9
10
11
OPTION button
FUCTION button
Up button
Down button
Right button
Left button
The button assignment depends on the mode.
12
15
Lab-Bus port 2
Lab-Bus port 1
input jacks for connecting the external sensors
13
14
Output #1 and Output
#2 of the generator
RCA jacks for connecting the internal generator.
16
USB port
slot for connecting device to a PC or charging the device.
Charging the battery of the device
The device has an internal battery. The running time of the device depends on the intensity of
use and the type of sensors connected. For charging, please connect the device via the USB port
to the charger or PC. Consider that for full charge, the device should be switched off. Use the
three-coloured LED for estimating the extent of battery charge and status of the device
(according to the table below):
Green
Orange
Red
Glows
continuously
The device is on; battery charge
above 80%. Charging complete or
not connected
The device is on; battery charge
above 80%. Charging is in process.
Device is off. Charging is in
process.
Blinks
slowly
The device is on; battery charge
above 50%. Charging complete or
not connected
The device is on; battery charge
above 50%. Charging is in process.
Blinks
quickly
The device is on; battery charge
above 20%. Charging complete or
not connected
The device is on; battery charge
above 20%. Charging is in process.
Starting work and configuring the device
Perform the complete charging cycle until the LED goes out. If necessary, connect sensors to the
Lab-Bus ports and generator outputs. Switch the device on using the slide switch. After it is
switched on, user will enter the configuration mode - “CFG”. The name of mode is indicated in
the upper left part of the display.

8
Use the Up and Down buttons for changing the menu entry. Use the Left and Right buttons for
changing the value of selected menu entry.
Port 1 – selecting the type of sensor, connected to Lab-Bus 1 port
Port 2 – selecting the type of sensor, connected to Lab-Bus 2 port
Light off - setting the time of automatic display backlight dimming in seconds. Backlight
goes off after the defined period of time and switches on when any button is pressed.
Please pay attention that running time decreases when the display backlight is used. It is
recommended to use the automatic backlight dimming option for saving the battery state
of charge.
Reset to default – resets all settings including mode settings and calibrations. Confirm
reset with Left button or cancel with Right button.
After configuring, press the MODE button for saving the settings.
Connecting to PC via the USB port
Switch the device on and wait until the “CFG” mode is loaded. Connect the device to a PC
using USB port. Install drivers from the CD, which is included into the delivery set, or download
them from the Support section at Spl-Lab web site www.spl-lab.ru | www.spllabusa.com.
Install the drivers and start Spl-Lab Measuring Center for device connection. After connection is
established, the device will automatically enter the “CON” mode.
Connecting to PC via Wireless network
The device can be supplied with the internal module for connecting to Wireless networks via WiFi. For configuring connection settings, connect the device to a PC and start the Measuring
Center. Once configured, the device will automatically connect to the selected Wireless network
every time it is switched on. After connection is established, the device will automatically enter
the “CON” mode.

9
Operation modes
In the Next-LCD device, several operation modes are provided. Current mode is indicated in the
upper left part of the display. Modes are changed cyclically using the MODE button. Apart from
the general operation modes, there are measuring modes. Each measuring mode has a unique
algorithm for conducting measurements. Different measuring modes operate with different types
of sensors. The measuring mode will be disabled in case the required equipment is unavailable.
“CFG” is the configuration mode. The device automatically enters this mode after
switched on.
“GEN” is the generator mode. Note that the generator can work in a background mode
alongside the process of measuring, even after exiting the mode.
“CON” is the mode which switches on automatically after device establishes connection
with a PC via USB or Wireless network. The type of current connection is displayed.
Managing the device is unavailable in this mode. For exiting the mode, disable the
connection on the PC.
“SPL” is the mode used for measuring the peak value of sound pressure for signals with
frequencies ranging from 10 to 120 Hz with resolution of 1 Hz. In this mode, the
waveform, spectrum, level and distortion of the measured signal are displayed. It is
possible to use two channels in this mode. The mode works with Next-Lab SPL Sensor.
“AVG” is the mode used for measuring the time-average peak value of sound pressure of
the signal with frequencies ranging from 10 to 120 Hz with resolution of 2 Hz. In this
mode, the level of the measured signal is displayed. It is possible to use two channels in
this mode. The mode works with Next-Lab SPL Sensor.
“RTA” is the mode used for measuring the amplitude, distortion and frequency-response
ripple of the sound signal with frequencies ranging from 10 to 20,000 Hz frequency with
resolution of 1 octave, 1/3 or 1/6 of an octave. In this mode, the waveform, spectrum and
amplitude of the measured signal are displayed. The mode works with Next-Lab RTA
Microphone.
“PWR” is the mode used for measuring power characteristics such as voltage, current,
power, frequency, impedance and harmonic distortion coefficient. Measuring the
characteristics of both direct and alternating current circuits with frequency up to
15,000 Hz is possible. It is possible to use two channels in this mode. The mode works
with Next-Lab SPL Sensor.

10
The generator mode GEN
The generator mode is intended for playing back test signals of different waveforms. The
generator can work in a background mode alongside the process of measuring, even after exiting
the mode. For switching the background mode off, it is necessary to return to the “GEN” mode.
Use the Up and Down buttons for changing the menu entry. Use the Left and Right buttons for
changing the value of selected menu entry.
Out – selecting the type of generated signal: SINE – sine, PINK – pink noise, WHITE -
white noise.
Level – setting the level of the playback signal. Level of 100% corresponds to amplitude
of 5 volt on the generator outputs.
Freq – setting the frequency of the sine signal in Hz within the range from 1 up to
20,000 Hz.
Use the FUNCTION button for starting/stopping the measurement. In doing so, the text at the
upper part of the display will indicate Stopped, when the generator is stopped, or Playing, when
the signal is being played back.
11
SPL Measuring Mode
The SPL mode is intended for measuring the sound pressure level of low frequency sound
signals. The analysed length of the signal equals to one second. The resultant value of the sound
pressure level is calculated from several spectral components for each analysed part of the signal
separately.
It is possible to view three types of information in SPL mode: spectrum, signal waveform and
digitized data. Changing between the types of reflected information is performed using the
OPTION button.
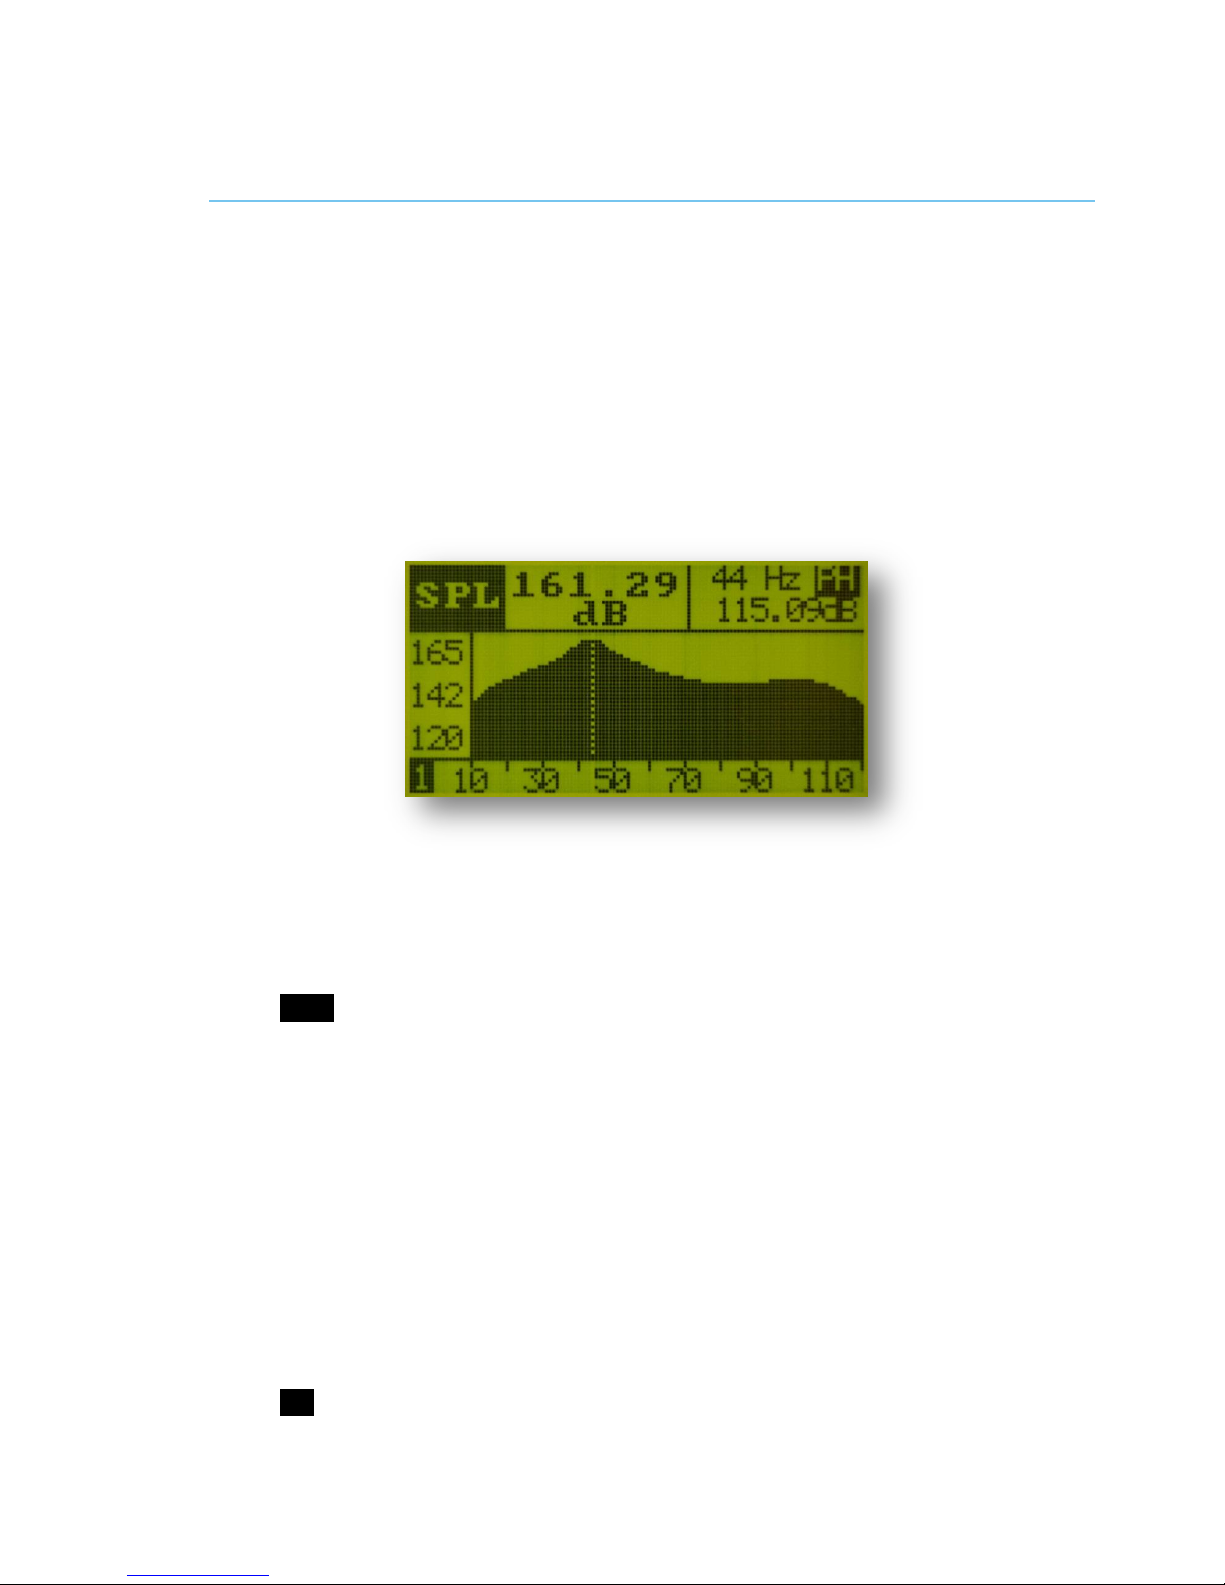
Spectrum
“161.29 dB” is the section displaying the peak result
“44 Hz” is the section displaying the frequency
“115.09 dB” is the section displaying the current result
“PH”– the indicator that is responsible for enabling/disabling the Peak hold mode. Use
the FUNCTION button to enable/disable the Peak hold mode. The peak result section
holds the maximum amplitude reached during the entire time of measurement and in the
frequency area - the frequency at which the maximum amplitude value was reached.
Only the peak component at the corresponding frequency is marked on the spectrum and
the amplitude values for each frequency change only in case they exceed the previous
maximum. Maximum amplitude is marked with a vertical, dashed line on the spectrum.
Collected data is reset with the Left button or switching off the peak hold mode.
“120…165” is the amplitude scale; It is zoomed automatically.
“10…110” is the frequency scale
“1” is the indicator of the currently displayed channel. The indicator is active only when
two channels are used. Channels are changed using the Up button.

12
Signal waveform
“40 Hz” is the section displaying the current frequency
“S=1” shows the scale of the displayed signal. It shows the number of signal parts
displayed. For changing the scale, use the Right and Left buttons.
“THD=4.8%” is the harmonic distortion coefficient value of the signal
“1” is the indicator of the currently displayed channel. The indicator is active only when
two channels are used. Channels are changed using the Up button.
Digitized data
“28” indicates duration of the current measurement in seconds. For starting/stopping the
measurement, press the FUNCTION button. Before starting a measurement, a 5 second
long countdown is provided.
“159.4dB” is the section displaying the peak result for channel 1
“40 Hz” is the section displaying the frequency for channel 1
“159.36 dB” is the section displaying the current result for channel 1
“112.4 dB” is the section displaying the peak result for channel 2
“10 Hz” is the section displaying the frequency for channel 2
“159.36 dB” is the section displaying the current result for channel 2

13
“Time: 30” is the set duration of measurement. For changing the duration, use the Up
and Down buttons.
Measurement is held in the peak hold mode.

14
AVG Measuring Mode
The AVG mode is intended for measuring the time-average sound pressure level of low
frequency sound signals. The analysed length of the signal equals to 1/2 second. Current value of
the sound pressure level is calculated from several spectral components separately for each
analysed part of the signal. The resultant value is an arithmetic average of maximum values
selected within the number of analysable parts of the signal specified in the “Period” parameter.
“9” indicates duration of the current measurement in seconds. For starting/stopping the
measurement, press the FUNCTION button. Before starting a measurement, a 5 second
long countdown is provided.
“117.1dB” is the section displaying the peak result for channel 1
“22 Hz” is the section displaying the frequency for channel 1
“117.18 dB” is the section displaying the current result for channel 1
“147.8 dB” is the section displaying the peak result for channel 2
“68 Hz” is the section displaying the frequency for channel 2
“147.86 dB” is the section displaying the current result for channel 2
“Time: 30” is the set duration of measurement. For changing the duration, use the Up
and Down buttons.
“Period: 1” is the defined period value. For changing period, use the Left and Right
buttons.
15
RTA Measuring Mode
The RTA mode is intended for measuring different sound signal characteristics through the
entire audible frequency range. The analysed length of the signal equals approximately to 1/5
second. In the RTA mode, the amplitude of the spectral peak component, coefficient of harmonic
distortion and frequency-response ripple of the analysed signal can be measured.
It is possible to view two types of information in RTA mode: spectrum and signal waveform.
Changing between the types of displayed information is performed by using the OPTION
button.
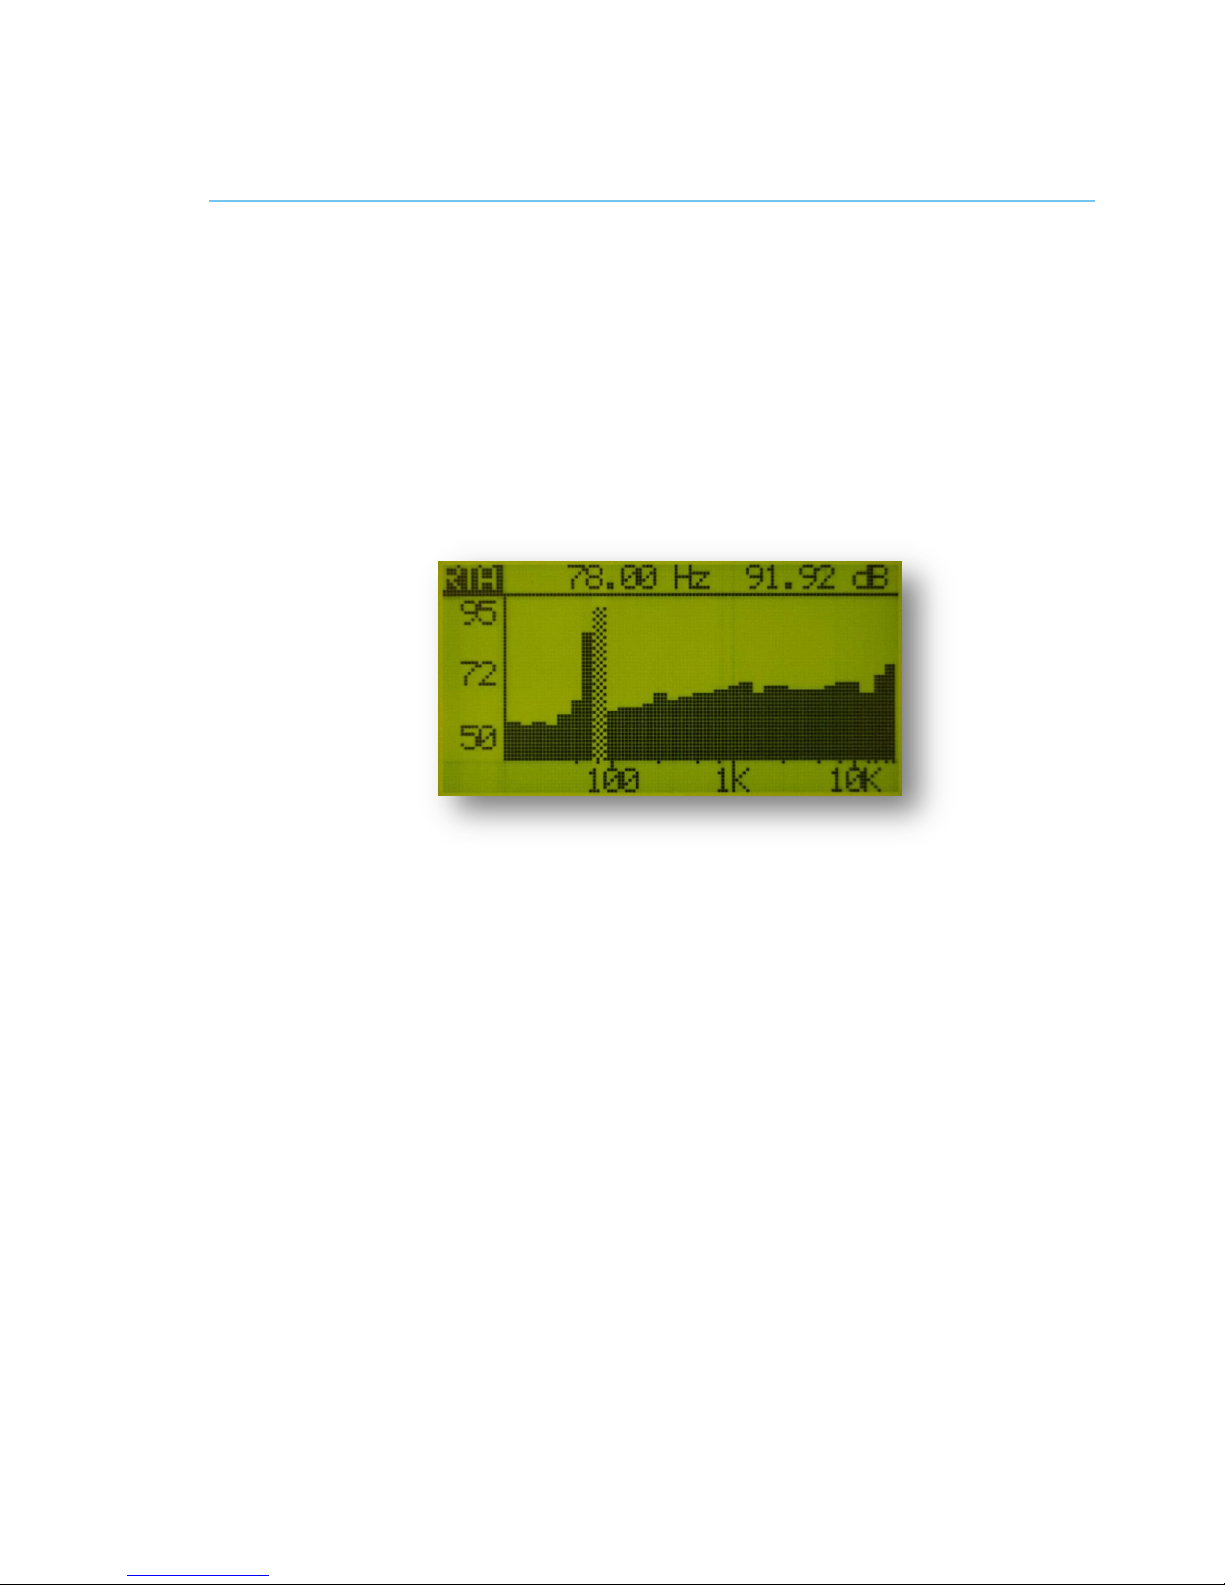
Spectrum
“78.00 Hz ” is the frequency of the peak values of the spectrum
“91.92 dB” is the amplitude of the peak values of the spectrum
“50…95” is the amplitude scale; It is zoomed automatically.
“100…10K” is the frequency scale
The spectrum is displayed in octave view with resolution of 1, 1/3 or 1/6 of the octave. For
changing the spectrum detailing, use the Up and Down buttons. When displaying the
spectrum, smoothing in real-time is used. Each component of the spectrum displayed is an
arithmetic average of 50 spectrum components taken earlier. Maximum amplitude is marked
with a vertical dashed line on the spectrum.
Use the FUNCTION button for starting/stopping measurement and the Left button for
resetting the collected data.

16
Signal waveform
“102.08 Hz” is the section displaying the current frequency
“S=14” shows the scale of the displayed signal or number of parts of the signal
displayed. For changing period, use Left and Right buttons.
“THD=10.8%” – the harmonic distortion coefficient value of the signal

17
PWR Measuring Mode
The mode used for measuring power characteristics such as voltage, current, power, frequency,
impedance and harmonic distortion coefficient. Measuring the characteristics of both direct and
alternating current circuits with frequency up to 15,000 Hz is possible.
Before starting the measurement, calibrate the sensors by pressing the FUNCTION button. At
the moment of calibration, values at the sensor input should equal to 0.
“63V” is voltage value at channel 1
“0A” is current value at channel 1
“0W” is power value at channel 1
“-----R” is impedance value at channel 1
“65HZ” is frequency value at channel 1
“1.1%” is harmonic distortion coefficient value at channel 1
“99.9V” is voltage value at channel 2
“1652A” is current value at channel 2
“-----”“W” is power value at channel 2
“DC ”“AC” is indicator of the signal type (direct/alternating) measured at channel 1.
For changing, use the Up button.
“PH” is the indicator for holding the peak value (no/min/max) at channel 1. For
changing, use the Down button.
“DC ”“AC” is indicator of the signal type (direct/alternating) measured at channel 2.
For changing, use the Right button.
“PH+” is the indicator for holding the peak value (no/min/max) at channel 2. For
changing, use the Left button.

18
Description of the CD tracks
The CD included in the Spl-Lab equipment distribution kit alongside with software contains
specialised audio tracks with test signals for adjusting a sound system. Consider that these tracks
are recorded not in the file form but as tracks in Audio-CD format. For playing back the tracks
from the CD, use specialised software or CD player. It is possible that some CD player models
will not read the audio content of the CD. In such case, or if it is more convenient for you to use
the audio files, download the archive with test signals from “Support” at Spl-Lab web site.
Table with track description below:
No. of track
Contents
Track 1
Pink noise 20-20 000 Hz
Track 2
Pink noise 40-60 Hz
Track 3
Pink noise 60-80 Hz
Track 4
Pink noise 80-100 Hz
Track 5
Pink noise 100-120 Hz
Track 6
Pink noise 120-140 Hz
Track 7
Pink noise 140-160 Hz
Track 8
Pink noise 160-180 Hz
Track 9
Sweep-tone 30-20 Hz Level – 0 dB.
Track 10
Sweep-tone 35-25 Hz Level – 0 dB.
Track 11
Sweep-tone 40-30 Hz Level – 0 dB.
Track 12
Sweep-tone 45-35 Hz Level – 0 dB.
Track 13
Sweep-tone 50-40 Hz Level – 0 dB.
Track 14
Sweep-tone 55-45 Hz Level – 0 dB.
Track 15
Sweep-tone 60-50 Hz Level – 0 dB.
Track 16
Sweep-tone 65-55 Hz Level – 0 dB.
Track 17
Sweep-tone 70-60 Hz Level – 0 dB.
Track 18
Sweep-tone 75-65 Hz Level – 0 dB.
Track 19
Sweep-tone 80-70 Hz Level – 0 dB.
Track 20-80
Sine signal. The number of track corresponds to the signal frequency. Level –
0 dB.

19
Track 81
Sweep-tone: Sweep-tone 20-20,000 Hz Level – 0 dB.
Track 82
Sine signal with frequency of 100 Hz
Track 83
Sine signal with frequency of 200 Hz
Track 84
Sine signal with frequency of 1,000 Hz
Track 85
Sine signal with frequency of 2,000 Hz
 Loading...