

Page 1

SR5500
Wireless Channel Emulator
Operations Manual
Page 2

Safety Summary
If the equipment is used in a manner not specified by the manufacturer the protection provided by the
equipment may be impaired.
Safety Symbols
The following safety symbols are used throughout this manual and may be found on the instrument. Familiarize
yourself with each symbol and its meaning before operating this instrument.
Instruction manual symbol. The
product is marked with this symbol
when it is necessary for you to refer to
the instruction manual to protect
against damage to the instrument.
Protective ground (earth) terminal.
Used to identify any terminal which is
intended for connection to an external
protective conductor for protection
against electrical shock in case of a
fault, or to the terminal of a protective
ground (earth) electrode.
Indicates dangerous voltage (terminals
fed from the interior by voltage
exceeding 1000 volts must be so
marked).
Frame terminal. A connection to
the frame (chassis) of the
equipment which normally includes
all exposed metal structures.
The caution sign denotes a hazard.
It calls attention to an operating
procedure, practice, condition or
the like, which, if not correctly
performed or adhered to, could
result in damage to or destruction
of part or all of the product or you’s
data.
Alternating current (power line).
Page 3
Résumé des règles de sécurité
Si le matériel est utilisé d’une façon non conforme aux spécifications du constructeur, la protection assurée
par le matériel peut être mise en défaut.
Symboles de sécurité
Les symboles suivants sont utilisés dans tout le manuel et peuvent être trouvés sur le matériel. Il est
recommandé de se familiariser avec chaque symbole et sa signification avant de manipuler le matériel.
Symbole « manuel d’instruction ». Ce
symbole apparaît sur le produit
lorsqu’il est nécessaire de se référer
au manuel d’instruction pour éviter
une détérioration du matériel.
Terre : ce symbole identifie la
connexion de terre chargée de
protéger le matériel contre les chocs
électriques. Cette connexion doit être
raccordée vers un conducteur externe
de protection ou vers une électrode de
type terre.
Ce symbole indique un voltage
dangereux (connexion alimentée en
interne par un voltage excédant 1000
volts).
Spirent Communications, Inc.
541 Industrial Way West
Eatontown, NJ 07724
Phone: (732) 544-8700
Fax: (732) 544-8347
This manual applies to the SR5500, Version 2.
Page Part Number: 2700-8351 Version A
7
30 and higher
Masse. Ce symbole identifie une
connexion au châssis du matériel
(ce châssis inclut normalement
toutes les structures métalliques
exposées).
Ce symbole désigne une opération
ou une condition dite « sensible »,
qui, si elle n’est pas correctement
réalisée, pourrait entraîner de
sérieuses détériorations au
matériel ou aux données
utilisateur.
Courant alternatif (ligne de
puissance).
Copyright
© 2007, Spirent Communications, Inc.
Printed in the USA.
Technical Support is available 8:30 AM – 5:30 PM EST, Monday - Friday
Phone support is available through Spirent Customer Care at +1 732-544-8700
Email support is available at wireless@spirent.com.
Information furnished by Spirent Communications is believed to be accurate and reliable. However, no responsibility is assumed by Spirent
Communications for its use. Specifications are subject to change without notice.
Page 4

Page 5

Table of Contents
1. Introduction ..................................................................................... 1
1.1. Overview ...........................................................................................1
1.2. SR5500 Applications..........................................................................2
1.2.1. Applicable to All Design Phases ............................................................... 3
1.2.2. Evaluating Radio Access Technologies .....................................................4
1.2.3. Evaluating Air Interface Performance ....................................................... 5
1.3. Key Product Features ......................................................................... 5
1.3.1. Wireless Channel Emulation Features....................................................... 5
1.3.2. Ease of Use Features ................................................................................ 6
1.4. SR5500 Guided Tour .......................................................................... 6
1.4.1. Front Panel Description............................................................................6
1.4.2. Rear Panel Description............................................................................. 8
1.5. Quick Start Procedure ........................................................................9
1.6. Verification Procedure...................................................................... 11
1.7. Quick Start Using Test Assistant ....................................................... 12
1.8. Version History ................................................................................15
2. Operation Reference....................................................................... 19
2.1. Overview .........................................................................................19
2.2. Operational Overview....................................................................... 19
2.2.1. Connecting to the SR5500......................................................................20
2.2.2. Basic Operation..................................................................................... 21
2.3. Using the Test Assistant................................................................... 25
2.3.1. Accessing the Test Assistant .................................................................. 25
2.3.2. Changing the Carrier Frequency............................................................. 26
2.3.3. Automatically Selecting a Channel Profile .............................................. 26
2.3.4. Completing the Configuration ................................................................ 27
2.4. Channel Player................................................................................. 27
2.5. File Operations ................................................................................ 28
2.5.1. Settings Saved in the Settings File .........................................................29
Page 6

ii | SR5500 Operations Manual
2.5.2. Recent File List....................................................................................... 29
2.6. Operational Detail............................................................................ 29
2.6.1. Channel I/O Parameters......................................................................... 29
2.6.2. Path Parameters.................................................................................... 38
2.6.3. Interference........................................................................................... 43
2.6.4. Instrument Setup View........................................................................... 45
2.7. Dynamic Environment Emulation ...................................................... 46
2.7.1. Method.................................................................................................. 47
2.7.2. Emulation File Creation (DEE Template).................................................. 48
2.7.3. Dynamic Environment Emulation (DEE) View .......................................... 52
2.7.4. Using DEE with Multiple SR5500s........................................................... 54
2.8. Power Meter Parameters ..................................................................54
2.9. Using the SR5500 with 6 GHz/6GHz-EX Option ................................. 55
2.9.1. Configuring TestKit for the 6 GHz(-EX) Option ......................................... 56
2.9.2. Selecting Lower/Middle/Upper Band ..................................................... 56
2.9.3. Parameter Dependencies....................................................................... 56
2.10. Downloading Firmware to the SR5500 .............................................. 57
2.10.1. Starting the Download ............................................................................57
2.10.2. During the Download............................................................................. 58
2.10.3. Recovery in Case of Failure..................................................................... 58
2.11. Changing the Remote Connection ..................................................... 58
2.11.1. Changing the SR5500 IP Address Configuration ..................................... 59
2.11.2. Changing the IP Address in SR5500 TestKit ............................................ 60
2.12. Updating the SR5500 Options .......................................................... 60
2.13. Controlling Multiple SR5500s...........................................................61
2.13.1. Connecting Synchronization Cables ....................................................... 61
2.13.2. Configuring TestKit to Control Multiple Units .......................................... 62
2.13.3. Switching Between Units........................................................................63
2.13.4. Player Functionality. .............................................................................. 63
2.13.5. Correlation Coefficient Type. ..................................................................63
2.13.6. System-Based Correlation. .................................................................... 64
2.14. Summary View................................................................................. 65
2.14.1. Path Parameters.................................................................................... 66
2.14.2. System Parameters................................................................................ 66
Page 7

Table of Contents | iii
3. Technical Reference ....................................................................... 67
3.1. Overview .........................................................................................67
3.2. Radio Channel Power Delay Profile ................................................... 68
3.3. Static Relative Path Delay................................................................. 69
3.4. Time-Varying Relative Path Delay...................................................... 69
3.4.1. Sliding Relative Path Delay .................................................................... 70
3.4.2. Birth-Death Time-varying Relative Path Delay..........................................71
3.5. Relative Path Loss............................................................................ 72
3.6. Fast Fading ...................................................................................... 72
3.6.1. Rayleigh Fading Amplitude Distribution ................................................. 73
3.6.2. Rician Fading Amplitude Distribution ..................................................... 76
3.6.3. Fast Fading Power Spectrum Shapes...................................................... 78
3.7. Static Amplitude Channel Effects ...................................................... 78
3.7.1. Frequency Shift (Static Doppler)............................................................. 79
3.7.2. Static Phase Shift................................................................................... 79
3.8. Slow Shadow Fading........................................................................ 79
3.9. Additive White Gaussian Noise (AWGN) interferer.............................. 81
3.10. Power Meter .................................................................................... 86
4. Instrument API ............................................................................... 89
4.1. Overview .........................................................................................89
4.2. Benefits and Features ...................................................................... 90
4.3. Development Environments..............................................................90
4.4. API Usage Example .......................................................................... 90
4.5. API Front Panel.................................................................................91
4.5.1. The API Front Panel Window Components............................................... 92
4.6. Further Information .......................................................................... 96
5. Remote Programming Interface Operation...................................... 97
5.1. Overview .........................................................................................97
5.2. Remote Control Features ..................................................................97
5.3. Configuring SR5500 TestKit for Remote Control................................. 97
5.3.1. Setting up the Remote Programming Interface ....................................... 98
5.3.2. Start/Stop the Listener........................................................................... 99
Page 8

iv | SR5500 Operations Manual
5.3.3. Local/Remote Mode............................................................................... 99
5.3.4. Enable Monitor Messages.................................................................... 100
5.3.5. Enable TCP/IP Echo .............................................................................. 100
5.3.6. Automatically Configuring SR5500 TestKit for Remote Control .............. 100
5.4. SR5500 TestKit Command Protocol................................................. 100
5.4.1. Command Types .................................................................................. 100
5.4.2. Command Sequence.............................................................................101
5.4.3. Program Messages...............................................................................101
5.4.4. Response Format ................................................................................. 102
5.4.5. Long Form and Short Form of Mnemonics............................................. 102
5.4.6. Hierarchical Default Format.................................................................. 103
5.4.7. Error Message Format.......................................................................... 103
5.5. Transmission Layer Protocols ......................................................... 104
5.5.1. LAN CR/LF Protocol .............................................................................. 104
5.5.2. GPIB Protocol .......................................................................................105
6. RPI Command Reference...............................................................111
6.1. Conventions to Specify Commands................................................. 111
6.2. Command Summary.......................................................................112
6.3. Command Descriptions .................................................................. 115
6.4. Command Dependencies................................................................ 132
6.5. Autosets........................................................................................ 133
6.6. Overload Status.............................................................................133
6.7. Dynamic Environment Emulation (DEE)............................................ 134
7. Technical Specifications............................................................... 136
7.1. Overview .......................................................................................136
7.2. RF Channel Specifications (without the SR5500 6 GHz Option).........136
7.3. RF Channel Specifications (with the SR5500 6 GHz Option)..............137
7.4. RF Channel Specifications (with the SR5500 6 GHz-EX Option)......... 139
7.5. Channel Emulation Characteristics .................................................140
7.6. Interference Generation Characteristics .......................................... 143
7.7. Power Measurement Characteristics............................................... 145
7.8. Interface and Environmental Characteristics ................................... 145
Page 9

1. Introduction
1.1. Overview
The Spirent SR5500 Wireless Channel Emulator accurately emulates complex wideband
wireless channel characteristics such as time-varying multi-path delay spread, fading,
and channel loss. By providing a programmable and repeatable set of emulated radio
channel conditions, the SR5500 enables a thorough, structured approach to receiver
performance characterization. The SR5500, shown in Figure 1-1, replicates real-world
deployment conditions using powerful digital signal processing techniques, making it
possible to isolate performance issues early in the development and design verification
cycle. Optional AWGN enhances the real-world conditions emulated by the SR5500. Early
optimization of performance accelerates time to market and minimizes post-deployment
issues.
Figure 1-1: SR5500 Wireless Channel Emulator
Complete analysis of the performance of today’s complex radio transmission schemes
requires a channel simulator that offers rich emulation of radio channel characteristics.
This is required to ensure that lab and field performance measurements align. At the
same time, the instrument implementation must contribute minimal unwanted parasitic
simulation effects that can distort test results. The SR5500 high performance, all-digital
signal processing engine presents a realistic set of radio channel conditions to the most
complex radio transmission technologies. The use of the SR5500 DEE (Dynamic
Environment Emulation) further replicates real-world fading scenarios by allowing
dynamic control over fading parameters. With a high fidelity channel and long simulation
repetition rates, the SR5500 ensures reliable and accurate performance evaluation.
Page 10
2 | SR5500 Operations Manual
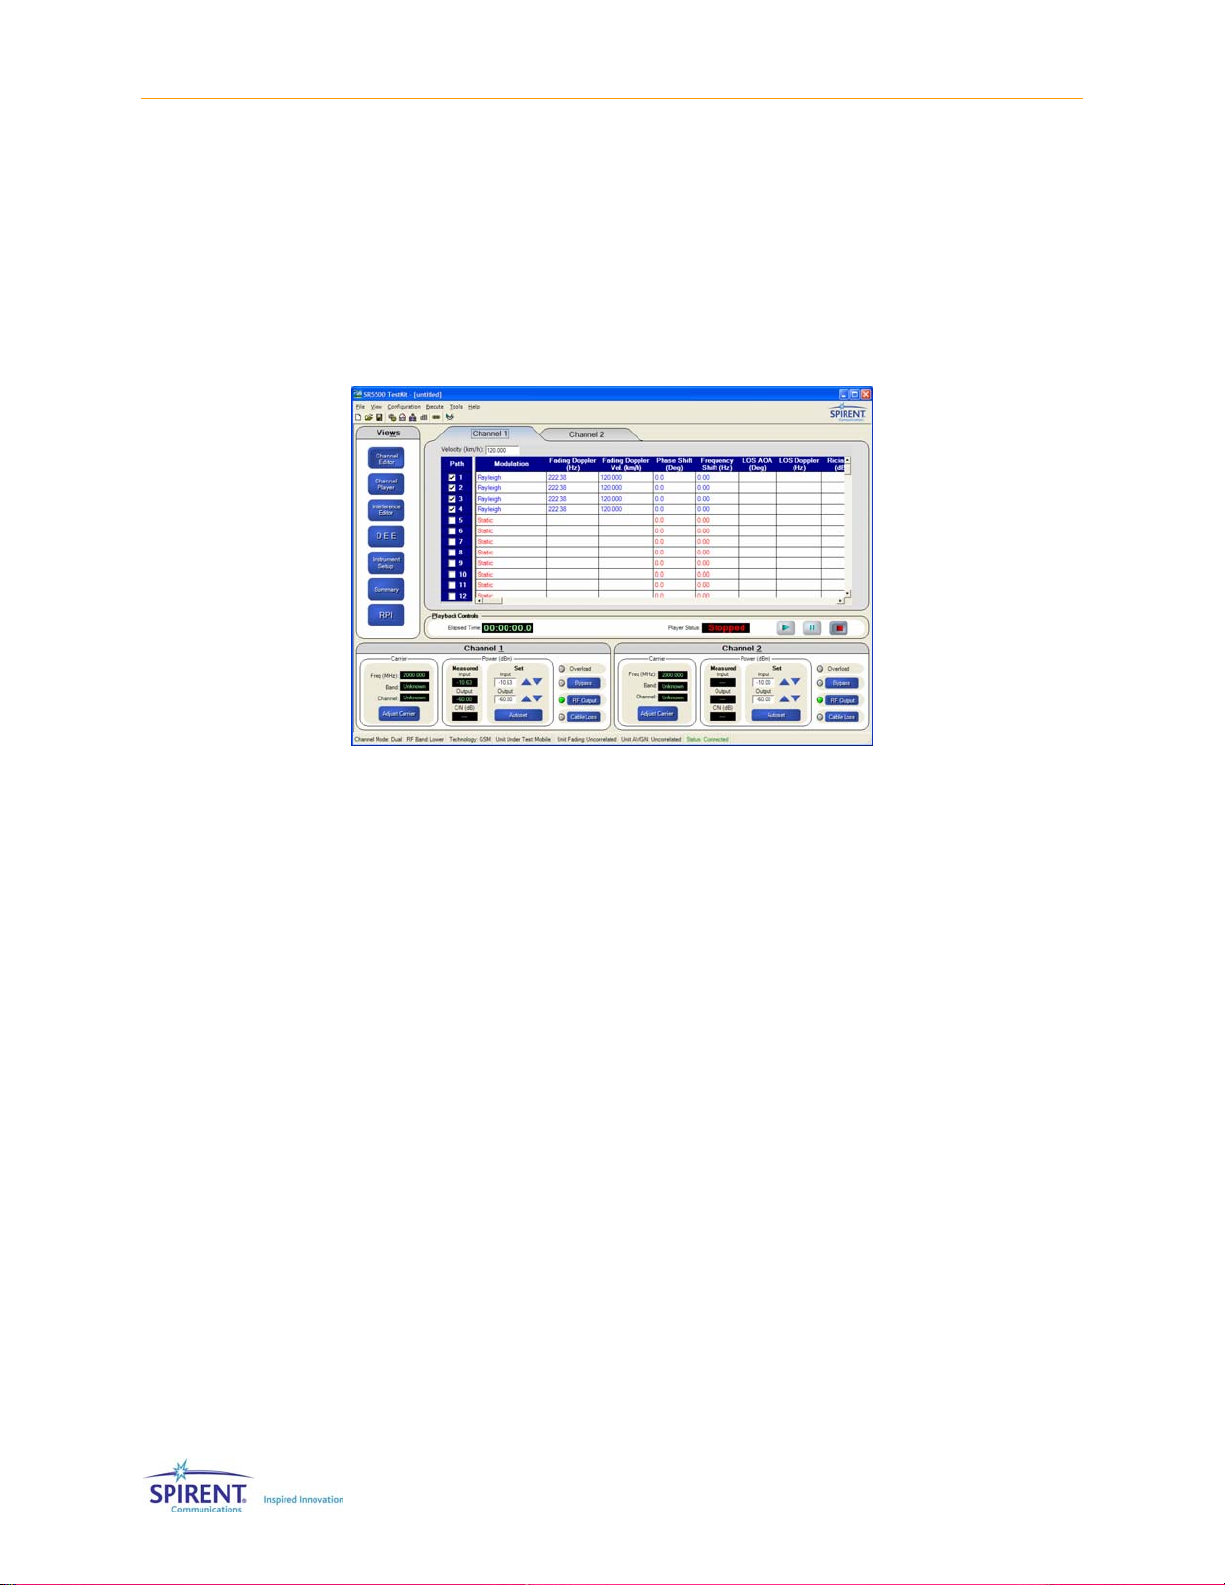
The SR5500 Graphical User Interface (GUI) shown in Figure 1-2, enables you to select
channel models from a vast library of pre-defined industry standard channel models or
custom configurations that provide extreme precision using the Channel Model Editor.
Once the channel model is configured, the Channel Model Player enables low-level
control over playback including the ability to play, pause, and stop the simulation. If
changes to the channel model are required, the SR5500 real-time fading sequence
generation enables modifications to take effect instantly. This eliminates the need to
tolerate the testing delays associated with fading simulators that must pre-calculate
fading sequences.
Figure 1-2: SR5500 Wireless Channel Emulator Graphical User Interface
With the standard instrument configuration equipped with 24 independent multi-paths,
the SR5500 delivers performance evaluation beyond the minimum performance
requirements associated with 3G technologies, such as CDMA2000 and WCDMA, and
with evolving Wireless LAN standards. The SR5500 enables you to program time-varying
channel conditions, which is a critical capability required to properly assess the overall
performance of high-speed transmission technologies such as 1xEV-DO, 1xEV-DV, and
WCDMA HSDPA that employ adaptive modulation and coding schemes.
1.2. SR5500 Applications
The SR5500 emulates a wide array of radio channel conditions ranging from indoor
micro cellular environments with low mobility to macro-cellular environments with highspeed mobility. With a channel modeling engine capable of an assortment of
configurations, the SR5500 can analyze the performance of current and emerging air
interface technologies such as EDGE/GSM/GPRS, CDMA2000, WCDMA, 802.16, and
802.11a/b/g in representative deployment conditions without leaving the test lab. To
facilitate testing that requires co-channel interference, the SR5500 optionally includes
the ability to generate AWGN. The SR5500 can be utilized in both Handset and Base
Station test applications as shown in Figure 1-3 and Figure 1-4. These capabilities make
it possible for the SR5500 to play a valuable role in all phases of the product realization
cycle.
Page 11

Figure 1-3: SR5500 Handset Test Setup
Chapter One: Introduction | 3
Figure 1-4: SR5500 Base Station Test Setup
1.2.1. Applicable to All Design Phases
Comprehensive performance evaluation throughout the product development cycle
improves the probability of identifying potential design issues at a stage where they can
be easily addressed. The SR5500 plays a valuable role throughout the product
realization process.
1.2.1.1 Research and Development
Early in the design and standardization of new air interface technologies, physical layer
modulation schemes, channel coding, and mobility algorithms must be evaluated and
compared. The SR5500 can analyze the performance of competing technologies by
providing repeatable test conditions across test campaigns. It is capable of sophisticated
channel models and low signal distortion, and can accommodate the evaluation of nextgeneration, wide-bandwidth signal formats.
Page 12

4 | SR5500 Operations Manual
1.2.1.2 Design Verification Test
Comprehensive evaluation of reference designs and commercial products against
original design objectives is a critical phase in the product realization process. You can
configure the SR5500 to emulate a wide range of radio propagation environments with
precise control over channel conditions for performance breakpoint analysis. With an
easy to use software application programming interface (API), the SR5500 also easily
integrates into automatic test systems capable of performing a large number of test
cases in minimal time.
1.2.1.3 Acceptance/Conformance Test
Before deployment, commercial products must typically undergo a series of acceptance
and conformance tests based on minimum industry performance standards. The
SR5500 User Interface features a Test Assistant that makes it easy to emulate
propagation conditions defined in various industry test specifications. These propagation
conditions are defined by ETSI, 3GPP, 3GPP2, and ITU.
1.2.1.4 System Performance Test
Once deployed to the field, the performance of wireless equipment is analyzed and
optimized. To accelerate the optimization process, it is necessary to recreate challenging
field scenarios on a controlled, repeatable test bed. By utilizing both RF channels in the
instrument, you can configure the SR5500 for bi-directional full duplex performance
evaluation. You can also program the SR5500 to play back field conditions repeatedly,
enabling the adjustment of algorithms until optimal performance is realized.
1.2.2. Evaluating Radio Access Technologies
The SR5500 possesses the capabilities necessary to evaluate a broad range of local and
wide area wireless network technologies. With frequency coverage up to 6 GHz, the
SR5500 covers all of the world’s deployment frequency bands. Supported technologies
include:
• GSM/GPRS/EDGE
• WCDMA
• WCDMA HSDPA
• CDMA2000 1x
• CDMA2000 1xEV-DO
• CDMA2000 1xEV-DV
• Location Based Services
• 802.11.a/b/g
• 802.16(WiMAX)
• HiperLAN
Page 13

Chapter One: Introduction | 5
1.2.3. Evaluating Air Interface Performance
Radio access technologies possess layers of algorithms designed to mitigate the harsh
effects of radio propagation and to deliver seamless mobility. The SR5500 possesses the
critical features required to stress test air interface performance and to identify
opportunities to improve product design. The SR5500 can be used to evaluate and
improve the performance of:
• Baseband Demodulation
• Rake Finger Tracking
• Diversity Reception
• Channel Equalization
• Power Control Schemes
• Handover Efficiency
• Radio Link Protocols (RLPs)
• Geolocation
1.3. Key Product Features
1.3.1. Wireless Channel Emulation Features
With a powerful all-digital signal processing engine, the SR5500 emulates wideband
channel conditions with unprecedented accuracy and programmability. RF Channel
Emulation features include:
• Comprehensive channel models with up to 24 independent paths enables evaluation
of 3G and Wireless LAN equipment well beyond minimum performance standards.
• Real-time fading sequence generation enables channel model modifications without
the lengthy delays required to pre-calculate fading coefficients.
• Superior channel fidelity required to properly evaluate higher-order modulation
schemes, minimizing unwanted distortion that leads to false test results.
• Digital AWGN gives accurate and repeatable C/N, C/No, and Eb/No ratios.
• Creation of real-world fading scenarios with DEE (Dynamic Environment Emulation)
enables time-vary fading parameters.
• Long fading sequence repetition rate ensures realistic test conditions results.
• Time-varying channel models include dynamic Power Delay Profiles that evaluate
adaptive modulation and coding schemes.
• Real-time display of channel conditions and low-level control over channel model
playback.
• Frequency range extends to 6 GHz to cover 802.11a applications.
• Power meter capable of both continuous and triggered mode, ideal for bursty signals
like GSM/GPRS/EDGE and WLAN.
Page 14

6 | SR5500 Operations Manual
1.3.2. Ease of Use Features
The SR5500 simplifies test setup and control with easy-to-use local and remote
interfaces. Some of these features include the ability to:
• Quickly recall industry standard fading profiles from 3GPP, 3GPP2, ITU and JTC.
• Create realistic user-defined scenarios using the SR5500 Channel Model Editor
providing easy access to emulation parameters.
• Set the absolute channel output level, without the need for external attenuators and
calibration, ensuring accurate signal levels are always present at the receiver under
test.
• Make real time changes to AWGN with the Interference Editor, eliminating the need
to re-configure the fading profile, significantly reducing test time.
• Monitor the Power Delay Profile and input/output power levels of the SR5500 in real-
time to provide valuable user feedback on current test conditions.
• Integrate the SR5500 into automatic test systems using a Windows .NET-based
software API.
1.4. SR5500 Guided Tour
All SR5500 functionality is controlled through the instrument control software SR5500
TestKit or the Application Programming Interface (API). Refer to the Setup Guide included
with the instrument for details on how to connect the SR5500 system.
1.4.1. Front Panel Description
Figure 1-5: SR5500 Front Panel
Page 15

Chapter One: Introduction | 7
Front Panel Control/Indicators
c
d
e
f
POWER Switch
The Power switch is located in the bottom right hand corner of the front panel.
STATUS LED
The Status LED is located next to the power switch and indicates the current status of the
unit. SR5500 is operating normally if the LED is green. An error condition exists when the
STATUS LED is red. The LED takes a few seconds to illuminate during power up.
CHANNEL 1 OVERLOAD LED and CHANNEL 2 OVERLOAD LED
The LED indicates the RF input signal has peak levels above the permitted range and will be
clipped by the instruments input circuitry. The overload LEDs should be monitored to ensure
the signal applied at the RF Channel input is within the specified range.
CHANNEL 1 BYPASS LED and CHANNEL 2 BYPASS LED
This indicator tells you the channel is in bypass mode. The channel is bypassed when the
LED is green.
Front Panel Signal Input/Output Connectors
g
h
i
j
k
l
CHANNEL 1 and CHANNEL 2 RF IN
N Connector (50 Ω) - This connector functions as the channel RF input.
CHANNEL 1 RF OUT [DUPLEX]
N Connector (50 Ω) - This connector functions as the channel 1 RF output.
CHANNEL 1 RF OUT [OUT2]
N Connector (50 Ω) - Reserved for future use.
CHANNEL 2 RF OUT
N Connector (50 Ω) - This connector functions as the channel 2 RF output.
CHANNEL 1 and CHANNEL 2 LO IN
N Connector (50 Ω) - This connector functions as the channel local oscillator input. LO IN
must be connected to LO OUT via the Loop-back cable supplied with the SR5500.
CHANNEL 1 and CHANNEL 2 LO OUT
N Connector (50 Ω) - This connector functions as the channel local oscillator output. LO IN
must be connected to LO OUT via the Loop-back cable supplied with the SR5500.
CAUTION: The RF IN and OUT Ports can accept a limited power range; refer to
the technical specifications to ensure absolute maximum levels are not
exceeded.
Page 16

8 | SR5500 Operations Manual
1.4.2. Rear Panel Description
Rear Panel Controls
c
d
e
f
g
h
i
j
k
l
n
10 MHz IN
BNC Type Connector (50 Ω) - Accepts an externally supplied 10 MHz sine wave reference
signal which can be used to drive the internal signal processing circuitry of the SR5500.
10 MHz OUT
BNC Type Connector (50 Ω) - Provides a 10 MHz sine wave reference signal as an output.
CH 1 and CH 2 I/IF IN
BNC Type Connector (50 Ω) - Reserved for future use.
CH 1 and CH 2 Q IN
BNC Type Connector (50 Ω) - Reserved for future use.
CH 1 and CH 2 I/IF OUT
BNC Type Connector (50 Ω) - Reserved for future use.
CH 1 and CH2 Q OUT
BNC Type Connector (50 Ω) - Reserved for future use.
DBB IN1, IN2, and IN3
26 Pin MDR Type Connector - Reserved for future use.
DBB OUT
26 Pin MDR Type Connector - Reserved for future use.
SYNC IN
15 Pin MDR Type Connector - Used to synchronize fading data between multiple SR5500
systems.
SYNC OUT
15 Pin MDR Type Connector - Used to synchronize fading data between multiple SR5500
systems.
CH 1 and CH 2 TRIG IN
BNC Type Connector (50 Ω) - Reserved for future use.
Figure 1-6: SR5500 Rear Panel
Page 17

Rear Panel Controls
o
p
q
r
s
t
u
CH 1 and CH 2 SYNC OUT
BNC Type Connector (50 Ω) - Reserved for future use.
GPIB
Reserved for future use.
ETHERNET
RJ-45 Type Connector - The Ethernet port supports TCP/IP. It is recommended that a
Category 5 Ethernet cable be used.
SERIAL
RJ-45 Type Connector - Control port used exclusively for configuring Ethernet
communication parameters.
AUX 1
RJ-45 Type Connector - This port is used to control the SR5500 6 GHz(-EX) RF Converter.
AUX 2
RJ-45 Type Connector - Reserved for future use.
AC Power Receptacle
The AC universal power receptacle is located on the lower left corner of the rear panel. This
receptacle also contains the fuses for the unit.
Chapter One: Introduction | 9
1.5. Quick Start Procedure
To prepare the SR5500 for initial operation, perform the following steps. Refer to the
table below to determine the number of cartons in the SR5500 shipment.
1. Unpack the SR5500 shipping cartons. There should be two shipping cartons, one
containing the SR5500 and accessories and the other containing the PC. An optional
third carton contains the SR5500 6 GHz(-EX) RF Converter and accessories.
a. The cartons should contain a packing list detailing all the items in the cartons.
b. Make sure that all parts listed on the packing list are contained in your SR5500
shipping cartons.
c. Save the shipping cartons and packing materials until you have completed the
system installation and initial check. If you must return equipment, please use
the original box and packing material.
d. Check each item for physical damage. If any part appears to be damaged, contact
the Spirent Communications Customer Service department.
2. Plug one end of the supplied AC power cord into the rear panel, and then plug the
other end into your AC source. Repeat as necessary.
3. Connect supplied loop-back cables from LO IN CH1 to LO OUT CH1. Repeat for LO
CH2.
4. OPTIONAL: Connect the following cables between the SR5500 and the SR5500 6
GHz(-EX) RF Converter.
(From) SR5500 (To) 6 GHz(-EX) RF Converter Cable Used
CHANNEL 1 RF IN IF - CH1 OUT Supplied N-N cable
CHANNEL 1 RF OUT IF - CH1 IN Supplied N-N cable
Page 18

10 | SR5500 Operations Manual
(From) SR5500 (To) 6 GHz(-EX) RF Converter Cable Used
CHANNEL 2 RF IN IF - CH2 OUT Supplied N-N cable
CHANNEL 2 RF OUT IF - CH2 IN Supplied N-N cable
AUX 1 (Unlabeled RJ-45 connector on
5. Connect the supplied cross over cable from the PC built-in Ethernet port (not the PC
Card Ethernet Port), to the SR5500 Ethernet port on the rear panel. Optionally, you
can connect the PC Card Ethernet Port to the LAN.
NOTE: When connecting the 6 GHz(EX) RF connector to the SR5500 the supplied
N, N cables must be used in order to maintain level accuracy.
6. Turn the power on.
e. Set the AC power switch on the lower right corner of the front panel to the "|"
position. The SR5500 now executes its power-up self test and calibration
sequence, this takes a few seconds. You will hear two beeps and the status light
will illuminate green. Note: The STATUS Light will take a few seconds before
turning on.
f. OPTIONAL: If the SR5500 6 GHz(-EX) RF Converter is present, turn the power on
by setting the AC power switch to the “|” position on the rear of the unit.
g. Power on the PC. Refer to the PC documentation for details.
7. Launch the instrument control software SR5500 TestKit on the PC by clicking the
TestKit icon
complete the connection to the SR5500 by clicking the Connect icon
Figure 1-7.
RJ-45 Cable
rear panel)
on the desktop. After launching the SR5500 TestKit application,
shown in
Figure 1-7: SR5500 TestKit Software Menus
8. TestKit indicates the connected status by displaying Status: Connected in the status
bar at the bottom of the window as shown in Figure 1-8.
Page 19
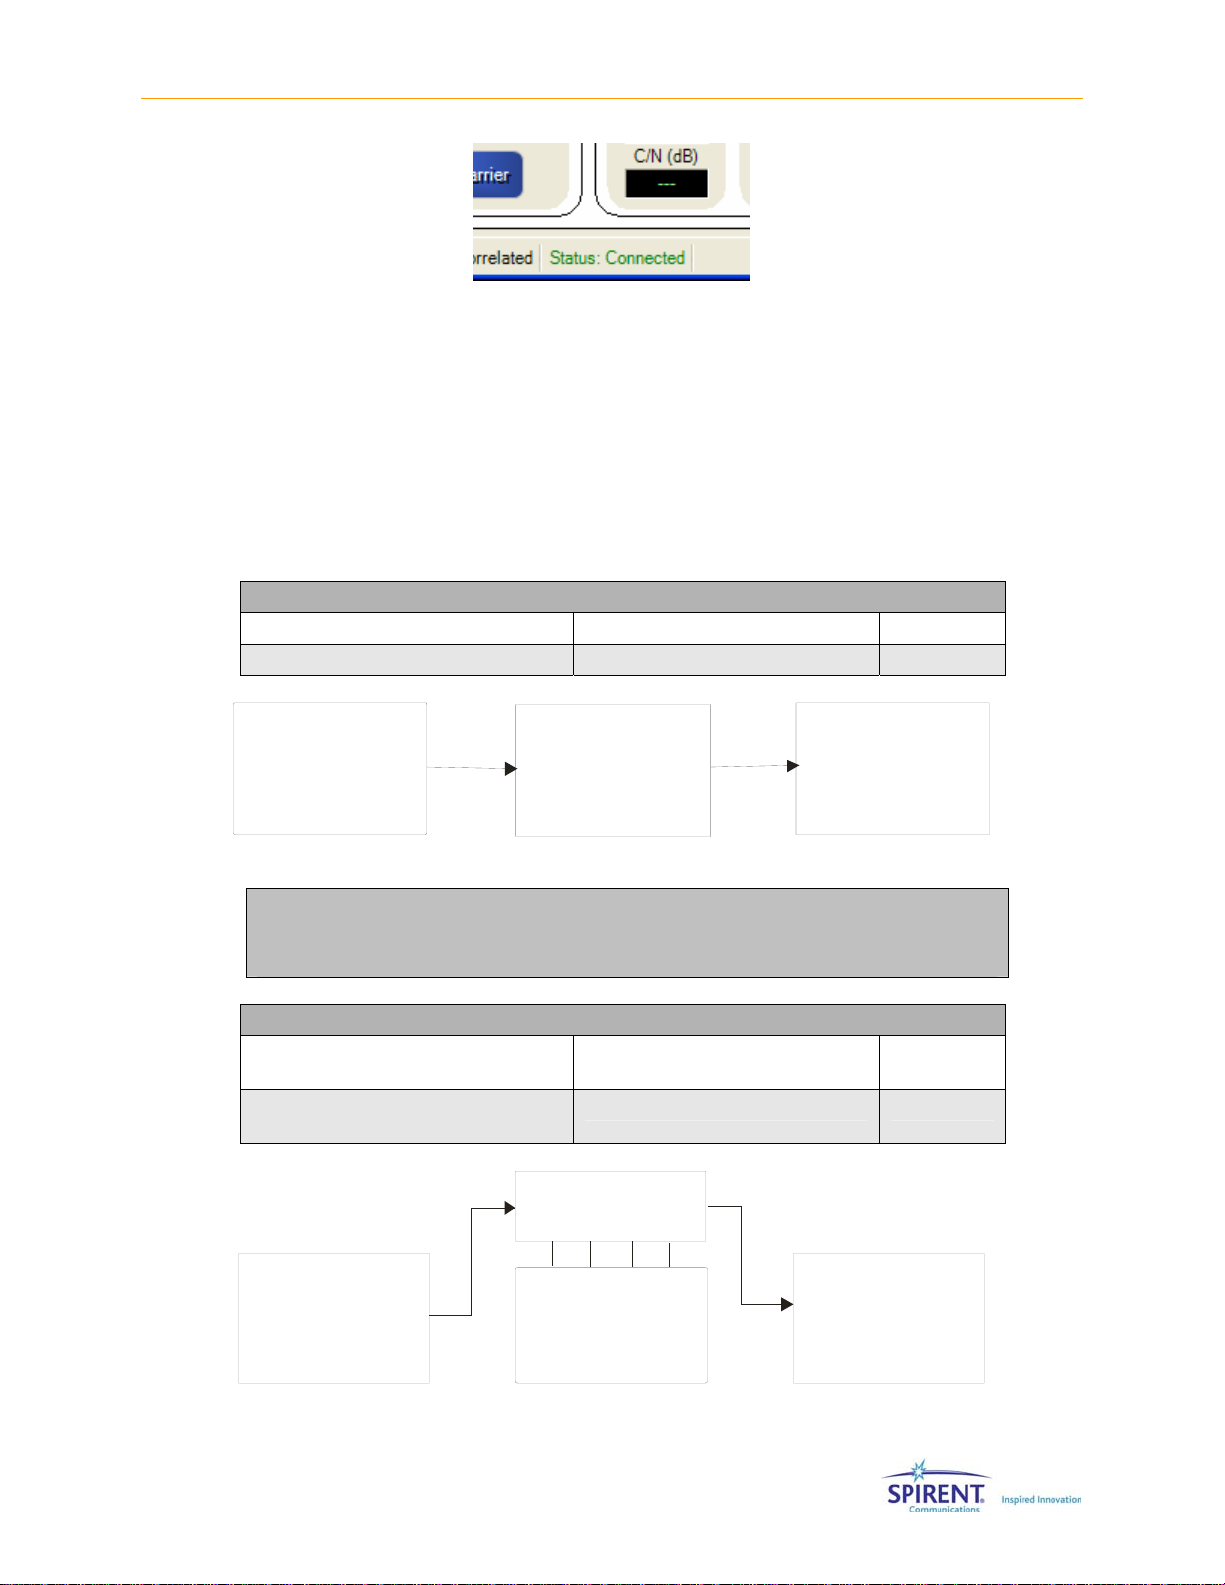
Figure 1-8: Status Connected Indicator
1.6. Verification Procedure
This procedure verifies the basic operation of the SR5500. It is not necessary to
complete these steps to use the SR5500. A signal generator and spectrum analyzer
capable of operating at 900 MHz is needed for this verification. The SR5500 default
settings are used for this procedure. Use the table and block diagram below to connect
the required equipment.
Connect From Connect To Cable
Signal Generator Output SR5500 CHANNEL 1 RF IN N to N
SR5500 CHANNEL 1 RF OUT Spectrum Analyzer Input N to N
Chapter One: Introduction | 11
Signal
Generator
SR5500
CH1
RF In
Figure 1-9: SR5500 Verification Setup Diagram
CH1
RF Out
Spec tr um
Analyzer
OPTIONAL: Use the table and block diagram shown in Figure 1-10 to
connect the equipment to a SR5500 equipped with the 6 GHz(EX) RF
Converter.
Connector 1 (From) Connector 2 (To) Cable
Signal Generator Output SR5500 6 GHz(-EX) RF Converter
CH 1 RF IN
SR5500 6 GHz(-EX) RF Converter CH
1 RF OUT
CH1 In
Spectrum Analyzer Input N-Type
CH1 Out
N-Type
6GH z Option
Signa l
Gener ator
SR5500
Spec tr um
Analy zer
Figure 1-10: SR5500 with 6GHz (-EX) Option Verification Setup
Page 20

12 | SR5500 Operations Manual
To run the Verification Procedure:
1. Set the signal generator to 900 MHz with an output power of -10 dBm.
2. Set the spectrum analyzer to 900 MHz with a span of 30 MHz.
3. The output signal should be about -40 dBm, as in the spectrum analyzer display
shown in Figure 1-11.
Figure 1-11: Spectrum Analyzer Output Signal of SR55 00 at 90 0 MHz
1.7. Quick Start Using Test Assistant
This procedure uses the Test Assistant to step through an example of a GSM standard
Specification Test. Test Assistant automatically configures the SR5500 for the specific
test application.
A Base Station Emulator, circulator, and a DUT (GSM Mobile) are used for this procedure.
Figure 1-12 shows the setup for the Mobile Test.
Figure 1-12: Mobile Test Setup
1. Connect the Base Station Emulator RF Output Port to the Channel 1 RF IN of the
SR5500 with the appropriate cable.
2. From Channel 1 RF OUT on the SR5500 connect to Port 1 of a Circulator, using the
appropriate cable.
Page 21

Chapter One: Introduction | 13
3. Connect Port 2 of the circulator to the Antenna Port of the GSM DUT (mobile phone
for this example). This completes the required connections for the downlink path
(Base Station to Mobile Station).
4. Connect Port 3 of the Circulator to the RF Input Port of the Base Station Emulator.
This connection establishes the unimpaired uplink path (Mobile Station to Base
Station).
5. After completing the interconnections outlined in Figure 1-12, power-on all
instruments in the test setup.
Before proceeding with the Test Assistant configuration, ensure the SR5500 TestKit is
running and connected to the SR5500.
6. Click the Test Assistant icon
The Test Assistant Window displays as shown in Figure 1-13.
located on the toolbar of SR5500 TestKit.
Figure 1-13: Test Assistant Window
7. Set the following parameters:
h. Set Technology to GSM.
i. Set Unit Under Test to Mobile.
j. Set Band to E-GSM900.
k. Set Channel Number to 50.
8. Select Use the following standard fading profile shown in Figure 1-14.
Figure 1-14: Test Assistant Window – Profile Selection Option
9. Select the HT2 (100 km/h, 12 path) model from the profile list.
Page 22

14 | SR5500 Operations Manual
10. Click the OK button.
The Channel Editor is now set to the test case Hilly Terrain 12 path model used for
3GPP test standards.
Figure 1-15: Sample Channel Editor with Correct Values Entered
11. Set the Base Station Emulator output power to -10 dBm.
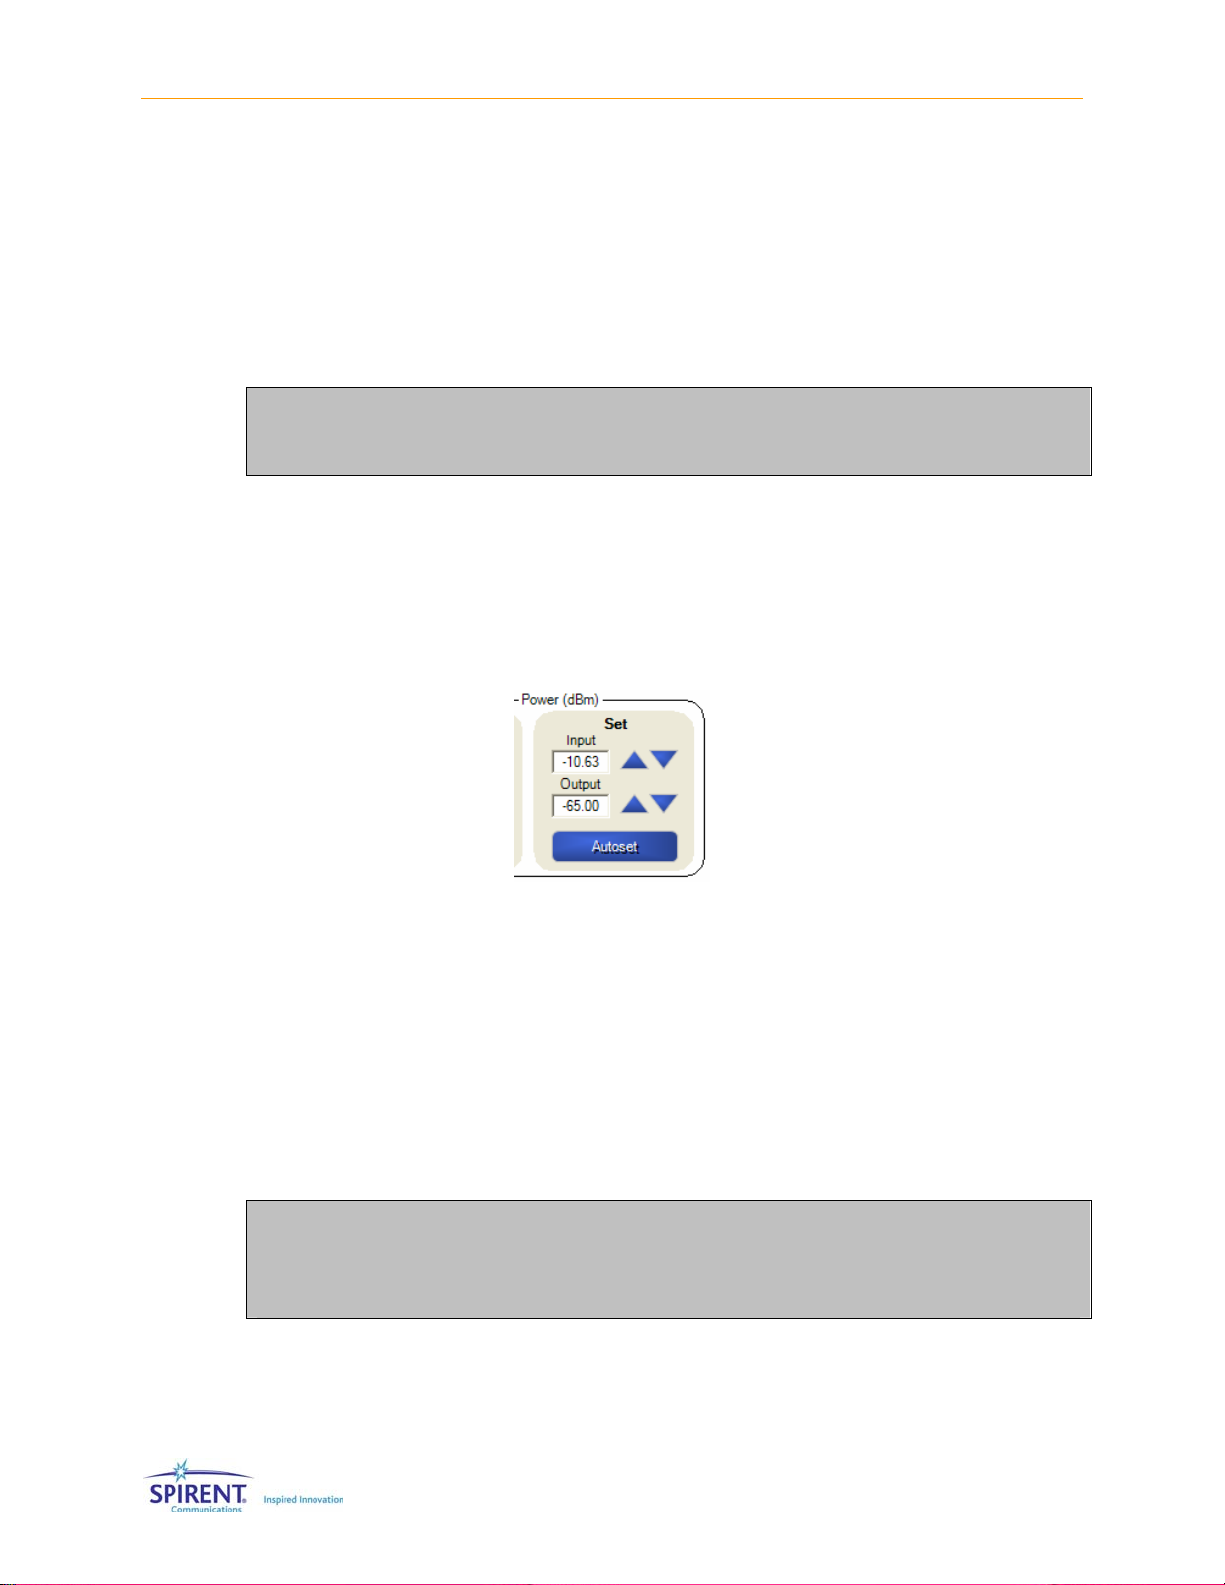
12. Program the Output Level to -65 dBm shown in Figure 1-16.
Figure 1-16: Output Level Meter
13. Click the Autoset button in the Channel Editor as shown in Figure 1-17.
Figure 1-17: The Autoset Button
14. Click the Channel Player icon to get a channel representation of the fading profile
generated by the SR5500.
Figure 1-18: The Channel Player Button
Page 23

Figure 1-19: Sample TestKit Window
15. Click the Play button to start the Fading Emulation.
You are now ready to perform a Mobile Performance Test.
Chapter One: Introduction | 15
1.8. Version History
The following information provides a summary of feature releases for the SR55500 since
the initial Version 1.00 release. To upgrade to a particular version, the SR5500
instrument Annual Service Agreement (ASA) expiration date must be later than or equal
to the release ASA date. To verify the ASA expiration date, refer to Section 2.12 on page
60.
Version 2.30 (Release ASA DATE: MAY 2007)
• Added the ability to set Complex Correlation between any two channels located in
different SR5500 systems. In addition, a unique Complex Correlation value can be
specified between each corresponding path between the two channels.
• Added the ability to change C/N, and Doppler Velocity Parameters within DEE.
• Added the latest frequency bands, channels, and fading profiles specified in 3GPP TS
25.101 Release 6 and 7.
Version 2.21 (Release ASA DATE: DECEMBER 2006)
• Resolved an issue in RPI mode that caused DEE to fail unless DEE had been run
manually at least once since power-up of the SR5500.
Version 2.21 (Release ASA DATE: DECEMBER 2006)
• Resolved an issue in RPI mode that caused DEE to fail unless DEE had been run
manually at least once since power-up of the SR5500.
Version 2.20 (Release ASA DATE: DECEMBER 2006)
• Added the Remote Programming Interface view. This allows for remote control of the
TestKit application via either the TCP/IP protocol or GPIB.
Page 24

16 | SR5500 Operations Manual
• Added the ability to change Angle of Arrival, K-Factor, and Frequency Shift
Parameters within DEE.
• Added the ability to control multiple SR5500’s with the SR5500-6GHZ-EX option
simultaneously.
• Added the ability to turn the RF Output on or off with a single command.
• Resolved an issue that caused AWGN not to function properly with some hardware.
Version 2.10 (Release ASA DATE: APRIL 2006)
• Added ability to set Rayleigh fading correlation between channels located in different
SR5500 systems.
• Added support for the SR5500-6GHZ-EX option which adds the 3300-3850 MHz
Band.
• Added a “summary screen” to TestKit which allows you to view all configured paths in
up to four systems simultaneously.
• Added the ability to connect to up to four SR5500 units simultaneously in an
unsynchronized manner.
• Extended the C/N ratio available when the channel Crest Factor is set to a non-
default value or when Log-Normal is enabled.
• Significantly increased the speed of DEE compilation by changing the format of the
source file from an XML based file (SSX) to a raw text file (STB).
• Resolved an issue that prevented the SR5500 from being controlled across a
network router.
Version 2.01 (Release ASA DATE: AUGUST 2005)
• Resolved an issue where, in some cases, noise could be produced at the SR5500
output port when no input signal was presented at the input port. This could also
have occurred during the OFF time of a non-continuous signal.
Version 2.00 (Release ASA DATE: AUGUST 2005)
• Added support for control of up to four SR5500 units from a single TestKit GUI.
• Increased accuracy of output Power Meter when noise is enabled.
• Added real time C/N measurement to main window.
• Added settable duty cycle to Power Meter parameters.
• Increased allowable number of averages on Power Meter.
• Resolved issue with Test Assistant CDMA2K Fading Profile 5, where paths were being
set to Rayleigh instead of static.
• Added 802.16(WiMAX) Models to the Test Assistant.
• Added “Round 12dB” Doppler shape for 802.16(WIMAX) testing.
• Increased resolution of Rayleigh Doppler velocity and frequency to accommodate
802.16(WIMAX) testing.
Version 1.31 (Release ASA DATE: SEPTEMBER 2004)
• Added real time C/I measurement to TestKit.
• Resolved issue which caused a long power-up sequence to occur on some units.
Page 25

Chapter One: Introduction | 17
• Added Settable Crest Factor.
• Resolved issue which caused graphical display of C/I ratio to be incorrect. (C/I ratio
set in SR5500 was correct).
• Various stability improvements were made to TestKit.
• Code Examples added to the installation.
• In BYPASS mode, internal Local Oscillator source is turned off to reduce interference.
Version 1.30 (Release ASA DATE: SEPTEMBER 2004)
• Added programmable correlation support.
• Added Diversity Modes.
• Added API Front Panel Tool.
• Modified STOP state to be a clean channel.
• Added output cable loss corrections factors.
Version 1.25
• Added support and calibration for new internal RF hardware modules.
• Resolved an issue with Birth Death Propagation introduced in 1.20.
• Resolved an intermittent power-up issue.
Version 1.21
• Resolved issue where the crest factor of the signal was miscalculated, resulting in
occasional failed auto-sets.
Version 1.20
• Added Dynamic Environment Emulation (DEE) feature.
• Added Log-Normal Fading feature.
• Improved firmware upgrade process.
Version 1.11
• Maintenance release to resolve an issue with interoperability with TASKIT/C2K.
Version 1.10
• Added AWGN (Additive White Gaussian Noise) feature.
• Added Triggered Power Measurement feature.
Version 1.01
• Maintenance release to resolve a number of TestKit issues.
Version 1.00
• Initial Product Release.
Page 26

18 | SR5500 Operations Manual
Page 27

2. Operation Reference
2.1. Overview
SR5500 TestKit is a PC-based Graphical User Interface (GUI) for the configuration and
control of the SR5500. TestKit runs under the Microsoft Windows operating system,
delivering the same ease of use and GUI features that Windows provides. These features
make it easy to use the SR5500 test system to perform sophisticated tests in a wide
range of communication environments.
NOTE: SR5500 TestKit has already been installed on the PC that accompanies
the SR5500.
• Although SR5500 TestKit is already installed on the accompanying PC, an SR5500
TestKit Install CD is included in the Manual binder. Use this CD to reinstall the
application on the provided PC, if needed.
This section describes the basic operations of SR5500 TestKit. For more detailed
information about the features, refer to Chapter Three on page 67.
NOTE: TestKit first starts in Local mode and does not control the SR5500. Refer
to Section 2.2.1. on page 20 for more information.
NOTE: The SR5500 features a powerful Player function that allows greater
control over the fading emulation. The Player defaults to the Stopped position.
To enable the channel emulation, click the Play button in the Player controls.
2.2. Operational Overview
To start SR5500 TestKit from the Windows Start Menu, click the SR5500 TestKit icon.
You can also start SR5500 TestKit by clicking the program icon on the Windows desktop
.
SR5500 TestKit Main Window displays, as shown Figure 2-1. This section will help you
familiarize yourself with the SR5500 TestKit basics.
Page 28
20 | SR5500 Operations Manual
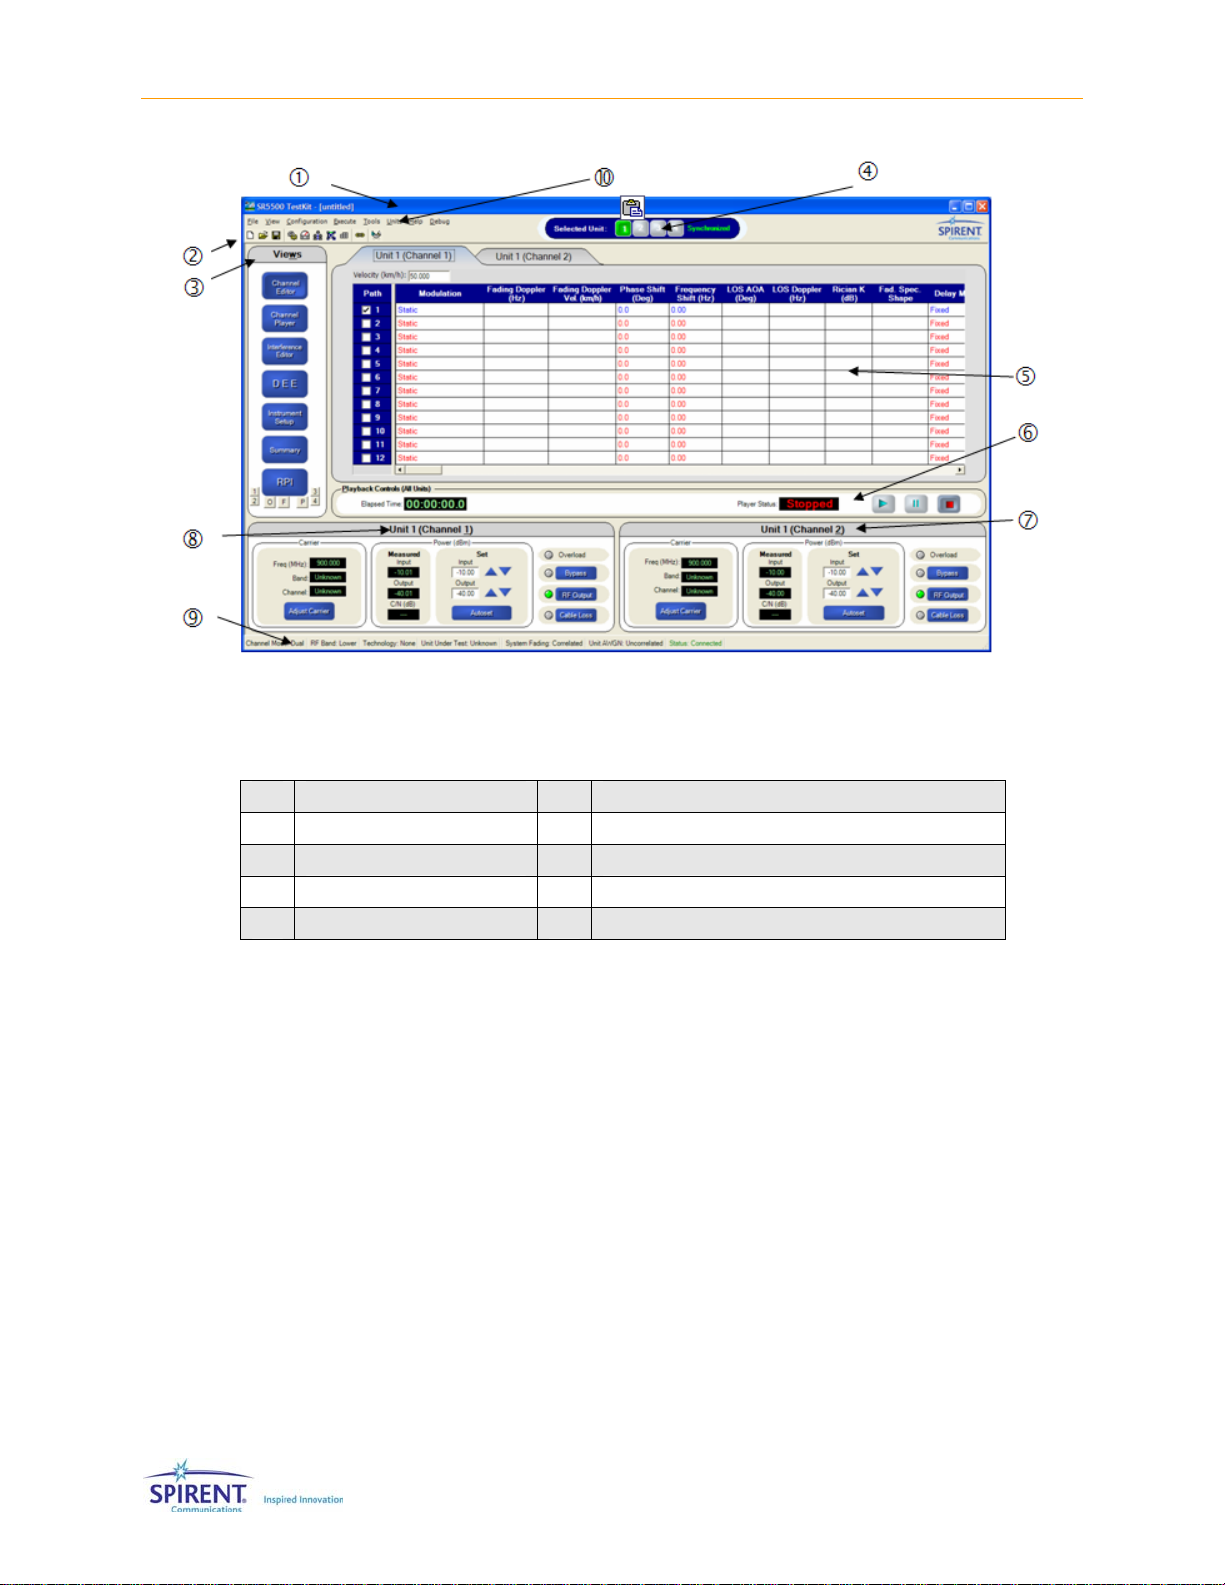
Figure 2-1: TestKit Main Window
The table below indicates the different parts of the SR5500 TestKit Graphical User
Interface (GUI).
c
d
e
f
g
Title Bar
Tool Bar
View Controls
Unit Selection
View Area
Player Controls and Indicators
h
Channel 2 I/O Controls and Indicators
i
Channel 1 I/O Controls and Indicators
j
Menu Bar
k
Unit Selection
l
2.2.1. Connecting to the SR5500
SR5500 TestKit can operate in Local Mode or Remote Mode. In Local Mode, TestKit does
not communicate with the SR5500. It emulates the control of the SR5500 but does not
send any commands and the actual configuration of the SR5500 is not known.
In Remote Mode, SR5500 TestKit sends commands to the SR5500 and receives status
information back. The presentation in Remote Mode is an accurate representation of the
configuration of the SR5500. TestKit starts in Local Mode, and must be manually set-up
to act in Remote Mode. There are two indicators of the Mode TestKit is in. The status bar
on the bottom of the window indicates Not Connected or Connected, respectively. The
Status Indicators are shown in Figure 2-2.
Page 29

Chapter Three: Technical Reference | 21
Figure 2-2: Connection Status Indicators
The icon on the tool bar changes appropriately to indicate the current status. In the
Execute menu, the first item in the menu displays, "Disconnect from SR5500" while in
Remote Mode.
Figure 2-3: Execute Menu – Connect to SR5500
To enter Remote Mode, click the Connect to SR5500 icon , or select
Execute>Connect to SR5500 as shown in Figure 2-3.
While establishing connection to the SR5500, TestKit attempts to communicate with the
SR5500. If successful, it communicates with the SR5500 to synchronize the PC software
and the SR5500 unit. If it is unsuccessful, you receive an error message indicating the
problem.
2.2.2. Basic Operation
2.2.2.1 Title Bar
At the top of the window is the Title Bar, as shown in Figure 2-4, which contains the
program name and the name of the current settings file. After starting SR5500 TestKit,
the current settings file is “[Untitled]”. The buttons at the right side of the Title Bar allow
you to minimize, resize or close the TestKit Application. The title bar also indicates the
current view.
Figure 2-4: TestKit – Sample Title Bar
Page 30
22 | SR5500 Operations Manual
2.2.2.2 Menu Bar
The Menu Bar, shown in Figure 2-5, is located immediately below the Title Bar. To display
the items in that menu, click the menu name or hold down the Alt and the underlined
letter of the menu title. Each menu provides access to a certain type of functionality.
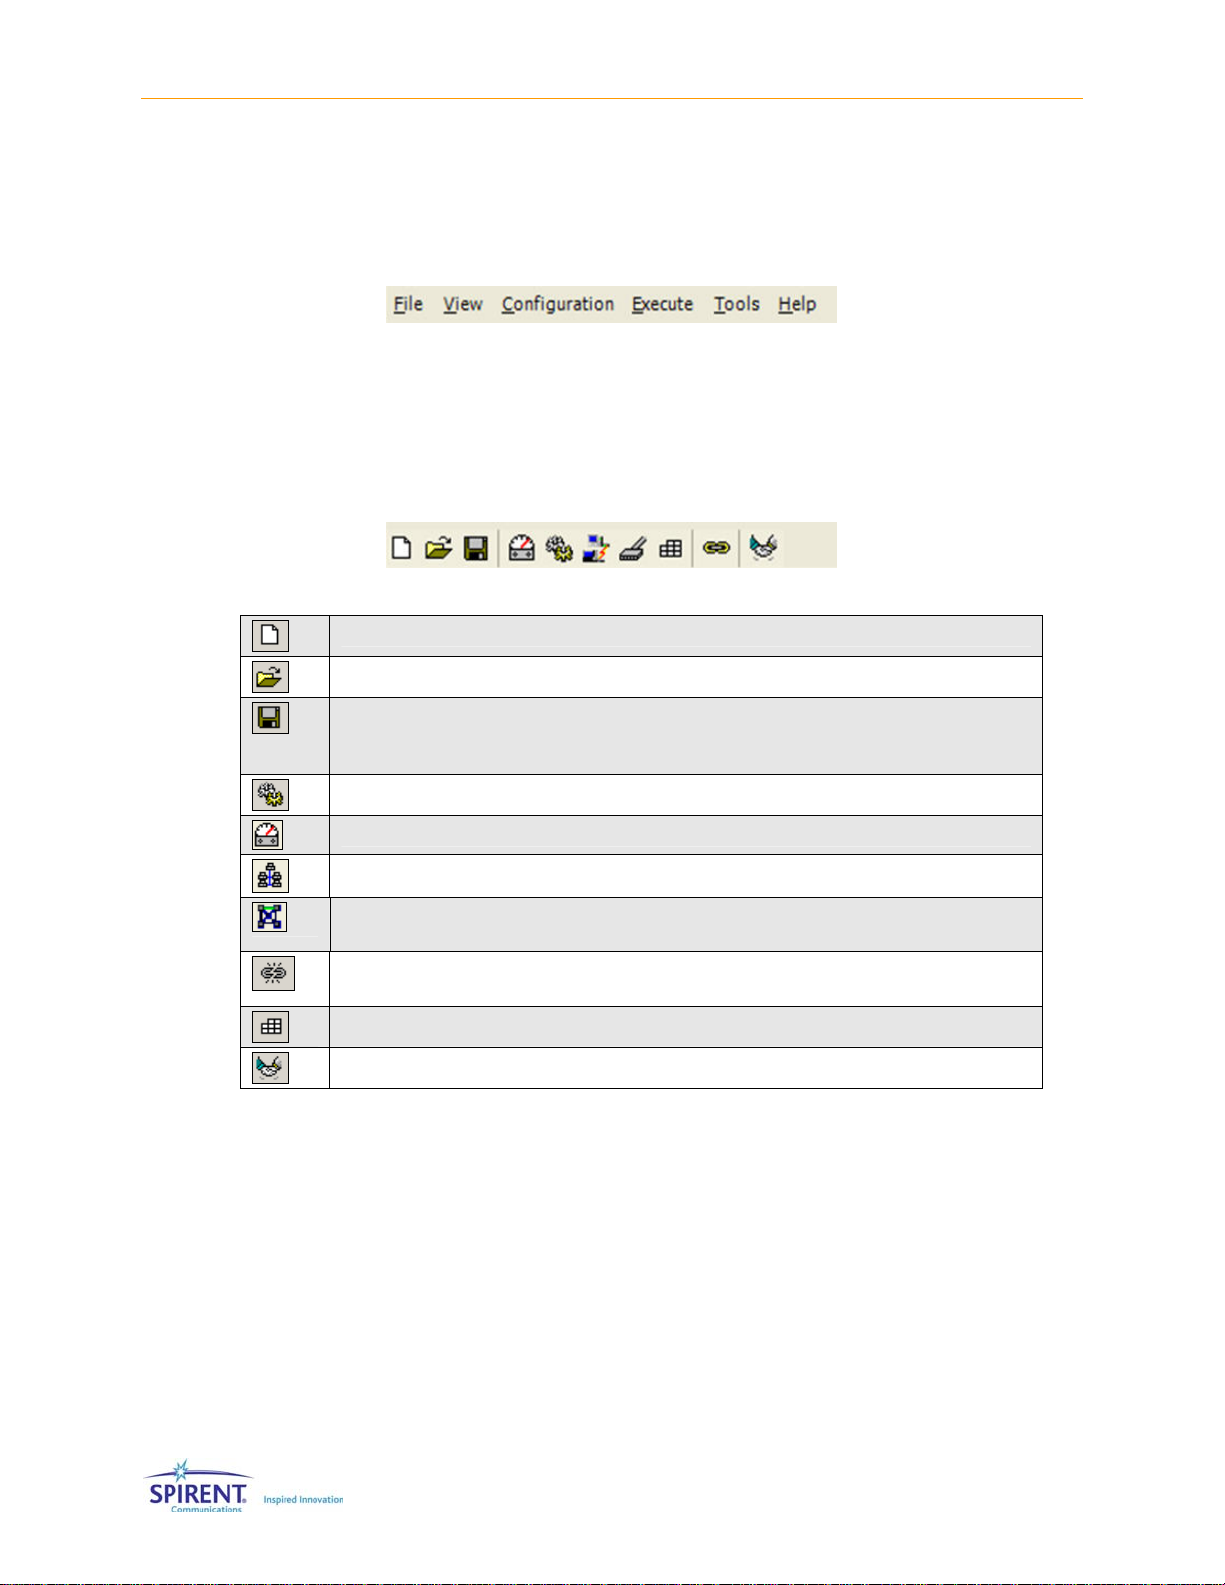
2.2.2.3 Toolbar
The Toolbar, shown in Figure 2-6, is located beneath the Menu Bar. The Toolbar provides
quick access to commonly used functions.
New Settings File - Resets all settings to the default values.
Open Settings File - Loads the settings previously saved in a file.
Save Settings File - Saves the current settings to the current file. If the settings
have not yet been saved to a file, you will be prompted to specify a file name and
location.
Displays the System/Communication Setup Window.
Displays the Power Meter Parameters Window.
Displays the Remote Programming Interface (RPI) setup window.
Displays the Correlation Coefficient window (This icon is only available when
controlling multiple SR5500s in a synchronized system-based manner).
Indicates the connection status with the SR5500 unit, and causes the opposite
status to be triggered when clicked.
Displays the Table Format Window.
Displays the Test Assistant Window.
Figure 2-5: TestKit – Sample Menu Bar
Figure 2-6: TestKit – Sample Toolbar
2.2.2.4 View Area
The contents of the View Area can be changed to provide access to different
functionality. Select the contents of the View Area by clicking on the Views buttons, or by
making a selection from the View menu. An example of the View Area is shown in Figure
2-7.
Page 31

Chapter Three: Technical Reference | 23
Figure 2-7: TestKit – Sample View Area
2.2.2.5 View Controls
The View Controls change the contents of the View Area. Different views provide access
to different functionality. The View buttons work the same as selecting the item from the
View menu. A sample View Control area is shown in Figure 2-8.
Figure 2-8: TestKit – Sample View Controls
2.2.2.6 Player Controls and Indicators
The Player Controls and Indicators allow control over the powerful fading playback
engine. For a given set of profile conditions, the engine will always generate the same
fading sequence. A sample Player Control Bar is shown in Figure 2-9.
Figure 2-9: TestKit – Sample Player Control Bar
You can control the fading emulation playback status with the Player Controls similar to
the way you use the controls on a CD player. Observe the current point in the fading
sequence via the Elapsed Time indicator.
Page 32

24 | SR5500 Operations Manual
Use the Play button to cause the fading emulation playback to proceed. Use the
Stop button
zero. Use the Pause button
While paused, use the Play button to resume emulation playback.
While stopped or paused, the SR5500 does not vary the signal passing through it. The
signal is subjected to the exact fading conditions at the moment indicated by the Elapsed
Time indicator.
While stopped, the SR5500 does have modulation enabled. The fading channel behaves
as if a single path were enabled with no modulation. The delay of this path matches what
is set for Path 1 of the channel. In Transmit Diversity Mode, the SR5500 has a clean
channel from RF1 IN to RF1 OUT
to stop the fading emulation playback and reset the Elapsed Time to
to temporarily suspend the fading emulation playback.
NOTE: When changing a parameter during playback, the SR5500 resets the
Time Elapsed indicator to zero and continues playing. When changing a
parameter while paused, the SR5500 resets the Time Elapsed indicator to zero
and stops. Additive impairments are unaffected by the Play, Stop, and Pause
buttons.
NOTE: The player state does not affect the additive interferer state. If AWGN is
enabled, it is present even if the player is stopped.
2.2.2.7 Channel 1 and Channel 2 I/O Controls and Indicators
Below the Player Controls and Indicators are the Channel 1 and Channel 2 I/O Controls
and Indicators. The Carrier Frequency Control and Indicators are on the left. The current
carrier frequency is shown, as is the current Band and Channel for the selected
Technology and Unit Under Test. Refer to Section 2.6. on page 29 for details on
controlling the Carrier Frequency, Band, Channel, Technology and the Unit Under Test.
To the right of the Carrier frequency are the Power Controls and Indicators. Refer to
Section 2.6.1. on page 29 for details on controlling the input and output powers.
Figure 2-10: TestKit – Sample Channel 1 an d 2 Cont rols
2.2.2.8 Status Bar
The status bar indicates the current settings for the following items:
• Channel Mode
• RF Band
Page 33

• Technology
• Unit Under Test
• System Fading
• Unit AWGN
• Remote Status
• Operation Progress
Figure 2-11: TestKit – Sample Status Bar
Refer to appropriate sections for more details on the above settings. The status bar also
has an area to the right to indicate progress for actions that take more than a few
seconds.
2.3. Using the Test Assistant
The Test Assistant is a powerful feature that simplifies setting up the SR5500 for tests
based on industry standards.
Chapter Three: Technical Reference | 25
2.3.1. Accessing the Test Assistant
To access the Test Assistant, select Tools>Test Assistant, or click the Test Assistant icon
on the toolbar. The Test Assistant window displays as shown in Figure 2-12. For a
detailed example on using the Test Assistant, refer to Section 1.5 on page 9.
Figure 2-12: Test Assistant Window
Page 34

26 | SR5500 Operations Manual
2.3.2. Changing the Carrier Frequency
The Test Assistant allows you to enter the exact carrier frequency in MHz, or you can let
the program set the carrier frequency based on your application. To set the carrier
frequency directly, click the Select Carrier Frequency button. Enter the Carrier Frequency
in MHz in the textbox as shown in Figure 2-13.
Figure 2-13: Select Carrier Frequency Button
To set the Carrier Frequency based on the application, select the appropriate Technology,
then the Unit Under Test. Next, click the Select Band and Channel Number button. Select
the appropriate Band from the list box. Finally, enter the appropriate Channel Number.
The Test Assistant uses these settings to calculate the Carrier Frequency. The Carrier
Frequency appears below in the Carrier Frequency textbox.
2.3.3. Automatically Selecting a Channel Profile
The Test Assistant allows you to set the Fading Profile settings in the Channel Editor
according to an industry standard.
Figure 2-14: Test Assistant Channel Editor
If you want to leave the current settings in the Channel Editor, click the Do not overwrite
settings in the channel editor button.
You are permitted to select a fading profile that does not match the Technology and Unit
Under Test settings on the left. This flexibility allows you to apply any industry standard to
the testing application.
Select a fading profile to view a textual summary. A textual summary displays in the
textbox at the bottom of the window.
Page 35
When you have made your final selections, click OK to apply your selections and close
the Test Assistant window. If you want to cancel your selections, click Cancel to close the
window.
2.3.4. Completing the Configuration
Although Test Assistant does most of the work, we recommend you set the output power
and perform an Autoset. The SR5500 may not be properly configured for testing without
completing these additional steps. For details on performing an Autoset and setting the
output power, refer to Sections 2.6.1.4. and 2.6.1.5. on page 33.
NOTE: Selecting a Test Assistant configuration disables any Additive
Impairments. If desired, the Additive Impairment can be enabled in the
window.
2.4. Channel Player
Chapter Three: Technical Reference | 27
View
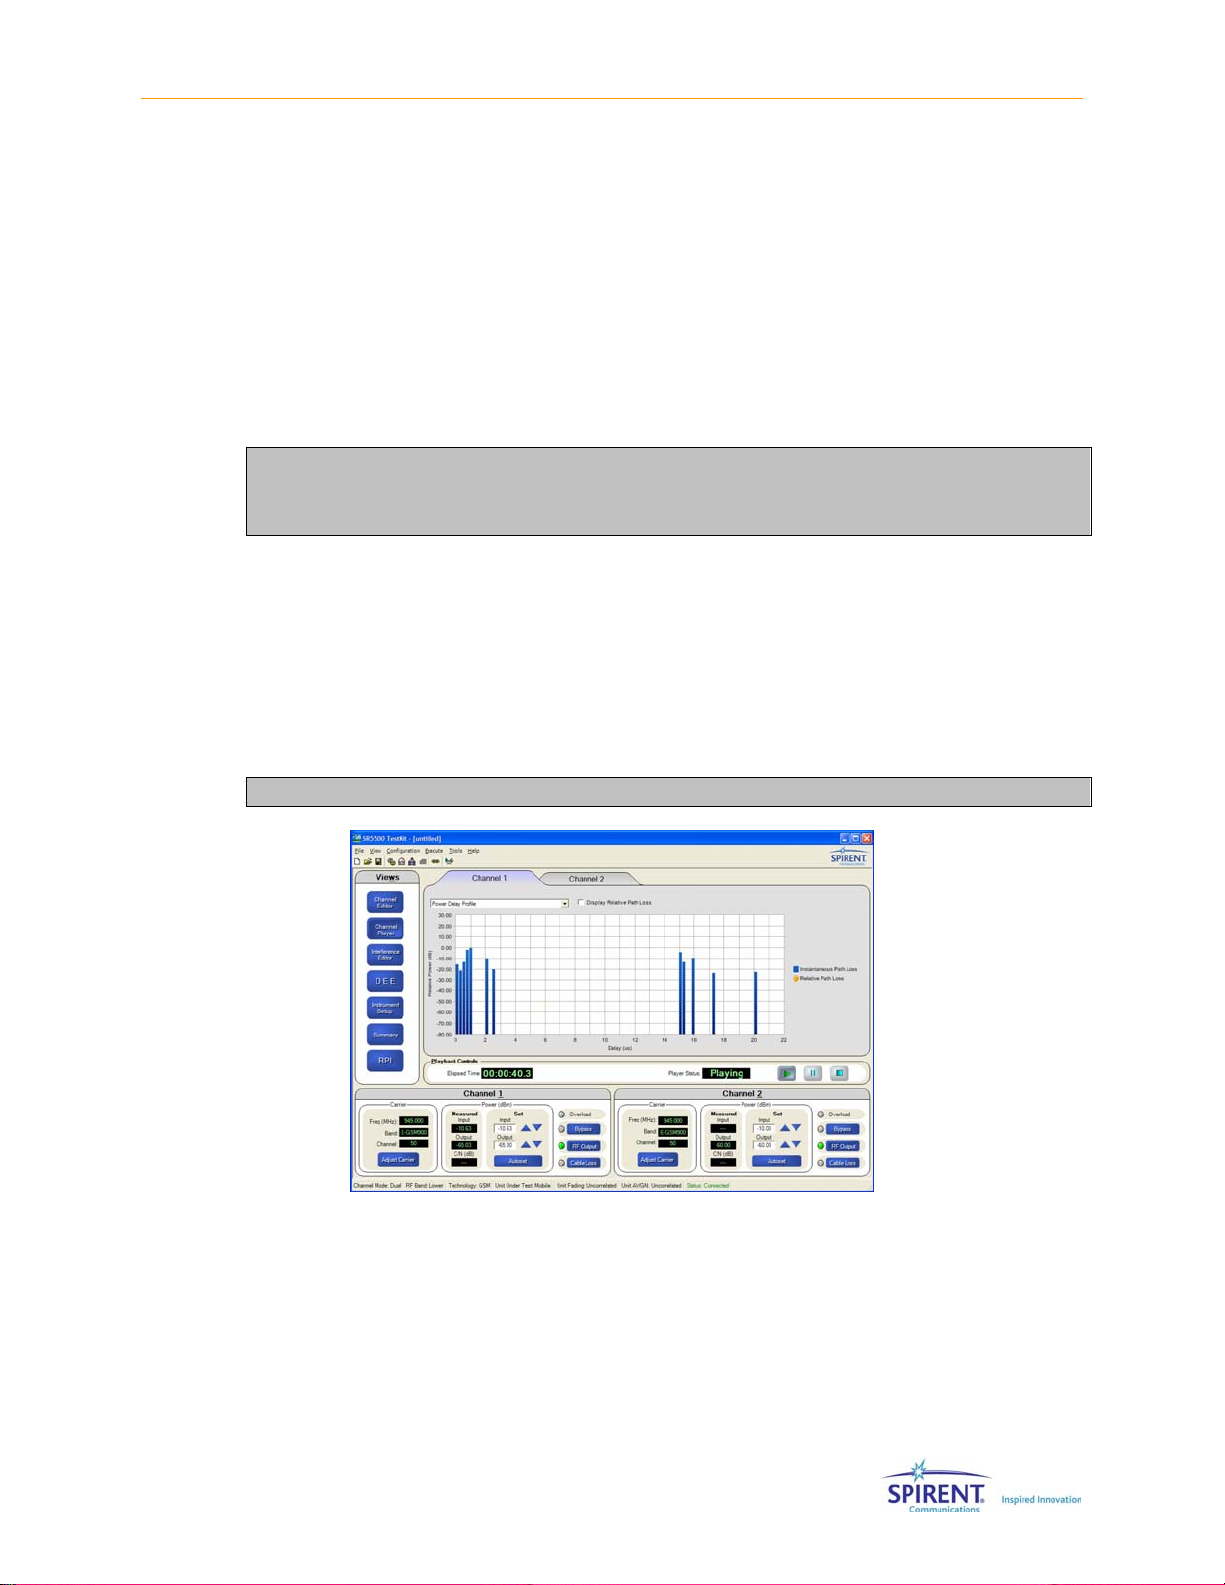
The Channel Player is a key feature of TestKit. This feature presents a graphical
representation of the fading profile as it changes. To access the Channel Player, click the
Channel Player button from the Views Panel. SR5500 TestKit displays the Channel
Player, similar to the display shown in Figure 2-15.
NOTE: This feature is not accessible when running DEE.
Figure 2-15: Channel Player Window
If the fading emulation playback is paused or stopped, the Channel Player view remains
static. If the playback is running, the Channel Player view constantly changes to show the
latest update in the fading emulation playback. The Channel Player features two unique
presentations. Change the presentation using the list box located above the graph.
Page 36
28 | SR5500 Operations Manual
The first presentation, the Power Delay Profile shows the instantaneous Power Delay
Profile. The delay for each path is represented by the position of each bar on the X axis
(Delay). The power of each path is represented by the height of each bar along on the Y
axis (Power). The Display Relative Path Loss checkbox shows and hides the average
power indicator for each path.
If Additive Impairments are enabled on the selected channel a horizontal line
representing the relative power of the impairment to the channel displays in the Player
view.
NOTE: The average power indicated for each path is relative to the total
composite output power of the channel. This does not map directly to the path
loss settings in the Channel Editor table.
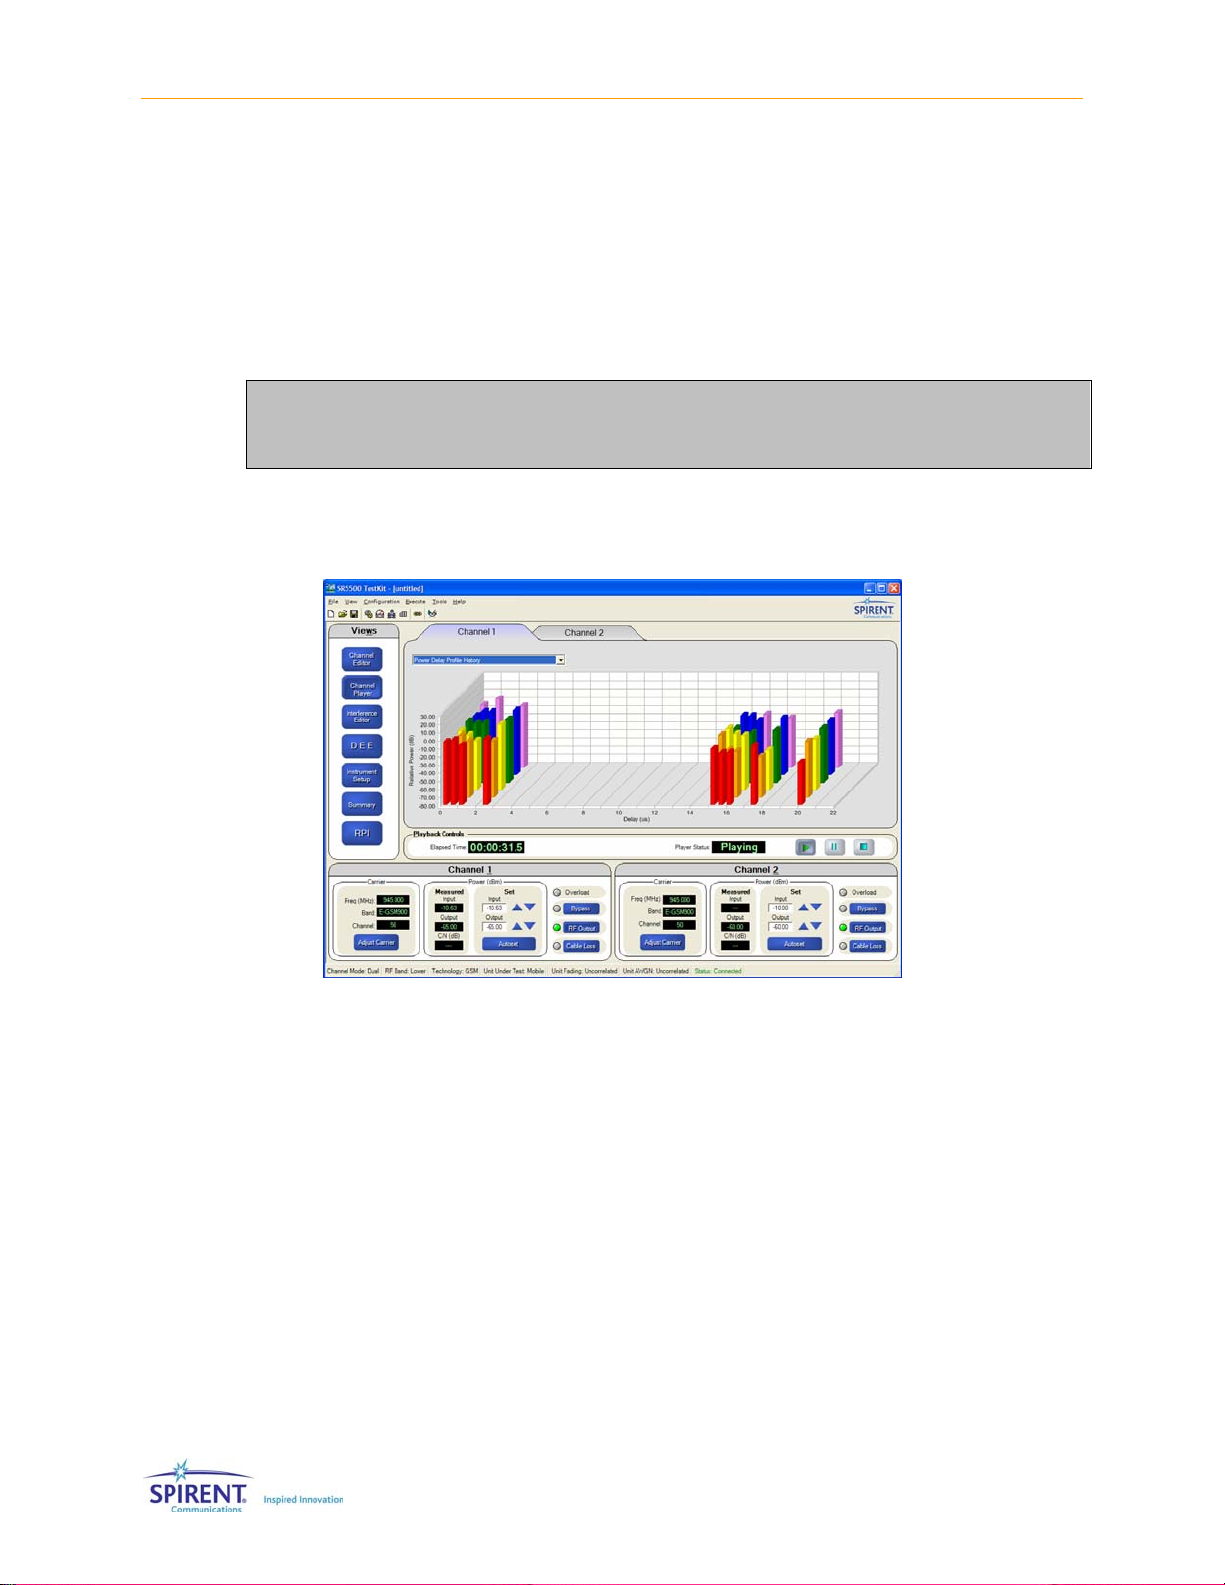
The second presentation, the Power Delay Profile History is similar to the first
presentation, but also displays a brief history. The older instantaneous Power Delay
Profiles move back along the Z axis (time) and the current DPD is added to the front.
2.5. File Operations
SR5500 TestKit supports saving and recalling files to simplify configuration of the
SR5500. As with most Windows applications, certain settings are saved in the file. When
the file is opened at a later time, those settings are restored.
Select File> New Settings File to reset settings back to their default values. Use Open
Settings File, Save Settings File, Save Settings File As, just as you would with any other
Windows application. Use the appropriate toolbar icons instead of selecting from the File
menu.
Figure 2-16: Power Delay – Profile History
Page 37

Chapter Three: Technical Reference | 29
2.5.1. Settings Saved in the Settings File
The following settings are saved in the Settings File and restored after opening a settings
file:
• System configuration (Channel Configuration and RF Frequency Mode).
• Test Assistant settings (Technology, Unit Under Test, Band, Channel, Profile).
• Channel I/O settings (Carrier Frequency, Input Power, Output Power, Bypass).
• All path settings in the Channel Editor view.
NOTE ON MULTI-UNIT USE: The settings for all four units are always saved in the
settings file. This is true even if only one unit is currently active. The number of
active units is stored in the system registry, not in the settings file. For
example, a settings file saved with three units active can be opened and used in
a setup that only has 2 active units.
The following settings are saved in the System Registry and restored after opening
TestKit:
• Number of active units.
• Communications settings for connected units. (IP address, etc.).
2.5.2. Recent File List
SR5500 TestKit maintains a list of the four most recently used files. These display at the
end of the File menu. To recall a file that appears on this list, select it from the File menu.
2.6. Operational Detail
This section details the parameters that control the Channel Input and Output and the
Path Fading parameters.
2.6.1. Channel I/O Parameters
Properly setting the Channel Input and Output parameters ensure the target signal is not
compromised in terms of fidelity and power, and produces the highest level of
performance from the SR5500. This section details the Channel I/O Parameters.
Page 38
30 | SR5500 Operations Manual
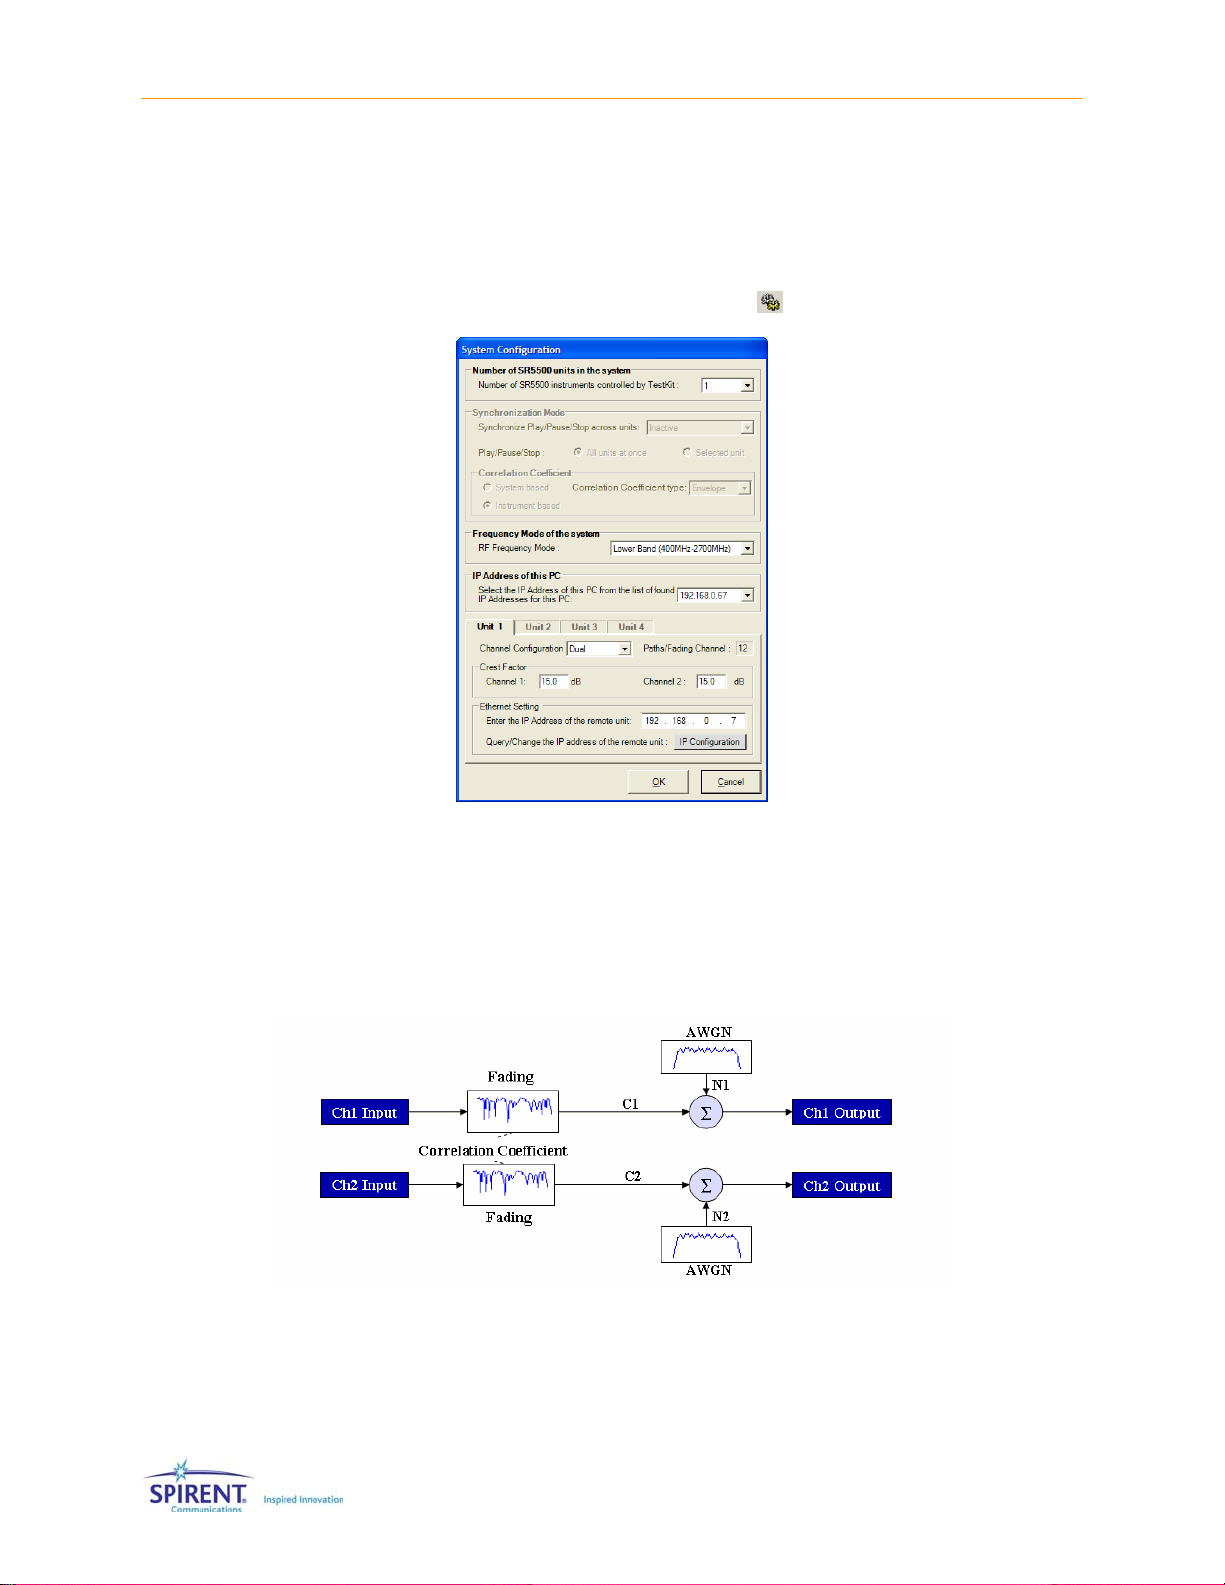
2.6.1.1 Selecting Instrument Configuration
The SR5500 can be configured for a single Channel with 24 Paths, or two Channels with
12 Paths each. Additionally, the SR5500 can be configured in both Receive and Transmit
Diversity modes. The number of Channels and Paths is set in the System/Communication
Setup window. To access this window, select Configuration>System/Communication
Setup, or click the System/Communication Setup icon
from the toolbar.
Figure 2-17: System Configuration Window
Set the Channel Configuration to Single for a single Channel with 24 Paths. Set the
Channel Configuration to Dual for two Channels with 12 Paths each. Set the Channel
Configuration to RX Diversity for two channels with 12 paths each. In this mode, both
channels are sourced by the CH1 RF IN port. Set the Channel Configuration to TX
Diversity for two channels with 12 paths each. These channels are then summed
together and output on the CH1 RF OUT port.
Figure 2-18: Dual Channel Mode Diagra m
Page 39

Chapter Three: Technical Reference | 31
Figure 2-19: Single Channel Mode
Figure 2-20: RX Diversity Mode
Figure 2-21: TX Diversity Mode
2.6.1.2 Setting the Channel Crest Factor
The Channel Crest Factor is a measure of the maximum peak/avg power ratio that the
SR5500 can accept without causing an overload condition. You can configure each
channel of the SR5500 to have a larger than default crest factor setting. To access this
window, select Configuration>System/Communication Setup, or click the
System/Communication Setup icon
from the toolbar.
Page 40

32 | SR5500 Operations Manual
Figure 2-22: System Configuration Window
The SR5500 Crest Factor is set to 15 dB, which is sufficient for most applications. You
can set larger values when required by the application.
NOTE: Increasing this value limits the maximum output power of the SR5500.
Additionally, system noise and spurious performance will be degraded.
2.6.1.3 Adjusting the Carrier Frequency
The Carrier Frequency must be set appropriately for each channel in order for the
SR5500 to function properly. The Carrier Frequency displays in the Channel controls and
indicators as shown in Figure 2-23.
Figure 2-23: Channel Controls and Indicat ors
To change the Carrier Frequency, click the Adjust Carrier button. SR5500 TestKit displays
the Channel Adjust Carrier Frequency window.
Page 41

Chapter Three: Technical Reference | 33
Figure 2-24: Channel Adjust Carrier Frequency Window
Adjust the carrier by setting the Band and Channel, or by selecting the Carrier Frequency
directly in MHz.
To set the Band and Channel:
1. Click the Select Band and Channel Number button.
2. Select the appropriate Band from the list box.
3. Enter the appropriate channel in the Channel Number textbox.
If the values you enter are valid, SR5500 TestKit displays the corresponding Carrier
Frequency in MHz in the read-only Carrier Frequency textbox.
If you want to change the currently selected Technology and/or Unit Under Test, use the
Test Assistant. For details on using the Test Assistant, refer to Section 2.3. on page 25.
To set the Carrier Frequency in MHz directly:
1. Click the Select Carrier Frequency button.
2. Edit the Carrier Frequency in MHz in the textbox.
3. Click OK to save the changes and close the window.
To cancel the changes, click the Cancel button.
2.6.1.4 Input and Output Level Control Overview
Both the SR5500 input ranging circuit and nominal output level can be manually
configured. Set the input ranging circuitry to match the RMS signal power present at the
input port to the SR5500. The output level parameter determines the nominal RMS
output power present at the output port of the SR5500.
NOTE: The output power level specified will only be accurate if the measured
input power matches the set input power settings.
Page 42
34 | SR5500 Operations Manual
To achieve the ideal performance from the SR5500, you must properly configure the
SR5500 input ranging circuit to the RMS input power. The SR5500 can measure the
input signal and automatically set the input ranging circuit, or you can manually set the
input ranging circuit. There are special concerns with directly setting these levels. Refer
to Section 2.6.1.6. on page 35 for details on setting the Input Power manually for details.
Access the automated level control functionality through the Autoset feature. Refer to
page 34 for details on the Autoset feature. SR5500 measures and reports the input
power level in SR5500 TestKit. Refer to the Section on Measured Input and Output
Power Indicators on page 36 for details.
NOTE: If the SR5500 is equipped with the SR5500 6 GHz(-EX) RF Converter, all
input and output power references are mapped to the input and output of the
SR5500 6 GHz(-EX) RF Converter.
2.6.1.5 Using Autoset
The Autoset feature measures the input signal power and configures the channel signal
levels for optimal output performance. The SR5500 performs the Autoset function once
each time you click the Autoset button. The SR5500 does not continually re-range for
changing input signal powers.
Figure 2-25: Autoset Option
To perform an Autoset:
Apply the appropriate input signal to the SR5500, then click the Autoset button. The
SR5500 measures the RMS input level and sets the correct input level circuitry.
The SR5500 also adjusts the output attenuation to achieve the set nominal RMS output
level. If the Autoset is successful, TestKit automatically updates the Set Input level
textbox.
If the Autoset is unsuccessful, TestKit reports the problem. If the input signal is bursty,
set the Power Meter in Triggered mode to measure the input signal correctly.
NOTE: As the input signal level changes over time, the output level change by
an equal amount. It may be necessary to repeat the Autoset because the
SR5500 does not automatically repeat the function. Make sure your measured
input power equals set input power.
Page 43

Chapter Three: Technical Reference | 35
2.6.1.6 Manually Setting the Input Power
The Input Ranging Circuit can be configured manually. To perform this operation, enter
the RMS power present at the SR5500 input in the Set Input textbox in TestKit.
Figure 2-26: Input Power Controls
You can also change the Input Level by clicking the Up and Down arrows to adjust the
value in the textbox. The value of the Set Input increases or decreases by 1 dB
increments. Holding down the Up or Down arrows causes the value in the textbox to
change more rapidly.
Examples of input signals that may require manual input level control include:
• A carrier signal with a variable input level.
• A bursty signal with a short on time.
If the carrier signal has a variable input level, configure the Set Input textbox to the
maximum expected RMS input signal power.
2.6.1.7 Input Overload Condition
If at anytime the SR5500 detects that the input signal level is higher than expected by
the input circuitry, an Overload condition exists. During an Overload condition, the
Overload LED on the front panel of the SR5500 displays. Also, TestKit illuminates the
Overload indicator in the Channel Control and Indicators area.
Figure 2-27: Overload Indicator
During an Overload condition, the input signal is too high to be properly sampled by the
unit input circuitry. Therefore, the SR5500 may cause undesired distortion of the input
signal. If the Overload condition exists, or periodically reoccurs, one or more of the
following actions may be necessary:
1. Reduce the signal level input to the SR5500.
2. Repeat the Autoset or manually set the input level with a signal level more
representative of its nominal level.
Page 44

36 | SR5500 Operations Manual
2.6.1.8 Adjust the Power Meter Parameters.
Refer to Section 2.8, Power Meter Parameters on page 54 for details on adjusting Power
Meter parameters.
2.6.1.9 Setting the Output Power
To set the nominal RMS output power level, enter the desired level in the Set Output
textbox in SR5500 TestKit. If the Set Input level accurately shows the actual input signal
level, the nominal RMS output level reflects the value in the Set Output textbox.
Figure 2-28: Output Power Controls
You can also change the nominal RMS output power level by clicking the Up and Down
arrows to adjust the value in the textbox. The value of the the Nominal RMS Output
Power increases or decreases by 1.0 dB increments. Holding down the Up or Down
arrows causes the value in the textbox to change more rapidly.
NOTE: The following are some of the conditions that can cause the Nominal RMS
Output Power to vary from the entered value:
• Input power measured does not match the Set Input textbox.
• Playback Engine in Pause mode.
• Channel Bypass active.
• No paths enabled for this channel.
• Output Cable Loss correction factor is incorrectly set.
2.6.1.10 Measured Input and Output Power Indicators
The SR5500 has built-in Power Meters that enable real-time monitoring of the input and
output. TestKit displays these power measurements in the Power Measurement Input
and Output textboxes. The input power measurement enables you to quickly determine
the accuracy of the Set Input value. The output power measurement represents the
average output power of the SR5500. If an interferer is enabled, TestKit displays the
measured C/N ratio. This measurement is based on the current measured output power
and the set C/N ratio.
You can set the output power measurement to one of two modes; Calculated or
Measured. In Calculated mode, the output power displays based on the measured input
level and the known loss of the channel. In this mode, the output measurement does not
respond to instantaneous changes in output power level caused by fast or slow fading.
This mode is useful when the Doppler is very low.
Page 45
Chapter Three: Technical Reference | 37
When set to Measured mode, the output power is measured and displayed after fading is
performed. The output power in this mode varies instantaneously with fading. The
Measured mode is not available when the Power Meter is set to Triggered mode.
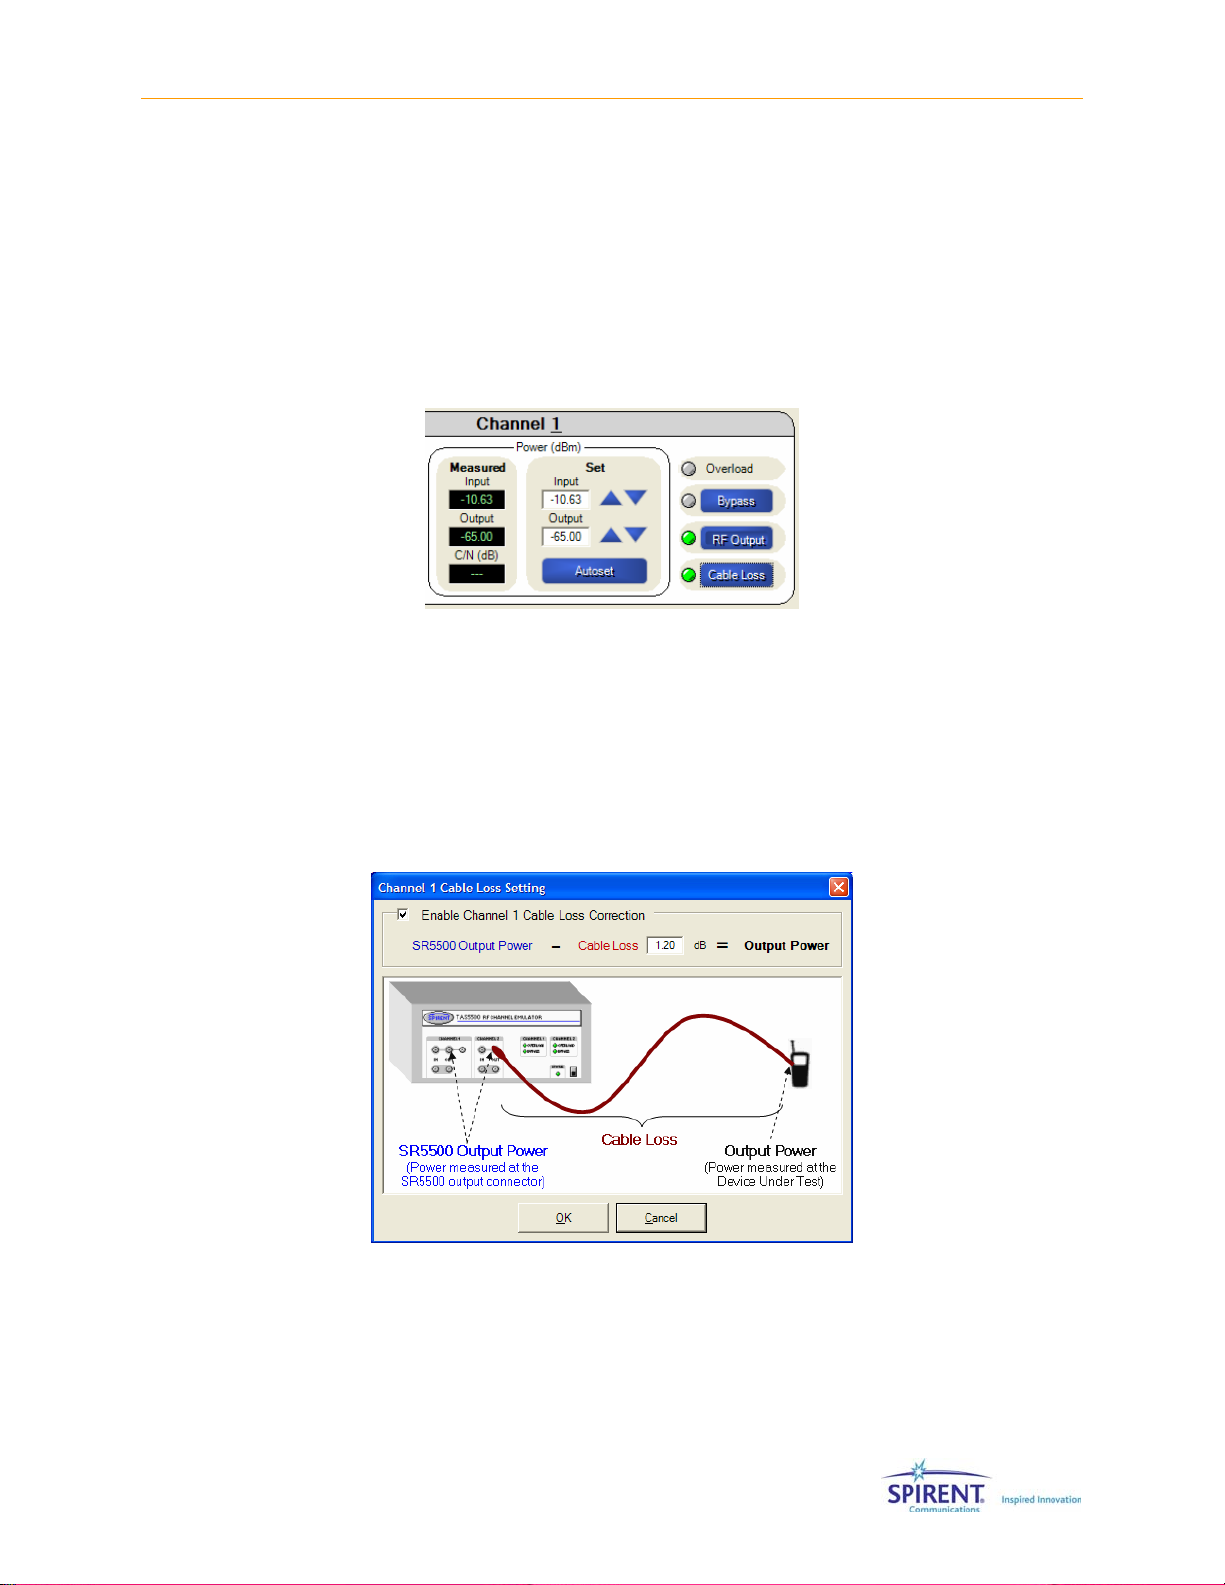
2.6.1.11 Adjusting the Output Power Cable Loss Correction Factors
The SR5500 has the ability to set and offset for measuring cable loss for both the Set
and Measured Power indicators. To perform this operation, click the Cable Loss button in
SR5500 TestKit.
Figure 2-29: Cable Loss Button
This opens the Cable Loss Setting window. This window allows you to enter a value for
the loss associated with a cable connected to the output port of the SR5500. When
enabled, a green LED lights up next to the Cable Loss button on the interface. When
enabled, any output level in the output level textbox is offset by the cable loss value. For
example, if a cable connecting the device has 1.2 db of loss associated with it, enter this
value in the Cable Loss Setting window. If you then set the output level of the SR5500 to
–50 dBm, the actual level at the RF output port of the SR5500 would be set to –48.8
dBm, but the level at the Unit Under Test would be –50dbm.
Figure 2-30: Cable Loss Setting Window
Page 46
38 | SR5500 Operations Manual
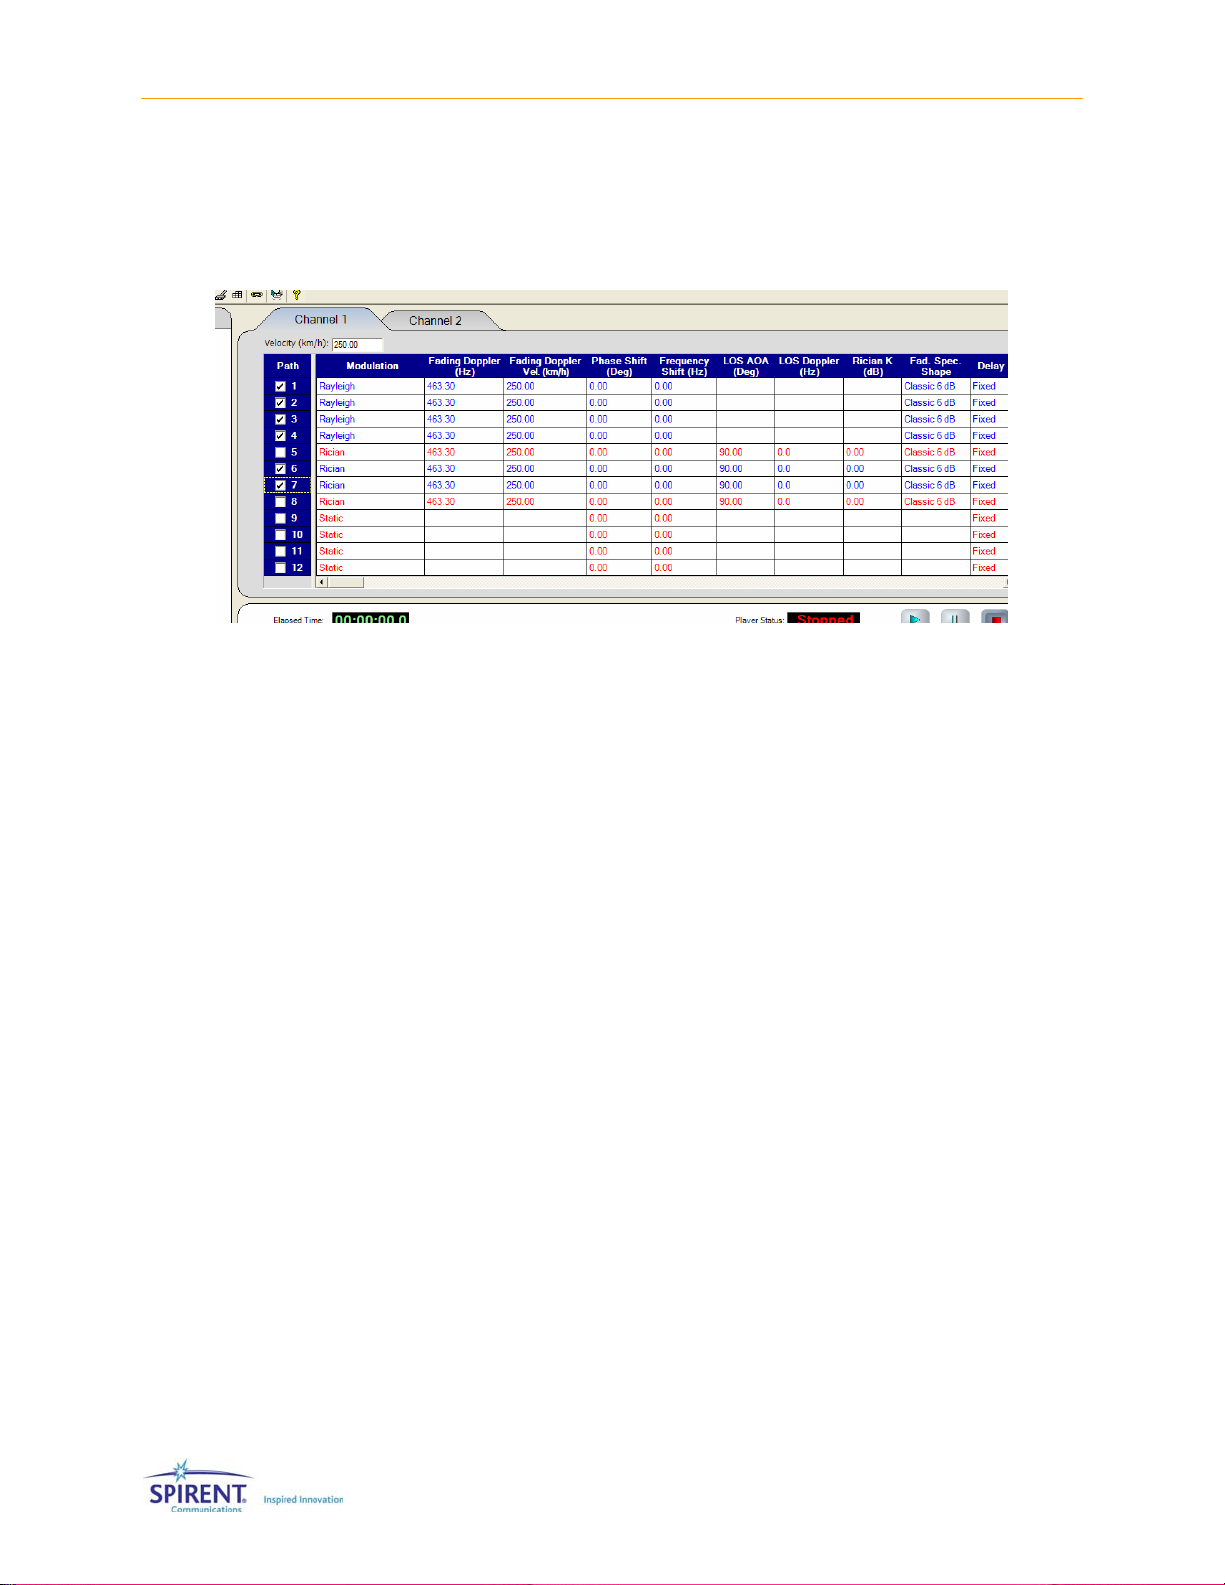
2.6.2. Path Parameters
To use the Channel Editor view to edit the Path Parameters, click the Channel Editor
button on the left to show the Path Parameters. SR5500 TestKit displays the Channel
Editor in the View Area as shown in Figure 2-31.
Figure 2-31: Path Parameters Window
The Technical Reference chapter on page 67 contains details on constructing a fading
profile.
2.6.2.1 Using the Grid
The grid displays the current path parameter settings and allows you to change the
current parameter settings. Each cell displays a unique parameter setting. Some
parameter settings have a list of valid values, while others allow a range of values.
To change a value in the grid:
1. Select the appropriate cell.
If the parameter has a list of values, a list box displays.
2. Click the list box to display the available choices. Click the desired value from the list
to complete the change.
3. If the parameter has a range of values, a textbox displays. Adjust the value in the
textbox to match the desired value. Press Enter when finished to complete the
change.
4. To set the same value in all enabled paths, select the column by clicking the column
name. Enter the desired value in any cell in the selected column.
SR5500 TestKit updates all the enabled paths to match the new setting.
2.6.2.2 Accessing Path Modulation Parameters
The SR5500 supports numerous path parameters to accommodate a wide variety of
testing demands. The grid can display all of these parameters. However, SR5500 TestKit
is initially configured to display only the most commonly used parameters.
Page 47
Chapter Three: Technical Reference | 39
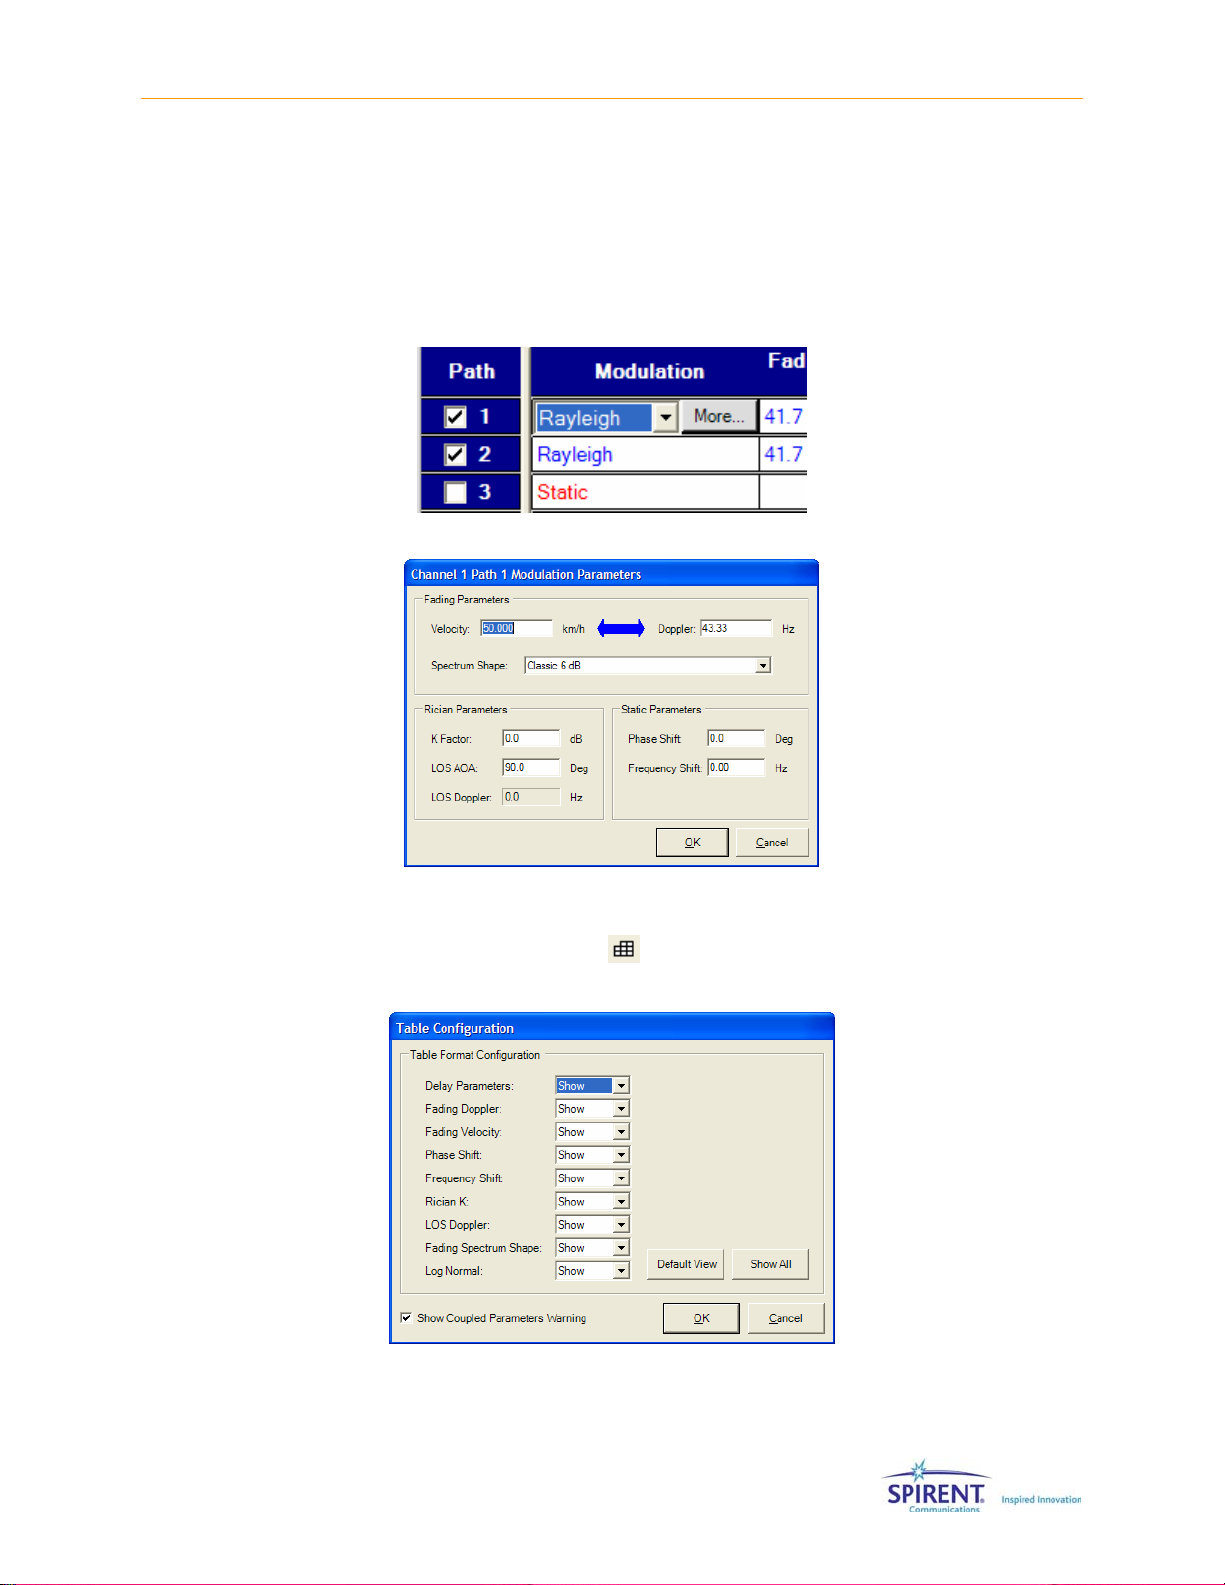
You can access the additional parameters two ways, by opening the Path Modulation
Parameters window, or by adding the parameters to the grid.
To display the Path Modulation Parameters window, place the mouse cursor anywhere in
the appropriate row in the Path Status column and click the More button that displays in
the row.
See Modulation later on page 40 for more details.
Figure 2-32: Modulation List
Figure 2-33: Path Modulation Parameters Window
To add all of the path parameter columns to the grid, select Menu>Configure>Table
Format, or click the Table Format icon
displays.
in the toolbar. The Table Configuration window
Figure 2-34: Table Format Configurat ion Window
Page 48

40 | SR5500 Operations Manual
This window allows you to select which columns display in the grid. Click the Show All
button to display all of the columns. Click the Default View button to show only the most
commonly used path parameters, including Path Status, Delay Mode, Delay Value, and
Relative Path Loss columns.
Select the columns to display in the grid. Click OK to save the changes and close the
window. Click Cancel to abandon the changes and close the window. The grid displays
the updated settings.
2.6.2.3 Modulation
Use Path Modulation to set the Fading Type, such as Rayleigh or Rician. To change the
Path Modulation, use the Path Modulation column in the grid shown in Figure 2-34.
NOTE: Setting all paths to "Off" will disable the output signal.
2.6.2.4 Velocity and Doppler
To set a unique velocity for each path, use the Fading Doppler Vel column in the grid, or
the Velocity textbox in the Path Modulation Parameters window.
To set a unique Doppler for each path, use the Fading Doppler column in the grid, or the
Doppler textbox in the Path Modulation Parameters window.
The path Doppler setting is related to the Path Velocity setting. If you set the path
Velocity, SR5500 TestKit calculates the path Doppler value and resets it appropriately. If
you set the path Doppler, SR5500 TestKit calculates the path Velocity and resets it
appropriately.
The Carrier Frequency, Doppler, and Velocity parameters are interdependent. When the
Carrier Frequency is changed, SR5500 TestKit calculates the Doppler to maintain the
currently set Velocity.
2.6.2.5 Spectrum Shape
The SR5500 allows you to select the Fading Spectrum Shape for each path with
independently set status. You can only set the Fading Spectrum Shape for paths that are
set to Rayleigh or Rician.
Use the column labeled Fad. Spec. Shape in the grid, or the Spectrum Shape list box in
the Path Modulation Parameters window.
2.6.2.6 Rician Parameters
The following path parameters apply when the Path Status is set to Rician. To adjust the
parameters in the grid or in the Path Modulation Parameters window, use the name
shown in parenthesis below:
• Line of Site Angle of Arrival (LOS AOA)
Page 49
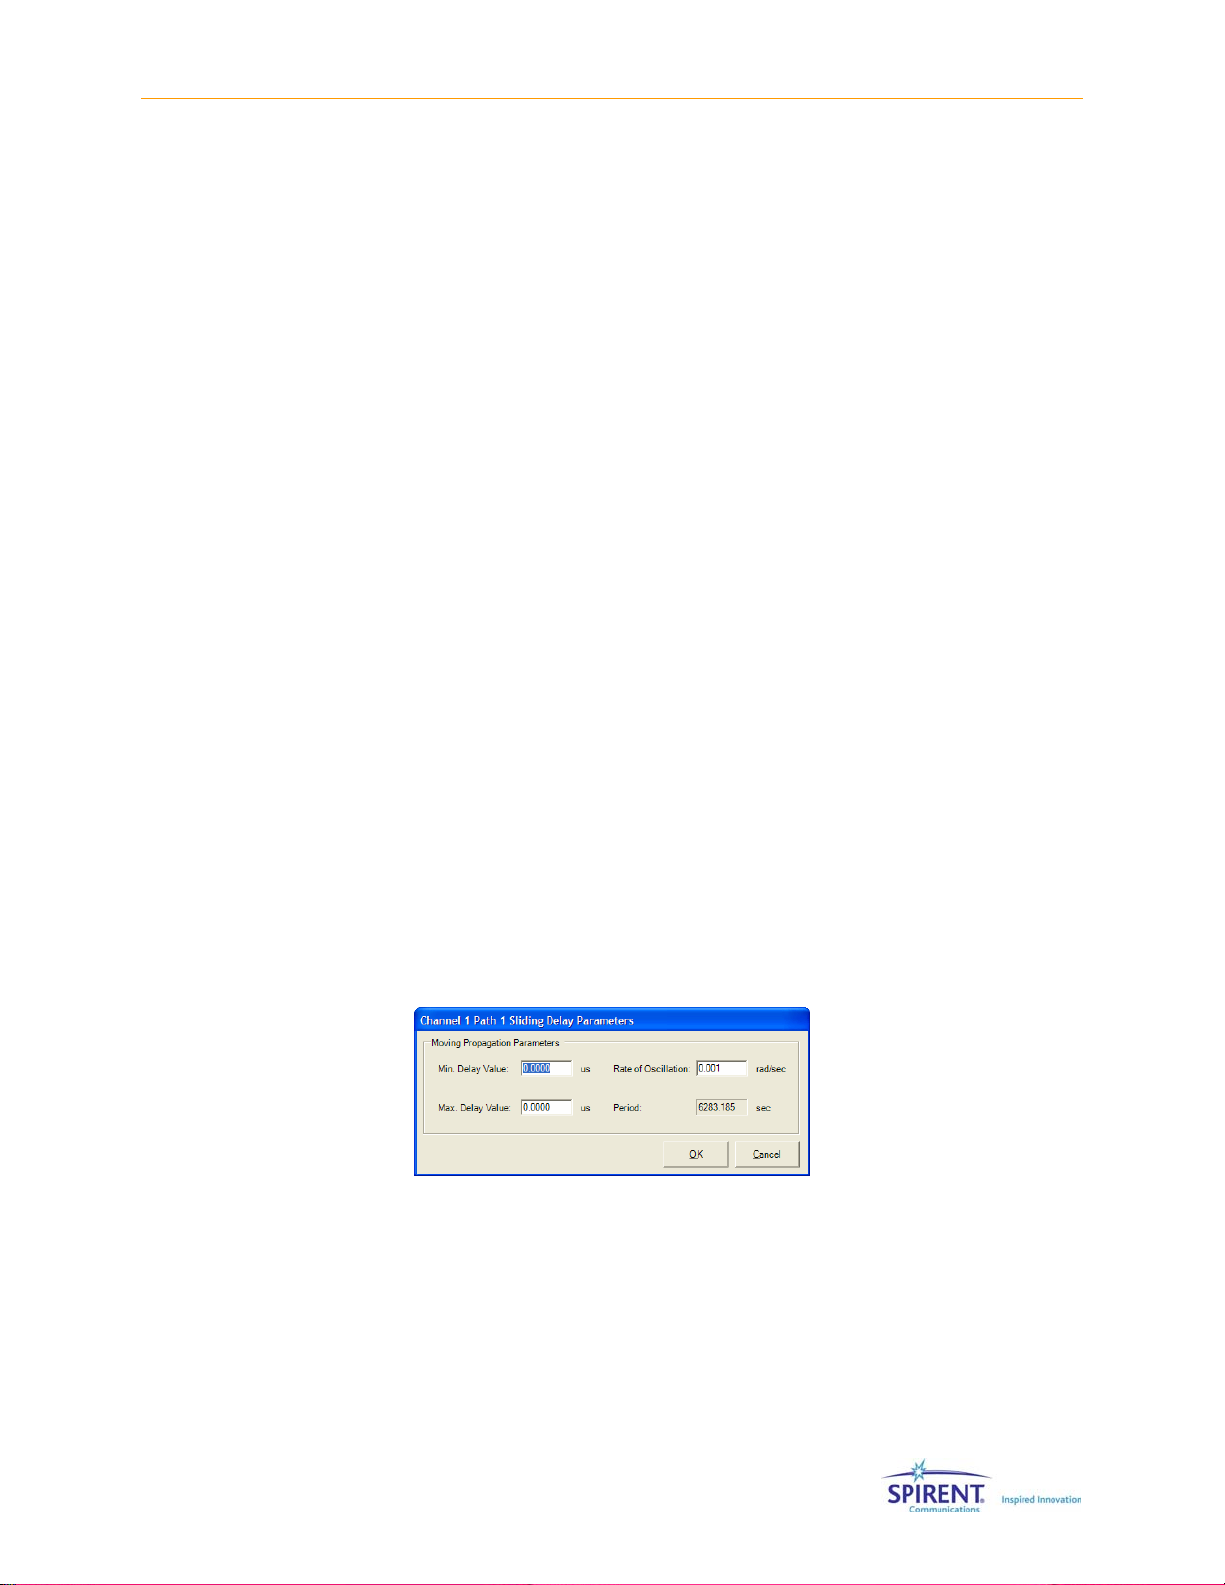
Chapter Three: Technical Reference | 41
• Line of Site Doppler (LOS Doppler)
• Rician K Factor (Rician K)
The LOS AOA and LOS Doppler are dependent. Setting one of these parameters causes
the other to be reset to the appropriate calculated value. The Carrier Frequency, LOS
AOA, and LOS Doppler parameters are interdependent. When the Carrier Frequency is
changed, SR5500 TestKit calculates the LOS Doppler to maintain the currently set LOS
AOA.
2.6.2.7 Modulator Parameters
Each path can have an independent Frequency Shift and Phase Shift value. To adjust the
frequency shift, use the Frequency Shift column in the grid, or the Frequency Shift
textbox in the Path Modulation Parameters window. To adjust the phase shift, use the
Phase Shift column in the grid, or the Phase Shift textbox in the Path Modulation
Parameters window.
2.6.2.8 Fixed Delay
To set a path for a Fixed Relative Delay, set the Delay mode to Fixed by selecting it from
the Delay Mode column. To set the amount of Fixed Relative Delay in microseconds
independently for each path, use the Delay Value column.
2.6.2.9 Sliding Delay
The SR5500 allows any number of paths to have Sliding Delay. Set the Delay Mode to
Sliding Delay, then set the remaining Sliding Delay parameters using the grid directly, or
the Sliding Delay Parameters window. To display the Sliding Delay Parameters window,
place the mouse cursor in the appropriate row of the Delay Value column and click the
More button. Make the desired changes to the Sliding Delay parameters and click the
Close button.
Figure 2-35: Sliding Delay Parameters Window
The Rate of Oscillation (Rate of Osc.) and Delay Period are dependent parameters.
Changing one causes the other to reset to the calculated value.
All the parameters presented in the Sliding Delay Parameters window also display in the
grid. Use the techniques described previously to edit these parameters in the grid.
Page 50

42 | SR5500 Operations Manual
2.6.2.10 Birth Death Delay
The SR5500 allows any number of paths to have Birth Death Delay. To setup a path for
Birth Death Delay, use the Delay Mode column and select Birth Death. Click the Birth
Death Settings button to display the Channel Birth Death Settings window.
Figure 2-36: Birth Death Settings Window
The Birth Death Wizard allows you to setup the Birth Death parameters. To use the Birth
Death Wizard, click the Birth Death Wizard button on the lower left of the Birth Death
Settings window. SR5500 TestKit displays the Birth Death Wizard window, as shown in
Figure 2-37.
Figure 2-37: Birth Death Settings Wizard
Set the number of delay bins; it should be greater than the number of paths that have
Birth Death delay. SR5500 TestKit indicates the paths that have Birth Death delay in the
read-only box labeled, Birth Death Enabled Paths. The maximum number of delay bins is
64. Set the Initial Delay and the Resolution, or the Increment Delay, and click OK.
SR5500 TestKit sets the Birth Death parameters to match your input. You can edit the
delay bin values directly. You can reset them all to zero with the Reset Bins button. You
can also edit the State Duration. To save your changes and close the window, click OK.
To abandon the changes and close the window, click the Cancel button.
2.6.2.11 Relative Path Loss
Each path can have its own relative fixed loss. To set the Relative Path Loss, use the
corresponding column.
Page 51
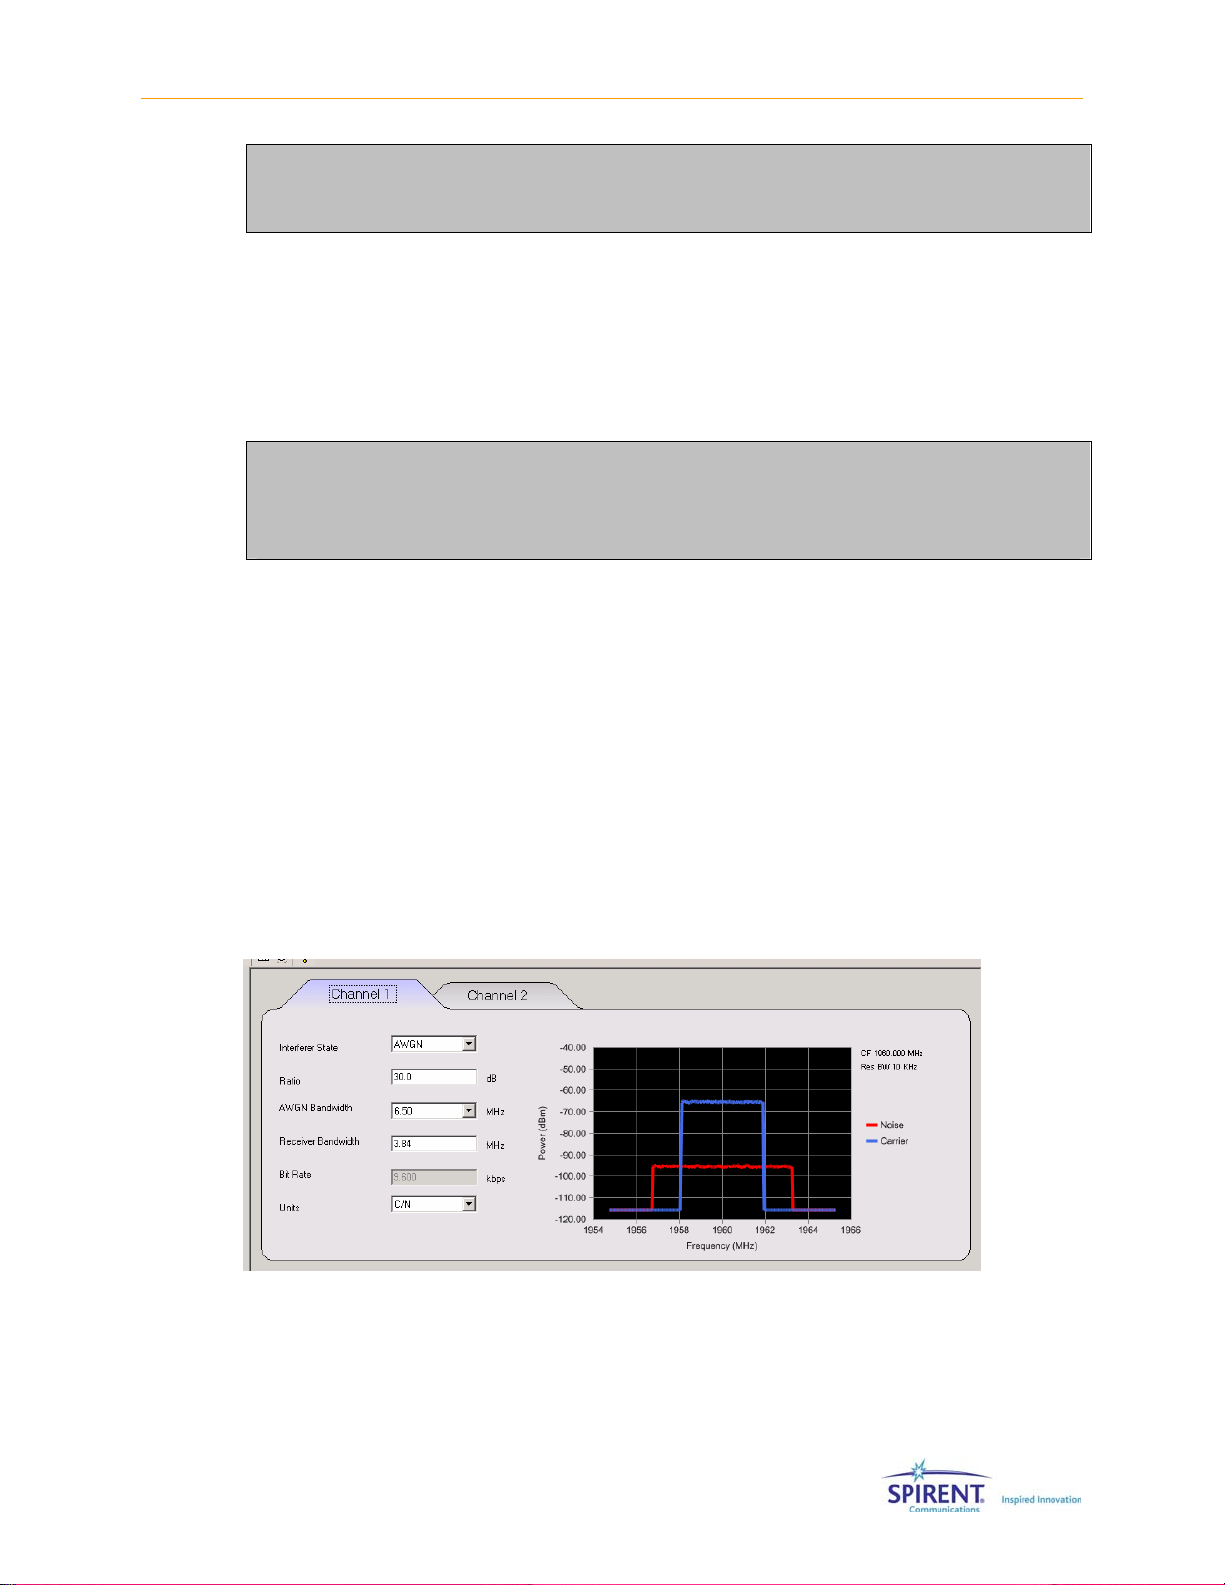
Chapter Three: Technical Reference | 43
NOTE: The SR5500 normalizes the power of each path to maintain a composite
channel power that equals the Set Output Level. The Path Loss value indicates
the path power relative to other paths in the Power Delay Profile.
If only one path is enabled, the Relative Path Loss setting is disabled.
2.6.2.12 Log-Normal Parameters
Each path can have Log-Normal fading enabled. You can also set the Rate and Standard
Deviation of Log-Normal.
NOTE: Enabling Log Normal on any path reduces the available output power
setting for the channel and degrades system noise and spurious performance.
This is due to the additional headroom requirements of Log-Normal. This is true
even if the path is not enabled.
2.6.3. Interference
The SR5500 is capable of accurately generating and summing Interference into each
channel independently. The Interference generated is AWGN at a configurable bandwidth
and relative level.
2.6.3.1 Accessing the Interference Editor
Access the Interference Editor view by clicking the Interference Editor button in the View
Shortcut window, or by selecting View>Interference Editor. The Interference Editor is
available for Channel 1 or Channel 2. Select the desired channel by clicking the
appropriate tab at the top of the View window.
Figure 2-38: Interference Editor
2.6.3.2 Enabling the Interference
To enable the Interference, select AWGN from the Interference State list box.
Page 52

44 | SR5500 Operations Manual
NOTE: The Channel Bypass feature overrides the Interference State selection. If
the Channel is bypassed, there will be no additive impairments present at the
output of the SR5500.
2.6.3.3 Setting the Interference Level
There are three ways to configure the relative level of the interferer to the carrier; C/N,
C/No, and Eb/No.
The Ratio parameter specifies the relative power of the interference to the power of the
carrier based on the selected units (C/N, C/No, or Eb/No).
Figure 2-39: Interference State Setting
Figure 2-40: Ratio Setting
The AWGN Bandwidth parameter specifies the spectral width of the AWGN interference
generated from a list box.
Figure 2-41: AGWN Bandwidth Setting
NOTE: The AWGN bandwidth most be greater or equal to the set Receiver
Bandwidth.
The Receiver Bandwidth parameter determines the bandwidth of AWGN interference
used when determining the impairment level.
Figure 2-42: Receiver Bandwidth Setting
The Bit Rate parameter used in conjunction with the aforementioned Interference level
parameters determine the relative level of interference to carrier when using Eb/No
units.
Figure 2-43: Bit Rate Setting
Page 53

Chapter Three: Technical Reference | 45
Refer to the Technical Reference section on page 67 for a detailed description of how to
set the Interference Relative Level for each of the three units.
NOTE: There are interdependencies between the output power available to the
carrier and the output power available to the interferer. Refer to the Technical
Reference on page 67 for a detailed description of these interdependencies.
2.6.3.4 Spectral Estimate Window
SR5500 TestKit provides a spectral estimate of the Interference and Carrier at the
output of the Impairment Channel. The estimate does not take spectral roll-off of the
Interference Generator or Carrier Fading into account.
Figure 2-44: Spectral Estimate Window
2.6.4. Instrument Setup View
The SR5500 Instrument Setup view is used to setup a number of system level
parameters. Rayleigh Fading correlation between channels can be set in this window.
Fading correlation is only valid if the path parameters for the different channels match.
For example, if the paths on Channel 1 are set to have a Doppler different from those on
Channel 2, the correlation is invalid. An indicator on the status bar informs you if this is
the case. When the Correlation Coefficient is set to System-based, correlation is
unavailable in this window. Refer to the Controlling Multiple SR5500s section on page
61 for details.
Page 54

46 | SR5500 Operations Manual
The system setup view provides other useful functions including a block diagram of the
current system setup useful in the RX and TX Diversity modes. It also allows you to enter
the relative power of the carriers and noise inputs in a number of different ways shown in
following list:
Figure 2-45: TestKit– System Setup View
Mode 1 – The native mode of the SR5500.
C(Output Power) – Total carrier power at the output of the SR5500. In the case of TX
Diversity mode, this is the sum of the power from Carrier 1 and Carrier 2.
C1/C2 – In RX Diversity mode, the ratio of the Carrier 1 power to Carrier 2 power.
C/N – The ratio of the total Carrier power to the Noise power.
Mode 2 – Allows quick translation of C/N ratios from specifications where the Noise
power is given, and the Carrier power is derived from a ratio.
N – Total noise power within the receiver bandwidth at the output of the SR5500.
C1/N – Ratio of Carrier 1 to the Noise power.
C2/N – Ratio of Carrier 2 to the Noise power.
Mode 3 – Allows you to set the absolute power of both the carriers and the noise.
N – Total Noise power within the Receiver Bandwidth at the output of the SR5500.
C1– Total power of Carrier 1 at the output of the SR5500.
C2– Total power of Carrier 1 at the output of the SR5500.
2.7. Dynamic Environment Emulation
This section details the parameters that control the Dynamic Environment Emulation
(DEE) function available through the TestKit/SR5500 GUI.
Page 55

Chapter Three: Technical Reference | 47
NOTE: Due to the high data rate requirements of DEE, it only functions if there is
a direct Ethernet connection between the controller PC and the SR5500, either
through a cross-over cable or using a hub. DEE may not function properly over a
network using a router.
The DEE feature allows you to change the state of the SR5500 dynamically at specified
time intervals. The following parameters can be changed:
• Channel Output Power
• Relative Path Loss
• Delay for a path
• Path Status (ON/OFF)
2.7.1. Method
To create a dynamic profile, you must define the Static State of the SR5500. Set up the
static (non DEE) state of the instrument using the TestKit GUI, as you would under normal
operation. This information combined with State 1 of the State Emulation file describes
the state of the SR5500 in “State 1” of DEE. When the path is initially set to Off, you can
modify the path parameters. This is allowed so if the path gets turned on dynamically in
DEE, the settings for the path are fully defined.
NOTE: While DEE is running, non-DEE parameters can
not
be changed.
Figure 2-46: TestKit – DEE Parameters
All parameters set up statically in the GUI remain static unless the particular parameter is
changed in DEE. Only certain parameters are capable of being changed in DEE.
Parameters not controllable in DEE and enabled in the Static Field, such as Modulation,
remain enabled during a DEE simulation. The state of the Modulation parameter can not
be changed dynamically and retains its static state.
SPECIAL CASE: Delay Mode – If the delay mode for a particular path is set to
“Birth/Death or Sliding-Delay”, the delay for that path can not be changed in
DEE. Sliding Delay and Birth/Death operates as set in Static mode while DEE is
running.
Page 56

48 | SR5500 Operations Manual
After defining the Static State of the SR5500:
1. Define the State Changes in the Emulation file (Refer to page 49 for details).
Set up the desired Dynamic Changes using the file “dee_template.xls”. This is an
Microsoft Excel file used to create the DEE Emulation File. The DEE view provides a
shortcut for opening this file.
NOTE: This file needs only to define changes from the static state of the unit. If
information in the template is left blank, it is assumed that no change is
desired.
2. Export the State Changes to an STB file using the Export function in the template.
The STB file is a text based file which the GUI can read. This file describes all of the
state changes to the GUI.
3. Using the DEE view (Refer to page 52) in the main GUI:
a. Load the Emulation (STB) file.
b. Enable DEE.
c. Play the Emulation file.
2.7.2. Emulation File Creation (DEE Template)
The DEE Template defines the changes to the state of the SR5500. To use the template,
macros must be enabled in Microsoft Excel.
NOTE: Previous versions of TestKit used a file format called SSX. This was a
proprietary XML based format. This format was discontinued with the 2.10
release of TestKit due to inefficient, large file sizes. TestKit still accepts
previously created SSX files, but the DEE template no longer creates them. A
new text-based format known as an STB file has replaced the SSX file.
2.7.2.1 Accessing the DEE Template
The Emulation File Template is found in the root directory of the TestKit Installation. This
is usually “C:\Program Files\Spirent Communications\SR5500 TestKit\”. You can also
access it by clicking the New Emulation File button in the DEE view.
Page 57
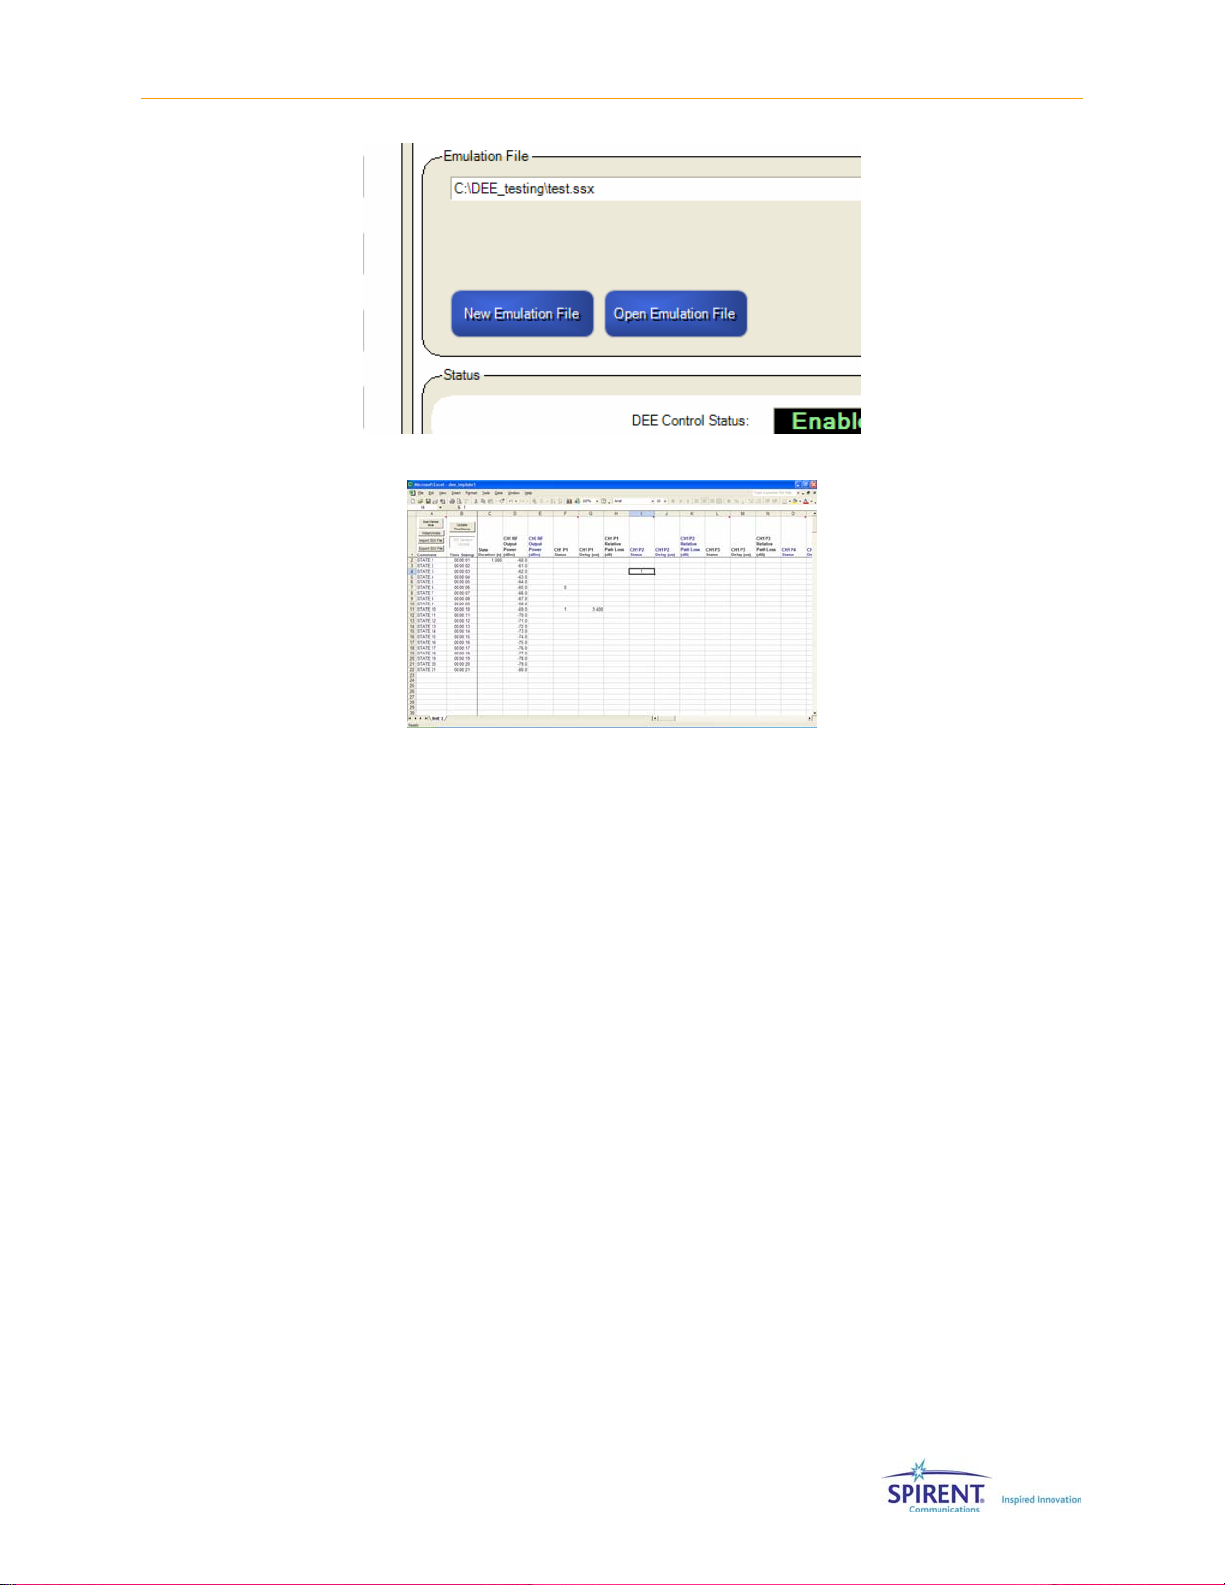
Chapter Three: Technical Reference | 49
Figure 2-47: Entering Emulation File Name
Figure 2-48: DEE Template
2.7.2.2 Editing the Emulation File
The emulation file can be modified using standard Excel methods. A typical Emulation file
is shown in Figure 2-48. This file performs the following functions:
In State 1:
1. Set State Duration to 1 second (each state duration thereafter remains 1 second
unless the particular state is changed.
2. Set the output power of the SR5500 to -60.00.
3. All other parameters remain as defined in Static mode.
In State 2:
1. Modify the output power of the SR5500.
In State 3:
1. Modify the output power of the SR5500.
2. Turn Channel 1 Path 2 ON ( 1 – ON, 0 – OFF).
In States 4–5:
1. Modify the output power of the SR5500.
In State 6
1. Modify the output power of the SR5500.
Page 58

50 | SR5500 Operations Manual
2. Turn Path 1 OFF. (This path was originally turned on in the Channel Editor table
(Static mode).
In States 7-9
1. Modify the output power of the SR5500.
2. Path 1 remains OFF.
In State 10
1. Modify the output power of the SR5500.
2. Turn Channel 1, Path 1 ON.
3. Change the delay of Channel 1, Path 1 to 3.4 us.
In States 11-21
1. Modify the output power of the SR5500.
As can be seen from the example in Figure 2-49, only changes to the current state are
required. If desired, you can enter data when the information has not changed, but it is
not necessary.
Figure 2-49: DEE Template – Example Changes
NOTE: When exporting a file, if a row is encountered without any data, it is
treated as the end of the file. If you want to have a number of states where
nothing changes, we suggest you fill in the state duration column for all of
these states. The data does not need to change, but it does need to exist.
The following Figures illustrate this concept.
Page 59

Figure 2-50: Example of a Column Having Two States
Figure 2-51: Example of Column Having Six States
2.7.2.3 Setting the Channel Mode
Chapter Three: Technical Reference | 51
You can set up the DEE template for DUAL or SINGLE Channel Mode. In DUAL mode, the
template displays information for Channel 1, Paths 1-12 AND Channel 2, Paths 1-12. In
SINGLE Mode, the template displays information for Channel 1, Paths 1-24.
2.7.2.4 Modifying the Template View (Hide/Unhide)
The DEE template provides some shortcuts for selectively displaying information
associated with a particular Channel or Path. Use the Hide/Unhide button to hide or
show particular columns, limiting the information displayed to what you want to modify.
Figure 2-52: View Selection Form Window
2.7.2.5 Updating the Timestamps
The Update Timestamp button updates the Timestamp Column. This column is useful
when determining how much time it takes to reach state X, especially when the state
duration of individual states vary.
Page 60
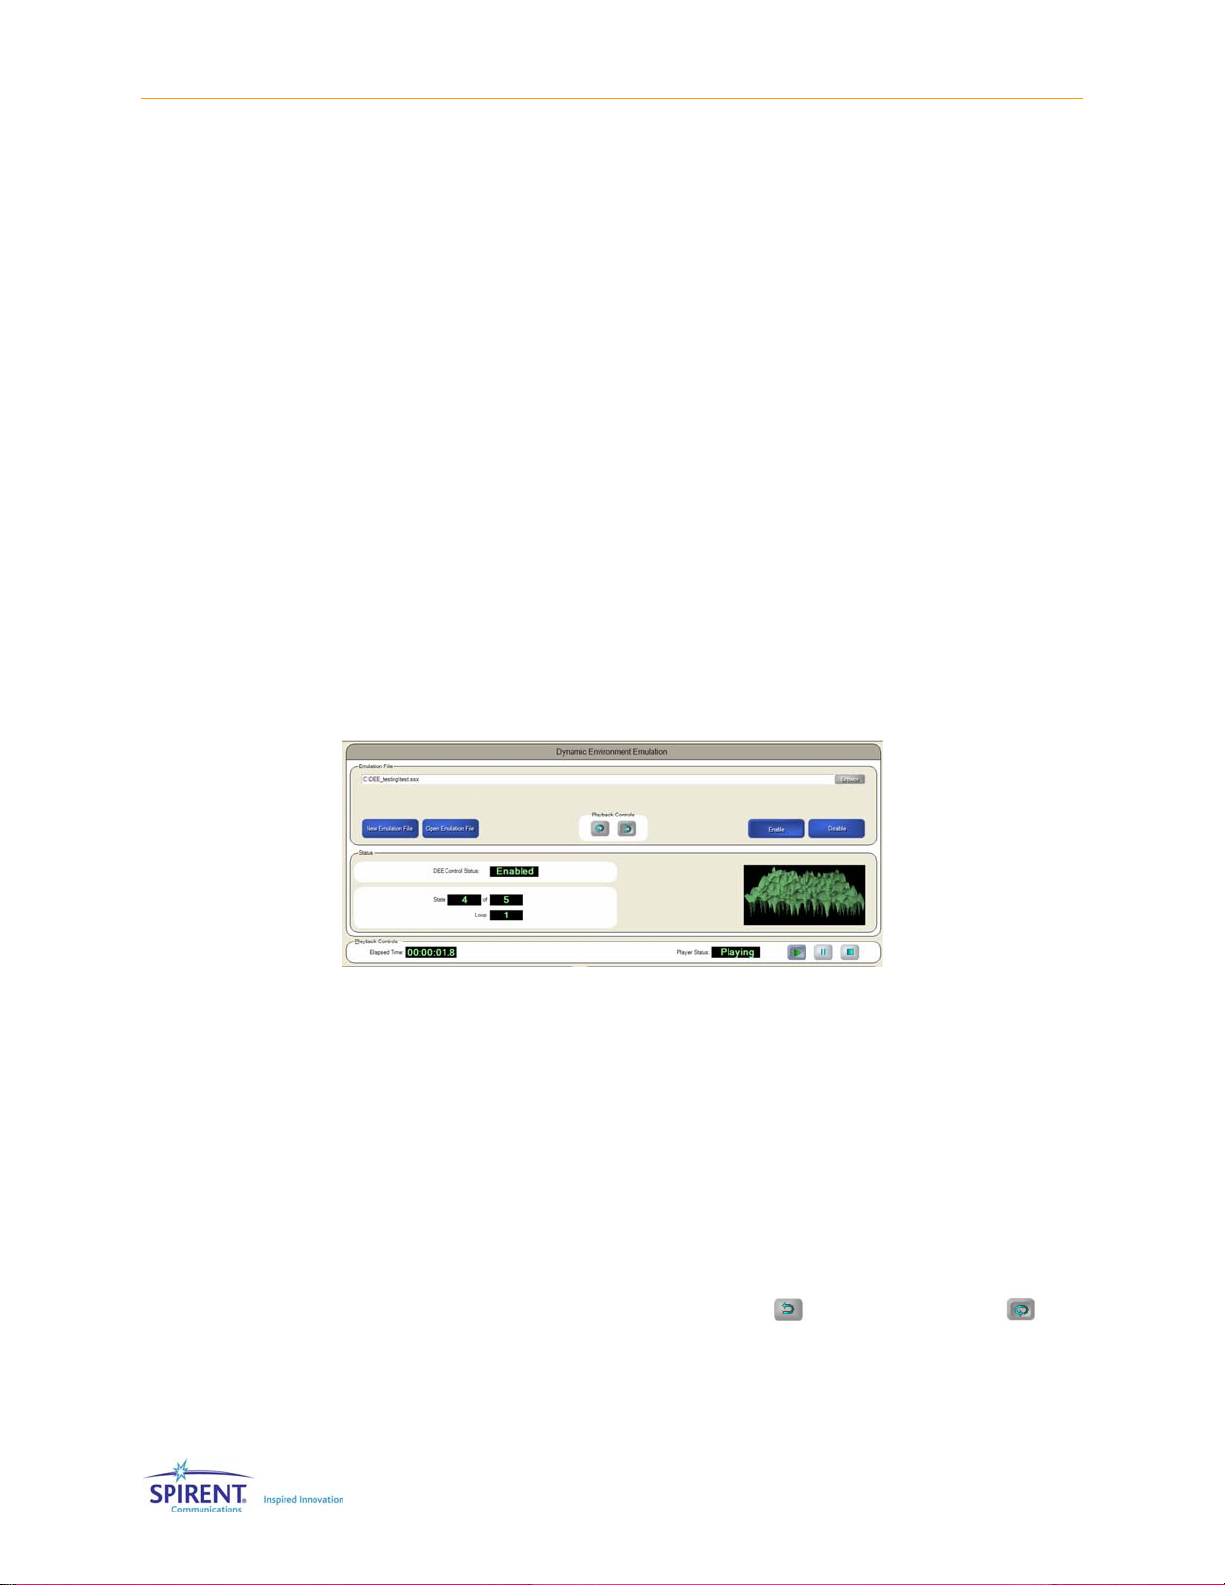
52 | SR5500 Operations Manual
2.7.2.6 Exporting Files to STB Format
To use the information from the Excel template in DEE, you must export the information
to STB format. This is a text based format the TestKit GUI uses to import the state change
information.
2.7.2.7 Importing Files from STB or SSX Format
You can import previously exported STB files and SSX files created with earlier versions
of the DEE template using this function.
2.7.3. Dynamic Environment Emulation (DEE) View
The SR5500 is capable of dynamically changing the current state of a number of Path
and Channel parameters. These changes can be setup in a table using Microsoft Excel.
2.7.3.1 Accessing the DEE View
Access the DEE view by clicking the DEE button in the View Shortcut window, or by
selecting View>DEE View.
Figure 2-53: Dynamic Environment Emulation (DEE) View
2.7.3.2 Selecting an Emulation File
Select the Emulation file by clicking the Browse button. If you are controlling multiple
SR5500s, you must select a separate file for each unit. The number of States and the
State Durations of the files must match. Refer to Section 2.7.2 on page 48 for further
details.
2.7.3.3 Configuring Playback Controls
Configure the type of playback by clicking the Play Once or Play Continuously
button. If you select Play Once, the Emulation file plays to the end, resets, and remains
stopped at the beginning of State 1. If you select Play Continuously, the Emulation file
continues to loop indefinitely.
Page 61
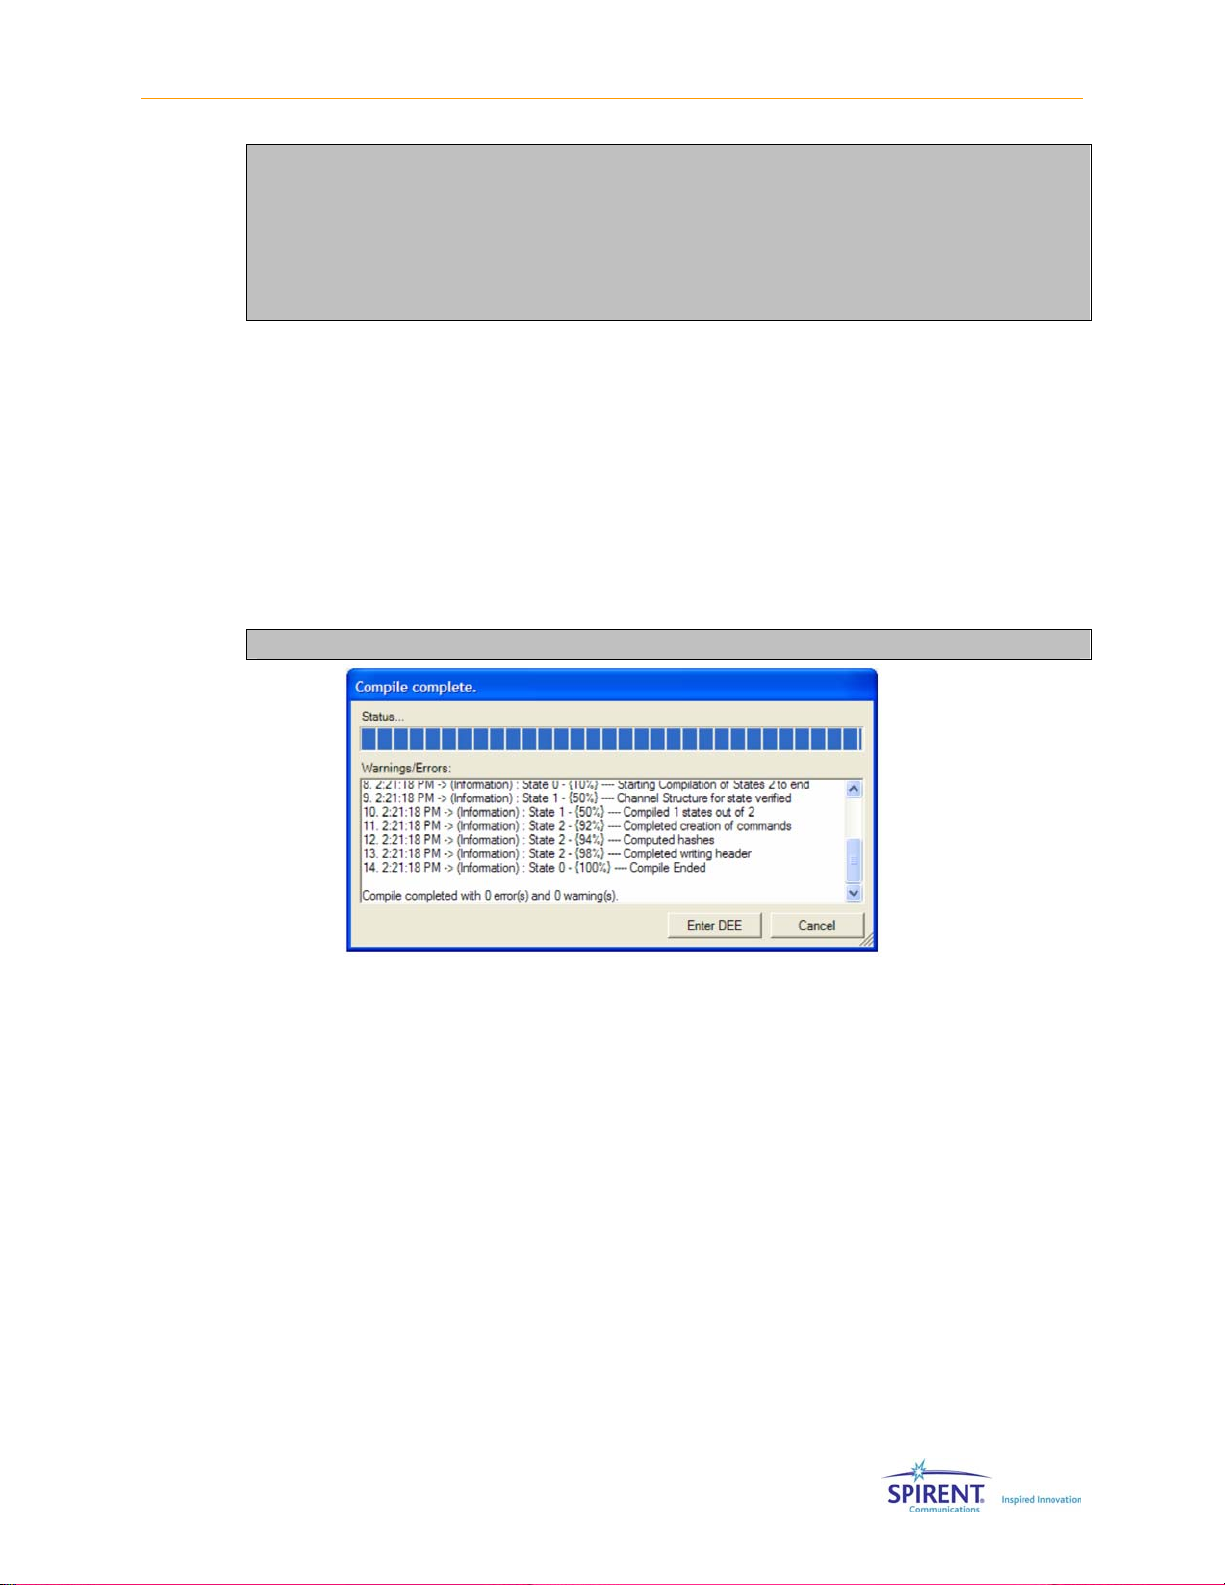
Chapter Three: Technical Reference | 53
NOTE: When the file loops back to State 1, the state of the instrument will be
the same as it was the first time in State 1, with the exception that the random
number generator creating Rayleigh fading will not reset.
This means that statistically, State 1 will be the same each time DEE loops, but
the instantaneous phase and amplitude distortion will differ. This is done to
avoid any glitches when wrapping from the last state to the first.
2.7.3.4 Enabling DEE
DEE Mode can be enabled by clicking on the Enable button. When DEE is enabled, the
following sequence of events occur:
1. All other views are locked out and you cannot leave the DEE view without first
disabling DEE.
2. The software compiles the Emulation file into a machine-readable format. A window
opens displaying the status of the DEE compile. If the compile is successful, click the
Enter DEE button.
NOTE: If you have previously successfully compiled the file, this step is skipped.
Figure 2-54: Compile Status Window
2.7.3.5 Disabling DEE
Disable DEE by clicking the Disable button. This stops the DEE engine, restores the
instrument to its original state before entering DEE and re-enables access to all TestKit
views.
2.7.3.6 Playing (Running) DEE
After enabling DEE, the player stops at Time 0 of State 1. The instantaneous PDP at this
time can be random, but is always repeatable. For instance, if one of the paths is set to
Rayleigh, it is possible that Time 0 of State 0 will be a deep fade. One method of setting
up DEE is to make State 1 have one path on with static modulation. A call could then be
set up in this mode before fading starts in State 2.
Page 62

54 | SR5500 Operations Manual
When you click the Play button , the fading engine begins, and the DEE engine begins
cycling through user states.
2.7.3.7 DEE Status Information
The following Information is provided from the DEE engine:
Current State – This is the current state of the DEE engine.
Current Loop – In Play Continuously mode, this indicates how many times the states have
been looped.
Total Time – Indicates the total time that DEE has been playing.
Player Status – Indicates the state of the Player – Playing/Stopped/Paused.
DEE Animation – A simple animation providing a visual cue that DEE is running. The state
of the animation has no effect on the actual PDP of the current state.
Measured Input Level – Shows the constantly measured and displayed input level.
Calculated Output Level – The average output power is calculated and displayed based
on the measured input level. The output level measurement assumes a valid path set-up.
In an extreme example with all paths turned off, the output power displayed will be
incorrect.
Set Output Level – Displays the set output level for the current state.
2.7.4. Using DEE with Multiple SR5500s
TestKit is capable of dynamically changing the current state of Path and Channel
parameters simultaneously on up to four SR5500 units. Refer to Section 2.13 on page
61 for more information on multi-unit control.
To run DEE simultaneously on up to four systems, create an STB file for each unit using
the Excel template and select the files in the main DEE view.
The STB files for all of the units must have the same number of states. The State
Duration is determined from the State Duration information in the STB file for Unit 1.
State duration information provided in other STB files is ignored.
2.8. Power Meter Parameters
The SR5500 contains a Power Meter used to measure the signal levels coming into the
unit. The default Power Meter parameter settings are appropriate for most applications.
Page 63
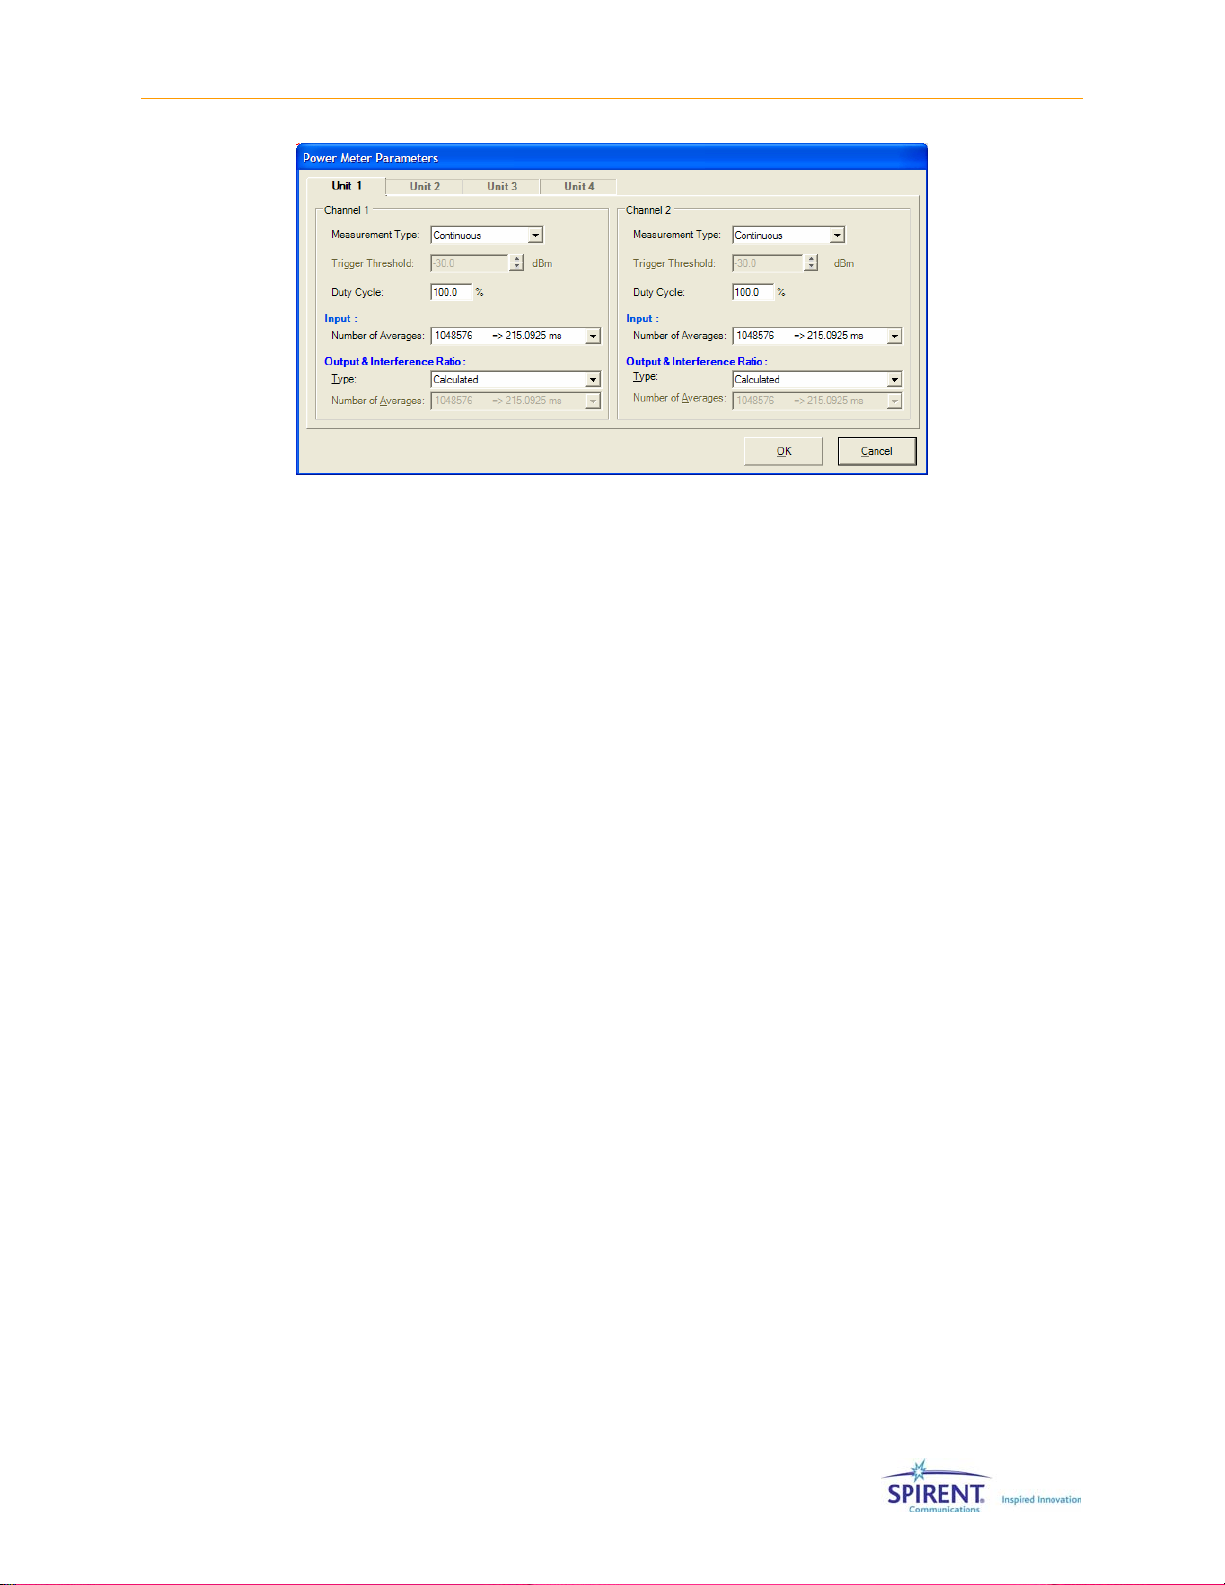
Chapter Three: Technical Reference | 55
Figure 2-55: Power Meter Parameters Window
You can configure the Power Meter in Continuous or Triggered mode. If you know the
duty cycle of the signal, enter the value and the Power Meter makes the appropriate
offset for both the input and output measurements. For example, if the input signal is a
half rate signal (on only half the time), you can set the duty cycle parameter to 50%. This
setting only impacts the measurement in Continuous mode.
In Continuous mode, the Power Meter constantly triggers and measures the signal.
In Triggered Mode, the Power Meter measures the signal when the input power is
detected over the Trigger Threshold. When the Power Meter set to Continuous, you have
the choice of setting the output Power Meter type to Calculated or Measured. In the
Triggered mode, only the Calculated mode is available.
When the output power measurement type is set to Calculated, the output power is
determined based on the measured input level. The channel is assumed to have a
constant fixed loss. This is true in most cases. If a model is setup with paths that are 180
degrees out of phase, this assumption may be incorrect.
When the output measurement type is set to Measured, the output is measured after
fading.
The Power Meter Configuration window allows you to select the number of averages used
to determine a power measurement. In Continuous mode, the Power Meter measures
over the configured time period and reports the average measurement. In Triggered
mode, the Power Meter records instantaneous RMS power measurements when the
Trigger threshold is satisfied. The data is recorded and averaged when the total
averaging time is reached. Refer to the Technical Reference chapter on page 67 for
details on the relationship between Trigger Level, Averaging Time and the function of the
triggered Power Meter.
2.9. Using the SR5500 with 6 GHz/6GHz-EX Option
The SR5500 6 GHz(-EX) RF Converter can increase the frequency range of the SR5500.
The SR5500 6 GHz option supports the Upper Band (4100 to 6000 MHz). The SR5500 6
GHz-EX option supports both the Upper and Middle(3300 to 3850 MHz).
Page 64

56 | SR5500 Operations Manual
2.9.1. Configuring TestKit for the 6 GHz(-EX) Option
The SR5500 controls the SR5500 6 GHz(-EX) RF Converter. It automatically detects the
presence of the Converter when properly connected. This information is sent to TestKit
when it connects to the SR5500. TestKit automatically makes the appropriate
adjustments after detecting the 6 GHz(-EX) RF Converter.
2.9.2. Selecting Lower/Middle/Upper Band
To access the additional frequency band available by the SR5500 6 GHz(-EX) RF
Converter, select Lower, Middle, or Upper Band by selecting Configuration>System or by
clicking the System/Communication Setup icon
Communication Setup window. A sample System/Communication Setup window is
shown in Figure 2-56.
from the toolbar to open the System/
Figure 2-56: System Configuration Window – Selecting the Band
You can change the RF Frequency Mode from Lower to Upper Band, and vice versa. refer
to the Technical Specifications chapter on page 67 for details. Certain parameters reset
when the RF Frequency Mode changes. Refer to Section 2.9.3. below for more details.
NOTE: The Middle Band is only available with the SR5500 6 GHz-EX option.
2.9.3. Parameter Dependencies
When the RF Frequency Mode is set to Upper Band, the SR5500 limits the range of the
parameters listed below:
• Carrier Frequency
• Technology
Page 65

Chapter Three: Technical Reference | 57
• Unit Under Test
• Band
• Channel
• Output Level
• Input Level
NOTE: We recommend you make any necessary adjustments to the above
parameter settings after changing the RF Frequency Mode parameter.
2.10. Downloading Firmware to the SR5500
NOTE: Having an Internet Firewall that prevents FTP access into the Host
computer will cause the Firmware upgrade to fail. When SP2 of Windows XP is
installed, a Firewall is automatically put in place. This firewall must be disabled
before beginning the Firmware upgrade process.
The SR5500 comes with the required Firmware already installed. It may be necessary to
download Firmware updates made available from Spirent Communications. This section
details the steps to update the Firmware when necessary.
NOTE: The firmware upgrade procedure should only be performed when there is
a direct Ethernet connection between the controller PC and the SR5500, either
through a cross-over cable or using a hub. The firmware upgrade may not
function properly over a network using a router.
2.10.1. Starting the Download
Successful installation of a new version of SR5500 TestKit automatically installs updated
Firmware files in the download directory on the Controller PC. Once the files are properly
located on the controller PC, run TestKit and connect to the SR5500. To start the
download in SR5500 TestKit, select Help>Firmware Upgrade. TestKit must communicate
with the SR5500 to detect the current Firmware version. The Firmware Upgrade window
displays.
Page 66

58 | SR5500 Operations Manual
Confirm the correct Firmware version to download. If connected to multiple units, select
the unit to upgrade. You should also verify that the IP address displayed matches the port
connected to the SR5500. Click the Upgrade Now button to start the Firmware download.
2.10.2. During the Download
Figure 2-57: Firmware Upgrade Window
During the Firmware download process, SR5500 TestKit instructs the SR5500 to retrieve
certain files from the Controller PC via TCP over the Ethernet interface. Each file is a part
of the Firmware in the SR5500 and is thoroughly checked to ensure proper transfer to
the SR5500.
The SR5500 resets when the file transfers are complete, and TestKit reconnects to the
unit.
2.10.3. Recovery in Case of Failure
Depending on the failure condition, it may be possible to recover by reattempting the
firmware download procedure. If the reattempt fails, or is not possible, it is likely the unit
requires service. Contact Spirent Communications customer care for more assistance.
2.11. Changing the Remote Connection
The connection between the controller PC and the SR5500 is a standard Ethernet
connection. SR5500 TestKit and the SR5500 use standard TCP/IP to communicate over
the Ethernet connection. Both the SR5500 and the controller PC are configured for
proper communication. It is unlikely you will need to make any adjustment to this
configuration.
In case you do need to change the Remote Connection configuration, use the
instrructions provided here to assist you. It is important that the SR5500 IP Address and
the IP Address in TestKit match to ensure proper communication.
Page 67

Chapter Three: Technical Reference | 59
2.11.1. Changing the SR5500 IP Address Configuration
The address of the SR5500 Ethernet connection is a standard IP Address.
To modify the IP Address of the Ethernet connection:
1. Use the supplied RJ-45 Type connector to DB-9 Type connector serial cable.
The serial cable connects the controller PC serial interface to the SR5500 serial
interface labeled, “SERIAL”.
2. Run SR5500 TestKit, but do not connect to the remote unit.
3. Select Configuration>System/Communications Setup,
The Communication Configuration window displays.
Figure 2-58: System Configuration Window – Changing IP Address
4. Click the IP Configuration button.
SR5500 TestKit uses the COM port to communicate with the SR5500 and retrieve
the current IP Address information.
5. If TestKit is controlling multiple SR5500s, connect the serial cable to each of them in
series.
The IP configuration is only for the system currently connected to the serial cable. If
TestKit can not communicate with the SR5500, it will display the appropriate error.
6. After collecting the IP Address information from the SR5500, SR5500 TestKit
displays the current IP Address information. Adjust the IP Address information to the
desired value.
7. Click OK.
Your changes are updated in the SR5500 unit. After SR5500 TestKit has updated
the IP Address in the unit, it automatically updates the IP Address it uses to
communicate with the SR5500.
It is not necessary to change the IP Address in SR5500 TestKit to match the updated
SR5500 IP Address.
Page 68

60 | SR5500 Operations Manual
2.11.2. Changing the IP Address in SR5500 TestKit
If you are changing the IP Address in SR5500 TestKit to match the IP Address of the
SR5500, be sure you know all the IP Address of the unit first. SR5500 TestKit must be in
Local Mode to adjust the IP Address parameter.
To change the IP Address SR5500 TestKit:
1. Select Configuration>Communication.
The Communication Configuration window displays.
2. Edit the IP Address listed in the Ethernet Settings.
3. Click OK to save the changes and close the window. Click Cancel to abandon the
changes and close the window.
2.12. Updating the SR5500 Options
The SR5500 permits the field addition of software options via an encoded password file.
Upon purchase of a soft option, a password file is provided which enables the purchased
feature.
To enable the purchased feature, follow the instructions included with the password
package provided by Spirent. Note that these instructions require that you perform the
operation with TestKit connected to the SR5500.
To verify the SR5500 options and ASA expiration date, view the Hardware Options by
selecting Help>Hardware Information.
Figure 2-59: Instrument Options Window
NOTE: SR5500 instruments purchased before version 1.20 may not have an ASA
Expiration date embedded in them. Please contact customer service if this is the
case.
NOTE: If an Annual Support Agreement (ASA) was not purchased, the ASA
expiration date will match the ASA expiration date of the current software
release at the time of purchase.
FW Version Shipped ASA Expiration Date
Page 69

2.2x December 2006
2.11 (Critical Bug Fix) August 2005
2.10 APRIL 2006
2.0x AUGUST 2005
1.3x SEPTEMBER 2004
1.2x or lower NONE
2.13. Controlling Multiple SR5500s
The TestKit GUI can control up to four SR5500s simultaneously in a synchronized fashion
which allows all of the fading paths to remain uncorrelated. In order to take advantage of
this option, the SR5500’s must be connected using the provided digital synchronization
cables. Additionally, all of the 10 MHz references must be locked using BNC cables.
2.13.1. Connecting Synchronization Cables
Chapter Three: Technical Reference | 61
Before using TestKit to control multiple SR5500s, the units must be connected with
synchronization cables. These cables ensure that fading between channels in different
systems remains uncorrelated, and also that when using DEE that the units change
states at the same time.
The following table shows the required connections.
UNIT # PORT UNIT # PORT TYPE
1 10 MHz OUT -> 2 10 MHz IN BNC
2 10 MHz OUT -> 3 10 MHz IN BNC
3 10 MHz OUT -> 4 10 MHz IN BNC
1 SYNC OUT -> 2 SYNC IN MDR Digital Cable
2 SYNC OUT -> 3 SYNC IN MDR Digital Cable
3 SYNC OUT -> 4 SYNC IN MDR Digital Cable
Page 70
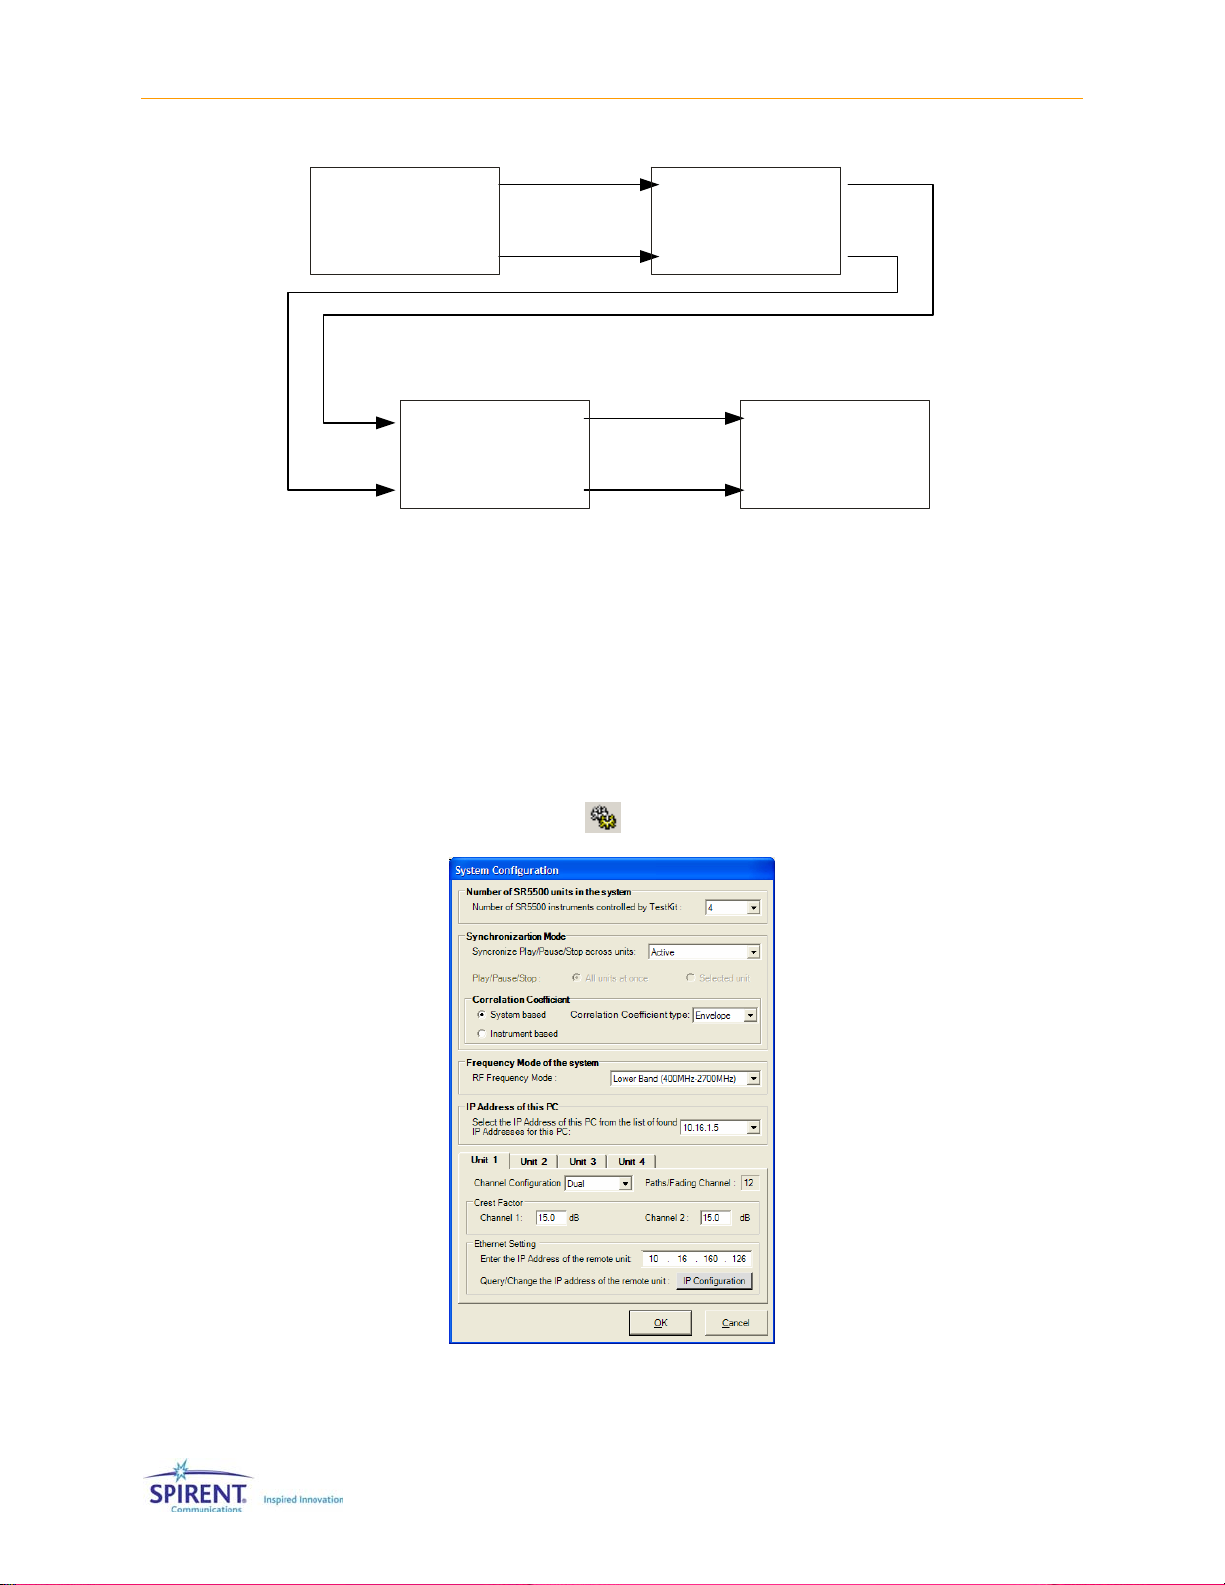
62 | SR5500 Operations Manual
10M
REF
IN
SYNC
IN
SR5500
UNIT 1
10M
REF
OUT
SYNC
OUT
DIGITAL
MDR
10M
REF
IN
SYNC
IN
SR5500
UNIT 2
10M
REF
OUT
SYNC
OUT
BNC
BNC
10M
REF
SR5500
IN
UNIT 3
SYNC
IN
Figure 2-60: SR5500 Multi Unit Synchronization
When controlling less than four units, omit the cables to the systems not being
controlled. The 10 MHz IN port of system 1 can be driven from an external source if
desired.
10M
REF
OUT
SYNC
OUT
DIGITAL
MDR
10M
REF
IN
SYNC
IN
SR5500
UNIT 4
10M
REF
OUT
SYNC
OUT
2.13.2. Configuring TestKit to Control Multiple Units
Select the number of SR5500 units to control in the System Configuration window. To
access this window, select Configuration>System/Communication Setup, or click the
System/Communication Setup icon
from the toolbar
Figure 2-61: System Configuration Window – Controlling Multiple Units
Page 71

Chapter Three: Technical Reference | 63
The Channel Configuration, Crest Factor, and IP address can be set independently for
each unit. Each unit must have a unique IP address.
The player Synchronization Mode can be set to Active or Inactive. For DEE and correlation
to function in a multi-unit setup, you must set the Synchronization Mode to Active. The
synchronization status is displayed with the unit selection.
Figure 2-62: Synchronization Status Bar
The Correlation Coefficient can be set to Instrument-based or System-based. Instrumentbased correlation allows you to set the Rayleigh correlation between the two channels
within a particular unit. System-based correlation allows the correlation to be set
between channels in different units.
2.13.3. Switching Between Units.
When TestKit is configured to control multiple units, the unit selection tool displays in the
toolbar as shown in Figure 2-63.
Figure 2-63: Unit Selection Tool
To modify or view parameters for a particular unit, click the appropriate unit number in
this toolbar. All of the information in the different views applies to the selected unit.
2.13.4. Player Functionality.
When TestKit is configured to control multiple units, you can set the player to control all
units simultaneously, or control the units in a completely independent manner. If the
Synchronization Mode is set to Active, when the player is paused or stopped, all units
pause or stop. This functionality allows you to set Rayleigh fading correlation between
channels in different systems. If the Synchronization Mode is set to Inactive, changes to
parameters in one unit do not impact other units.
2.13.5. Correlation Coefficient Type.
The Correlation Coefficient Type can be set to Envelope, Component, or Complex. You
can only select Complex if the Complex Correlation Option is present in every SR5500 in
the Multi-unit System.
Page 72

64 | SR5500 Operations Manual
When the Correlation Coefficient Type is Envelope, the correlation is between the
magnitude of the Rayleigh faded channels. Envelope correlation is defined as the
correlation between the magnitude of the Rayleigh fading channels.
When the Correlation Coefficient Type is Component, the correlation is between the Inphase (I) components and Quadrature (Q) components of the Rayleigh faded channels.
Component correlation is defined as the correlation between the I components and Q
components of the Rayleigh fading signals.
When the Correlation Coefficient Type is Complex, the correlation between the Rayleigh
faded channels is a complex number Complex correlation is defined as the correlation in
a complex sense (imaginary and real values) of the Rayleigh fading signals.
2.13.6. System-Based Correlation.
The correlation of Rayleigh fading between units can be set by selecting
Configuration>Correlation Coefficient Between Units or clicking the Correlation
Coefficient between Units icon
in the toolbar.
Figure 2-64: TestKit Configuration Menu
If you select Envelope or Component as the Correlation Coefficient Type, the Correlation
Coefficients window displays, as shown in Figure 2-65. In this window, you can set the
Channel to Channel Correlation. The available range for the current coefficient entered
displays at the bottom left of the window.
Figure 2-65: Correlation Coefficient Window
Initially, this window shows all channels as Uncorrelated. You can enter values in any
order. Values entered higher in the matrix affect the range of values lower in the matrix.
Because of range dependencies, we advise you to enter the values from top to bottom by
tabbing through the matrix.
Page 73
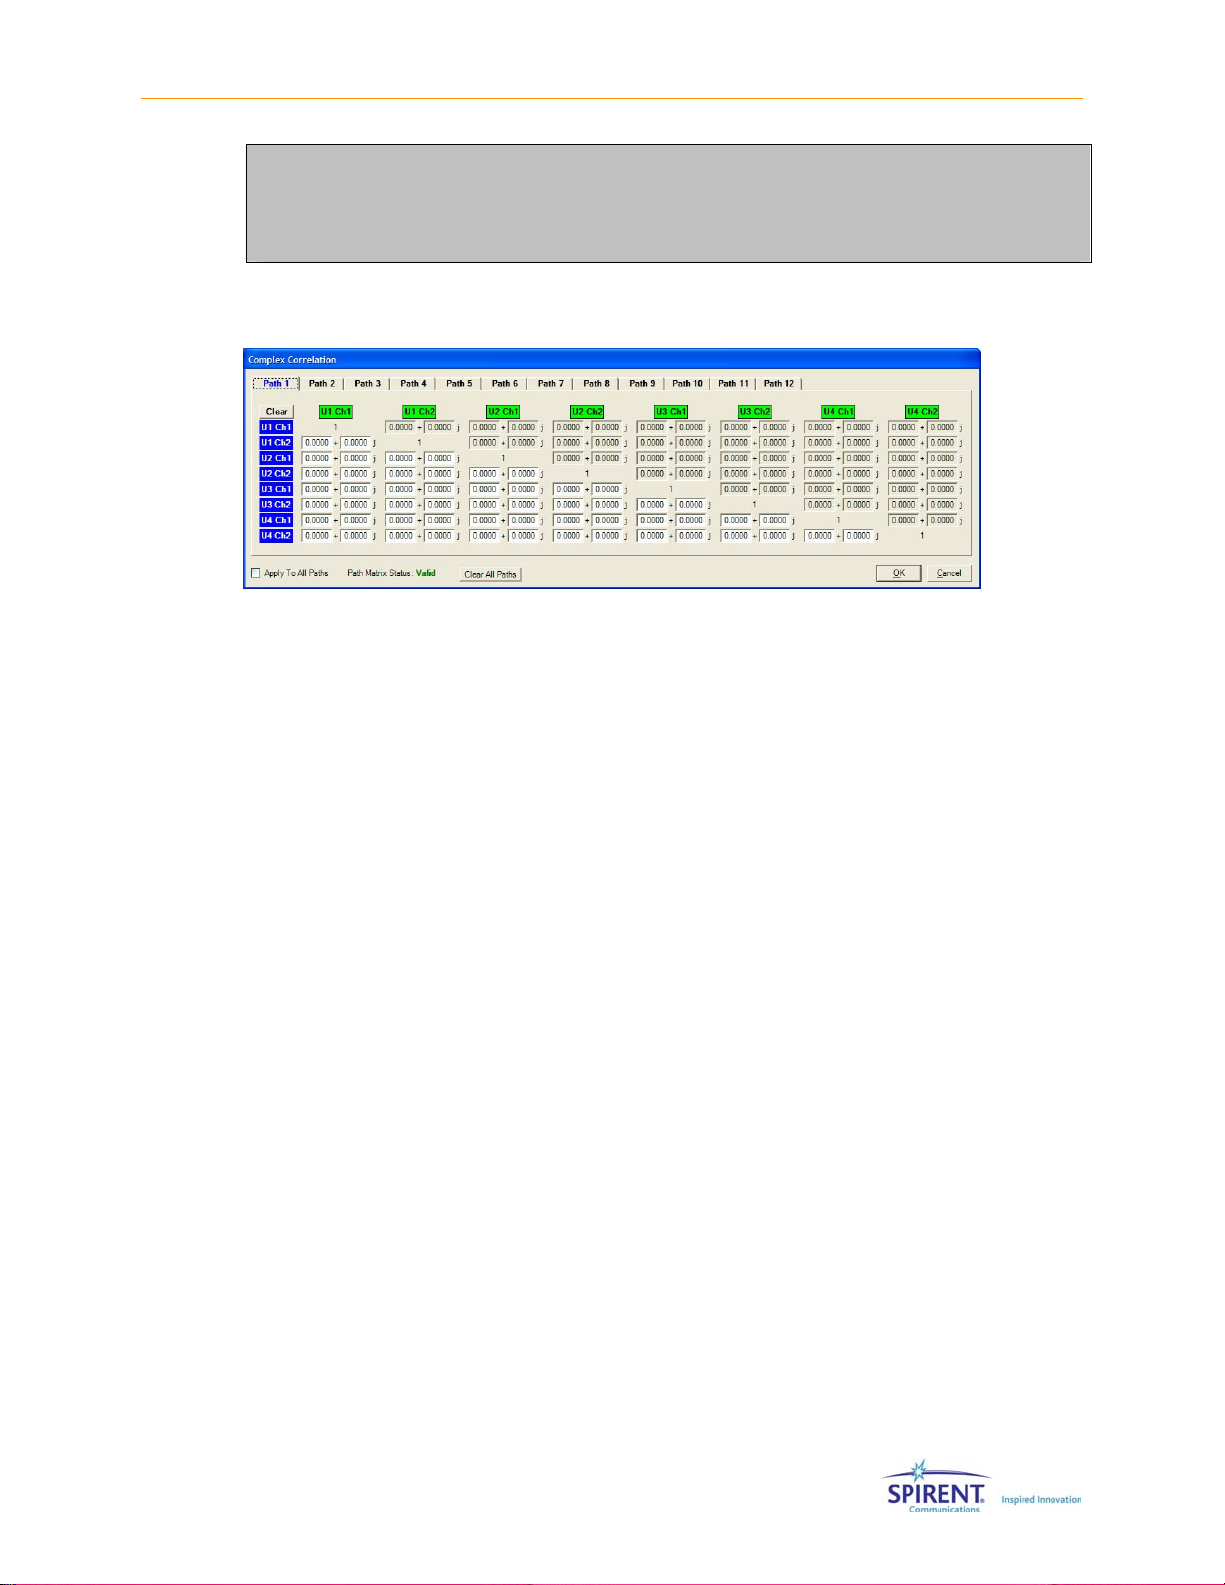
Chapter Three: Technical Reference | 65
NOTE: There are times when no range is possible for a given correlation
coefficient. This occurs when the matrix can not be physically implemented in
the real world. If this occurs, the values elsewhere in the matrix must be
changed to correct the condition.
If you select Complex as the Correlation Coefficient Type, the Complex Correlation
window displays, as shown in Figure 2-66.
Figure 2-66: Complex Correlation Window
The complete channel-to-channel complex correlation matrix displays in the Complex
Correlation window. The matrix can be specified for each path for up to 12 paths (in a 2-
channel setup) or 24 paths (in a single-channel setup) by selecting the appropriate folder
tab at the top of the window.
Enter the values in the lower-left triangle of the matrix. The upper-right triangle displays
the complex conjugate of the lower-left reflected about the main diagonal, enforcing the
matrix to be Hermitian.
As you enter values, the matrix is tested for positive definiteness and the Path Matrix
Status updates. If the test for positive definiteness fails, the Path Matrix Status displays
“Invalid” in red, if it passes, it displays “Valid” in green. Each complex value is tested to
make sure the magnitude is less than or equal to one. An error box displays if the
magnitude of any complex value entered is greater than one (1).
You can enter a different complex matrix for each path. To lock the paths together, select
the Apply To All Paths checkbox. The displayed matrix then applies to all paths in the
system.
To reset all matrices to zero, click the Clear All Paths button.
After entering all value, click the OK button to implement the matrix or click the Cancel
button to discard any changes.
2.14. Summary View.
The Summary View allows you to simultaneously view the state of all of the configured
units. Access the Summary view by clicking the Summary button or by selecting
View>Summary.
Page 74

66 | SR5500 Operations Manual
2.14.1. Path Parameters.
The current state of all configured paths can be examined using the path parameters tab.
This tab shows configured paths on all units. Paths not enabled do not display in this
view. Items in this view are read-only.
Figure 2-67: Path Parameters View
2.14.2. System Parameters.
Examine the current state of system parameters using the System Parameters tab. Items
in this view are read-only.
Figure 2-68: System Parameters View
Page 75

3. Technical Reference
3.1. Overview
Wireless communication is a demanding application that requires complex air interface
protocols to seamlessly interact and harsh radio channel effects to be mitigated. When a
wireless signal is sent from the transmitter to the receiver it traverses a complex radio
channel that distorts the intended signal transmission. The transmitted signal takes
multiple paths to the receiver. These paths are caused by the signal bouncing off
reflective surfaces such as the ground, buildings, or trees. Mobility between the
transmitter and receiver causes the characteristics of these paths to be time-varying.
Chapter Three: Technical Reference | 67
Figure 3-1: Typical Multi-path Fading Scenario
The radio propagation effects can be characterized by fast fading (also known as multipath fading), relative path delay, relative path loss, and slow shadow fading (also known
as log-normal fading). Different mobile environments generate various combinations of
these effects. The cause of each of these characteristics will be discussed along with
their effect on the transmitted signal. All of these characteristics can be demonstrated
with a simple transmitter to receiver diagram. Figure 3-1 is a diagram of a typical mobile
receiver (the car) as it drives along a roadway. Paths A, B, C, and D depict just four of the
many signal paths from the transmitter to receiver.
Page 76

68 | SR5500 Operations Manual
As shown in Figure 3-1, multiple versions of the originally transmitted signal show up at
the receiver each having taken a different route (A-D) through the radio propagation
channel. Because each of these macroscopic signal paths takes a different route through
the topology of the environment they each travel a different distance from transmitter to
receiver. This difference in distance causes the paths to arrive at the receiver staggered
in time and at a different average power level.
Fast and slow fading describe the time variation of the received signal level around an
average power level. Fast fading describes the signal variations of a macroscopic path
that take place over the course of several milliseconds. This level variation is primarily
caused when the propagation channel creates destructive addition of the phases of a
large number of reflected copies of the macroscopic path. These multiple received
transmissions are generated by microscopic scattering of the macroscopic path from
obstacles in the local geographical area (within a few hundred wavelengths of the
receiver).
While fast fading effects are attributed to local scattering of the transmitted signal,
topographical changes in the propagation channel introduce slow fading effects that vary
over 10’s or 100’s of milliseconds. These signal variations are caused when a particular
element of the geography, such as a mountain or large building, gets in between the
transmitter and receiver and partially blocks signal reception. Slow fading is often
described as shadow fading, since in effect, the geographic element casts a shadow on
the receiver. Amplitude variation fluctuations happen at a slow rate.
3.2. Radio Channel Power Delay Profile
In wireless communications, a signal transmitted to a receiver can arrive having traveled
over many different paths through the radio channel. On its way to the receiver, a
transmitted signal may take the direct line of sight path or may bounce off reflecting
surfaces before arriving at the receive antenna. Since these multiple copies of the
original transmitted signal travel different distances, they arrive at the receiver staggered
in time with different average power levels.
The impulse response of the radio channels is used to characterize what predominant
paths are present between the transmitter and receiver at a given time. Using the
impulse response method, a short transmit signal is broadcast through the radio channel
and multiple copies of the original signal are captured and measured at the receive
antenna. The result is displayed in the form of a Power-Delay Profile. An example Power
Delay Profile is shown in Figure 3-2. This example shows 4 copies of the original
transmitted signal arriving at the receiver. The Y-axis describes the relative power of each
of these paths at the receive antenna. The X-axis describes the relative time difference
between the paths as they arrived at the receiver. Since the radio channel is dynamic,
the amplitude and relative delay characteristics of the paths in the Power Delay Profile
vary over time. The following sections describe various characteristics of the paths
illustrated by the radio channel’s Power Delay Profile.
Page 77

Chapter Three: Technical Reference | 69
A
D
B
C
Relative Power (dB)
Relative Delay Spread
Figure 3-2: 2D – Power Delay Profile of Figure 3-1
3.3. Static Relative Path Delay
Relative path delay is a phenomenon where individual signal paths from the transmitter
to the receiver arrive at different times. An example of this is shown in Figure 3-1
between Paths (A) and (C). Path (C) will arrive at the receiver (the automobile) a finite
time after signal Path (A). The net effect of the arrival time difference is to spread the
originally transmitted signal at the receiver in time. In a digital wireless communications
this will cause received symbols to overlap resulting in inter-symbol interference.
The amount of relative path delay varies with terrain and application. In an indoor
application, delays could be in the 10's of nanoseconds (ns), where 10 ns is about 10
feet. In outdoor applications, delays of 10 microseconds (µs) or less are typical (1 µs is
about 1000 feet). Delays greater than 50 µs are rare in cellular environments.
Path delay in the SR5500 is set relative to the first arriving path. This delay setting is in
addition to the absolute electrical delay through the system.
3.4. Time-Varying Relative Path Delay
A Power-Delay Profile, as shown in Figure 3-3 provides a snapshot of the impulse
response of a radio propagation channel. In mobile applications, the number of paths in
a Power Delay Profile and their location along the delay spread X-axis would remain
constant over several meters. In many cases the impulse response of a radio channel is
averaged over this small distance (which translates into a short-period of time with
mobility) to provide a “static” or wide sense stationary view of channel conditions. As a
mobile wireless terminal moves over a wider area the shape and characteristics of the
Power Delay Profile change dramatically. This is shown in the time-varying Power Delay
Profile shown in Figure 3-3.
Page 78
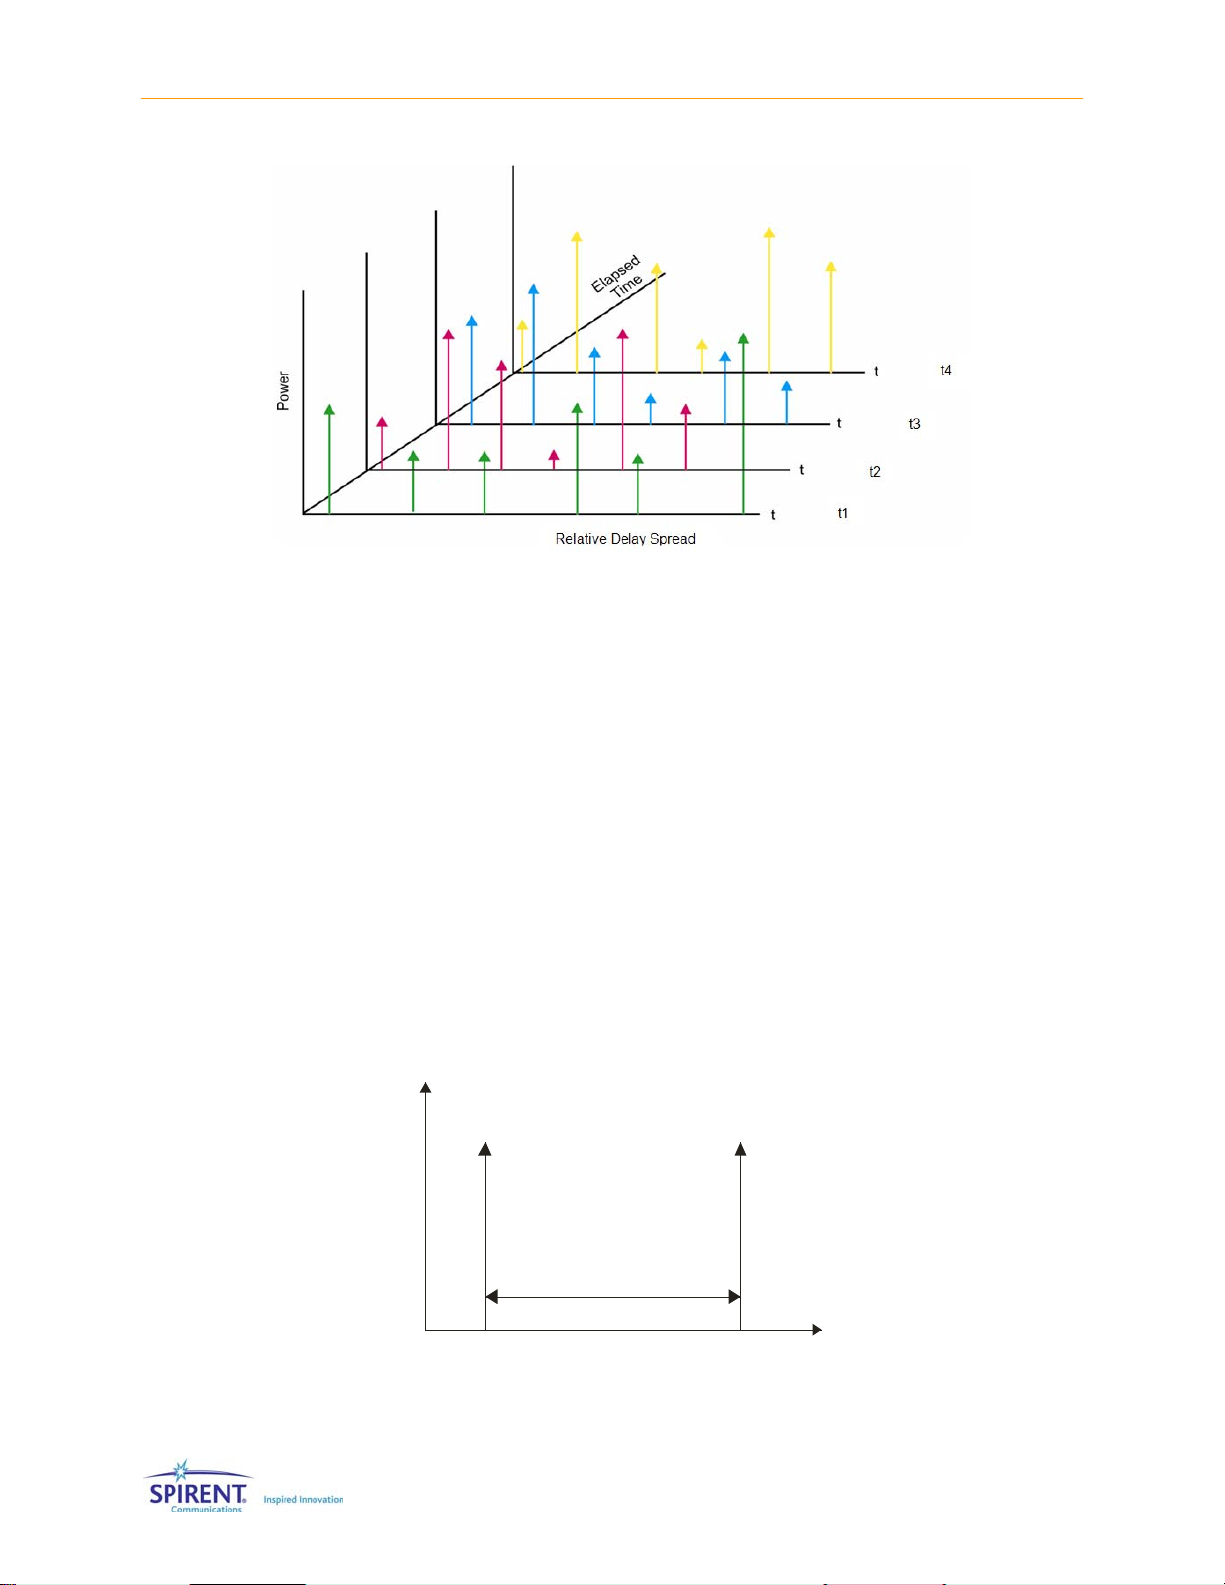
70 | SR5500 Operations Manual
Figure 3-3: 3D Plot Showing Time-Varying PDP
Modern wireless communications systems must adapt to these dramatic changes to
continuously mitigate the impact of multi-path delay spread. To accurately evaluate the
performance over a time-varying Power Delay Profile, a fading emulator must be able to
emulate the time-varying changes in the paths delay characteristics. The following
sections describe popularly employed models to emulate dynamic delay spread.
3.4.1. Sliding Relative Path Delay
Popular channel models feature Power-Delay Profiles with time-varying delay spread to
evaluate a receiver’s ability to adapt to dynamic changes in the radio environment
caused by mobility. These models may specify the use of paths with sliding delay
characteristics. 3GPP test specifications define Moving Propagation channel models that
utilize paths that possess sliding delay with a sinusoidal variation in delay spread.
SR5500 sliding delay emulation smoothly varies the temporal location of individual multipath components using a periodic sinusoidal function. A two-path example is shown in
Figure 3-4 below. In this example, Path 1 has fixed delay (t
) while Path 2 has sliding
0
delay oscillating over the delay range of ∆τ.
r
e
w
1
o
h
P
t
a
P
2
h
t
a
P
∆τ
t
0
Relative Delay Spread
Figure 3-4: Sliding Delay Example
t
1
Page 79

Chapter Three: Technical Reference | 71
Several parameters must be defined for paths employing sliding delay. These include:
• Minimum Delay – minimum delay of the sliding path
• Maximum Delay – maximum delay of the sliding path
• Rate of Oscillation – rate of sliding delay change
• Delay Period – time of one sliding delay period
3.4.2. Birth-Death Time-varying Relative Path Delay
As an alternative to changing the delay spread of a path by sliding the path along the
delay axis, some channel models employ Birth-Death time-varying delay emulation. The
Birth-Death emulation method randomly varies the location of the paths in the Power
Delay Profile along the delay-spread axis. Paths take turns hopping between pre-defined
delay spread bins. An example Birth-Death sequence is illustrated in the series of powerdelay profiles found in Figure 3-5.
P1P
P
P
1
2
P
P
P
1
1
2
P
2
2
0
10
5
(s)µ
0
10
5
(s)µ
0
10
5
(s)µ
Figure 3-5: Birth-Death Delay Example
Birth-Death paths have fixed delay value during each defined state but change delay
value during a state change. Birth-Death paths participate in the Birth-Death sequence
by taking turns changing their location along the delay spread axis. During each state,
only one path changes its temporal delay location. This “death” of the path in its current
delay bin and subsequent “birth” in a new unoccupied bin is performed using a uniform
random distribution. You defines the individual delay bins that make up the distribution
set.
Several parameters must be defined for paths participating in the Birth-Death sequence.
These include:
• Number of Bins: Defines the number of bins that paths configured for Birth-Death
delay will hop between.
• State Duration: Defines the time between delay state changes.
• Delay Bin Values: Defines the location of the individual delay bins used in the Birth-
Death sequence.
Page 80
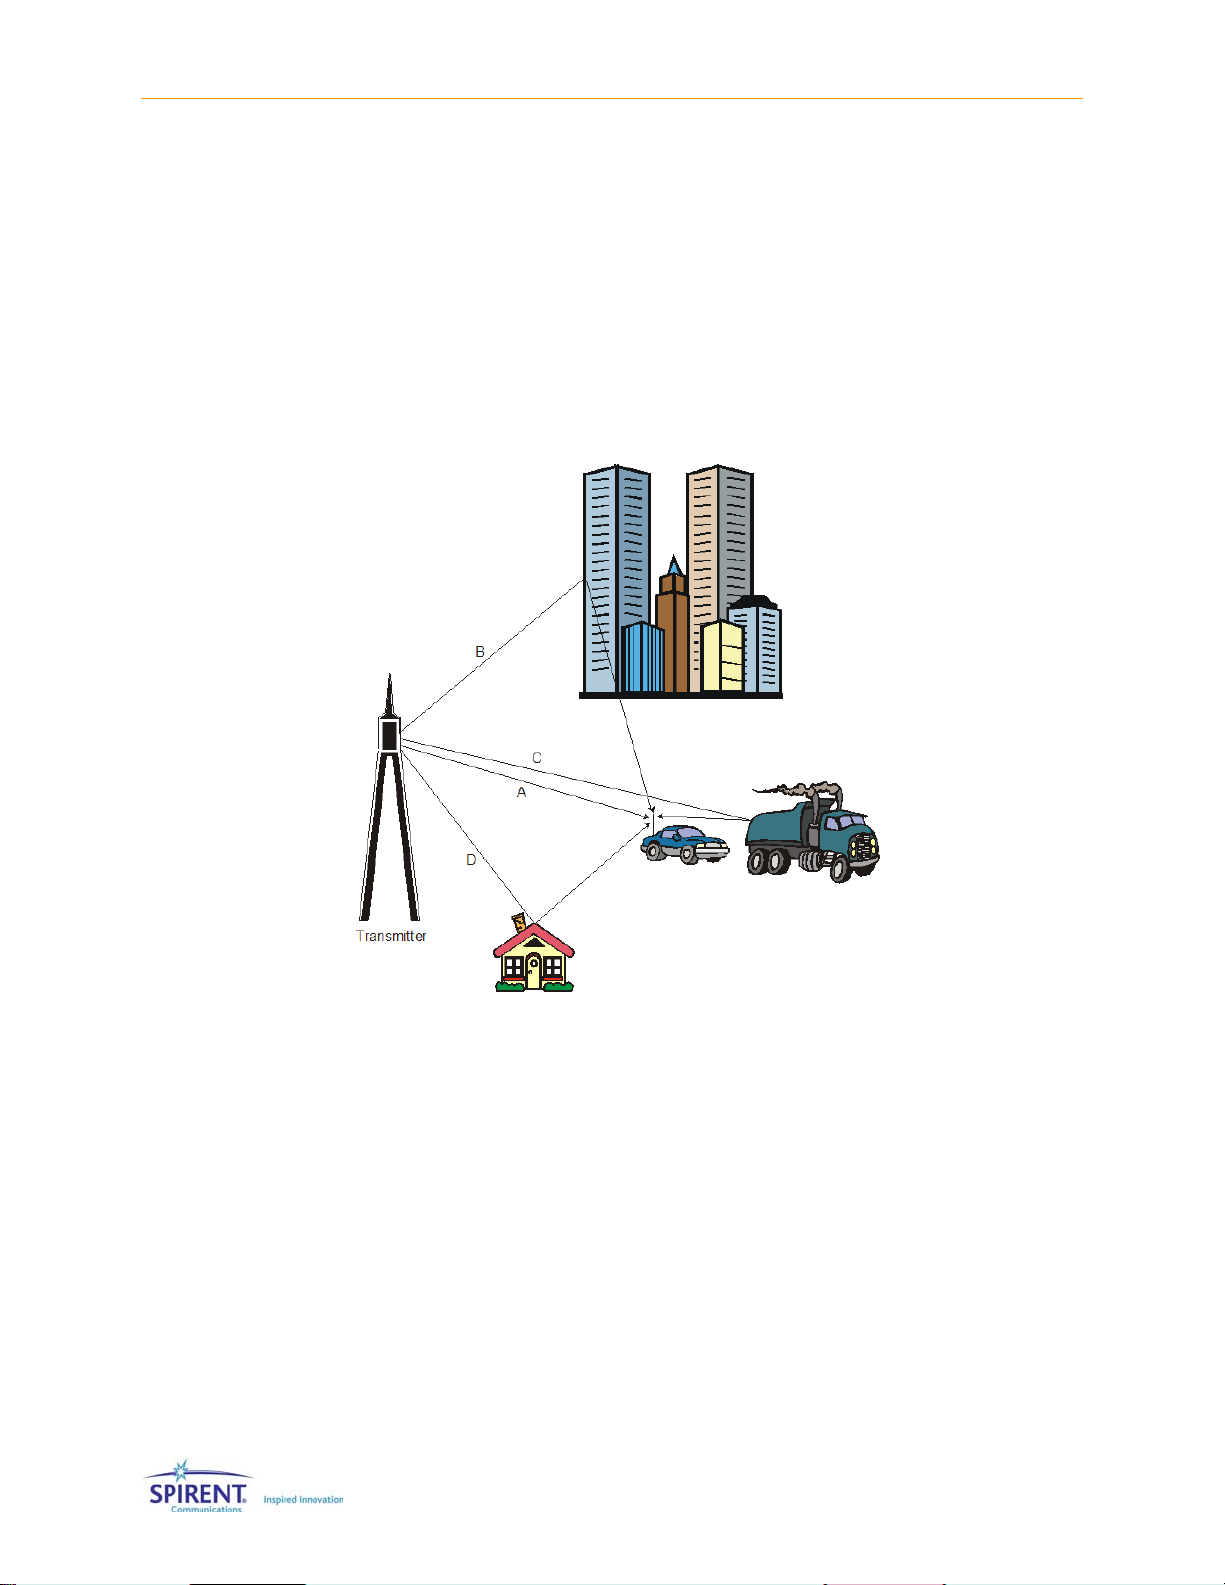
72 | SR5500 Operations Manual
3.5. Relative Path Loss
Relative path loss is a phenomenon where individual signal paths arriving at the receiver
are at different absolute power levels. The difference in power levels between paths is
caused by the physical obstructions in the signal path. Referring to Paths (A) and (C) in
Figure 3-6, Path (C) will arrive at a lower power level then Path (A). This occurs since
some amount of the power in signal Path (C) is lost when it reflects off the truck. Signal
strength will also vary due to the distance the signal travels. The loss of signal strength
should follow the 1/d
and the receiver. In the actual cellular environment the loss is much worse, (between
3
1/d
to 1/d6), due mainly to variations in the terrain.
2
law in free space, where d is the distance between the transmitter
3.6. Fast Fading
Fast fading is generated by local scattering of the individual paths in the Power-Delay
Profile in close proximity to the receiver. This scattering creates a large number of
reflected signal transmissions that arrive at the receiver at relatively the same time (with
respect to the inverse of receive signal bandwidth) with random phase and amplitude
caused by the difference in distance traveled. Several different mathematical
distributions are commonly used to model the amplitude and phase characteristics of the
fast fading phenomena. These include the Rayleigh and Rician fast fading amplitude
distributions.
Figure 3-6: Transmitter to Receiver Signal Diagram
Page 81

Chapter Three: Technical Reference | 73
3.6.1. Rayleigh Fading Amplitude Distribution
Fast fading is commonly referred to as Rayleigh fading. A Rayleigh modulated signal is
caused by scattering of the paths in the Power-Delay Profile from man-made and natural
obstacles such as buildings and trees in the local geographical area (within a few
hundred wavelengths of the receiver). It is formed by a large number of these scattered
(reflected) signals combining at the receiver. Each of these signals has a random phase
and amplitude at the receiver due to the reflections and difference in distance traveled.
The phenomenon that creates Rayleigh fading can be easily illustrated using a simple
two path example. At the receiver the two paths can be of any amplitude and phase. If
the two paths are of the same amplitude, and their phase is 180
total destructive interference and no resultant signal. If the two signal paths are 0
in phase there will be constructive interference and the signal envelope will be 3 dB
larger than the individual path's amplitudes.
The signals rarely combine to greater than 10 dB above the individual path's power. The
deep fades (destructive interference) would range from just a few dB to fades of greater
than 50 dB. The spacing and amplitude of the fades are a function of the carrier
frequency. At 900 MHz the deep fades will occur at the mobile every few centimeters
apart.
o
apart, there will be
o
apart
The fades and peaks of the signal envelope follow a Rayleigh distribution. This causes
the signal strength to fluctuate rapidly between slightly higher levels to deep fades of
greater than 50 dB. Figure 3-7 shows an example of the Rayleigh faded signal versus
time. Rayleigh fading is called fast fading since the fluctuations are so rapid, as
compared to log-normal or slow fading.
-20.00
-30.00
-40.00
SIGANL POWER (dBm)
-50.00
-60.00
TIME (75 ms sweep)
Figure 3-7: Rayleigh Faded Signal vs. Time
• Doppler Freq. = 100 Hz
• Center Freq. = 900 MHz
• Span = 0 Hz
• RBW = 100 kHz
• Sweep Time = 75 msec
Page 82
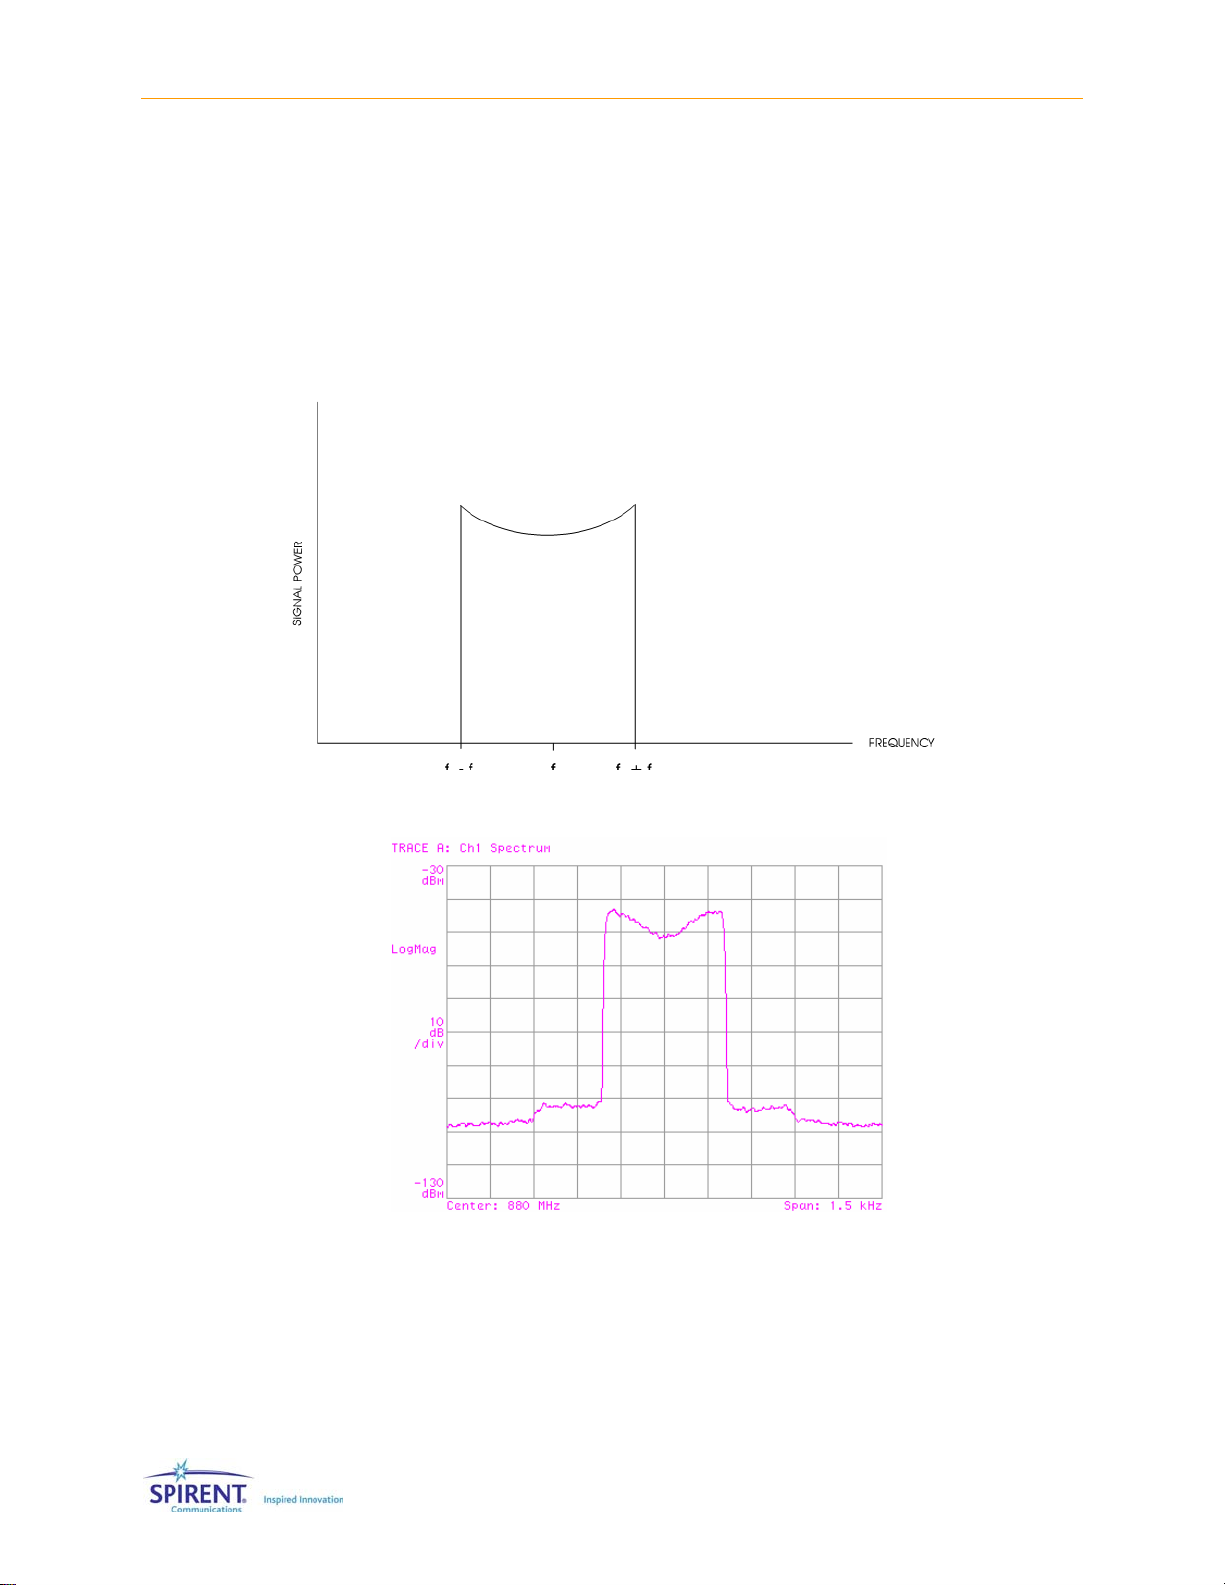
74 | SR5500 Operations Manual
The Rayleigh distribution is generated using a complex I/Q modulator. The I/Q signals are
modulated with two Gaussian distributed signals. Since Rayleigh fading occurs when
there is relative movement between the transmitter and receiver, the signal is subjected
to a Doppler shift (frequency shift). As a result the spectrum of Rayleigh fading is limited
to plus or minus the Doppler frequency (which is a function of the vehicle velocity)
assuming that there is an equal probability that the signal is received with an arrival
angle anywhere within the range from 0 to 360 degrees. The theoretical power spectral
density of a Rayleigh faded signal is shown in Figure 3-8. Also shown, in Figure 3-9, is the
measured power spectral density from a SR5500.
Figure 3-8: Theoretical Rayleigh Power Spectral Density
Figure 3-9: Measured Rayleigh Power Spectral Density
• Doppler Freq. = 200 Hz
• Center Freq. = 880 MHz
• Span = 1.5 kHz
Page 83

Chapter Three: Technical Reference | 75
To evaluate the performance of Rayleigh fading implemented in the SR5500, it must be
compared to a defined standard metric to ensure consistent operation. One set of
performance criteria can be found in industry standard test documents. The primary
performance criteria that are used to evaluate Rayleigh fading are the Cumulative
Probability Distribution Function (CPDF) and the Level Crossing Rate (LCR).
Representative fast fading specifications state that an un-modulated carrier with
Rayleigh fading should meet the following performance.
1. The measured Rayleigh (CPDF) should match the calculated CPDF using the
following criterion:
a. The measured CPDF of power shall be within ±1 dB of the calculated CPDF from
+10 dB above the mean power to 20 dB below the mean power.
b. The measured CPDF of power shall be within ±5 dB of the calculated CPDF from
20 dB to 30 dB below the mean power.
c. 2. The measured LCR should match the calculated LCR, and not deviate more
than ±10% of the simulated vehicle speed over a range of 3 dB above the mean
power level to 30 dB below the mean power level.
The theoretical and measured CPDF are shown in Figure 3-10. This plot is the probability
of a signal level being less then the mean level. The LCR plots, shown in Figure 3-11, are
the number of crossings per second versus the signal power. In both of these plots the
signal power is relative to the mean. The CPDF and LCR were taken with an 80 Hz
Doppler frequency. Both plots show the measured performance of the SR5500 well
exceeds the above standards for Rayleigh fading.
1.00
0.10
P(r)<x
0.01
0.00
-30.00 -20.00 -10.00 0.00 10.00
Figure 3-10: Measured vs. Theoretical CPDF
• ______ Measured
• _ _ _ _ _ Theoretical
SIGNAL POWER REALATIVE TO MEAN
Page 84

76 | SR5500 Operations Manual
100.00
10.00
LEVEL CROSSING RATE (# crossing / sec)
1.00
-30.00 -25.00 -20.00 -15.00 -10.00 -5.00 0.00
• ♦ ♦ ♦ ♦ Measured
• _ _ _ _ _ Theoretical
LEVEL RELATIVE TO MEAN (dB)
Figure 3-11: Measured vs. Theoretical LCR
3.6.2. Rician Fading Amplitude Distribution
Rician fading is formed by the sum of a Rayleigh distributed signal and a Line-Of-Site
(LOS or direct path) signal, where the LOS signal is typically subjected to a static
frequency shift (static Doppler). A fading environment typically associated with Rician
fading is that where one strong direct path reaches the receiver at roughly the same
delay as multi-path from local scatterers.
The SR5500 supports the general case of Rician fading with programmable Angle of
Arrival (AOA) and K factor. In the general case of Rician fading the arrival angle of the
LOS path at the receiver is programmable, as is the ratio of power between the LOS path
and the multi-path. The SR5500 provides access to both the LOS arrival angle specified
as the AOA (expressed in degrees) and the LOS path to multi-path power ratio specified
as the K factor (expressed in dB). Changing the LOS arrival angle will move the relative
location of the direct path with respect to the faded spectrum by changing the static
Doppler shift of this component. This Doppler shift is set according to the following
equation:
Doppler
direct component
= Doppler
faded component
The K factor setting then controls the relative power of the direct path and the multi-path
and has a valid range of -30dB (faded spectrum will dominate) to +30dB (LOS signal will
dominate).
x cosine (LOS arrival angle)
Page 85
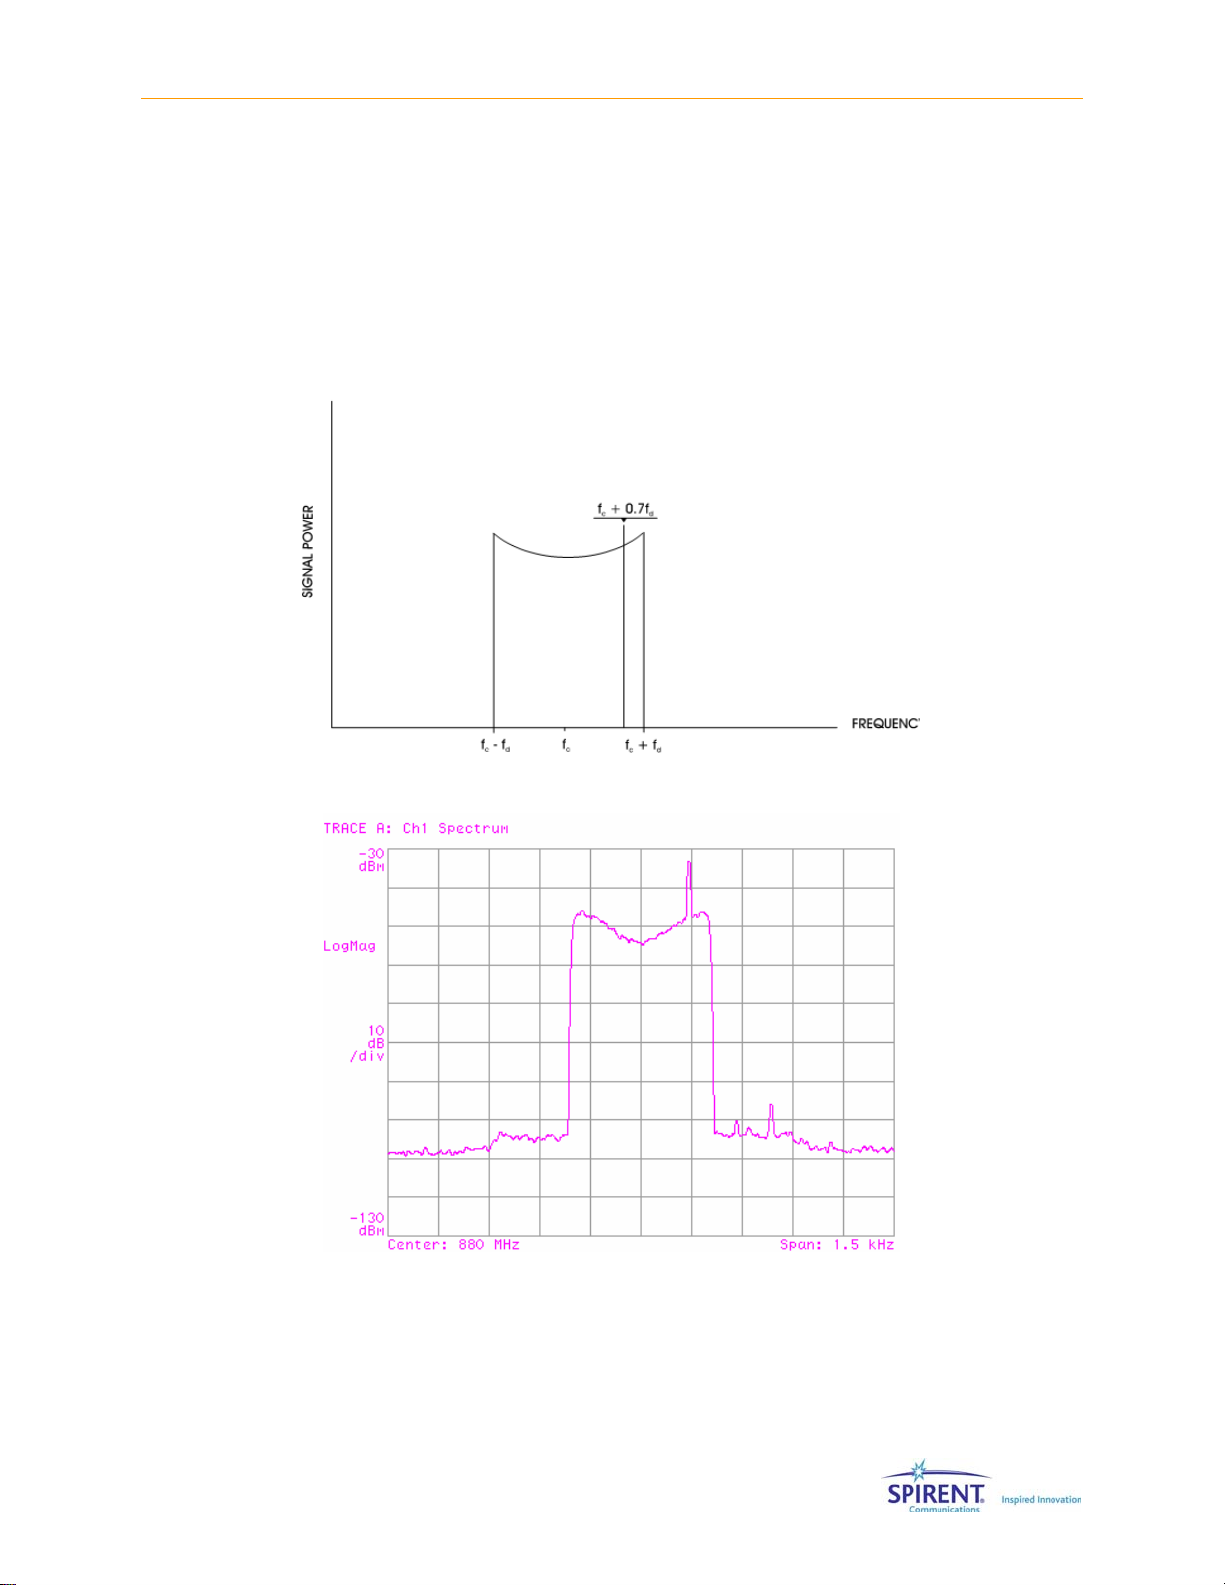
Chapter Three: Technical Reference | 77
An example configuration of Rician fading may have an angle of arrival of the LOS signal
o
path set to be 45
, resulting in a Doppler shift that is ~0.707 of the maximum Doppler
shift of the Rayleigh distributed signal (classical Doppler spectrum). Furthermore, if the
signal power of Rician fading is split equally between the LOS and multi-paths (where the
power envelope of the multi-paths combine to from a Rayleigh distribution) this
corresponds to a K factor setting of 0 dB. A theoretical power spectral density for this
example of Rician fading is shown in Figure 3-12 and a measured spectral density is
shown in Figure 3-13.
Figure 3-12: Theoretical Power Spectral Density for Rician Fading
Figure 3-13: Measured Rician Fading Power Spectral Density
• Doppler Freq. = 200 Hz, K = 0 dB
• Center Freq. = 880 MHz
• Span = 1.5 kHz
Page 86

78 | SR5500 Operations Manual
3.6.3. Fast Fading Power Spectrum Shapes
Rayleigh fading and Rician fast fading describe the amplitude distribution of the faded
signal. However, several different frequency domain models can be used to represent the
power spectrum shape produced by multi-path fading.
The SR5500 allows you to select the shape of the power spectrum produced by multipath fading. The four possible spectrum shapes that can be set are shown in Figure 3-14.
The first shape, Classical 6 dB is the most commonly used model and adheres to the
spectral requirements detailed in many mobile communications standards for Rayleigh
fading conditions. The Flat spectrum shape has been determined to be representative of
the multi-path propagation effects experienced in some indoor applications. The
Classical 3 dB, Rounded and Rounded 12 dB spectrum shapes are also available in the
SR5500.
6 dB
Classical 6 dB Flat
3 dB
Classical 3 dB
Figure 3-14: Fading Power Spectrum Shape
Rounded
3.7. Static Amplitude Channel Effects
In some cases it is desirable to emulate single reflected paths that do not undergo local
multi-path scattering and thus have static, or constant, amplitude. While these paths
have a fixed amplitude versus time, they may be subjected to constant or time-varying
phase modulation. These phase modulation effects are descried in the following
sections.
Rounded 12
dB
12 dB
Page 87

Chapter Three: Technical Reference | 79
×
3.7.1. Frequency Shift (Static Doppler)
Static frequency shift from the carrier frequency occurs when the distance between the
receiver and transmitter is changing. An example of this is when a mobile receiver (car) is
driving away from the transmitter. Path (A) in Figure 3-6 has a static frequency shift due
to the movement of the car. The amount of the frequency shift (Doppler frequency) from
the carrier is determined by the following formula:
Freq
Doppler
where C ≅ Speed of Light (3 x 10⁸ m/s)
The Doppler frequency, caused by dynamic rotation of the path phase, can be either
positive or negative depending whether the mobile receiver is moving away from or
towards the transmitter respectively.
3.7.2. Static Phase Shift
A static phase shift is a result of a constant random distance between the transmitter
and receiver. This distance is very rarely going to be an integer number of carrier
wavelengths; a non-integer value will result in a static phase shift on the signal path. The
amount of phase shift can vary between 0 and 360 degrees.
3.8. Slow Shadow Fading
Slow or Shadow fading is the slow variation of the average signal power over time. A plot
of signal power versus time for Shadow fading is shown inFigure 3-15. Shadow fading is
often characterized by a log-normal amplitude distribution. The time scale is much larger
than that for Rayleigh fading as shown in Figure 3-9. The variation in signal strength at
the receiver is due to blockage or absorption of the signal by large-scale variations in the
terrain profile and by changes in the nature of the local topography in the path from the
transmitter to the receiver. The blockage of the signal is caused by elements in the
environment such as hills or a building. This phenomenon is often called shadowing
since the receiver is passing through a large "shadow" of an object. An example of this is
shown in Figure 3-16 as the mobile receiver (car) passes in the "shadow" of the building,
the signal strength would fade.
Velocity Freq
=
mobile carrier
C
Page 88
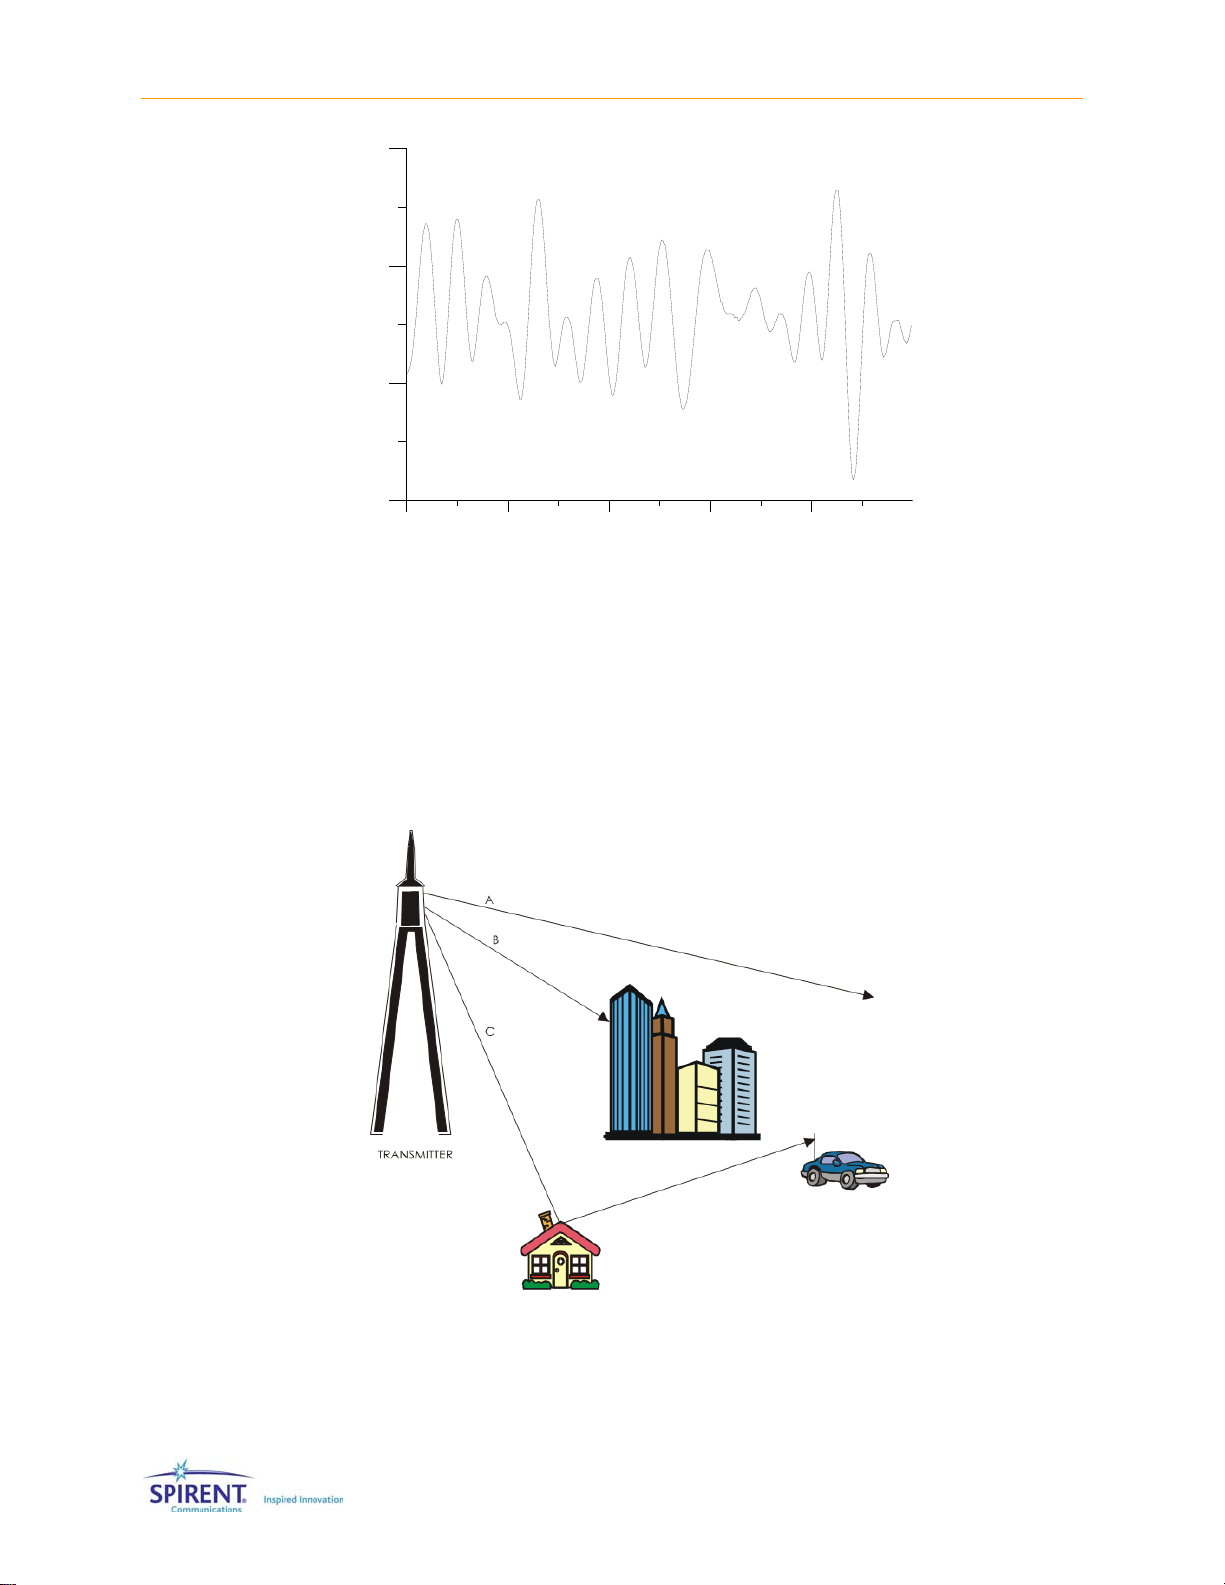
80 | SR5500 Operations Manual
-40.00
-50.00
SIGNAL POWER (dBm)
-60.00
-70.00
TIME (2 sec sweep)
Figure 3-15: Log-Normal Fading vs. Time
• Log-Normal Standard Deviation = 10 dB
• Log-Normal Rate = 10 Hz
• Path Loss = 25 dB
• Center Freq. = 900 MHz
• Span = 0 Hz
• RBW = 100 kHz
• Sweep Time = 2 sec.
Figure 3-16: Transmitter to Receiver Log-Normal Diagram
Page 89

Chapter Three: Technical Reference | 81
m
/
This fading has statistical characteristics that are represented by a log-normal
distribution of fluctuations in the mean (average) signal power expressed in decibels
(dB). The standard deviation of the log-normal distribution is determined by the
characteristics of the terrain where the transmitter and receiver are located. For
example, a standard deviation of between 6-8 dB is typical for urban areas, while a
deviation of 10-12 dB can be observed in rural locations.
The maximum rate of the log-normal fading must also be specified. The rate of lognormal fading is the maximum frequency of the fading spectrum and defines the
maximum pace that the mobile will move through the shadow of elements in the terrain.
An example can be given of a mobile receiver (car) driving at a fixed speed along a road.
If the car is in a rural area behind hills far apart, the log-normal rate would be small since
the car is moving through "shadows" at a slow rate. If the car is in an urban area behind
rows of buildings, the rate would be larger since the mobile would be passing through
"shadows" at a higher rate.
The following relationship holds for log-normal fading:
Log Normal Rate (Hz) =
Mobile Velocity ( )
Min. Shadow Length (m)
The log-normal frequency in this equation will be the maximum rate that the mobile will
move through "shadows". This corresponds to the maximum frequency of the log-normal
fading spectrum that has a span that begins near DC.
3.9. Additive White Gaussian Noise (AWGN) interferer
The AWGN type of additive interferer is generated independently for each of the two
channels of the SR5500. The noise source is defined as being flat over the specified
band within the tolerance specified in Section 7.6 on page 143. Refer to Figure 3-17
through Figure 3-21 for plots of typical band-limited noise signal power vs. frequency for
each of the available noise bandwidths.
s
Figure 3-17: Typical SR5500 AWGN Source Power vs. Frequency (1.625 MHz Bandwidth)
Page 90

82 | SR5500 Operations Manual
Figure 3-18: Typical SR5500 AWGN Source Power vs. Frequency (3.25 MHz Bandwidth)
Figure 3-19: Typical SR5500 AWGN Source Power vs. Frequency (6.5 MHz Bandwidth)
Page 91

Chapter Three: Technical Reference | 83
Figure 3-20: Typical SR5500 AWGN Source Power vs. Frequency (13 MHz Bandwidth)
Figure 3-21: Typical SR5500 AWGN Source Power vs. Frequency (26 MHz Bandwidth)
The power of the band-limited noise interferer relative to the carrier power may be
specified in one of three ways: carrier to noise, carrier bit power to noise power spectral
density and carrier power to noise power spectral density. In carrier to noise (C/N) mode,
the power of the band-limited noise is set as a ratio of carrier power to noise in the
bandwidth of the receiver. In carrier bit power to noise power spectral density (Eb/No)
mode, the power of the band-limited noise is set as a ratio of carrier bit energy to noise
power spectral density.
Page 92

84 | SR5500 Operations Manual
The carrier bit power and noise power in dBm can be calculated based on the following
formula:
Eb (dBm/bps) = C (dBm) - 10*log10(Bit Rate (bps))
where:
Eb = Bit power in dBm/bps
C = carrier power in dBm
Bit Rate = bit rate of the carrier
and
N (dBm) = No + 10 log10 (Receiver Bandwidth)
where:
N = noise power in the receiver bandwidth in dBm
No = noise power spectral density in dBm/Hz
Receiver Bandwidth = carrier bandwidth in Hz
In carrier to noise power spectral density (C/No) mode, the power of the band-limited
noise is set as a ratio of carrier power to noise power spectral density. The noise power
can be calculated based on the following formula:
N (dBm) = No + 10 log10 (Receiver Bandwidth)
where:
N = noise power in the receiver bandwidth in dBm
No = noise power spectral density in dBm/Hz
Receiver Bandwidth = carrier bandwidth in Hz
There is also a dependency between the total output power available and the C/N ratio.
Since the SR5500 can produce a fixed amount of total power, large negative C/N ratios
reduce the maximum settable output power. The following plot shows the relationship
between C/N ratio and output power. The plot assumes that the receiver bandwidth is
set to 100% of the noise bandwidth.
Page 93
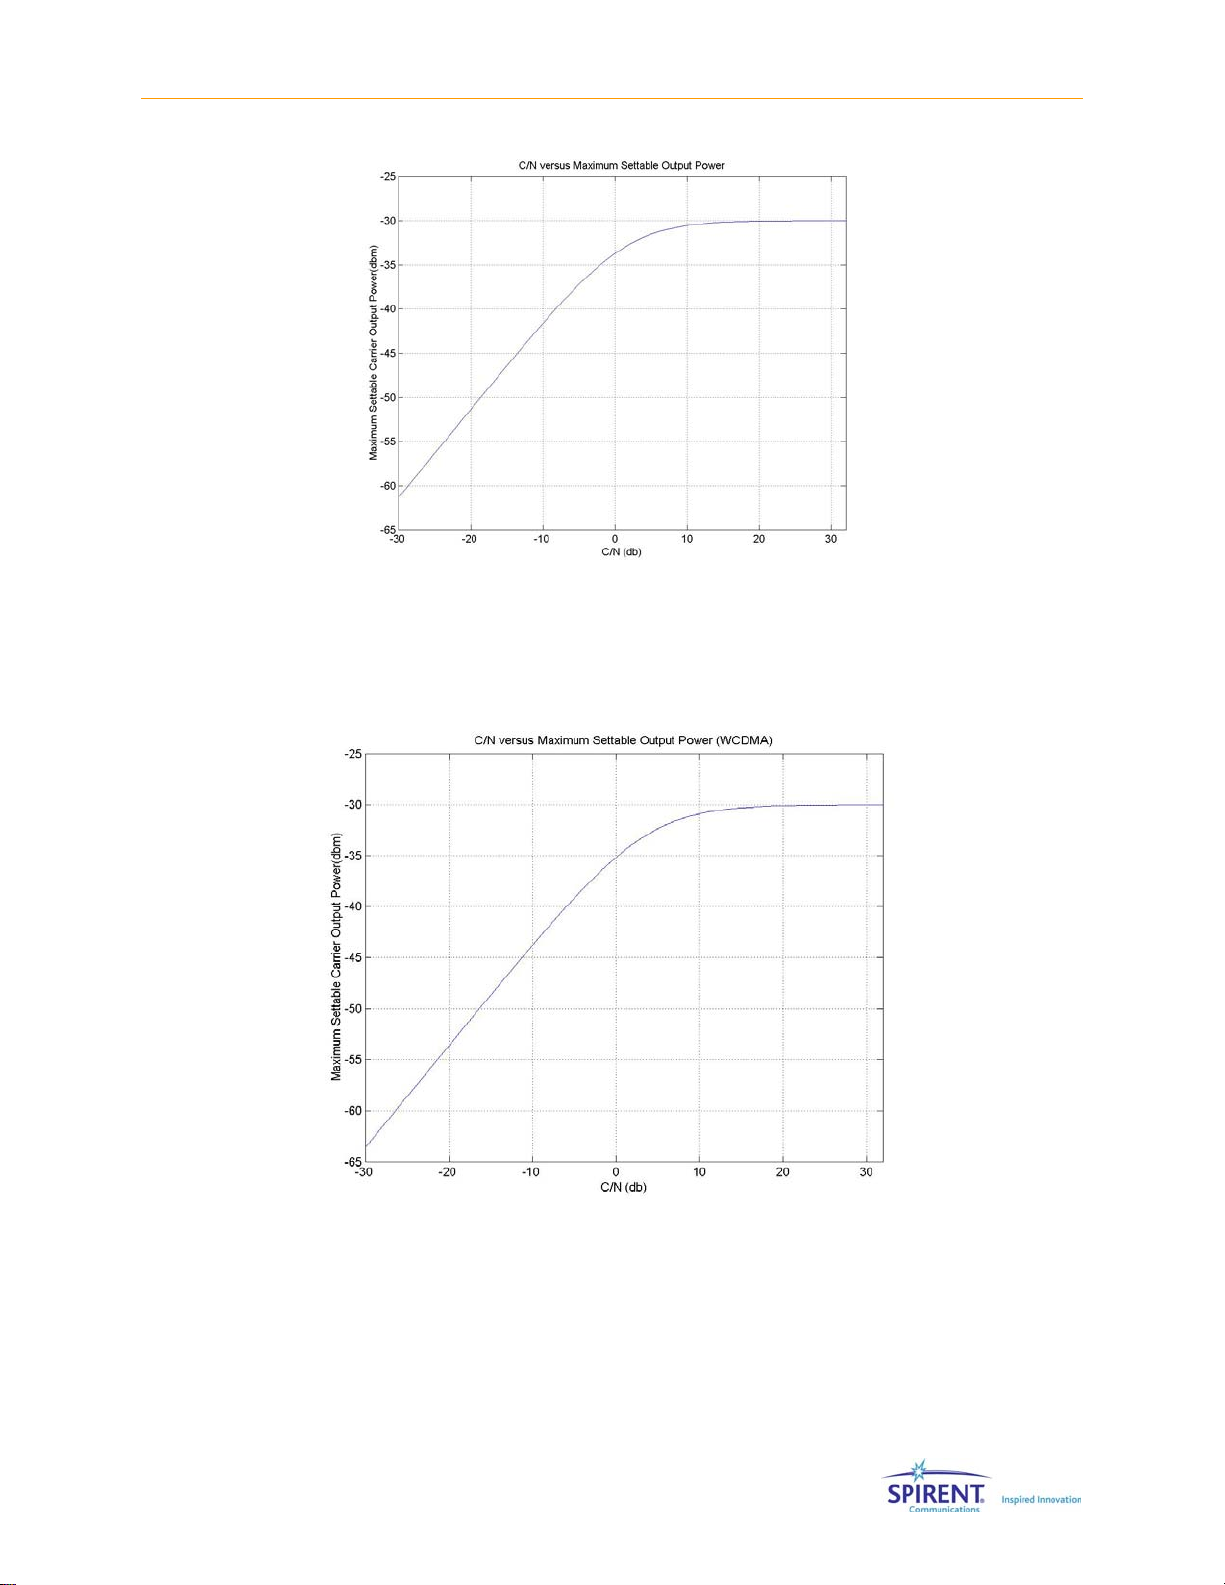
Chapter Three: Technical Reference | 85
Figure 3-22: C/N vs. Settable Output Power (Receiver Bandwidth – Noise Bandwidth)
Setting the receiver bandwidth to be less then the total noise bandwidth affect this
relationship. The following plot shows the relationship for a typical WCMA setup. Noise
Bandwidth = 6.5 MHz, Receiver bandwidth set to 3.84 MHz.
Figure 3-23: C/N vs. Settable Output Power (Receiver Bandwidth = 3.84 MHz, Noise Bandwidth = 6.5 MHz)
The AWGN source is generated using real-time signal generation methods. The AWGN in
channel 1 is uncorrelated from the AWGN generated in channel 2. The methods enable
band-limited noise generation with very long sequence durations, resulting in excellent
statistical properties of peak-to-average ratio and complementary cumulative distribution
function (CCDF). Refer to Figure 3-24 for a typical plot of the band-limited AWGN CCDF.
Page 94

86 | SR5500 Operations Manual
%
0.001
0.0001
Figure 3-24: Typical SR5500 Band-Limited AWGN CCDF
100
10
1
0.1
0.01
01020
dB
3.10. Power Meter
The SR5500 contains a Power Meter in each channel that is used to measure the signal
levels coming into the unit. The measurement is a wideband power measurement limited
by the bandwidth of the SR5500 channel (26 MHz). The Power Meter functions in two
modes: continuous and triggered mode.
In the continuous mode of operation, the Power Meter analyzes the input signal at all
times. The number of averages that you selects defines how many samples of data the
meter will sum together before producing a result. Although the Power Meter samples the
input signal at 78 MHz, the number of averages parameter refers to blocks of 16
samples. So if the number of averages is set to 2, the actual amount of time that the
signal will be sampled before returning a result is:
1/78E6 * 16 * 2 = 0.410 µs
In the triggered mode of operation, the Power Meter will only analyze samples that are
higher in power than the set trigger level. The triggered mode is intended for use in
applications where the equipment signal is “bursty”. GSM and WLAN are examples of
applications where this mode should be employed. Due to the instantaneous variations
in power of communications signals, some filtering must be employed in order to
accurately detect when the signal is in the “ON” State.
The criteria that the Power Meter uses to determine whether an individual sample will be
included in the average calculation is:
‘A sample will be included in the average if the mean of both the previous eight samples
and the next eight samples is greater than the trigger level.’
Page 95

Samples
from ADC
at 78 MH z
Chapter Three: Technical Reference | 87
This approach allows the signal to be measure during only the burst on-time. If the
number of averages is large, the measurement will likely take place over multiple
‘bursts’. The number of averages in this case refers to the number of included samples.
In the case of a signal with a long period between bursts, the measurement can take a
significant amount of time. Figure 3-25 shows a block diagram of the triggering
approach.
Block
4.875 MHz
Averaging
of 16
samples
FIFO (8 bl ocks deep = 1. 64
us)
Average of All
samples in
FIFO
is AVG
> trigger
level
Figure 3-25: Triggered Power Measurement Bl ock Di a gr a m
FIFO ( 8 blocks deep = 1.64
us)
Average of All
samples in
FIFO
is AVG
> trigger
level
Both True?
Then enabl e
switch.
Accumulator
# of sample
accumulated
If # of samples
accumulated = #
of averages then
latch outpu t of
accumulator and
accumulator for
measurement.
clear the
the next
Latch
Output
Divide by # of
averages
Measured
Input Level
Figure 3-26 displays an example of how the Power Meter collects samples. The input is a
20 MHz wide noise-like signal pulsed on and off at a 20 µs interval. Note that even
though some individual samples exceed the set trigger level they are not included in the
measurement because they are too short in duration.
Figure 3-26: Trigger Level
Page 96

88 | SR5500 Operations Manual
Page 97

4. Instrument API
4.1. Overview
Spirent Communications provides the SR5500 TestKit application as the Graphical User
Interface (GUI) for advanced control of the SR5500 resources. SR5500 TestKit is the
recommended control interface for the SR5500. Additionally, Spirent Communications
provides the SR5500 Wireless Channel Emulator Instrument API (Application
Programming Interface). This is provided for developers who want to remotely control the
SR5500 directly, for example within proprietary control applications or automated test
environments.
Previously, the remote control interface consisted of the proprietary user command set. A
remote control application was required to transmit individual commands to the unit to
configure it. This required individual development of the drivers. For the SR5500, this
remote control interface is replaced with the advanced Application Programming Interface
(API) interface. An API is a library of programming objects, routines, and other building
blocks provided to a programmer in a widely-accepted format to access resources
required for building a complete application. It is no longer necessary to develop your own
drivers. The API provides a higher level of functionality than the command set approach
and buffers you from the implementation complexities of configuring the unit.
The SR5500 WCE-IAPI is provided in the Dynamic Link Library (DLL) format which is
commonly used by developers and easily integrated into any project. A DLL is a collection
of small programs that provide access to resources. These programs are only loaded into
RAM for use when called upon by the application.
This DLL is released in the form of a .NET DLL. .NET is a Microsoft initiative for next
generation software development..NET is a language-neutral development environment
where developed code modules are targeted for the .NET Framework rather than for a
particular hardware and operating system combination. As a result a DLL developed in
.NET is designed to run on any system supporting the .NET Framework. This Framework
consists of a suite of class libraries and a runtime execution engine for .NET-based
programs.
NOTE: The SR5500 version 1.20 software release has changed the interface to
the Spirent API from “Spirent.WirelessChEmulator” to
“Spirent.Gen2.WirelessChEmulator”. The older interface will be supported for a
limited time to support customers with code compiled with the Rev 1.11 API.
This can be done by installing the “binary compatible” API. New users and users
in development environments should switch over to the new API immediately
and not install the “binary compatible” version.
Page 98

90 | SR5500 Operations Manual
4.2. Benefits and Features
The SR5500 Instrument API is an advanced Application Programming Interface for remote
control of the SR5500, providing substantial advantages over a traditional remote
command interface. Some of the benefits of the API are:
• Allows for easy integration of SR5500 control into user’s proprietary instrument
control applications, with all the common benefits of development with a DLL in an
integrated development environment.
• Simplifies the control of a very complex system with the provision of simple control
interfaces which intuitively group parameters and functionality by type; while hiding
the complexities of parameter interdependencies, control optimization algorithms,
communication details, etc.
• Provides extensive online Hyperlinked help resources.
Specific SR5500 control features include:
• Intuitive partitioning of system, channel and path configuration resources.
• Range and type checking for all parameters.
• Structured error handling and logging.
• Subscribe-able event structure (for parameter dependency warnings, etc.).
• Advanced control mechanisms such as file recall.
• Driver trace utility for development debug.
• Driver and instrument identity and option resources.
• File recall functionality for one-step system configuration.
4.3. Development Environments
The API is released in the form of a .NET DLL (dynamic link library) and is intended for use
in a .NET programming environment such as Visual Studio .NET which supports
development languages such as Visual Basic .NET, Visual C++ .NET and Visual C# .NET.
Use of the API requires installation of the .NET framework.
The DLL can also be used in a COM (Common Object Model; Microsoft’s pre-cursor to the
.NET Framework) development environment such as Visual Studio 6.0, LabView,
LabWindows/CVI etc.
4.4. API Usage Example
The SR5500 API is intuitively designed to facilitate a quick ramp-up for developers
adopting the API. To illustrate the ease of use of the SR5500 API for configuring the
system, the following sample code extract is provided (in VB.NET). The example illustrates
the intuitive hierarchical structure, the simplicity of the interface and the descriptive
naming convention employed.
Page 99

Chapter Four: Instrument API | 91
This example configures a single RF channel with 2 Rayleigh faded paths, the second path
being delayed by 2 µs. Comments are included to explain the upcoming line of code.
'instantiate fader object
Dim myFader As New Spirent.Gen2.WirelessChEmulator.SR5500
'Clear away any currently allocated channel resources
myFader.ClearChannels()
'create 1 RF channel (RF1input-to-RF1 output); assign all paths to
this channel;
AddChannel(myFader, ChanInputSourceType.RF1,
ChanOutputSinkType.RF1, 24)
'set a 900MHz Carrier frequency (in Hz); Note that channels are
indexed from ‘0’
myFader.Channel(0).CarrierFrequency = 900000000
'set input level to -15dBm and output level to -45dBm
myFader.Channel(0).ChanInputLevel = -15
myFader.Channel(0).ChanOutputLevel = -45
'Enable 2 paths; Note that paths are indexed from ‘0’ also
myFader.Channel(0).Path(0).IsEnabled = True
myFader.Channel(0).Path(1).IsEnabled = True
'enable Rayleigh Fading on both paths:
myFader.Channel(0).Path(0).ModType = ModulationType.Rayleigh
myFader.Channel(0).Path(1).ModType = ModulationType.Rayleigh
'set the Doppler Velocity to 8km/h on both paths:
myFader.Channel(0).Path(0).FadingDoppVelocity = 8
myFader.Channel(0).Path(1).FadingDoppVelocity = 8
'set delay of the second path to ‘Fixed’ delay with a value of 2us
myFader.Channel(0).Path(1).DelayMode = DelayModeType.Fixed
myFader.Channel(0).Path(1).Delay = 2
'Connections Setup: 'set IP address
myFader.Comm.IPAddress = "192.168.0.7"
'call connect method to connect to unit and have the above
configuration automatically downloaded
myFader.Comm.Connect()
As can be seen from this simple example, the API is hierarchically and intuitively
structured with descriptive naming conventions to allow for easy adoption by developers
4.5. API Front Panel
The SR5500 API includes a utility designed to help verify that the code is configuring the
SR5500 properly. This utility is called the API front Panel. The API front panel displays the
current state of the API at any moment in time.
Page 100

92 | SR5500 Operations Manual
Invoking the API Front Panel
In order to invoke the API Front Panel, the following API method must be called:
MyFader.LauchAPIFrontPanel()
This opens the API Front Panel window.
NOTE: The API Front Panel Window will open in “minimized” mode. This keeps
the API Front Panel from taking up screen real estate until it is required.
How the API Front Panel Works
The API Front Panel automatically updates any parameter that you change in the code. If a
property is changed, the API will send an event to the API front Panel, which will update
this property on its GUI.
You can set and view many of the properties viewable in the API Front Panel. This feature
allows you to change these values while in a breakpoint or when deemed necessary. This
feature should be used with caution as it is possible to cause issues if the code is running
while making changes to the API Front Panel.
Since the API Front Panel generally responds only to changes in the API, the measured
power levels and overload conditions do not update unless you query these values in the
code. The values displayed are the result of the last query. Use the Refresh command in
the API Front Panel to force a query of these items.
Since the API front panel needs to respond to each and every API command sent, it slows
the rate of execution of the program. Use only when necessary.
4.5.1. The API Front Panel Window Components
4.5.1.1 Main Window
The main window displays some general information about the state of the API and of the
connected SR5500. The current frequency for each channel displays, along with the state
of the set and measured input and output levels. The Bypass state also displays.
 Loading...