

Spectrum Technologies WatchDog 2400, WatchDog 2425, WatchDog 2450, WatchDog 2475 Product Manual
Page 1
2000 Series
®
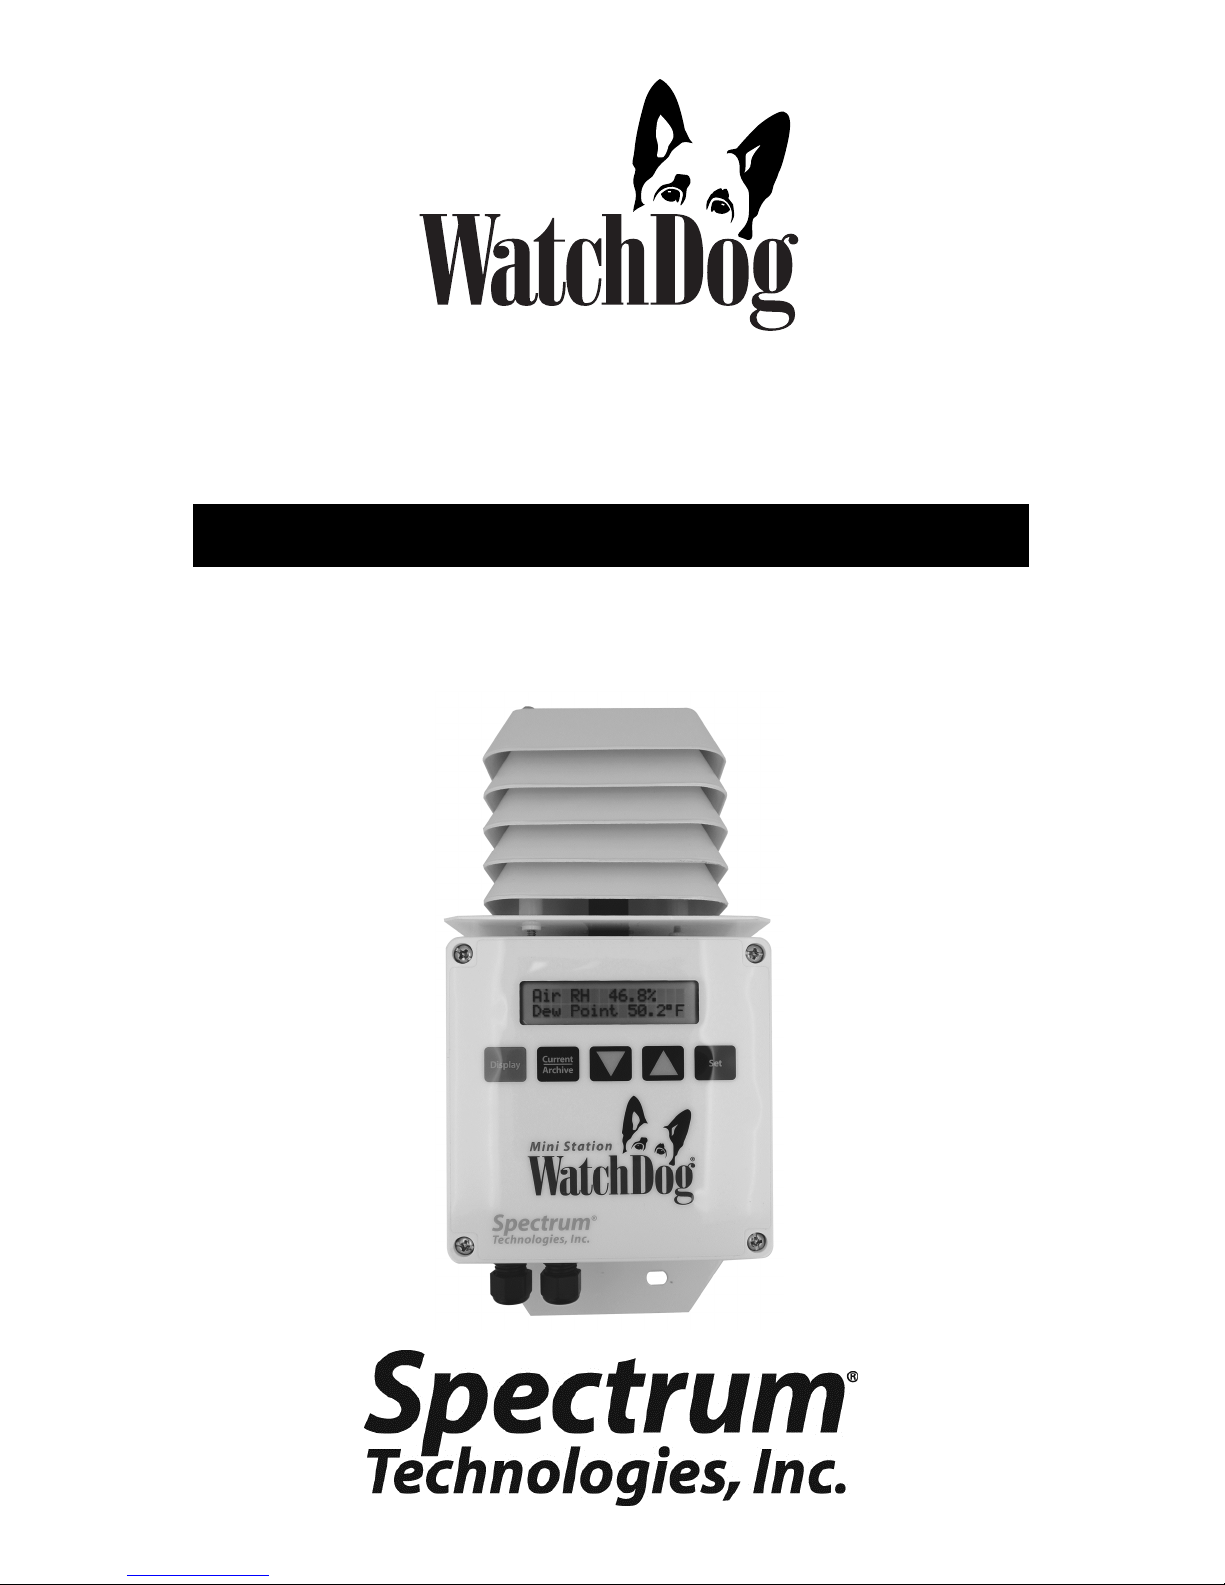
Mini Stations
PRODUCT MANUAL
Model #’s
2400, 2425, 2450, 2475
1
Page 2

CONTENTS
General Overview 4
Specifications for Internal Sensors 5
External Sensors 6
Station Installation 8
Configuring the Data Logger 9
Connecting to a PC/ Battery Replacement 10
Clearing the Loggers Memory 11
Keypad Display 12
Setting the Time and Date 13
Setting the Display Units 14
Setting the Degree Day Counter 15
Setting the Chill Hour Counter 16
Resetting the Disease Models 17
Archives 18
Screens 20
Degree Days/ Chill Hours 22
Activating Optional Disease Models 23
2
Page 3

Light 25
Plant-Specific Light Requirements 26
General Light Requirements 28
DIF 29
VPD 30
Grape Powdery Mildew 32
Grape Mills Table 33
Grape Black Rot 34
Apple Scab/Apple Sooty Blotch 35
Apple Mills Table 36
Tom Cast 38
References 39
CE Declaration of Conformity 40
3
Page 4

General overview
Thank you for purchasing a WatchDog 2000 Series Mini
Station. The loggers are completely waterproof and feature 12-bit resolution for higher accuracy. The loggers
can be accessed at different times by multiple users because the data is not cleared from memory following a
download. The 2000-Series Mini Stations can communicate via direct-wire, radio or telephone connections.
Current weather conditions, historical data, and computed
parameters are easily viewed on the station’s LCD screen.
The internal electronics calculate Growing Degree Days
(GDD) for up to three degree day counters. For example,
one counter can be activated at planting while another can
track the development of insects. The station calculates
Chill Hours, which is the total amount of hours during
which temperatures have been below a specified low temperature. The station LCD can also be programmed to
display a variety of plant disease infection potentials. The
arrow keys allow you to scroll through the sensor readings, Degree Day/Chill Hour calculations as well as set
your temperature ranges.
4
Page 5
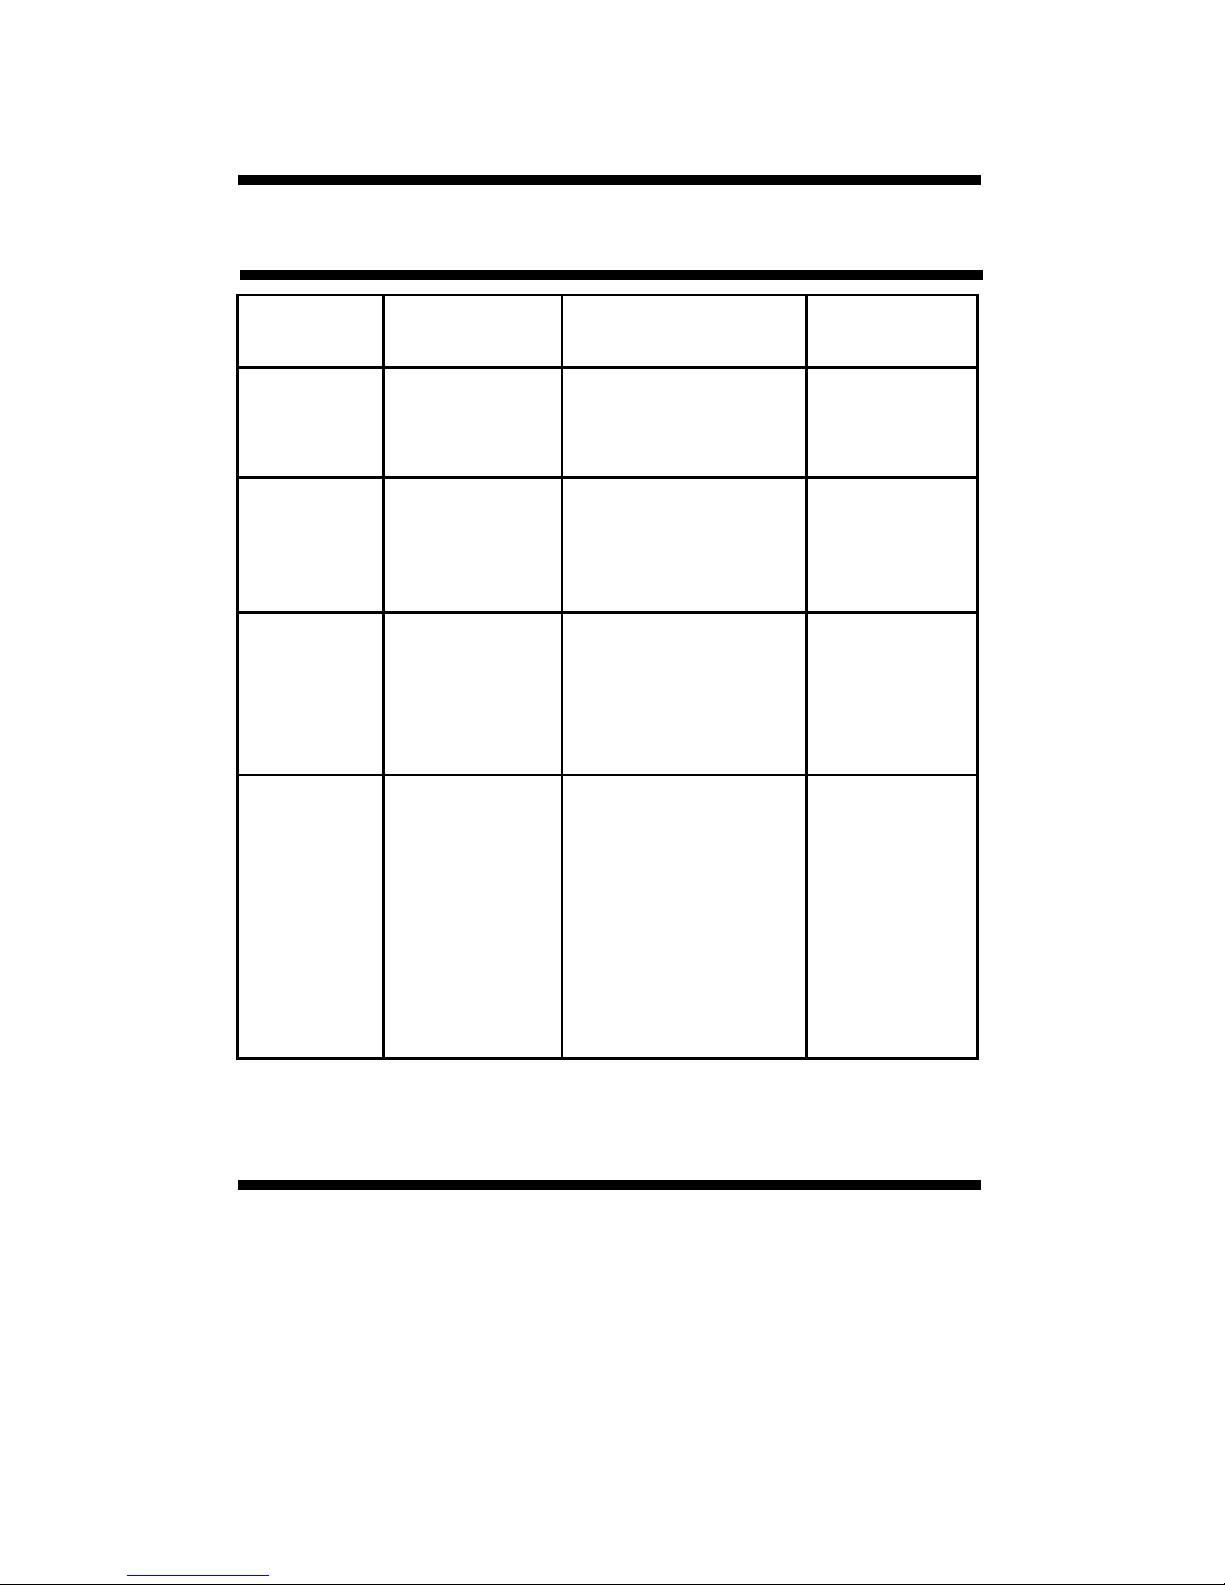
Specifications
Internal sensors
Model # Internal
Sensors
2400
2425
2450
2475
Temperature
Temperature
Temperature
None
- - - - - - -
Humidity
- - - - - - -
Humidity
- - - - - -
PAR Light
Measurement
Range
N/A
-25° to 212°F
-32° to 100°C
-25° to 212°F
-32° to 100°C
- - - - - - - - -
10% to 100%
@ 5 to 50C
-25° to 212°F
-32° to 100°C
- - - - - - - - -
10% to 100%
@ 5 to 50C
- - - - - - - - -
0 to 2500 µmol/m2/s
Accuracy
N/A
±1°F
±0.6°C
±1°F
±0.6°C
- - - - - - - ±3%
±1°F
±0.7°C
- - - - - - - ±4%
- - - - - - - ±5%
Operating Temperature Range: -22° to 130°F (-30° to 55°C)
Logger Capacity
The WatchDog 2000 Series Mini Stations can log up to
8800 data intervals. This represents 198 days at 30
minute intervals, 99 days at 15 minute intervals, or other
proportionate capacities. When the station reaches
capacity, it wraps and begins recording over the oldest
data. It is important to download data within the
appropriate days to ensure no data is lost.
5
Page 6
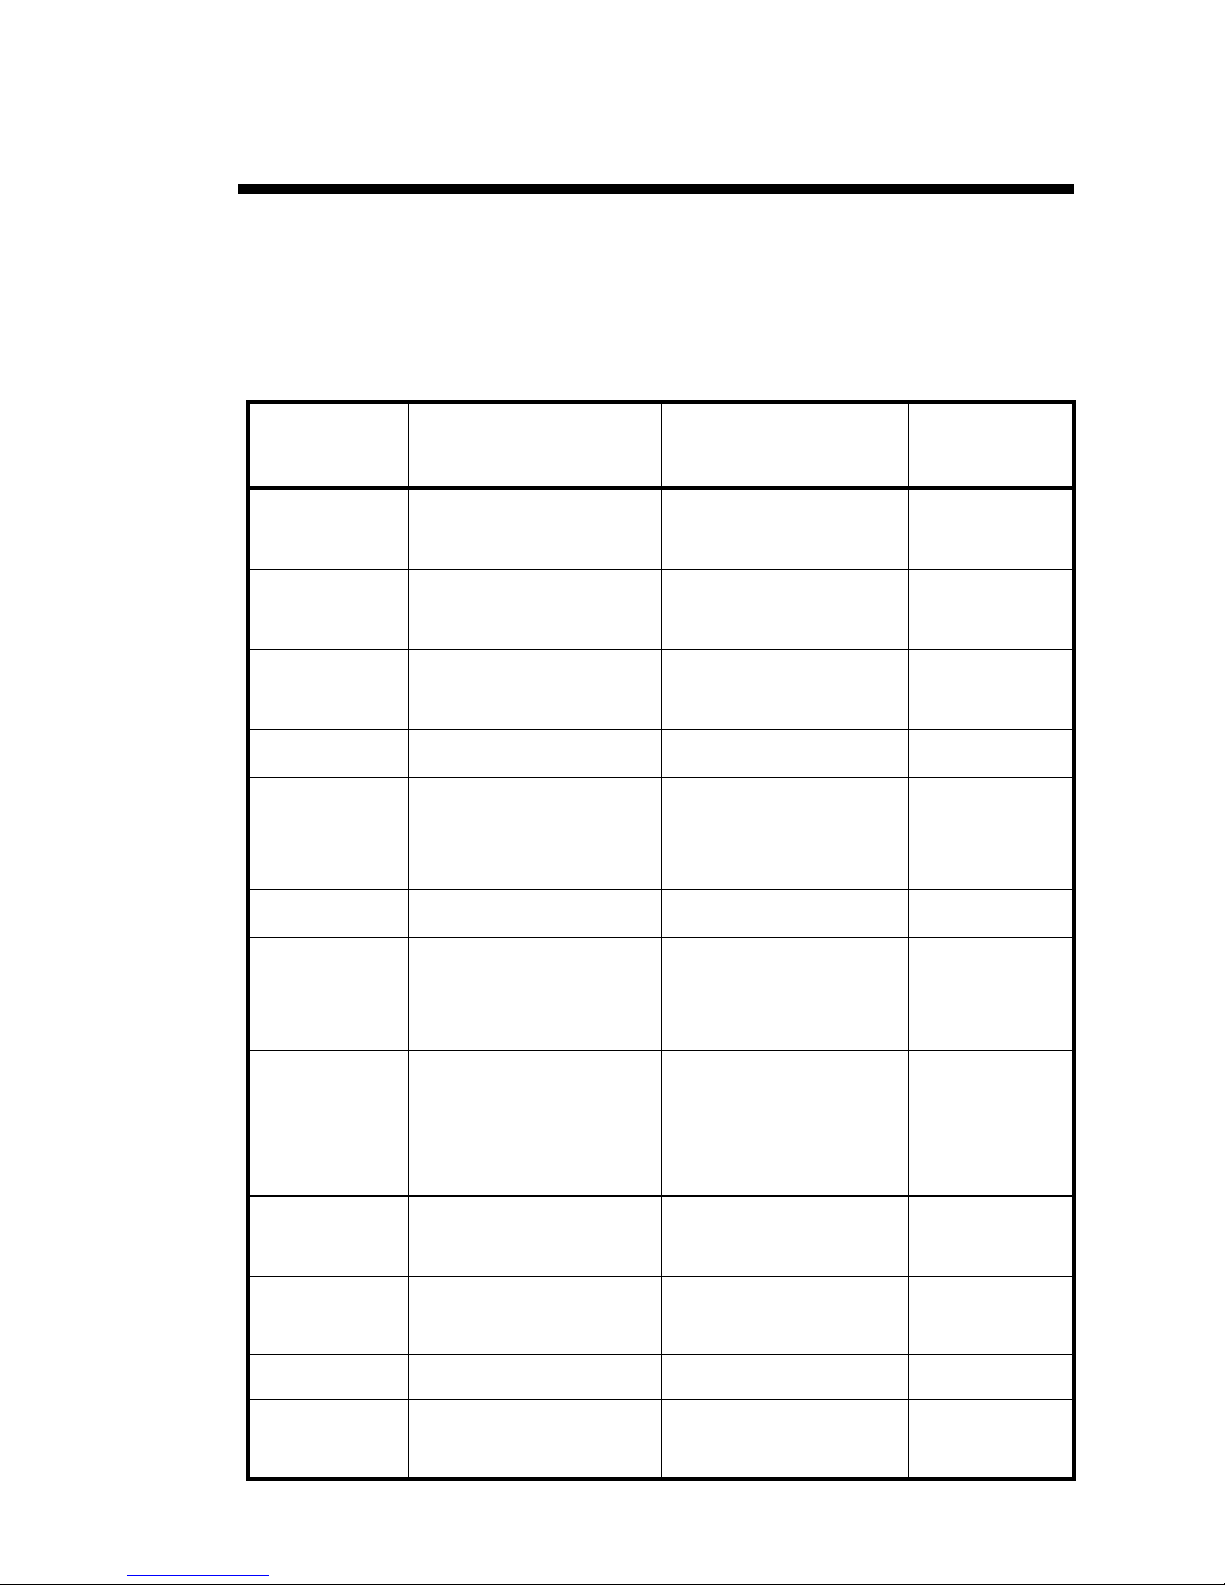
External Sensors
All WatchDog 2000 Mini Station models have external channels (ports)
for additional sensor input. The following table lists some of the
available optional sensors. See www.specmeters.com for a complete
list. Most sensors include a 6-foot cable with pin-type connector.
Items 3667-20, 6460-20, 6470-20 and 6450WD20 have 20 foot cables.
Item #
Description
Accuracy
Range
Measurement
3665R
3666
3667,
3667-20
3670i Silicon Pyranometer 1-1250 W/m2 ±5%
3668i,
3668i3,
3668i6
3676i UV Light Sensor 0-200 µmol m-2s
6460,
6460-20
Tipping Bucket
Rain collector
Leaf Wetness
Sensor
External (Soil)
Temperature Sensor
Quantum Light
Sensor and Sensor
Bars
WaterScout SM 100
Soil Moisture Sen-
sor
N/A ±2%
0(Dry) - 15(Wet) N/A
-40 to 185ºF
-40 to 85ºC
0-2500 µmol m-2s
0% to saturation
(typically 50%)
-1
-1
±1.1°F
±0.6°C
±5%
±5%
±3%
6470, 6470-
20
3669
6450WD
6450WD20
6451 Irrigation Sensor Switches at 5 psi ±1 psi
3673
3674
6
WaterScout SMEC
300 Soil Moisture/
EC/Temperature
Sensor
Soil Moisture
Transducer
Watermark Soil
Moisture Sensor
Input Cables for
user-supplied sensor
VWC: 0% to sat.
EC: 0 to 10 mS/cm,
Temp: 0 to 122 °F
(-18 to 50 °C)
0-100 kPa ±2%
0 - 200 cbars N/A
0-2.5V
4-20mA
VWC” ±3%
Temp: ±1.4
EC: ±2%
°F (0.8 °C)
±0.005V
±1%
Page 7
External Sensors (cont.)
To connect the external sensor to the station, plug the sensor
cable into the station port that has been programmed for that
particular sensor.
Port A is the only channel that will record rainfall data.
Program each channel (port) to a specific sensor through the
SpecWare launch screen. Refer to the SpecWare Software
User’s Guide for more detailed instructions on launching and
sensor configuration.
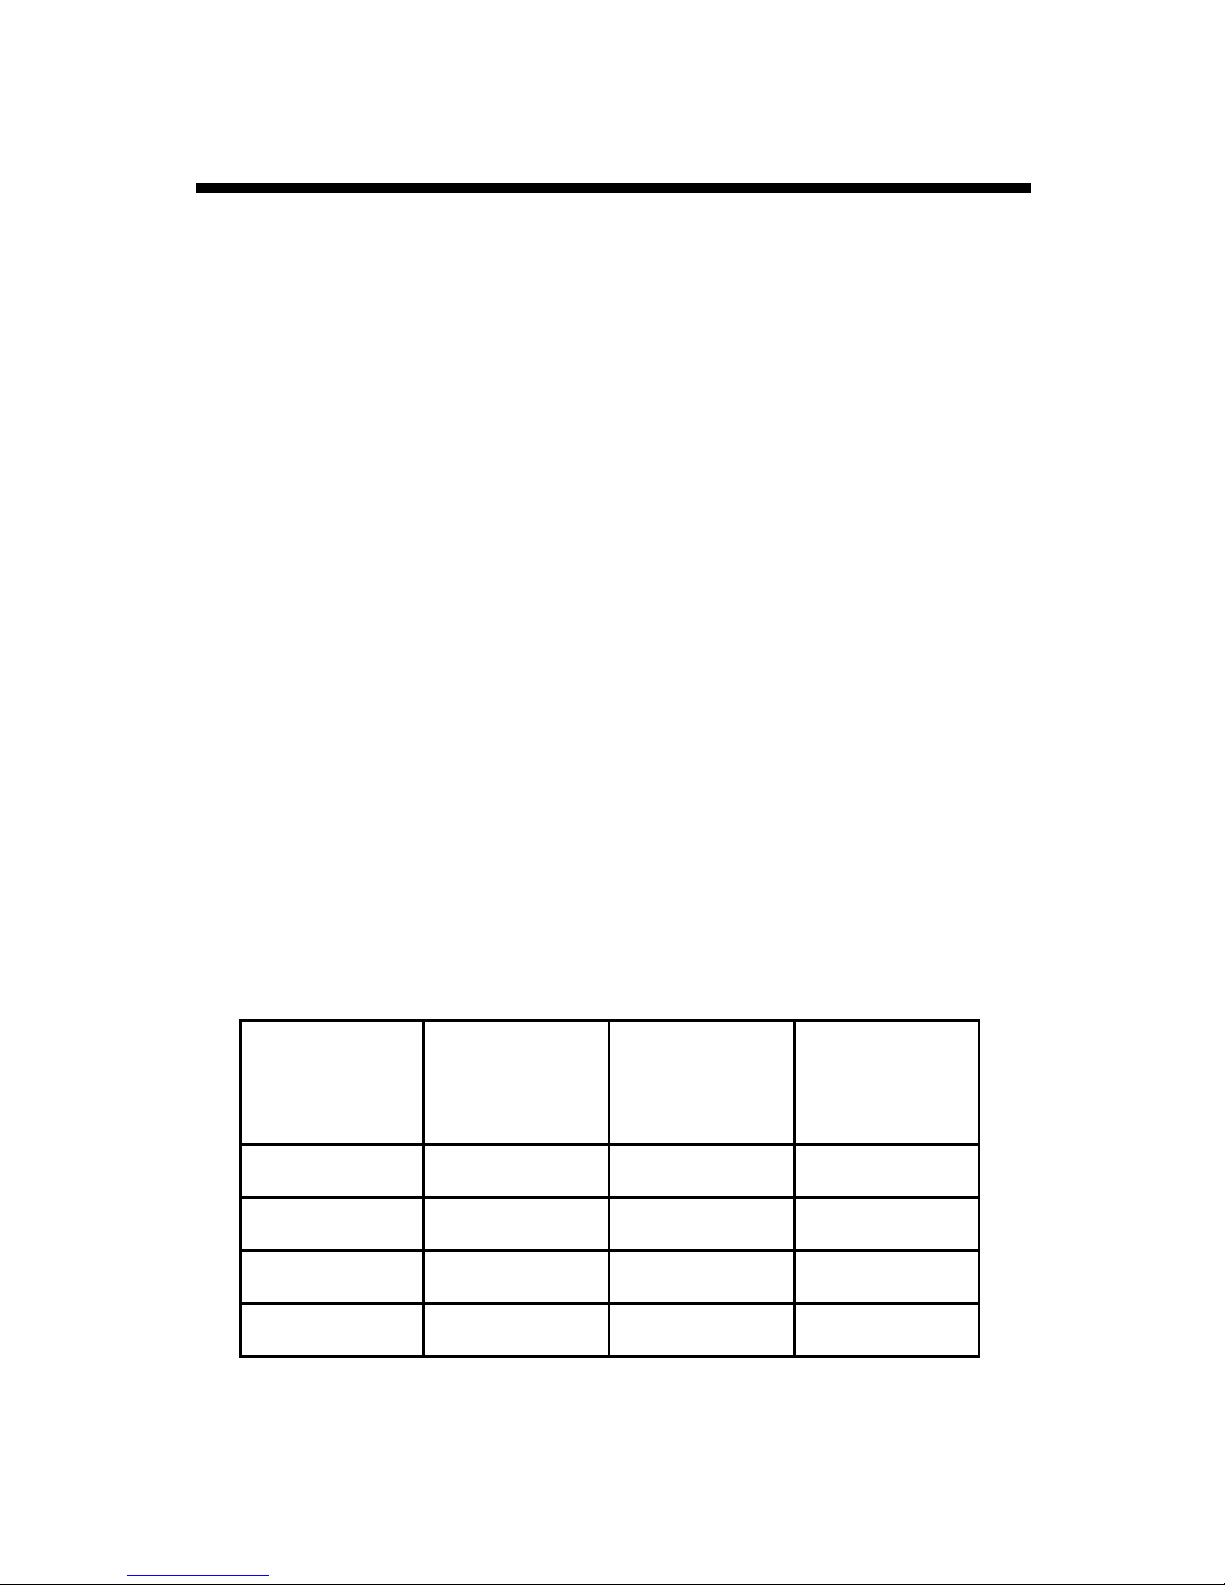
For a Weather Station to be compatible with the SMEC300 sensor, SpecWare software version 9.04 or later is required. See the
following table for the earliest compatible firmware and number
of sensors that can be used per station type.
Using SMEC 300 sensors will reduce the logging capacity.
When using 30 minute intervals, the logger will hold 89 days of
of data rather than 198. Be sure to download data more often.
Weather
Station
2475 3.9 1 A
2450 3.9 2 A, B
2425 3.9 3 A, B, C
Firmware
Version
Number of
Sensors
Available
Channels
2400 3.9 4 A, B, C, D
7
Page 8

Station Installation
The data logger has the versatility to be located in any
micro-climate for recording weather data. Hardware is
included for attaching it to a 1” to 1¼” outside diameter
mast (pipe). Use a 5’ - 10’ length of conduit or pipe as the
mast mount. When purchasing and/or cutting the mast to
size, plan on placing 1½’ - 2’ of the mast into the ground.
It can also be mounted to a wooden post with the screws
that are provided.
For all models (except model 2400), the radiation shield
protects the temperature sensor from solar radiation and
other sources of reflected heat. If other sensors are connected, secure the sensor wires to the mast just below the
display module with a plastic tie. This will make the
wires less vulnerable to being accidentally severed during
the season.
8
Page 9
Configuring the
Data Logger
The 2000-Series data logger does not have a button or
switch for powering up and down. Instead, the device is
operational whenever the batteries are installed. The loggers are shipped with default logging settings that can be
modified with SpecWare software (see SpecWare User’s
Guide for details). Once the logger is configured, it will
retain those settings even after the battery is removed or
replaced.
One new feature of the WatchDog 2000-Series loggers is
that they do not need to be relaunched after being downloaded. This allows greater flexibility for loggers that are
accessed by multiple users. Although, the logger stores
data on an interval set in SpecWare, the sensor readings
displayed on the LCD are refreshed every 20 seconds.
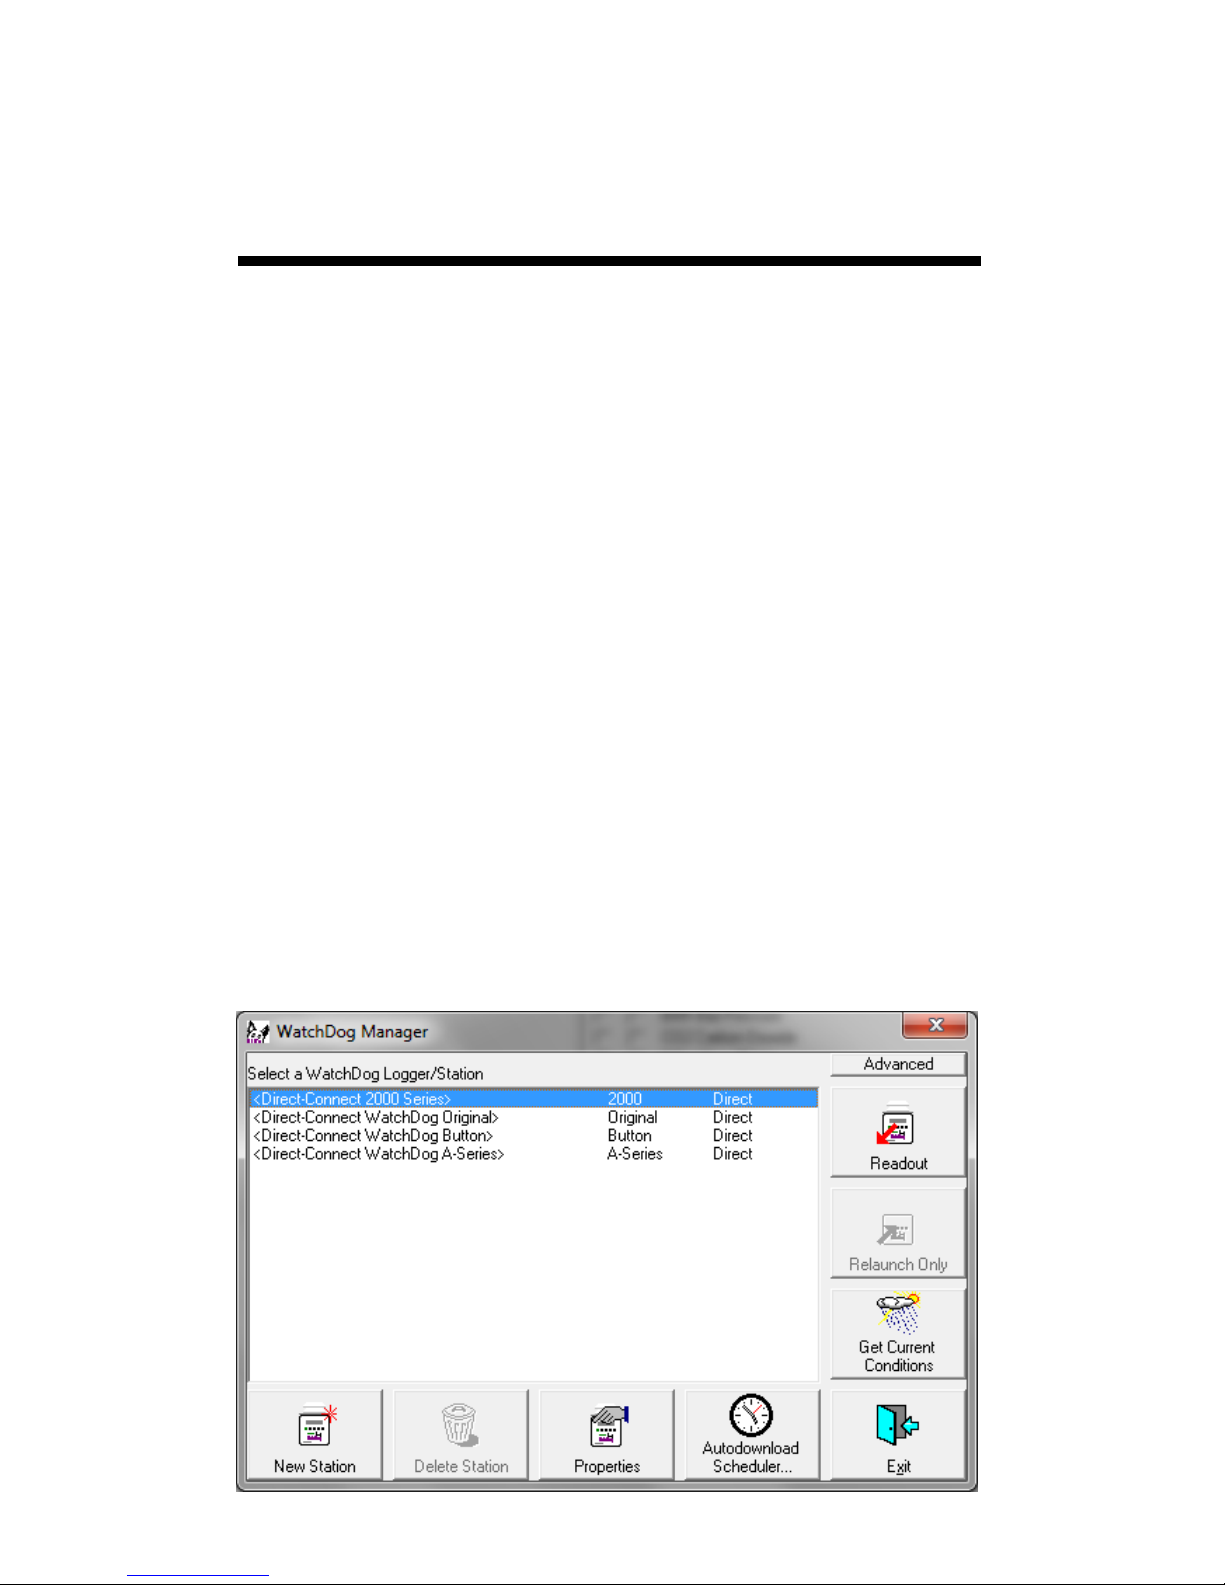
The 2000-Series data loggers are configured in the
WatchDog Manager screen of SpecWare software. Remember to identify the WatchDog type as 2000-series.
9
Page 10
Connecting to a PC/
Battery Replacement
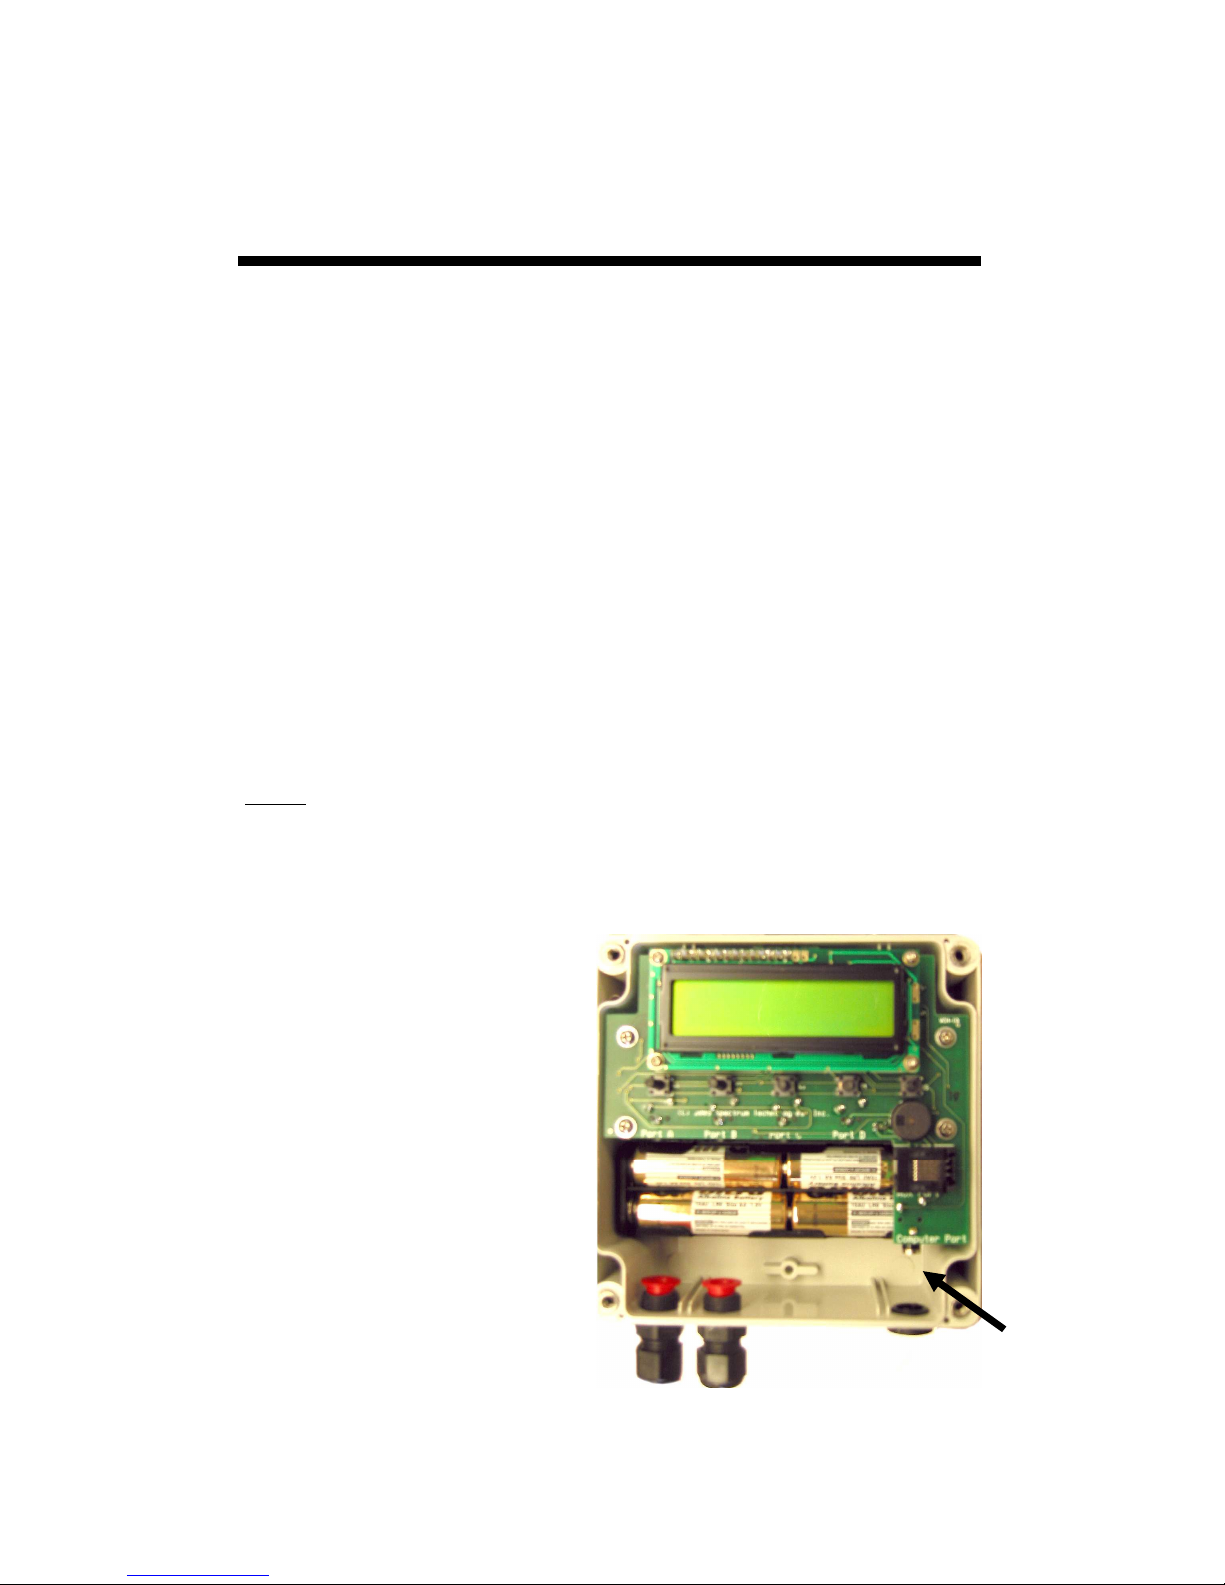
The computer port of the data logger is accessed by removing the plastic screw on the underside of the logger
(see fig. 1). The PC interface cable that accompanied
SpecWare software plugs into the serial jack inside the
logger casing.
The only time the logger needs to be connected to a computer is during a download and/or when a change is being
made to the logger configuration. The data is not erased
following a download, and the logger does not need to be
restarted. Please consult the SpecWare User’s Guide or
Spectrum Technologies’ online troubleshooting resource
if you experience difficulty connecting to the logger.
Whenever the batteries are replaced, the time and date
must be reset immediately so the data is time-stamped correctly. However, all settings related to Degree Days, Chill
Hours and IPM parameters (disease models, DIF, etc.) remain stored in the meter’s memory even when the batteries are removed.
The 2000 Series data loggers are powered by 4 AA
batteries. This will provide
enough power for 1 year of
continuous use. The battery compartment is accessed by removing the 4
Philips head screws on the
face plate (see fig 1).
Upon installation of the
PORT
batteries, the LCD should
illuminate and the logger
resume functioning. The
LCD will prompt you to set the date and time (see p. 11).
10
Figure 1
Page 11

Clearing the
Logger’s memory
The memory of the 2000-Series data logger is not automatically cleared when the logger is downloaded or the
batteries are replaced. The logger can be cleared manually through SpecWare software. This may be desired if,
for example, the logger is being shut down for the season
or is being moved to a new location.
Once the command is sent from SpecWare to clear the
memory, the data erasure is carried out automatically by
the logger itself. The PC interface cable can then be disconnected without affecting the process. A data erasure
will take several minutes to complete and the logger
cannot be contacted in the interim. Once the memory
is cleared, it is impossible to recover. SpecWare pro-
vides warning messages to prevent an accidental clearing
of the memory.
11
Page 12

Keypad/Display
The keypad of the 2000-Series data logger allows you to
scroll through all measured and calculated parameters
available on the LCD. It is necessary to use the keypad to
set the date and time for the data being stored in the longterm memory. This is the only keypad function that is also reflected in the data stored in the data logger. Otherwise, the data logger only records the measurements from
the sensors. Parameters calculated and displayed on the
LCD by the firmware (such as Growing Degree Days) are
only retained in the Daily and Monthly Archives (see Archives, p. 16). The functions of each of the keypad buttons are described in the following pages.
Pressing the Display key once brings the LCD display to
life. The screen will initially display descriptive information about the station. The screen then displays current
conditions. Current conditions are refreshed every 20 seconds. Pressing the Display key a second time will deactivate the display. The station continues to record data
when the display is not active. To conserve battery power, the display goes off after 2 minutes of inactivity.
12
Page 13

Setting The
Date and Time
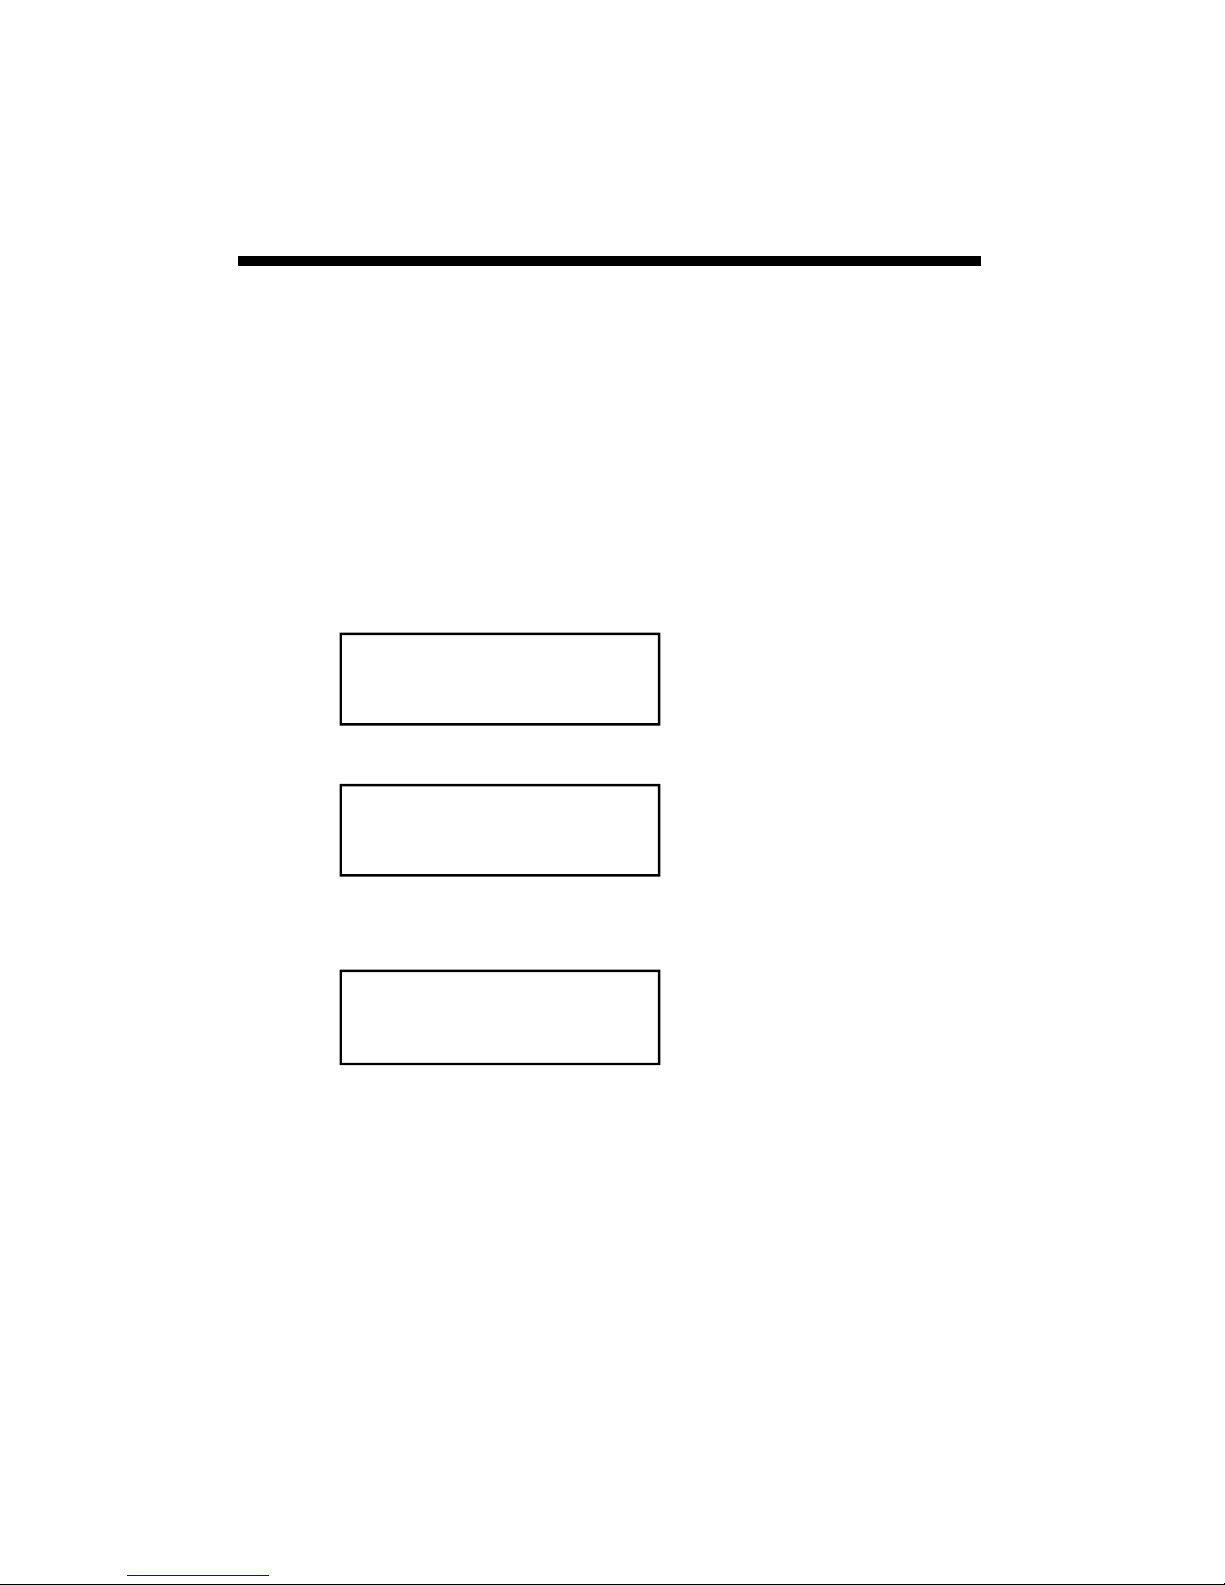
1. Press Display.
2. Press Set.
Select Parameter
To Be Set (↑↓)
3. Press the down arrow key once to reach the Time &
Date screen.
TIME & DATE
Press SET
4. Press Set.
09-22-13 11:45AM
Press SET
5. Press Set.
6. Enter the month using the arrow keys.
**-22-13 11:45AM
Press SET
7. Press Set.
8. Enter the year
9. Press Set.
10. Enter the day.
11. Press Set.
12. Enter the hour.
13. Press Set.
14. Enter the minutes.
15. Press Set.
16. Enter AM or PM.
17. Press Set.
13
Page 14

Setting The
Display Units
If the display is off, press Display to turn it on.
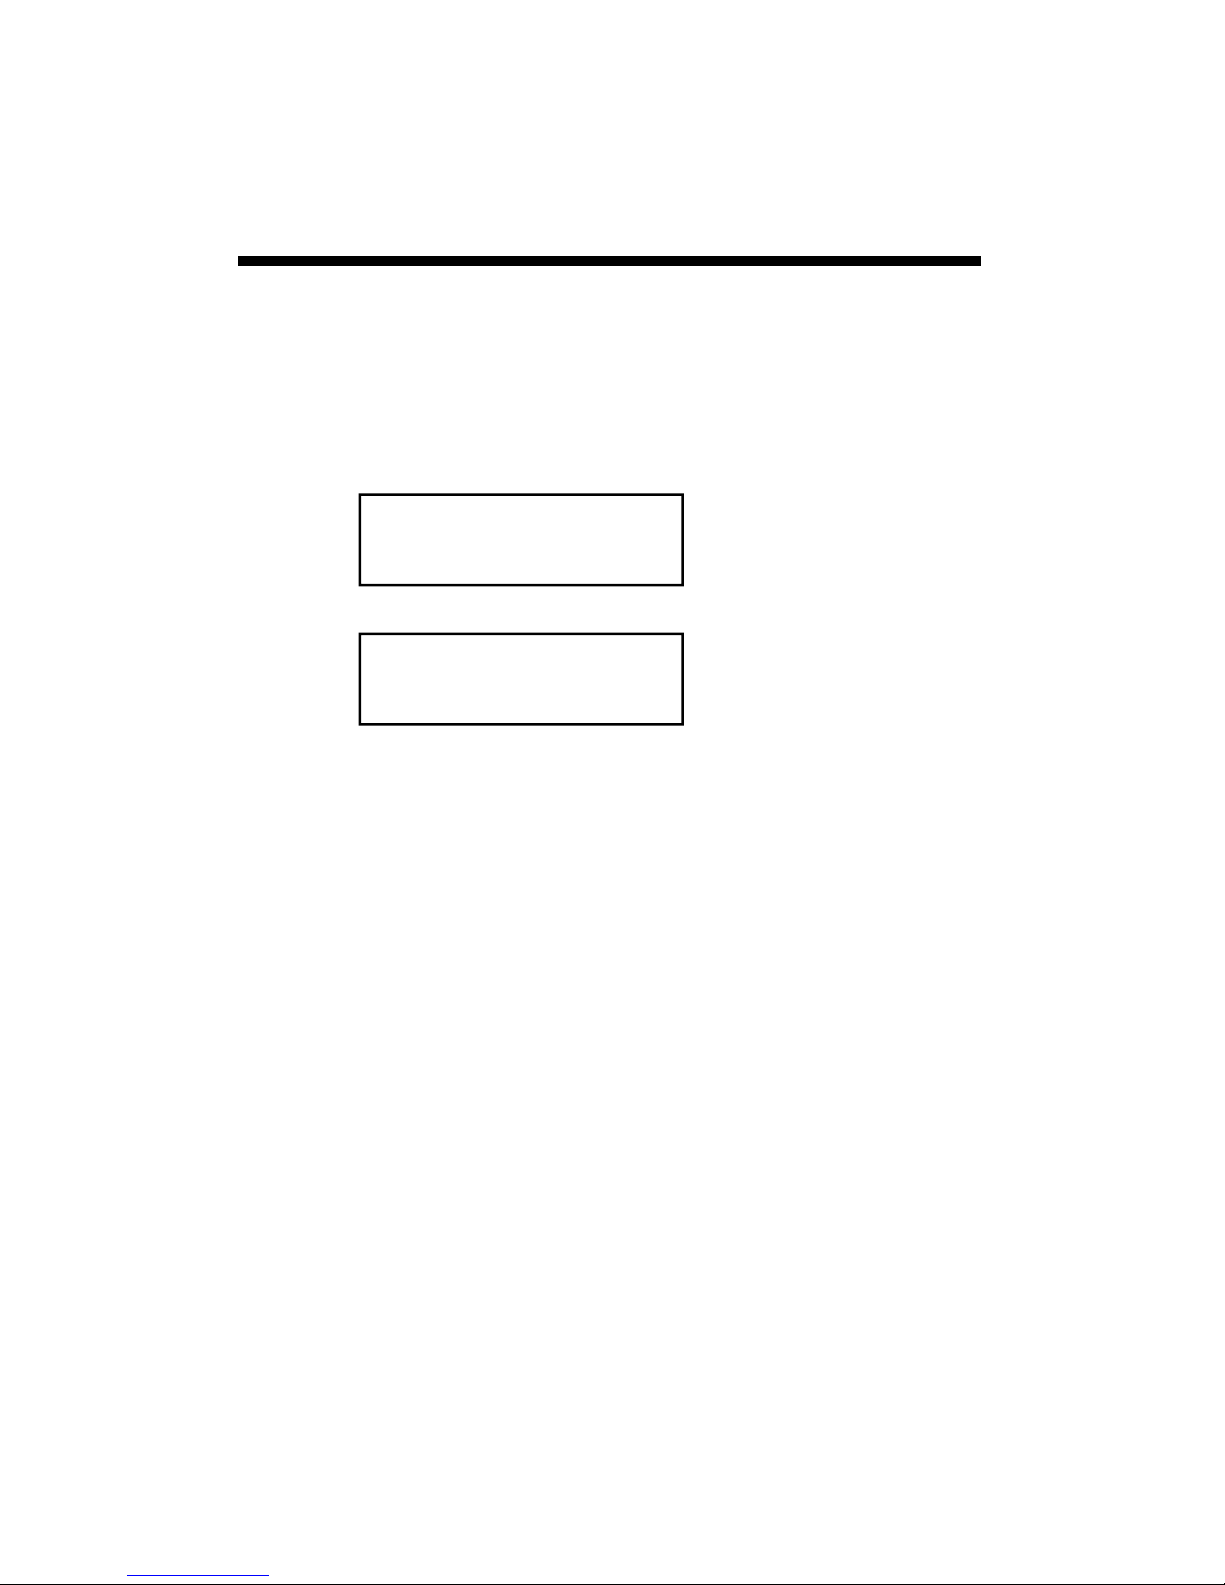
1. Press Set.
Select Parameter
To Be Set (↑↓)
2. Use arrows to scroll to display units.
DISPLAY UNITS
Press SET
3. Press Set.
4. Use the arrow keys to choose data in English or
metric units.
5. Press Set.
Note: The unit system used by the 2000-Series Data
Logger can be modified by both the keypad and by
SpecWare. Although it is advisable to have both the
software and firmware using the same unit system, it is
not required. SpecWare is equipped to handle situations where it receives data in a different unit system.
However, if you use SpecWare to change any of the
data logger’s configuration parameters (i.e. logging
interval), the data logger will also be reconfigured to
use the unit system used by SpecWare.
14
Page 15

Setting The
Degree-Day Counter
Caution: Be careful when entering a parameter update
screen for a degree day counter when that counter is enabled. If the Set key is pressed, the counter status will become modifiable and the archives WILL BE ERASED. If
this is not desirable, press one of the arrow keys instead of
the Set key to exit the screen.
If the display is off, press Display to turn it on.
1. Press Set.
Select Parameter
To Be Set (↑↓)
2. Scroll to Degree Day Counter #1 screen.
DEG DAY COUNT #1
Press SET
3. Press Set.
4. The counter will say DISABLED.
Counter: DISABLED
BASE=55 UPPER=55
5. Press Set.
6. Use arrow keys to scroll to “Start Now” option.
This will start the degree day counter. The other
option is DISABLED.
7. Use arrow keys to scroll to BASE.
8. Press Set.
9. Choose the base temperature using the arrow keys.
10. Press Set.
11. Choose the upper temperature limit using the arrow
keys.
12. Press Set.
15
Page 16
Setting The
Chill Hour Counter
Caution: Be careful when entering a parameter update
screen for a chill hour counter when that counter is enabled. If the Set key is pressed, the counter status will become modifiable and the archives WILL BE ERASED. If
this is not desirable, press one of the arrow keys instead of
the Set key to exit the screen.
If the display is off, press Display to turn it on.
1. Press Set.
Select Parameter
To Be Set (↑↓)
2. Scroll to the Chill Hour screen.
CHILL HOURS
Press SET
3. Press Set.
4. The counter will say DISABLED.
Counter: DISABLED
BASE=40
5. Press Set.
6. Use arrow keys to scroll to “Start Now” option.
This will start the degree day counter. The other
option is DISABLED.
7. Use arrow keys to scroll to BASE.
8. Press Set.
9. Choose base temperature using the arrow keys.
10. Press Set.
16
Page 17
Resetting Disease
Models
This option restarts the disease model calculations and
should be done at the beginning of the season.
If the display is off, press Display to turn it on.
1. Press Set.
Select Parameter
To Be Set (↑↓)
2. Scroll to the Reset Disease screen.
RESET DISEASE
Press SET
3. Press Set to reset the disease model.
4. The screen will go back to Current Values and the disease model will be reset.
17
Page 18

Archives
The data logger features two archives that allow you to
look at historical data for that location. The archives are
regularly updated whenever the data logger is actively collecting data. The archives are accessed by pressing the
Current/Archive key.
Daily Archive
The Daily Archive retains the last 30 days of data. If the
battery power runs low, the logger’s firmware will stop
measuring and archiving data until the battery is replaced.
After using the arrow key to select a certain day from the
Daily Archive, the data logger will then cycle through all
the information stored for that day. This will include a
screen with the high and low temperatures for that day,
any active degree day counters and the average readings
for any sensors connected to the device. If a currently active Degree Day Counter was not active on that day, the
screen will say “No Data”.
Monthly Archive
The Monthly Archive retains 12 months of data. When a
month is selected, the data logger’s LCD will then cycle
through all the information stored for that month. This
will include a screen with high and low temperatures for
the month, degree day data and the cumulative rainfall (if
applicable) for that month. If a currently active Degree
Day Counter was not active at the end of a month, the
screen will say “No Data” for that month.
18
Page 19

Archives (Cont)
Note: If an active Degree Day counter is disabled or
reset, the entire archive for that counter will be erased
Disabling a Degree Day counter does not affect the
storing of data in memory and, thus will not affect any
of the SpecWare report functions.
Displaying Archives
If the display is off, press Display to turn it on.
1. Press Current/Archive once to bring up the daily archive.
2. Use the arrow keys to scroll to the date of interest.
DAILY ARCHIVE
Select Day (↑↓)
3. The unit will automatically scroll through all the
screens for that date.
4. Press Current/Archive again to bring up monthly summaries.
2/14/13
READING VALUES...
5. Use the arrow keys to scroll through the past 12
months of data.
19
Page 20
Screens
The following figures give examples of what each of the
various weather monitor screens look like.
-Initial information screen
Model 2450 v 1.1
Apple IPM Alert
This is the first screen that comes up when you turn on the
logger. It gives the model number, version number and
model description. This screen is from a Model 2450 version 1.1 with the apple disease model enabled.
-Current Values
Air Temp 74oF
Leaf Wet Hours 05
This screen shows the current air temperature and status of
the leaf wetness sensor (Dry or Wet) and the cumulative
number of hours for the day. The current temperature on
this screen is 74°F. The leaf wetness sensor is wet, and
there is a total number of 5 leaf wetness hours for the day.
-Daily High and Low Values
HI 74oF 01:58 PM
LO 66oF 03:05 AM
This screen shows the high and low temperature for the
day, along with the times at which they occurred. This
screen shows a high temperature of 74°F at 01:58 PM and
a low of 66ºF at 03:05 AM.
20
Page 21
Screens (Cont.)
-Degree Day Counter
DD #1 50-86o 16
Since 07/12 2125
This screen shows the information for Degree Day Counter #1. This counter is using a temperature range of 50 to
86°F. So far it has accumulated 16 Degree Days (DD) for
today’s date and has accumulated 2125 since the counter
was started or reset on July 3. Degree Days calculated by
the meter are not saved in memory. SpecWare uses stored
temperature data to produce its own Degree Day reports.
-Time, Date
-Battery Level
09-08-12 07:09PM
BATTERY AT 90%
This screen shows the current date, time and battery
strength. The current date is 09-08-12 and the time is
07:09 PM. The battery is at 90%.
-Disease Name
-Index Values
BLK ROT=NONE PM:
ASC=NONE CON=100
This screen shows the current disease risks. This screen
will be different for each of the disease models. (See
more detailed descriptions on pgs. 30-36) This screen
shows no risk for Black Rot, no risk for ascospore infection, and a conidial index of 100.
21
Page 22

Degree Days/Chill
Hours
Degree Days
Temperature is a key factor contributing to the development of plants, insects and plant diseases. Degree Days
are a way to quantify the amount of heat that is available,
which is a function of the time the temperature is within a
given temperature range. For example, if the base temperature is determined to be 40 degrees and the actual temperature is 41 degrees for 24 consecutive hours, one Degree Day is said to have accumulated (41 – 40 = 1 degree
for 24 hours or 1 day). Degree Days indicate the developmental stage of a pest generation. This allows for more
precise pesticide recommendations.
The logger’s firmware calculates Degree Days using the
integral method. Degree Day values are calculated at 15
minute intervals to produce Degree Quarter-Hours (DQH),
which are then summed over a full day. DQH are calculated as follows:
DQH = T
avg
- T
base
Where T
interval and T
is the average temperature over the 15-minute
avg
is the base temperature. If the average
base
temperature is greater than the upper limit of the temperature range, the upper temperature limit is used instead of
the average temperature when calculating DQH. If the
average temperature is less than the base temperature,
DQH is set equal to zero for that interval.
Chill Hours
Chill hours are calculated as the amount of time spent below a base temperature. Chill hours accumulations are
used to estimate dormancy for tree fruit.
22
Page 23

Activating Optional
Disease Models
If you have purchased a disease model option for the 2000
Series data logger, this option must be activated with
SpecWare. This will require an authorization code that
can be obtained by calling Spectrum Technologies. You
will be asked for the Serial and Registration numbers that
appear on the “Spec9 Pro” information screen (see figure
below). This screen is brought up by selecting the “About
SpecWare” option from the Help menu on the SpecWare
main screen.
Once a disease model has been activated on a station, the
infection risk will be available on the LCD at all times.
Once the data is downloaded, more complete reports can
be run within SpecWare itself. Only one disease model
can be activated on a logger at a time, but there is no limit
on the number of disease reports or plant growth reports
that can be run within SpecWare.
23
Page 24

Activating Optional
Disease Models (Cont.)
All disease models require, at least, air temperature and
leaf wetness data. Therefore, an additional leaf wetness
sensor must be purchased and connected to port B on the
logger. If a model 2400 is set for disease models a temperature sensor needs to be plugged in to port D.
Setting the Disease/Report mode is done using the
"Report" pulldown on the Properties screen within the
WatchDog Manager in SpecWare.
The available disease models are described in pages 30-
36.
24
Page 25

Light
The quantum sensor approximates PAR light, the
radiation between 400 and 700 nanometers. These are the
most influential wavelengths for optimum plant growth.
PAR light is necessary for the plant to function properly.
Light requirements differ between crops, but the rule of
thumb is to allow the maximum amount of light possible.
Growers commonly apply shade to decrease temperature
and improve foliage. In some crops, such as tomatoes, the
yield has been shown to be directly proportional to the
amount of light. Limiting light may cause the stomates to
close which prevents the leaves from cooling off. The data logger monitors the light available and records it as
moles/day (Peet, 2002).
Moles/day is the unit for the Daily Light Integral (DLI);
the amount of light present during a day. The DLI varies
with the seasons, increasing in the spring and decreasing
in the fall. The greenhouse film and structure allow 3570% of the light to reach the plants. Environmental factors like dust and dew can also block light. Light transfer
is hard to assess using the human eye because it adjusts
immediately to the current light level. The only way to
verify light quantity is to use a light meter (Faust, 2002).
Installation of light sensors
- Position the sensor in an appropriate area to monitor
plant conditions.
- Make sure the quantum sensor is not being shadowed or
blocked.
- Use the bubble level to ensure the sensor is horizontal.
- Inspect the sensors frequently to make certain they are
clear of obstructions.
Contact your cooperative extension agricultural agent for
further suggestions on field placement.
25
Page 26

Plant-Specific
Light Requirements
Light quantity is measured in a daily light integral (DLI)
which refers to the total amount of light a plant receives in
one day. A plant requires a minimum DLI just like it requires a certain amount of rainfall. The following values
were obtained from a set of experiments performed at
Clemson University.
SPRING EXPERIMENT
The spring experiment measured plant development at 0%
shade (18 mol/day), 25% shade (12 mol/day), 50% shade
(6 mol/day), and 75% shade (3 mol/day).
Plant Commercially
Acceptable Quality
Begonia 6 mol/day 12 to 18 mol/day
Pansy N/A 18 mol/day
Marigold 6 mol/day N/A
Angelonia 12 mol/day 18 mol/day
Petunia N/A N/A
Impatiens 3 mol/day 6 to 12 mol/day
Highest Quality
26
Page 27

Plant-Specific
Light Requirements
SUMMER EXPERIMENT
The summer experiment measured outdoor plant development at 0% shade (38 mol/day), 50% shade (15 mol/day),
70% shade (6 mol/day), and 90% shade (3 mol/day).
Plant Commercially
Acceptable Quality
Agertum 15 mol/day > 15 mol/day
Vincia 7 mol/day N/A
Zinnia N/A 38 mol/day
Highest
Quality
FALL EXPERIMENT
The fall experiment measured outdoor plant development
at 0% shade (30 mol/day), 50% shade (13 mol/day), 70%
shade (8 mol/day), and 90% shade (3 mol/day).
Plant Commercially
Geranium 13 mol/day 30 mol/day
Melampodium 8 mol/day 30 mol/day
Acceptable Quality
Highest
Quality
27
Page 28

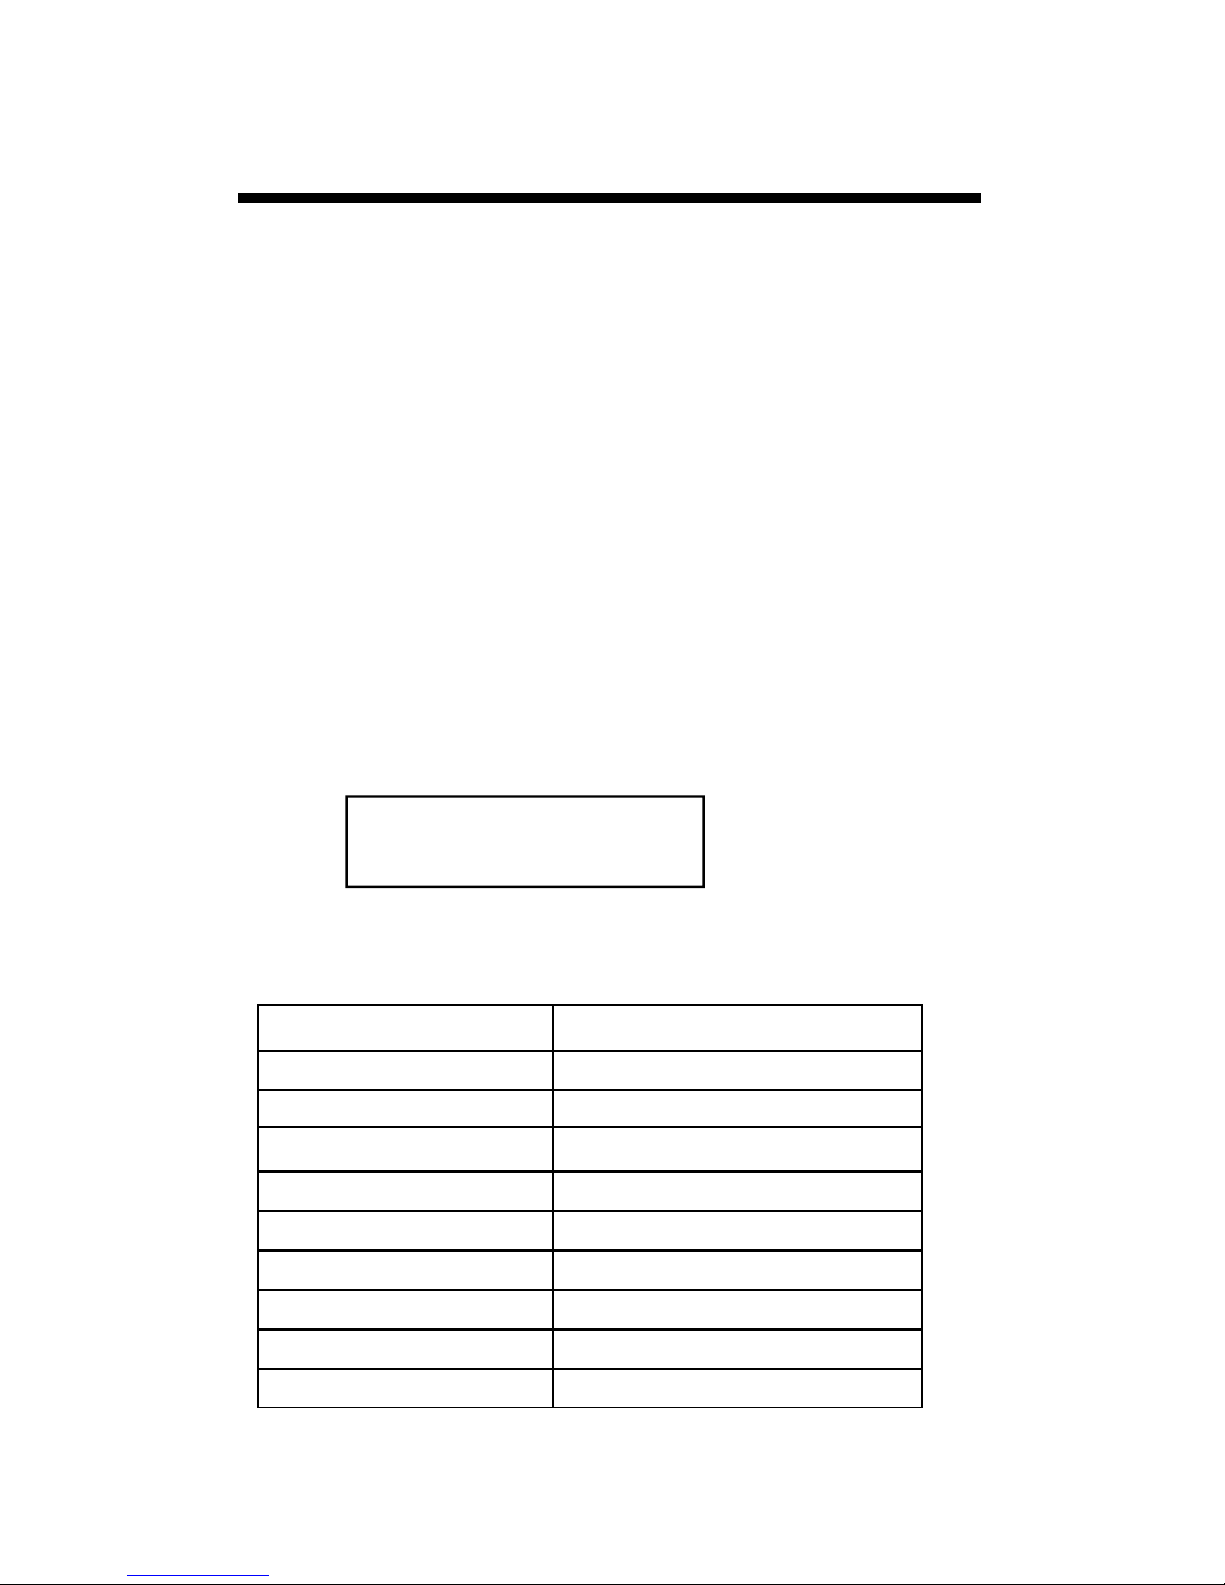
General Light
Requirements
Light Quantity
(Daily Light Integral-
DLI)
< 5 mol/day
5-10 mol/day
10-20 mol/day
Results
Produces poor quality plants
Produces commercially acceptable plants
Produces high quality plants for shade-
adapted species
Produces high quality plants
28
Page 29

Dif
The model 2475 includes temperature, relative humidity
and light sensors. This unit displays DIF, which is the
average day temperature minus the average night temperature. This value is used to determine stem elongation.
When day temperature is warmer than night temperature
(positive DIF value) plants will become taller. When day
temperature is cooler than night temperature (negative
DIF value) less stem elongation will occur.
To view a DIF report, select Reports in the dropdown
menu from Tools on the menu bar in SpecWare. Select
Plant Growth Report (DIF/DLI) in Standard Reports. Use
the Where and When tab to change the dates of data used
to generate the report, and the View Report tab to view
DIF values.
29
Page 30

VPD
The model 2475 Plant Growth Station displays VPD on
the unit. VPD can be calculated in SpecWare Custom Reports for all models. Firmware 3.8 and SpecWare 9 Pro or
higher is needed to use VPD.
VPD (vapor pressure deficit) is the difference between
how much water vapor is in the air and how much water
vapor the air can hold at saturation. It predicts the rate of
water vapor movement from the plant to the surrounding
air and is a useful tool in plant watering decisions.
To view a VPD report, select Reports in the dropdown
menu from Tools on the menu bar in SpecWare. Select
Custom Reports (see button to right of Standard Reports)
on the Select Report tab. Create a new Custom Report.
Assign a name and reporting interval.
30
Page 31

VPD (cont.)
Then, press the New Column button. Select RH, Primary,
and VPD. Press OK.
Use the Where and When tab to change the dates of data
used to generate the report, and the View Report tab to
view VPD values.
31
Page 32

Grape Powdery Mildew
This option predicts two infectious stages, an ascospore
stage and a conidial stage (Thomas, Gubler, and Leavitt
1994; Weber, Gubler, and Derr 1996) Ascospores are
released in the spring from the structure in which the
disease overwintered. Conidial spores are the result of an
ascospore infection. Ascospores cause primary infections
and conidial spores cause secondary infections. Your
State Agricultural Extension Service can advise you about
which stage is important in your area.
Ascospore Infection risk is determined using the daily
average temperature and the hours of leaf wetness. A
modified Mills Table (2/3 the original Mills leaf wetness
value) is used to determine the development of a ‘Heavy’
Ascospore Infection, the point at which treatment should
begin.
Three consecutive days with 6 consecutive hours of
temperatures between 70°F and 85°F are required to
initiate the Conidial Index. Thereafter, the index
increases by 20 with each day having six consecutive
hours between 70°F and 85°F. The index decreases by 10
on days with less than six consecutive hours in the range
of 70°F to 85°F and on days with a maximum temperature
greater than 95°F. The index will always be between zero
and 100.
Infection Severity Screen
BLK ROT=NONE PM:
ASC=NONE CON=010
This screen shows the risk for Black Rot and Powdery
Mildew. The Powdery Mildew ascospore infection is
none, and the conidial index is 10.
32
Page 33

Grape Mills Table
Hours of Leaf Wetness required
Daily Average
Temperature (F)
42 40
43 34
44 30
45 27.3
46 25.3
47 23.3
48-49 20
50 19.3
for heavy ascospore infection
(2/3 original Mills value)
51 18
52 17.3
53 16.7
54-55 16
56-57 14.7
58-59 14
60-61 13.3
62 12.7
63-75 12
76 12.7
77 14
78 17.3
Conidial Index:
0 - 30 = Light infection risk
40 - 50 = Medium infection risk
60 - 100 = Heavy infection risk
33
Page 34
Grape Black Rot
Black Rot is a disease caused by the fungus Guignardia
bidwelli. It overwinters in in old mummified berries. In
spring, the primary inoculum is released which starts the
initial round of infection. Those initial spores are dispersed by rain and wind. After the initial infection period,
secondary infections are spread by rain splash. This model predicts infection periods of Black Rot based upon the
Spotts model.
This model uses temperature and leaf wetness period to
estimate the onset of an infection period. The temperature
is compared with the period of leaf wetness needed to produce an observable infection. If the wetness period exceeds the required period for that temperature, the word
RISK will appear
Infection Severity Screen
BLK ROT=RISK PM:
ASC=NONE CON=010
This screen shows a risk for Black Rot as well as Powdery
Mildew. This screen shows a risk for Black Rot.
Temperature (F) Hours of Leaf Wetness
50 24
55 12
60 9
65 8
70 7
75 7
80 6
85 9
90 12
Source R.A. Spotts, Ohio State University
34
Page 35

Apple Scab
Apple Scab
Sootyblotch Flyspec
This option predicts the approximate “Infection Degree”
for Apple Scab. The infection severity (None, Light, Medium, or Heavy) is triggered by the accumulation of
sufficient hours of leaf wetness that occur between the
base and upper temperature limits. The Weather Tracker
uses the Mills Apple Scab model as modified by A.L.
Jones 1980. A modified Mills table is shown on the following 2 pages.
SBFS MILLS=NONE
000hrs WSU=NONE
This screen shows the infection risk for the day. The risk
on this screen is light. The apple scab risk is calculated
daily.
35
Page 36
Apple Mills Table
Approximate numbers of hours of wetting
required for primary apple scab infection
at different air temperatures
Average
Temp.
(°F) Light Medium Heavy
78 13 17 26
77 11 14 21
76 9.5
63 to 75 9
62 9 12 19
61 9 13 20
60 9.5 13 20
59 10 13 21
Degree of Infection (hrs)
12
12
19
18
58 10 14 21
57 10 14 22
56 11 15 22
55 11 16 24
54 11..5 16 24
53 12 17 25
52 12 18 26
51 13 18 27
36
Page 37

Apple Mills Table
Approximate numbers of hours of wetting
required for primary apple scab infection
at different air temperatures
Average
Temp.
(°F) Light Medium Heavy
50 14 19 29
49 14.5 20 30
48 15 20 30
47 15 23 35
46 16 24 37
45 17 26 40
44 19 28 43
43 21 30 47
Degree of Infection (hrs)
42 23 33 50
41 26 37 53
40 29 41 56
39 33 45 60
38 37 50 64
37 41 55 68
33 to 36 48 72 96
37
Page 38

Tom-Cast
This option uses Tom-Cast, a tomato disease forecasting
program designed to predict Early Blight, Septoria Leaf
Spot, and Anthracnose. (Pitblado ~1985; Bolkan and
Reinert 1994) Tom-Cast calculates a disease severity
value (DSV) to predict the development of these diseases.
An increasing number of leaf wetness hours and a higher
temperature cause the DSV to increase at a faster rate. A
Cumulative DSV of 15 to 20 is usually viewed as the
threshold for initiating a spray program. Contact your
State Agricultural Extension Service for further
information regarding disease management in your area.
Infection Severity Screen
TOMCAST DSV
DAY=2 ACCUM=010
This screen shows the DSV values for the day as well as
the accumulated DSV values. The daily DSV on this
screen is 2 and the number of DSV’s accumulated since
the reset is 10.
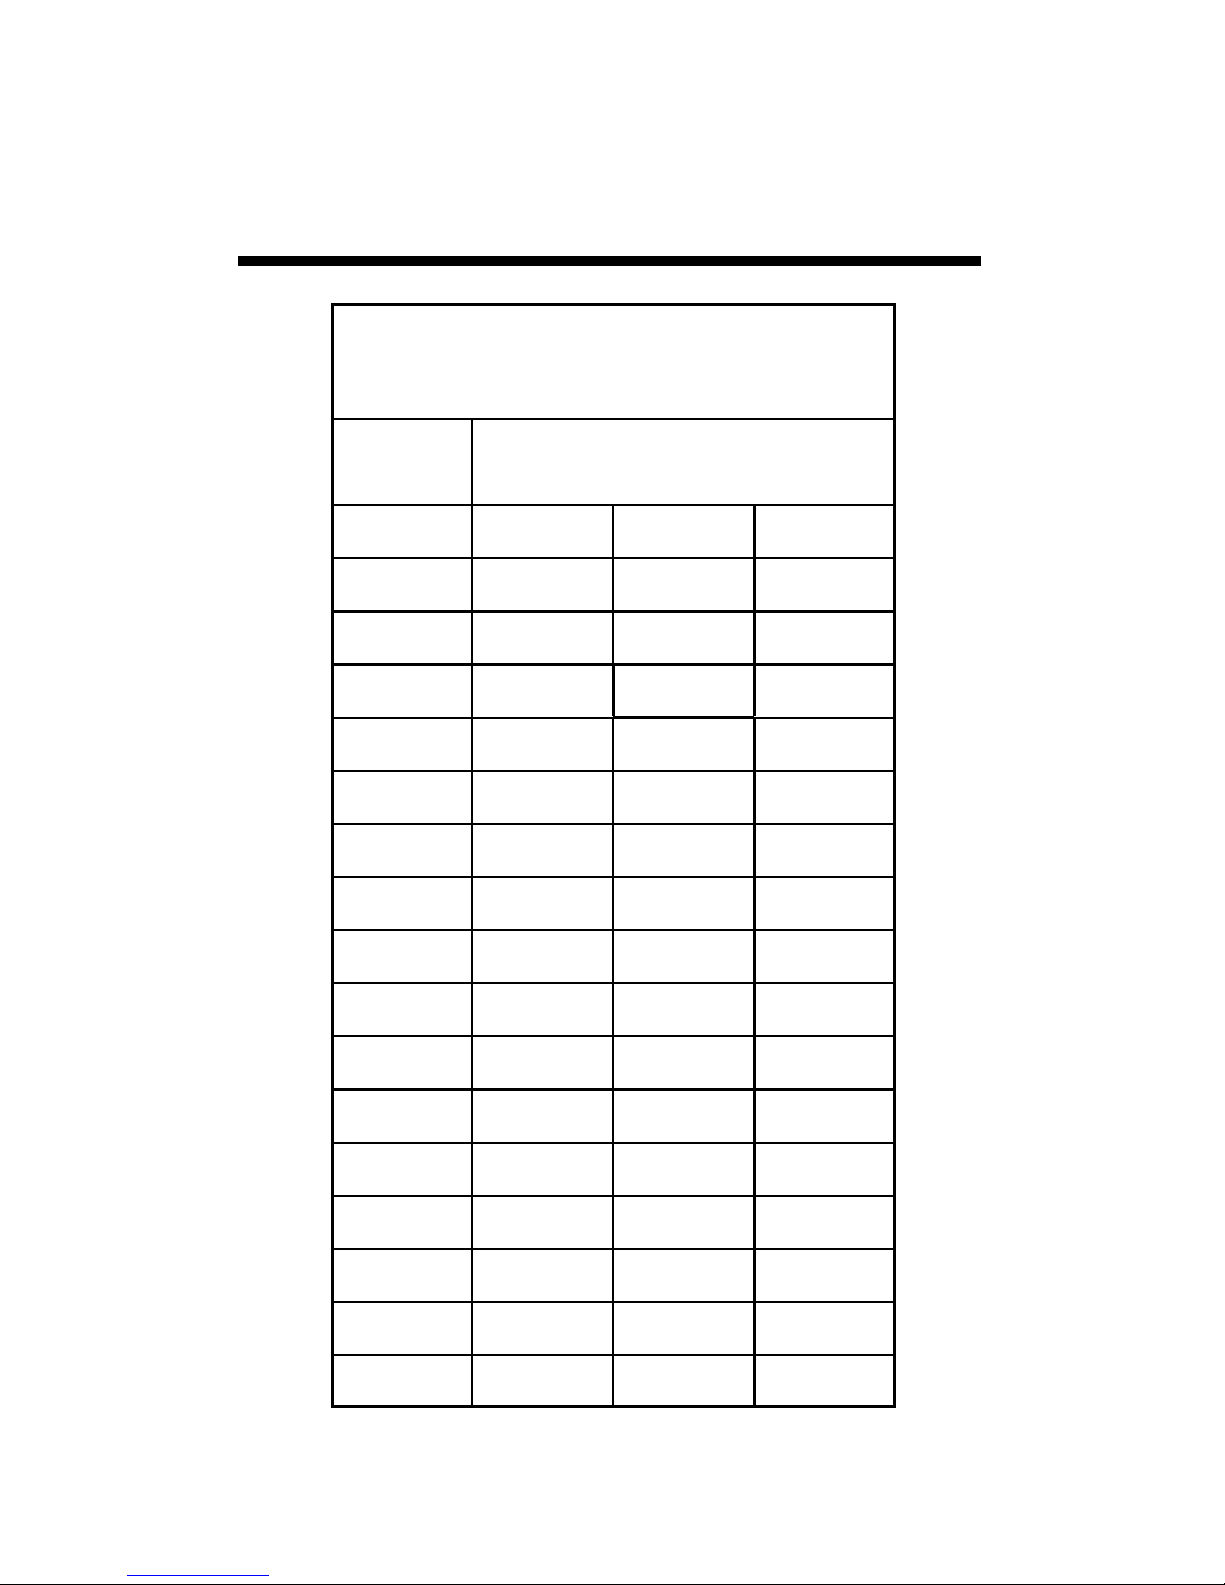
Disease Severity Value Chart
Average Temp
During Leaf Wet
Hours (ºF)
55-63 0-6 7-15 16-20 21 +
64-69 0-3 4-8 9-15 16-22 23+
70-78 0-2 3-5 6-12 13-20 21+
Hours of Leaf Wetness per Day
79-84 0-3 4-8 9-15 16-22 23+
Daily DSV = 0 1 2 3 4
38
Page 39

Refferences
Bolkan, M. A. and W. R. Reinert. (1994). Developing and
Implementing IPM Strategies to Assist Farmers: An Industry
Approach. Plant Disease, 78:545-550.
Faust, James E. “Light Management in Greenhouses” 2002. http://
www.firstinfloriculture.org/pdf/2002-5_LightManagement_pt_1.pdf
(2002-Nov-26)
Holcombe, Veronda B., Kelly Lewis, and James E. Faust. “How
Much Light Do Bedding Plants Really Need?” Greenhouse Product
News July 2001:26-30.
Jones, A. L., et al. (1980). A Microcomputer-based Instrument to
Predict Primary Apple Scab Infection Periods. Plant Disease. 64:69-
72.
Peet, Mary M, “Greenhouse Vegetable Production” 2002. http://
www.ces.ncsu.edu/depts/hort/greenhouse_veg/more_info_/
stress3.html (2002-Nov-26).
Pitblado, R.E. (1985). A Weather-timed Fungicides Spray Program
for Field Tomatoes in Ontario. TOM-CAST, The Model. Ridgetown
College of Agricultural Technology. Ridgetown, ON.
Spotts, R. A., (1977). Effect of Leaf Wetness Duration and
Temperature on the Infectivity of Guignardia Bidwelli on Grape
Leaves. Phytopathology 67:1378-1381.
Thomas, C. S., W. D. Gubler, and G. Leavitt. (1994). Field Testing of
a Powdery Mildew Disease Forecast Model on Grapes in California.
Phytopathology, 84:1070 (abstract)
Weber, E., D. Gubler, and A. Derr. (1996). Powdery Mildew
Controlled with Fewer Fungicide Applications. Practical Winery &
Vineyard, January/February.
39
Page 40

Warranty
This product is warranted to be free from defects in material or workmanship for one year from the date of purchase. During the warranty
period Spectrum will, at its option, either repair or replace products that
prove to be defective. This warranty does not cover damage due to
improper installation or use, lightning, negligence, accident, or unauthorized modifications, or to incidental or consequential damages beyond the Spectrum product. Before returning a failed unit, you must
obtain a Returned Materials Authorization (RMA) from Spectrum. Spectrum is not responsible for any package that is returned
without a valid RMA number or for the loss of the package by any shipping company.
DECLARATION OF CONFORMITY
Spectrum Technologies, Inc.
3600 Thayer Court
Aurora, IL 60504 USA
Model Numbers: 3683WD, 3684WD, 3685WD, 3686WD
Description: WatchDog Mini Station
Type: Electrical Equipment for Measurement, Control, and
Laboratory Use
The undersigned hereby declares that the above referenced product is in
conformity with the provisions of:
Directive: 2004/108/EC
Standards: EN 61326-1:2006
EN 61000-4-2:1995, including A1:1998 and A2:2001
EN 61000-4-3:2002
EN 55011:2007
Michael J. Dunning
Weather Products Manager March 25, 2009
(800) 248-8873 or (815) 436-4440
E-Mail: info@specmeters.com
40
3600 Thayer Court
Aurora, IL 60504
Fax (815) 436-4460
www.specmeters.com
Rev. 08/14
 Loading...