

Page 1
TDR 350
Soil Moisture Meter
PRODUCT MANUAL
Item # 6435
Page 2

2
CONTENTS
Shaft Dimensions 4
Specifications 5
Batteries 6
Button Functions 8
Display Screens 10
Meter Calibration 14
Updating Firmware 15
Electrical Conductivity 16
Meter Operation 18
Replacing or Re-attaching the Probe Block 21
Replacing the Display 22
Field Scout Mobile App/SpecConnect 23
Pairing TDR350 with FieldScout Mobile App 25
Data Logs 27
VWC Measurements 29
GPS Status 30
Optional Accessories 31
Appendix 1: Checking VWC Readings 32
Appendix 2: Soil-Specific Calibration 33
Appendix 3: FAQ 35
This manual will familiarize you with the features and operation of
your new Field ScoutTM TDR 350 Soil Moisture Meter. Please read
this manual thoroughly before using your instrument.
Page 3

3
Thank you for purchasing the Field ScoutTM TDR 350
soil moisture, electrical conductivity and soil surface
temperature meter. This manual describes the meter's
general features and operation.
Soil moisture is a critical, and potentially highly varia-
ble, component of the soil environment. Time domain
reflectometry is a proven technology for quickly and
accurately determining volumetric water content
(VWC) in soil. Electrical conductivity (EC) is a function of the moisture and salt in the soil. The meter also
measures soil surface temperature. The user can quickly
transition between taking VWC readings in standard
and high-clay mode.
The TDR 350's shaft-mounted probe allows the user to
take measurements while standing. The meter’s built-in
data logger can record data from several sites and eliminates the need to record data manually. The data points
can be viewed with the FieldScout Mobile app that
maps out soil measurements using logged GPS locations. Measurements can also be saved to a USB drive
that is plugged into the built-in USB port.
Contents
Your shipment includes the following components:
- TDR 350 meter (in collapsed position)
- Carrying case
- 4 AA batteries
Note: TDR rods are sold separately
General overview
Page 4
4
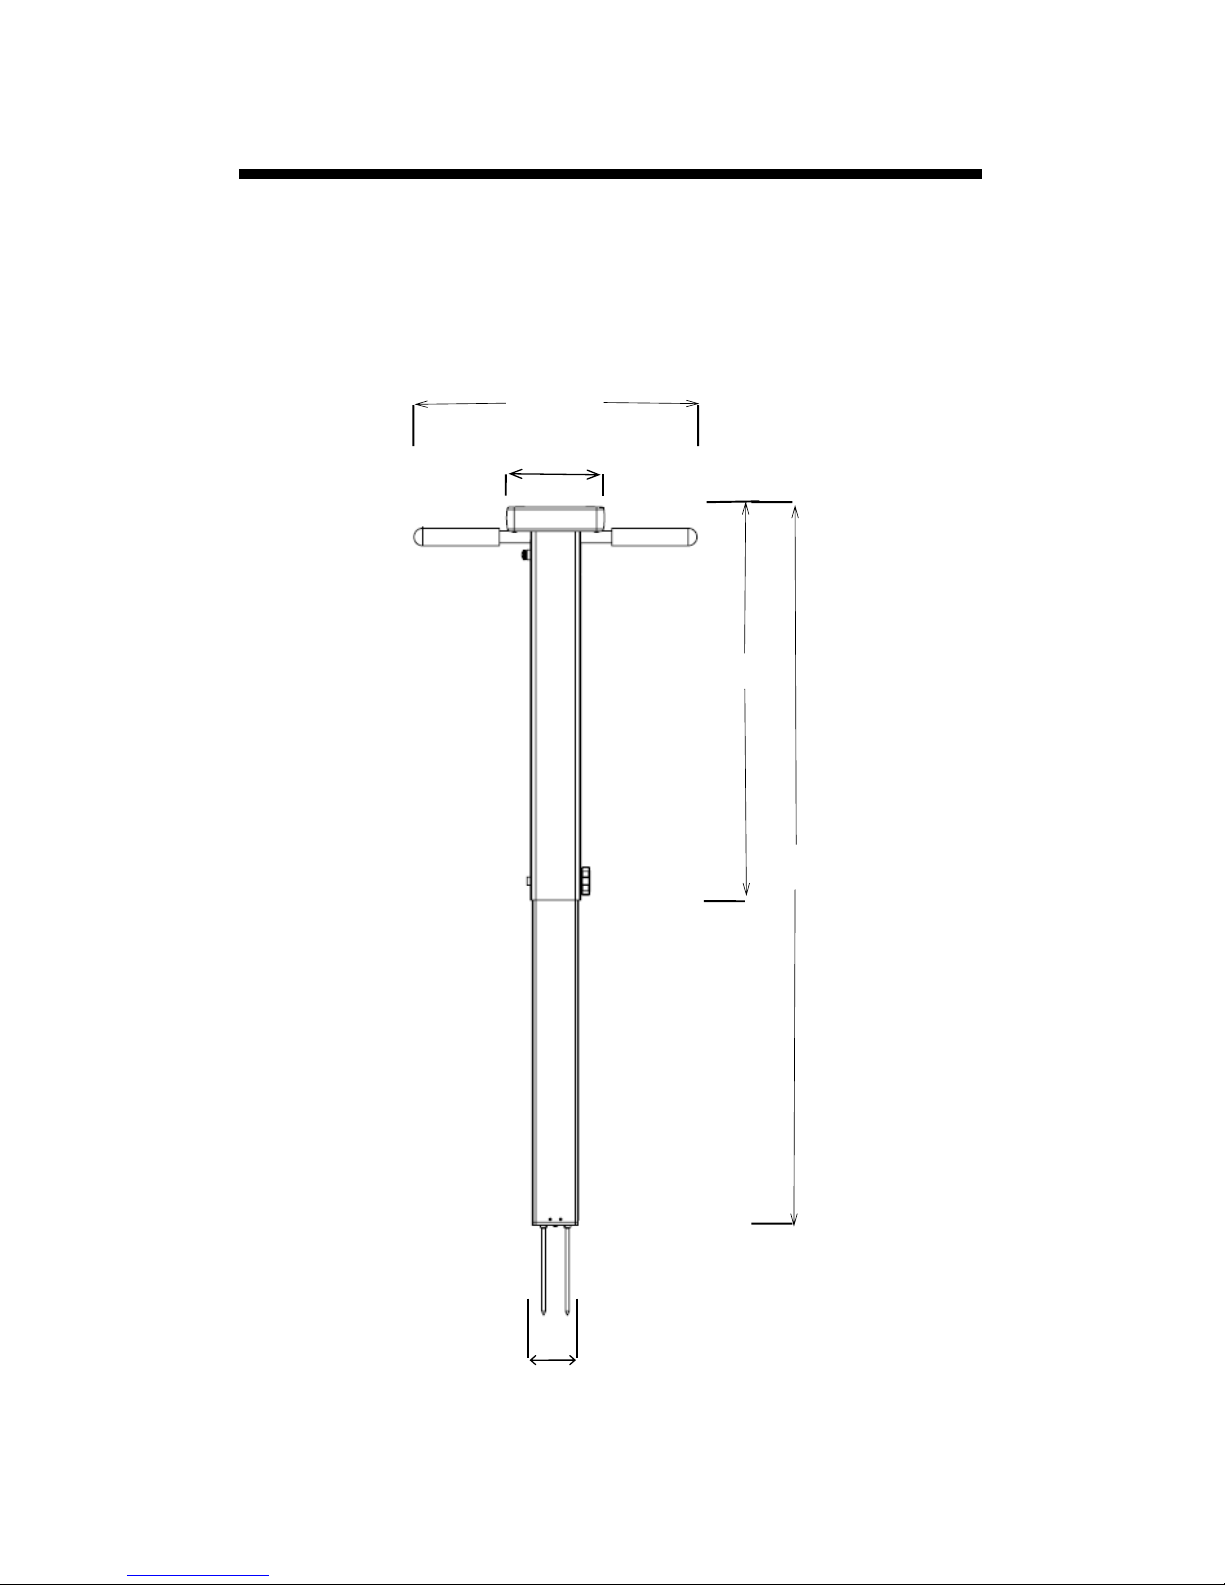
Shaft dimensions
The following are the dimensions of a fully extended
shaft. It is possible to reduce the length of the meter to
23” (58.5 cm) by adjusting the lower half of the shaft.
38"
19.5"
2.4"
14"
5"
Page 5

5
Measurement
Units
Percent volumetric water content (VWC)
Period (raw sensor reading)
Resolution
VWC: 0.1% VWC units
EC: 0.01 mS/cm
Temperature: 0.2 ˚F (0.1 ˚C)
Accuracy
VWC: ±3.0% volumetric water content
with electrical conductivity < 2 mS/cm
EC: ± 0.1 mS/cm
Temperature: ± 1.8 ˚F (± 1 ˚C)
Range
VWC: 0% to saturation (Saturation is typi-
cally around 50% volumetric water)
EC: 0 to 5 mS/cm
Temperature: -22 to 140 ˚F (-30 to 60 ˚C)
Power
4 AA batteries
Lithium batteries will optimize battery life
Logger
Capacity
50,000 measurements
Display
Backlit, high-contrast, graphic LCD
GPS
Accuracy < 2.5m
Weight
4.3 lbs. (1.9 kg)
Probe Head
Dimensions
2.4” x 1.4”
(6cm x 3.5cm)
Shaft
Dimensions
Extended Length: 38” (96.5cm)
Collapsed Length: 23” (58.4cm)
Width: 1.4” (3.5cm)
Available
Rod
Dimensions
Turf 1.5” (3.8cm)
Short 3” (7.6cm)
Medium 4.7” (12cm)
Long 7.9” (20cm)
Diameter: 0.2” (0.5cm)
Spacing: 1.2” (3cm)
Specifications
Page 6
6
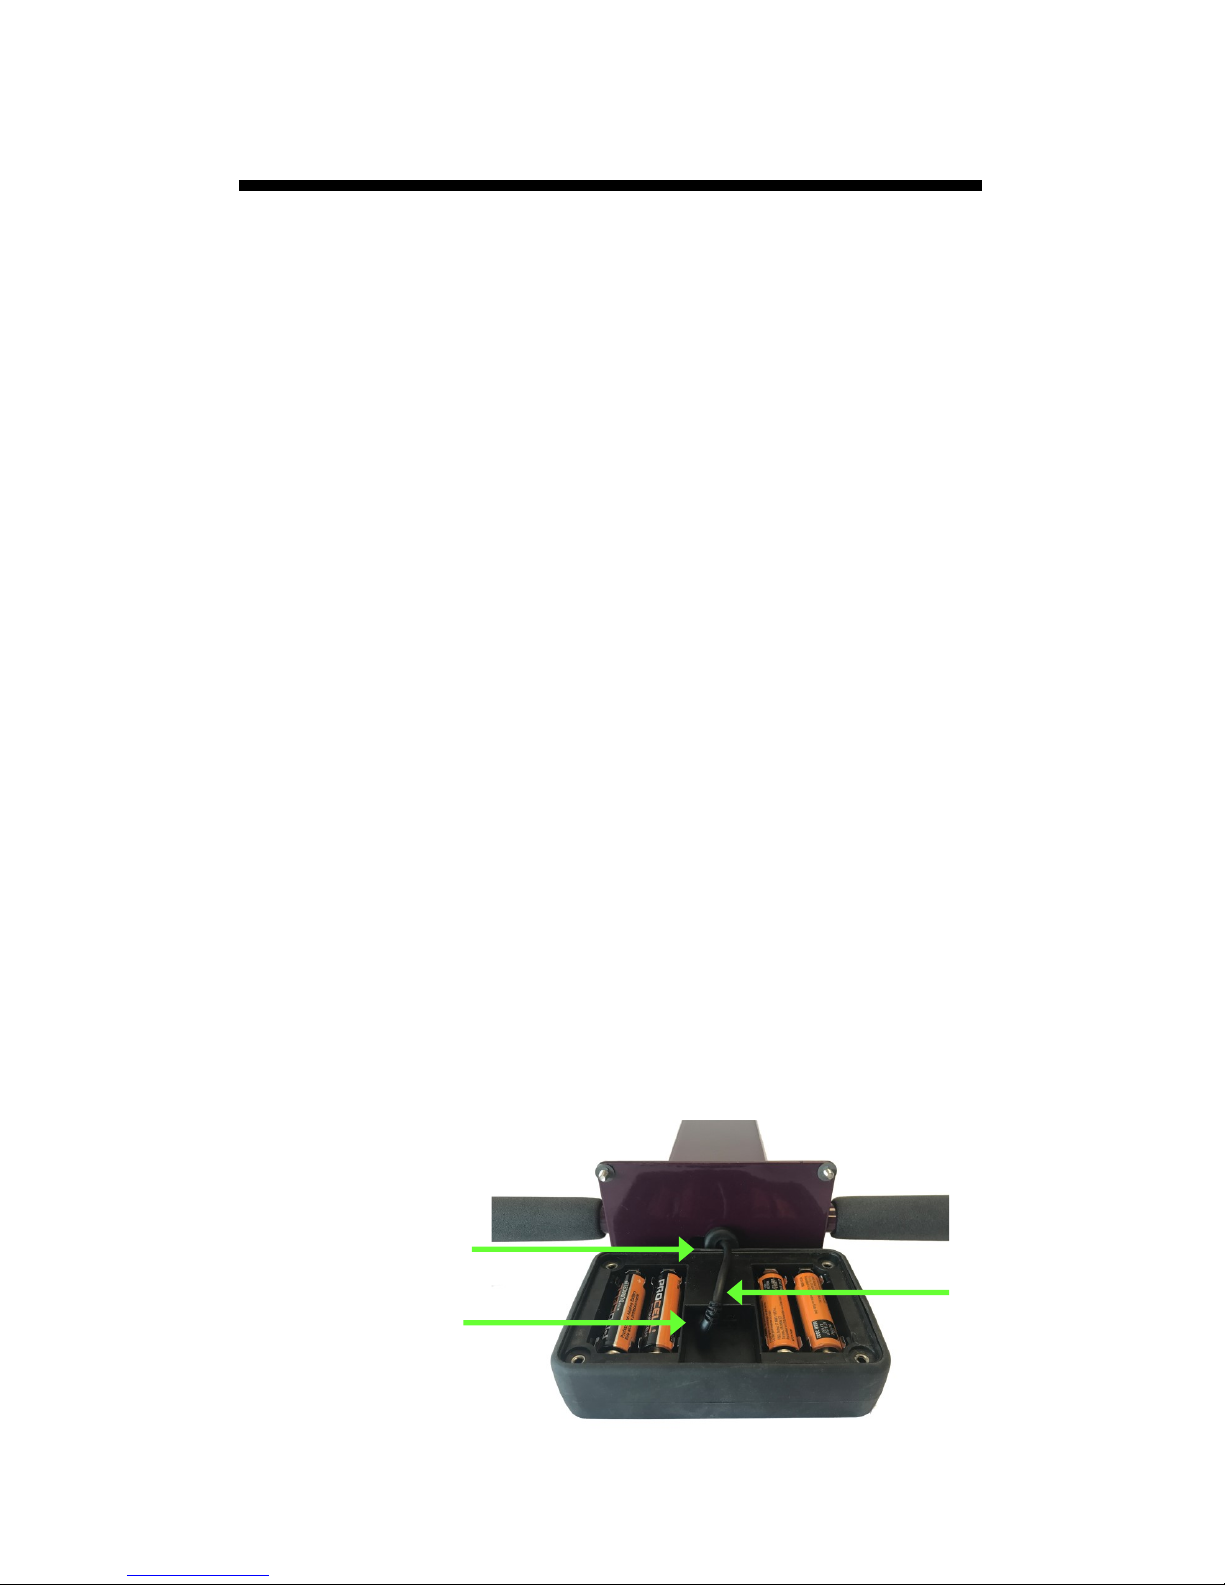
Changing the batteries
The TDR 350 requires 4 AA batteries. The battery holder
is on the underside of the display unit. The sensor is attached to the display via a cable that is plugged into a
socket between the battery holders. The cable can be
pulled out of and pushed back into the shaft through a
grommet at the top of the shaft.
Do not permanently remove the foam plug. It ensures
the plug does not come detached.
STEPS:
1. Collapse the shaft.
2. Turn the TDR 350 upside down and remove the 4
screws. Open the bottom and separate the display
module from the base plate. This may require pulling
the cable slightly out of the shaft.
3. Install batteries and ensure correct polarity by referencing the (+) positive and (-) negative labels at either
end of each slot.
4. Plug the cable connector back into the larger stereo
jack.
5. Mount the display box back onto the base plate. As
you do this, make sure the side with the USB port is
on the same side as the label.
6. Re-attach the 4 screws.
Batteries
plug
grommet
cable
Page 7
7
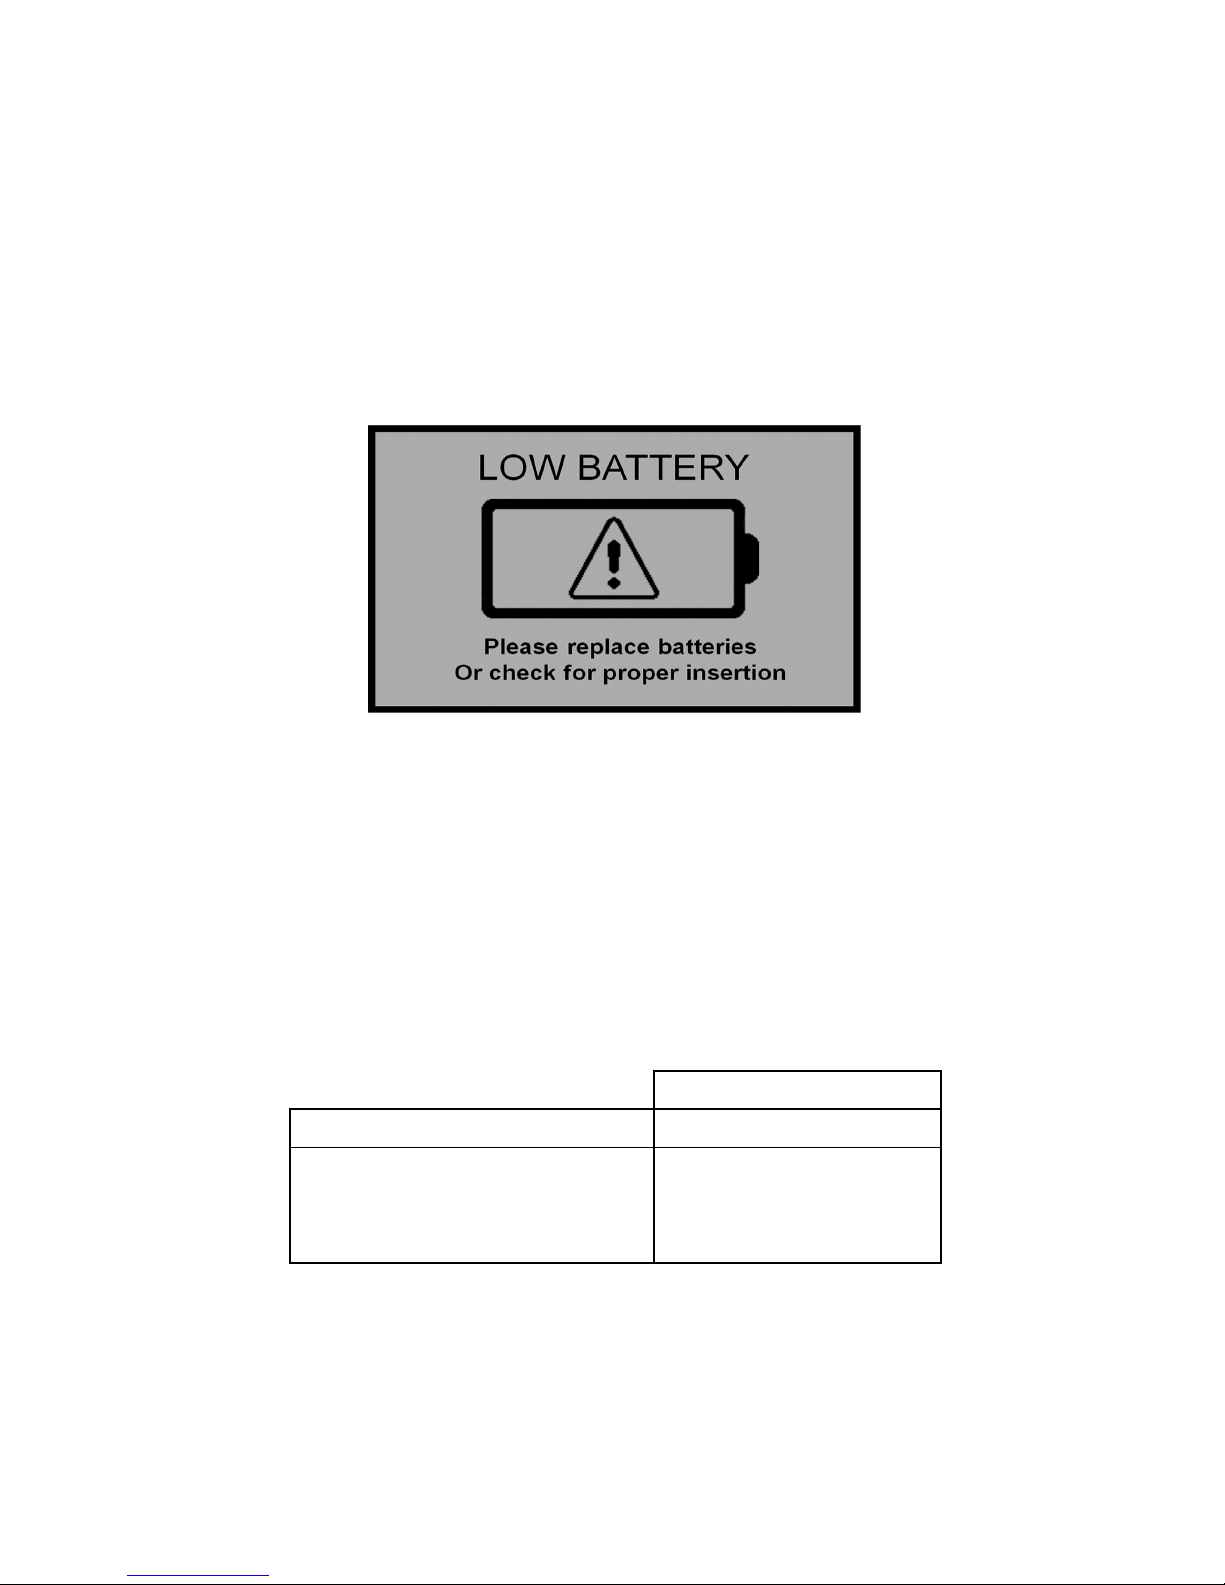
Battery life
The battery level is checked every time the display
unit is turned on. If the battery level is low, or if a
battery is inserted incorrectly, this low battery image shows on the full screen for about 10 seconds
and then the display will automatically turn off.
In addition to frequency of use, battery life is impacted by use of the backlight and GPS receiver. If
not needed, the GPS feature should be disabled.
The backlight can be set to AUTO mode (p. 12).
This allows enough time to see the reading without
unduly taxing the battery. The chart below gives a
rough estimate of the number of readings that can
be taken given certain configuration parameters.
Total Readings
Bluetooth GPS Backlight Alkaline Lithium
ON ON ON 12,000 24,000
ON ON OFF 24,000 35,000
OFF OFF OFF 150,000 225,000
Page 8
8
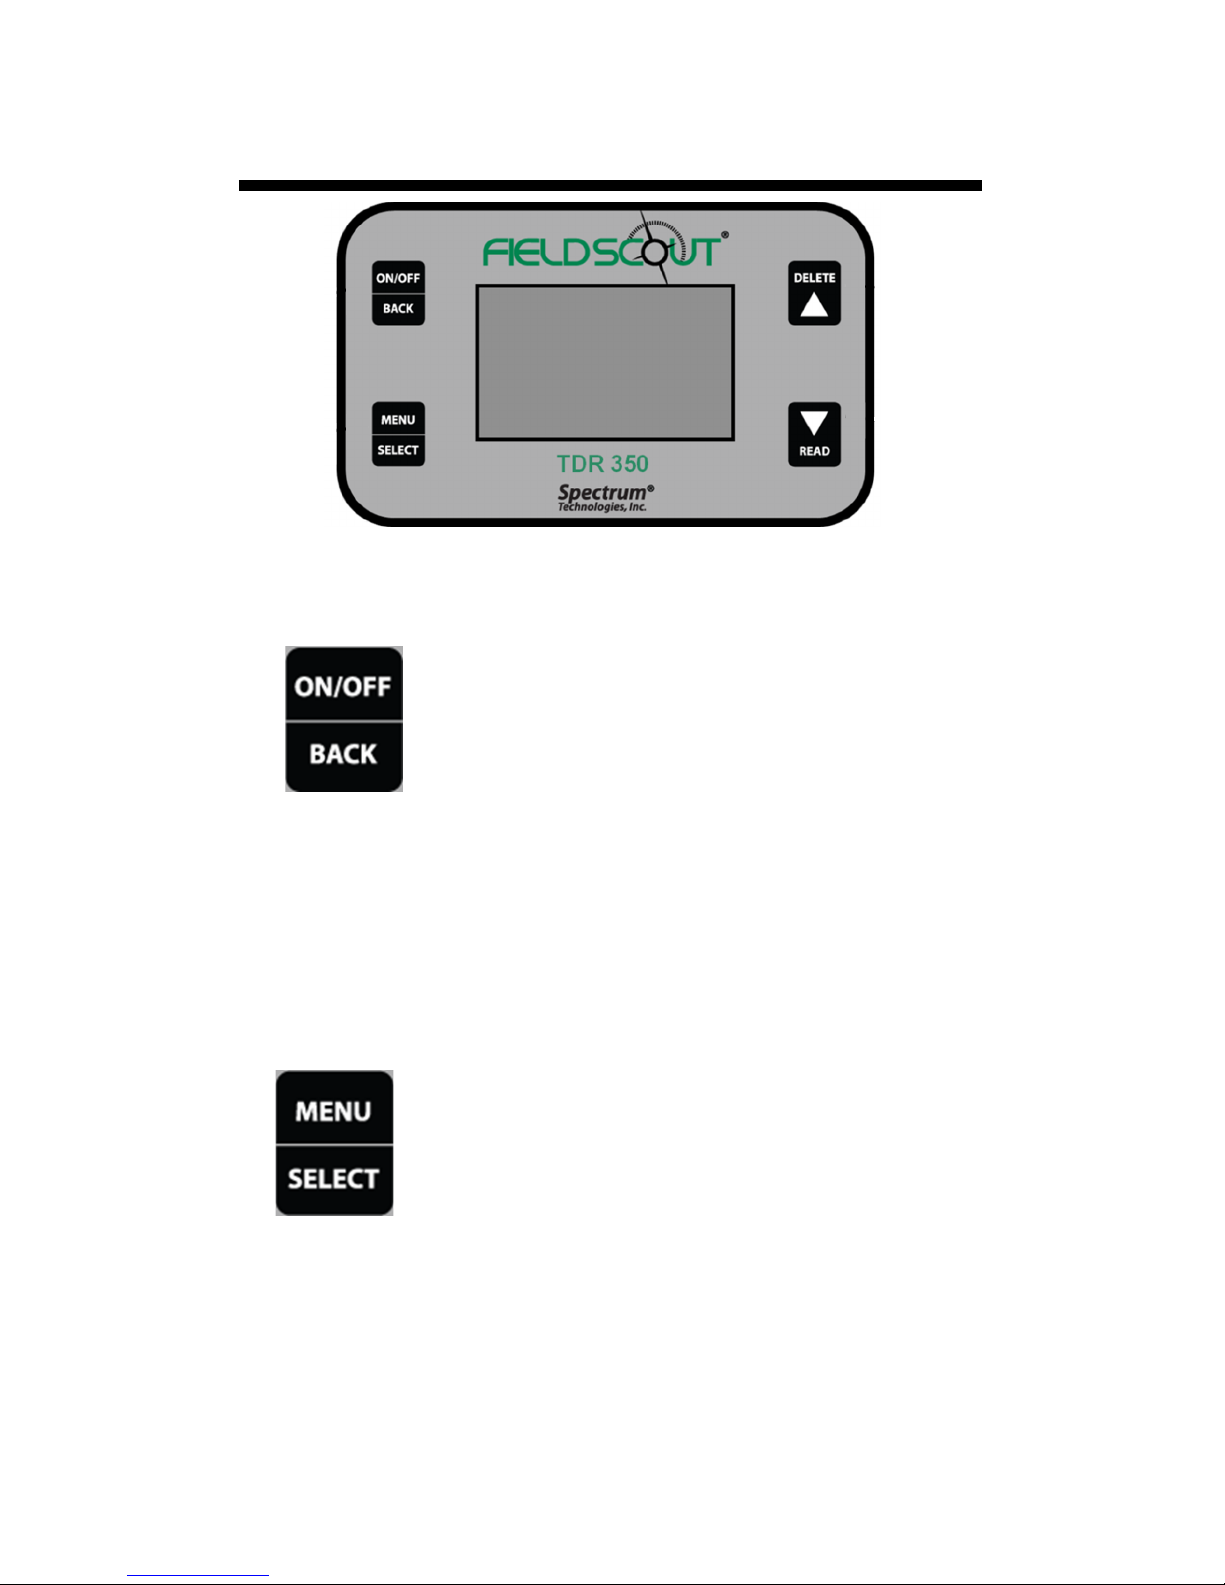
Button Functions
Basic Button Operations
ON/OFF or BACK button
Press this button briefly to turn on the
display. The meter will then display
the Data screen (p. 11). To turn the
meter off, press and hold this button
for about 2 seconds.
When in the Settings Menu screen (p. 12), press
this button to return to the Data screen. If you are
in a settings option that requires its own screen,
this button will return you to the Settings Menu
screen
MENU or SELECT button
When in the Data screen, press this button to go to the Settings Menu screen
(p. 12). When in the Settings Menu
screen and on a menu option, press this
button to browse through the different
choices for that specific menu selection.
In some cases, selecting a settings option will take
you to another screen for further action.
Page 9
9
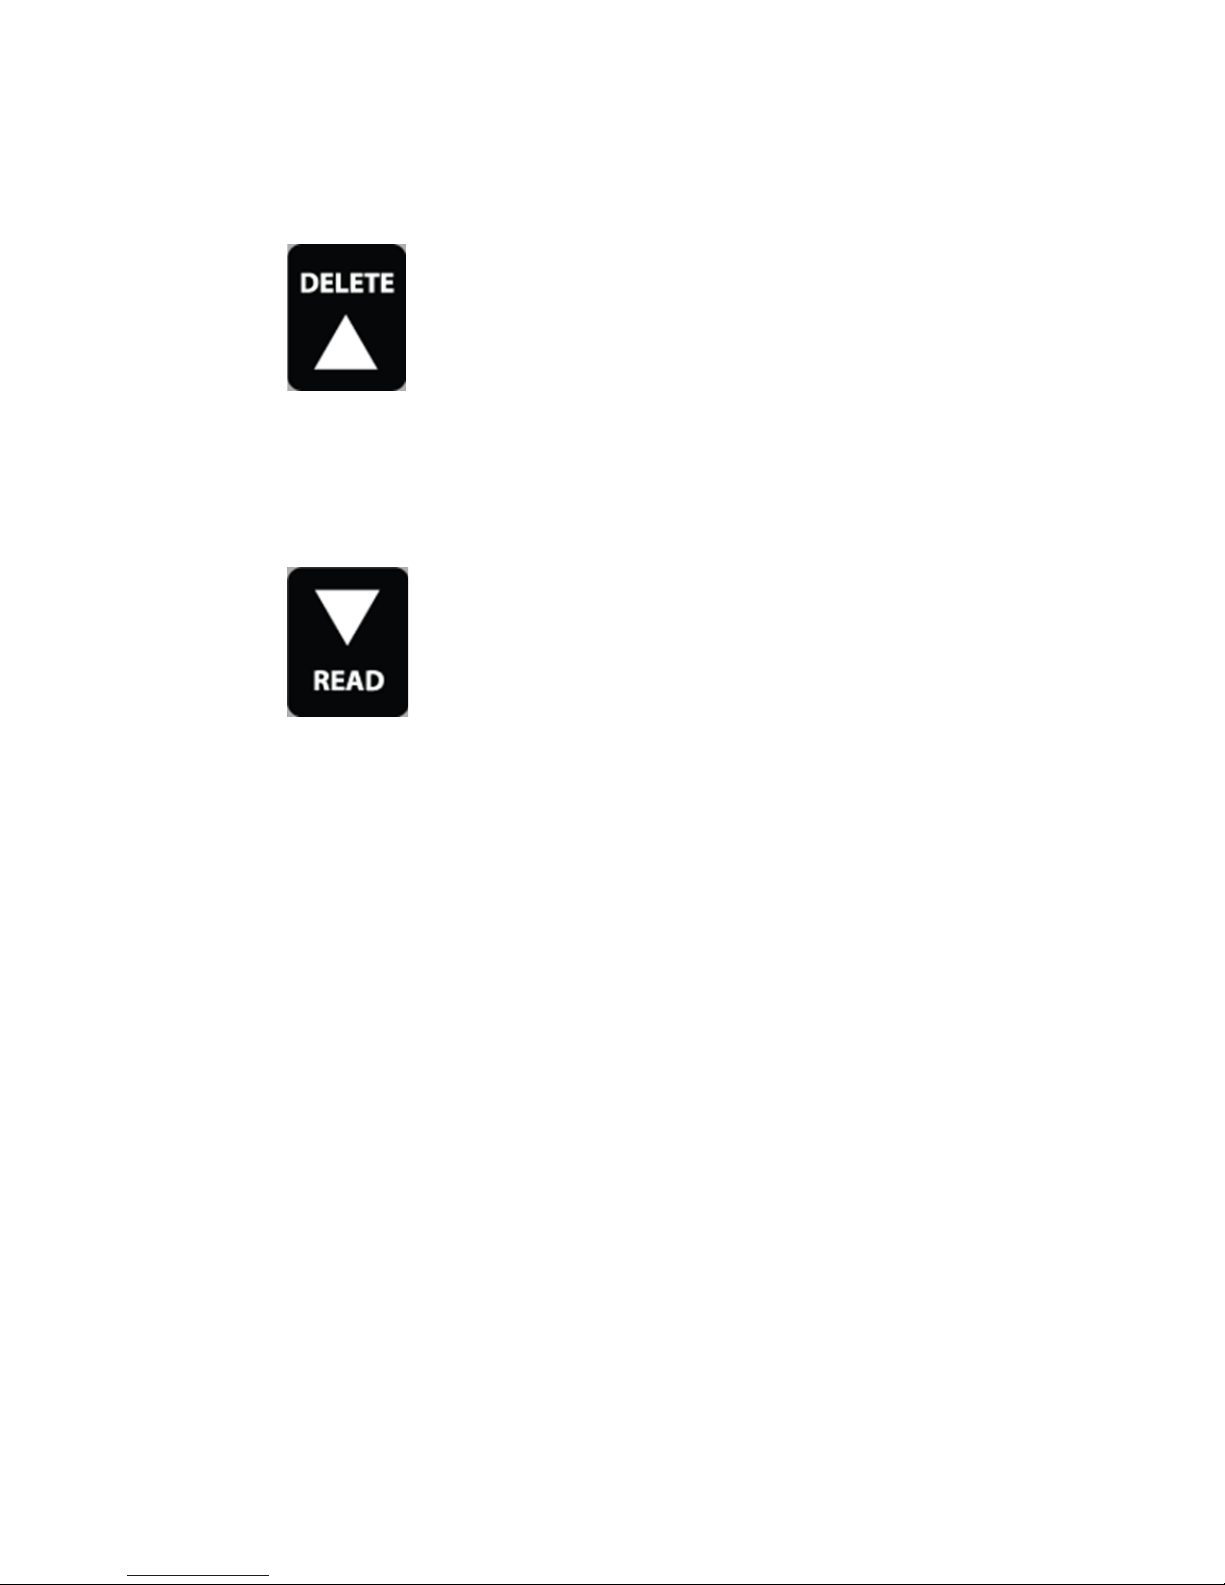
DELETE or UP button
When on the Data screen (p. 11), press
this button to delete the last measured
data point from the computed Average
and decrement the Count.
When on the Settings Menu screen (p. 12), press
this button to scroll up to the previous menu item.
READ or DOWN button
When on the Data screen, press and
release this button to take a sensor
reading. Press and hold to clear the average and reset the sample count to 0.
When on the Settings Menu screen, press this button to scroll down to the next menu item.
Page 10
10
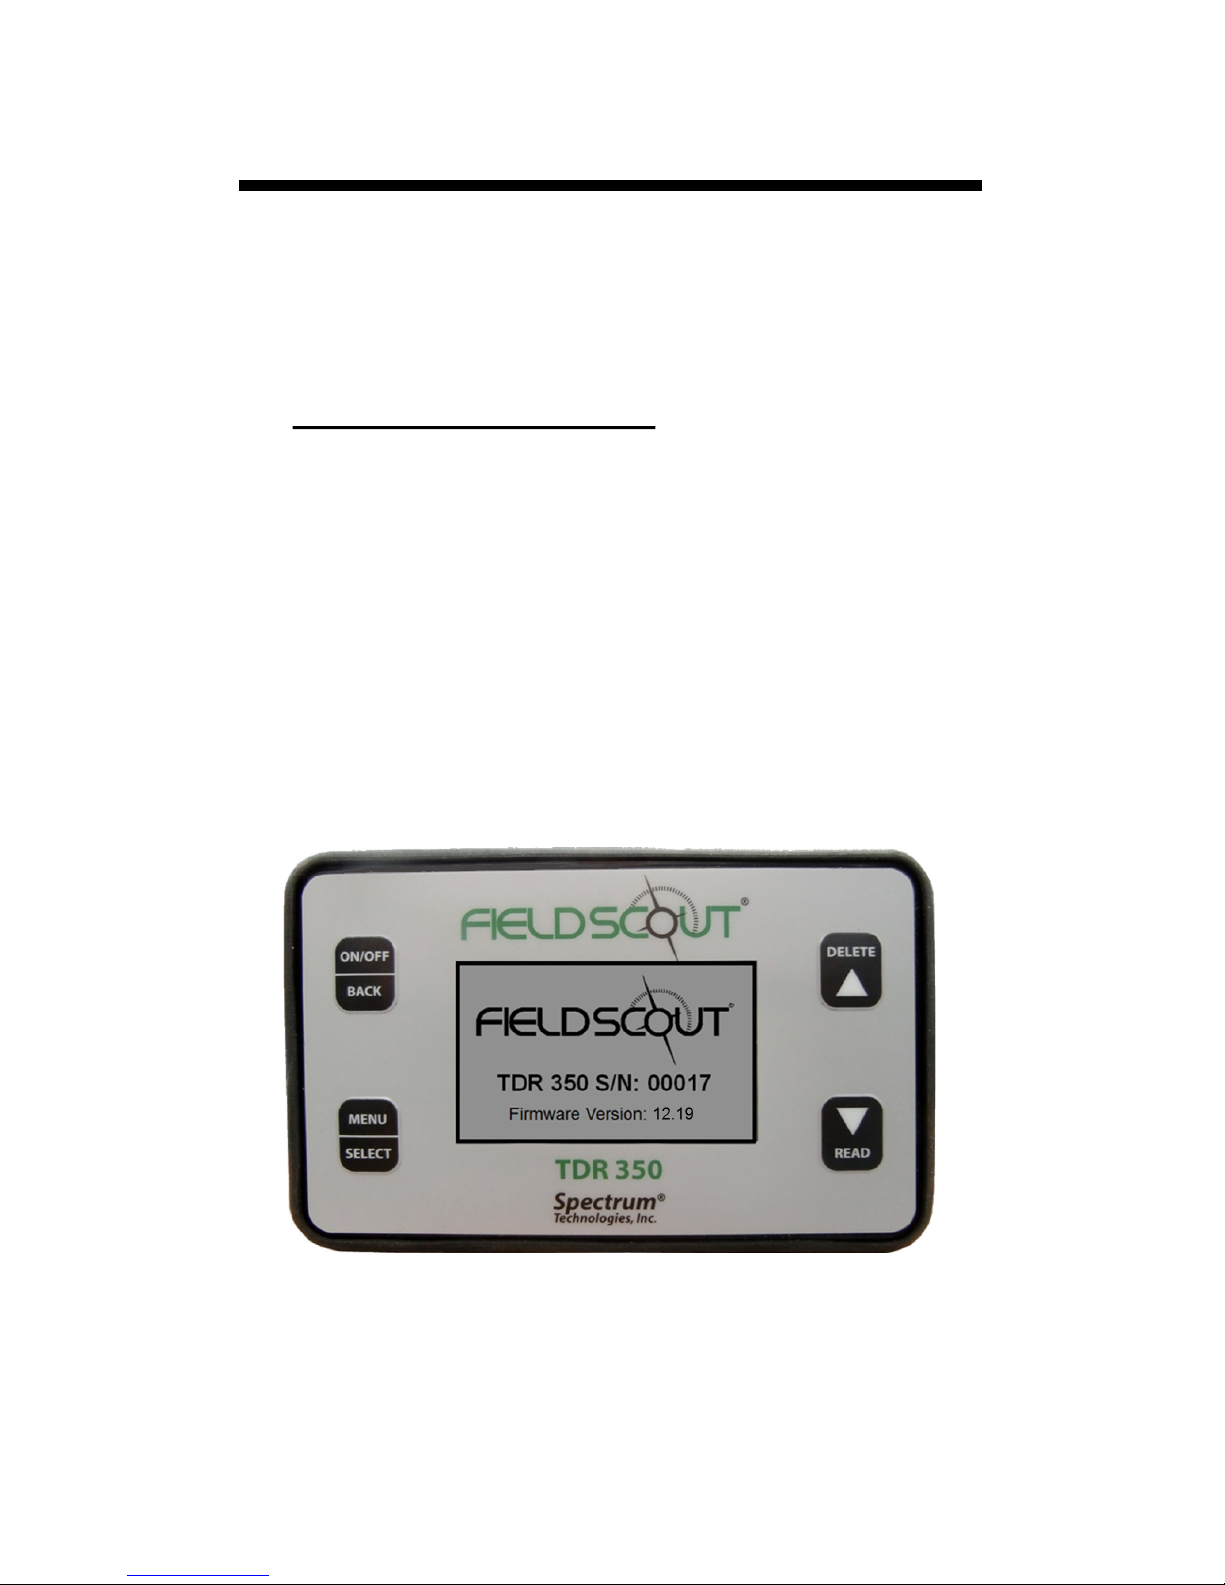
Display Screens
The TDR 350 has 3 main display screens;
- Startup Information screen
- Data screen
- Settings Menu screen
Startup Information screen
The Startup Information screen is displayed for
about 2 seconds after the display is turned on.
If desired, the startup screen can be kept on for a
longer duration. While powering up the meter,
press and hold the On/Off/Back button to continue displaying the Startup Device Information
screen. Release the button to proceed to the Data
screen.
Page 11
11
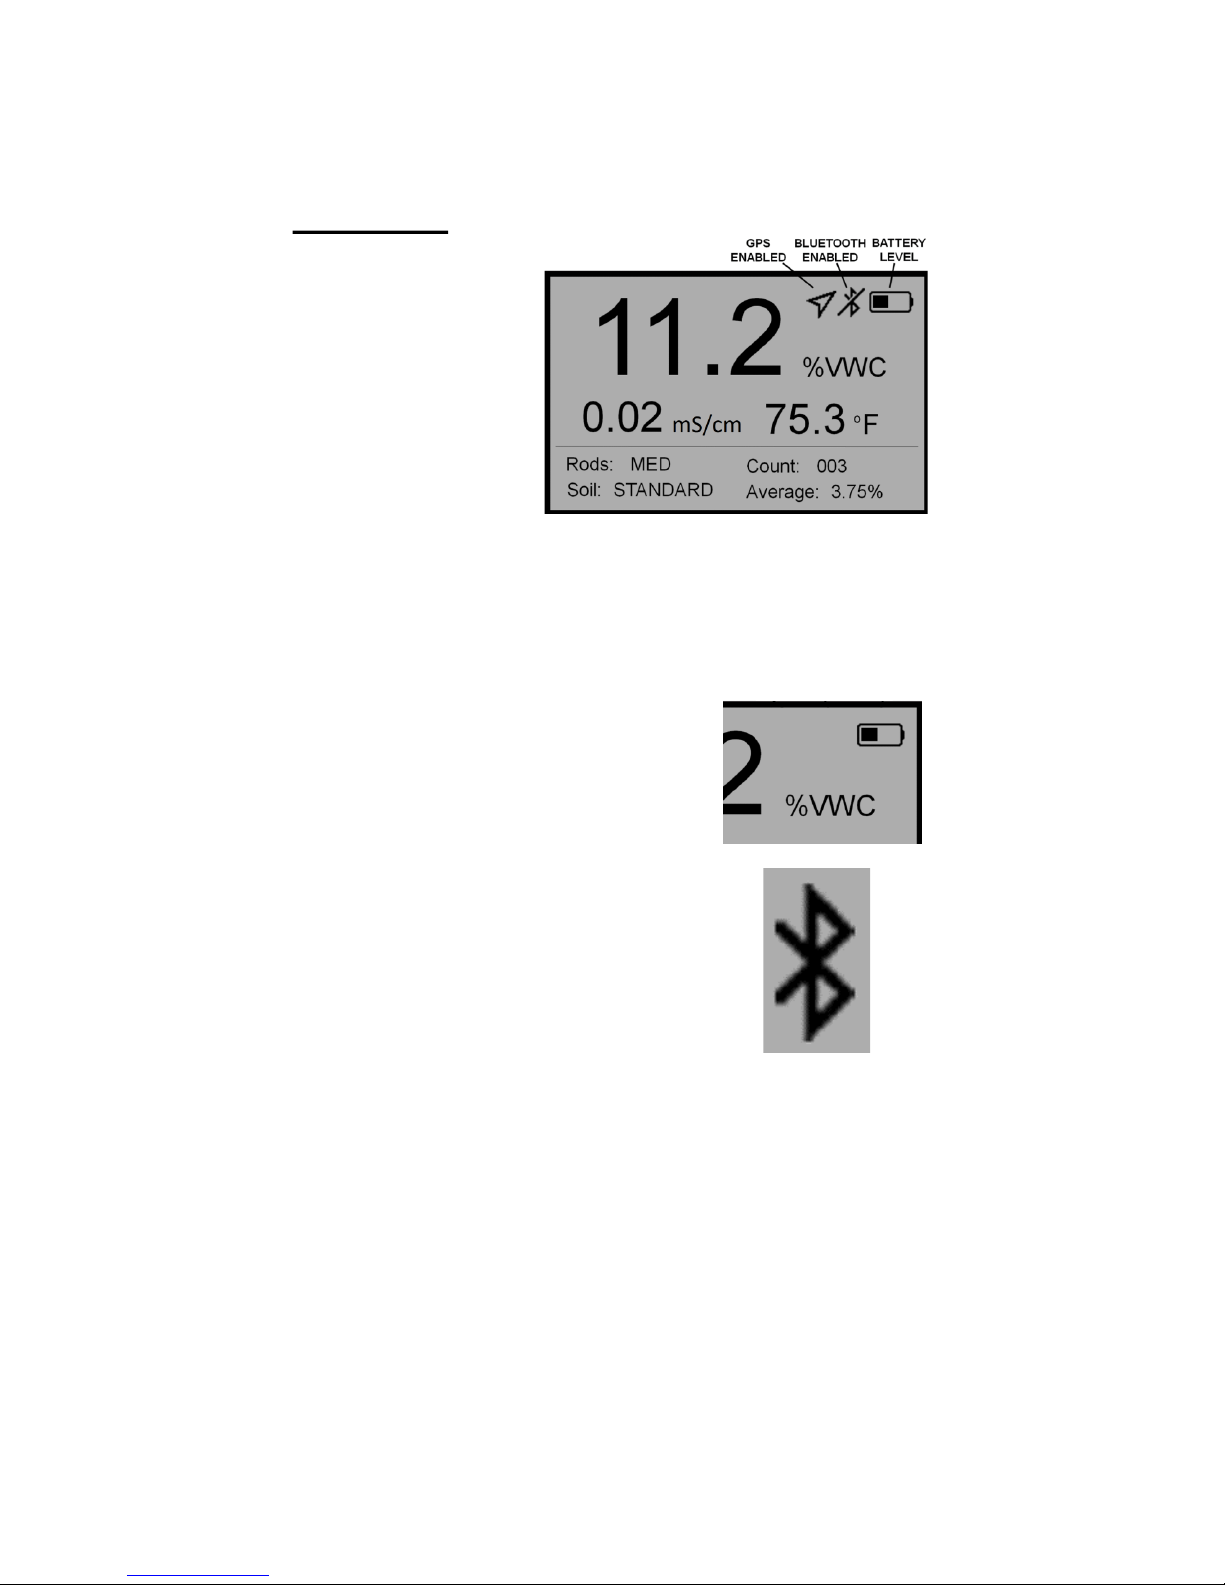
Data screen
Readings from
the sensor are
displayed on the
Data screen. The
battery level indicator appears
in the upper right
corner. The running average and
number of readings included in that average are
shown in the lower right corner. Pressing and
holding the READ button will clear the average
and re-set the counter to 0.
When disabled, the GPS and/or
Bluetooth icons will no longer
be visible. When visible, the
GPS icon will indicate the quality of the GPS fix (p. 29).
When the Bluetooth is enabled
but the TDR is not connected to
a mobile device, the Bluetooth
icon has a bar through it (see
image in data screen at top of
page). When the TDR is connected to a mobile device, the bar is removed (see
image to the right).
Page 12

12
Settings Menu screen
The contents of the Settings Menu are shown on the
following figure. Use the arrow buttons to scroll to the
desired option. The options are described below. For
most options, pressing the Select button simply toggles you through the different choices for that option.
Some options require an additional step or steps.
Clear Average*:
Clears the current average
and resets the counter to
zero.
Rod Length: Select the
size rods attached to meter. See p. 5 for options.
Soil Type: Choose Standard, Hi-Clay or Sand.
Clear Logs*: Initiates
erasing of data from internal memory.
Save to USB*: Initiates
transfer of data to USB
flash drive.
Backlight: The three options are ON, OFF, and AUTO. In AUTO mode, the backlight will be illuminated
for 5 seconds after a measurement is taken and then
shut off.
GPS, Bluetooth, Sound: Enable or disable these options. If location is not needed or a mobile devices is
not used, disabling these features will improve battery
life.
Page 13

13
Temp Source: Choose Soil Sensor or IR Sensor.
Temp Units: Choose Fahrenheit or Celsius.
Moisture Type: Choose volumetric water content
(VWC%), raw sensor reading (Period), or TDR 300
mode. The latter will report a VWC that matches the out-
put of the TDR 300 meter (no EC optimization).
EC Units: Choose simple EC value (mS/cm) or the Salinity Index (see p. 17).
Auto-Off: Choose how long the meter will stay on before
automatically powering off.
Current Date, Current Time: These are reported values. They cannot be manually adjusted. This information
is acquired from the GPS signal.
Timezone: Choose the offset from Greenwich Mean
Time. As you change the offset, the Current Time and
Date will be updated.
Daylight Savings: Options are ON or OFF.
Calibration*: Initiates calibration sequence (see p. 14).
Factory Defaults*: Returns all meter settings to the fac-
tory default values. See p. 34.
* Pressing Select button for these options brings up an
additional screen.
Page 14

14
The meter has internal calibrations for standard,
sand, and high-clay soil types. It also has the option of outputting a value that matches its predecessor, the TDR 300. These calibrations will work
for a large number of soils. However, each meter
will have a small difference in how it responds to
identical soil conditions. This is due to sensor drift
or variability in the electronic components used
during manufacturing. The meter allows for adjustments to the calibration to account for these differences. Therefore, if two meters are giving slightly
different readings in the same soil, the output of
the meters can be standardized such that the meters
can be used interchangeably. After calibration, a
TDR 350 in "TDR 300" mode (see p. 13) should
read the same as a TDR 300 meter.
To perform the calibration, you will need a 6" diameter plastic container of distilled or de-ionized
water. The container must be at least as tall as the
length of the TDR rods. The procedure is as follows:
1. From the Settings Menu (p. 12), scroll to the
Calibration option. Press the Select button to
initiate the calibration process.
2. Hold the meter so the rods are in the air. Press
the Menu/Select button and wait until the meter indicates it is ready.
3. Immerse the rods completely in the water.
Press the Menu/Select button and wait until
the meter indicates it is ready.
Meter Calibration
Page 15

15
The meter will then show that the calibration is
complete for that specific rod length. If more than
one rod size is being used, a calibration operation
must be done for each one.
Note: This procedure is different than a soilspecific calibration (Appendix 2, p. 32) where a
unique calibration curve is generated.
Updating Firmware
The firmware of the TDR 350 can be updated us-
ing a USB flash drive. Firmware update files can
be found at the Spectrum website.
1. Copy the latest firmware update from your PC
onto your flash drive.
2. Power off the meter.
3. Insert the flash drive into the meter's USB port.
4. While holding down the Delete button, press
the On/Off/Back button. The meter will beep.
5. Release the Delete button after the meter beeps
a second time.
6. Remove the flash drive.
The meter will then power up as usual.
Page 16

16
Electrical Conductivity
Electrical Conductivity
Knowledge of the salinity level of your soil is an important component of irrigation and nutrient management.
The source of the salts in the soil ranges from the original
parent material to additions from natural sources and management activity. Often, having salt in the soil has a nega-
tive connotation. This is because when the soil solution
has a high salt concentration, plant roots cannot bring in
sufficient soil moisture. However, fertilizer exists as salt
ions in that same soil solution. So, if the salt level is too
low, the plant cannot get the nutrients it needs.
Direct measurement of salt content can only be done by
subjecting a field sample to laboratory analysis. Fortunately, the electrical conductivity (EC) is a function of the dissolved salts in the soil. EC is expressed in units of mS/cm.
This proxy measurement is possible because, as salts dissolve into the soil, they disassociate into ions which conduct electricity.
The EC measured by an electrode is defined as the bulk
EC. The significance of this value depends on how the
sample was prepared. The EC reported by a soil lab is typically the saturated media extract. Briefly, distilled water
is added the soil until it glistens. The soil solution is given
time to equilibrate with ions on the soil exchange sites.
This soil water is then suctioned off to be measured.
Measuring the EC of diluted soil/water solutions (such as
1 part soil: 2 parts water) is also common. The determination of whether the EC is within an acceptable range is
based on the type of sample being measured.
The TDR 350 uses the same metal rods used for soil moisture sensor as the electrodes for the EC circuit. The value
measured is an average for the entire depth sampled.
Page 17

17
Salinity Index
The TDR 350 measures the bulk EC of soil that may or
may not be saturated. There are two competing mechanisms at place. As the soil dries, the remaining solution in
the pore space becomes more concentrated which increases its EC. However, reduced water in the pores leads to a
longer and more tortuous path between the sensor elec-
trodes, which decreases EC. The second mechanism dom-
inates. This means that bulk EC will decrease as soil
moisture decreases. EC measurements at different sampling times are comparable when the moisture content for
each measurement is the same. This is easily accomplished if readings are always taken when the site is at
field capacity. Field capacity is defined as the condition
that exists when a saturated soil is allowed to drain to the
point where the pull of gravity can no longer remove any
additional water.
The TDR 350 also gives the option to report EC in the
form of the Salinity Index. The salinity index is defined as
the ratio of the bulk EC to the volumetric water content
(expressed as a decimal). For example, if the bulk EC is
0.25 mS/cm and the VWC is 22%, the Salinity Index
would be reported as 1.14 (0.25 ÷ 0.22 = 1.14). Therefore,
the Salinity Index combines VWC and EC (corrected for
temperature) into a parameter that will be less dependent
on the sub-saturated water content.
Page 18

18
Meter Operation
Setting up the meter
The telescoping shaft (fig. 1) can be used in an extended
or retracted position. To adjust the length, remove the fastening bolt and push or pull the shaft into its new position.
Screw the rods into the sockets at the bottom of the probe
block.
Configuring the meter
Meter configuration is done in the Settings Menu (pp. 12
- 13).
The TDR 350 can be set to one of three Soil Type modes,
Standard, High Clay, or Sand. The Standard mode will be
appropriate for most mineral soils. The High Clay mode
will be more accurate for soils with higher clay contents
(> 27%). Sand is applicable for sand based sports fields or
golf greens. There are 3 Moisture Type options. VWC%
mode displays the moisture content optimized by the output of the EC sensor. Period mode displays the raw sensor
reading. This mode is intended primarily for troubleshooting or for soil-specific calibrations. TDR 300 mode
displays a reading that will match the output of a TDR
300 meter.
Figure 1. Shaft, fastening bolt, and rods
Page 19

19
To geo-reference data, enable the GPS capability. If you
are using the FieldScout Mobile app (p. 22), Bluetooth
functionality must be enabled. When Bluetooth is activated, it will always be on while meter is powered up. If
GPS is disabled, the app will use the phone's GPS instead.
Display
Figure 2 shows a sample
data screen. The GPS,
Bluetooth, and battery
status are shown in the
upper right corner. Soil
moisture, EC, and temperature data are displayed in
the top half of the display.
The average reading and number of readings included in
the average are visible in the lower right corner. The current Rod Length and Soil Type are shown in the lower
left corner.
Taking Readings
Push the rods into the soil. When taking a measurement,
it is important that the rods be fully inserted into the soil.
If not, part of the sampling volume will be composed of
air and the reading will be inaccurately low. For the same
reason, the probe should be inserted with a steady, down-
ward pressure. If the rods are wiggled into the soil, air
pockets can be created adjacent to the rods that will result
in low readings. The probe should not be struck with a
hammer or other blunt instrument as this can cause damage to the internal electronics. Also, care should be taken
to ensure the rods are inserted as parallel to one another
as possible. This will not have a large affect on the reading but will decrease the chances the rods will be bent or
broken. Likewise, it is best to avoid areas with rocks or
Figure 2.Sample data screen
Page 20

20
other material that can cause the rods to deflect or bend.
If the ground is especially hard or compact, you can use a
Pilot Hole maker (item 6430PH) to make 3” holes to aid
in starting the insertion of the probe rods.
Press the READ button to initiate the measurement sequence. The reading should appear almost instantaneous-
ly. If the display does not detect the sensor, it will display
dashes. Check that the sensor is securely attached (see p.
21).
Note: The TDR rods are manufactured from type 303
stainless steel and are designed to bend if non-vertical
force is applied to them. This serves to protect the TDR
block electronics from potential damage that could be
caused by excessive force.
Occasional rod bending is normal, and can be expected
during the course of sampling. Longer rods will be more
susceptible to bending than shorter rods. If bending occurs, rods should simply be bent back to parallel position,
perpendicular to the TDR block. Measurements will continue to be accurate provided that rods are reasonably
close to parallel.
If care is not taken to reposition rods to a parallel position, subsequent pressure on the rods will accentuate the
bending and may cause the rods to break.
Rods should be considered maintenance items that may
need to be replaced over time, depending upon the nature
and frequency of sampling. The rods will wear most rapidly in sand-based root zones.
Page 21

21
Replacing or
Re-attaching the
Probe Block
The TDR 350 sensor block is a user-replaceable com-
ponent (item 6435S). Remove the rods before separat-
ing the old sensor.
1. Turn the TDR 350 upside down and remove the 4
screws. Open the bottom and separate the display
module from the base plate (fig. 1). This may require pulling the cable slightly out of the shaft.
2. Unplug the cable connector from the jack to completely detach the display from the base.
3. Remove the fastening bolt that joins the probe
block to the shaft.
4. Separate the probe block from the shaft (fig. 2).
5. Feed the cable from the replacement probe block
through the shaft.
6. Connect the cable to the large socket on the underside of the display module and re-assemble the
display.
Figure 1. Sensor cable
connection to board.
Figure 2. Sensor block/
shaft interface
Page 22

22
Replacing the Display
Remove the rods before separating the old display
from the probe block. The shaft should be
collapsed before beginning the procedure.
1. Turn the TDR 350 upside down and remove
the 4 screws. Open the bottom and separate the
display module from the base plate (fig. 1).
This may require pulling the sensor cable
slightly out of the shaft.
2. Remove the foam plug and unplug the sensor
cable connector from the jack. If an IR
temperature sensor is connected, disconnect
this plug as well. Completely detach the
display from the base.
3. Re-connect the sensor cable to the large socket
on the underside of the new display module.
Attach the IR temperature sensor if necessary.
4. Push the foam plug back into place. The forked
end fits around the sensor cable molding.
5. Re-assemble the display.
Fig. 1: Cable attached. Foam retainer installed
Page 23

23
In addition to transferring data to a flash drive, the
FieldScout Mobile App can be used to send data
directly to the SpecConnect web utility. Data can
be viewed on a Smartphone in two formats. In grid
mode, the site is divided into a customizable 2dimensional grid of 3 to 5 rows and 3 to 5 columns. Measurements are taken in each grid cell.
Average, color-coded data are displayed on the
app (Fig. 1). In freeform mode, a color-coded
pushpin icon is placed at every sampling point. If
the TDR 350 has a good GPS fix (p. 29), the app
will use the coordinates from the meter. If not, or
if the meter's GPS is disabled, it will use the inter-
nal GPS of the smartphone.
Field Scout
Mobile App/
SpecConnect
Figure 1. Grid Mode Figure 2. Freeform Mode
Page 24

24
The data from the Pro version of the app is sent
instantaneously to SpecConnect. Data can be
viewed in map form (fig. 3), exported to an Excel
spreadsheet, or viewed as a Trend Report (fig. 4).
More details are available in the user's guide for
the app.
Fig. 3. 2-D Contour Plot in SpecConnect
Fig. 4. Trend Report
Page 25

25
The internal Bluetooth radio must be paired with the smartphone
running FieldScout Mobile. The radio is activated when the meter
is powered up. For some smartphone operating systems, it may be
necessary to manually enable Location Services.
1. Activate Bluetooth feature on the smartphone.
2. Open the app.
3. Tap the Course/Farm icon. Select an existing course or create, name, and select
a new course.
4. Select an existing session or create,
name, and select a new session. This will
bring up the Select Session Mode screen
(Fig. 1). Select whether you are using
Grid or Freeform (Pro version only)
mode to collect data.
5. a. For Grid mode, the Main Grid screen (Fig. 2a) will appear.
Confirm that the meter you are using appears at the top of the
screen. If not, a new session must be created. Tap any of the
zones to bring up the Take Reading screen (Fig. 2b).
Figure 1. Session
Mode screen
Figure 2a. Main
screen
Figure 3. Bluetooth
Connect button
(freeform)
Pairing TDR350 With
FieldScout Mobile App
Figure 2b. Bluetooth
Connect button (grid)
Page 26

26
b. For Freeform mode, the app will immediately transition to
the Take Reading screen (Fig. 3).
6. Tap the Connect FieldScout Device via
Bluetooth button. If the Bluetooth feature
has not been activated, you will be prompted to do so.
7. The app will search for the Bluetooth device. It should then appear in the list of
scanned devices (Fig. 4).
After selecting the device, the App will be
ready to take readings.
Note: Although the device appears in the app,
it may not show up on the phone's list of Bluetooth devices.
Figure 4. Scanned
device list
Page 27

27
Downloading Data
Data stored in the meter's internal memory can be
transferred to your PC with a USB flash drive.
Connect the flash drive to the USB port on the
front of the meter. Press the Menu/Select button
(p. 8) to open the Settings Menu. Scroll to the
Save to USB option and, again, press the Menu/
Select button. The data will be saved to the flash
drive as a file with a .csv extension. If you already
have a data file on the flash drive for the meter you
are downloading, it will be over-written* by this
data transfer.
*Caution: If you cleared the data log before taking
the current set of measurements, be sure any data
on the flash drive has already been saved to your
PC.
Erasing Data
Press the Menu/Select button (p. 8) to open the
Settings Menu. Scroll to the Clear Logs option
and, again, press the Menu/Select button. Press
Menu/Select button to complete the process or the
On/Off/Back button to abort.
Managing Data
The data is stored in comma-delimited text files.
The file name will match the serial number of your
Figure 1: Sample TDR 350 data file
Data Logs
Page 28

28
meter. These files can be opened with text-editing
software or spreadsheet software (fig. 1). The data
is separated into 11 fields.
a
Time is based on the GMT offset selected in the
Timezone option (p. 13)
b
If "TDR 300" is selected as the Moisture Type,
the TDR 300 VWC (without EC optimization) will
appear in the VWC% column.
c
GPS format is DDMM.MMMM C
Where DD is degrees, MM.MMMM is decimal
minutes, and C is the compass direction.
d
Satellite fix status will be 0 if the meter was unable to determine the a location, 1 if a location was
found but without the differential correction, and 2
if the differential correction was available.
e
Rod length options are Long (8"), Med (4.8"),
Short (3"), and Turf (1.5")
f
Soil Type options are Standard, Hi-Clay, and
sanD.
Column Description
1
Date and timea
2 - 6
Sensor readingsb
(VWC, Period, EC, Soil Temperature,
IR Temperature)
7 - 8
GPS coordinates (longitude, latitude)c
9 Number of satellites visible during reading
10
Satellite fix statusd
11
Rod lengthe
12
Soil typeef
Page 29

29
VWC Measurements
Volumetric Water Content (VWC)
The soil can be thought of as being composed of soil,
water and air. The volumetric water content (VWC) is the
ratio of the volume of water in a given volume of soil to
the total soil volume. This can be expressed as either a
decimal or a percent. Three soil moisture levels of
importance can be defined as follows:
Saturation: All soil pores are filled with water. The VWC
will equal the percent pore space of the soil.
Field Capacity: The condition that exists after a saturated
soil is allowed to drain to a point where the pull of gravity
is no longer able to remove any additional water.
Permanent Wilting Point: The highest moisture content at
which a plant can no longer extract water from the soil.
Additionally, we can define Plant Available Water as the
amount of water between Permanent Wilting Point and
Field Capacity. One rule of thumb is that irrigation should
be initiated when half the Plant Available Water has been
depleted.
Time Domain Reflectometry (TDR)
The underlying principal of TDR involves measuring the
travel time of an electromagnetic wave along a wave-
guide. The speed of the wave in soil is dependent on the
bulk dielectric permittivity () of the soil matrix. The fact
that water ( = 80) has a much greater dielectric constant
than air ( = 1) or soil solids ( = 3-7) is exploited to de-
termine the VWC of the soil. The VWC measured by
TDR is an average over the length of the waveguide.
Page 30

30
Electronics in the TDR 350 generate and sense the return
of a high energy signal that travels down and back,
through the soil, along the waveguide composed of the
two replaceable, stainless steel rods. The sampling volume
is an elliptical cylinder that extends approximately 3 cm
out from the rods. The high frequency signal information
is then converted to volumetric water content. High
amounts of clay or high electrical conductivity
(EC>2 mS/cm) will attenuate the high-frequency signal
and affect the reading displayed by the meter. Very high
organic matter content will similarly affect the VWC reading.
GPS Status
For best results, wait until the GPS has located as many
satellites as possible. When GPS is enabled and the location is fixed, the icon will change from white, to gray, to
black. A black icon indicates the meter has detected 10 or
more satellites. If differential correction is available, the
GPS icon will include a crosshairs icon as well.
GPS coverage will be best when you have a clear view of
the sky. The GPS receiver is in the front of the meter (near
the USB port). When taking readings, the receiver should
be pointed away from any structures or other obstacles
such as trees.
Page 31

31
Optional Accessories
There are two optional items that can be used to expand the capabilities of
the TDR350. They are described briefly below. See the website for the
product's specific user information and installation instructions.
Infrared Temperature Sensor (item 6435TS)
The Infrared Temperature Sensor is an alternate to the sur-
face temperature sensor. The sensor detects the infrared sig-
nature from the surface just ahead of the sensor block. This
allows for an instantaneous and highly accurate temperature
reading.
TDR Spacer (item 6435SP)
There are 4 default rod-length options for the
TDR350 (1.5", 3.0", 4.8", and 8.0"). The Rod Spacer
allows for the measurement of 0.5" or 1.0" soil
depths. This can help identify how fast and firm the
greens are. The spacer will only work for meters
equipped with 1.5" Turf rods. The spacer must be placed over the end of a
sensor block. This constrains the rods from being fully inserted. The spacer has two orientations allowing it to work for either desired depth. The
meter must be running firmware version 1.02 or greater to be compatible
with the TDR Spacer.
Page 32

32
Rod Length Water
8 inches (20 cm) 60 - 65%
4.8 inches (12 cm) 70 - 75%
3 inches (7.5 cm) 75 - 80%
1.5 inches (3.8 cm) 65 - 70%
Note: The meter does not read 100% in water because the soil moisture
calibration equations were created to be most accurate in the volumetric
water contents typically found in mineral soils.
Appendix 1
Checking VWC Readings
There are two tests that can be performed to check if the meter is operating properly.
Test 1 (No rods): Disconnect the rods from the probe block. Select the
Period option for Moisture Type (p. 13). With no rods connected, the
meter should read 1930 ± 30 µs.
Test 2 (Rods attached): Readings can be taken in three standard environments; air, distilled water, and playground sand saturated with distilled
water. It is important that any troubleshooting be done with distilled water. Readings taken in tap water can differ greatly from the expected results observed in distilled water. When readings are taken in water and
saturated sand, the container should have a diameter of at least 3 inches
(7.5cm) and should be tall enough so the rods can be completely immersed or inserted.
Readings should be taken with the Soil Type set to Standard (p. 12) and
Moisture Type (p. 13) set to TDR 300 mode. Be sure that the correct
Rod Length (p. 12) is selected. The meter should read VWC=0% in air.
In saturated sand, it should read between 35% and 45%. The table below
shows the approximate ranges of volumetric water content that are expected for the different rod lengths in distilled water.
Page 33

33
For maximum accuracy, you may
choose to perform a soil-specific
calibration rather than use either of
the internal (Standard, High Clay,
or Sand) soil calibrations coded into
the TDR 350’s firmware. In these
cases, an independent soil moisture content measurement
is required. A relation can then be developed that relates
the meter’s period reading (see Moisture Type option, p.
13) to actual volumetric water content (VWC). This is
most easily accomplished by doing a regression of one set
of data against another.
VWC data can be obtained with a device such as a neutron
probe, by measuring the weight of a saturated soil column
of known volume as it is gradually dried, or by gradually
wetting a known volume soil with the addition of known
increments of water. In most cases, however, the calibration will be done with gravimetric sampling. This procedure is briefly described below.
In the field, establish a number of sites to sample. Each
site should be wetted to a different soil moisture content
by adding varying amounts of water. At each site a Field
Scout TDR reading is taken followed by the extraction of
a known volume of soil. Ideally, this would be an undisturbed soil core. The wet weight of this soil must be determined. If the soil cannot be weighed immediately, it
should be stored in a plastic bag to reduce evaporation.
The soil is then oven-dried (105oC for 48 hours is a common requirement) and weighed again. The volumetric water content is calculated as follows:
Appendix 2
Soil-Specific
Calibration
Page 34

34
VWC = 100*(M
wet
- M
dry
)/(w*V
tot
)
Where:
M
wet, Mdry
= mass (g) of wet and dry soil respectively
V
tot
= total soil volume (ml)
w = density of water (1g/ml)
An alternate, but equivalent, calculation can be obtained
from the gravimetric water content and soil bulk density.
VWC = GWC *(bw)
Where GWC is the gravimetric water content and b is the
bulk density:
GWC = 100*(M
wet
- M
dry
)/M
dry
b = M
dry/Vtot
The final step is to plot the calculated the measured period
values with the readings obtained from Field Scout TDR
meter. Regression analysis can then be performed on this
data to develop an equation to convert from period to
VWC.
Page 35

35
Appendix 3
FAQ
1. What are the factory default settings?
2. What type of sensor is used to measure surface temperature?
The sensor on the underside of the probe block is a thermistor.
3. What type of differential correction are available for
the GPS receiver?
The Wide Area Augmentation System (WAAS) is used in
North America. The European Geostationary Navigation
Overlay Service (EGNOS) is used in Europe.
4. How do I get access to SpecConnect?
SpecConnect is a subscription-based web utility. Contact
Spectrum Technologies or your distributor for details.
5. I cannot save data or load firmware with my USB
flash drive.
Check that the drive is not full. Verify that it has FAT or
FAT32 format.
6. Getting a "No Sensor" message on the display.
Confirm that the probe block is securely plugged into the
display.
Rod Length
Turf
Soil Type
Standard
Backlight, GPS,
Bluetooth
Disabled
Sound
On
Temperature
Fahrenheit
Temp Source
Soil Sensor
Moisture
VWC
EC units
Salinity Index
Auto-Off
15 minutes
Time Zone
GMT
Page 36

R - 05/18
DECLARATION OF CONFORMITY
Spectrum Technologies, Inc.
3600 Thayer Ct.
Aurora, IL 60504 USA
Model Numbers: 6435
Description: Portable Soil Moisture\Conductivity\Temperature Probe
Type: Electrical Equipment for Measurement, Control, and Laboratory
Use
Directive: 2004/30/EU
Standards: EN 61326-2:2012
EN 61000-6-1:2007
EN 61000-6-3:2007+A1:2010
ICES-003:2016; ITE Emissions for Canada (ANSI C63.4:2014)
FCC Part 15:2016: Emissions for Unintentional Radiators for
USA (ANSI C63.4:2014)
EN 55032:2015
Paul Martis, Hardware Engineering Manager February 6, 2017
3600 Thayer Ct.
Aurora IL 60504
(800) 248-8873 or (815) 436-4440
Fax (815) 436-4460
E-Mail: info@specmeters.com
www.specmeters.com
Warranty
This product is warranted to be free from defects in
material or workmanship for one year from the date of
purchase. During the warranty period Spectrum will, at
its option, either repair or replace products that prove to
be defective. This warranty does not cover damage due
to improper installation or use, lightning, negligence,
accident, or unauthorized modifications, or to incidental
or consequential damages beyond the Spectrum product. Before returning a failed unit, you must obtain a
Returned Materials Authorization (RMA) from Spec-
trum. Spectrum is not responsible for any package that
is returned without a valid RMA number or for the loss
of the package by any shipping company.
 Loading...