

Page 1
de
quant® Pharo 300
Spectroquant
®
Pharo 300
Page 2

Operating manual
en
Spectroquant
®
UV/VIS Spectrophotometer
Pharo 300
Spectroquant
®
Pharo 300
Page 3

Spectroquant
®
UV/VIS Spectrophotometer
Pharo 300
General Information
Spectroquant
®
Pharo 300
Page 4

Spectroquant® photometers
Contents
1 Photometers . . . . . . . . . . . . . . . . . . . . . . . . . . . . . . . . . . . . . . 5
1.1 Photometry . . . . . . . . . . . . . . . . . . . . . . . . . . . . . . . . . . . . . 5
1.2 The Photometers. . . . . . . . . . . . . . . . . . . . . . . . . . . . . . . . . 6
2 Photometric Test Kits . . . . . . . . . . . . . . . . . . . . . . . . . . . . . 6
2.1 Basic Principle. . . . . . . . . . . . . . . . . . . . . . . . . . . . . . . . . . . 6
2.1.1 Spectroquant® Cell Tests . . . . . . . . . . . . . . . . . . . . 7
2.1.2 Spectroquant® Reagent Tests . . . . . . . . . . . . . . . . . 7
2.2 Notes for Practical Use . . . . . . . . . . . . . . . . . . . . . . . . . . . . 8
2.2.1 Measuring Range . . . . . . . . . . . . . . . . . . . . . . . . . . 8
2.2.2 Influence of pH . . . . . . . . . . . . . . . . . . . . . . . . . . . . 10
2.2.3 Influence of Temperature . . . . . . . . . . . . . . . . . . . . 10
2.2.4 Time Stability . . . . . . . . . . . . . . . . . . . . . . . . . . . . . 10
2.2.5 Influence of Foreign Substances. . . . . . . . . . . . . . . 11
2.2.6 Dosing of Reagents . . . . . . . . . . . . . . . . . . . . . . . . 11
2.2.7 Shelf-life of the Reagents . . . . . . . . . . . . . . . . . . . . 12
3 Sample Preparation. . . . . . . . . . . . . . . . . . . . . . . . . . 12
3.1 Taking Samples . . . . . . . . . . . . . . . . . . . . . . . . . . . . . . . . . . 12
3.2 Preliminary Tests . . . . . . . . . . . . . . . . . . . . . . . . . . . . . . . . . 13
3.3 Dilution . . . . . . . . . . . . . . . . . . . . . . . . . . . . . . . . . . . . . . . . 13
3.4 Filtration . . . . . . . . . . . . . . . . . . . . . . . . . . . . . . . . . . . . . . . 14
3.5 Homogenization. . . . . . . . . . . . . . . . . . . . . . . . . . . . . . . . . . . . . . . . . . . . . . . . 15
3.6 Decomposition . . . . . . . . . . . . . . . . . . . . . . . . . . . . . . . . . . . . . . . . . . . . . . . . . 15
4 Pipetting System . . . . . . . . . . . . . . . . . . . . . . . . . . . . . . . . . 17
5
Analytical Quality Assurance (AQA)
5.1 Quality Control at the Manufacturer . . . . . . . . . . . . . . . . . . 18
5.2 Quality Control for the User. . . . . . . . . . . . . . . . . . . . . . . . . 19
5.2.1 Checking the Photometer . . . . . . . . . . . . . . . . . . . . 20
5.2.2 Checking the Overall System . . . . . . . . . . . . . . . . . 20
5.2.3 Checking the Pipettes . . . . . . . . . . . . . . . . . . . . . . . 21
5.2.4 Checking Thermoreactors. . . . . . . . . . . . . . . . . . . . 21
5.2.5 Testing for Handling Errors . . . . . . . . . . . . . . . . . . . 22
5.3 Determination of Sample Influences . . . . . . . . . . . . . . . . . . 22
5.4 Definition of Errors . . . . . . . . . . . . . . . . . . . . . . . . . . . . . . . 23
. . . . . . . . . . . . . . . 18
4
Release 06/2014
Page 5

1 Photometers
1.1 Photometry
Spectroquant® photometers
When a beam of light is transmitted through a colored solution, then this
beam loses its intensity, in other words a part of the light is absorbed by
the solution. Depending on the substance in question, this absorption
occurs at specific wave lengths.
Monochromators (e. g. narrow-band interference filters, lattices) are used
to select the wavelength from the total spectrum of a tungsten-halogen
lamp (VIS spectrum), a deuterium lamp (UV spectrum) or, respectively, a
xenon lamp.
The intensity of the absorption can be characterized using the transmittance T (or, respectively, T in percent).
T = I/I
0
I0 = Initial intensity of the light
I = Intensity of the transmitted light
If the light is not absorbed at all by a solution, then this solution has a
transmittance of 100 %; a com plete absorption of the light in the solution
means 0 % transmittance.
The measure generally used for the absorption of light is the absorbance
(A), since this correlates directly with the concentration of the absorbing
substance. The fol lowing connection exists between absorbance and
transmittance:
A = – log T
Experiments by BOUGUER (1698–1758) and LAMBERT (1728 –1777)
showed that the absorbance is dependent on the thickness of the absorbing layer of the cell used. The relationship between the absorbance
and the concentration of the analyte in ques
(1825–1863). The com
bination of these two natu ral laws led to the deri va-
tion was discovered by BEER
tion of Lambert-Beer’s law, which can be described in the form of the following equation:
A = · c · d
=
Molar absorptivity, in l/mol x cm
d = Path length of the cell, in cm
c = Concentration of the analyte, in mol/l
Release 06/2014
5
Page 6

Spectroquant® photometers
1 Photometers
1.2 The Photometers
The photometers that belong to the Spectroquant® Analysis System differ
from con ven tional photo meters in the following important aspects:
The calibration functions of all test kits are electronically stored.
•
The measurement value can be immediately read off from the display
•
in the de sired form.
The method for the test kits (Cell Tests and reagent tests) belonging to
•
the Spectroquant® analysis system is automatically selected via the
scanning of the bar code
All cells formats used are automatically identified and the correct meas-
•
uring range is selected automatically
Instrument-supported AQA ensures that measurement results can be
•
used as secure, reproducible, and recognized analytical results.
New methods can be downloaded from the internet site
•
www.service-test-kits.com and permanently stored in the instrument.
.
.
For technical data and instructions for use please refer to the section
“Function description” or can also be found on the internet.
2 Photometric Test Kits
2.1 Basic Principle
By means of reagents, the component of a sample to be analyzed is converted into a colored compound in a specific reaction. The reagents or
reagent mix tures contain – in addition to the reagent selective for a parameter to be determined – a number of auxi liary substances that are
essential for the course of the reaction. These include, for example, buffers
for adjusting the pH to the optimal value for the reaction, and masking
agents that suppress or mini mize the influence of interfering ions.
The color reactions are in most cases based on standardized analytical
methods specifically optimized in terms of ease of use, a low working
effort, and shorter reaction times. Furthermore, methods cited in the literature or developed by ourselves are also used
erence procedures are stated in the package insert or else in the parameter overview.
. Details on the respective ref-
6
Release 06/2014
Page 7
2 Photometric Test Kits
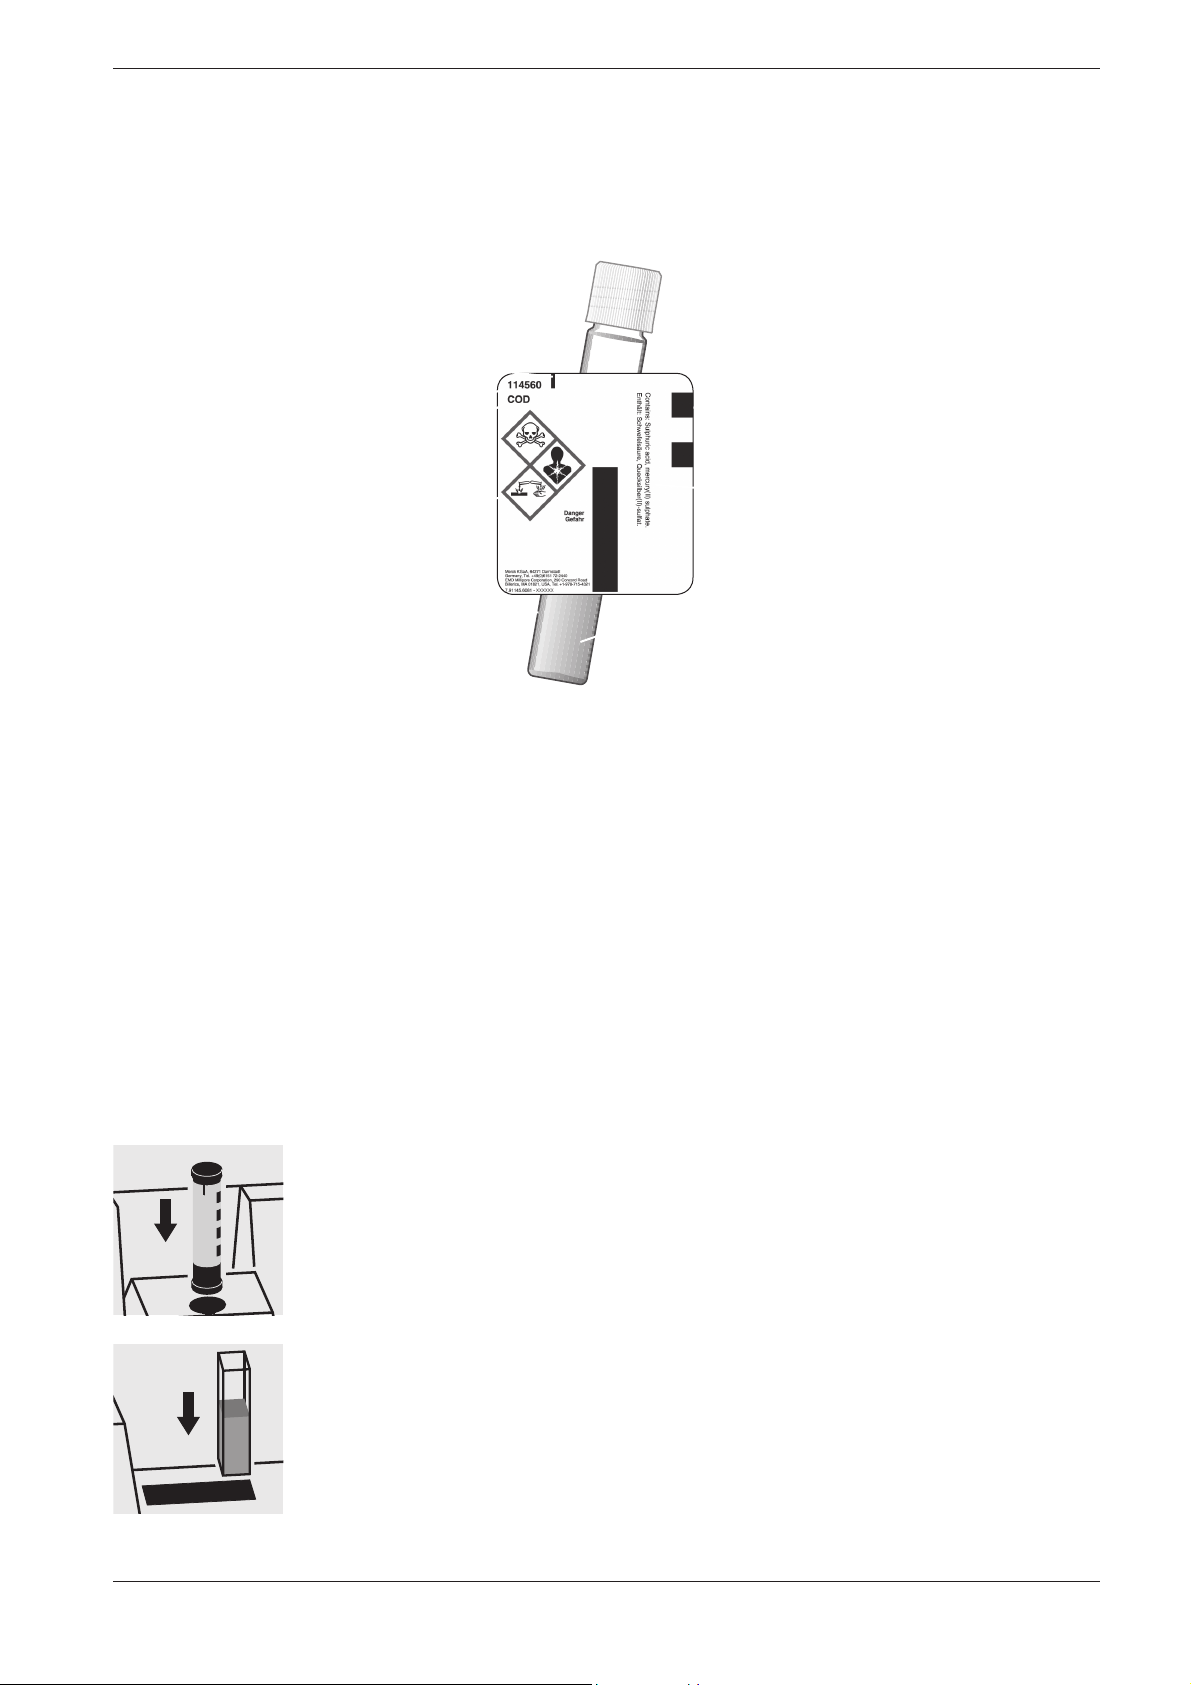
2.1.1 Spectroquant® Cell Tests
Identification mark for the
correct insertion into the cell
compartment of the photometer
Cat. No. of test kit
Spectroquant® photometers
Leakproof cap
Bar code for identification
in the photometer
Designation of test kit
Risk phrases
Special cell in
optical quality
Additional reagent(s)
Certain cell tests, e. g. COD or nitrite, already contain all necessary reagents in the cells, and the sample must merely be added with a pipette.
In other tests, however for reasons of chemical compatibility it is necessary to separate the test into two or three different reagent mixtures. In
such cases, besides the sample a metered reagent must also be added.
2.1.2 Spectroquant® Reagent Tests
The principle behind the reagent tests is that the reagents necessary for the
color reaction are com bined in the form of liquid concentrates or solid-substance mixtures
sample.
enhances the sensitivity of the detection
classical photometry by which the sample is made up to a defined volume
in a volumetric flask is dispensed with.
Details regarding contents
Highly precise dosage of
the reagent
. A few drops of the reagent concentrate are added to the
This means that there is no need to dilute the sample, which in turn
. The procedure generally used in
Release 06/2014
The method is selected automatically by means of the scanning of the bar
code by the AutoSelector.
All cells formats used are automatically identified and the correct measuring range is selected automatically.
Subsequently the result is automatically shown on the display
.
7
Page 8

Spectroquant® photometers
2 Photometric Test Kits
2.2 Notes for Practicle Use
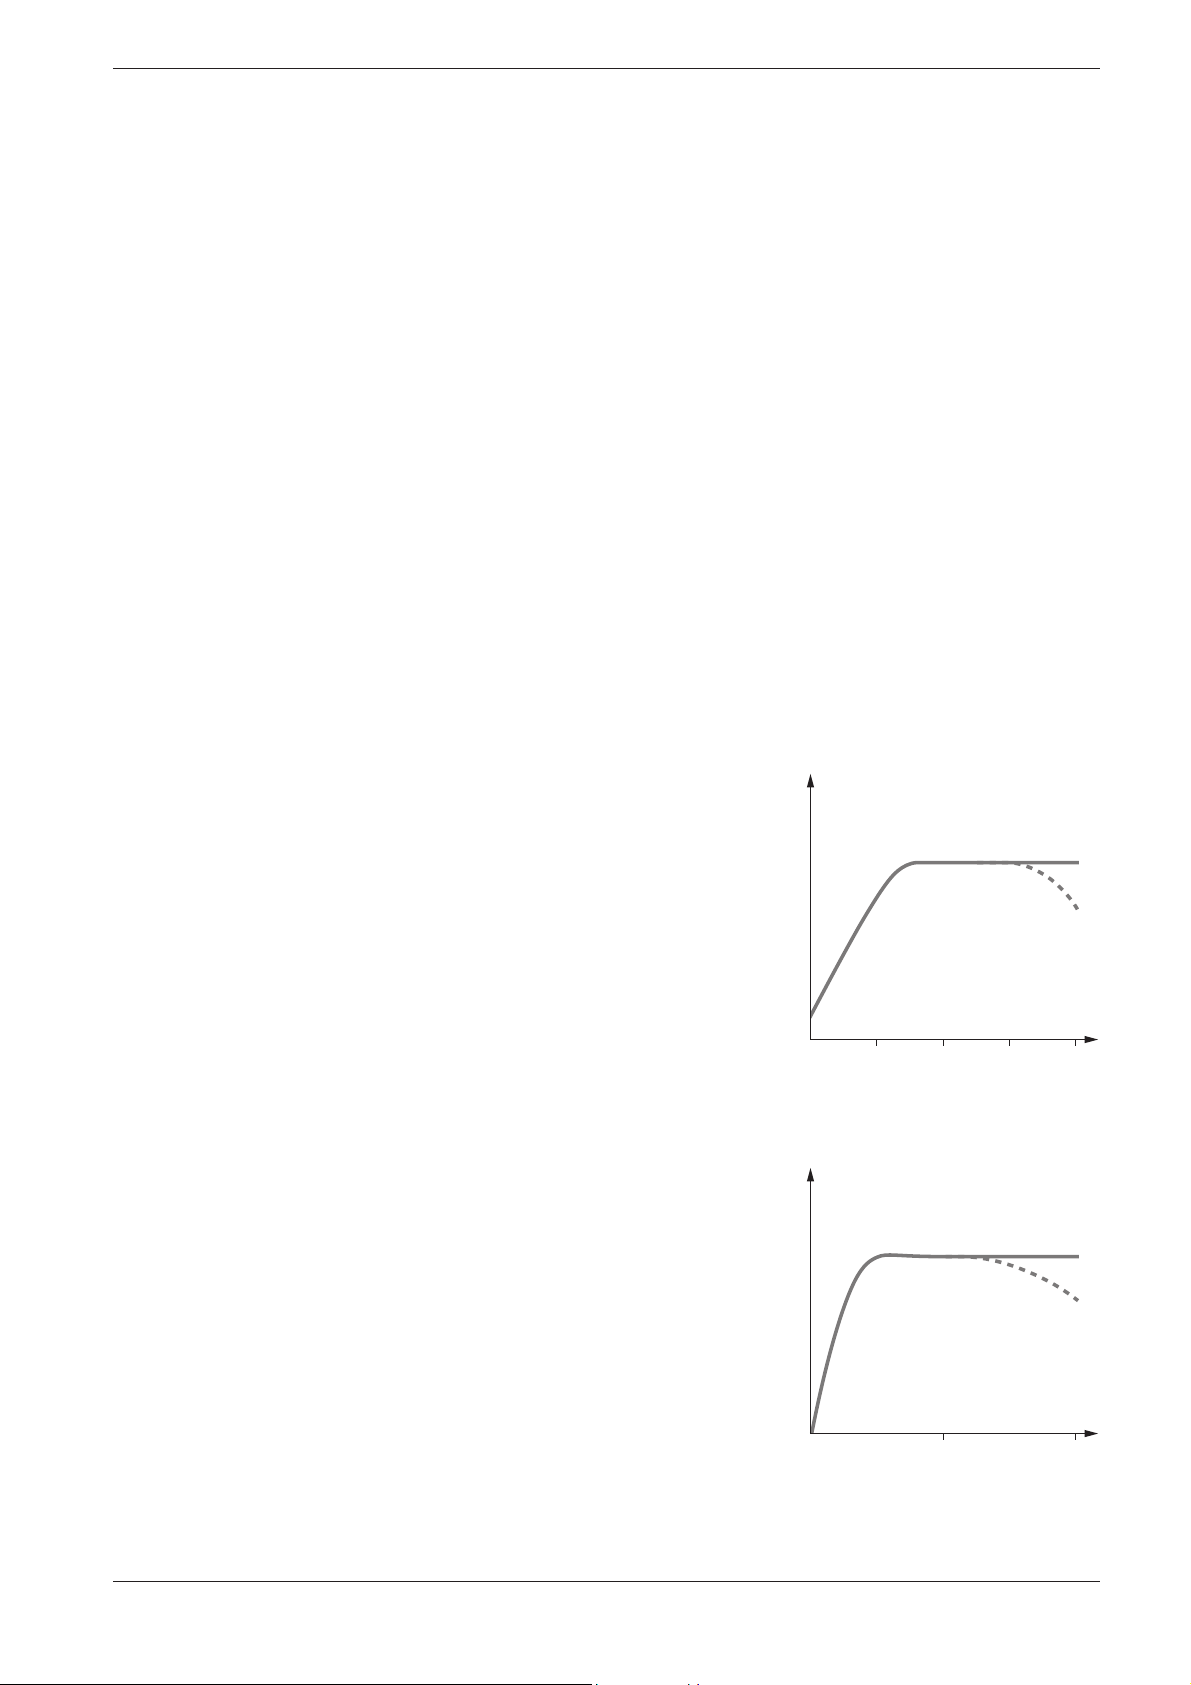
2.2.1 Measuring range
The intensity of the color of a solution, measured as the absorbance, is
proportional to the concentration of the respective analyte only within a
specific range. This mea sur ing range (effective range) is electro nically
stored in the photometers for each in di vidual test kit .
Below the specified measuring range, either a different cell or else another
procedure must be used. The lower limit of the measuring range either
takes the form of non linearity of the calibration curve, as shown in the
figure, or else is given by the method detection limit. The method detec-
tion limit of an analytical method is the lowest concentration of the analyte in question that can be measured quantitatively with a defined degree
of probability (e. g. 99 %).
The upper limit of the measuring range is the point at which the linear
correlation between the concentration and the absorbance ends. In such a
case the sample must be diluted accordingly so that it lies ideally in the
middle of the ef fective range (least-error measurement).
Absorbance
In photometry it is conventional practice to measure against the reagent
blank va lue. Here the analysis is carried out “blind”, i.e. without any analyte added. In stead of the sample volume, the corresponding quantity of
distilled or DI water is used. This reagent blank value is prestored in the
photometers belonging to the Spectroquant® analysis system, which
means that - due to the high batch reproducibility - it is possible to dispense with a separate measurement of the reagent blank. At the lower
limit of the measuring range, the accuracy of the determination can be
enhanced by performing the measurement against a separately prepared
reagent blank.
In some cases the intensity of the color of the solution and thus the absorbance can drop again when very high concentrations of the analyte
are present (see package insert).
Concentration
8
Release 06/2014
Page 9
2 Photometric Test Kits
2.2.2 Influence of pH
Chemical reactions follow an optimal course only within a certain pH
range. The rea gents contained in the test kits produce an adequate buffering of the sample sol u tions and ensure that the pH optimal for the reaction in question is obtained.
Strongly acidic (pH < 2) and strongly alkaline (pH >12) sample solutions
can prevent the pH from being adjusted to an optimal range, since under
certain circumstances the buffering capacity of the test-kit reagents may
not be sufficient. Any necessary correction is made by the dropwise addition of diluted acid (reduces the pH) or diluted lye (raises the pH), testing
the pH with suitable indicator strips after each drop is added. The addition
of the acid or lye results in a dilution of the test solution. When up to five
drops are added to 10 ml of sample, the change in the volume can be
neglected, since the resultant error is lower than 2 %. The addition of larger quantities should be duly con sidered by adjusting the sample volume
accordingly.
The specified pH values for the sample solution and, wherever applicable,
for the measurement solution are defined in the respective package
inserts and in the analy sis instruc tions in chapter 3 of the manual.
Spectroquant® photometers
2.2.3 Influence of Temperature
The temperature of the sample solution and the reagents may have an
effect on the color reaction and thus on the measurement result. The typical tempe ra ture course is illustrated in the figure.
If the sample temperature is lower than 15 °C, false-low results must be
reckoned with. Temperatures exceeding 30°C generally influence the stability of the com pound that is formed in the reaction. The optimal temperature for the color reaction is stated in the package inserts of the
respective Spectro quant® test kits.
Attention! After thermic decomposition proce dures, the de termination of COD or total contents of nitro gen, phos pho rus, or metal, a
sufficient wait ing time must be allowed for to permit the solution
cool to room temperature.
2.2.4 Time Stability
Most of the color reactions require a certain time to reach the maximum
color in ten sity. The solid curve in the figure at the right gives a schematic
impression of a typical time course. The behavior of relatively instable color reactions with time is shown by the dotted curve.
The reaction time specified in the working instruc tions refers to the period
of time from the addition of the last reagent until the actual measurement.
In addition, the package inserts for the individual test kits also state the
time interval in which the mea sure ment value does not change. The maximum time inter val is 60 minutes; this time should not be ex ceeded, even in
the case of stable color reactions.
Absorbance
Absorbance
10 30
20 40
Temperature (°C)
Release 06/2014
30 60
Reaction time (minutes)
9
Page 10
Spectroquant® photometers
2 Photometric Test Kits
2.2.5 Influence of Foreign Substances
Foreign substances in the sample solution can
raise the measurement value as a result of an amplification of the
•
reaction
lower the measurement value as a result of a prevention of the reaction.
•
A quantification of this effects is stated in tabular form in the respective
package inserts for the most important foreign ions. The tolerance limits
have been deter mined for the indi vidual ions; they may not be evaluated
cumulatively.
Suitability for use in seawater
A tabular survey (see appendix 1) provides infor mation on the suitability of
the tests in connection with seawater and also on the tolerances for salt
concentrations.
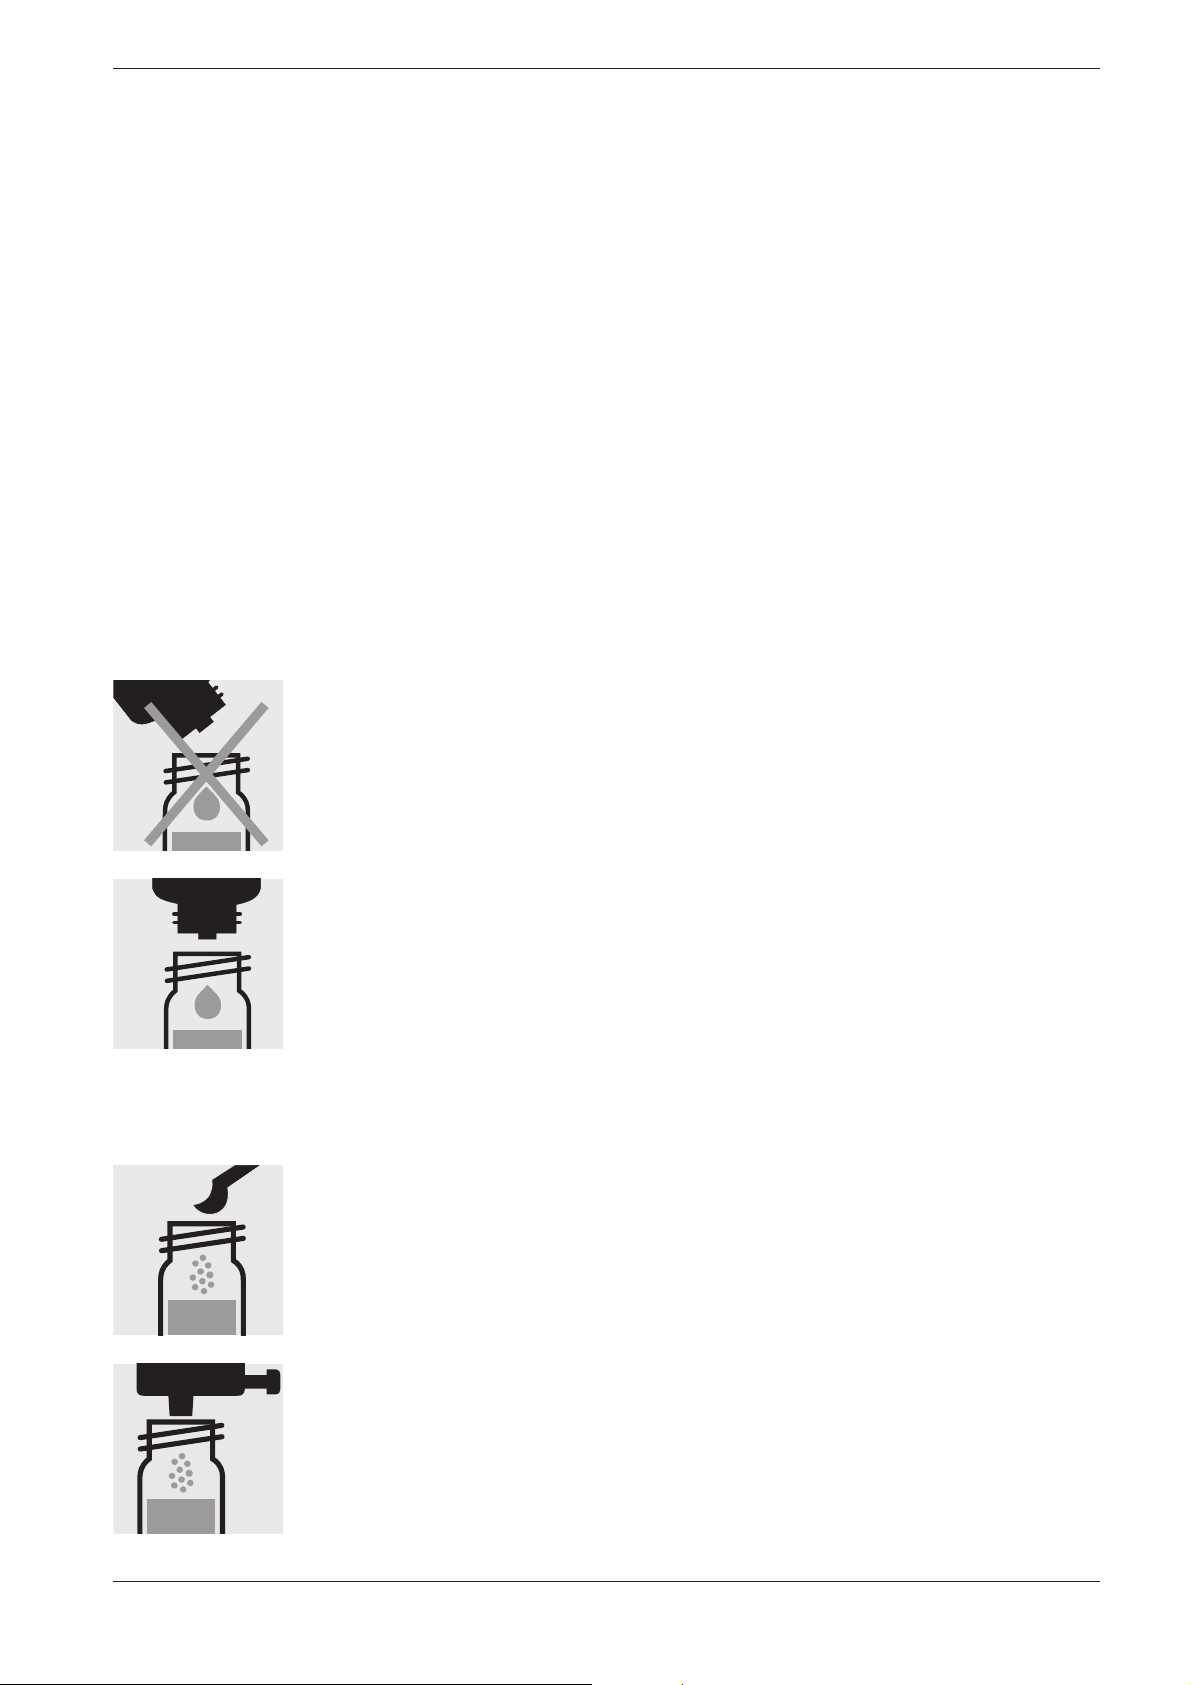
2.2.6 Dosing the Reagents
Small amounts of liquids are dosed by counting the number of drops from
a leak proof bottle
bottle be held vertically and that the drops be added slowly
(approx. 1 drop per second). If this is not observed, the cor-
m
achieved.
A positive-displacement pipette should be used for larger quantities of liquid or for the exact dosage of smaller reagent quantities. In these cases
the reagent bottles are not fitted with a dropper insert.
Solid substances are dosed either with the dose-metering cap or with
microspoons that are integrated into the screw cap of the respective reagent bottle. The dose-metering cap is used for solid reagents or reagent
mixtures that are free-flowing.
In all other cases the substances are dosed with the microspoon.
In this case it is necessary to add only level microspoonfuls. To this end
the spoon must be drawn over the brim of the reagent bottle
When using dropper bottles it is extremely important that the
rect drop size and thus the correct amount of reagent are not
.
.
10
At the first use replace the black screw cap of the reagent bottle by the
dose-metering cap.
Hold the reagent bottle vertically and, at each dosage, press the slide all
the way into the dose-metering cap. Before each dosage ensure that the
slide is completely retracted.
end of the measurement series, since the function of the rea-
m
Reclose the reagent bottle with the black screw cap at the
gent is impaired by the absorption of atmospheric moisture.
Release 06/2014
Page 11

2 Photometric Test Kits
2.2.7 Shelf-life of the Reagents
The Spectroquant
stored in a cool, dry place. A few test kits have a lower shelf-life of 18 or
24 months or must else be stored in a refrigerator.
COD Cell Tests must be stored protected from light.
The expiry date of the package unit is printed on the outer label. The shelflife may become reduced when the reagent bottles are not reclosed tightly
after use or when the test kit is stored at temperatures higher than those
specified.
®
test kits are in most cases stable for 3 years when
3 Sample Preparation
Sample preparation covers all the steps necessary before the actual analysis can be performed.
3.1 Taking Samples
Spectroquant® photometers
The taking of samples is the first and most impor tant step on the way to
obtaining the correct ana lysis result. Not even the most exact method of
analysis can correct any mistakes made in the taking of the sample. The
objective of the sampling proce dure is to gain a sample with a representative com position. The most important pre condition for gain ing a re-
presentative sample is the identification of the suitable sampling site.
Here it must be borne in mind that the solution to be investigated can display varying con centrations in different places at different times.
In sampling, a distinction is made between manual and automatic methods. In many cases a true picture of the average composition of the sample can be obtained only once several individual samples have been collected; this can be done manually or with an automatic sampler.
Clean plastic containers with a volume of 500 or 1000 ml are suitable for
collecting samples. They should be rinsed several times, under vigorously
shaken, with the water to be investigated, and then filled free of air bubbles and immediately closed tightly. The containers must be protected
against the effects of air and heat and then be forward ed for the further
analytical steps as soon as possible. In ex ceptional cases, preserva tion
measures in the form of short-term refrigeration at +2 to + 5 °C and
chemical conservation can be taken.
Parameter Preservation
COD +2 to + 5 °C max. 24 h or
–18 °C max. 14 days
N compounds: analyze immediately, only in exceptional case
NH4-N, NO3-N, NO2-N
P compounds: short-term storage, no preservation;
PO
-P, P total with nitric acid to
4
Heavy metals short-term storage, no preservation;
with nitric acid to
+2 to + 5 °C max. 6 h
pH 1, max. 4 weeks
pH 1, max. 4 weeks
Release 06/2014
11
Page 12

Spectroquant® photometers
3 Sample Preparation
3.2 Preliminary Tests
Correct measurement results can be obtained only within the measuring
range spe ci fied for each indi vi dual parameter. When dealing with sample
solutions of an un known concentration, it is advisable to establish whether
the sample concentration is indeed within the specified measuring range,
ideally roughly in the middle of the range.
Preliminary tests enhance the analytical reliability and make the determination of the necessary dilution ratios in the case of high concentrations
easier. MQuantTM Test Strips are very well suited for preliminary tests.
3.3 Dilution
Dilution of samples is necessary for two reasons:
The concentration of the parameter under investigation is too high, i. e.
•
it lies out side the measuring range.
Other substances contained in the sample interfere with the determina-
•
tion (matrix interference); false-high or false-low results may ensue.
The following auxiliaries are absolute prerequisites for the dilution of the
sample:
Volumetric flasks of varying sizes (e. g. 50, 100 and 200 ml)
•
Positive-displacement pipette
•
Distilled or DI water.
•
Only dilutions carried out with these auxiliary pro ducts are of sufficient reliability in the area of trace analysis, to which photometry belongs (for the
sim pli fied procedure see page 14).
An important aspect here is that once the volumetric flask has been filled
up to the mark with distilled water the flask is closed and the contents are
thoroughly mixed.
The dilution factor (DF) resulting from the dilution procedure is calculated
as follows:
D
Initial volume (sample volume)
The analytical result is subsequently multiplied by the dilution factor.
A calculation can be dispensed with when the dilu tion is programmed into
the pho tometer. The dilution number (see the table on page 14) is
entered and the measure ment value is subsequently calculated cor rectly
and immediately displayed.
Final volume (total volume)
=
F
12
Release 06/2014
Page 13

3 Sample Preparation
All dilutions should be made in such a way that the measurement value
lies in the middle of the measur ing range. As a rule, the dilution factor
should never be higher than 100. In the event that yet higher dilu tions
become necessary all the same, then this must be done in two separate
steps.
Example
Step 1: Make up 2 ml of sample to 200 ml with distilled water;
D
Step 2: Take 5 ml of the above solution and make up to 100 ml;
D
The dilution factor for the total dilution is calcu lated by multiplying the
individual dilutions:
D
Simplified procedure
Dilutions up to 1:10 can also be prepared without volumetric flasks in a
glass bea ker, measuring the volumes of the sample and the dilution water
using a pre viously calibrated positive-displacement pipette (see table for
instructions).
= 100, dilution number 1+ 99
F
= 20, dilution number 1+19
F
= DF1 x DF2 = 100 x 20 = 2000, dilution number 1+1999
F total
Spectroquant® photometers
Desired Volume of Volume of Dilution Dilution
dilution sample
[ml] [ml]
distilled water
factor number
1:2 5 5 2 1+ 1
1:3 5 10 3 1+ 2
1:4 2 6 4 1 +3
1:5 2 8 5 1 +4
1:10 1 9 10 1 +9
3.4 Filtration
Strongly turbid samples require pretreatment before they can determined
in a photometer, since the effect of turbidity can result in considerable
variations in the measurement values and in false-high readings. Care
must be taken here to ensure that the sub stance to be deter mined is not
contained in the sus pended material, in which case a sample decompo si tion must be carried out.
Compounds that always occur in dissolved form (for example ammonium,
nitrate, nitrite, chlorine, chlo ride, cyanide, fluoride, orthophosphate, and
sulfate) permit a previous filtration, even when the sample solution is
strongly turbid.
Weak turbidity is eliminated by the automatic turbi dity-correction
feature built into the photo meter (see Function description, “Device set-up/
Correction function”); in such cases it is not necessary to filter the sample
before analysis.
As a measure to distinguish between dissolved and undissolved waterborne sub stances, the water sample can be filtered through a simple
paper filter. Following the recommendations stated in the refe rence methods, membrane filters with a pore size of 0.45 µm are required for fine
filtration.
Release 06/2014
13
Page 14
Spectroquant® photometers
3 Sample Preparation
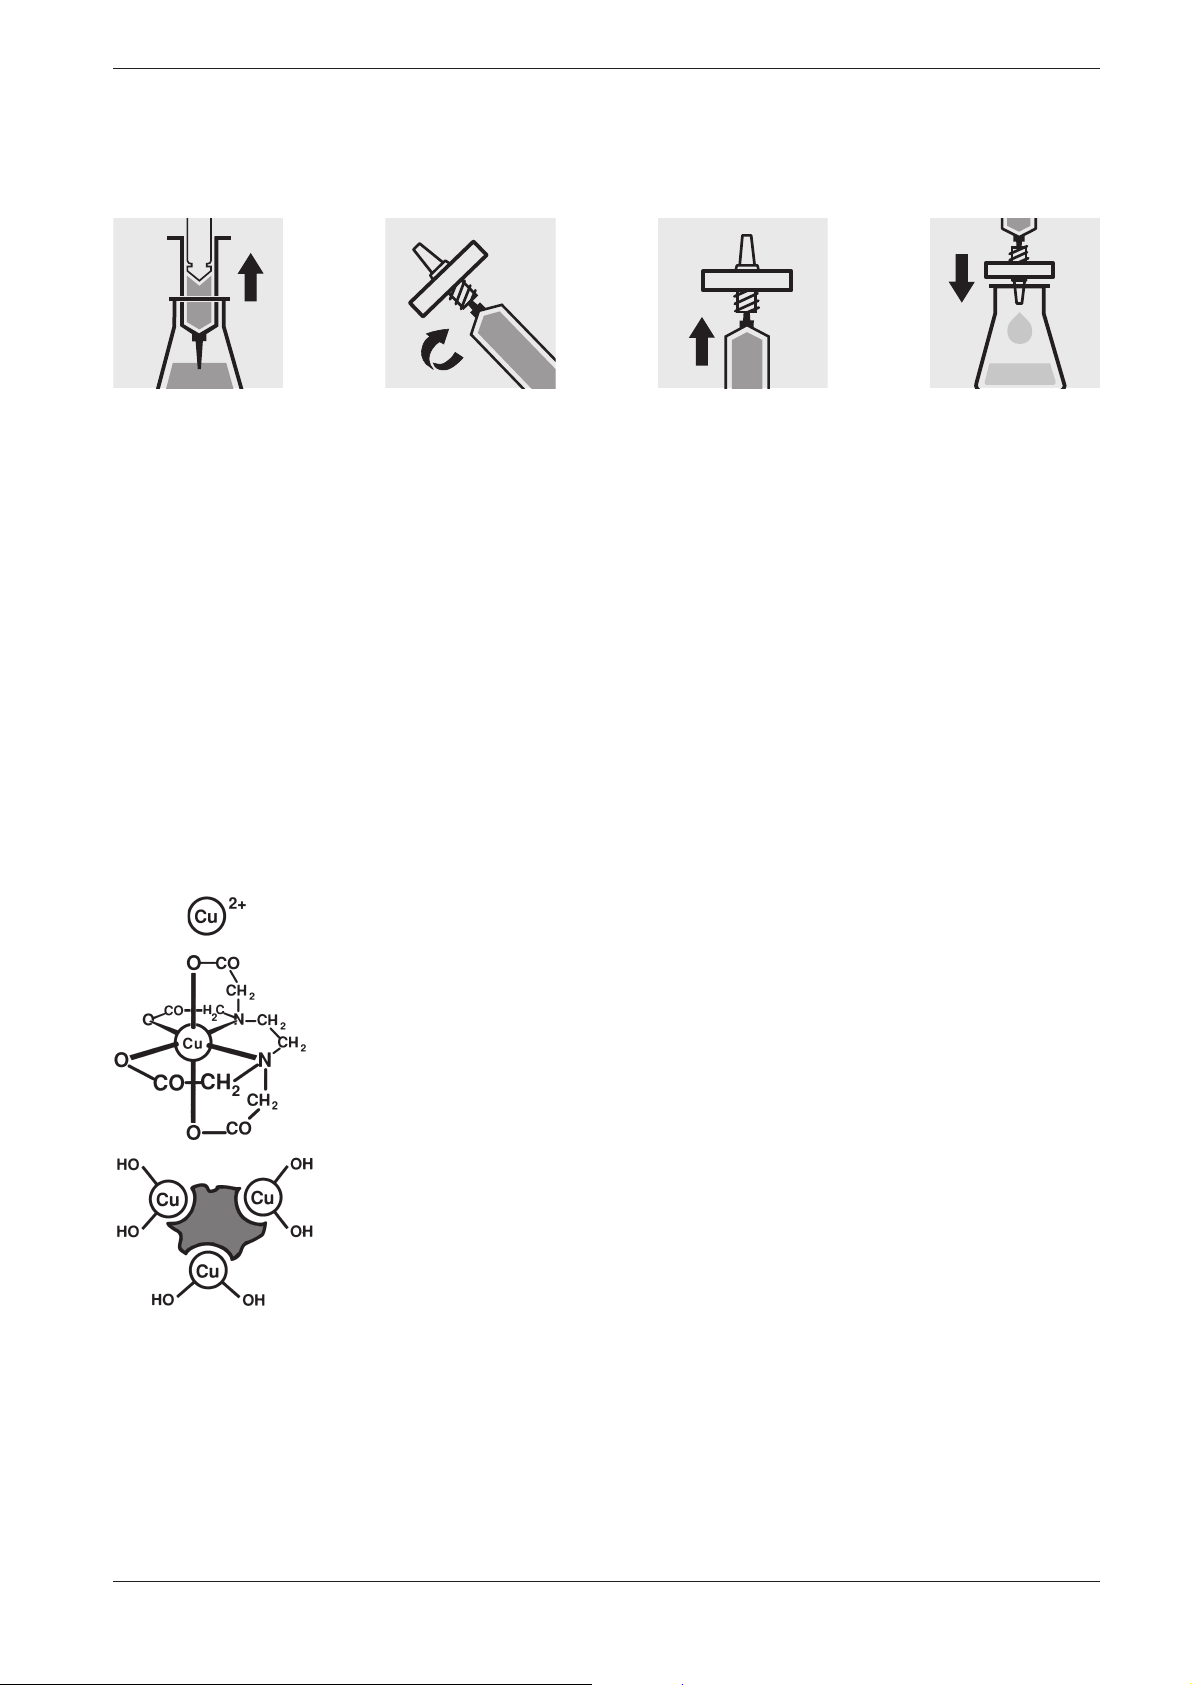
Procedure for microfiltration
Draw out the liquid
to be filtered with
the syringe.
3.5 Homogenization
3.6 Decomposition
Ion
Screw the syringe
tightly into the front
side of the mem brane-filter attachment.
As a measure to ensure that a representative sample can be taken in the
presence of suspended matter in the water sample in question, for certain
parameters - e. g. COD and the total content of heavy metals - the sample
must be homogenized. This must be carried out using a high-speed blender (2 minutes at 5000 –20 000 rpm and taking the sample while stirring.
Water-borne substances can be present in the sample for investigation in
a variety of forms: as the ion, bound more or less solidly in a complex, or
as a solid substance.
Hold the syringe
upright and slowly
depress the piston
upwards until the
membrane- filter is
fully wetted free of
air bubbles.
Filter the contents
of the syringe into
the intended glass
vessel.
14
Complex
Solid
substance
Release 06/2014
Page 15
3 Sample Preparation
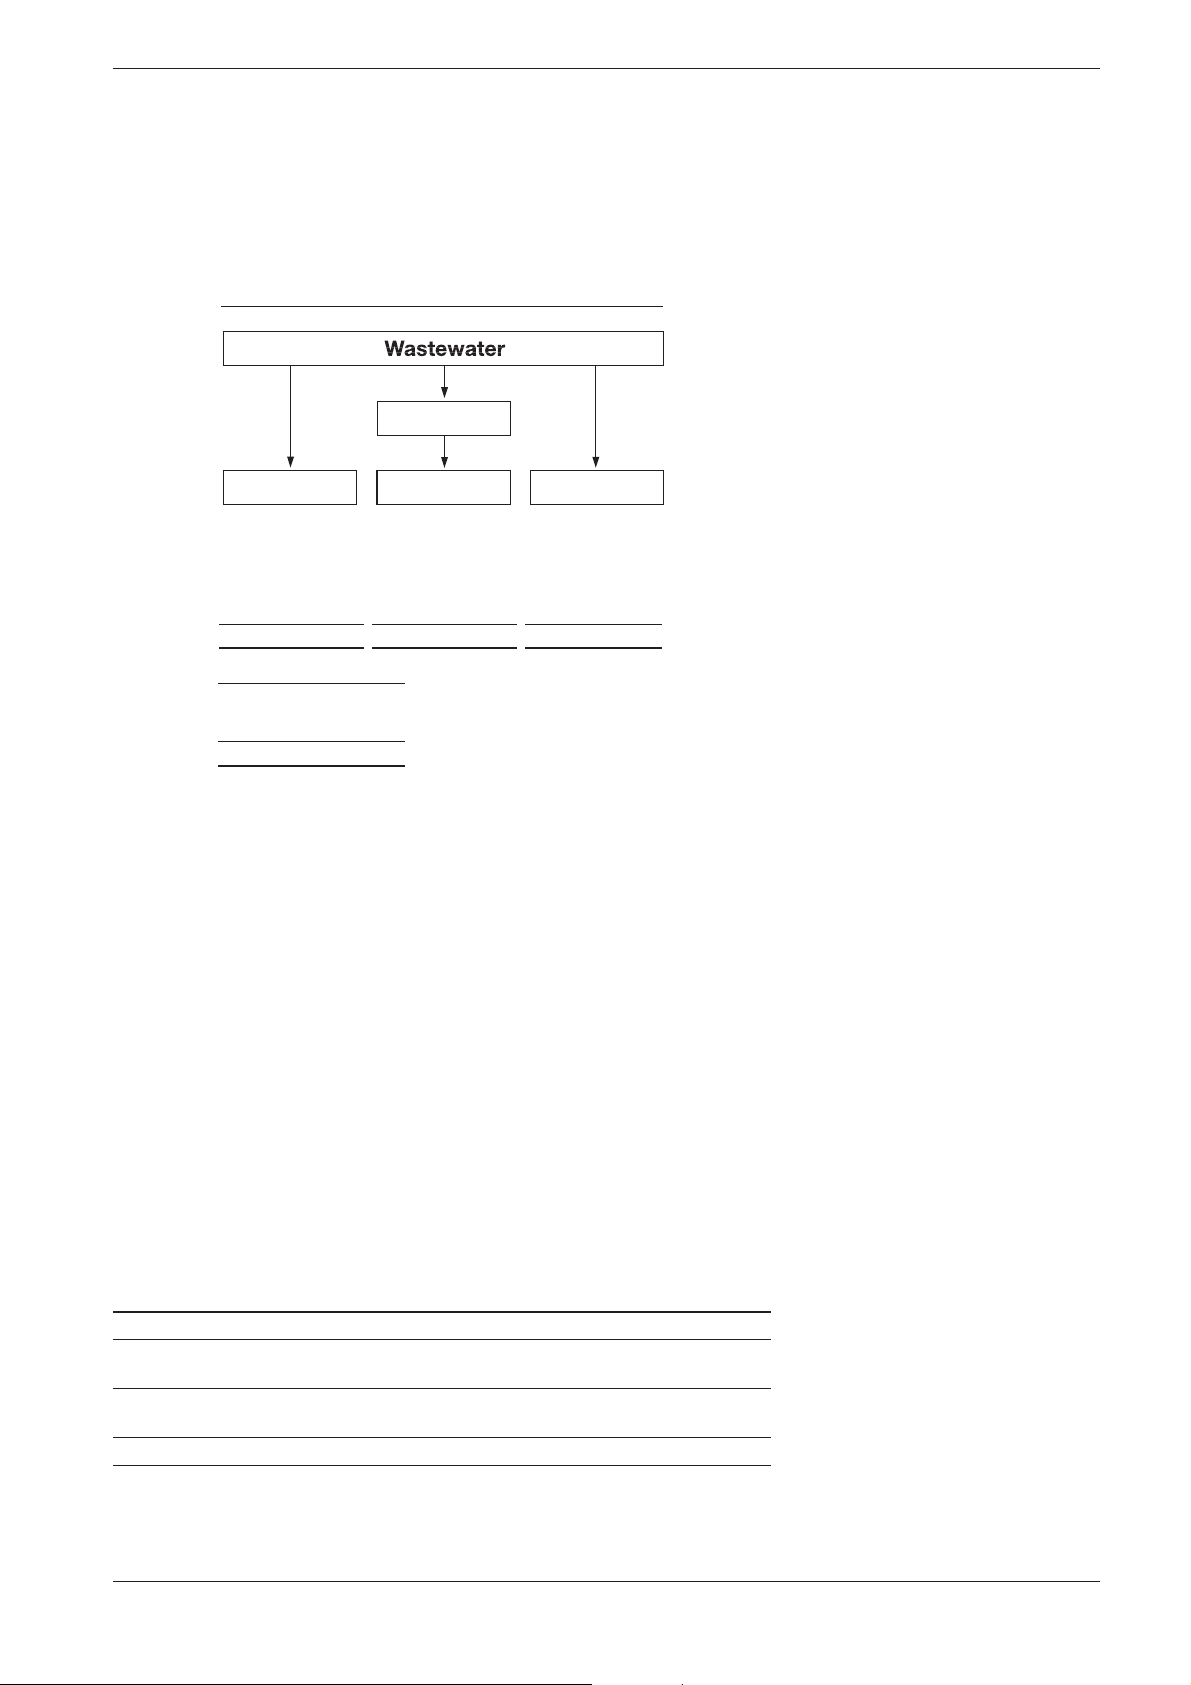
The manner in which the sample is pretreated en ables the three proportions to be dis tinguished from each other. This can be illustrated using
a copper-containing waste water sample as an example.
Example
Filtration
Spectroquant® photometers
Decomposition
Total content Dissolved proportion Dissolved proportion
Solid Substances
Cu(OH)
2
Complexes Cu-EDTA Complexes Cu-EDTA
2+
Ions Cu
Result A Result B Result C
Proportion:
Ionogenic = C
Complex = B–C
Solid Substances = A – B
Total content = A
Decomposition
2+
Ions Cu
Filtration
Ions Cu
2+
Decomposition converts the substance to be deter mined into an analyzable form. In most cases, de composition agents take the form of acids
in com bination with oxidiz ing agents; in exceptional cases (e. g. in the
determination of total nitrogen) an alka line decomposition is more effective. The type of decomposition procedure used de pends on the analyte to
be determined and the sample matrix.
The ready-to-use sample-decomposition products
Spectro
quant® Crack
Set 10 and 20 are suited for the preparation of the sample materials for
the determinations stated in the table.
The decomposition processes are carried out in the
Spectro
quant® ther-
moreactor (capacity: 12 or 24 decomposition cells) at 120°C or, respec-
tively, 100 °C. Details regarding the heating times and further treatment
can be found in the package inserts contained in the Spectroquant®
Crack Set packs.
Determination of Sample preparation with
Total phosphorus* Crack Set 10 / 10C**
Total chromium* Crack Set 10 / 10C
[= sum of chromate and chromium(III)]
Total metal Crack Set 10 / 10C
[= sum of free and complex-bound metal]
Total nitrogen* Crack Set 20
* The decomposition reagents are already contained in the packs of the respective cell tests.
** Decomposition cells are included in the pack; empty cells are required for the decomposition for
Crack Sets 10 and 20.
Release 06/2014
15
Page 16

Spectroquant® photometers
3 Sample Preparation
In the event that the sample to be analyzed is a highly contaminated material (high proportion of organic substances) or water-insoluble samples,
decomposition using concentrated acids and other agents is in dispensible
Corresponding examples from the collection of applications for real samples are available on request.
The necessity for decomposition can be checked according to the following diagram:
Decomposition
.
Procedure
Measurement
Result A
Decomposition
necessary
For wastewater with a consistent composition, this check as a rule need
be carried out only once. It is, however, advisable to check the result periodically.
No
A and B
idential?
Yes
Procedure
Measurement
Result B
No decomposition
necessary
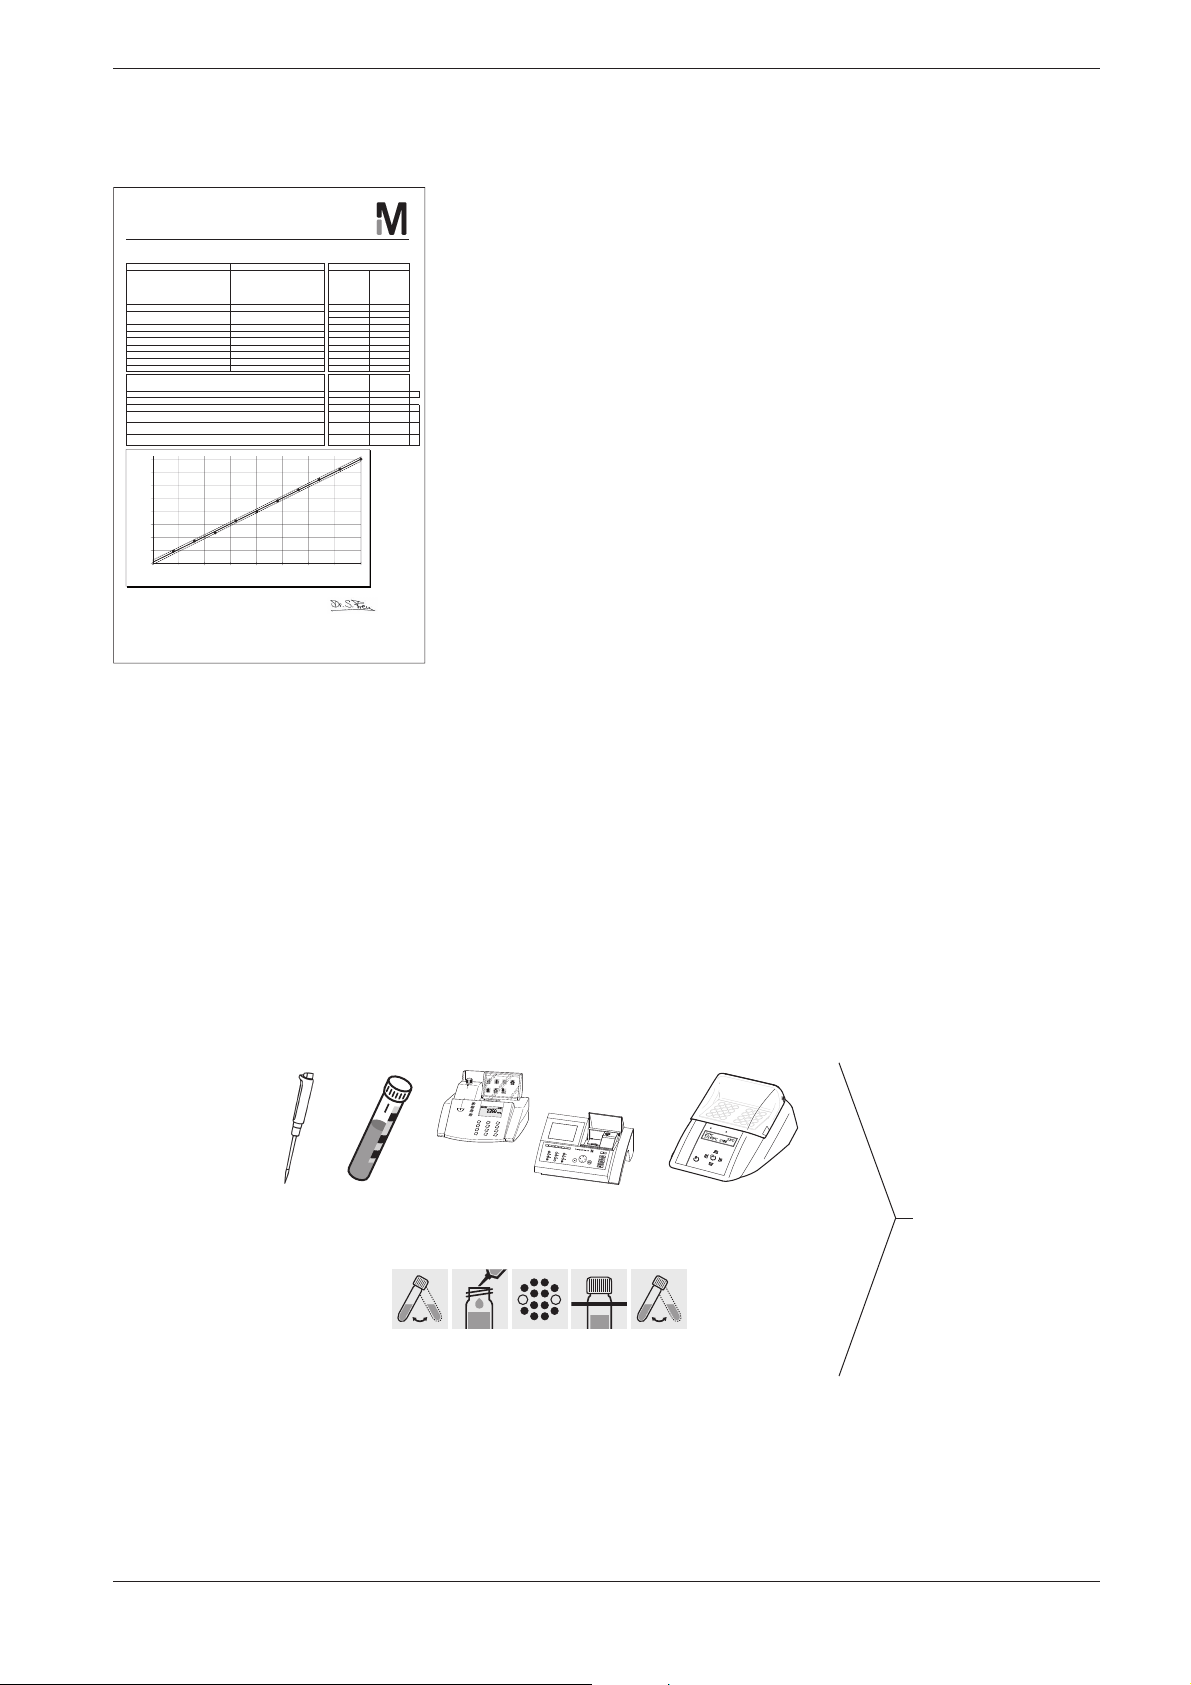
4 Pipetting System
Positive-displacement pipettes permit
an exact dosage of the sample volume
•
a precise measurement of sample and reagent volumes and of the
•
volumes of water for dilution purposes
.
Pipettes of varying volumes and also ones with a fixed volume are available.
Sources of error and hints on how to avoid them:
Closely follow the instructions for use contained with the pipette in
•
question.
Check the pipetted volumes
•
a)
1 ml of water at 20°C = 1.000 g ±1 mg
b) using Spectroquant® PipeCheck;
this is a pho tometric check of the pipette, and scales are not
necessary (see section “AQA”).
Avoidance of spread effects by rinsing the pipette several times with
•
the solution to be pipetted.
Always exchange the pipette tip.
•
Draw up the liquid slowly and depress piston completely to discharge
•
the liquid.
16
by weighing using analytical scales (weighing ac cu racy ±1 mg),
Release 06/2014
Page 17

5 Analytical Quality Assurance (AQA)
The objective of analysis must always be to determine the true content of
the analyte in question as accurately and precisely as possible.
Analytical Quality Assurance represents a suitable and indispensible
method by which the quality of the user's own work can be assessed,
errors in the measurement system diagnosed, and the comparability with
the results obtained using the respec tive refe rence methods demonstrated.
Spectroquant® photometers
Details regarding the necessity of AQA can be found
dum A 704 of the German Association for the Water Sector, Wastewater,
and Waste Materials (Deutsche Vereinigung für Wasserwirtschaft, Abwasser und Abfall e.V., DWA)
toring regulations of the Ger man federal states (available in english).
Causes for errors can include:
the working materials used
•
the handling
•
the sample under investigation.
•
These errors have effects on both the accuracy and precision of the
results obtained.
and in the corresponding self-con trol/self-moni-
in the in Memoran-
5.1 Quality Control at the Manufacturer
Photometers and photometric test kits possess specifications that are
adhered to and above all else also documented by the manufacturer.
The certificate for the photometer enclosed with each device documents the quali ty of the measuring device.
Release 06/2014
17
Page 18
Spectroquant® photometers
CSB/COD/DQO
Datum / Date / Fecha
Sollwert
Valor nominal
Chargenwert
Valor del lote
99
99
99
99
99
Merck KGaA
Chargenzertifikat
5 Analytical Quality Assurance (AQA)
The certificate for the test kit, available for each lot produced, docu-
Lot Certificate / Certificado del lote
Spectroquant® CSB-Küvettentest
®
Spectroquant
COD Cell Test / Spectroquant® Test en cubetas DQO
Art.Nr. / Cat.No. / Art. Nro. 1.14560.0001
Messbereich
Measuring Range / Intervalo de medida
Charge-Nr. / Lot no. / Lote nro. HC119527 4,0 4,7
Verwendbarkeit
Expiry date / Fecha de caducidad
Standard / Standard / Patrón Potassium hydrogen phthalat e 1.02400 16,0 16,4
Photometer / Photometer / Fotómetro Referenz / Reference / Referencia 20,0 19,9
Wellenlänge / Wavelength / Longitud de onda 340 nm 24,0 24,1
Küvette / Cell / Cubeta 16 mm rund / round / redonda 28,0 28,4
Prüfer / Tester / Verificador Fr. Brandner 32,0 32,4
Datei / File / Fichero 1145600001_HC119527_EN 40,0 40,2
Kalibrierfunktion / Calibration Function / Función de calibración
DIN 38402 A51 / ISO 8466-1
Steigung / Slope / Pendiente +/- Tolerance / Tolerancia
Ordinatenabschnitt / Ordinate segment / Interse cto en ordenadas
Reag.blindwert / Reagent blank / Valor en blanco del react +/- Tolerance / Tolerancia
Vertrauensbereich (95% Wahrscheinlichkeit )
Confidential interval (P=95%) / Intervalo de confianza (95 % de probabilidad)
Verfahrensstandardabweichung
Standard Deviation of the Method / Desviación estándar del procedimiento
Verfahrensvariationskoeffizient
Variation Coefficient of the Method / Coeficiente de variación del procedimiento
40,0
35,0
30,0
25,0
20,0
15,0
10,0
5,0
Messergebnis / Result / Resultado (mg/l)
0,0
0,0 5,0 10,0 15,0 20,0 25,0 30,0 35,0 40,0
Qualitätskontrolle Laborleiter / Head of Lab.
Quality control / Control de calidad Jefe de laboratorio
4,0 - 40,0 mg/l CSB/COD/DQO
31.10.2012
20.09.2011 36,0 36,3
Sollwert / Target value / Valor nominal (mg/l)
n = 10
Sollwert
Target value
Result / Resultado
Valor nominal
(Standard / Patrón)
(Standard / Patrón)
mg/l
8,0 8,7
12,0 11,8
Target value
1,00 ± 0,03 0,99
1,410 ± 0,020 A 1,403 A
± 1,0 mg/l ± 0,8 mg/l
± 2,5 % ± 1,4%
Messergebnis
CSB/COD/DQO
Lot value
± 0,3 mg/l
ments the quality of the reagents contained in the test kit.
Calibration function:
mg/l
The calculated function must agree, within specified tolerances, with the
function electronically stored in the photometer.
Confidence interval:
Maximum deviation from the desired value over the entire mea suring
0,4
range; every measurement value can be affected by this deviation; this
parameter is a measure for the accuracy.
Standard deviation for the procedure:
Measurement for the dispersion of the measurement values over the
entire measuring range, ex pressed in ±mg/l.
Coefficient of variation for the procedure:
Measurement for the dispersion of the measurement values over the
entire measuring range, ex pressed in %. The smaller the standard deviation/ coefficient of variation for the procedure, the more pronounced the
linearity of the calibration curve.
5.2 Quality Control for the User
A complete check comprises the entire system, i. e. the working equipment
and the mode of operation. The photometer offers an optimum degree of
support in this re gard, in the form of the different quality mode. The instrument, or the whole system (includ ing reagents and all accessories) will be
checked, depending on which quality mode selected. All of checking operations can thus be supported by the pho tometer and the check values
accordingly docu mented as per GLP (Good Laboratory Practice) recommendations (see Function description, “Analytical Quality Assurance”).
The following diagram provides an overview regarding internal qualityassurance aspects:
Checking the
working equipment
Pipette Test kit Photometer Thermoreactor
Checking the
handling
operations
Suspend the bottom
sediment in the cell by
swirling.
Carefully pipette 3.0 ml
of the sample into a
reaction cell, close tightly with the screw cap ,
and m ix vigorously.
Caution, the cell
becomes very hot!
1
4
7
.
C2/25 CSB
1500 Chemischer
Me§bereich
100 1500 mg/l CSB
2 ml Prob
elösung
Mischen
in ein Reaktions-
Küvette wird heiß,
küvette geben
am Verschluss
anfassen
Mischen
Abkühlen auf
Raumtem
peratur
(mind. 30 min)
2
3
5
6
8
9
0
C
Sauerst
offbedarf
14 mm
im Thermoreaktor
mind. 10 min
erhitzen
abkühlen
148 C, 120 min
Messen
Heat the reaction cell in
the thermoreactor at
148 °C for 2 hours.
Remove the reaction
cell from the thermoreactor and place in a
test-tube rack to cool.
Swirl the cell after
10 minutes.
= Test for the
overall system
Influence of the sample
18
Test for recovery
Release 06/2014
Page 19

5 Analytical Quality Assurance (AQA)
5.2.1 Checking the Photometer
As soon as the photometer is activated it is running a Self-Check. This
means the hardware and the soft ware of the photometer is checked and
compared with internal standards.
As soon as the photometer is activated it is running a Self-Check. This
means the hardware and the soft ware of the photometer is checked and
compared with internal standards.
The photometer itself is checked in the AQA 1 mode with the
Spec tro quant® Photo Check: the pack in cludes round cells con tain ing
stable
test solu tions (secondary
at the
445, 525, and 690 nm wave lengths. The test solutions
in a refe rence photo me ter monitored with primary standards, and the
certificate stating the absorbance values is enclosed with the package
unit. These desired values with the per missible tolerances are entered into
the pho tometer or else handwritten into the control chart. For the measure ment the cell is placed in the compartment for the round cell and identified by the photometer via the bar code, and the measured absorbance is
com pared with the de sired value. The ab sorbance is shown on the display
and can be entered into the corresponding control chart.
The measurement of four cells for a given wavelength tests – in addition to
the wavelength accuracy – also the linearity of the absorbance over the
effective range.
The verification of the instrument, as it is required by DIN/ISO 9000 or
GLP, can be easily performed by using the Spec tro quant
The PhotoCheck hence offering the possibility to check the instrument. All
of the corresponding documentation, required by these certifi cation guidelines, is done by the photometer auto ma tically.
stan dards) for checking the photo meter
are measured
®
PhotoCheck.
Spectroquant® photometers
C2/25 CSB 1500 Chemischer
Sauerst
offbedarf
Me§bereich
100 1500 mg/l CSB
14 mm
2 ml Probelösung
Mischen
in ein Reaktions-
im Thermoreaktor
Küvette wird heiß,
mind. 10 min
küvette geben
erhitzen
am Verschluss
abkühlen
148 C, 120 min
anfassen
Mischen
Abkühlen auf
Messen
Raumtemperatur
(mind. 30 min)
1
2
3
4
5
6
7
8
9
.
0
C
5.2.2 Checking the Overall System
Test for the overall system includes checking the working equipment and
checking the handling operations.
The overall system can be checked using standard solutions of a known
content, preferably with the Spectroquant® CombiCheck; this corres ponds
with the AQA 2 mode in the photometer.
Spectroquant® CombiCheck are ready-to-use standard solutions that in
terms of the analyte concentration are finely adjusted to the individual test
kits. They contain a mixture of several analytes that do not interfere with
each other. The stan dard solution (R -1) is used in the same way as a
sample. A double determination is recommended as a measure to
diagnose any random errors.
Standard solutions for photometric applications (CRM) are ready-touse standard solutions that in terms of the analyte concentration are finely
adjusted to the individual test kits. The standard solution is used in the
same way as a sample. A double determination is recommended as a
measure to diagnose any random errors.
In addition to the CombiCheck and the standard solutions for photometric
applications, it is also possible to use CertiPUR® stan dard solutions for
this checking procedure. These contain 1000 mg of the respective analyte
per liter of solution.
They can be diluted to different final con cen trations, which should preferably lie approxi mately in the middle of the mea sur ing range of the re spective test kit. The table presented in Appendix 2 pro vides an over-view of
the available CombiCheck and ready-to-use standard solu tions.
Release 06/2014
19
Page 20
Spectroquant® photometers
5 Analytical Quality Assurance (AQA)
Due to li mited shelf-life characteristics, there are no CombiCheck or
ready-to-use standard solutions for certain parameters. Appendix 3 is a
compilation of standard working procedures necessary to make your
own solutions of a defined concentration. This allows the control of parameters where there are no simple to prepare solutions available.
If the test for the overall system shows that all requirements are fulfilled,
the individual results are flagged as AQA2. If not, an error message is given and the individual components of the instrument have to be checked in
detail.
5.2.3 Checking the Pipettes
The Spectroquant
contains cells filled with color-dye concentrates. After the addition of a
predefined volume
ured against a corre sponding reference cell also contained in the pack.
The difference in the absorbance values of the measurement cell and reference cell may not exceed the tolerances given in the package insert.
If the tolerances are exceeded, the instructions given in the section
“Pipetting system” must be followed accordingly.
®
PipeCheck is used to check the pipettes. The pack
of water using the pipette in question, the
cell is meas-
5.2.4 Checking Thermoreactors
This is checked by means of the thermosensor. The thermoreactor is preheated as described in the Instructions for use. When the control lamp
goes out, the temperature is measured in any one of the bores of the thermoreactor. The following desired temperatures must be achieved:
Block temperature 100 °C = desired temperature 100 ±3 °C
Block temperature 120 °C = desired temperature 120 ±3 °C
Block temperature 148 °C = desired temperature 148 ±3 °C
The even distribution of the temperature over all bores can also be documented using the thermosensor.
20
Release 06/2014
Page 21

5 Analytical Quality Assurance (AQA)
5.2.5 Testing for Handling Errors
The user’s own mode of operation must also be subjected to an exact
analysis.
The following questions may serve as a guide in this regard:
Is the test kit optimal for the measurement assignment in question?
•
Is the test kit’s measuring range suitable?
•
Were the operating instructions for the test followed
•
Was the sample volume correct?
•
Was the pipette handled properly?
•
Was a new pipette tip used?
•
Is the pH of the sample and measurement solution correct?
•
Was the reaction time adhered to?
•
Does the sample and reagent temperature lie within the correct range?
•
Is the cell clean and free from scratches?
•
Has the expiry date for the test kit been exceeded?
•
?
Spectroquant® photometers
5.3 Determination of Sample Influences (matrix effects)
The influence of other substances contained in the sample may, under
certain cir cumstances, be so great that their recovery rates lie in the region
of several percent. It is recommended to check for any influence by using
the addition solution contain ed in the Spectroquant
A defined quantity of the addition solution (R-2), which contains a known
concen tration of the respective analyte, is added to the sample and the
recovery rate is de termined. The following difference is then calculated:
Result (sample + addition solution) – Result (sample)
If the calculated difference is equal to the concen tration of analyte of addition solution that was add ed, the recovery rate is 100 %. If the difference
is less than 90 %, then a matrix inter ference is present.
®
CombiCheck pack.
Release 06/2014
21
Page 22
Spectroquant® photometers
5 Analytical Quality Assurance (AQA)
5.4 Definition of Errors
It is obvious that measurement results as a rule may be associated with
errors. This applies equally to standardized methods of analysis (reference
methods) and to rou tine analysis. The discovery and the minimization of
errors must be the objective here.
A distinction is made between systematic errors and random errors.
Systematic errors are present when all the results of an analysis deviate
from the true value with the same algebraic sign. Examples here include:
a wrong sample volume, a wrong pH, a wrong reaction time, a samplematrix influence, etc. Systematic errors thus affect the accuracy of the
method of analysis.
Accuracy = Deviation of the measured concentration from the true concentration
Random errors manifest themselves in the form of a wide range of deviation of the results of a given sample. These can be kept to a minimum by
ensuring good operat ing techniques and multiple determina tion with calculation of the mean values. Ran dom errors make the result of the analysis unreliable; they influence the precision.
Precision = Dispersion of the results among each other
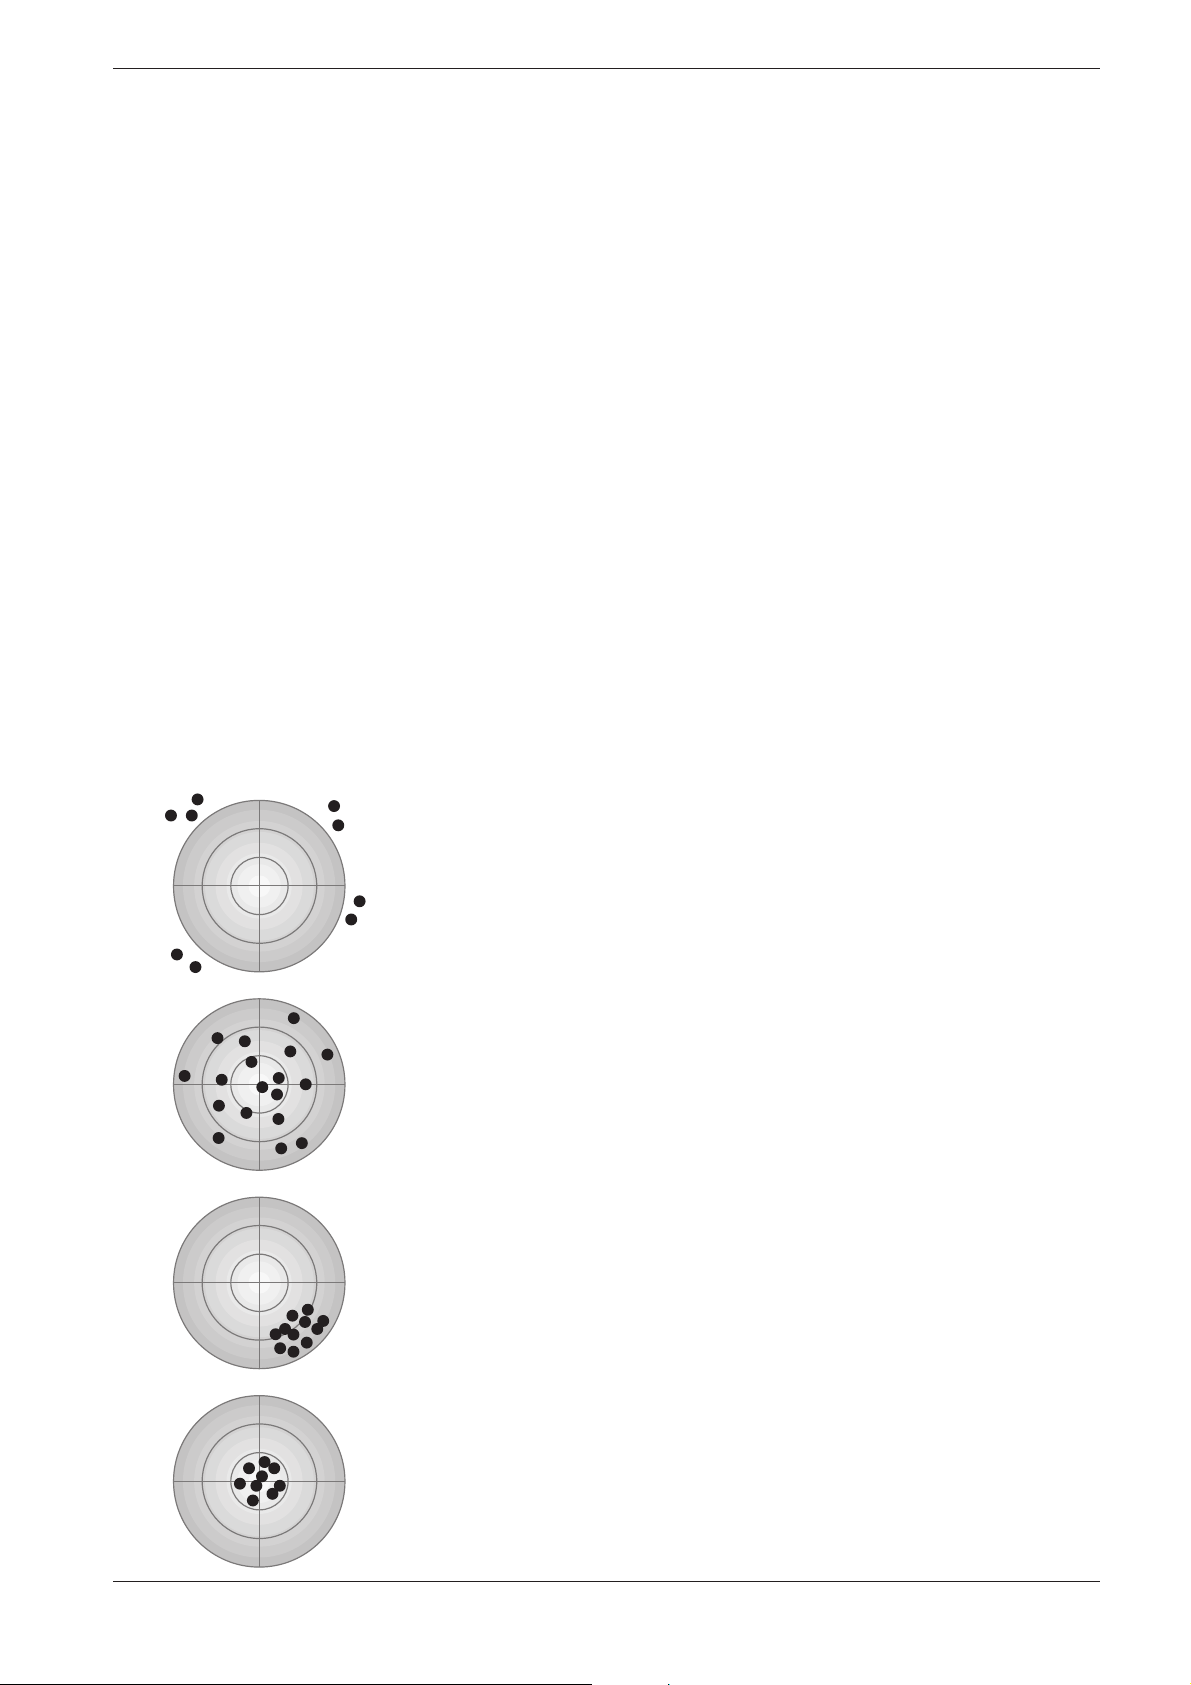
The following diagram illustrates the aspects of accuracy and precision:
Accuracy: poor
Precision: poor
Major errors have been made!
Accuracy: good
Precision: poor
Calculation of the mean values from at least three – or better even more –
parallel determina tions yields an approximation of the true value.
Accuracy: poor
Precision: good
The high degree of precision mis takenly indicates a correct value!
22
Accuracy: good
Precision: good
The ideal objective!
Release 06/2014
Page 23

Spectroquant
®
UV/VIS Spectrophotometer
Pharo 300
Description of Function
Spectroquant
®
Pharo 300
Page 24

Spectroquant® Pharo 300
Accuracy when going to
press
The use of advanced technology and the high quality standard of our
instruments are the result of continuous development. This may result
in differences between this operating manual and your instrument.
Also,
we cannot guarantee that there are absolutely no errors in this manual.
Therefore, we are sure you will understand that we cannot accept
any legal claims resulting from the data, figures or descriptions.
Copyright © Merck KGaA
Frankfurter Str. 250
D-64271 Darmstadt
Germany
Internet: www.analytical-test-kits.com
Reprinting - even as excerpts - allowed only with the explicit written
authorization of Merck KGaA, Darmstadt.
ba75703e07 04/2014
Page 25

Spectroquant® Pharo 300 Contents
Spectroquant® Pharo 300 - Contents
1 Overview . . . . . . . . . . . . . . . . . . . . . . . . . . . . . . . . . . . . . 29
1.1 Overview of the instrument . . . . . . . . . . . . . . . . . . . . . . 29
1.2 Keypad . . . . . . . . . . . . . . . . . . . . . . . . . . . . . . . . . . . . . . 30
1.3 Display . . . . . . . . . . . . . . . . . . . . . . . . . . . . . . . . . . . . . . 32
2 Safety instructions . . . . . . . . . . . . . . . . . . . . . . . . . . . . . 33
2.1 Target group and user qualification . . . . . . . . . . . . . . . . 33
2.2 Authorized use . . . . . . . . . . . . . . . . . . . . . . . . . . . . . . . . 34
2.3 General safety instructions . . . . . . . . . . . . . . . . . . . . . . . 34
2.4 Handling of hazardous substances . . . . . . . . . . . . . . . . 35
3 Commissioning . . . . . . . . . . . . . . . . . . . . . . . . . . . . . . . 37
3.1 Scope of delivery . . . . . . . . . . . . . . . . . . . . . . . . . . . . . . 37
3.2 General notes on handling . . . . . . . . . . . . . . . . . . . . . . . 38
3.3 Initial commissioning . . . . . . . . . . . . . . . . . . . . . . . . . . . 39
3.3.1 Inserting the buffer batteries . . . . . . . . . . . . . . . 39
3.3.2 Connecting the power supply . . . . . . . . . . . . . . 40
3.3.3 Switching on the photometer for the first time . . 41
3.3.4 Setting the language . . . . . . . . . . . . . . . . . . . . . 41
3.3.5 Setting the date and time . . . . . . . . . . . . . . . . . 42
3.4 Connecting optional accessories . . . . . . . . . . . . . . . . . . 43
3.4.1 Communication interfaces . . . . . . . . . . . . . . . . . 43
3.4.2 PC/printer . . . . . . . . . . . . . . . . . . . . . . . . . . . . . 44
3.4.3 USB memory device . . . . . . . . . . . . . . . . . . . . . 45
3.4.4 PC keyboard . . . . . . . . . . . . . . . . . . . . . . . . . . . 46
3.4.5 Barcode reader . . . . . . . . . . . . . . . . . . . . . . . . . 46
3.4.6 12 V-Adapter . . . . . . . . . . . . . . . . . . . . . . . . . . . 47
4 Operation . . . . . . . . . . . . . . . . . . . . . . . . . . . . . . . . . . . . 49
4.1 Switching on or off the photometer . . . . . . . . . . . . . . . . 49
4.2 General operating principles . . . . . . . . . . . . . . . . . . . . . 52
4.2.1 Navigating with function keys and menus . . . . . 52
4.2.2 Display of navigation paths in short form . . . . . 54
4.2.3 Entry of numerals, letters and characters . . . . . 55
4.2.4 Detailed operating example: Changing the
language . . . . . . . . . . . . . . . . . . . . . . . . . . . 57
4.3 Photometer settings and system administration . . . . . . 58
4.3.1 Language . . . . . . . . . . . . . . . . . . . . . . . . . . . . . 58
4.3.2 Date/Time . . . . . . . . . . . . . . . . . . . . . . . . . . . . . 59
4.3.3 Display settings . . . . . . . . . . . . . . . . . . . . . . . . . 60
ba75703e07 04/2014
25
Page 26

Contents Spectroquant® Pharo 300
4.4 Zero adjustment . . . . . . . . . . . . . . . . . . . . . . . . . . . . . . . 61
4.5 Measuring in Concentration mode . . . . . . . . . . . . . . . . . 66
4.5.1 Measuring cell tests with barcode . . . . . . . . . . . 66
4.5.2 Measuring reagent tests with AutoSelector . . . . 67
4.5.3 Measuring reagent-free tests and user-defined
methods . . . . . . . . . . . . . . . . . . . . . . . . . . . . . . . 68
4.5.4 Exceeding the upper or lower limits of the
measuring range . . . . . . . . . . . . . . . . . . . . . . . . 71
4.5.5 Selecting a method manually . . . . . . . . . . . . . . . 72
4.5.6 Settings for Concentration mode . . . . . . . . . . . . 73
4.5.7 Measuring diluted samples . . . . . . . . . . . . . . . . 75
4.5.8 Sample blank value . . . . . . . . . . . . . . . . . . . . . . 77
4.5.9 Reagent blank value . . . . . . . . . . . . . . . . . . . . . 79
4.5.10 User calibration (standard adjustment) . . . . . . . 83
4.5.11 Automatic Turbidity correction . . . . . . . . . . . . . . 90
4.5.12 Programming / modifying user-defined methods 90
4.6 Measuring the Absorbance / % Transmission . . . . . . . 101
4.6.1 General information . . . . . . . . . . . . . . . . . . . . . 101
4.6.2 Measuring the absorbance or transmission . . . 101
4.6.3 Measuring against the Reference absorbance 103
4.7 Special / Multi wavelengths methods . . . . . . . . . . . . . . 105
4.7.1 Basic information on Special / Multi wavelengths
measurements . . . . . . . . . . . . . . . . . . . . . . . . . .105
4.7.2 Programming / modifying the Special / Multi
wavelengths methods . . . . . . . . . . . . . . . . . . . 106
4.7.3 Selecting a Special / Multi wavelengths method113
4.7.4 Carrying out Special / Multi wavelengths
measurements . . . . . . . . . . . . . . . . . . . . . . . . . 114
4.8 Spectrum . . . . . . . . . . . . . . . . . . . . . . . . . . . . . . . . . . . 117
4.8.1 General information . . . . . . . . . . . . . . . . . . . . . 117
4.8.2 Recording the Spectrum . . . . . . . . . . . . . . . . . 118
4.8.3 Loading/editing a spectrum . . . . . . . . . . . . . . . 121
4.8.4 Saving / exporting a spectrum . . . . . . . . . . . . . 124
4.9 Kinetics . . . . . . . . . . . . . . . . . . . . . . . . . . . . . . . . . . . . . 125
4.9.1 Creating/editing profiles for Kinetics recordings 125
4.9.2 Loading a profile for Kinetics recording . . . . . . 128
4.9.3 Recording the Kinetics . . . . . . . . . . . . . . . . . . . 129
4.9.4 Saving / exporting a Kinetics record . . . . . . . . 132
4.9.5 Loading a Kinetics record . . . . . . . . . . . . . . . . 134
4.9.6 Editing a Kinetics record . . . . . . . . . . . . . . . . . 134
4.10 Timer . . . . . . . . . . . . . . . . . . . . . . . . . . . . . . . . . . . . . . . 137
4.10.1 User defined timer . . . . . . . . . . . . . . . . . . . . . . 138
4.10.2 Analysis timer . . . . . . . . . . . . . . . . . . . . . . . . . 138
4.11 Memory . . . . . . . . . . . . . . . . . . . . . . . . . . . . . . . . . . . . . 140
4.11.1 Overview . . . . . . . . . . . . . . . . . . . . . . . . . . . . . 140
4.11.2 Instructions on using USB memory devices 144
4.11.3 Measurement datasets . . . . . . . . . . . . . . . . . . 145
4.11.4 Saving measurement datasets manually . . . . 145
26
ba75703e07 04/2014
Page 27

Spectroquant® Pharo 300 Contents
4.11.5 Saving measurement datasets automatically . 145
4.11.6 Displaying measurement data memory . . . . . . 146
4.11.7 Filtering measurement datasets . . . . . . . . . . . 148
4.11.8 Inverting filters . . . . . . . . . . . . . . . . . . . . . . . . . 149
4.11.9 Erasing stored measurement datasets . . . . . . 150
4.11.10 Saving kinetic recordings, spectra and AQA
files . . . . . . . . . . . . . . . . . . . . . . . . . . . . 151
4.11.11 Saving data as a pdf file . . . . . . . . . . . . . . . . . 151
4.12 Saving / exporting files . . . . . . . . . . . . . . . . . . . . . . . . . 152
4.12.1 Copying all measurement data files to a USB
memory device . . . . . . . . . . . . . . . . . . . . . . . . 152
4.12.2 Copying user-defined methods / profiles to a
USB memory device . . . . . . . . . . . . . . . . . . . . 153
4.12.3 Copying files to a PC . . . . . . . . . . . . . . . . . . . . 154
4.13 Importing files . . . . . . . . . . . . . . . . . . . . . . . . . . . . . . . . 155
4.13.1 Importing spectra or kinetic recordings from a
USB memory device . . . . . . . . . . . . . . . . . . . . 155
4.13.2 Importing methods / profiles from a
USB memory device . . . . . . . . . . . . . . . . . . . . 155
4.13.3 Importing files from a PC . . . . . . . . . . . . . . . . . 156
4.14 Printing data (RS232, USB) . . . . . . . . . . . . . . . . . . . . . 157
4.14.1 Printer and terminal programs . . . . . . . . . . . . . 157
4.14.2 Settings for data transmission . . . . . . . . . . . . . 158
4.14.3 Printing measurement datasets . . . . . . . . . . . 159
4.14.4 Printing Kinetics records . . . . . . . . . . . . . . . . . 160
4.14.5 Printing spectra . . . . . . . . . . . . . . . . . . . . . . . . 161
4.15 Analytical quality assurance (AQA) . . . . . . . . . . . . . . . 162
4.15.1 General information . . . . . . . . . . . . . . . . . . . . . 162
4.15.2 Photometer monitoring (AQA1) . . . . . . . . . . . . 163
4.15.3 Total system monitoring (AQA2) . . . . . . . . . . . 168
4.15.4 AQA3/MatrixCheck . . . . . . . . . . . . . . . . . . . . . 172
4.16 User management . . . . . . . . . . . . . . . . . . . . . . . . . . . . 178
4.16.1 User levels and user rights . . . . . . . . . . . . . . . 178
4.16.2 Activating or deactivating the User
management function . . . . . . . . . . . . . . . . . . . 179
4.16.3 Creating, changing or deleting a user account 180
4.16.4 Login with active user management . . . . . . . . 182
4.16.5 Changing the password . . . . . . . . . . . . . . . . . 184
4.17 Reset . . . . . . . . . . . . . . . . . . . . . . . . . . . . . . . . . . . . . . 185
4.18 Photometer information ([Info]) . . . . . . . . . . . . . . . . . . 186
4.19 Lamp counter . . . . . . . . . . . . . . . . . . . . . . . . . . . . . . . . 186
4.20 Software and methods update . . . . . . . . . . . . . . . . . . . 187
4.20.1 Update using a USB memory device . . . . . . . 187
4.20.2 Update using a PC . . . . . . . . . . . . . . . . . . . . . 189
4.20.3 Language update . . . . . . . . . . . . . . . . . . . . . . 189
ba75703e07 04/2014
27
Page 28

Contents Spectroquant® Pharo 300
5 Maintenance and cleaning . . . . . . . . . . . . . . . . . . . . . 191
5.1 Exchanging the buffer batteries . . . . . . . . . . . . . . . . . . 191
5.2 Cleaning . . . . . . . . . . . . . . . . . . . . . . . . . . . . . . . . . . . . 192
5.2.1 Cleaning the enclosure . . . . . . . . . . . . . . . . . . 192
5.2.2 Cleaning the cell shaft . . . . . . . . . . . . . . . . . . . 192
5.2.3 Cleaning the detector lens . . . . . . . . . . . . . . . . 193
6 What to do if ... . . . . . . . . . . . . . . . . . . . . . . . . . . . . . . . 195
6.1 Actions in the case of a broken cell . . . . . . . . . . . . . . . 195
6.2 Error causes and remedies . . . . . . . . . . . . . . . . . . . . . . 196
7 Technical data . . . . . . . . . . . . . . . . . . . . . . . . . . . . . . . 199
7.1 Measurement characteristics . . . . . . . . . . . . . . . . . . . . 199
7.2 Measured value documentation and quality assurance 202
7.3 General meter data . . . . . . . . . . . . . . . . . . . . . . . . . . . . 203
8 Accessories and options . . . . . . . . . . . . . . . . . . . . . . . 207
8.1 Accessories . . . . . . . . . . . . . . . . . . . . . . . . . . . . . . . . . 207
8.2 Test equipment . . . . . . . . . . . . . . . . . . . . . . . . . . . . . . . 208
8.3 Optional equipment . . . . . . . . . . . . . . . . . . . . . . . . . . . . 208
8.4 Connection cable: . . . . . . . . . . . . . . . . . . . . . . . . . . . . . 209
Appendix . . . . . . . . . . . . . . . . . . . . . . . . . . . . . . . . . . . . 211
A.1 Menus . . . . . . . . . . . . . . . . . . . . . . . . . . . . . . . . . . . . . . 211
A.1.1 Measuring . . . . . . . . . . . . . . . . . . . . . . . . . . . . 211
A.1.2 General settings and functions . . . . . . . . . . . . 215
A.2 Glossary . . . . . . . . . . . . . . . . . . . . . . . . . . . . . . . . . . . . 219
A.3 List of trademarks . . . . . . . . . . . . . . . . . . . . . . . . . . . . . 221
A.4 Index . . . . . . . . . . . . . . . . . . . . . . . . . . . . . . . . . . . . . . . 223
28
ba75703e07 04/2014
Page 29
Spectroquant® Pharo 300 Overview
1 Overview
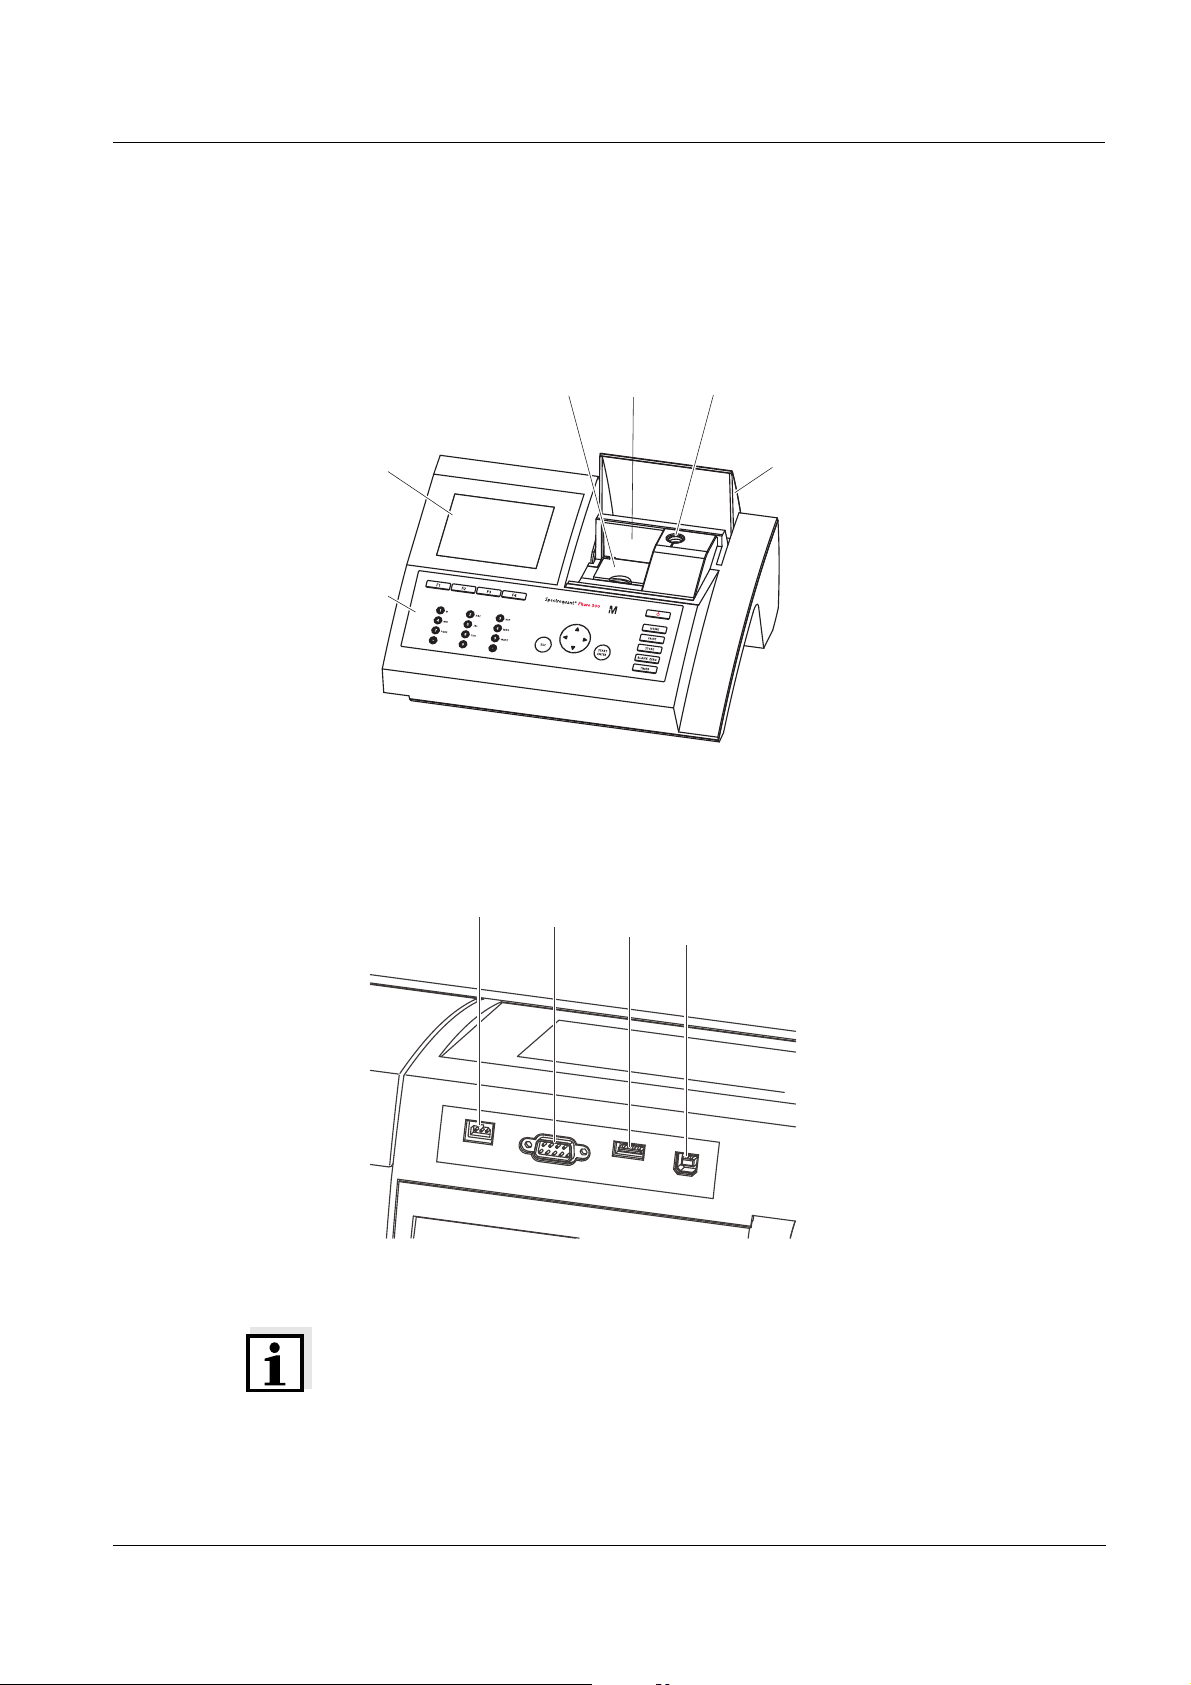
1.1 Overview of the instrument
Front of the
instrument
Socket field on the
rear panel
35
1
4
6
2
Fig. 1-1 Front of the instrument with operating elements
7
8
9
10
1 Display
2 Keypad
3 Shaft for rectangular cells
4 Turn-up lid
5 Shaft for round cells
6 Cell shaft cover
ba75703e07 04/2014
7 Connection for power pack
8 RS232 connection
9 USB-A connection
10 USB-B connection
Fig. 1-2 Rear panel with socket field
Note
All connections comply with SELV.
29
Page 30
Overview Spectroquant® Pharo 300
1
2
3
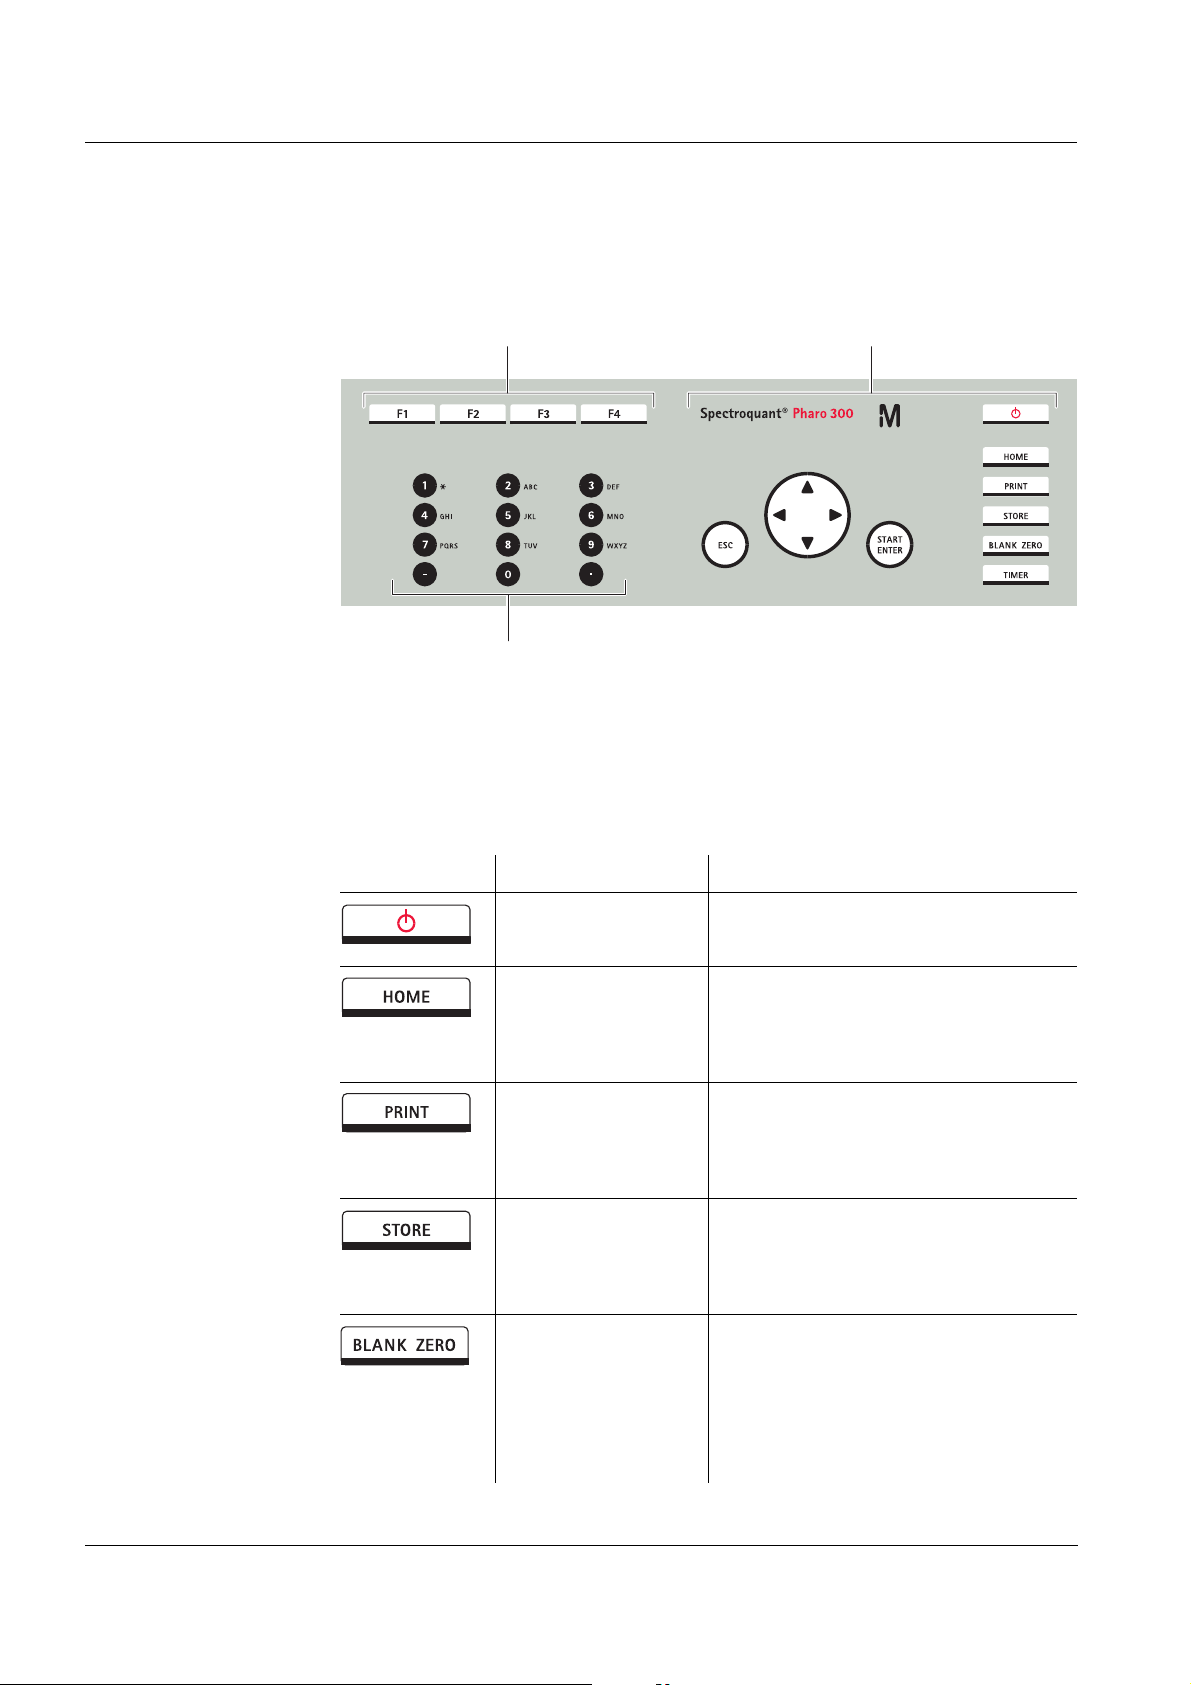
1.2 Keypad
Overview
1 Function keys F1 to F4 (function menu-depending)
2 Alphanumeric keypad
3 Keys with dedicated function
Fig. 1-3 Keypad
Key functions The keys on the right side of the keypad have the following functions:
Key Designation Functions
<ON/OFF> – Switches on and off the photome-
ter
<HOME> – Switches to the main menu from
any operating situation. Actions
that are not completed are canceled.
<PRINT> – Outputs the displayed measured
value to an interface if the
Printer symbol is displayed in the
status line.
<STORE> – Saves a displayed measured
value or spectrum if the Save
symbol is displayed in the status
line.
<BLANK ZERO> – Starts one of the following mea-
surements, depending on the
operating situation:
- Zero adjustment
- Blank value measurement
- Baseline measurement
30
ba75703e07 04/2014
Page 31

Spectroquant® Pharo 300 Overview
Key Designation Functions
<TIMER> – Opens the menu, Timer.
<ESC> – Cancels the running action.
Entries that have not yet been
accepted are discarded.
– Switches to the next higher menu
level.
<START ENTER> – Starts an action (e.g. measure-
ment)
– Opens a selected menu
– Confirms a selection or entry
<▲>or
<▼>
– Moves the selection in menus and
lists one position up or down
<> – Deletes the character left of the
cursor during character entries
– Moves the cursor to the left in a
spectrum or kinetic diagram
(Arrow keys)
<> – Moves the cursor to the right in a
spectrum or kinetic diagram
Function keys The function keys F1 to F4 have different functions depending on the operat-
ing situation. The current functions are displayed in the function key menu at
the bottom edge of the display (see section 4.2.1).
ba75703e07 04/2014
31
Page 32

Overview Spectroquant® Pharo 300
1
2
3
Concentration
16.04.07 9:52
1.92
mg/l
18: 14752
NH4-N
10 mm
0.05 - 3.00 mg/l
Setup
Method list
Citation form Unit
1.3 Display
Display elements
1 Status line (current state, date and time)
2 Display range for menus and measurement results
3 Function keys menu
Fig. 1-4 Display
Symbols in the
status line
Symbol Designation Function
Save The <STORE> key is active.
You can store the displayed data with
<STORE> (see section 4.11).
Printer The <PRINT> key is active.
You can output to an interface the displayed
data with <PRINT> (see section 4.14).
Progress bar During the warm-up time (15 minutes) a
progress bar appears on the display.
The reproducibility of measured values is
limited during the warm-up time (see section
4.14).
32
ba75703e07 04/2014
Page 33

Spectroquant® Pharo 300 Safety instructions
2 Safety instructions
This operating manual contains basic instructions that you must follow during
the commissioning, operation and maintenance of the photometer. Consequently, all responsible personnel must read this operating manual carefully
before working with the meter. Keep this operating manual in the vicinity of
the meter.
General safety
instructions
Other labels
Safety instructions in this operating manual are indicated by the warning symbol (triangle) in the left column. The signal word (such as "CAUTION") indicates the danger level:
WARNING
indicates instructions that must be followed precisely in order to prevent serious dangers to personnel.
CAUTION
indicates instructions that must be followed precisely in order to avoid
slight injuries to personnel or damage to the instrument or the environment.
Note
indicates notes that draw your attention to special features.
Note
indicates cross-references to other documents.
2.1 Target group and user qualification
ba75703e07 04/2014
Carrying out photometric determinations with the aid of test sets frequently
requires the handling of hazardous substances.
We assume that the operating personnel know how to handle hazardous substances due to their professional training and experience. The operating personnel must particularly be able to understand and correctly implement the
safety labels and safety instructions on the packages and inserts of the test
sets.
33
Page 34

Safety instructions Spectroquant® Pharo 300
2.2 Authorized use
The Photometer was developed for use in the laboratory for water analysis.
Follow the technical specifications of the cells in chapter 7 T
ECHNICAL DATA.
Any other use is considered to be unauthorized.
2.3 General safety instructions
The photometer is built and inspected according to the relevant guidelines
and norms for electronic instruments (see chapter 7 T
the factory in a safe and secure technical condition.
Note
The opening of the photometer or adjustment and repair work must only be
performed by specialist personnel authorized by the manufacturer. Noncompliance invalidates any claim with regard to the warranty.
ECHNICAL DATA). It left
Function and
operational safety
The smooth functioning and operational safety of the photometer can only be
guaranteed if the generally applicable safety measures and the specific
safety instructions in this operating manual are followed during operation.
The smooth functioning and operational safety of the photometer can only be
guaranteed under the environmental conditions that are specified in chapter
ECHNICAL DATA.
7 T
If the photometer was transported from a cold environment to a warm environment, the formation of condensate can lead to the faulty functioning of the
meter. In this event, wait until the temperature of the meter reaches room
temperature before putting the meter back into operation.
Safe operation If safe operation is no longer possible, the photometer must be taken out of
operation and secured against inadvertent operation.
Safe operation is no longer possible if the photometer:
has been damaged in transport
has been stored under adverse conditions for a lengthy period of time
is visibly damaged
no longer operates as described in this manual.
34
If you are in any doubt, contact the supplier of your photometer.
ba75703e07 04/2014
Page 35

Spectroquant® Pharo 300 Safety instructions
2.4 Handling of hazardous substances
When developing test sets, Merck carefully sees that the tests can be carried
out as safely as possible. Some hazards by dangerous substances, however,
cannot always be avoided.
WARNING
Improper handling of certain reagents can cause damage to your
health.
In any case follow the safety labels on the packing and the safety instructions of the package insert. Protective measures specified there
have to be followed exactly.
Safety datasheets The safety datasheets of the chemicals comprise all instructions on safe han-
dling, occurring hazards, preventive actions and actions to take in hazardous
situations. Follow these instructions in order to work safely.
ba75703e07 04/2014
35
Page 36

Safety instructions Spectroquant® Pharo 300
36
ba75703e07 04/2014
Page 37

Spectroquant® Pharo 300 Commissioning
3 Commissioning
3.1 Scope of delivery
Spectrophotometer Spectroquant® Pharo 300
Power pack connection cable
Buffer batteries 4 x AA alkaline manganese (Mignon)
Zero cell (16 mm, round)
Short instructions
CD-ROM with
– Detailed operating manual
– Analysis instructions
– SpectralTransfer software
– Language updates to install additional character sets (see section
4.20.3)
Packing This photometer is sent out in a protective transport packing.
CAUTION
Keep the original packing including the inner packing to protect the instrument against hard shocks if it has to be transported.
Note that damage caused by improper transport voids all warranty
claims.
ba75703e07 04/2014
37
Page 38

Commissioning Spectroquant® Pharo 300
3.2 General notes on handling
The Spectroquant® Pharo 300 photometer is an optical precision meter.
Therefore, it should always be handled with care, especially in mobile use.
Always protect the meter from conditions that could damage the mechanical,
optical and electronic components. Heed the following points especially:
The temperature and humidity during operation and storage must be
within the limits specified in chapter 7 T
The following influences always have to be avoided with the meter:
– Extreme dust, moisture and wetness
– Exposure to intensive light and heat
– Fumes that are corrosive or contain high concentrations of solvents.
For measuring, the meter must be placed on a flat surface.
Spilled liquid or other material should be removed immediately (see sec-
tion 5.2 C
LEANING).
ECHNICAL DATA.
If a cell has broken in the cell shaft, the cell shaft should be cleaned imme-
diately (see section 6.1 A
CTIONS IN THE CASE OF A BROKEN CELL).
The cell shaft should always be closed when the photometer is not used.
During transport of the photometer, the cell shaft has to be empty.
For mobile use we recommend the suitable transport case (see section
8.1 A
CCESSORIES).
38
ba75703e07 04/2014
Page 39

Spectroquant® Pharo 300 Commissioning
3.3 Initial commissioning
Perform the following activities:
Insert the buffer batteries (see section 3.3.1)
Connect the power supply (see section 3.3.2)
Switch on the photometer (see section 3.3.3)
Set the language (see section 3.3.4)
Set the date and time (see section 3.3.5)
Carry out a zero adjustment (see section 4.4)
Note
When you set the language, date and time according to the mentioned sections of this operating manual you will quickly become familiar with the simple
operation of the Spectroquant
operation are given in section 4.2 G
®
Pharo 300. More detailed instructions on
ENERAL OPERATING PRINCIPLES.
3.3.1 Inserting the buffer batteries
The buffer batteries supply the integrated clock while the photometer is
switched off. Four alkaline manganese batteries (type AA or Mignon) separately included in the scope of delivery are used as the buffer batteries.
Insert the batteries as follows:
1 Turn the photometer upside down
1
and place it on a soft surface.
2 Open the lid of the battery com-
partment (1).
3 Insert the four batteries in the bat-
tery compartment. Make sure that
the poles of the batteries are in the
correct position.
The ± signs on the batteries must
correspond to the ± signs in the
battery compartment.
4 Close the lid of the battery com-
partment.
Battery service life The power consumption of the clock is very low. The lifetime of high quality
batteries is at least 5 years.
ba75703e07 04/2014
39
Page 40

Commissioning Spectroquant® Pharo 300
1
3.3.2 Connecting the power supply
The power is supplied via the enclosed plug-in power pack. The power pack
supplies the photometer with low voltage (12 VDC).
CAUTION
The line voltage of the usage location must fulfill the specifications stated on the power pack (the specifications are also given in chapter 7
T
ECHNICAL DATA). Always use the supplied 12 V original power pack on-
ly. The power pack is not suitable for operation with older photometers
(ser.no. prior to 1319xxxx).
Connecting the
plug-in power pack
Operation with a
mobile 12 V power
source
1 Connect the miniplug of the power
pack to the socket (1) of the photometer.
2 Connect the power pack to an
easily accessible power socket.
The display illumination switches
itself on and then off again.
You can also operate the Spectroquant
®
Pharo 300 on the move and inde-
pendent of the local power supply.
To do so, a 12 V power supply such as a commercial 12 V portable power
source or a 12 V car battery and the 12 V-Adapter available as an accessory
is required (see section 8.1).
More detailed information on operation is available:
in section 3.4.6 and
in the operating manual of the 12 V-Adapter .
40
ba75703e07 04/2014
Page 41

Spectroquant® Pharo 300 Commissioning
3.3.3 Switching on the photometer for the first time
During the initial commissioning, the photometer automatically guides you
through the setting of the meter language, date and time after switching on
(see following sections).
Language
Englisch ✓
English
Fran?ais
Espa?ol
Italiano
Bulgarian/Български
?esko
Simplified Chinese/ 中文
Traditional Chinese/ 繁體中文
Greek/Ελληνικ?
Indonesian/Indonesia
16.04.07 9:52
1 Press <ON/OFF>.
The photometer is switched on.
The display switches to the setting
of the language (see section
3.3.4).
After the setting of the language
the photometer carries out the
self-test.
When the initial commissioning is completed, the photometer displays the
Home menu each time after it is switched on and after the self-test (see section 4.1).
3.3.4 Setting the language
During the initial commissioning the photometer automatically guides you to
the setting of the meter language after switching on.
Language
Englisch ✓
English
Fran?ais
Espa?ol
Italiano
Bulgarian/Български
?esko
Simplified Chinese/ 中文
Traditional Chinese/ 繁體中文
Greek/Ελληνικ?
Indonesian/Indonesia
16.04.07 9:52
1 Select a language with <▲><▼>.
2 Confirm the selected language
with <START ENTER>.
The language has been set.
The currently selected language is
marked by a check.
The display switches to the setting
of the Date and Time (see section
3.3.5).
ba75703e07 04/2014
After the initial commissioning, you can change the language in the General
setup / Language menu at any time (see section 4.2.4).
41
Page 42

Commissioning Spectroquant® Pharo 300
Date/Time
16.04.07 9:52
Date 16.04.2007
Time 9:52:09
OK
Date/Time
16.04.07 9:52
Date 16.04.2007
Time 9:52:09
OK
Date
23 .10.2006
Date/Time
16.04.07 9:52
Date 16.04.2007
Time 9:52:09
OK
Time
10
:22 :09
3.3.5 Setting the date and time
During the initial commissioning, the instrument automatically guides you to
the setting of the time and date after the setting of the language.
The Date/Time menu is open.
Using <▲><▼>, select a menu
item and
confirm or open it with
<START ENTER>
.
1 Select and confirm Date.
The input field for the current date
pops up.
2 Enter the current date with <0...9>
and confirm.
The input field closes.
The date is accepted.
3 Select and confirm Time.
The input field for the current time
pops up.
4 Enter the current time with <0...9>
and confirm.
The input field closes.
The time is accepted.
After the initial commissioning, you can change the date and time in the Gen-
eral setup / Date/Time menu at any time (see section 4.2.4).
42
ba75703e07 04/2014
Page 43

Spectroquant® Pharo 300 Commissioning
3.4 Connecting optional accessories
3.4.1 Communication interfaces
Connections
RS232
USB-A
figure 3-1 Communication interfaces on the rear panel
USB-B
You can connect the following accessories to the photometer:
PC (see section 3.4.2)
Printer (see section 3.4.2)
USB storage media (see section 3.4.3)
USB-PC keyboard (see section 3.4.4)
Barcode reader (see section 3.4.5)
12 V-Adapter (see section 3.4.6)
Note
If you want to connect several USB devices such as a USB-PC keyboard and
a USB memory device to the meter, you can increase the number of USB-A
sockets by a commercially available USB-2 hub with separate power supply.
ba75703e07 04/2014
43
Page 44

Commissioning Spectroquant® Pharo 300
3.4.2 PC/printer
PC and printer can be connected to the photometer as follows:
Interface PC Printer Functions
RS232
USB-A
USB-B
-
The data is sent to the interface with
<PRINT>.
If a printer is connected, the data is
printed out.
If a PC is connected, the data can be
received with a terminal program
(see section 4.14).
The data is printed out with <PRINT>.
Enables the direct connection of photometer and PC. With this you can transmit measurement data to the PC (see
section 4.12 and section 4.14) or update
the photometer software (see section
4.20.1).
The direct connection with the PC is
established with the aid of the "SpectralTransfer" program. The program is provided on the supplied CD-ROM.
More instructions on how to establish
the connection are given in the operating manual of the "SpectralTransfer"
program (see CD-ROM).
44
Note
Suitable are all printers that can interpret the PCL-3 printer control language.
ba75703e07 04/2014
Page 45

Spectroquant® Pharo 300 Commissioning
Operation at RS232 Connect the RS232 interface to the devices as follows:
PC: with a commercially available zero modem cable
Printer: with a commercially available RS232 printer cable
The cables are available in specialized computer shops.
Set up the following interface data at the PC/printer:
Baud rate Selectable from 1200, 2400, 4800, 9600, 19200
The baud rate must agree with the baud rate set on
the PC/printer.
Flow control
none
("handshake")
Parity none
Data bits 8
Stop bits 1
3.4.3 USB memory device
Using a USB memory device (such as a USB flash drive), you can
update the meter software and method data (section 4.20)
transmit data to the USB memory device (section 4.11 and section 4.12).
USB memory devices are connected to the USB-A interface.
Note
Please follow the instructions on using USB memory devices (see section
4.11.2).
ba75703e07 04/2014
45
Page 46

Commissioning Spectroquant® Pharo 300
3.4.4 PC keyboard
With the PC keyboard it is possible to enter letters, e.g. to assign names for
identification (ID).
In addition, the following keys of the PC keyboard are assigned with the following functions of the photometer:
PC keyboard Photometer
Enter <START ENTER>
Esc <ESC>
F1 to F4 Function keys <F1> to <F4>
The USB-PC keyboard is connected to the USB-A interface.
3.4.5 Barcode reader
The barcode reader enables the simplified entering of alphanumerical character strings and can be used in all operating situations that require the entry
of text or numerals. The barcode reader is connected to the USB-A interface.
46
ba75703e07 04/2014
Page 47

Spectroquant® Pharo 300 Commissioning
3.4.6 12 V-Adapter
®
With the 12 V-Adapter you can operate the Spectroquant
Pharo 300 spectrophotometer on the move and independent of the local power supply.
To do so, a 12 V power supply such as a commercial 12 V portable power
source or a 12 V car battery is required.
12 V-Adapter
12 V power supply unit
Spectroquant
®
Pharo 300
(e.g. portable power
source or car battery )
Safety instructions For operation with an external battery, follow the safety instructions of the
battery.
Make sure the power source is suitable for operation of the spectrophotometer (see technical data of the power source and technical data of the spectrophotometer).
Operating time with
battery
The maximum operating time depends on various factors:
Battery (e.g. nominal capacity, condition, age)
Operating mode of the spectrophotometer (e.g. frequency of measure-
ments)
Photometer (instrument type)
Example Operating time with a type 12 V / 19 Ah battery in optimum condition: approx.
16h
Note
The spectrophotometer consumes electricity even while it is in standby
mode.
We recommend to disconnect the 12 V-Adapter if you do not use the photometer during battery operation.
Technical data
12 V-Adapter
ba75703e07 04/2014
Cable length 2 m
max. voltage 12 V
max. current 8 A
47
Page 48

Commissioning Spectroquant® Pharo 300
48
ba75703e07 04/2014
Page 49

Spectroquant® Pharo 300 Operation
4Operation
4.1 Switching on or off the photometer
Switching on
Self test
Please make sure no cell is inserted and the cover is
closed. Then press <START/ENTER>
Setup Info
Login
Enter user name
Administrator
16.04.07 9:52
16.04.07 9:52
1 Switch the photometer on with
<ON/OFF>.
The display shows
– the Self test dialog (if the user
management is not active).
or
– the Login dialog
(if the user management is
active).
With activated user management:
2 Login
Enter user name and password or
register as a guest (see section
4.16.4).
Then the photometer displays the
Self test dialog.
Starting the
Self test
Self test During the self-test, all cells must be removed and the cell shaft cover closed.
ba75703d07 04/2014
Self test
Please make sure no cell is inserted and the cover is
closed. Then press <START/ENTER>
16.04.07 9:52
3 Remove all cells and close the cell
shaft cover.
4 Start the self-test with
<START ENTER>.
The photometer carries out the
self-test.
49
Page 50

Operation Spectroquant® Pharo 300
Self test
16.04.07 9:52
Keep cover closed
System test
Filter test
Lamp test
Wavelength calibration
Progress bar during warm-up
time
The self-test includes:
– the test of the memory, proces-
sor,
internal interfaces,
filter and lamp
– a calibration for each wave-
length
After the self-test is completed,
the main menu is displayed.
Note
The result of the self-test can be viewed and printed with the [Info] function
key (see section 4.18).
Warm-up time After being switched on the photometer requires a warm-up time of 15 min-
utes. Reproducibility of measurement data is restricted during the warm-up
time.
Therefore, do not measure during the warm-up time.
During the warm-up time, a progress bar appears on the display next to the
date. The progress bar disappears as soon as the warm-up time is over.
50
ba75703d07 04/2014
Page 51

Spectroquant® Pharo 300 Operation
AutoCheck With the AutoCheck function the photometer checks and calibrates the opti-
cal measuring unit. The AutoCheck is automatically carried out if measurement settings were changed since the last measurement, e.g.:
if a different wavelength was selected or
if a different method was selected.
If necessary, the photometer asks you to remove the cell from the cell shaft.
With unchanged measurement settings, the AutoCheck is carried out in the
background at regular intervals of 5 minutes. The AutoCheck can only be carried out in the background if the cell shaft is empty. If a cell is in the cell shaft
the AutoCheck is carried out only after the cell was removed.
Note
Remove the cell from the cell shaft after every measurement. Thus the photometer can carry out the regular AutoCheck.
Cells must be completely removed from the cell shaft.
Cells that are removed only half disturb the AutoCheck measurement and, as
a consequence, falsify measured values until the next AutoCheck is carried
out.
Plastic cells that are not recognized by the automatic cell recognition also disturb the AutoCheck.
Note
During a running kinetic measurement the photometer cannot carry out any
AutoCheck. That is why in this case a warm-up time of two hours is required.
After this time the signal is stable enough so that the measurement accuracy
is secured over a longer period of time.
Automatic
wavelength
calibration
With the automatic wavelength calibration function the photometer checks and calibrates the accuracy of the wavelengths created by the monochromator.
The wavelength calibration of the photometer is regularly carried out after switching
on (with the self-test) and is automatically repeated during operation after 15, 30, 60,
120 and 240 minutes.
A note is displayed while the photometer is carrying out the automatic wavelength calibration. The automatic wavelength calibration only starts when the
cell shaft is empty.
If a cell is in the cell shaft the wavelength calibration is carried out only after
the cell was removed.
Display illumination The photometer automatically switches off the display illumination if no key
has been pressed for 5 minutes. The illumination is switched on again with
the next keystroke. The function of the key becomes active only with the following keystroke.
Switching off To switch the photometer off, keep the <ON/OFF> key depressed until the
photometer is switched off.
ba75703d07 04/2014
51
Page 52

Operation Spectroquant® Pharo 300
Press twice<>q
Moves the selection down
by 2 positions
Current selection
in reverse video
Confirm selection
with <START ENTER>
Further navigation
andwith <><>pq
<START ENTER>
Further navigation
with function keys
(here: F1 and F2)
Press the F1
Funktion key
("Settings")
Opens the
"Settings"
submenu
Updated function
key menu in the
multi wavelengths
mode
Function key
menu
Main menu
4.2 General operating principles
4.2.1 Navigating with function keys and menus
figure 4-1 Example of navigation with function keys (left) and "classical" menu navigation
(right)
52
ba75703d07 04/2014
Page 53

Spectroquant® Pharo 300 Operation
Use of the function
keys
Navigation with
arrow keys
(<▲><▼>) and
<START ENTER>
The function keys F1 to F4 are below the display. Their functions change
depending on the operating situation and mode. The current functions are
displayed in the function key menu at the bottom edge of the display.
Apart from navigation, the function keys are also used for other operations:
Opening a selection list or input field
Executing a command (directly or with intermediate query)
Switch over between two display options,
such as absorbance
transmission
These operating elements are used to select an item from a menu or list. The
current selection is displayed in reverse video. Pressing of
<START ENTER> confirms the selection.
Apart from navigation, the <START ENTER> key is also used for other operations:
Opening a selection list or input field
Confirming a selection
Confirming entries of text and numerals
Executing a command (directly or with intermediate query)
Activating an item in a selection list (✓ = active)
ba75703d07 04/2014
53
Page 54

Operation Spectroquant® Pharo 300
<HOME>
[General setup]
– Language
Bold letters and angle brackets
indicate a key on the photometer
(except function keys).
→ Press the "Home" key.
The main menu is called up.
Square brackets indicate a function key F1 to F4. The text
between the brackets corresponds to the assignment according to the function key menu on
the bottom edge of the display.
→ Press the function key with the
assignment "Settings"
Text without brackets stands for a
menu item indicated on the display (list item).
→ Select the menu item with the
arrow keys
<><>. The cur-
rent selection is displayed in
reverse video.
→ Then press <START ENTER>.
4.2.2 Display of navigation paths in short form
In this operating manual, the introductory navigation steps leading to individual menus or dialogs are clearly shown in a gray box. The box indicates a
section of the menu tree.
Starting point of the description is always the main menu, which can be
reached with the <HOME> key from any operating situation. From there navigation takes place downward.
Operating example:
Navigation to the
setting menu for the
The following example shows the elements of the menu tree with the relevant
operating steps:
language
54
Further navigation options:
The <ESC> key moves you one level up in the menu tree.
The <HOME> key directly calls up the main menu.
Note
If you are "lost" in a menu, press <HOME> and restart navigating from the
main menu.
ba75703d07 04/2014
Page 55

Spectroquant® Pharo 300 Operation
Note
The complete menu tree is given in the appendix of this operating manual.
4.2.3 Entry of numerals, letters and characters
Numerals, letters, punctuation marks and special characters are entered with
the alphanumeric keypad of the meter or using an external keyboard.
Entries are required in operating situations such as the following:
Entering the date and time
Entering an ID e.g. when storing measurement data
Selecting a method with the [Search] function
Programming user-defined methods
Entering user name and password
Administrating users
Character set The following characters are available:
Numerals 0 ... 9
Letters A ... Z and a ... z
Punctuation marks. -
Special characters ° / + ² ³ # %
Operating principle Entering characters is always possible if there is an input field on the display.
The numerals and characters (expect for the small letters) assigned to the
keys of the alphanumeric keypad are printed on the keys. Example: With the
<7/PQRS> key you can enter the following characters: 7, P, Q, R, S, p, q, r, s.
Select the required character by pressing the key several times (similar to a
mobile phone). When pressing a key that is assigned to several characters
once, the respective numeral appears first. To enter a numeral, one keypressing is always sufficient.
When pressing the key for the first time a line pops up that displays all characters possible with this key. The currently selected character is highlighted.
A character is taken over in the input field if
ba75703d07 04/2014
the character is highlighted for more than one second,
the character is confirmed with <START ENTER>,
another alphanumeric key is pressed.
55
Page 56

Operation Spectroquant® Pharo 300
Enter ID
8
8 T U V t u v
Enter ID
T
8
T
T U V t u v
Enter ID
Test_
Note
During mere number entries (such as entering a wavelength), the keys of the
alphanumeric keypad are assigned to the respective numeral only. Each keypressing directly enters the numeral (like a pocket calculator).
Special characters Special characters are entered with the <1/*> key.
Operating example:
Entering the ID
Correcting incorrect
entries
The Enter ID input field appears if you press the <STORE> key while the stor-
ing symbol is visible. In the following example a measurement dataset with
the ID "Test" is stored.
1 Press <8/TUV> several times until
"T" appears in the input line.
Below the input field, a selection
line pops up with all characters
that are available for this key, e.g.
8 T U V t u v.
The currently selected character is
highlighted.
After approx. one second the
character is taken over and the
selection line closed.
2 Complete the ID with <A...9> and
confirm.
Using <>, erase all characters until you have reached the incorrect digit and
repeat the entry from there.
56
ba75703d07 04/2014
Page 57

Spectroquant® Pharo 300 Operation
4.2.4 Detailed operating example: Changing the language
1 Call up the main menu with the
<HOME> key.
2 Open the General setup menu
with the F1 function key [Setup].
General setup
Language
Date/Time
Display settings
User managementg
Measured value memory
Software/methods update
Reset
Data transfer/Printer
Exchange methods/profiles
Save data to USB memory device
Unlock application packages
Language
Deutsch ✓
English
Français
Español
Italiano
Bulgarian/Български
Česko
Chinese/ 中文
Traditional Chinese/ 繁體中文
Greek/Ελληνικά
Indonesian/Indonesia
Deutsch ✓
16.04.07 9:52
16.04.07 9:52
3 Using <><>
, select the Lan-
guage menu item and open with
<START ENTER>.
The Language menu shows a list
with the available languages. The
currently active language is
marked by a check.
4 Select the required language from
the list with <><> and confirm
with <START ENTER>.
The selected language is taken
over immediately. The photometer
moves up one menu level.
ba75703d07 04/2014
57
Page 58

Operation Spectroquant® Pharo 300
4.3 Photometer settings and system administration
The general photometer settings are done in the <HOME> -> General setup
menu. The general photometer settings comprise:
Language (see section 4.3.1)
Date/time (see section 4.3.2 and section 4.2.4)
Display characteristics (see section 4.3.3)
User management (see section 4.16)
Administration of the measurement data memory (see section 4.11)
Software and method update (see section 4.20)
Reset of the settings to default values (see section 4.17)
Settings for data transmission (see section 4.14.2)
4.3.1 Language
The complete list of the available instrument languages is given in the Language chapter 7 T
ECHNICAL DATA menu of the photometer.
Note
If you want to set some special languages on your photometer (e.g. Chinese
or Thai), a character set extension is required to display the characters (see
section 4.20.3).
For more languages please contact your Merck supplier.
Note
How to set the language is described in detail in the operating example in
section 4.2.4.
58
ba75703d07 04/2014
Page 59

Spectroquant® Pharo 300 Operation
4.3.2 Date/Time
The date format is set automatically with the language setting.
According to the locally usual version, the date format is displayed in the
order, Day.Month.Year (DD.MM.YY) or Month/Day/Year (MM/DD/YY or
MM.DD.YY).
<HOME>
[General setup]
– Date/Time
The Date/Time menu is open.
1 Select and confirm Date.
The input field for the current date
pops up.
Date/Time
Date 16.04.2007
Time 9:52:09
Date
23 .10.2006
Date/Time
Date 16.04.2007
Time 9:52:09
Time
10
:22 :09
16.04.07 9:52
OK
16.04.07 9:52
2 Enter the current date with <0...9>
and confirm.
The input field closes.
The date is accepted.
3 Select and confirm Time.
The input field for the current time
pops up.
4 Enter the current time with <0...9>
and confirm.
The input field closes.
The time is accepted.
ba75703d07 04/2014
OK
59
Page 60

Operation Spectroquant® Pharo 300
<HOME>
[General setup]
– Display settings
Display settings
16.04.07 9:52
Contrast 50 %
4.3.3 Display settings
Here you can adjust the display contrast to the lighting conditions.
1 Select and confirm Contrast.
A slide control for the display contrast appears.
2 Using <><>, set the display
contrast and confirm.
60
ba75703d07 04/2014
Page 61

Spectroquant® Pharo 300 Operation
4.4 Zero adjustment
A valid zero adjustment is required for the calculation of measured values in
the modes, Concentration, Absorbance / % Transmission, Special / Multi
wavelengths and Kinetics. With a zero adjustment, the absorbance of a cell
filled with distilled water ("zero cell") is measured and stored.
®
Factory zero
adjustment for
concentration
measurements
For all measurements with Spectroquant
factory zero adjustment is available in the delivery condition. We recommend
replacing it with a zero adjustment of your own.
test sets (Concentration mode), a
Zero adjustment for
absorbance
measurements
In the Absorbance mode, the zero adjustment has to be carried out separately for each cell type and each used wavelength. If a zero adjustment
exists already for the inserted cell type at the selected wavelength, the date
and time of the last zero adjustment are displayed in the top right area of the
display.
Absorbance
To start measurement, insert cell or press <START/
ENTER>
525 nm 10 mm
Setup Wavelength Transmission Reference
16.04.07 9:52
[ZERO 11.11.2010 11:11]
If no zero adjustment is available, the photometer will prompt you to carry out
a zero adjustment.
Note
The cells must be absolutely clean and free of scratches.
Always use a cell of the same type for zero adjustment and measurement of
the sample.
Notes on zero
adjustment
ba75703d07 04/2014
Zero adjustment with round cells:
Only use clean, scratch-free round cells with distilled water. The minimum
filling level is 20 mm. A ready zero cell is included in the scope of delivery
of the photometer and PhotoCheck (see chapter 8 A
OPTIONS).
CCESSORIES AND
A ready zero cell can, in principle, be used any number of times. We rec-
ommend, however, to regularly check the zero cell for visible contamination and scratches and refill or exchange it if necessary (at least every
24 months).
Zero adjustment with rectangular cells:
61
Page 62

Operation Spectroquant® Pharo 300
For rectangular cells, the zero adjustment must be carried out with the
same cell type (manufacturer and cell material [e.g. optical glass, quartz
glass, plastic]) that is used for measurement. This is important because
cells of different manufacturers have a different absorption behavior.
When changing the cell type repeat the zero adjustment with the new type.
Prior to zero adjustment, clean the rectangular cell and fill it with distilled
water. The minimum filling level is 20 mm.
Rectangular cells always have to be inserted in the cell shaft with the
same orientation for measurement and zero adjustment (e.g. cell printing
on the left side ).
Note
Ordering information is given in chapter 8 A
cells listed in the chapter 8 A
to the Merck Spectroquant
cells are given in chapter 7 T
CCESSORIES AND OPTIONS are especially adapted
®
test set program. General requirements of the
ECHNICAL DATA. Note that the spectral transpar-
CCESSORIES AND OPTIONS. The
ency of the cell must be suitable for the intended application (example, quartz
cell for UV range).
62
ba75703d07 04/2014
Page 63

Spectroquant® Pharo 300 Operation
Carrying out a zero
adjustment
The zero adjustment takes place similarly in the Concentration, Absorbance
/ % Transmission, Special / Multi wavelengths and Kinetics modes.
1 In the respective mode, press the
<BLANK ZERO> key.
Concentration
16.04.07 9:52
2 In Concentration mode only:
Select and confirm Zero adjust-
ment.
Adjust
Blank value
Zero adjustmen t
51: 14558
16 mm
Setup
Zero adjustment
Method list
Citation form Unit
NH4-N
0.20 - 8.00 mg/l
16.04.07 9:52
The zero adjustment window pops
up.
Please insert zero cell (distille d water) or
press <START/ENTER>
Zero cell
(H O dist.)
2
inner
turn-up lid
3 Close the inner turn-up lid.
4 Depending on the cell type, insert
the zero cell as follows:
Round cell:
Insert the round cell in the round
cell shaft so it touches the bottom.
If the inner turn-up lid is opened
too wide, a message prompts you
to close the inner turn-up lid.
ba75703d07 04/2014
63
Page 64

Operation Spectroquant® Pharo 300
Zero cell
(H O dist.)
2
Zero adjustment
16.04.07 9:52
Zero adjustment successful
10 mm
OK
Rectangular cell:
Open the inner turn-up lid.
Insert the rectangular cell verti-
cally so it touches the bottom and
left edge of the cell shaft. The
opaque sides of the rectangular
cell must point to the front and
back.
The photometer has an external
light recognition. If there is too
much external light, a message
prompts you to close the cell shaft
cover.
The photometer automatically
starts the zero adjustment and
subsequently stores the value.
5 After a successful zero adjustment
switch to measurement with [OK].
64
ba75703d07 04/2014
Page 65

Spectroquant® Pharo 300 Operation
Validity of the zero
adjustment
The data of the zero adjustment is stored in the photometer separately for
each cell type. As long as the data is valid, it is automatically used again after
a temporary change to a different cell type. The validity depends on the
respective mode:
Mode Validity of the zero adjustment
Concentration (permanently
Till the next zero adjustment
programmed methods)
Absorbance / % Transmission Till the next zero adjustment with the
same wavelength *
Concentration (user-defined
methods) and
Till the next zero adjustment for the same
method *
Special / Multi wavelengths
Kinetics Till another kinetic profile is loaded
Till the Kinetics mode is exited or the pho-
tometer is switched off
* After the wavelength or method respectively was temporarily exited the photometer dis-
plays that a zero adjustment is available and the time it was carried out. You can then
decide whether to use this zero adjustment or carry out a new zero adjustment.
When to repeat the
zero adjustment?
We recommend to repeat the zero adjustment in the following cases:
If the photometer was subject to mechanical stress such as strong shock
or transport
If the ambient temperature changed by more than 5 °C since the last zero
adjustment
At least once per week
If a new cell type (different manufacturer, different glass type is used)
Basically each time you want to measure with the highest possible accu-
racy.
ba75703d07 04/2014
65
Page 66

Operation Spectroquant® Pharo 300
<HOME>
Concentration
Concentration
16.04.07 9:52
Please select method for measuring or insert
a barcoded cell or insert AutoSelector .
Setup
Method list Last method New Method
Line mark
Barcode
Concentration
16.04.07 9:52
49
mg/l
14: 14540
COD
16 mm
10 - 150 mg/l
Setup
Method list
Citation form Unit
4.5 Measuring in Concentration mode
4.5.1 Measuring cell tests with barcode
Inserting a cell with barcode starts
a measurement.
1 Open the cell shaft cover.
2 Close the inner turn-up lid.
If the inner turn-up lid is opened
too wide, a message prompts you
to close the inner turn-up lid.
3 Insert the barcoded round cell in
the round cell shaft so it touches
the bottom. When doing so, align
the line mark with the notch at the
front of the round cell shaft.
The photometer selects the
method based on the bar code
and automatically starts measurement.
4 Further options:
– Select a different citation form
with [Citation form],
(e.g. NH
<–> NH4-N).
4
– Select a different measuring
unit with [Unit],
(e.g. mg/l <–> mmol/l).
– Make further settings such as
dilution or blank value measurements with [Setup] (see section
4.5.6).
66
Display if the measured value is not within the measuring range (see section
ba75703d07 04/2014
Page 67

Spectroquant® Pharo 300 Operation
4.5.4).
4.5.2 Measuring reagent tests with AutoSelector
<HOME>
Concentration
Concentration
Please select method for measuring or insert
a barcoded cell or insert AutoSelector .
Setup
Concentration
To start measurement, insert cell or press
<START/ENTER>
38: 14761
10 mm
Setup
Method list Last method New Method
Method list
Citation form Unit
Line mark
Inner
turn-up lid
16.04.07 9:52
16.04.07 9:52
0.05 - 5.00 mg/l
Barcode
The method is selected by inserting the AutoSelector.
The photometer is ready to measure.
Fe
1 Open the cell shaft cover.
2 Insert the AutoSelector in the
round cell shaft so it touches the
bottom. When doing so, align the
line mark with the notch at the
front of the round cell shaft.
– The photometer selects the cor-
rect method with the aid of the
barcode.
ba75703d07 04/2014
67
Page 68

Operation Spectroquant® Pharo 300
Concentration
16.04.07 9:52
1.92
mg/l
18: 14752
NH4-N
10 mm
0.05 - 3.00 mg/l
Setup
Method list
Citation form Unit
<HOME>
Concentration
3 Open the inner turn-up lid.
4 Insert the rectangular cell verti-
cally so it touches the bottom and
left edge of the cell shaft. The
opaque sides of the rectangular
cell must point to the front and
back.
The correct measuring range is
automatically selected when the
rectangular cell (1, 2, 5 cm) is
inserted.
The photometer has an external
light recognition. If there is too
much external light, a message
prompts you to close the cell shaft
cover.
The photometer starts measuring
automatically.
5 Further options:
– Select a different citation form
with [Citation form],
(e.g. NH
<–> NH4-N).
4
– Select a different measuring
unit with [Unit],
(e.g. mg/l <–> mmol/l).
– Make further settings such as
dilution or blank value measurements with [Setup] (see section
4.5.6).
Display if the measured value is not within the measuring range (see section
4.5.4).
68
4.5.3 Measuring reagent-free tests and user-defined methods
User-defined methods and reagent-free methods normally do not have a barcode and therefore, no automatic method recognition. In such a case, select
the method manually:
ba75703d07 04/2014
Page 69

Spectroquant® Pharo 300 Operation
Concentration
Please select method for measuring or insert
a barcoded cell or insert AutoSelector .
Setup
Concentration
To start measurement, insert cell or press
<START/ENTER>
51: 14558
16 mm
Setup
Method list Last method New Method
Method list
Citation form Unit
16.04.07 9:52
16.04.07 9:52
NH4-N
0.20 - 8.00 mg/l
1 Select the method manually
(see section 4.5.5).
The photometer is ready to measure.
2 Depending on the type, insert the
cell as follows:
inner
turn-up lid
Round cell:
Close the inner turn-up lid.
Insert the round cell in the round
cell shaft so it touches the bottom.
If the turn-up lid is opened too
wide, a message prompts you to
close the inner turn-up lid.
ba75703d07 04/2014
69
Page 70

Operation Spectroquant® Pharo 300
Concentration
16.04.07 9:52
0.629
mg/l
1001: Nitrite
NO2-N
10 mm
0.050 - 1.000 mg/l
Setup
Method list
Citation form Unit
Rectangular cell:
Open the inner turn-up lid.
Insert the rectangular cell verti-
cally so it touches the bottom and
left edge of the cell shaft. The
opaque sides of the rectangular
cell must point to the front and
back.
The photometer has an external
light recognition. If there is too
much external light, a message
prompts you to close the cell shaft
cover.
3 Further options:
– Select a different citation form
with [Citation form],
(e.g. NH
<–> NH4-N).
4
– Select a different measuring
unit with [Unit],
(e.g. mg/l <–> mmol/l).
– Make further settings such as
dilution or blank value measurements with [Setup] (see section
4.5.6).
Display if the measured value is not within the measuring range (see section
4.5.4).
70
ba75703d07 04/2014
Page 71

Spectroquant® Pharo 300 Operation
4.5.4 Exceeding the upper or lower limits of the measuring range
Measured value display if the measured value is outside the measuring
range:
Range Display Example:
MR: 10 - 150 mg/l
LL < MV < UL Measured value
1 UL < MV < UL + 10% Upper limit of measuring
range exceeded by up to
10% and measured value
LL - 50% < MV < LL Lower limit of measuring
range undercut by up to 50%
and measured value
2MV > UL + 10% Upper limit of measuring
range exceeded by more
than 10%
MV < LL - 50% Lower limit of measuring
range undercut by more
than 50%
3 Invalid measured value
Bars
e.g. MV < 0
MR = Measuring range
UL = Upper limit value of the measuring range
LL = Lower limit value of the measuring range
MV = Measured value
ba75703d07 04/2014
71
Page 72

Operation Spectroquant® Pharo 300
<HOME>
Concentration
– [Last method]
<HOME>
Concentration
– [Method list]
Select method (all)
16.04.07 9:52
14 14540 COD 10 - 150 mg/l
15 FB436 DFZ
0.5 - 50.0 m
-1
17 14554 Ni 0.10 - 6.00 mg/l
18 14785 Ni 0.10 - 5.00 mg/l
21 IodFa IFZ 0.1 - 50.0 IFZ
23 14541 COD 25 - 1500 mg/l
24 14555 COD 500 - 10000 mg/l
30 14563 NO3-N 0.5 - 25.0 mg/l
31 14560 COD 4.0 - 40.0 mg/l
32 Hz340 HZ 1 - 500 HZ
▼
Last used
4.5.5 Selecting a method manually
Selecting the
method last used
Selecting a method
from the Method list
The method last used is immediately selected.
The list of methods is displayed.
The methods are ordered according to the method number. The
arrows
or on the right edge
indicate that the list comprises
more methods further up or down.
The method last selected is highlighted.
Select the method:
Narrowing down the
method list
1 Select the required method with
<▲><▼>. The active selection is
displayed in reverse video.
2 Accept the selection with
<START ENTER>.
You can narrow down the method list and thus make the search easier:
Using [Last used], you can restrict the method list to the ten methods last
used.
With the search function you can search certain character strings in the
list. The search takes place as a full-text search of the entire list contents.
Thus you can search for a method number or certain citation form.
72
ba75703d07 04/2014
Page 73
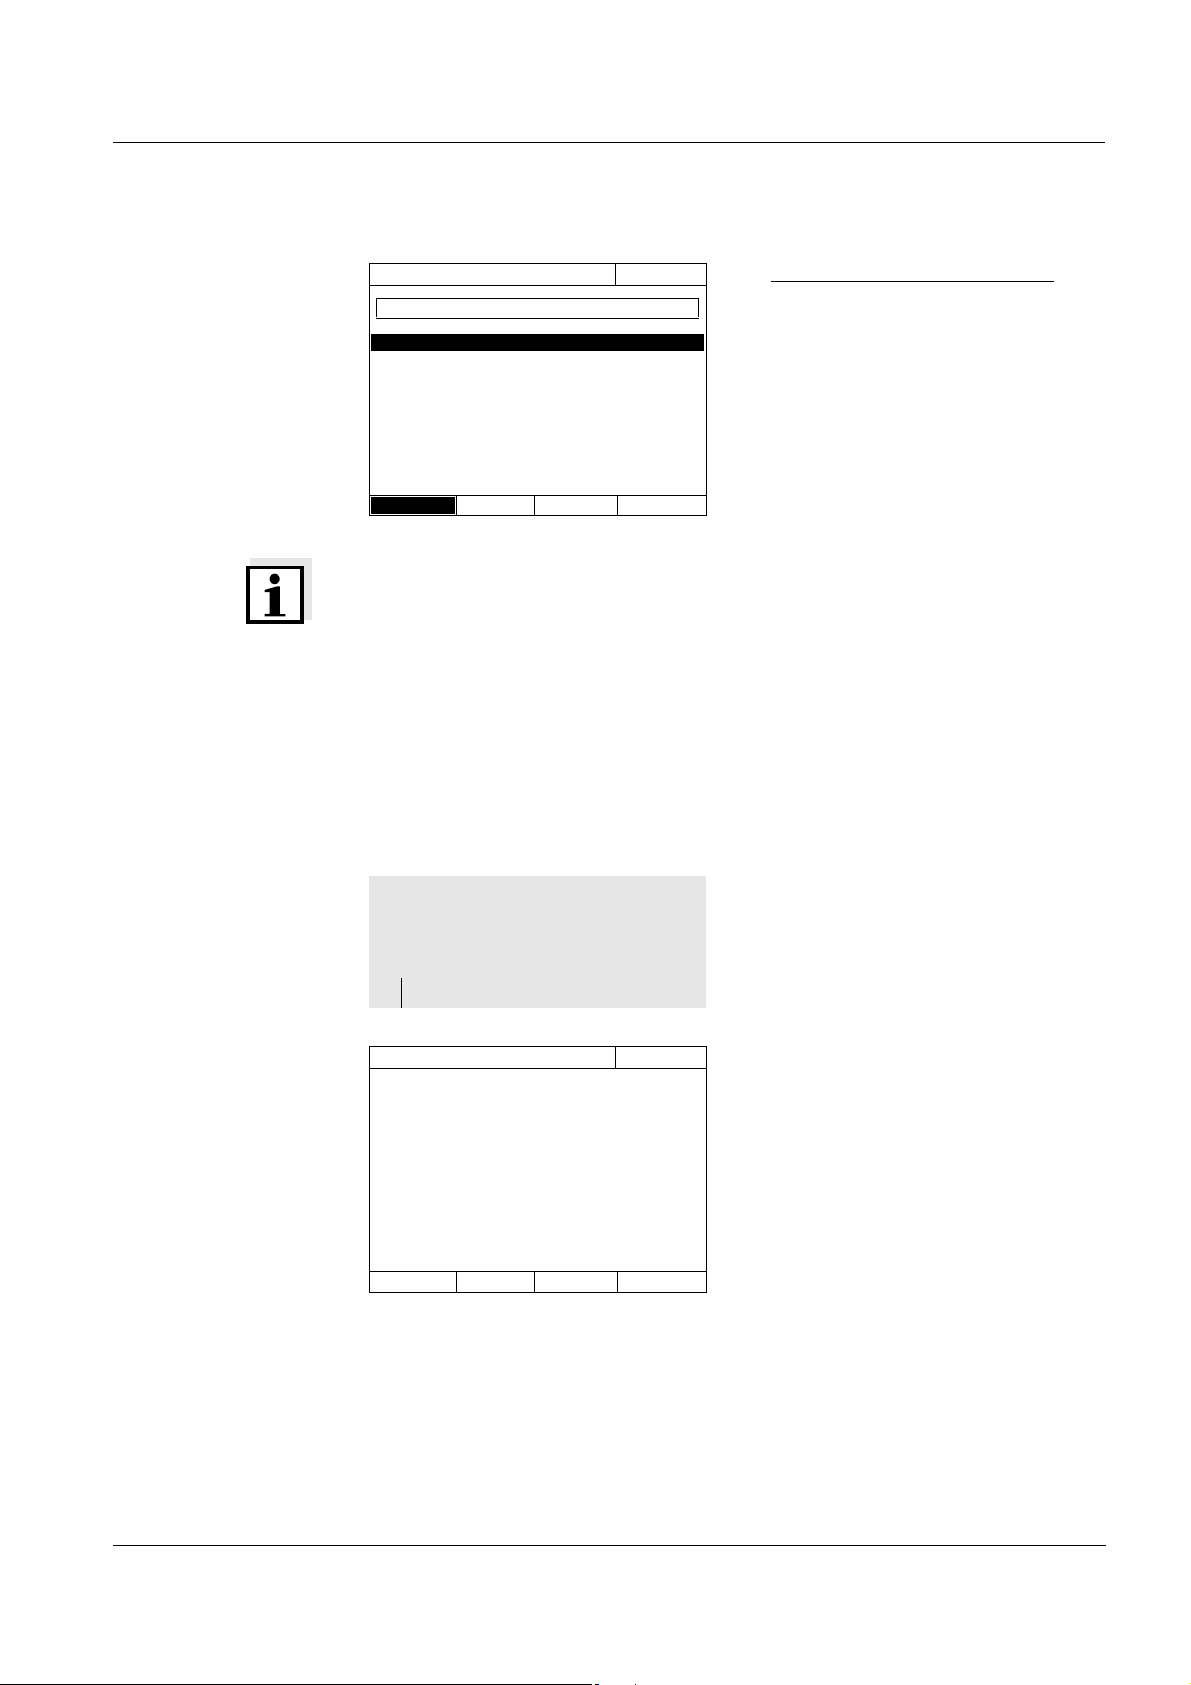
Spectroquant® Pharo 300 Operation
Search function
Select method (last used)
CO_
14 14540 COD 10 - 150 mg/l
23 14541 COD 25 - 1500 mg/l
16.04.07 9:52
Search for a character string:
Enter the character string to be
searched for in the search window
with <A...9>.
The list appearing below shows all
hits containing the character
string. The hit list is updated with
each character that is entered.
All methods
Note
Note the case sensitivity when searching. It is not required or possible to
enter inferior characters. When searching for chemical formulas, inferior
characters are treated as normal characters. Example: The search for "NH4"
shows all hits that contain "NH4" as well as "NH
".
4
4.5.6 Settings for Concentration mode
Prior to measuring, check the settings for the selected method.
<HOME>
Concentration
Select a method
– [Setup]
Concentration
Dilution ✓
Sample blank value
User-defined blank value
Turbidity correction
Display absorbance
AQA
Edit method
New method
Measurement data memory
✓
16.04.07 9:52
The menu shows an overview of
all settings.
Active settings are marked by a
check.
ba75703d07 04/2014
73
Page 74

Operation Spectroquant® Pharo 300
Overview of the
settings
Menu item Explanation
Dilution Here you can set the dilution prior to measuring if
you want to use a diluted sample.
In the measured value display, the dilution is indi-
cated in the form [1 + x] (parts sample + parts distilled water).
For more detailed information on dilution, see section 4.5.7.
Sample blank value Here you can measure while taking a sample blank
value into account.
In the measured value display, measurements with
sample blank value are marked by [SB] (Sample
blank).
For more detailed information on sample blank
value, see section 4.5.8.
User-defined blank
value
If available, a user-defined reagent blank value is
used.
In the measured value display, measurements with
a user-defined reagent blank value are marked by
[BV/Lot number].
For more detailed information on reagent blank
value, see section 4.5.9.
Turbidity correction Activates/deactivates the automatic turbidity cor-
rection.
In the measured value display, measurements with
automatic turbidity correction are marked by
[TURB].
For more detailed information on the automatic turbidity correction, see section 4.5.11.
Display absorbance Activates/deactivates the display of the absor-
bance value in addition to the main measured
value.
AQA Here you can view and change the AQA settings
without discarding the current measurement.
Edit method Here you can edit user-defined methods.
New method Here you can create user-defined methods.
Measurement data
memory
Here you can view the measurement data memory.
74
ba75703d07 04/2014
Page 75

Spectroquant® Pharo 300 Operation
4.5.7 Measuring diluted samples
If the concentration of a sample exceeds the measuring range of a method,
you can specifically dilute the sample so that the concentration of the diluted
sample is in the measuring range of the method. Thus a valid measurement
is possible.
After entering the factor for the dilution the meter converts the concentration
to that of the undiluted sample.
Note
Optimum measurement results are achieved if the concentration of the
diluted sample is in the middle of the measuring range of the method after
diluting.
Setting the dilution
<HOME>
Concentration
Concentration
Please select method for measuring or insert
a barcoded cell or insert AutoSelector .
Setup
Concentration
To start measurement, insert cell or press
<START/ENTER>
51: 14558
16 mm
Setup
Method list Last method New Method
Method list
Citation form Unit
16.04.07 9:52
16.04.07 9:52
NH4-N
0.20 - 8.00 mg/l
Inserting a cell with barcode starts
a measurement.
If a cell without barcode is used:
Select the method manually
(see section 4.5.5).
The photometer is ready to measure.
ba75703d07 04/2014
75
Page 76

Operation Spectroquant® Pharo 300
Concentration
16.04.07 9:52
51: 14558
NH4-N
16 mm
0.20 - 8.00 mg/l
Setup
Method list
Citation form Unit
Sample + distilled water
1 + _
1 Open the setting menu with
[Setup].
2 Select and confirm Dilution.
The input field for the dilution pops
up.
3 Enter and confirm the dilution
(<0...9>).
The entered dilution is taken into
account with the next measurement.
The entered value for the dilution factor is valid for the selected method only.
The dilution factor is erased if
the photometer is switched off
a different method is selected
the factor 0 is entered in the Dilution menu.
If a dilution factor is active, it is indicated on the display during measurement
in the form [1 + x].
76
ba75703d07 04/2014
Page 77

Spectroquant® Pharo 300 Operation
4.5.8 Sample blank value
By measuring and using a sample blank value, measurement errors due to
coloring and turbidity of the sample matrix can be eliminated to a large extent.
The sample blank value is a characteristic of the sample (coloration) to be
currently determined. It is diluted according to the used method but does not
contain any color reagents.
The pH value corresponds to that of the test sample.
Note
Due to the addition of reagents the sample is diluted. This can also change
the pH value of the sample. For this reason the blank sample also has to be
diluted and the pH value adjusted accordingly.
Validity The sample blank value applies to the next measurement only.
Single and multiple
determination
Measuring the
sample blank value
The sample blank value can be determined by single or multiple determination. With multiple determination, the sample blank value is calculated as the
median from the individual measured values.
<HOME>
Concentration
Concentration
16.04.07 9:52
Inserting a cell with barcode starts
a measurement.
Please select method for measuring or insert
a barcoded cell or insert AutoSelector .
If a cell without barcode is used:
Select the method manually
(see section 4.5.5).
Setup
Concentration
Method list Last method New Method
16.04.07 9:52
The photometer is ready to measure.
ba75703d07 04/2014
To start measurement, insert cell or press
<START/ENTER>
51: 14558
16 mm
Setup
Method list
Citation form Unit
1 Open the setting menu with
[Setup].
2 Select and confirm Sample blank
value.
NH4-N
0.20 - 8.00 mg/l
77
Page 78

Operation Spectroquant® Pharo 300
Sample blank value
16.04.07 9:52
To start measurement, insert cell or press
<START/ENTER>
51: 14558
NH4-N
16 mm
0.20 - 8.00 mg/l
Sample blank value
16.04.07 9:52
Last measured absorbance
0.115
Median
0.115 (1 Measurement(s))
51: 14558
NH4-N
16 mm
0.20 - 8.00 mg/l
Next meas.
Discard Apply
Concentration
16.04.07 9:52
[SB]
To start measurement, insert cell or press
<START/ENTER>
51: 14558
NH4-N
16 mm
0.20 - 8.00 mg/l
Setup
Method list
Citation form Unit
3 Insert the cell with a suitable blank
sample.
The first single measurement for
the sample blank value takes
place.
The following data is displayed as
the result:
– The measured absorbance
from the (last) single measurement.
– The median from all single mea-
surements carried out up to
now.
4 If necessary, carry out further sin-
gle measurements for the formation of the median with [Next
meas.]
or
discard the last single measurement with [Discard].
78
5 To accept the median value, press
[Apply].
The photometer is ready to measure.
The use of the sample blank value
is indicated by [SB] in the top right
corner of the display.
ba75703d07 04/2014
Page 79

Spectroquant® Pharo 300 Operation
4.5.9 Reagent blank value
The evaluation of the photometric measurement always refers to the comparison value of a test sample without the substance to be determined (reagent
blank value). Thus the influence of the basic absorbance of the reagents on
photometric measurement is compensated for.
In practice, the reagent blank value is measured with the same amount of deionized water instead of sample.
Factory and user-
defined reagent
blank values
Validity The factory blank values always remain stored in the meter and can be acti-
Single and multiple
determination
With photometric concentration determination, the reagent blank value is a
constant. The method data for all measurements with Merck Spectroquant
®
test sets (Concentration mode) include an exactly determined reagent blank
value. This value is overwritten if you measure the reagent blank value yourself (setting, User-defined blank value, see section 4.5.6).
Note
You can increase accuracy if you determine the reagent blank value with a
test of a new lot and use the reagent blank value for all further measurements
with this lot. This is especially recommended for measurements in the vicinity
of the lower limit of the measuring range. To be able to attribute the reagent
blank value in the measured value documentation later, you can enter the lot
number of the reagent package (Lot number) during the blank value determination.
vated at any time. The reagent blank values you measured yourself also
remain stored in the meter until they are overwritten by a new blank value
measurement.
The reagent blank value can be determined with single or multiple determination. With multiple determination, the reagent blank value is calculated as
the median from the individual measured values.
ba75703d07 04/2014
79
Page 80

Operation Spectroquant® Pharo 300
User-defined
methods
For user-defined methods, you can activate the reagent blank value function
as follows only:
Entry type Function type Reagent
blank value
possible?
Entry of a function
(with and without entering the ordi-
Linear Yes
Nonlinear No
nate intercept)
Entry of value pairs or measure-
ment and storage of standard solutions
(with entering/measuring and storing E0)
Entry of value pairs or measurement and storage of standard solutions
(without entering/measuring and
storing E0)
Linear Yes
Parabola
Yes
(second-order function)
Polygon line No
Linear Yes
Parabola
No
(second-order function)
Polygon line
Polygon line through
zero
Note
If no value for E0 is stored during the entry of value pairs or the measurement
and storing of standard solutions for a nonlinear function (parabola or
polygon line), the message, No blank value correction is intended for this
method. appears when the User-defined blank value function is activated.
The blank value (E0) can be entered later by editing the method.
80
ba75703d07 04/2014
Page 81

Spectroquant® Pharo 300 Operation
Measuring the
reagent blank value
<HOME>
Concentration
Concentration
Please select method for measuring or insert
a barcoded cell or insert AutoSelector .
Setup
Concentration
To start measurement, insert cell or press
<START/ENTER>
51: 14558
16 mm
Setup
Method list Last method New Method
Method list
Citation form Unit
16.04.07 9:52
16.04.07 9:52
NH4-N
0.20 - 8.00 mg/l
Inserting a cell with barcode starts
a measurement.
If a cell without barcode is used:
Select the method manually
(see section 4.5.5).
The photometer is ready to measure.
Concentration
Adjust
Zero adjustment
Blank value
51: 14558
16 mm
Setup
Method list
16.04.07 9:52
0.20 - 8.00 mg/l
Citation form Unit
NH4-N
1 Using <BLANK ZERO>, open the
Adjust selection list.
2 Select and confirm Blank value.
The window for the measurement
of the reagent blank value pops
up.
The data of the last measurement
appears in the measured value
display.
ba75703d07 04/2014
81
Page 82

Operation Spectroquant® Pharo 300
Blank value
16.04.07 9:52
To start measurement, insert cell or press
<START/ENTER>
51: 14558
NH4-N
16 mm
0.20 - 8.00 mg/l
Blank value
16.04.07 9:52
Last measured absorbance
0.600
Median
0.600 (1 Measurement(s))
51: 14558
NH4-N
16 mm
0.20 - 8.00 mg/l
Next meas.
Discard Apply
Blank value
16.04.07 9:52
[BV/Lot number]
To start measurement, insert cell or press
<START/ENTER>
51: 14558
NH4-N
16 mm
0.20 - 8.00 mg/l
Setup
Method list
Citation form Unit
3 Insert the cell with the blank sam-
ple.
The first single measurement for
the reagent blank value takes
place.
The following data is displayed as
the result:
– The measured absorbance
from the (last) single measurement.
– The median from all single mea-
surements carried out up to
now.
4 If necessary, carry out further sin-
gle measurements for the formation of the median with [Next
meas.]
or
discard the last single measurement with [Discard].
82
5 To accept the median value, press
[Apply].
The Lot number entry field pops
up.
6 Enter and confirm the Lot number
(<A...9>).
The blank value measurement is
completed.
The photometer is ready to measure.
The use of the reagent blank value
is indicated by [BV/Lot number] in
the top right corner of the display.
ba75703d07 04/2014
Page 83

Spectroquant® Pharo 300 Operation
4.5.10 User calibration (standard adjustment)
Some methods for concentration measurement provide the option to optimize the original calibration stored with the method by means of a user calibration.
When creating a used-defined method you can also allow a user calibration
(see section 4.5.12).
A user calibration is only valid if the difference compared to the original calibration is no more than 30%.
The absorbance measurement for a user calibration can be carried out as a
single or multiple determination. With multiple determination, the absorbance
is calculated as the median from the individual measured values.
When a method is called up for which a user calibration is possible, a query
appears whether or not the user calibration should be carried out.
When a method is called up for which a user calibration is required, measurement is only possible with a valid user calibration.
Validity
The usage of the user calibration is documented with the measured value
and indicated in the measured value display with [Cal].
A user calibration is always stored for the method presently called up. A user calibration is only erased if
a new user calibration is carried out
the original calibration is selected for measurement
the user calibration is manually erased
the photometer is reset to the default condition.
ba75703d07 04/2014
83
Page 84

Operation Spectroquant® Pharo 300
<HOME>
Concentration
Concentration
16.01.12 9:52
Please select method for measuring or insert
a barcoded cell or insert AutoSelector .
Setup
Method list Last method New Method
Concentration
16.01.12 9:52
304: Ca
Ca
10 mm
0..20 - 4.00 mg/l
Setup
Method list
Citation form Unit
Adjust
Zero adjustment
Reagent blank
Calibrate the method
Carrying out a user
calibration
Select the method manually
(see section 4.5.5).
If there are already data for the
zero adjustment, reagent blank
value or a user calibration available, the photometer informs you
of this. You can take over or discard the available values.
With methods that are not bar
coded the photometer refers to the
first execution of a zero adjustment.
1 Using <BLANK ZERO>, open the
Adjust selection list.
or
Open the setting menu with
[Setup].
2 Select and confirm Calibrate the
method.
If data of a user calibration are
available, the list displays the calibration data of the last user calibration for each of the standard
solutions.
If there are no data of a user calibration, the list for measuring the
Absorbance for all calibration
standards required appears.
84
ba75703d07 04/2014
Page 85

Spectroquant® Pharo 300 Operation
Calibrate the method
E0 0.00 mg/l
10.60 mg/l
21.50 mg/l
32.40 mg/l
43.20 mg/l
54.00 mg/l
Calibrate the method
304: Ca
10 mm
Target value (Ca) Absorbance
Back Next
To start measurement, insert cell or press
<START/ENTER>
16.01.12 9:52
16.01.12 9:52
0..20 - 4.00 mg/l
3 In the Target value column, enter
the nominal values of the individual standard solutions.
The nominal value for E0 (reagent
blank value) is preset and cannot
be changed. The respective
absorbance has to be measured.
4 Select an absorbance value and
confirm with <START ENTER>.
The measurement window pops
up.
5 Insert the cell with the relevant
standard or the reagent blank
value (for E0).
The first single measurement for
the calibration is carried out.
The following data is displayed as
Ca
the result:
– The measured absorbance
from the (last) single measurement.
Calibrate the method
Last measured absorbance
0.177
Median
0.177 (1 Measurement(s))
304: Ca
10 mm
Next meas.
16.01.12 9:52
0..20 - 4.00 mg/l
Discard Apply
– The median from all single mea-
surements carried out up to
now.
6 If necessary, carry out further sin-
gle measurements for the formation of the median with [Next
meas.]
or
discard the last single measurement with [Discard].
Ca
7 To accept the median value, press
[Apply].
The list of the standards required
for this method pops up. The
absorbance measured for the
standard or reagent blank value
respectively (E0) is entered.
ba75703d07 04/2014
85
Page 86

Operation Spectroquant® Pharo 300
Calibrate the method
16.01.12 9:52
Target value (Ca) Absorbance
E0 0.00 mg/l E 0.177
1 0.60 mg/l 1 0.433
2 1.50 mg/l 2 0.874
3 2.40 mg/l 1.347
4 3.20 mg/l 4 1.762
5 4.00 mg/l 5 2.097
Back Next
Calibrate the method
16.01.12 9:52
The calibration has been successfully completed.
Protocol ID:
2
Date: 16.01.2012
User: admin
Curve type: Straight line
Correction: 105%
304: Ca
Ca
Cancel
Calibration
Apply
Calibrate the method
16.01.12 9:52
User calibration:
Protocol ID:
2
Date: 16.01.2012
User: admin
Curve type: Straight line
Correction: 105%
304: Ca
Ca
End
Calibration
Delete New
8 In the Absorbance column, select
all fields one after the other and
start the respective measurement
with <START ENTER>.
When all values
have been measured (also the reagent blank
value E0):
9 Accept the values with Next.
The result of the calibration pops
up.
If necessary, display the list with
the value pairs of nominal value
and absorbance with Calibration
data.
If necessary, display the calibration curve in the window of the
value pairs with Graphic.
10 Accept the calibration with Apply.
If necessary, display the list with
the value pairs of nominal value
and absorbance with Calibration
data.
86
If necessary, display the calibration curve in the window of the
value pairs with Graphic.
If necessary, erase the user calibration with Delete.
If necessary, carry out a new user
calibration with New measure-
ment.
11 Finish the calibration with End.
The Lot number input field for
entering the Lot number of the
reagent blank value (E0) pops up.
ba75703d07 04/2014
Page 87

Spectroquant® Pharo 300 Operation
Calibrate the method
User calibration:
2
Lot number for reagent blank E0
Protocol ID:
Date:
User: admin
Curve type: Straight line
Correction: 105%
304: Ca
Calibrate the method
304: Ca
10 mm
Setup
16.01.2012
_
End
To start measurement, insert cell or press
<START/ENTER>
Calibration
Method list
Delete New
[Cal][BV/Lot number][10.01.12 8:32 ]
16.01.12 9:52
16.01.12 9:52
0..20 - 4.00 mg/l
Unit
12 Enter the Lot number of the
reagent blank value (<A...9>) and
confirm.
The user calibration is completed.
Ca
The photometer is ready to measure.
If the user calibration is used, the
[Cal] indicator appears on the display.
Note: calibration is unsuccessful if
Ca
the new value deviates by more
than 30% from the value of the
stored calibration.
ba75703d07 04/2014
87
Page 88
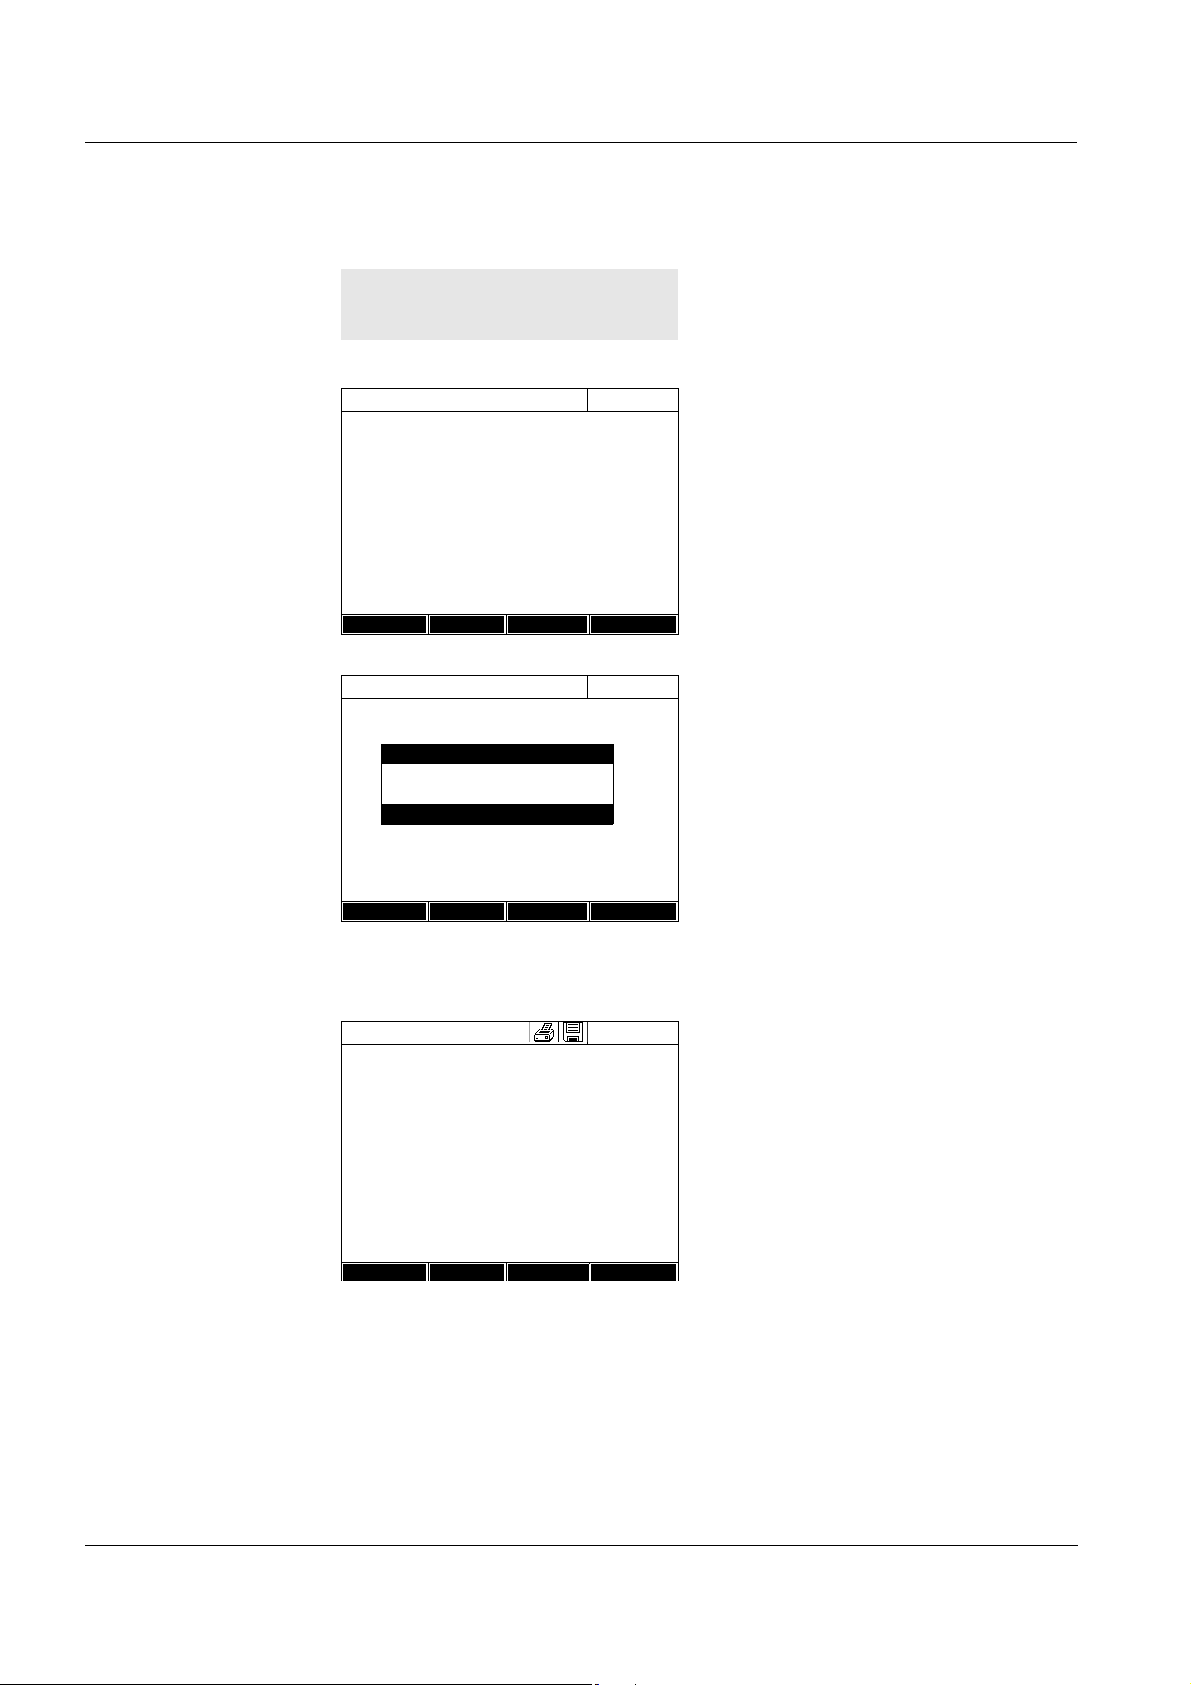
Operation Spectroquant® Pharo 300
<HOME>
Concentration
Concentration
16.01.12 9:52
Please select method for measuring or insert
a barcoded cell or insert AutoSelector .
Setup
Method list Last method New Method
Concentration
16.01.12 9:52
304: Ca
Ca
10 mm
0..20 - 4.00 mg/l
Setup
Method list
Citation form Unit
Adjust
Zero adjustment
Reagent blank
Calibrate the method
Calibrate the method
16.01.12 9:52
User calibration:
Protocol ID:
2
Date: 16.01.2012
User: admin
Curve type: Straight line
Correction: 105%
304: Ca
Ca
End
Calibration
Delete New
Viewing the data of
the user calibration
Select the method manually
(see section 4.5.5).
If there are already data for the
zero adjustment, reagent blank
value or a user calibration available, the photometer informs you
of this. You can take over or discard the available values.
1 Using <BLANK ZERO>, open the
Adjust selection list.
or
Open the setting menu with
[Setup].
2 Select and confirm Calibrate the
method.
The Calibrate the method window
pops up.
The data of the last measurement
appear in the window.
If necessary, display the list with
the value pairs of nominal value
and absorbance with Calibration
data.
If necessary, display the calibration curve in the window of the
value pairs with Graphic.
If necessary, erase the user calibration with Delete.
If necessary, carry out a new user
calibration with New measure-
ment.
88
If necessary, finish the calibration
with End.
ba75703d07 04/2014
Page 89

Spectroquant® Pharo 300 Operation
Measuring with user
calibration
<HOME>
Concentration
Concentration
[Cal][BV/2c][ZERO 10.01.2012 11:08]
User calibration
A calibration dated xxx is available for this
To start measurement, insert cell or press
method. Should it be used?
<START/ENTER>
Yes
No
304: Ca
10 mm
Setup
Method list
Citation form Unit
16.01.12 9:52
0..20 - 4.00 mg/l
Select the method manually
(see section 4.5.5).
If there are already data for the
zero adjustment, reagent blank
value or a user calibration available, the photometer informs you
Ca
of this. You can take over or discard the available values.
If the available user calibration
should not be used, a query with
further options pops up:
- Use default calibration
The existing user calibration is
erased. Further measurements
will be carried out with the original calibration stored with the
method
- Recalibrate
The existing user calibration is
erased. A new user calibration
is started.
Concentration
[Cal][BV/2c][ZERO 10.01.2012 11:08]
To start measurement, insert cell or press
<START/ENTER>
304: Ca
10 mm
Setup
Method list
Citation form Unit
16.01.12 9:52
0..20 - 4.00 mg/l
- Cancel
The existing user calibration
remains stored. The previous
query is displayed.
The photometer is ready to measure after all the necessary data
have been confirmed or measured.
Ca
ba75703d07 04/2014
89
Page 90

Operation Spectroquant® Pharo 300
4.5.11 Automatic Turbidity correction
The Turbidity correction function activates the automatic recognition and
compensation of the light absorption caused by turbid substances.
After activating the function remains permanently switched on. Measured values that were measured with Turbidity correction are labeled with [TURB]
(turbidity correction) on the display and in the documentation (printout and
memory).
The Turbidity correction function is not active in the delivery condition.
Note
The setting for automatic turbidity correction is used with all methods where
the automatic turbidity correction makes sense. The photometer automatically decides whether or not to use the function.
Switching on the
turbidity correction
Overview For Concentration mode, you can develop and store yourself user-defined
Calibration data and
calibration function
The automatic turbidity correction is activated and deactivated in the setting
menu of the concentration measurement (see section 4.5.6 S
ONCENTRATION MODE).
C
ETTINGS FOR
4.5.12 Programming / modifying user-defined methods
methods under the method numbers 1001 to 1100. The photometer software
supports you when creating the methods.
In photometry, the calibration function describes the dependency between
the measured parameter (e.g. concentration) and the photometric measurement result (e.g. absorbance) of a sample. The knowledge of this dependency is a prerequisite for the development of a photometric method. The
calibration function is usually determined by means of a series of measurements with standard solutions of known concentrations (nominal value), e.g.
a 10-point calibration.
Note
In measuring operation, the reverse calibration function is used to output the
measured absorbance as a concentration value.
90
Line types The dependency between the nominal value and absorbance is often linear
in a wide range as shown in the following example:
ba75703d07 04/2014
Page 91

Spectroquant® Pharo 300 Operation
0
0
Nominal value (e. g. concentration)
Absorbance
0
0
Nominal value (e. g. concentration)
Absorbance
0
0
Nominal value (e. g. concentration)
Absorbance
figure 4-2 Example of a linear calibration function after a 10-point calibration
In the case of a linear dependency, the calibration function is determined by
means of linear regression. The slope and axis intercept (E0) are the characteristics of the calibration line.
In the case of a nonlinear dependency, the points of the measuring ranges
can be connected to each other as a polygon line or approximated as a
parabola:
figure 4-3 Example of a polygon line calibration function after a 10-point calibration
figure 4-4 Example of a parabola calibration function after a 10-point calibration
ba75703d07 04/2014
91
Page 92

Operation Spectroquant® Pharo 300
Determining the
calibration function
You have the following options to create a method:
Measure and store:
Carry out a series of measurements with the following sample solutions
while at the same the photometer takes over the values:
– Blank sample to determine the reagent blank value
(with deionized water instead of sample, see section 4.5.9)
– at least one, up to ten standard solutions in different concentrations.
The photometer stores nominal value/absorbance value pairs of the individual measurements and determines the resultant characteristics of the
calibration. When doing so, you can select the following line types: Poly-
gon line, Straight line or Parabola.
Enter as value pairs:
Entry of the value pairs, Nominal value (concentration) / Measured absorbance of an already available
test series with the following sample solu-
tions:
– Blank sample to determine the reagent blank value
(with deionized water instead of sample, see section 4.5.9)
– at least one, up to ten standard solutions in different concentrations.
Based on the entered value pairs, the photometer determined the characteristics for the calibration. When doing so, you can select the following
line types: Polygon line, Straight line or Parabola.
Enter a function:
Entry of a function to calculate the concentration from the absorbance
(reverse calibration function). You can enter on the photometer the coefficients of a polynomial equation of the following type:
c = a0 + a1·A + a2·A
2
+ a3·A3 + a4·A4 + a5·A
5
with:
c Measurement result, e.g. concentration
a0 to a5 Coefficients (input range 0.000 to 1000,000)
A Absorbance
Note
Entering the formula is especially simple if you measure with a commercial
test set for which the manufacturer has given the value for the coefficients a1.
It is often called the "Factor" and corresponds to the reciprocal value of the
slope of the straight line of the calibration function.
If a linear
function (straight line) should be entered, it is necessary to enter
the coefficients a0 and a1 to receive correct measured values.
92
ba75703d07 04/2014
Page 93

Spectroquant® Pharo 300 Operation
If the exact value for a0 is not known at the time the formula is entered, it is
sufficient to enter the coefficient a1. In this case, the User-defined blank value
function (in the Concentration / Setup menu) has to be activated to measure
with this method.
Prior to measuring with this method, a blank value measurement has to be
carried out. This procedure determines the value for a0, which then replaces
the value from the programming of the method.
If the User-defined blank value function is not activated, the photometer uses
the value zero for the coefficient a0.
More information on
the entry of the
formula
(determination of
coefficients)
Linear
function
If the value for a1 (slope of the reverse calibration function)
is unknown, you can very simply program the method in
the photo
meter by measuring/storing or entering the value
pairs (see above).
For entry as a formula, you can determine the coefficients
of the reverse calibration function by linear regression.
When doing so, the concentration has to be on the Y axis
and the absorbance on the X axis.
In the case of a linear function, the coefficients of the
reverse calibration function can also be determined from
the determined reagent blank value and the slope (m) of
the calibration function (Y axis = absorbance, X axis = concentration). Proceed as described below.
Explanation of the coefficients of the formula:
a0 = - E0*a1
[E0 = reagent blank value
(absorbance at concentration 0)]
a1 = 1/m
Reverse value of the slope of the calibration func-
tion
(often referred to as "Factor")
m = slope of the calibration function
ba75703d07 04/2014
Nonlinear
function
a2, a3, a4, a5 = further coefficients
(when entering a linear function: zero)
The coefficients of the reverse calibration function are
determined by multiple regression. When doing so, the
concentration has to be on the Y axis and the absorbance
on the X axis.
93
Page 94

Operation Spectroquant® Pharo 300
Further method data
Input field Possible entries
Number* 1001 ... 1100
Designation Any name (max. 18 characters)
Version Any version designation (max. 18 characters)
Wavelength* Freely selectable (in nm)
Cell* 16 (round), 10, 20 or 50 mm
Citation form e.g. PO4-P (max. 18 characters)
Unit** e.g. mg/l (max. 18 characters)
Resolution* 0.001, 0.01, 0.1 or 1
Lower and upper limit of
the measuring range *
Any value between zero and the highest concentration of the used standard solutions
Timer 0 to 3 Up to four analysis timers freely adjustable
AQA2 target value Any value within the measuring range
AQA2 tolerance Any
Required measure-
ments
1 or greater
Number of measurements after which a measured
value is documented. With more than one measurement, the documented measured value is the
median from all measurements.
Blank required Yes / No
Calibration possible Yes / No
Calibration required Yes / No
* necessary inputs
** default: mg/l
Note
If a nonlinear calibration curve is programmed for a method, it may occur that
the presetting of the following menu items cannot be changed:
Blank required
Calibration possible
Calibration required
94
ba75703d07 04/2014
Page 95

Spectroquant® Pharo 300 Operation
How to program
user-defined
methods
<HOME>
Concentration
– [Setup]
– New method
Edit method
Number 1001
Designation Nitrite
Version 01
Wavelength 525
Cell 10 mm
Citation form NO2-N
Unit mg/l
Resolution 0.001
Calibration curve Measure standard solutions
Method list Delete Next
16.04.07 9:52
1 Enter the general method data
here. The next available method
number is already entered as the
number.
You have the following options
when filling out the input fields:
- Fill out all empty input fields one
after the other
-Using [Method list], select an
already existing method as a
model, give it a new method
number and adjust the entries
-Using [Method list], select an
existing method in order to
change it (without changing the
number).
- You can delete the method
completely with [Delete].
2 Select the menu item, Calibration
curve. Select the method for the
determination of the calibration
line. The following variants can be
selected:
- Measure standard solutions
- Enter value pairs
- Enter formula
3 Using [Next], accept all entries on
the page and switch to the next
page.
Note
During the following proceeding, you can return to the previous page at any
time with [Back], e. g. if you want to correct entries, add further value pairs or
eliminate outliers.
ba75703d07 04/2014
95
Page 96
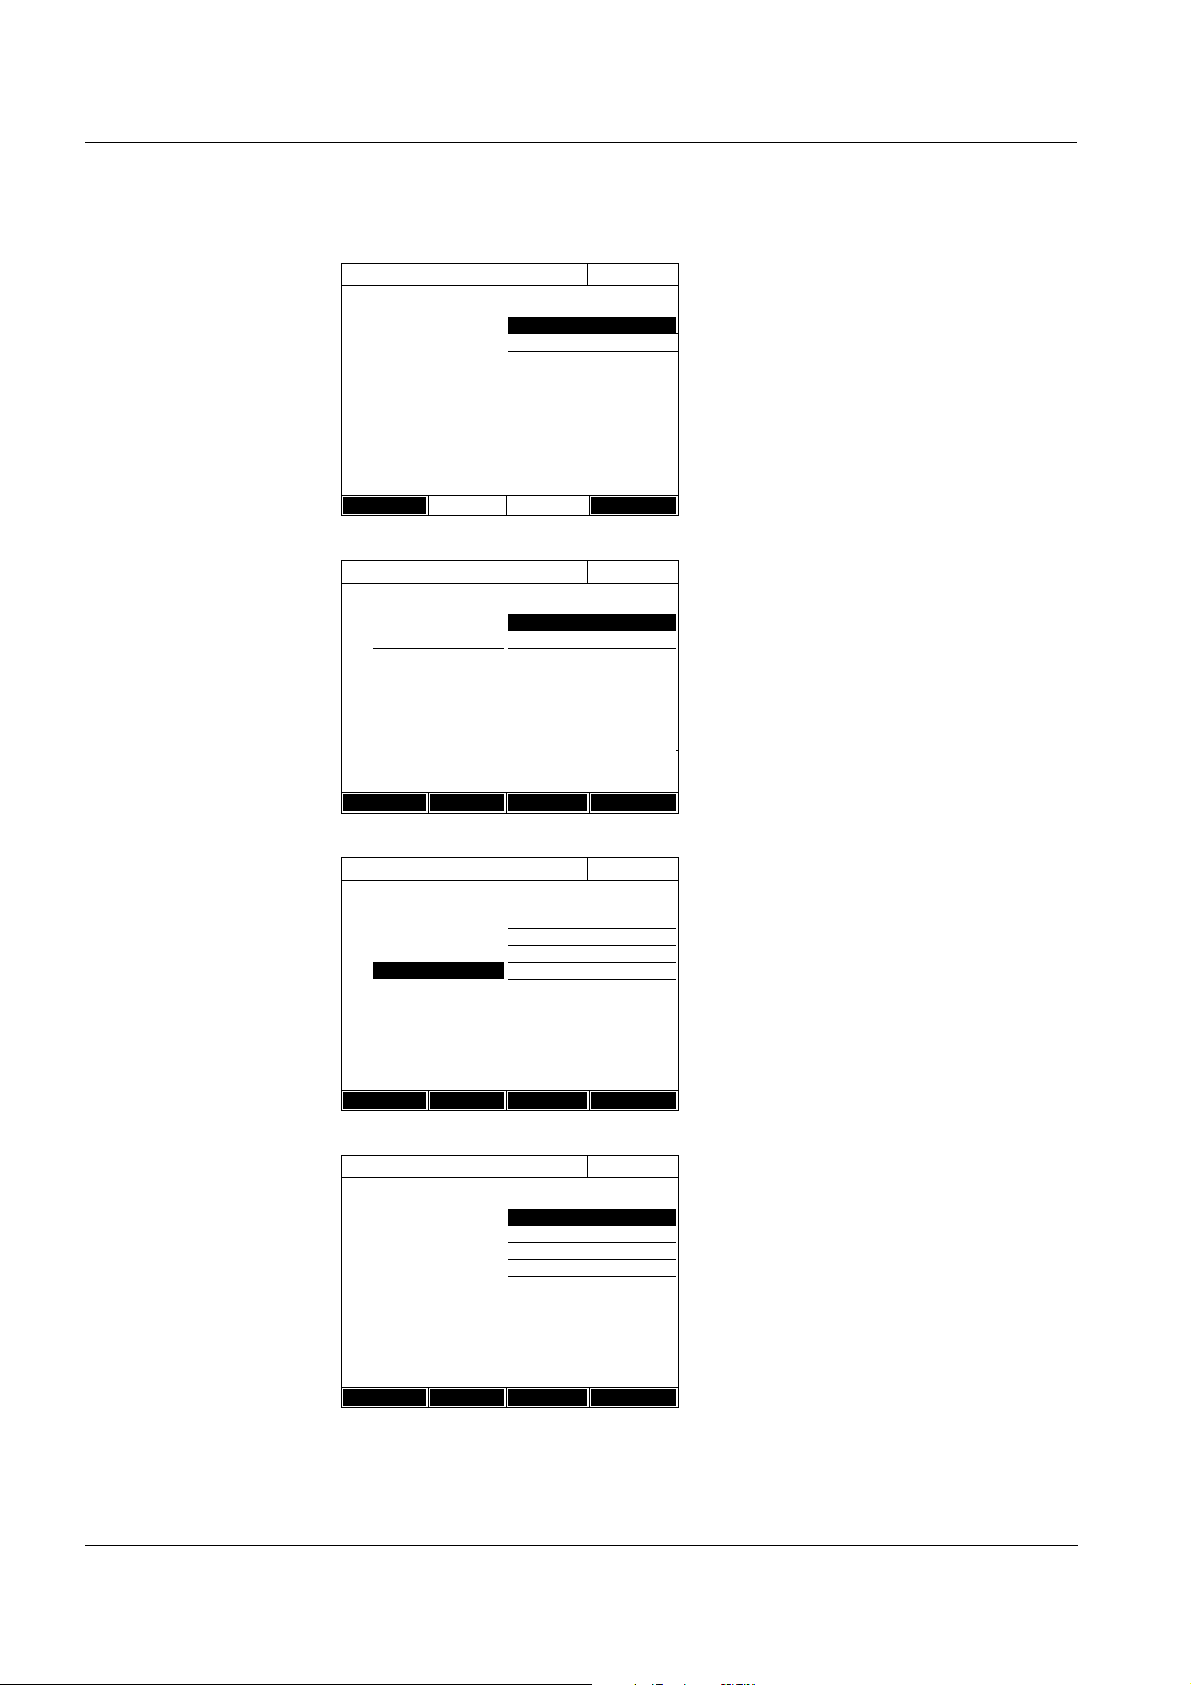
Operation Spectroquant® Pharo 300
Edit method
16.04.07 9:52
Standard ID
Standard manufacturer
Back Next
Edit method
16.04.07 9:52
T arget va lue Absorbance
E0 0.000
1
Back Add Delete Next
Edit method
16.04.07 9:52
T arget va lue Absorbance
E0 0.000
10.300
20.600
3 1.000
Back Add Delete Next
Edit method
16.04.07 9:52
T arget va lue Absorbance
E0 0.000
10.300
20.600
31.000
Back Add Delete Next
Variant 1:
Measure standard
solutions
1 Select and confirm Measure stan-
dard solutions.
2 Enter and confirm details of the
standard solutions (optional).
3 Using [Next], accept all entries on
the page and switch to the next
page.
The table for the measurement of
standard solutions pops up.
In the first two lines of the table,
the two value pairs (measuring
points) that are at least required
for a calibration are already prepared (reagent blank value E0 and
any further nominal value).
4 Create further values pairs with
[Add] as necessary.
You can delete a highlighted value
pair with [Delete].
5 In the Target value column, enter
the nominal values of the individual standard solutions.
Measuring the standard solutions:
6 Using the arrow keys <▲><▼>
and <><>, navigate to the relevant input field in the Absorbance
column and press
<START ENTER>.
96
ba75703d07 04/2014
Page 97

Spectroquant® Pharo 300 Operation
Absorbance E0
To start measurement, insert cell or press
<START/ENTER>
525 nm
Absorbance E0
Last measured absorbance
0.009
Median
0.009 (1 Measurement(s))
525 nm
Next meas.
Discard Apply
16.04.07 9:52
16 mm
16.04.07 9:52
16 mm
The measurement display
appears.
7 Insert the cell with the respective
standard.
The absorbance is measured. The
result of the first single measurement is displayed.
8 If necessary, carry out further sin-
gle measurements for the formation of the median with [Next
meas.]
or
discard the last single measurement with [Discard].
9 To accept the median value, press
[Apply].
Note
If the zero standard concentration (reagent blank value E0) is not measured
and stored, the photometer calculates the calibration line without this value.
If the User-defined blank value function (in the Concentration / Setup menu)
is activated for measuring with this method, the value for a0 is determined
and replaces the calculated axis intercept from the programming of the
method.
Edit method
T arget va lue Absorbance
E0 0.000 0.009
1 0.300 0.664
2 0.600 1.292
31.000 2.178
16.04.07 9:52
10 Repeat the steps 6 to 9 until all
input fields in the Absorbance column are filled out.
11 Using [Next], accept all entries on
the page and switch to the next
page.
The value pairs are displayed in a
Back Add Delete Next
diagram (standard: Polygon line).
ba75703d07 04/2014
97
Page 98

Operation Spectroquant® Pharo 300
Edit method
16.04.07 9:52
f(x)=0.73x
R2 = 1.000
Meas. range: 0.050 - 1.000 mg/l
Concentration [mg/l NO2-N]
Back Curve type Meas. range Next
Absorbance
Edit method
16.04.07 9:52
Timer 0 00:00:00
Timer 1 00:00:00
Timer 2 00:00:00
Timer 3 00:00:00
AQA2 target value 1.00 mg/l
AQA2 tolerance 0.10 mg/l
Required measurements 1
Blank required No
Calibration possible No
Calibration required No
Back Complete
The related formula f(x) and corre-
2
lation coefficient R
are displayed
above the diagram.
12 If required, select a different line
type for the line adjustment with
[Curve type].
- Polygon line
- Straight line
- Parabola
13 If required, enter different mea-
sured value limits with [Meas.
range].
- Lower limit
- Upper limit
14 Using [Next], complete the editing
of the calibration line and proceed
to the next page.
The timers and AQA2 data linked
to the method are displayed.
98
Enter value pairs
Variant 2:
15 If necessary, enter intervals for up
to 4 timers.
16 If necessary, enter the AQA2 tar-
get value and AQA2 tolerance.
17 If necessary, select from how
many single measurements the
documented measured value is
calculated.
18 If necessary, set whether a
reagent blank value is required.
19 If necessary, set whether a user
calibration is possible and/or
required.
20 Complete the programming of the
method with [Complete].
The method is programmed and
selected for measuring.
Unlike variant 1, the fields of the Absorbance column are filled out manually
here. Accordingly, the steps 6 to 10 are not applicable here. Apart from that,
the proceeding is identical to variant 1.
ba75703d07 04/2014
Page 99

Spectroquant® Pharo 300 Operation
Vari a n t 3:
Enter formula
Edit method
c = a0 + a1·A + a2·A2 + a3·A3 + a4·A4 + a5·A
a0 0.605
a1 2
a2
a3
a4
a5
Lower limit of measuring range 1,000 mg/l
Upper limit of measuring range 3.000 mg/l
Method list Delete Next
16.04.07 9:52
5
1 Select and confirm Enter formula.
Input fields for the coefficients (a0
... a5) of the formula are displayed.
2 Enter and confirm the factors.
If no value is entered for a coefficient the photometer automatically
uses the value 0.
Note
Entering the formula is especially simple if you measure with a commercial
test set for which the manufacturer has given the value for the coefficients a1.
It is often called the "Factor" and corresponds to the reciprocal value of the
slope of the straight line of the calibration function.
If a linear function (straight line) should be entered, it is necessary to enter
the coefficients a0 and a1 to receive correct measured values.
If the exact value for a0 is not known at the time the formula is entered, it is
sufficient to enter the coefficient a1. In this case, the User-defined blank value
function (in the Concentration / Setup menu) has to be activated to measure
with this method. Prior to measuring with this method, a blank value measurement has to be carried out. During this procedure the value for a0 is
determined and replaces the previous value.
3 Enter and confirm the measuring
range limits.
4 Complete the entering of the for-
mula with [Next].
The timers and AQA2 data linked
to the method are displayed.
ba75703d07 04/2014
99
Page 100

Operation Spectroquant® Pharo 300
Edit method
16.04.07 9:52
Timer 0 00:00:00
Timer 1 00:00:00
Timer 2 00:00:00
Timer 3 00:00:00
AQA2 target value 1.00 mg/l
AQA2 tolerance 0.10 mg/l
Required measurements 1
Blank required No
Calibration possible No
Calibration required No
Back Complete
5 If necessary, enter intervals for up
to 4 timers.
6 If necessary, enter the AQA2 tar-
get value and AQA2 tolerance.
7 If necessary, select from how
many single measurements the
documented measured value is
calculated.
8 If necessary, set whether a
reagent blank value is required.
9 If necessary, set whether a user
calibration is possible and/or
required.
10 Complete the programming of the
method with [Complete].
The method is programmed and
selected for measuring.
100
ba75703d07 04/2014
 Loading...