

Operation & User Manual
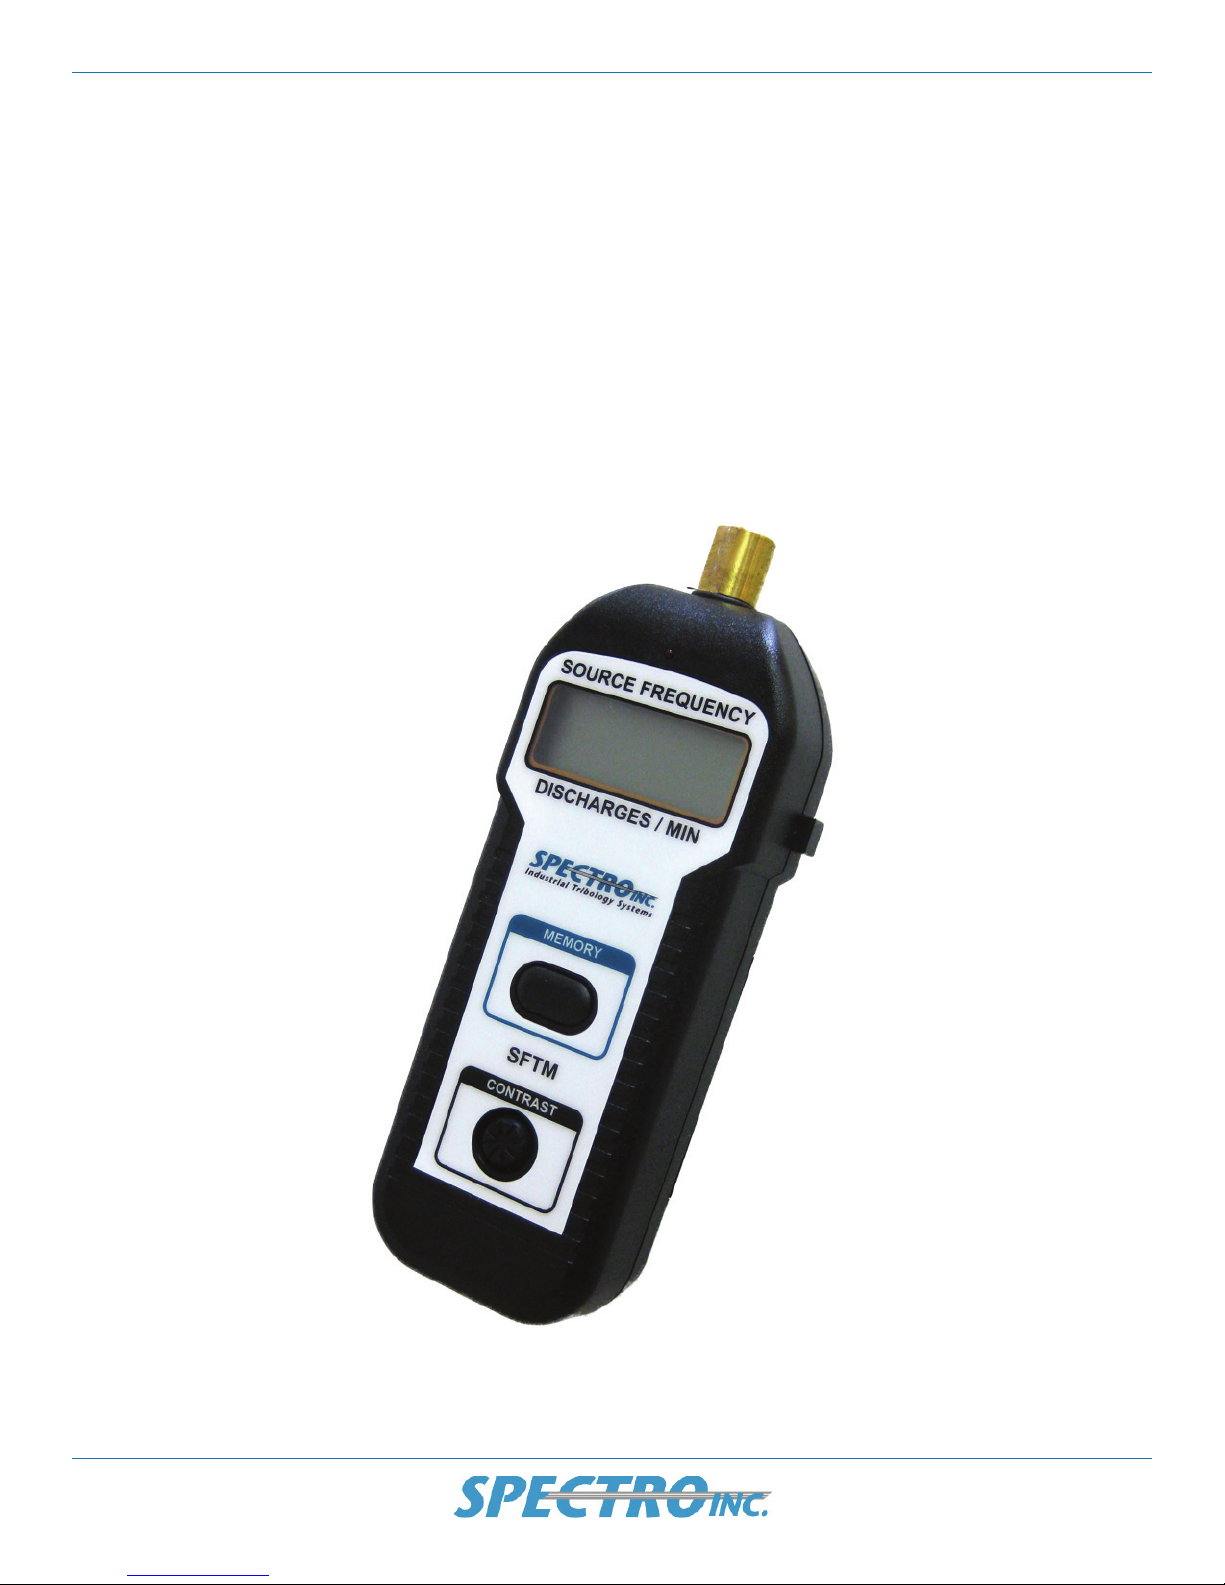
Source Frequency
Test Meter
Part Number M90301

Operation & User Manual
Source Frequency
Test Meter
Part Number M90301

© 2008-2012 Spectro, Incorporated. All rights reserved.
The information and descriptions in this document are the sole property of Spectro Incorporated and may
not be copied, reproduced, disseminated, or distributed without explicit written permission from Spectro
Incorporated. The statements, confi gurations, technical data, and recommendations in this document
are believed to be accurate and reliable at the time of this publication, but Spectro Incorporated assumes
no responsibility or liability for any errors or inaccuracies that may appear in this document. Spectro
Incorporated is not responsible for any infringement of patents or other rights of third parties that
may result from the use of this document. The content of this document is furnished for informational
purposes only, is subject to change without notice, and does not represent a commitment or guaranty
by Spectro Incorporated. Spectro Incorporated makes no warranty, express or implied, with respect to
the content of this document. Spectro Incorporated shall not be liable for any loss or damage, including
consequential or special damages, resulting from any use of this information, even if loss or damage is
caused by Spectro Incorporated as a result of negligence or any other fault.
FluidScan is a registered trademark and SpectroInc, Spectroil, SpectroVisc, SpectroTrack, SpectroLNF,
SpectroFTIR, and SpectroFDM are trademarks of Spectro, Incorporated. All other trademarks are the
property of their respective holders.
Spectro Incorporated (“Spectro Inc.”) warrants to the original purchaser only, that all Spectro Inc. bench top
instruments will be free from defects in material or workmanship for a period of twelve (12) months from
date of installation or fi fteen (15) months from the date of shipment, whichever occurs fi rst. SPECTRO
INC.’S SOLE OBLIGATION AND YOUR EXCLUSIVE REMEDY under this Limited Warranty and, to
the extent permitted by law, any warranty or condition implied by law, shall be the repair or replacement of
parts, without charge, which are defective in material or workmanship and which have not been misused,
carelessly handled, abnormal conditions or operation, accidents or acts of God, or misrepaired by persons
other than Spectro Inc. or Authorized Service Provider. To make a claim under this Limited Warranty, you
must contact the Spectro Inc. Factory Service Center or Authorized Service Provider. The determination of
whether any product has been subject to misuse or abuse will be made solely by Spectro Inc. If a hardware
defect arises and a valid claim is received within the limited warranty period, at its option and to the extent
permitted by law, Spectro Inc. will either (1) repair the hardware defect at no charge, using new parts or
refurbished parts that are equivalent to new in performance and reliability, or (2) exchange the product with
a product that is new or refurbished that is equivalent to new in performance and reliability and is at least
functionally equivalent to the original product. Spectro Inc. may request that you replace defective parts with
user-installable new or refurbished parts that Spectro Inc. provides in fulfi llment of its warranty obligation.
A replacement product or part, including a user-installable part that has been installed in accordance
with instructions provided by Spectro Inc., assumes the remaining warranty of the original product. For
Authorized Service Provider, please contact Spectro Inc. Technical Support, +1-978-431-1130, or support@
spectroinc.com.

IMPORTANT!
Register Your Product.
Register your product online at http://www.spectroinc.com/register.htm.
Filling out the online form completes your product registration. Completing the one-page form is quick and
enables Spectro to:
• Contact you with important product alerts.
• Inform you about any product updates.
• Send special product-based applications as they become available.
• Obtain needed information for processing a warranty claim.


Product Safety
WARNING: High voltages are present during the operation of the Spectroil M!
Observe all safety precautions! Turn OFF the main power switch and unplug the
Spectroil M before performing any work.
Software CAUTION: Do not attempt to add any software or alter the original
factory-installed software without checking fi rst with the Spectro Inc. Service
Department.
Source Frequency Test Meter v July 2012/Version 1.2

Product Safety Operation & User Manual
July 2012/Version 1.2 vi Source Frequency Test Meter

Source Frequency Test Meter || vii
Contents
1.0 INTRODUCTION ......................................................................................................... 1
2.0 DESCRIPTION & SPECIFICATIONS .......................................................................... 3
3.0 MAINTENANCE & ADJUSTMENT ............................................................................ 5
3.1 Display Contrast Adjustment ........................................................................................... 5
3.2 Battery Replacement ........................................................................................................5
3.3 Calibration ....................................................................................................................... 6
4.0 PROCEDURE TO CHECK THE EXCITATION SOURCE FREQUENCY .................. 7
4.1. Auxiliary Gap Optical Fiber View ..................................................................................... 7
4.2 Auxiliary Gap Direct View ............................................................................................... 9
5.0 DETAILED DESCRIPTION OF EXCITATION SOURCE FREQUENCY ................. 13
July 2010/Version 1.2

viii || Operation & User Manual
List of Effective Pages
is manual consists of 18 pages plus a cover.
Summary of SFTM Manual Versions
Change
Ver-
Date Description
First Issue 1.0 30 June 1995 CID versions of the Spectroil M and Spectroil Jr+
1 1.1 29 July 2008 Updated manual for current versions of the Spectroil M
that have SFTM docking ports.
July 2010/Version 1.2

Section 1.0
Introduction
Source Frequency Test Meter || 1
1.0 INTRODUCTION
is manual provides a description of the Source
Frequency Test Meter (SFTM) and step-by-step
procedure to measure and adjust the excitation
source frequency of the Spectroil M family of Oil
Analysis Spectrometers. Proper care and operation of the Source Frequency Test Meter (SFTM),
part number M90300 and information on the
maintenance and adjustments to the SFTM are
also provided.
e Source Frequency Test Meter (SFTM) Figure
1-1, is a hand-held electronic measurement device
used to check the frequency of oscillatory arc excitation sources. e SFTM is easy to operate, it is
battery operated, requires no calibration, and can
be used in place of an oscilloscope. It is shipped
in its own carrying case and includes the four AA
batteries required for operation.
e excitation sources in all versions of the
Spectroil M are an oscillatory arc discharge. ey
have been designed to achieve excitation characteristics that produce a spectral signature to match
the United States Department of Defense Joint
Oil Analysis Program (JOAP) date base. e per-
Figure 1-1, Source Frequency Test Meter
(SFTM) in its carrying case
July 2010/Version 1.2

2 || Operation & User Manual
formance of the Spectroil M is directly dependent
on the output characteristics and frequency of the
oscillatory arc source.
It is absolutely necessary to check the excitation
source frequency prior to performing the JOAP
monthly correlation samples. e source frequency also has to be checked each time the instrument
is deployed to a country where the line frequency
is other than 60 Hertz, and/or to verify that no
damage was incurred during transport.
Description and user maintenance of the SFTM
is provided in Sections 2 and 3 of this manual.
Step-by-step procedures for setting the excitation
source frequencies of the Spectroil M are provided
in Section 4.0 and a detailed description of the
excitation source frequency and the need to verify
it is explained in Section 5.
July 2010/Version 1.2

Source Frequency Test Meter || 3
Section 2.0
Description &
Specifi cations
2.0 DESCRIPTION & SPECIFICATIONS
e Source Frequency Test Meter is a hand-held
device used to check and to verify the excitation
source frequency of the Spectroil M family of
oil analysis spectrometers. It includes its’ own
carrying case the four AA batteries required for
operation. A special adapter is pre-installed for
connection to the SFTM port on Spectroil M
spectrometers.
e SFTM control buttons used in measuring
excitation source frequency, are noted in Figure
2-1. e step-by-step procedure for checking the
excitation source frequency of a Spectroil M is described in Section 4.0 of this manual.
Input Coupler / Aiming Light
Momentary Power Switch
MEMORY Switch
CONTRAST Control
Figure 2-1, Source Frequency Test Meter
(SFTM)
July 2010/Version 1.2

4 || Operation & User Manual
SFTM SPECIFICATIONS
Item Description
Display: 5 digits, 10 mm (0,4”) Liquid Crystal (LCD)
Measuring Range: 5 to 99,999 counts
Resolution: 0.1 count ( < 1,000 discharge/min.
1 discharge/min. (> 1,000 counts)
Accuracy: +/- (0.05% + 1 count)
Time Base: Quartz Crystal, 4.194 Mhz
Operating Temperature: 0-50°C (32 - 122°F)
Memory: Last/Maximum/Minimum values
Battery: Four 1.5 volt AA batteries
Power Consumption: Approximately 153 ma
Size: 165 x 61 x 39 mm (6.5 x 2.4 x 1.5 inch)
Weight: 235 g (0.52 LB) including batteries
July 2010/Version 1.2

Section 3
Maintenance &
Adjustment
Source Frequency Test Meter || 5
3.0 MAINTENANCE & ADJUSTMENT
3.1 Display Contrast Adjustment
e contrast of the LCD display may vary due
to battery voltage drop or a change of the viewing
angle. e contrast is variable with the “CONTRAST” adjustment knob on the control panel
of the SFTM. It should be set for viewer preference.
3.2 Battery Replacement
e LCD display will have a “LO” indication to
warn the user that the batteries are low and should
be replaced. e warning appears when the batteries have discharged from the original 6.0 volts
to approximately 4.5 volts. When the “LO” indication rst appears, the SFTM can still be used
for several hours, however, it is good practice to
replace the batteries at the rst opportunity.
e battery compartment, Figure 3-1 is on the
back of the SFTM. e battery compartment
Table 3-1, SFTM battery compartment with
cover removed
July 2010/Version 1.2

6 || Operation & User Manual
cover can be removed by momentarily depressing
the latch with your nger. Replace the old batteries with four (4) fresh AA batteries. e correct
polarity and location of the batteries is shown in
each socket. All four batteries should be replaced
at the same time. Replace the cover by lining
up the bottom slots and closing until a “click” is
heard to signify that it is latched.
3.3 Calibration
e Source Frequency Test Meter does not require
calibration with normal use. e discharge rate is
counted and controlled by a 4.194 MHz quartz
crystal similar to a quartz watch.
Under normal circumstances, the SFTM does not
require calibration. To verify calibration, point
the SFTM toward a uorescent light xture and
press and hold the Momentary Power Switch for
at least 10 seconds. For power sources with 60
Hertz, the meter should read 7,200 +/- 100 and
for 50 Hertz power sources, 6,000 +/- 100. If the
SFTM measurement exceeds the tolerances speci ed, utilize the oscilloscope method.
Contact Spectro Inc. if you suspect that your
SFTM has been abused and/or its operation is
suspect.
July 2010/Version 1.2

Source Frequency Test Meter || 7
Section 4
Procedure
to Check the
Excitation
Source
Frequency
4.0 PROCEDURE TO CHECK THE
EXCITATION SOURCE FREQUENCY
ere are two methods to check the excitation
source frequency using the Source Frequency Test
Meter. e rst method employs an optical ber
that views the arc discharges as they occur across
the auxiliary gap. e second method measures
the source frequency by directly viewing the arc
discharges that occur across the auxiliary gap.
Both methods work equally well, but the advantage of the rst method is that it is faster and also
does not expose the operator to areas with live
voltage. Follow the steps listed below to check
the excitation source frequency using the SFTM.
4.1. Auxiliary Gap Optical Fiber View
To check the excitation source frequency by measuring the discharges per minute across the auxiliary gap using the SFTM, follow the steps listed
below.
NOTE: is procedure should be performed by the
operator once per month prior to JOAP monthly
correlations, whenever the instrument is moved, or
every 2,000 burns.
1. Remove the SFTM from the protective container. If this is the rst time this test meter
is to be used, four AA size batteries will have
to be installed before it can be operated.
ese batteries are provided with the test
meter.
2. Hold the SFTM in the right hand and with
your thumb, press and hold the momentary
switch located on the upper right side of the
SFTM. is will turn the test meter ON
and along the right side of the digital display
a “0” (zero) should appear. If the image of
the “0” is not clear, or if many characters
simultaneously appear on the display, the
CONTRAST control should be adjusted.
NOTE: Under normal circumstances, the SFTM
does not require calibration. To verify calibration,
July 2010/Version 1.2

8 || Operation & User Manual
point the SFTM toward a uorescent light xture
and press and hold the Momentary Power Switch
for at least 10 seconds. For power sources with 60
Hertz, the meter should read 7,200 +/- 100 and
for 50 Hertz power sources, 6,000 +/- 100. If the
SFTM measurement exceeds the tolerances speci ed,
utilize the oscilloscope method.
3. Remove the threaded protective dust cover
from the SFTM PORT and insert the docking coupler of the SFTM into the SFTM
PORT until it stops. e SFTM coupler
has a guide so that it can only be inserted at
a convenient viewing angle. Refer to Figure
4-1.
4. Set the MODE switch on the control panel
to OPERATE.
NOTE: Make four warm-up burns before proceeding.
5. Prepare the sample excitation stand for a
routine analysis with a new disc and rod
electrode and set the analytical gap in accordance with the Spectroil M Operator’s
Manual. Place a sample holder on the
sample table and ll it with base oil (0 ppm)
standard oil. Raise the sample holder into
the normal position. Close the sample stand
door.
6. Press the START switch located on the front
control panel. e burn cycle will begin and
the high voltage across the auxiliary gap will
appear as a concentrated stream of light. In
actuality, this steam of light consists of approximately 700 high voltage discharges per
second and the function of the SFTM is to
detect and quantify these arc discharges.
7. Press and hold the momentary power switch
on the SFTM after the preburn period
has completed (after approximately 6 seconds). If the SFTM is properly positioned
to receive the light emitted across the auxiliary gap, a small red light emitting diode
(LED) located above the digital display of
the SFTM will begin to ash at a consistent
rate. Hold the position of the SFTM steady
and continue to hold the momentary power
switch and monitor the consistency of the
red LED to ensure that the signal is strong
and consistent. Once the burn cycle is complete (30 seconds), release the momentary
power ON switch of the SFTM and remove
the SFTM from the port for a more convenient observation of the measurement.
NOTE: It is normal to observe uctuations of
approximately +/- 1000 discharges per minute
(DPM) during the measurement cycle.
NOTE: If the red LED does not appear or ashed
at an erratic rate, the SFTM is not in position to
permit the light from the auxiliary gap to enter the
test meter. Repeat the procedure until a steady ashing red light is obtained.
8. When the burn is complete, press and hold
the MEMORY switch located on front of
the SFTM one time. A number will appear
momentarily, then the letters “LA” (last)
will appear. is number should be approximately 54,000 and represents the last
measurement the SFTM made before the
power switch was released. is reading is
not signi cant for this procedure. Release
the MEMORY switch to end the reading.
Table 4-1, SFTM inserted in SFTM port and
ready for use
July 2010/Version 1.2
9. Press and hold the MEMORY switch a
second time and a new number will appear. is is the number that will be used to

Source Frequency Test Meter || 9
determine the excitation source frequency.
is number must be 54,000 +/- 2000. If
the MEMORY switch is held, the letters
“UP” will appear, which designates that
this was the highest reading taken during
the burn. If the source frequency is within
this range, then proceed to step 12 of this
procedure. If not, SFTM port ber may be
defective. Check frequency with the Direct
View Method, Section 4.2.
10. Upon completion of the source frequency
check, replace the dust cover on the SFTM
PORT to prevent any accumulation of
debris.
11. Return the SFTM to its protective storage
container.
12. is procedure is now complete.
Top Trim Panel
Circuit Breaker CB1
Table 4-2, Location of CB1 and top trim panel
Excitation
Source
Access Panel
4.2 Auxiliary Gap Direct View
To check the excitation source frequency by measuring the discharges per minute across the auxiliary gap using the SFTM, follow the steps listed
below.
WARNING: is procedure should only be performed by a qualifi ed technician.
1. Remove power from the Spectroil M by
placing the main power circuit breaker CB1
to the OFF or down position, Figure 4-2.
2. Remove the four Phillips head mounting screws positioned in the corners of the
Spectroil M top trim panel, Figure 4-2. Be
sure not to lose the dress washers for these
panel screws; they are not captive to the
screws. Remove the top trim panel.
3. To remove the top excitation source access
panel (the smaller of the two panels) Figure
4-3, turn the six 1/4 turn pawl fasteners
screws counterclockwise until the maximum
travel of the screw is achieved, approximately
10 rotations.
Table 4-3, Excitation source access panel
CAUTION: Do not overdrive the counterclockwise travel of these screws, stop when light resistance is encountered. Once all fasteners have been
loosened, remove the top access panel.
NOTE: is panel has a safety interlock switch to
protect unauthorized personnel from removing this
panel with power applied. Only trained operators
and electronic maintenance personnel are authorized to enter this compartment. To perform service
in the excitation source compartment, the operator/
technician must bypass this safety interlock switch.
4. To bypass the interlock switch, Figure 4-4,
grasp the plunger and pull in an upward
direction until the plunger moves approximately 1/4 inch. is will bypass the inter-
July 2010/Version 1.2

10 || Operation & User Manual
Auxiliary
Gap
Safety
Interlock
Switch
Table 4-4, Location of safety interlock and auxiliary gap
lock switch function and permit power to be
applied to the instrument. If either of two
safety interlock switches are not properly
positioned or bypassed, circuit breaker CB1
will fail to latch in the ON position.
5. Place the circuit breaker CB1 in the up
or ON position. is will apply power to
the instrument and after the computer has
loaded the software and selected the proper
line voltage and frequency settings for the
current location, a burn can be made.
NOTE: Make four warm-up burns before proceeding..
6. Prepare the sample excitation stand for a
routine analysis with a new disc and rod
electrode and set the analytical gap in accordance with the Spectroil M Operator’s
Manual. Pour a new sample of base (0 ppm)
standard and place this sample in position
for analysis. Close the sample stand door.
7. Set the MODE switch on the control panel
to OPERATE.
8. Remove the SFTM from the protective container. If this is the rst time this test meter
is to be used, four AA size batteries will have
to be installed before it can be operated.
ese batteries are provided with the test
meter.
9. Hold the SFTM in the right hand and with
your thumb, press and hold the momentary
switch located on the upper right side of the
SFTM, see Figure 4-5. is will turn the
test meter ON and along the right side of
the digital display a “0” (zero) should appear. If the image of the “0” is not clear, or
if many characters simultaneously appear on
the display, the CONTRAST control should
be adjusted.
NOTE: Under normal circumstances, the SFTM
does not require calibration. To verify calibration,
point the SFTM toward a uorescent light xture
July 2010/Version 1.2

Table 4-5, Auxiliary gap assembly and ideal
position for source frequency test
and press and hold the Momentary Power Switch
for at least 10 seconds. For power sources with 60
Hertz, the meter should read 7,200 +/- 100 and
for 50 Hertz power sources, 6,000 +/- 100.
10. Locate the auxiliary gap on the excitation
source component board, refer to Figure 4-4
for the location. Hold the SFTM approximately 10 inches (25 cm) above the auxiliary
gap with the input coupler pointing downwards towards the auxiliary gap as shown in
Figure 4-5.
Source Frequency Test Meter || 11
11. Press the START switch located on the
front control panel, refer to the Spectroil M
Operator’s Manual. e burn cycle will begin and the high voltage across the auxiliary
gap will appear as a concentrated stream of
light. In actuality, this steam of light consists
of approximately 700 high voltage discharges per second and the function of the SFTM
is to detect and quantify these arc discharges.
12. Press and hold the momentary power
switch on the SFTM after the preburn
period has completed (after approximately
6 seconds). If the SFTM is properly positioned to receive the light emitted across the
auxiliary gap, a small red light emitting diode (LED) located above the digital display
of the SFTM will begin to ash at a consistent rate. Hold the position of the SFTM
steady and continue to hold the momentary
power switch and monitor the consistency
of the red LED to ensure that the signal is
strong and consistent. Once the burn cycle
is complete (30 seconds), release the momentary power ON switch of the SFTM
and position it so it can be easily read.
Once the burn cycle begins, high voltage will be
generated and distributed throughout the excitation source. Do not touch any components of
the excitation source assembly while the excitation source is operating. Wait until the burn
cycle terminates before attempting to make any
adjustments. Always turn the MODE switch to
STANDBY before making any adjustments.
Warning: Wear safety glasses or do not look directly at the spark. e spark from the auxiliary
gap could harm your eyes if stared at for prolonged periods of time.
Caution: Only trained personnel should carry
out this procedure. It is performed in an area of
the Spectroil M where high voltage potentials are
present.
NOTE: It is normal to observe uctuations of
approximately +/- 1000 discharges per minute
(DPM) during the measurement cycle.
If the red LED does not appear or ashed at an
erratic rate, the SFTM is not in position to permit
the light from the auxiliary gap to enter the test
meter. Repeat the procedure until a steady ashing red light is obtained.
13. When the burn is complete, press and hold
the MEMORY switch located on front of
the SFTM one time. A number will appear
momentarily, then the letters “LA” (last)
will appear. is number should be approximately 54,000 and represents the last
measurement the SFTM made before the
power switch was released. T his reading is
not signi cant for this procedure. Release
July 2010/Version 1.2

12 || Operation & User Manual
the MEMORY switch to end the reading.
14. Press and hold the MEMORY switch a
second time and a new number will appear.
is is the number that will be used to determine the excitation source frequency. is
number must be 54,000 +/- 2000. If the
MEMORY switch is held, the letters “UP”
will appear, which designates that this was
the highest reading taken during the burn.
If it is within this range, the procedure is
complete; proceed with step 15. If not, the
solid-state ignition circuit or high voltage
capacitor may be defective, see Section 2.1.2
of the Spectroil M Maintenance Manual.
NOTE: If you press and hold the MEMORY
switch a third time, the number will be the lowest
measured value “DN” for the burn. is reading is
not signi cant for this procedure.
19. is procedure is now complete.
15. Place the MODE switch to the STANDBY
position. Shut down Windows and place the
circuit breaker CB1 to the down position to
remove power to the instrument. Remove
the main power input cable by disconnecting the MIL-type connector from the mating receptacle.
16. Press the interlock actuator inward to reset
the normal operation of the switch. is interlock should activate when the actuator is
pressed inward to its maximum travel. Place
the environmental sealing panel in position
and start the six 1/4 turn pawl fasteners.
Once all screws have been started, tighten all
screws until they are snug, compressing the
sealing gasket.
17. Install the exterior panel and secure it in
position with the four Phillips head screws
and dress washers.
18. Attach the main power input cable to the
instrument, and plug the cable into the
source of line voltage. Apply power to the
instrument in accordance with all steps
detailed in Section 2.1.3 of the Spectroil M
Overview and System Description Manual.
July 2010/Version 1.2

Source Frequency Test Meter || 13
Section 5
Detailed
Description
of Excitation
Source
Frequency
5.0 DETAILED DESCRIPTION OF
EXCITATION SOURCE FREQUENCY
he excitation source of the Spectroil M is an oscillating alternate current (AC) electric arc discharge
which has been optimized for oil matrices and
the JOAP data base. e excitation source is the
most important subassembly of the spectrometer
with regard to analytical performance (accuracy,
repeatability, and JOAP data correlation). e following paragraphs will describe the function of
the excitation source and explain factors which
a ect its performance.
e excitation source has two basic functions: 1)
to provide a high voltage potential to overcome
the resistance o ered by the air and oil between
the graphite rod and disc electrodes which make
up the analytical gap, and 2) to provide an analytical potential capable of instantaneously vaporizing the oil and any particles suspended in the
oil medium. is is accomplished with a solidstate excitation ignition circuit (SSEI) to charge
a high voltage capacitor C2 until its potential is
high enough to ionize the air between the graphite electrodes. is ionization will appear as a
high voltage arc across the analytical gap. Once
the high voltage has ionized the air across the analytical gap, the resistance between the gap is effectively zero ohms or a short circuit to ground.
is momentary (approximately 3 microsecond)
short circuit to ground is all that is necessary to
discharge the potential which is stored on the analytical capacitor C3. is potential will instantaneously vaporize the oil and any particles which
are suspended in the oil at that one moment in
time. is vaporization potential will raise the energy level of the valence electron(s) of the particles
and when this energy is released as it returns to
the ground state, it will create atomic emission
which is the basis of this technique.
is process occurs approximately 700 times per
second and is referred to as the excitation source
frequency. e main reasons for the relatively
high excitation source frequency are twofold:
July 2010/Version 1.2

14 || Operation & User Manual
1) to provide a good statistical sampling of the
particles spread across the disc electrode which
is approximately 1/4 inch by 1/4 inch and 2) to
raise the vaporization temperature su ciently to
vaporize the refractory elements such as Si, Al and
Ti. is excitation frequency is regulated or electronically controlled to ensure that the frequency
remains constant over the complete burn cycle or
from one oil type to the next. In order to allow the
measurement of this excitation source frequency
and still maintain optical alignment between the
analytical gap and the optical processing assembly,
a second gap called the auxiliary gap is designed
into the excitation source and this gap is in series
with the analytical gap.
is excitation source frequency has become the
standard for wear metal analysis, particularly in
the United States Department of Defense (DoD)
Joint Oil Analysis Program (JOAP). Over the last
two decades, an extensive database of wear trends
and maintenance guidelines have been established
based on this excitation source characteristic and
certain parameters, such as frequency. is database has been derived based on the results of
approximately 300 xed laboratory sites where
actual mechanical system failures have been detected and the trend data leading up to the detection of the impending failure have been analyzed
to determine guidelines for appropriate corrective
maintenance action. ese stationary laboratories
participate in a monthly data correlation program
operated by the Technical Support Center of the
Joint Oil Analysis Program in Pensacola, Florida.
Prior to each monthly correlation data sampling
or every 2000 burns, the laboratory normally has
to check the excitation source frequency by using an oscilloscope or SFTM. is procedure has
been referred to as checking the breaks per half
cycle.
e e ects of the physical and environmental
characteristics have virtually been eliminated
by the design of the solid-state excitation ignition circuit (SSEI). is is accomplished by incorporating an internally mounted ferromagnetic
regulating transformer T1 which can stabilize
the nominal (120 or 240 VAC) input line voltage having +/- 10% deviation to an output of
125 VAC within +/- 3%. However, since the high
voltage transformer is simply a step-up voltage device having an 80:1 ratio, it is understandable that
an unstable line voltage will cause the high voltage transformer output to vary. If this occurs, the
charge stored on the high voltage capacitor will
also vary thus resulting in an unstable excitation
source frequency. e frequency of the line voltage is the second physical parameter which must
be compensated for. Since the excitation source
frequency is modulated from the line frequency,
if the line frequency changes then the excitation
source frequency will automatically change. Of
course, if the components which make up the high
voltage ignition circuitry were to fatigue, this will
change or cause an unstable excitation source frequency. Last to be mentioned, but most probable
to occur in application is erosion of the two 3/16”
tungsten electrodes which together make the auxiliary gap. e auxiliary gap electrodes have approximately 27,000 arc discharges during each 30
second analysis which originate from the parabolic tips. is function is slowly removing tungsten
material from the tips of these electrodes, which
in e ect is enlarging the gap distance. As the gap
distance gets larger, the resistance of the air gap is
increasing and the net result is a decrease in the
excitation source frequency. is is the main reason that the standard operating procedure in the
U.S. DoD laboratories is to perform a 2000 burn
check of the excitation source frequency and reset
the source frequency accordingly.
e second parameter which can a ect the excitation source frequency is the environment in which
the instrument must operate. ese parameters
are altitude and relative humidity, and their a ect
are not easily remedied by design. In both cases,
altitude and relative humidity, the resistance to
current ow o ered by the air across the auxiliary
and analytical gaps can cause the excitation source
to holdo .
Holdo occurs when the auxiliary gap has di culty breaking down. is phenomenon is usu-
July 2010/Version 1.2

Source Frequency Test Meter || 15
ally identi able by a pause in the time between
the start of the burn and the countdown of the
burn counter. While it is di cult to identify the
actual cause of this phenomenon, it is believed to
be in uenced by environmental conditions. To
minimize this phenomenon, a set screw has been
added to the auxiliary gap, Figure 3-13, to assist
in breaking down its magnetic eld. Holdo does
not have an e ect on analytical results unless it exceeds 2 seconds. Please refer to the troubleshooting section of this manual if your instrument is
experiencing holdo that exceeds two 2 seconds.
When the instrument is factory calibrated at near
sea level, the excitation source is set using an oscilloscope or the Spectro Incorporated Source Frequency Test Meter to the prescribed frequency. If
the instrument is deployed to a higher altitude,
the resistances across the gaps are reduced. With
lowered resistance, the high voltage capacitor can
discharge across these gaps more easily and more
often within a xed time period. e result is an
increase in excitation source frequency.
When an instrument is exposed to high relative
humidity, nearly the same e ect occurs, however, for a di erent reason. e percentage of
moisture in the environment makes the density
of air higher and therefore o ers lower resistance
to current ow. is allows the high voltage to
conduct through the air more easily thus resulting in an increase in excitation source frequency.
is is somewhat controlled in the Spectroil M
with the incorporation of a heat exchanger which
stabilizes the internal environment of the instrument. However, there is no humidity control in
the sample excitation stand.
puter will adjust the calibration curves to make all
the standards from 0 to 100 ppm read correctly.
Now assume that we have an oil sample containing iron wear particles. ese particles range from
1 to 40 microns in size and are evenly distributed
throughout the sample. Instrument #1 will totally
vaporize all particles of iron from 0.1 to 5 microns
but when a 30 or 50 micron particle reaches the
analytical gap, only 10% will be vaporized because of the excitation source frequency and the
resident time in the analytical gap. e analytical
result for instrument #1 may be 100 ppm. Instrument #2 will also vaporize all particles from 0.1 to
5 microns, but will only vaporize 2% of the particles in the 30 to 40 micron range. e analytical
result for instrument #2 can be perhaps as low as
70 ppm. Both instruments standardize correctly,
and all standards read correctly, but they do not
correlate on used oil samples because of the di erences in the excitation source frequency.
It is absolutely necessary to check and/or adjust
the excitation source frequency prior to performing the JOAP monthly correlation samples. It is
also essential to check and/or adjust the excitation
source frequency each and every time the instrument is deployed to a country where the line frequency is other than 60 Hertz and/or the elevation or environment is di erent from the last time
the frequency was set.
Maintaining the correct excitation source frequency is the most in uential parameter to
achieving good JOAP data correlation. For sake
of discussion, let’s assume that the excitation
source frequency of instrument #1 is set exactly
correct in accordance with Section 2.2.1 or 2.2.2,
and instrument #2 is operating 20% lower than
speci cation. Both of these instruments will standardize without any problem because the com-
July 2010/Version 1.2

16 || Operation & User Manual
July 2010/Version 1.2

1 Executive Drive, Suite 101 • Chelmsford, MA 01824 USA
Email: service@spectroinc.com • Web: www.spectroinc.com
1.978.486.0123 • Fax 1.978.486.0030
 Loading...