

Page 1

COMPREHENSIVE INTERNET SECURITY
SonicWALL ViewPoint 2.0
User's Guide
TM
Page 2

Copyright Information
© 2003 SonicWALL, Inc. All rights reserved.
Under the copyright laws, this manual or the software described within, may not be copied, in whole or
part, without the written consent of the manufacturer, except in the normal use of the software to make a
backup copy. The same proprietary and copyright notices must be affixed to any permitted copies as were
affixed to the original. Under the law, copying includes translating into another language or format.
SonicWALL is a registered trademark of SonicWALL, Inc.
Other product and company names mentioned herein may be trademarks and/or registered trademarks of
their respective companies.
Specifications and descriptions subject to change without notice.
Part Number: 232-000369-00 Rev A
Page 3

Software License Agreement for SonicWALL ViewPoint
This Software License Agreement (SLA) is a legal agreement between you and SonicWALL, Inc.
(SonicWALL) for the SonicWALL software product identified above, which includes computer software
and any and all associated media, printed materials, and online or electronic documentation (SOFTWARE PRODUCT). By opening the sealed package(s), installing, or otherwise using the SOFTWARE
PRODUCT, you agree to be bound by the terms of this SLA. If you do not agree to the terms of this SLA,
do not open the sealed package(s), install or use the SOFTWARE PRODUCT. You may however return
the unopened SOFTWARE PRODUCT to your place of purchase for a full refund.
The SOFTWARE PRODUCT is licensed, not sold.
You acknowledge and agree that all right, title, and interest in and to the SOFTWARE PRODUCT,
including all associated intellectual property rights, are and shall remain with SonicWALL. This SLA
does not convey to you an interest in or to the SOFTWARE PRODUCT, but only a limited right of use
revocable in accordance with the terms of this SLA.
oThe SOFTWARE PRODUCT is licensed as a single product.
oYou may also store or install a copy of the SOFTWARE PRODUCT on a storage device, such as a network server, used only to install or run the SOFTWARE PRODUCT on your other computers over an
internal network.
oYou may not resell, or otherwise transfer for value, rent, lease, or lend the SOFTWARE PRODUCT.
oThe SOFTWARE PRODUCT is trade secret or confidential information of SonicWALL or its licensors.
You shall take appropriate action to protect the confidentiality of the SOFTWARE PRODUCT. You shall
not reverse-engineer, de-compile, or disassemble the SOFTWARE PRODUCT, in whole or in part. The
provisions of this section will survive the termination of this SLA.
oYou agree and certify that neither the SOFTWARE PRODUCT nor any other technical data received
from SonicWALL, nor the direct product thereof, will be exported outside the United States except as
permitted by the laws and regulations of the United States, which may require U.S. Government export
approval/licensing. Failure to strictly comply with this provision shall automatically invalidate this
License.
LICENSE
SonicWALL grants you a non-exclusive license to use the SOFTWARE PRODUCT for a number of
SonicWALL Internet Security Appliances. This number is specified and shipped with the SOFTWARE
PRODUCT. Support for additional SonicWALL Internet Security Appliances is subject to a separate
upgrade license.
OEM - If the SOFTWARE PRODUCT is modified and enhanced for a SonicWALL OEM partner, you
must adhere to the software license agreement of the SonicWALL OEM partner.
UPGRADES
If the SOFTWARE PRODUCT is labeled as an upgrade, you must be properly licensed to use a product
identified by SonicWALL as being eligible for the upgrade in order to use the SOFTWARE PRODUCT.
A SOFTWARE PRODUCT labeled as an upgrade replaces and/or supplements the product that formed
the basis for your eligibility for the upgrade. You may use the resulting upgraded product only in accordance with the terms of this SLA. If the SOFTWARE PRODUCT is an upgrade of a component of a
package of software programs that you licensed as a single product, the SOFTWARE PRODUCT may be
used and transferred only as part of that single product package and may not be separated for use on more
than one computer.
Page 4

DISTRIBUTION RIGHTS
To i-net SPRINTA(tm) 2000 DRIVER - SonicWALL has been given a non-exclusive, worldwide license
by i-net software GmbH to distribute directly and indirectly (through SonicWALL's distribution channels) the i-net SPRINTA(tm) 2000 driver to SonicWALL's end user customers to use the driver with SonicWALL ViewPoint. SonicWALL's end user customers may make a copy of the driver for backup or
archival purposes only. SonicWALL's end user customers are not allowed to make other copies, transfer,
re-distribute, use, translate, or reverse assemble/compile the driver with any other non-SonicWALL applications. i-net software GmbH holds copyright and title to the i-net SPRINTA(tm) 2000 Driver.
To Microsoft's SQL Server Developer's Edition (MSDE) - This software incorporates Microsoft's SQL
Server Developer's Edition (MSDE) and your use is subject to the terms and conditions of Microsoft's
MSDE End-User License Agreement (a copy of which is available on Microsoft's website: <http://
www.microsoft.com/sql/howtobuy/deveula.asp>).
To Quest Software's (formerly Sitraka) JClass ServerChart - This software incorporates Quest Software's
(formerly Sitraka) JClass ServerChart and your use is subject to the terms and conditions of Quest's Jclass
License Agreement (a copy of which is available on Quest's website: <http://java.quest.com/jclass/licensing.shtml>).
SUPPORT SERVICES
SonicWALL may provide you with support services related to the SOFTWARE PRODUCT (“Support
Services”). Use of Support Services is governed by the SonicWALL policies and programs described in
the user manual, in “online” documentation, and/or in other SonicWALL-provided materials. Any supplemental software code provided to you as part of the Support Services shall be considered part of the
SOFTWARE PRODUCT and subject to terms and conditions of this SLA. With respect to technical
information you provide to SonicWALL as part of the Support Services, SonicWALL may use such information for its business purposes, including for product support and development. SonicWALL shall not
utilize such technical information in a form that identifies its source.
OWNERSHIP
As between the parties, SonicWALL retains all title to, ownership of, and all proprietary rights with
respect to the SOFTWARE PRODUCT (including but not limited to any images, photographs, animations, video, audio, music, text, and 'applets” incorporated into the SOFTWARE PRODUCT), the accompanying printed materials, and any copies of the SOFTWARE PRODUCT. The SOFTWARE PRODUCT
is protected by copyrights laws and international treaty provisions. The SOFTWARE PRODUCT is
licensed, not sold. This SLA does not convey to you an interest in or to the SOFTWARE PRODUCT, but
only a limited right of use revocable in accordance with the terms of this SLA.
U.S. GOVERNMENT RESTRICTED RIGHTS
If you are acquiring the Software including accompanying documentation on behalf of the U.S. Government, the following provisions apply. If the Software is supplied to the Department of Defense (“DoD”),
the Software is subject to “Restricted Rights”, as that term is defined in the DOD Supplement to the Federal Acquisition Regulations (“DFAR”) in paragraph 252.227 7013(c) (1). If the Software is supplied to
any unit or agency of the United States Government other than DOD, the Government's rights in the Software will be as defined in paragraph 52.227 19(c) (2) of the Federal Acquisition Regulations (“FAR”).
Use, duplication, reproduction or disclosure by the Government is subject to such restrictions or successor provisions. Contractor/Manufacturer is: SonicWALL, Inc. 1160 Bordeaux Drive, Sunnyvale,
California 94089.
Page 5

MISCELLANEOUS
This SLA represents the entire agreement concerning the subject matter hereof between the parties and
supersedes all prior agreements and representations between them. It may be amended only in writing
executed by both parties. This SLA shall be governed by and construed under the laws of the State of
California as if entirely performed within the State and without regard for conflicts of laws. Should any
term of this SLA be declared void or unenforceable by any court of competent jurisdiction, such declaration shall have no effect on the remaining terms hereof. The failure of either party to enforce any rights
granted hereunder or to take action against the other party in the event of any breach hereunder shall not
be deemed a waiver by that party as to subsequent enforcement of rights or subsequent actions in the
event of future breaches.
TERMINATION
This SLA is effective upon your opening of the sealed package(s), installing or otherwise using the
SOFTWARE PRODUCT, and shall continue until terminated. Without prejudice to any other rights,
SonicWALL may terminate this SLA if you fail to comply with the terms and conditions of this SLA. In
such event, you agree to return or destroy the SOFTWARE PRODUCT (including all related documents
and components items as defined above) and any and all copies of same.
LIMITED WARRANTY
SonicWALL warrants that a) the software product will perform substantially in accordance with the
accompanying written materials for a period of ninety (90) days from the date of purchase, and b) any
support services provided by SonicWALL shall be substantially as described in applicable written materials provided to you by SonicWALL. Any implied warranties on the software product are limited to ninety
(90) days. Some states and jurisdictions do not allow limitations on duration of an implied warranty, so
the above limitation may not apply to you.
CUSTOMER REMEDIES
SonicWALL's and its suppliers' entire liability and your exclusive remedy shall be, at SonicWALL's
option, either a) return of the price paid, or b) repair or replacement of the SOFTWARE PRODUCT that
does not meet SonicWALL's Limited Warranty and which is returned to SonicWALL with a copy of your
receipt. This Limited Warranty is void if failure of the SOFTWARE PRODUCT has resulted from accident, abuse, or misapplication. Any replacement SOFTWARE PRODUCT shall be warranted for the
remainder of the original warranty period or thirty (30) days, whichever is longer. Outside of the United
States, neither these remedies nor any product Support Services offered by SonicWALL are available
without proof of purchase from an authorized SonicWALL international reseller or distributor.
NO OTHER WARRANTIES
To the maximum extent permitted by applicable law, SonicWALL and its suppliers/licensors disclaim all
other warranties and conditions, either express or implied, including, but not limited to, implied warranties of merchantability, fitness for a particular purpose, title, and non-infringement, with regard to the
SOFTWARE PRODUCT, and the provision of or failure to provide support services. This limited warranty gives you specific legal rights. You may have others, which vary from state/jurisdiction to state/
jurisdiction.
LIMITATION OF LIABILITY
Except for the warranties provided hereunder, to the maximum extent permitted by applicable law, in no
event shall SonicWALL or its suppliers/licensors be liable for any special, incidental, indirect, or consequential damages for lost business profits, business interruption, loss of business information,) arising out
of the use of or inability to use the SOFTWARE PRODUCT or the provision of or failure to provide support services, even if SonicWALL has been advised of the possibility of such damages. In any case,
Page 6

SonicWALL's entire liability under any provision of this SLA shall be limited to the amount actually paid
by you for the SOFTWARE PRODUCT; provided, however, if you have entered into a SonicWALL support services agreement, SonicWALL's entire liability regarding support services shall be governed by the
terms of that agreement. Because some states and jurisdiction do not allow the exclusion or limitation of
liability, the above limitation may not apply to you.
Manufacturer is SonicWALL, Inc. with headquarters located at 1143 Borregas Avenue, Sunnyvale, CA
94089, USA.
Page 7

CONTENTS
Chapter 1 Introducing SonicWALL ViewPoint 11
Chapter 2 Installing SonicWALL ViewPoint 13
Installation Overview 14
Installation 14
Logging in and out of SonicWALL ViewPoint 18
Registering SonicWALL ViewPoint 19
Creating a mysonicwall.com Account 19
Registering the SonicWALL Appliance 19
Activating the ViewPoint Software 20
Enabling the ViewPoint License 21
Chapter 3 Configuring ViewPoint 23
Configuring a SonicWALL Appliance for ViewPoint 23
Configuring Access to a SonicWALL Appliance 25
Adding a SonicWALL Appliance to SonicWALL ViewPoint 29
Viewing and Updating SonicWALL Information 31
Deleting a SonicWALL Appliance from SonicWALL ViewPoint 32
Modifying Settings for a SonicWALL Appliance 33
Changing ViewPoint Login Password 34
Configuring ViewPoint Settings 35
Managing ViewPoint Logs 36
Managing ViewPoint Sessions 37
Summarizer Settings 38
General Report Settings 39
Configuring Log Viewer Settings 40
Adding a Service 41
Chapter 4 Viewing Reports 43
Viewing Bandwidth Reports 43
Viewing the Bandwidth Summary Report 44
Monitoring Bandwidth Usage in Real Time 46
Viewing the Top Users of Bandwidth 48
7
Page 8

Viewing Bandwidth Usage Over Time 49
Viewing the Top Users of Bandwidth Over Time 51
Viewing Service Usage Reports 53
Monitoring Service Usage in Real Time 54
Viewing the Services Summary Report 55
Viewing Web Usage Reports 56
Viewing the Web Usage Summary Report 57
Viewing the Top Sites 58
Viewing the Top Users of HTTP Bandwidth 60
Viewing HTTP Bandwidth Usage by User 62
Viewing Bandwidth Usage Over Time 63
Viewing Top Sites Over Time 65
Viewing Top Users Over Time 67
Viewing Bandwidth Usage By User Over Time 69
Viewing Web Filter Reports 71
Viewing the Web Filter Summary Report 72
Viewing the Web Filter Top Sites Report 73
Viewing the Top Users that Try to Access Blocked Sites 75
Viewing the Top Blocked Sites for Each User 77
Viewing Blocked Site Attempts Over Time 79
Viewing the Top Blocked Site Attempts Over Time 81
Viewing the Top Blocked Site Users Over Time 83
Viewing the Top Blocked Sites for Each User Over Time 85
Viewing File Transfer Protocol Reports 87
Viewing the FTP Summary Report 88
Viewing the Top Users of FTP Bandwidth 89
Viewing FTP Bandwidth Usage Over Time 91
Viewing the Top Users of FTP Bandwidth Over Time 93
Viewing Mail Usage Reports 95
Viewing the Mail Usage Summary Report 96
Viewing the Top Users of Mail Bandwidth 97
Viewing Mail Usage Over Time 99
Viewing the Top Users of Mail Bandwidth Over Time 101
Viewing VPN Usage Reports 103
Viewing the VPN Usage Summary Report 104
Viewing the Top VPN Users 105
Viewing VPN Usage Over Time 107
Viewing the Top VPN Users Over Time 109
Viewing Attack Reports 111
Viewing the Attack Summary Report 112
8 SonicWALL ViewPoint User Guide
Page 9

Viewing the Attacks by Category 113
Viewing the Attacks by Source 115
Viewing the Errors and Exceptions Report 117
Viewing Attack Reports Over Time 119
Viewing Errors Over Time 121
Categories Over Time 123
Sources Over Time 125
Viewing Authentication Reports 127
Viewing the User Login Report 127
Viewing the Administrator Login Report 129
Viewing the Failed Login Report 130
Viewing the Log 132
Tec hn ic al Tip s 135
Modifying the Serial Number of an Appliance 135
ViewPoint Database Port Number 136
Changing the ViewPoint Web Server Port Number 136
Changing the ViewPoint Server IP Address 137
Changing the Default Syslog Server Port Number 137
The SonicWALL ViewPoint Log Files 137
Encrypting the sgmsConfig.xml File 138
Encrypted Data in the sgmsConfig.xml File 138
Resetting the Admin Password 138
Copying into the SonicWALL ViewPoint User Interface 138
Securing Access to the ViewPoint Web Server 139
Troubleshooting 141
Installation Failure 141
9
Page 10

10 SonicWALL ViewPoint User Guide
Page 11

Introducing SonicWALL ViewPoint
Monitoring critical network events and activity, such as security threats, inappropriate Web use, and
bandwidth levels, is an essential component of network security. SonicWALL ViewPoint complements SonicWALL’s Internet security offerings by providing detailed and comprehensive reports of
network and firewall activities.
SonicWALL ViewPoint is a browser-based software application that creates dynamic web-based
network reports. With SonicWALL ViewPoint, you can monitor network access, enhance security,
and anticipate future bandwidth needs.
SonicWALL ViewPoint generates both real-time and historical reports to offer a complete view of
all activity through one or more SonicWALL Internet Security appliances. It generates the reports
based on the stream of syslog data received from each SonicWALL appliance and summarizes this
data, allowing you to view the reports for current date, a previous day, or for a range of days.
SonicWALL ViewPoint:
• Displays bandwidth use by IP address and service.
• Identifies inappropriate Internet use.
• Provides detailed reports of attacks.
• Collects and aggregates system and network errors.
• Shows Virtual Private Network (VPN) events and problems.
• Presents visitor traffic to your website.
• Provides detailed daily firewall logs to analyze specific events.
CHAPTER 1
SonicWALL ViewPoint offers the following features:
• Web-based browser reporting application—SonicWALL ViewPoint can be accessed from a
local or remote system using a web browser.
• On-demand reporting—SonicWALL ViewPoint provides immediate reporting function for
users requiring quick results.
• Comprehensive set of graphical reports—SonicWALL ViewPoint offers a comprehensive set
of graphical reports including firewall attacks, bandwidth usage, Web site visits, user activity,
and others. These reports can be generated for a single firewall or as aggregate reports for multiple firewalls.
Introducing SonicWALL ViewPoint 11
Page 12

• Single firewall real-time and historical reports—SonicWALL ViewPoint offers numerous reports
for one SonicWALL appliance.
• Aggregate real-time and historical reports—SonicWALL ViewPoint offers aggregate reports for
multiple SonicWALL appliances.
• Summarized Data—SonicWALL ViewPoint summarizes its data, allowing the user to view reports
for the current date, a previous day, or a range of days.
• Support for multiple firewalls—SonicWALL ViewPoint can generate reports for one or more Son-
icWALL appliances.
• Log Viewer—Enables you to search the database for a specific firewall activity or event. It can also
be used to search the database for activity types, narrowing the set of matches by specifying a destination or source IP address over a specified range of dates.
• Top Usage Reports—SonicWALL ViewPoint includes a large range of reports that display the top
sites, top users, and top sites per user including 5, 10, 20, 50, and 100.
• Concurrent login sessions—Multiple users can log into SonicWALL ViewPoint concurrently.
• Syslog reporting—SonicWALL ViewPoint generates reports based on the stream of syslog data
received from each SonicWALL appliance.
• Embedded MSDE database—SonicWALL ViewPoint installs MSDE database to store raw and
summarized syslog data from each SonicWALL appliance.
• Platform support—SonicWALL ViewPoint supports Windows 2000 Professional, Windows 2000
Server and Windows XP Professional. SonicWALL ViewPoint software must be installed on a Windows server that can be located on the same network of the SonicWALL appliance's LAN interface or
on the WAN side.
• Supports SonicWALL Internet Security Appliances—SonicWALL ViewPoint supports 2nd and
3rd generation SonicWALL appliances, including the new SonicWALL Wireless product.
• SonicWALL firmware—SonicWALL ViewPoint supports SonicWALL appliances running firm-
ware 6.3.1.4 and above and SonicWALL Wireless product running SonicOS 1.0 and above.
12 SonicWALL ViewPoint User Guide
Page 13

Installing SonicWALL ViewPoint
This chapter describes how to install SonicWALL ViewPoint.
To install SonicWALL ViewPoint, complete the following procedures:
• Review the installation requirements. See “Installation Overview” on page 14.
• Install SonicWALL ViewPoint, see “Installation” on page 14.
• Register SonicWALL ViewPoint, see “Installation” on page 14.
CHAPTER 2
Installing SonicWALL ViewPoint 13
Page 14
Installation Overview
In order to install and run SonicWALL ViewPoint, you must be logged in as the administrator and the
SonicWALL ViewPoint server must meet the following requirements:
• Windows 2000 or Windows XP Professional.
• If accessed from the WAN interface, the SonicWALL appliance must have a static IP address. Other-
wise, it may have either a static or dynamic IP address.
• Local and remote browser access: Microsoft Internet Explorer 5.5 or later.
• Support for Java Plug-in JRE 1.3.1
• Pentium III or IV with a 1.4 GHz or faster processor.
• Minimum 512 MB RAM.
• At least 20 GB of free disk space.
• Hostname that is 20 characters or less.
• The SonicWALL ViewPoint system must be connected to the network.
• SonicWALL ViewPoint cannot be installed in a folder that has an embedded blank space. For exam-
ple, “Program Files.”
Installation
When you are ready to install SonicWALL ViewPoint, follow these steps:
1. Log on to the computer as administrator.
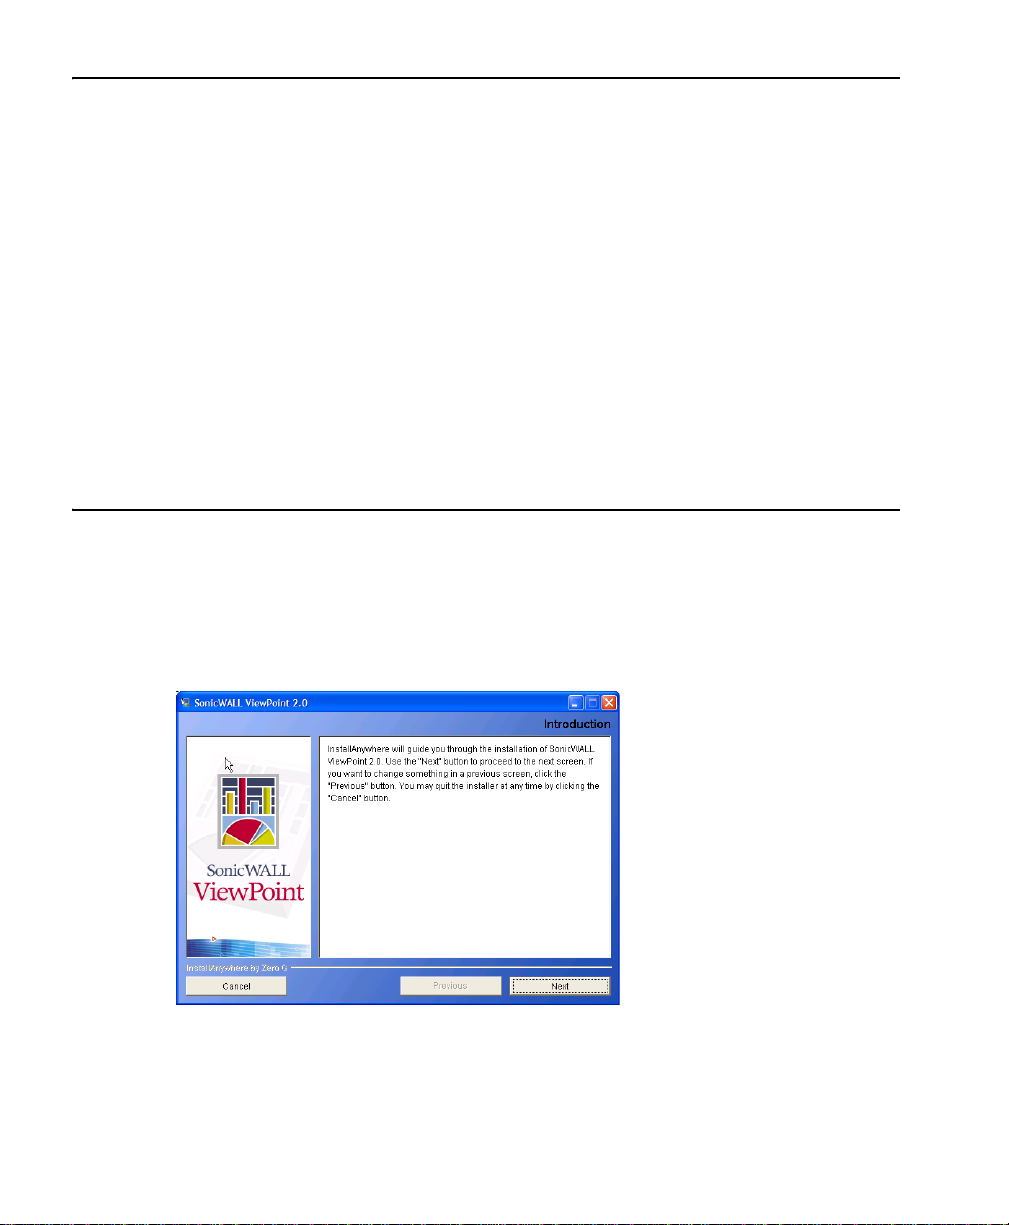
2. Locate the SonicWALL ViewPoint install file on the network. Double-click the VPS.exe. The Introduction screen appears.
14 SonicWALL ViewPoint User Guide
Page 15
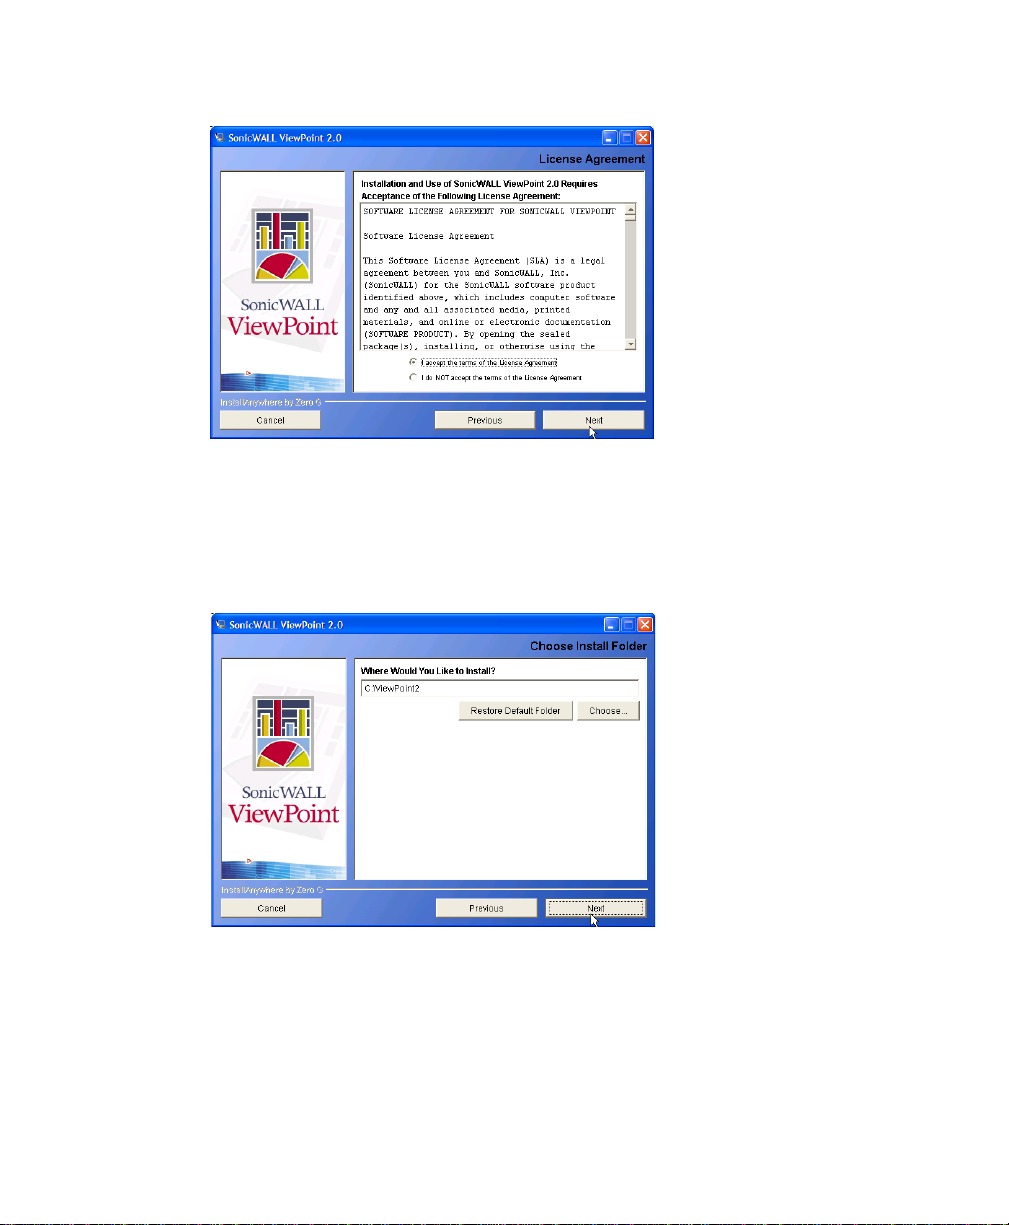
3. Click Next. The License Agreement screen appears.
4. Select from the following:
• To accept the terms of the license agreement, select I accept the terms of the License Agree-
ment and click Next. The Choose Install Folder screen appears.
• To not accept the terms, select I do NOT accept the terms of the License Agreement and click
Next. The SonicWALL ViewPoint installation program closes and the product does not install.
5. To accept the default location, click Next. To select a different location, click Choose and select a
folder. Click Next.
Installing SonicWALL ViewPoint 15
Page 16
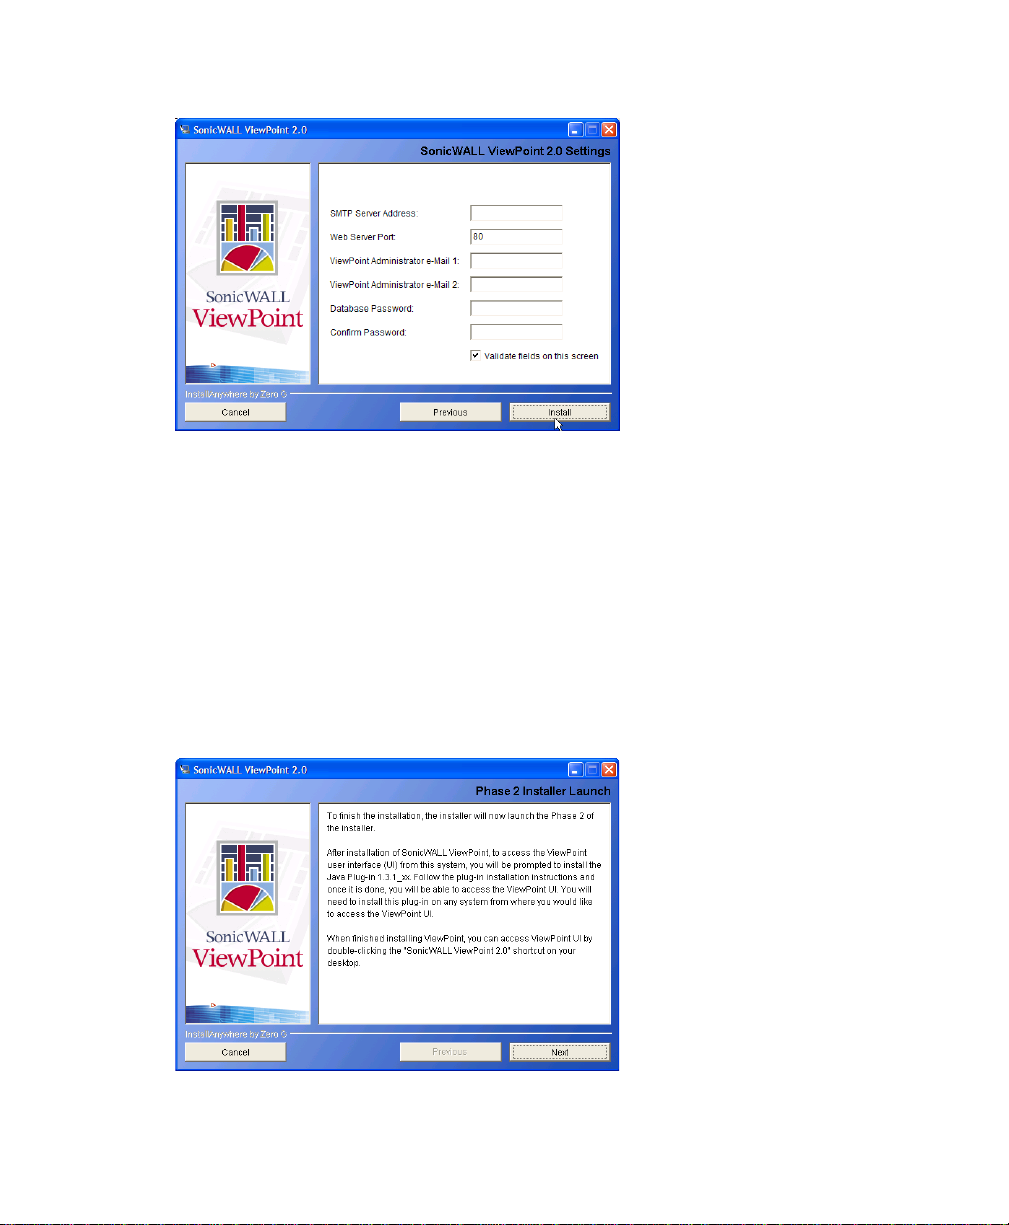
The Settings screen appears.
Do the following:
• Enter the IP address or host name of the Simple Mail Transfer Protocol (SMTP) server in the
SMTP Server Address field.
• Enter the number of the web server port in the Web Server Port field (default: 80).
• Enter the e-mail addresses of administrators who will receive e-mail notifications from Son-
icWALL ViewPoint.
• Enter and confirm the database password in the Database Password and Confirm Password
fields.
• To validate the entries on this page, select the Validate fields on this screen check box.
Click Install. The installation program begins copying SonicWALL ViewPoint files and installing the
MSDE database.
16 SonicWALL ViewPoint User Guide
Page 17
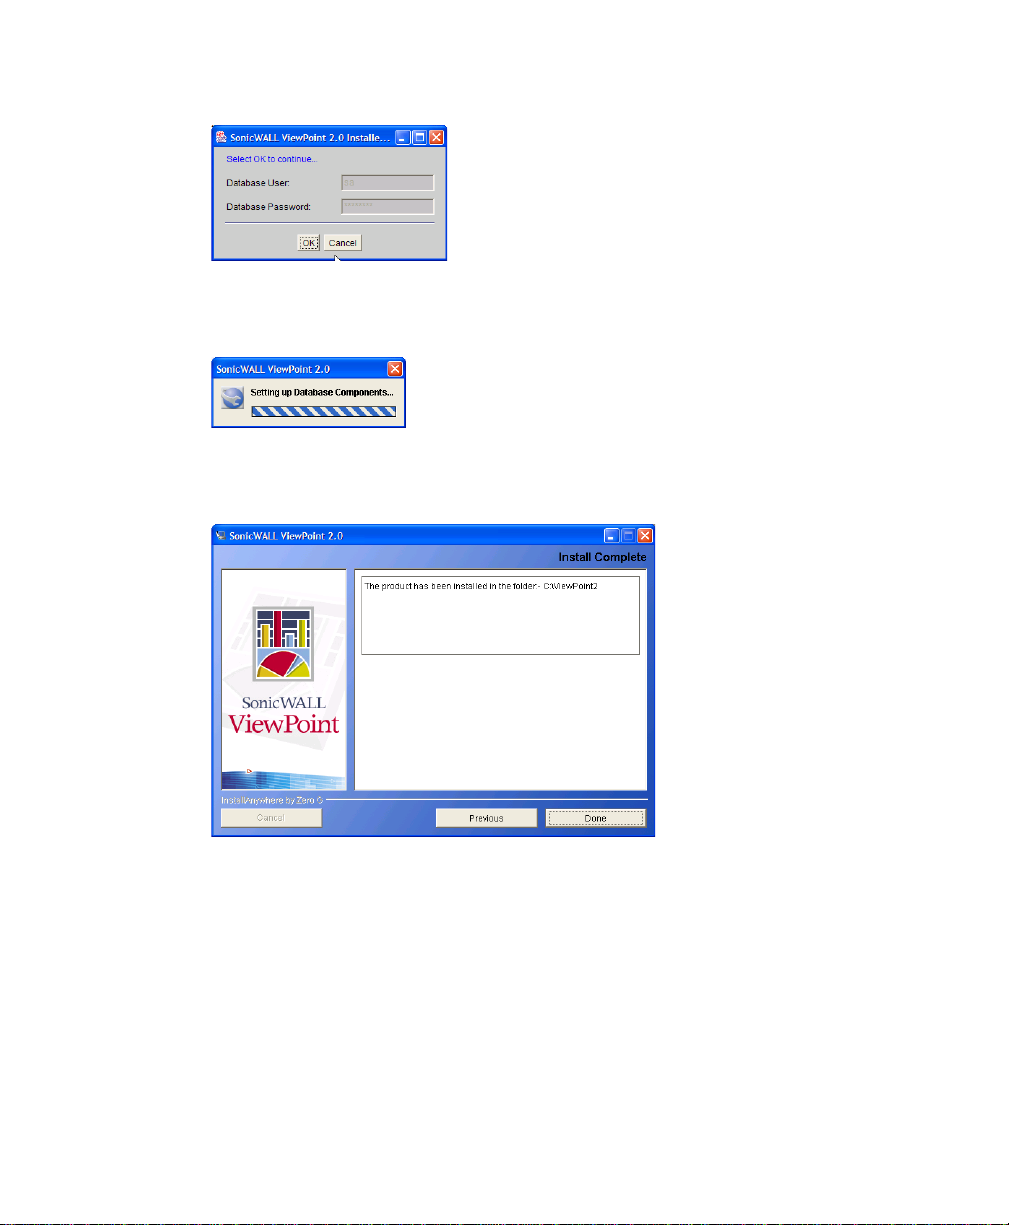
6. Click Next. Phase 2 of the installation begins.
7. Click OK.
Note: The database name “sa” cannot be changed.
The installation program begins installing the database components. When it is finished, the Install
Complete screen appears.
8. Click Done. Installation is complete.
9. Restart the server.
10.Ensure the following SonicWALL ViewPoint services are running on your system:
• SNWL ViewPoint Summarizer
• SNWL ViewPoint Syslogd
• SNWL ViewPoint WebServer
• MSSQL$SNWL (MSDE database)
Installing SonicWALL ViewPoint 17
Page 18
Logging in and out of SonicWALL ViewPoint
To start and log into SonicWALL ViewPoint, follow these steps:
1. Do one of the following:
• If you are logging in locally, double-click the SonicWALL ViewPoint icon on your desktop.
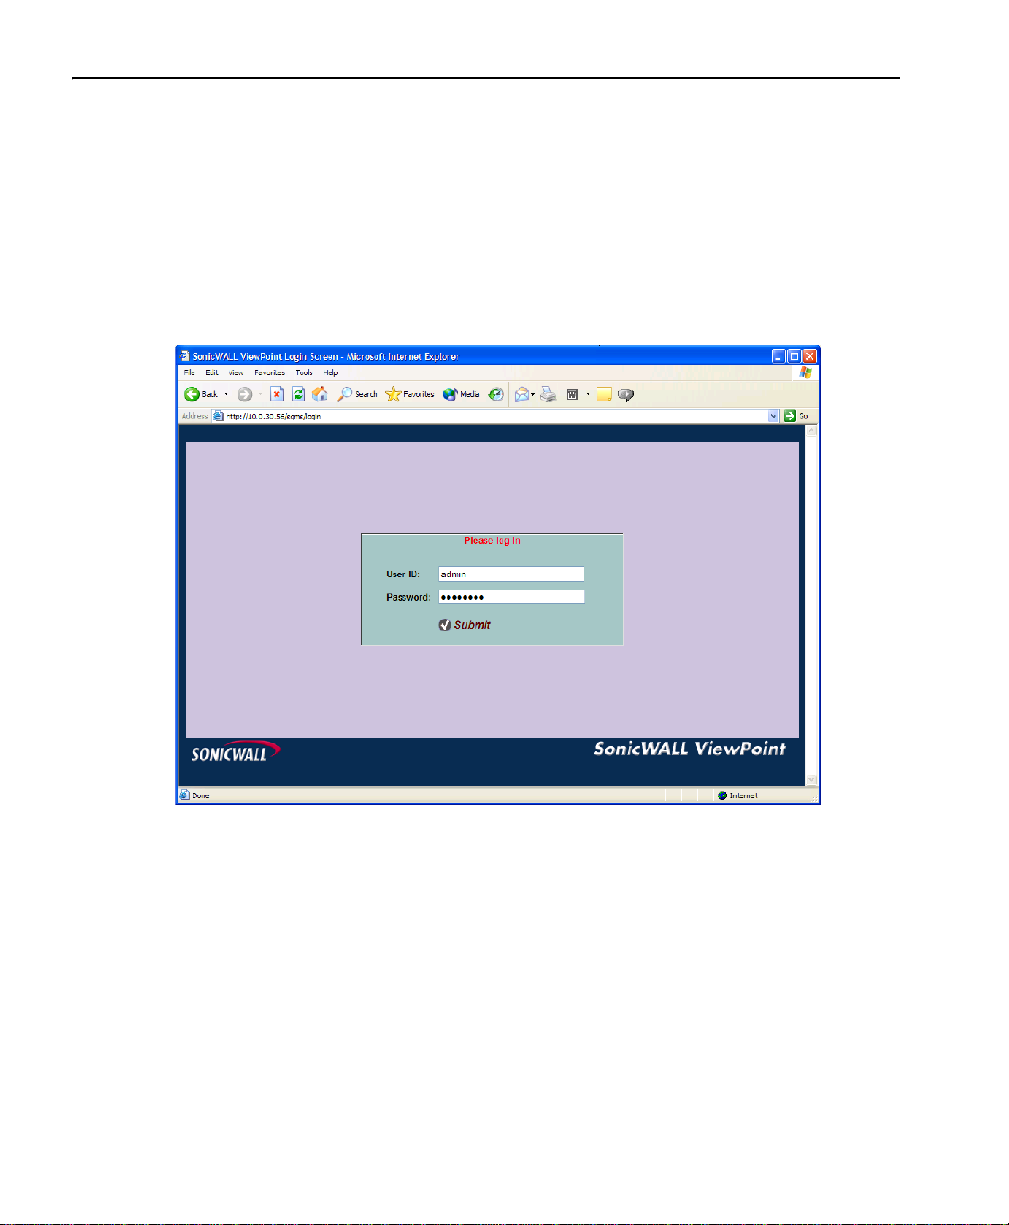
• If you are logging in from a remote location, open a web browser and enter http://
viewpoint_ipaddress/sgms/login or http://viewpoint_ipaddress.
where viewpoint_ipaddress is the IP address or hostname of the server.
The SonicWALL ViewPoint login page appears.
2. Enter the SonicWALL ViewPoint user ID (default: admin) and password (default: password).
Note: After the password is entered, an authenticated management session is established that times out
after 5 minutes of inactivity.
For the security purposes, it is highly recommended to change the default password for the user admin.
The maximum size of the SonicWALL ViewPoint User ID is 24 alphanumeric characters. If the password
is more than 32 characters long, it is automatically be truncated. Do not use special characters (e.g., # +
, % &). Embedded spaces in the password are also not allowed.
3. Click Submit. SonicWALL ViewPoint opens.
4. If you are prompted to install the Java Plug-in 1.3 application from Sun, click Ye s and follow the onscreen instructions to install the Java Plug-in application.
5. To logout, click Logout in the SonicWALL ViewPoint user interface (UI).
18 SonicWALL ViewPoint User Guide
Page 19

Registering SonicWALL ViewPoint
To register SonicWALL ViewPoint, follow these steps:
• Create a mysonicwall.com account—see “Creating a mysonicwall.com Account” on page 19.
• Register the SonicWALL appliance—see “Registering the SonicWALL Appliance” on page 19.
• Activate the ViewPoint Software—see “Activating the ViewPoint Software” on page 20.
• Enable the ViewPoint license on the SonicWALL appliance—see “Enabling the ViewPoint License”
on page 21.
Creating a mysonicwall.com Account
If you do not already have a mysonicwall.com account, open a web browser and navigate to the following
website:
http://www.mysonicwall.com
Then, follow the on-screen prompts to create a user account.
Registering the SonicWALL Appliance
To register the SonicWALL appliance, follow these steps:
1. Log on to your mysonicwall.com account.
Installing SonicWALL ViewPoint 19
Page 20
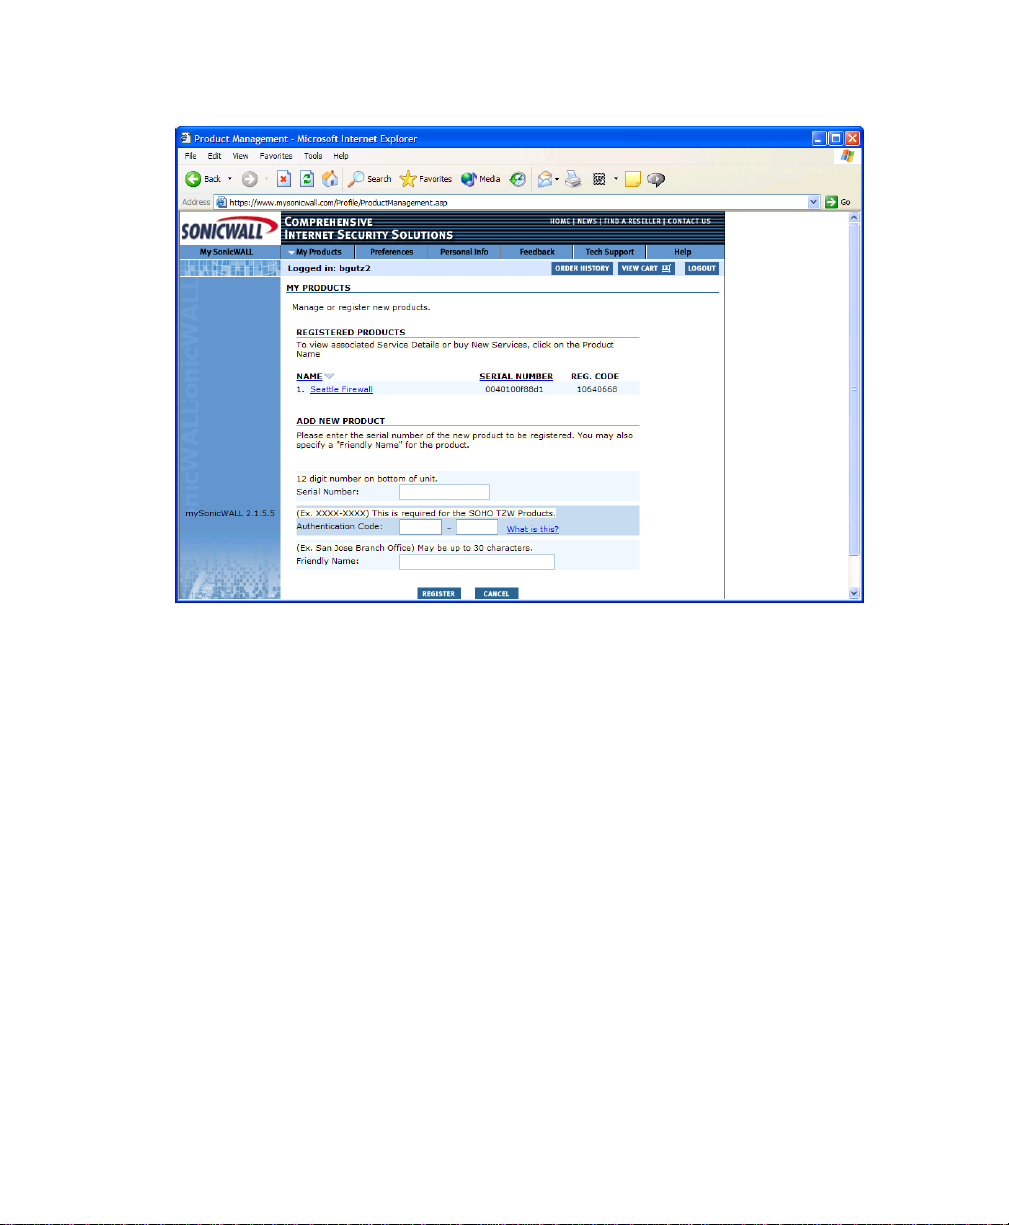
2. Click My Products. The SonicWALL Product Registration page appears.
3. Enter your SonicWALL serial number in the Serial Number field.
4. If you are registering a SonicWALL SOHO TZW, enter the authentication code in the Authentica-
tion Code field.
5. Enter a descriptive name for the SonicWALL appliance in the Friendly Name field.
6. Click Register. The mysonicwall.com website registers the SonicWALL appliance.
Activating the ViewPoint Software
To activate the SonicWALL ViewPoint software, follow these steps:
1. Log on to your mysonicwall.com account.
20 SonicWALL ViewPoint User Guide
Page 21
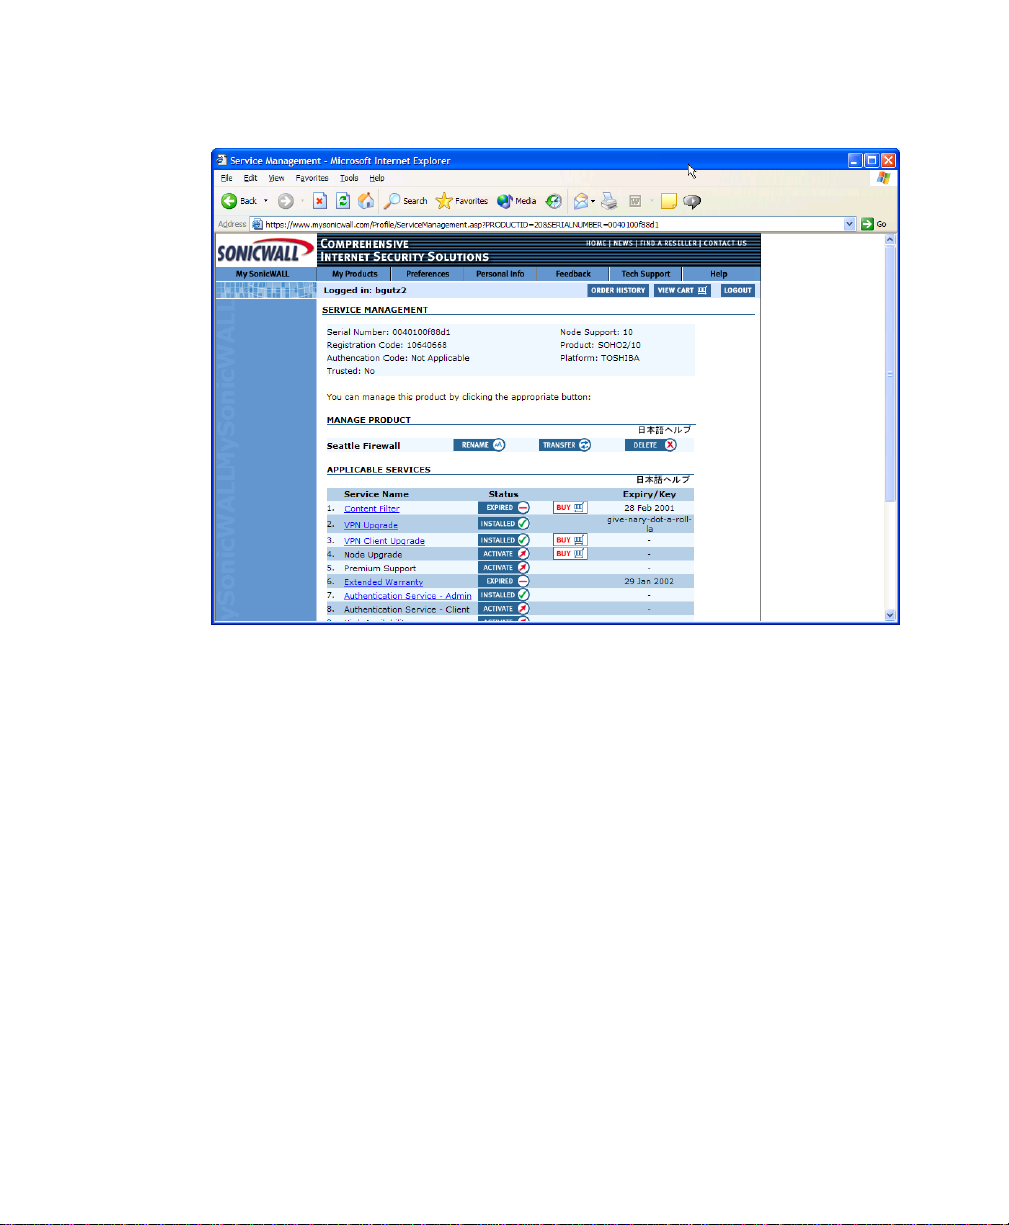
2. Click the label of the newly registered SonicWALL appliance. The Service Management page
appears.
3. Locate the ViewPoint service and click its Activate button. The Activate Service dialog box appears.
4. Enter the ViewPoint Activation Key in the Activation Key field. The ViewPoint Activation Key is
printed on the ViewPoint Software License Certificate shipped with the SonicWALL ViewPoint
package.
5. Click Submit. After the Activation Key is registered, a ViewPoint License Key appears.
Note: SonicWALL ViewPoint shows up as an active licensed product under the SonicWALL appliance in
your Mysonicwall.com account; it does not appear alongside the list of your SonicWALL appliances in
the account.
Enabling the ViewPoint License
To enable the SonicWALL ViewPoint license, follow these steps:
1. Log into the SonicWALL appliance.
2. Expand the Log tree and click ViewPoint. The ViewPoint page appears.
3. Enter the ViewPoint License Key provided by mysonicwall.com in the Enter upgrade key field.
4. Click Upgrade.
5. Restart the SonicWALL for the change to take effect.
Installing SonicWALL ViewPoint 21
Page 22

If the SonicWALL appliance is running SonicOS, follow these steps:
1. Log on to the SonicWALL appliance.
2. Click Log, and then ViewPoint.
3. Enter the ViewPoint License Key collected from MySonicwall.com into the Enter upgrade key
field.
4. Click Apply.
5. Restart the SonicWALL for the change to take effect.
22 SonicWALL ViewPoint User Guide
Page 23

Configuring ViewPoint
This chapter describes configure SonicWALL ViewPoint. Select from the following:
• To configure a SonicWALL appliance for SonicWALL ViewPoint, see “Configuring a SonicWALL Appliance for ViewPoint” on page 23.
• To configure access settings, see “Configuring Access to a SonicWALL Appliance” on page 25.
• To add a SonicWALL appliance to SonicWALL ViewPoint, see “Adding a SonicWALL Appli-
ance to SonicWALL ViewPoint” on page 29.
• To delete a SonicWALL appliance from SonicWALL ViewPoint, see “Deleting a SonicWALL
Appliance from SonicWALL ViewPoint” on page 32.
• To modify a SonicWALL appliance’s settings, see “Modifying Settings for a SonicWALL Appliance” on page 33.
• To change the SonicWALL ViewPoint password, see “Changing ViewPoint Login Password” on
page 34.
• To configure ViewPoint settings, see “Configuring ViewPoint Settings” on page 35.
• To manage ViewPoint sessions, see “Managing ViewPoint Sessions” on page 37.
• To configure reporting settings, see “Summarizer Settings” on page 38.
CHAPTER 3
Configuring a SonicWALL Appliance for ViewPoint
The following instructions describe how to configure a SonicWALL appliance to send data to SonicWALL ViewPoint.
1. Log into the SonicWALL appliance.
Configuring ViewPoint 23
Page 24
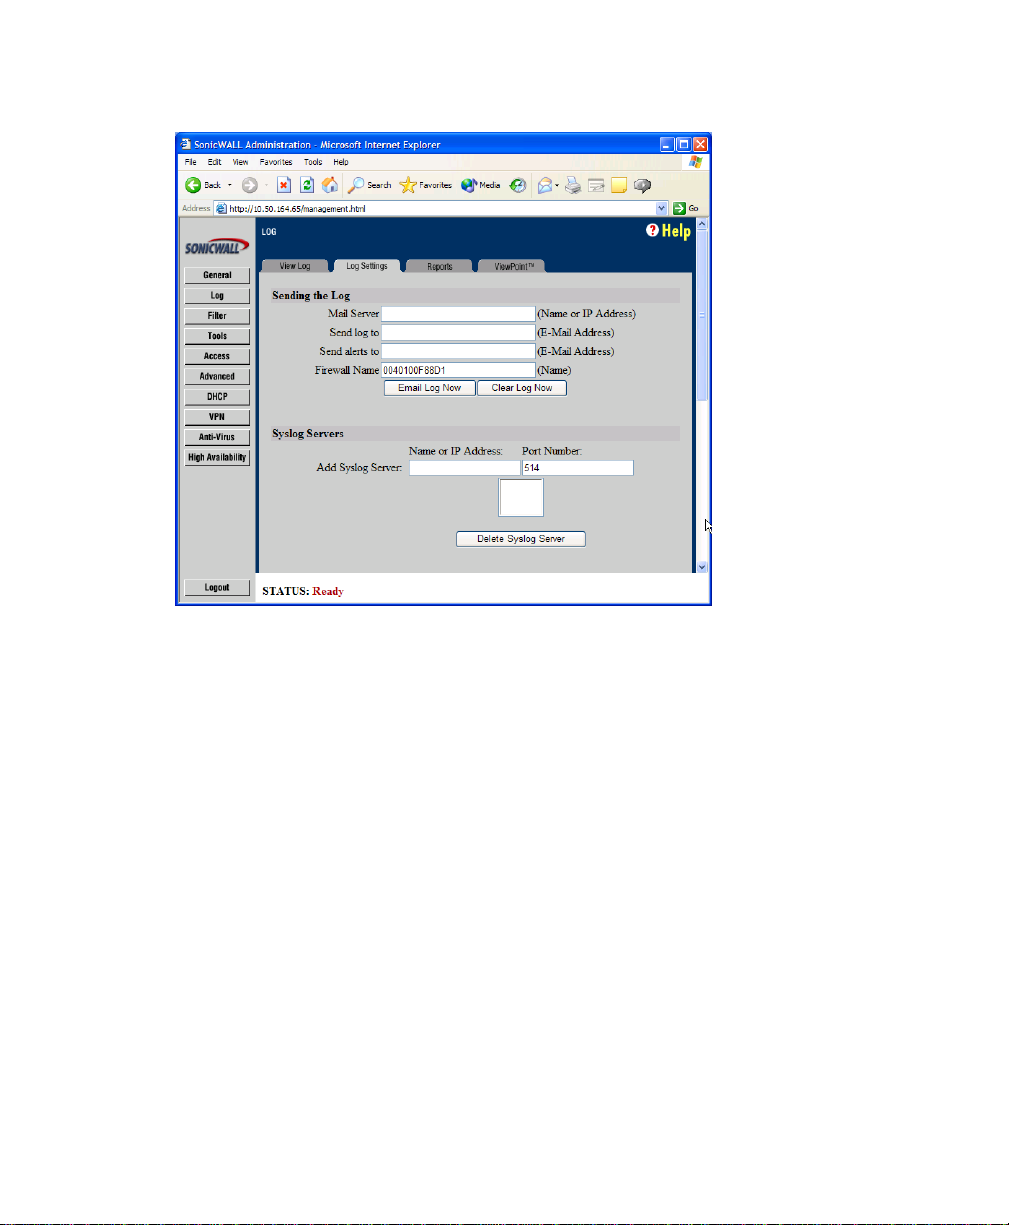
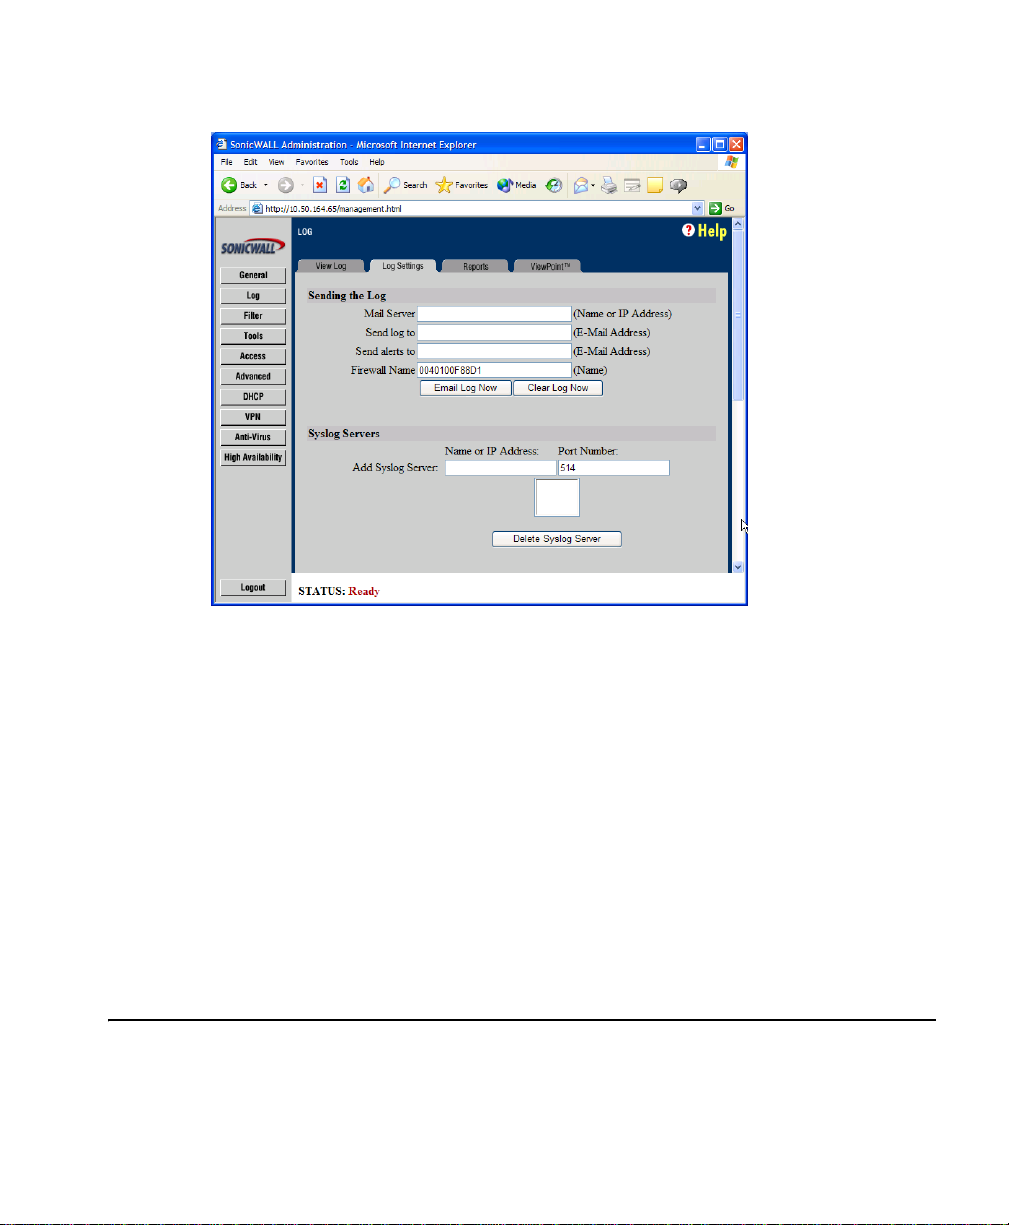
2. Expand the Log tree and click Log Settings. The Log Settings page appears.
3. Enter the IP address or hostname and port (default: 514) of the SonicWALL ViewPoint server in the
Add Syslog Server fields.
Note: For firmware 6.3.1.4, the fields are Syslog Server 1 and Syslog Server Port 1.
4. Enter 0 in the Syslog Individual Event Rate field.
The Syslog Individual Event Rate field reduces the number of repetitive events that are logged by
SonicWALL ViewPoint. Although this prevents a log file from being full of repetitive events, setting
the Syslog Individual Event Rate field to anything other than 0 results in inaccurate ViewPoint
reports.
5. Select Default from the Syslog Format list box.
6. To ensure accurate and complete reporting, make sure that every event category in the Categories
area is selected except for Network Debug.
7. When you are finished, click Update.
Note: SonicWALL ViewPoint expects the syslog data in UTC format. Make sure the Display UTC in logs
check box on the General/Time screen for the SonicWALL appliance is selected.
If the SonicWALL appliance is running SonicOS, follow these steps:
1. Log into the SonicWALL appliance.
24 SonicWALL ViewPoint User Guide
Page 25
2. Click Log and then click Automation. The Automation page appears.
3. Enter 0 in the Syslog Individual Event Rate field.
The Syslog Individual Event Rate field reduces the number of repetitive events that are logged by
SonicWALL ViewPoint. Although this prevents a log file from being full of repetitive events, setting
the Syslog Individual Event Rate field to anything other than 0 results in inaccurate ViewPoint
reports.
4. Select Default from the Syslog Format list box.
5. Click Add in the Server Name section and enter the IP address or hostname and port (default: 514)
of the SonicWALL ViewPoint server in the Add Syslog Server fields. Then, click Apply.
6. To ensure accurate and complete reporting, click Categories and make sure that every event category
in the Log Categories area is selected except for Network Debug.
7. When you are finished, click Apply.
Note: SonicWALL ViewPoint expects the syslog data to come in UTC format from a SonicWALL
appliance. Therefore, it is important that the Display UTC in logs check box on the General/Time
screen in the SonicWALL appliance is selected.
Configuring Access to a SonicWALL Appliance
For reporting, your SonicWALL appliance must be added to the SonicWALL ViewPoint UI. To function
properly, SonicWALL ViewPoint must be able to access, log into, and authenticate the ViewPoint license
Configuring ViewPoint 25
Page 26
on the SonicWALL appliance. To accomplish this, SonicWALL ViewPoint can access the SonicWALL
appliance from the LAN, WLAN, WAN, or over a VPN tunnel using HTTPS or HTTP.
• LAN interface—If the SonicWALL ViewPoint server is located on the same network as the Son-
icWALL appliance's LAN interface, SonicWALL ViewPoint can log into the SonicWALL appliance
using HTTP or HTTPS. By default, both HTTP and HTTPS are enabled in your SonicWALL appliance. In this configuration, syslog traffic is sent to SonicWALL ViewPoint unencrypted and in the
clear.
• VPN tunnel—If the SonicWALL ViewPoint server is located behind a VPN/firewall device, and if
there is a VPN tunnel between your SonicWALL appliance and the firewall, SonicWALL ViewPoint
can access your SonicWALL appliance using HTTPS or HTTP over the VPN tunnel. In this configuration, syslog traffic is sent to SonicWALL ViewPoint encrypted.
• WAN interface—If the SonicWALL ViewPoint server is located on the WAN side of your Son-
icWALL appliance, the SonicWALL appliance can be configured to allow SonicWALL ViewPoint to
access it using HTTPS. In this configuration, syslog traffic is sent to the SonicWALL ViewPoint
server in the clear.
Note: If you use the WAN interface HTTPS option, the WAN IP address must be static. If the WAN IP
address is dynamic, use the VPN tunnel option instead.
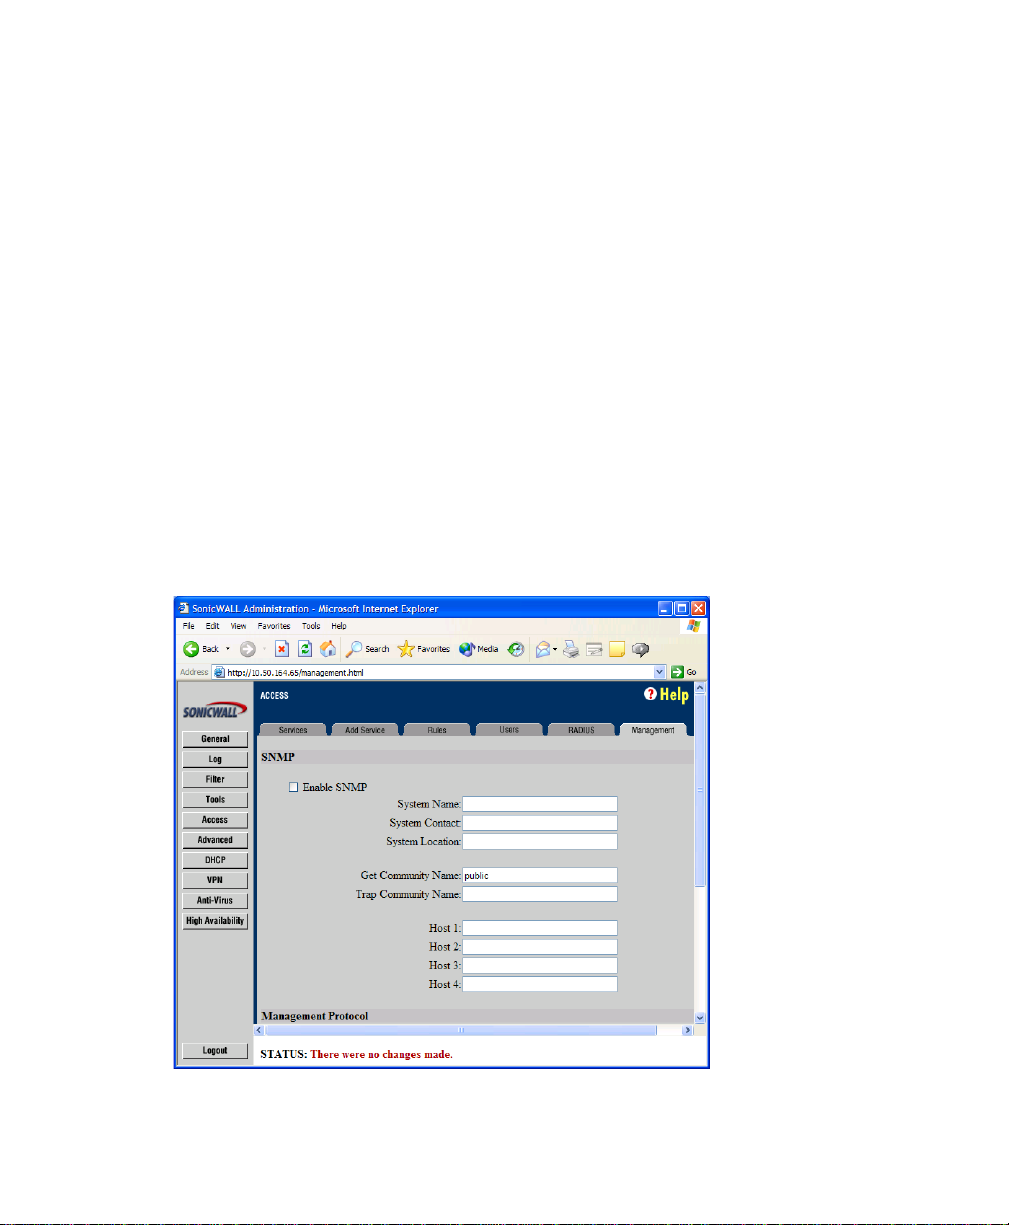
To enable WAN access using HTTPS, follow these steps:
1. Log into the SonicWALL appliance.
2. Expand the Access tree, and click Management. The Management page appears.
26 SonicWALL ViewPoint User Guide
Page 27

3. From the Management Method section, select from the LAN interface and remotely from the WAN
interface from the Managed menu.
4. Click Update.
5. Click the Add Service tab. The Add Service page appears.
6. Select HTTPS Management from the Add a Known service list and click Add.
Configuring ViewPoint 27
Page 28
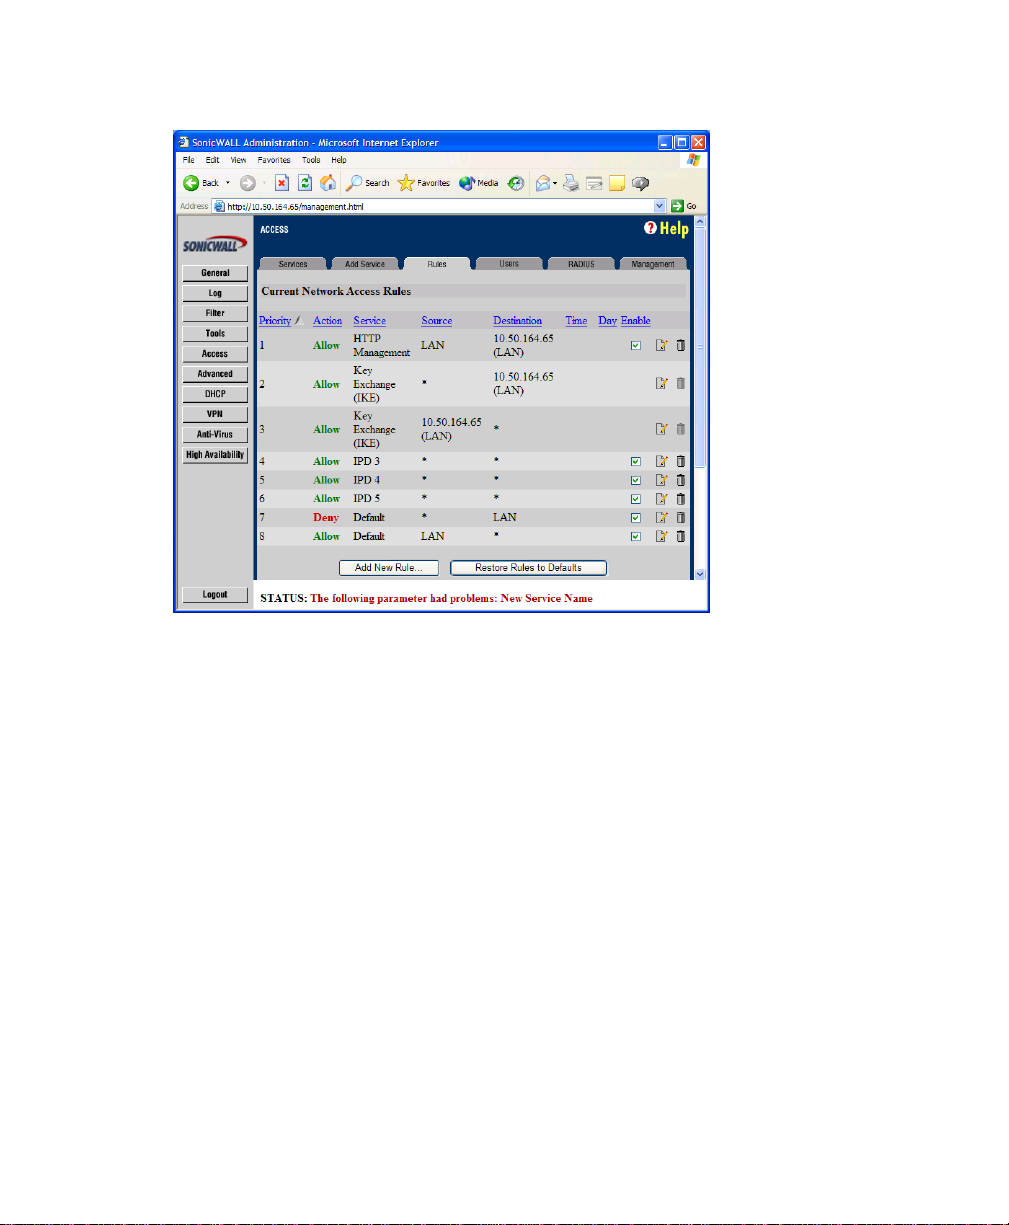
7. Click the Rules tab. The Rules page appears.
28 SonicWALL ViewPoint User Guide
Page 29
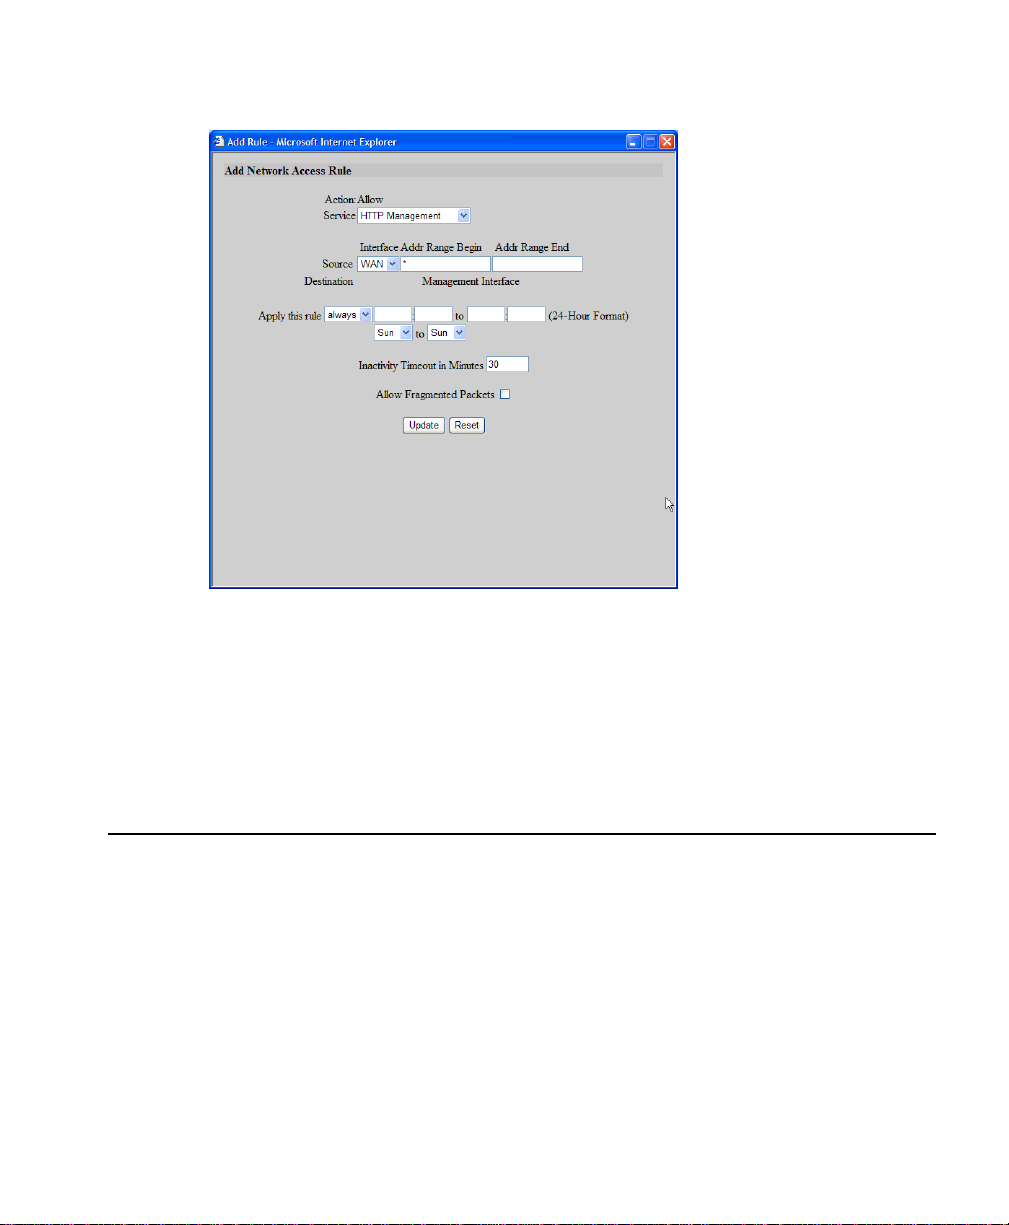
8. Click Add New Rule. The Add Network Access Rule dialog box appears.
9. Create a rule that allows SonicWALL ViewPoint to access your SonicWALL appliance using HTTPS
(HTTPS Management service) from the WAN and click Update. The rule is added.
Note: The common name for the HTTPS Certificate must match the IP address or host name of the
WAN i n t e r f a c e .
Note: If your SonicWALL ViewPoint server is behind a firewall, you need to ensure the syslog traffic
can reach the SonicWALL ViewPoint server. To do this, add the IP address of the firewall as the syslog server in your SonicWALL appliance, and create a rule in the firewall to allow syslog traffic from
your SonicWALL appliance to the SonicWALL ViewPoint server.
Adding a SonicWALL Appliance to SonicWALL ViewPoint
This section describes how to add a SonicWALL appliance to SonicWALL ViewPoint. To add a SonicWALL appliance, follow these steps:
Configuring ViewPoint 29
Page 30
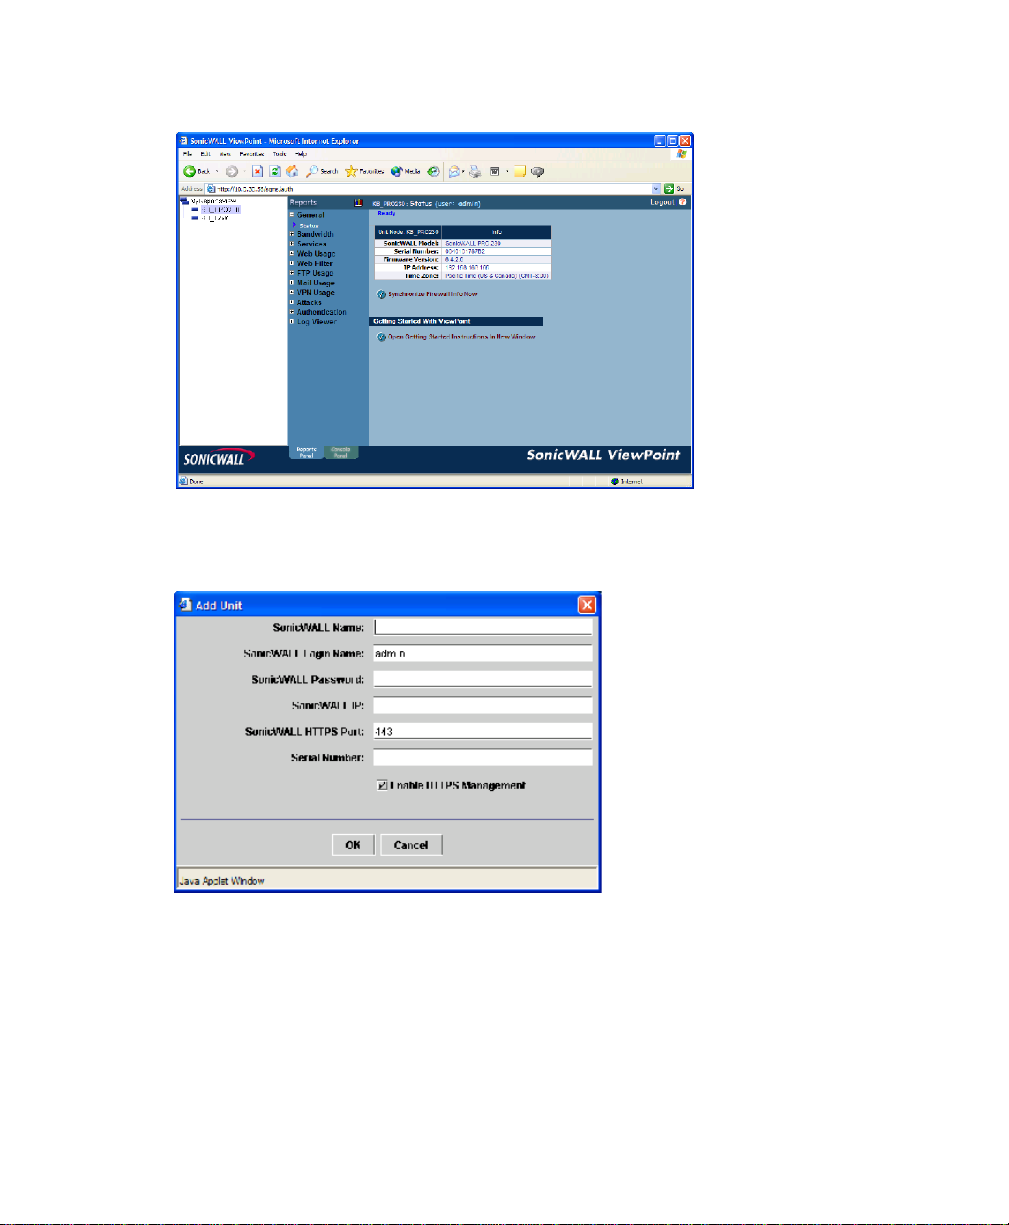
1. Start and log into SonicWALL ViewPoint. The Status page appears.
2. Right-click MyReportsView in the left pane of the SonicWALL ViewPoint UI and select Add Unit
from the pop-up menu. The Add Unit dialog box appears.
3. Enter a descriptive name for your SonicWALL appliance in the SonicWALL Name field.
Note: Do not enter the single quote character (') in the SonicWALL Name field.
4. Enter the username used to access your SonicWALL appliance in the SonicWALL Login Name field
(default: admin).
5. Enter the password used to access the SonicWALL appliance in the SonicWALL Password field.
6. Enter the IP address that is used to access the SonicWALL appliance in the SonicWALL IP Address
field.
30 SonicWALL ViewPoint User Guide
Page 31
Note: If SonicWALL ViewPoint is on the same LAN as the SonicWALL appliance or accesses it
through a VPN tunnel, enter the LAN IP address. If SonicWALL ViewPoint will access the SonicWALL appliance from the WAN interface, enter the static WAN IP address.
7. If SonicWALL ViewPoint will log into the SonicWALL appliance using HTTP, deselect the Enable
HTTPS Management check box and enter the HTTP port number used to access your SonicWALL
appliance in the SonicWALL HTTP Port field (default: 80).
8. If SonicWALL ViewPoint will log into the SonicWALL appliance using secure HTTP (HTTPS),
enter the HTTPS port number in the SonicWALL HTTPS Port field (default: 443).
9. Enter the serial number of the SonicWALL appliance in the Serial Number field.
10.Click OK. SonicWALL ViewPoint finds the SonicWALL appliance and validates its ViewPoint
license. When this is complete, the SonicWALL appliance appears in the left pane of the SonicWALL
ViewPoint UI under MyReportsView.
Note: If one of the parameters in the Add Unit dialog box is left blank, SonicWALL ViewPoint will
display a pop-up notification.
Viewing and Updating SonicWALL Information
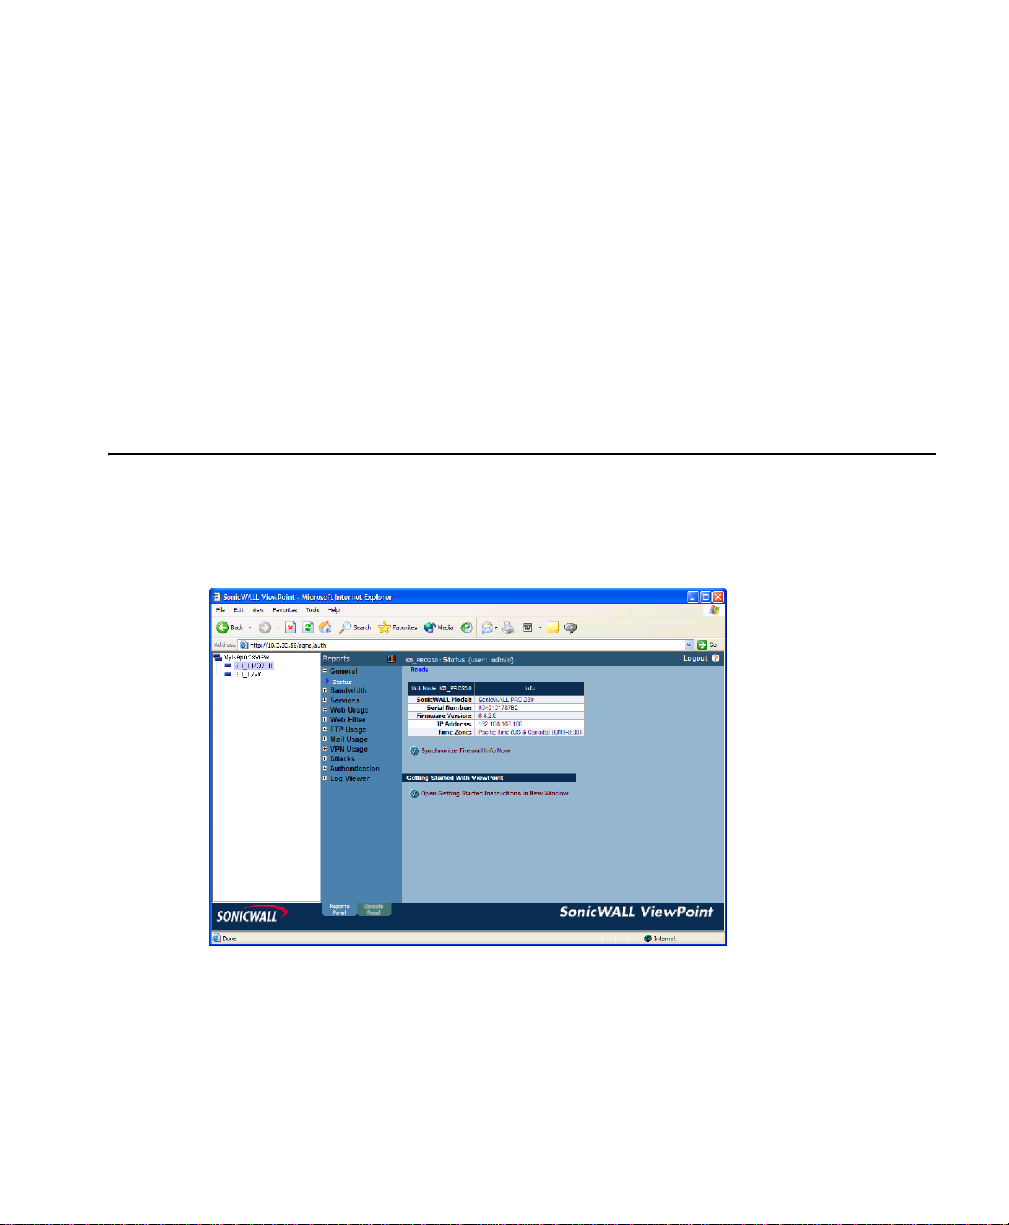
To view the status of a SonicWALL appliance, follow these steps:
1. Start and log into SonicWALL ViewPoint. The Status page appears.
The page displays the SonicWALL model, serial number, firmware version, IP address, and time
zone.
2. To update this information, click Synchronize Firewall Info Now.
Configuring ViewPoint 31
Page 32

Deleting a SonicWALL Appliance from SonicWALL ViewPoint
To delete a SonicWALL appliance from SonicWALL ViewPoint, follow these steps:
1. Start and log into SonicWALL ViewPoint. The Status page appears.
2. Select a unit in the left pane of the SonicWALL ViewPoint UI under MyReportsView.
3. Right-click the unit and select Delete Unit from the pop-up menu. You are prompted to confirm the
deletion.
4. Click Yes . The SonicWALL appliance disappears from the left pane of the SonicWALL ViewPoint UI
and is deleted from the ViewPoint database.
32 SonicWALL ViewPoint User Guide
Page 33

Modifying Settings for a SonicWALL Appliance
To change the settings of a SonicWALL appliance, whether you are changing the IP address, password, or
other settings, follow these steps:
1. Start and log into SonicWALL ViewPoint. The Status page appears.
2. Select a unit in the left pane of the SonicWALL ViewPoint UI under MyReportsView.
3. Right-click on the unit and select Modify Unit from the pop-up menu. The Modify Unit dialog box
appears.
4. Make changes to any of the fields.When you are finished, click OK. After SonicWALL ViewPoint
finds the SonicWALL appliance and validates its ViewPoint license, the SonicWALL appliance will
Configuring ViewPoint 33
Page 34

re-appear in the left pane of the SonicWALL ViewPoint UI under MyReportsView, and the ViewPoint database is modified.
Note: Do not enter the single quote character (‘) in the SonicWALL Name field.
Note: If the SonicWALL ViewPoint server is on the same network as the SonicWALL appliance LAN
interface or if the SonicWALL ViewPoint server needs to access the SonicWALL appliance through a
VPN tunnel, enter the LAN IP address of the SonicWALL appliance in the IP Address field. If the SonicWALL ViewPoint server will access the SonicWALL appliance from the WAN, enter the WAN IP
address of the SonicWALL appliance in the IP Address field. The WAN IP address must be static.
Note: The serial number cannot be changed in the Modify Unit dialog box. To change this value, see
the instructions “Modifying the Serial Number of an Appliance” on page 135.
Changing ViewPoint Login Password
To modify the configuration settings for SonicWALL ViewPoint, follow these steps.
1. Start and log into SonicWALL ViewPoint.
2. Click the Console Panel tab at the bottom of the SonicWALL ViewPoint UI.
3. Expand the Login tree and click Change Password. The Change Password page appears.
4. Enter the current ViewPoint password in the Old ViewPoint Password field.
5. Enter the new ViewPoint password in the New ViewPoint Password field.
6. Reenter the new ViewPoint password in the Confirm ViewPoint Password field.
34 SonicWALL ViewPoint User Guide
Page 35

7. When you are finished, click Update. The password is changed. To clear all screen settings and start
over, click Reset.
Note: The password is one-way hashed and any password of any length can be hashed into a fixed 32
character long internal password. The ViewPoint password cannot contain special characters (# + ,
% &) or any embedded blank spaces.
Configuring ViewPoint Settings
To modify the configuration settings for SonicWALL ViewPoint, follow these steps:
1. Start and log into SonicWALL ViewPoint.
2. Click the Console Panel tab at the bottom of the SonicWALL ViewPoint UI.
3. Expand the Login tree and click ViewPoint Settings. The ViewPoint Settings page appears.
4. The ViewPoint Inactivity Timeout period specifies how long SonicWALL ViewPoint waits before
logging out an inactive user. To prevent someone from accessing the SonicWALL ViewPoint UI
when SonicWALL ViewPoint users are away from their desks, enter an appropriate value in the
ViewPoint Inactivity Timeout field (default: 5 minutes).
Note: This field can be set to a maximum of 32767 minutes.
5. Enter the IP address or hostname of the Simple Mail Transfer Protocol (SMTP) server in the SMTP
Server Address field.
Configuring ViewPoint 35
Page 36

6. Enter the email addresses of the SonicWALL ViewPoint administrators in the ViewPoint Admin eMail Address and ViewPoint Admin e-Mail Address 2 fields.
7. Enter the sender's email address that appears in messages sent from the SonicWALL ViewPoint in the
ViewPoint Sender's e-Mail Address field.
8. Select the amount of debug information that is stored from the System Debug Level field. For no
debugging, enter 0. For verbose debugging, enter 3.
Note: Debugging should only be enabled when troubleshooting any SonicWALL ViewPoint problems.
9. When you are finished, click Update. The ViewPoint settings are changed. To clear the screen settings and start over, click Reset.
Managing ViewPoint Logs
SonicWALL ViewPoint logs its activities. To view these logs, follow these steps:
1. Start and log into SonicWALL ViewPoint.
2. Click the Console Panel tab at the bottom of the SonicWALL ViewPoint user interface (UI).
3. Expand the Log tree and click View Log. The View Log page appears.
36 SonicWALL ViewPoint User Guide
Page 37

4. SonicWALL ViewPoint also allows you to delete the old logs. To do so, expand the Log tree and
click View Log. The Configuration page appears.
5. To delete logs older than a certain date, select the date and click Delete Logs Older Than.
Managing ViewPoint Sessions
To manage SonicWALL ViewPoint login sessions, follow these steps:
1. Start and log into SonicWALL ViewPoint.
2. Click the Console Panel tab at the bottom of the SonicWALL ViewPoint user interface (UI).
Configuring ViewPoint 37
Page 38

3. Expand the Management tree and click Sessions. The Sessions page appears.
4. Select the check box of each user to log off and click End selected sessions. The selected users are
logged off.
Summarizer Settings
This section describes how to configure reporting settings. These include how often the summary information is updated, the number of days that summary information is stored, and the number of days that
raw data is stored.
These reports are constructed from the most current available summary data. In order to create summary
data, SonicWALL ViewPoint must parse the raw data files.
Note: Because reports are based on the most current summary data, the report may be old. For example,
if the data was summarized four hours ago, all activity that occurred since the last summary will not be in
the report.
When configuring SonicWALL ViewPoint, you can select the amount of summary information to store.
Summary information consumes approximately one kilobyte of information per SonicWALL appliance
per day. Make sure the database is large enough to accommodate the number of days that you choose.
Additionally, you can select the amount of raw data to store. The raw data is made up of information for
every connection. Depending on the amount of traffic, the raw data can quickly consume an enormous
amount of space in the database. Be very careful when selecting how much raw information to store.
38 SonicWALL ViewPoint User Guide
Page 39

General Report Settings
To configure SonicWALL ViewPoint settings, follow these steps:
1. Start and log into SonicWALL ViewPoint.
2. Click the Console Panel tab at the bottom of the SonicWALL ViewPoint user interface (UI).
3. Expand the Reports tree and click Summarizer. The Summarizer page appears.
4. Specify how often SonicWALL ViewPoint processes and updates summary information from the
Time Between Summaries list box and click Update.
5. To specify the next summary time, enter a date and time in the Next Scheduled Summary Time field
and click Update.
6. To update the summary information now, click Summarize Data Immediately. SonicWALL ViewPoint automatically processes the latest information and makes it available for immediate viewing.
Note: This will not affect the normally scheduled summarization.
7. Configure the following report setting defaults:
• Select the default number of sites to be summarized from the Number of Top Sites list box
(default: All).
• Select the default number of users to be summarized from the Number of Top Users list box
(default: All).
• Select the default number of sites per user to be summarized from the Number of Top Sites Per
User list box (default: All).
Configuring ViewPoint 39
Page 40

8. Specify how many days of summarized data the SonicWALL ViewPoint will store in the database
from the Days To Store Summarized Data list box and click Submit. To save all information, enter
All (default: 15 days).
Summarized data consumes approximately one kilobyte of information per SonicWALL appliance
per day. Make sure the database is large enough to accommodate the number of days that you choose.
9. The Summary Data Available Until field displays when the data was last summarized. To re-sum-
marize any data, enter a date and time and click Update.
Configuring Log Viewer Settings
To configure Log Viewer settings, follow these steps:
1. Start and log into SonicWALL ViewPoint.
2. Click the Console Panel tab at the bottom of the SonicWALL ViewPoint user interface (UI).
3. Expand the Reports tree and click Log Viewer Settings. The Log Viewer Settings page appears.
4. Specify how many days of raw data SonicWALL ViewPoint will store in the database from the Days
To Store Raw Data list box and click Update. To save all information, enter All (default: 10 days).
40 SonicWALL ViewPoint User Guide
Page 41

Adding a Service
SonicWALL ViewPoint can monitor known services or custom services.
To add a service that is displayed in the services reports, follow these steps.
1. Start and log into SonicWALL ViewPoint.
2. Click the Console Panel tab at the bottom of the SonicWALL ViewPoint user interface (UI).
3. Expand the Reports tree and click Services. The Services page appears.
4. To add a known service, select it from the Add a known service list box and click Add.
5. To add a custom service, enter a name in the Name field, enter the service’s port range, and select the
protocol that it uses from the Protocol list box. Click Add.
6. To delete a service, select it and click Delete.
Configuring ViewPoint 41
Page 42

42 SonicWALL ViewPoint User Guide
Page 43

Viewing Reports
This chapter describes how to generate reports using SonicWALL ViewPoint.
Select from the following reports:
• To view general bandwidth usage reports, see “Viewing Bandwidth Reports” on page 43.
• To view bandwidth reports, by service, see “Viewing Service Usage Reports” on page 53.
• To view web usage bandwidth reports, see “Viewing Web Usage Reports” on page 56.
• To view reports on the number of attempts that users made to access blocked websites, see
“Viewing Web Filter Reports” on page 71.
• To view file transfer protocol (FTP) bandwidth usage reports, see “Viewing File Transfer Protocol Reports” on page 87.
• To view mail bandwidth usage reports, see “Viewing Mail Usage Reports” on page 95.
• To view virtual private networking (VPN) reports, see “Viewing VPN Usage Reports” on
page 103.
• To view reports on attempted attacks, see “Viewing Attack Reports” on page 111.
• To view detailed logging information, see “Viewing the Log” on page 132.
• To view user and administrator authentication reports, see “Viewing Authentication Reports” on
page 127.
Note: When you log into SonicWALL ViewPoint, ViewPoint displays data for the previous day. This
is true for every new login session.
CHAPTER 4
Viewing Bandwidth Reports
Bandwidth reports display the amount of data transferred through the selected SonicWALL appliance(s).
Bandwidth reports are an ideal starting point for viewing overall bandwidth usage. You can view
bandwidth usage view by the hour, day, or over a period of days. Additionally, you can view the top
users of bandwidth.
From this information, you can determine network strategies. For example, if you need more bandwidth, you might need to upgrade network equipment, or you might simply need to curtail the bandwidth usage of a few employees.
Viewing Reports 43
Page 44

Note: The single firewall report appears in firewall's local time. The aggregate multi-firewall report
appears in Universal Time, Coordinated (UTC) or Greenwich Mean Time (GMT).
Select from the following:
• To view a summary of the daily bandwidth usage, see “Viewing the Bandwidth Summary Report” on
page 44.
• To view bandwidth usage in real time, see “Monitoring Bandwidth Usage in Real Time” on page 46.
• To view the users who consume the most bandwidth, see “Viewing the Top Users of Bandwidth” on
page 48.
• To view bandwidth usage over a period of time, see “Viewing Bandwidth Usage Over Time” on
page 49.
• To view the users who consume the most bandwidth over time, see “Viewing the Top Users of Bandwidth Over Time” on page 51.
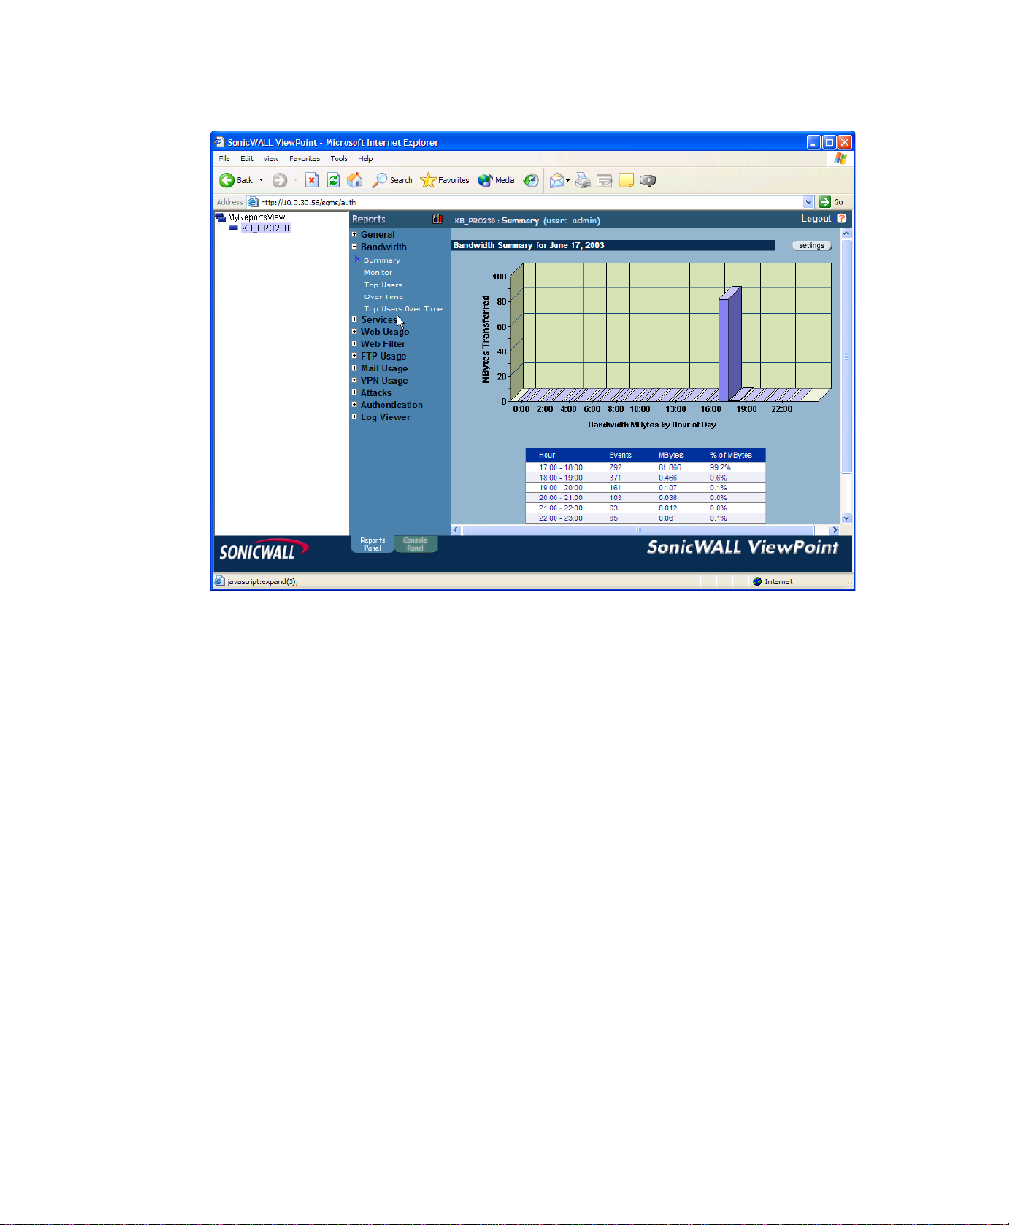
Viewing the Bandwidth Summary Report
The Bandwidth Summary report contains information on the amount of traffic handled by a SonicWALL
appliance or group of SonicWALL appliances during each hour of the specified day.
To view the Bandwidth Summary report, follow these steps:
1. Start and log into SonicWALL ViewPoint.
2. Click the Reports tab.
3. Select the global icon, a group, or a SonicWALL appliance.
44 SonicWALL ViewPoint User Guide
Page 45

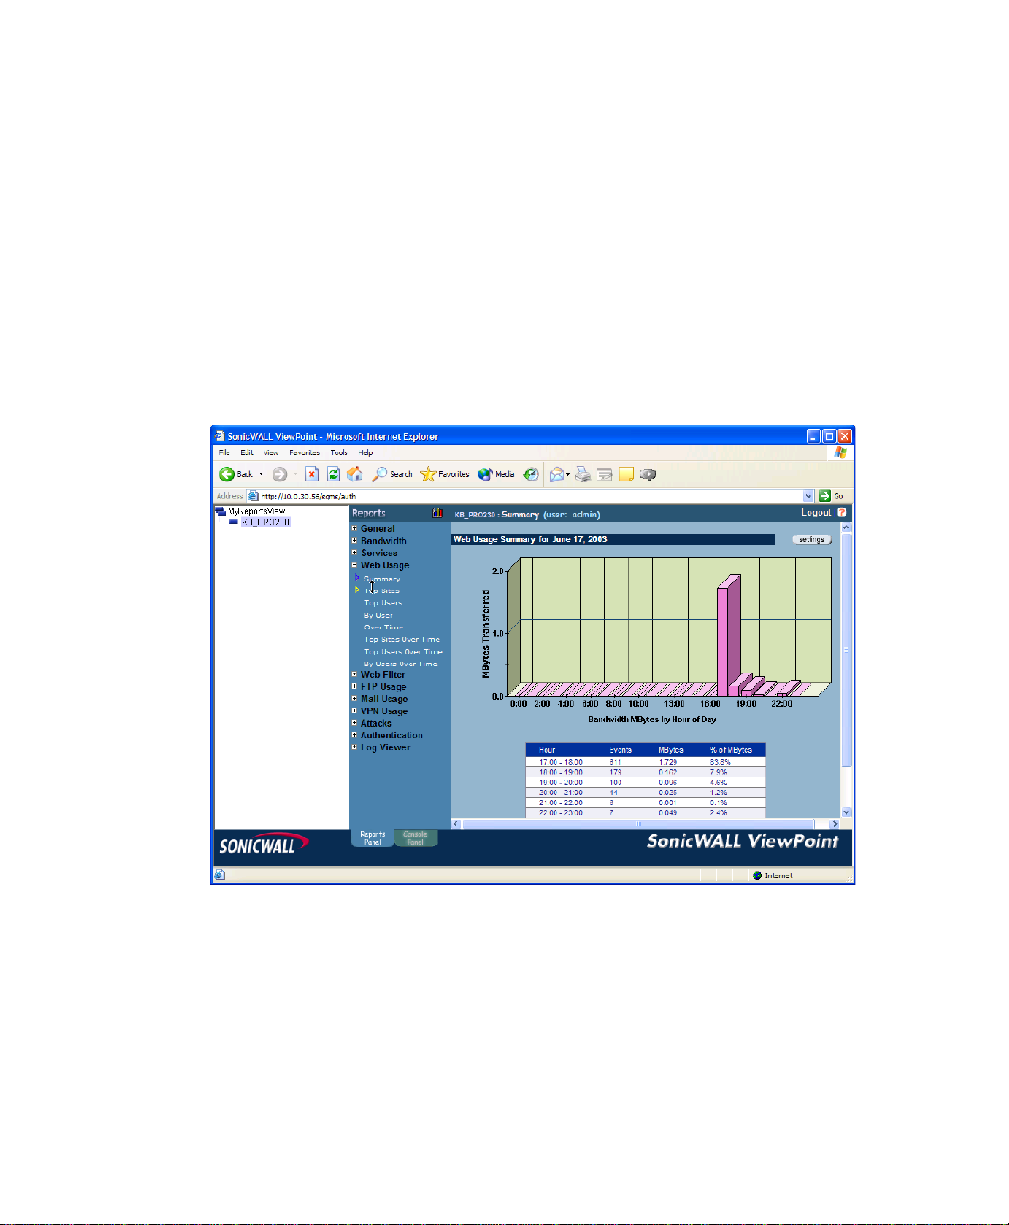
4. Expand the Bandwidth tree and click Summary. The Summary page appears.
5. The bar graph displays the amount of bandwidth transferred during each hour of the day.
6. The table contains the following information:
• Hour—when the sample was taken.
• Events—number of events or “hits.”
• MBytes—number of megabytes transferred.
• % of MBytes—percentage of megabytes transferred during this hour, compared to the day. For
example, if 1000 megabytes of data was transferred during the day and 100 megabytes was transferred at the 12:00 time period, the % of MBytes field will display 10%.
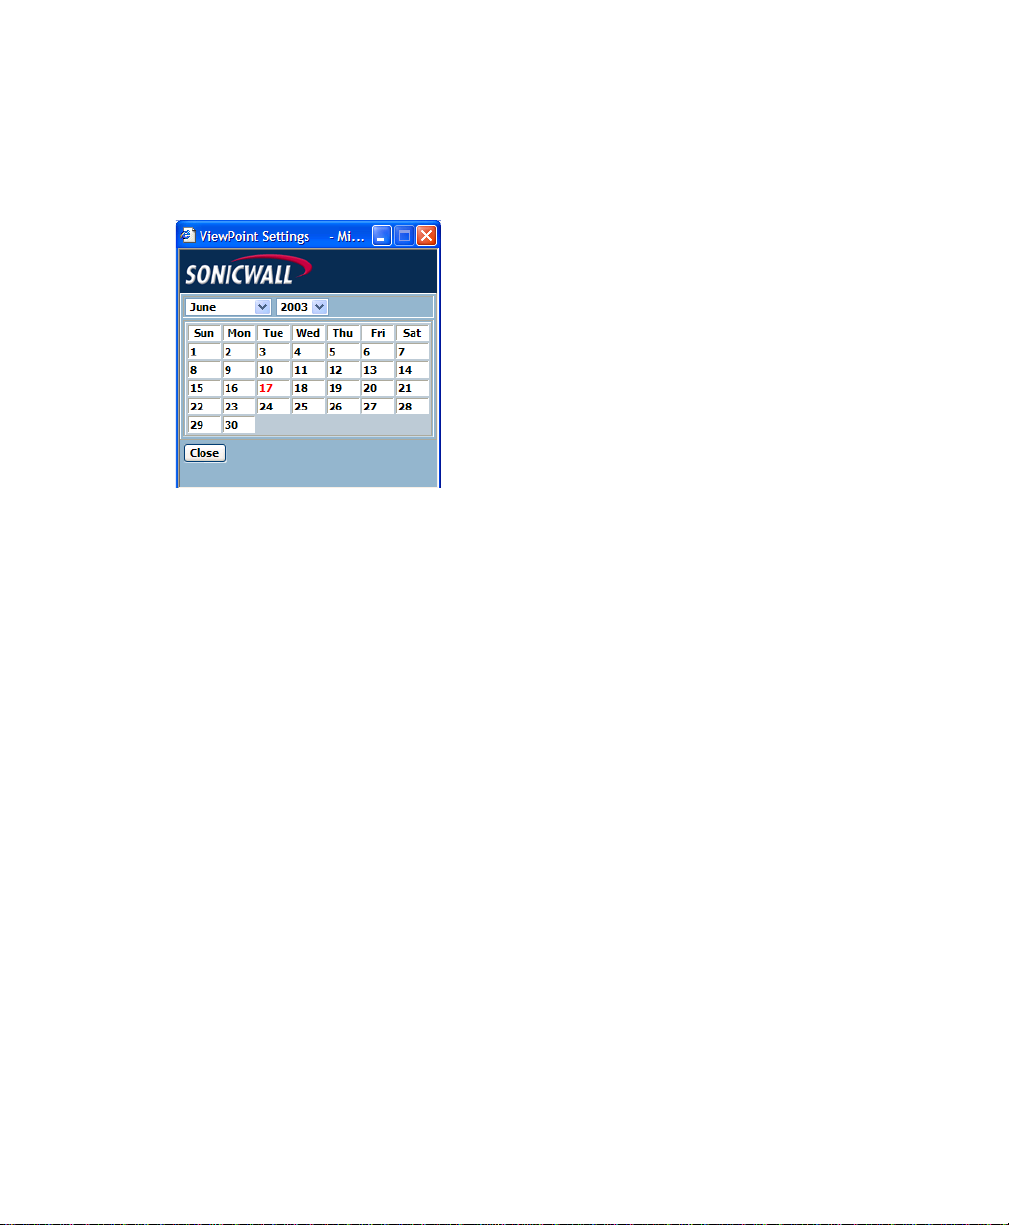
7. SonicWALL ViewPoint shows today’s report. To change the date of the report, click Settings. The
Report Settings dialog box appears.
Viewing Reports 45
Page 46
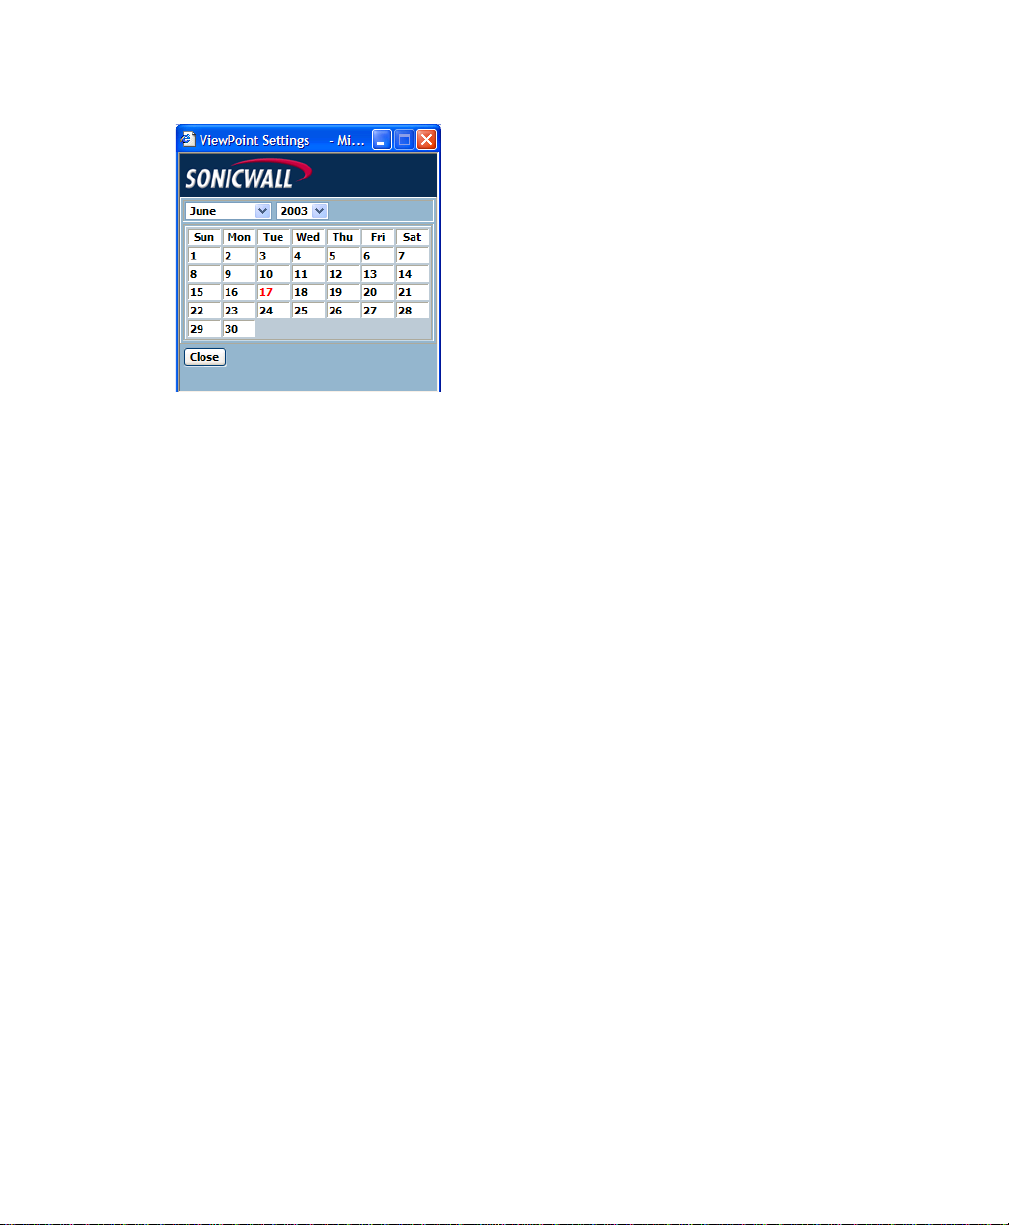
8. Select the year, month, and day to view.
9. When you are finished, click Close. SonicWALL ViewPoint displays the report for the selected day.
Note: These settings stay in effect for all reports during your active login session. Once you log out,
the settings will be reset to the default values embedded in the software.
Monitoring Bandwidth Usage in Real Time
The Bandwidth Monitor displays bandwidth usage for the selected SonicWALL appliance in real time.
To view the Bandwidth Monitor, follow these steps:
1. Start and log into SonicWALL ViewPoint.
2. Click the Reports tab.
3. Select a SonicWALL appliance.
46 SonicWALL ViewPoint User Guide
Page 47
4. Expand the Bandwidth tree and click Monitor. The Monitor page appears.
5. The Bandwidth Monitor shows the amount of data transferred during each sampling period for the
last five minutes. The sampling period is five seconds.
Viewing Reports 47
Page 48

Viewing the Top Users of Bandwidth
The Top Users report displays the users who used the most bandwidth on the specified date.
To view the Top Users report, follow these steps:
1. Start and log into SonicWALL ViewPoint.
2. Click the Reports tab.
3. Select a SonicWALL appliance.
4. Expand the Bandwidth tree and click Top U s er s. The Top Users page appears.
5. The pie chart displays the percentage of bandwidth transferred by each user.
6. The table contains the following information:
• Users—the IP address of the user.
• Connections—number of events or “hits.”
• MBytes—number of megabytes.
• % of MBytes—percentage of megabytes transferred by this user, compared to all users. For
example, if 1000 megabytes of data was transferred during the day and 200 megabytes was transferred by the top user, the % of MBytes field will display 20%.
48 SonicWALL ViewPoint User Guide
Page 49

7. By default, SonicWALL ViewPoint shows today’s report, a pie chart, and the ten top users. To change
these settings, click Settings. The Report Settings dialog box appears.
8. Select the number of users to display from the Number of Users list box.
9. Select the type of chart from the Chart Type list box.
10.Select the year, month, and day to view.
11.When you are finished, click Close. SonicWALL ViewPoint displays the report for the selected day.
Note: These settings stay in effect for all reports during your active login session. Once you log out,
the settings will be reset to the default values embedded in the software.
Viewing Bandwidth Usage Over Time
The Bandwidth Over Time report displays the daily amount of traffic handled by a SonicWALL appliance
or a group of SonicWALL appliances for the specified time period.
To view the Bandwidth Over Time report, follow these steps:
1. Start and log into SonicWALL ViewPoint.
2. Click the Reports tab.
3. Select the global icon, a group, or a SonicWALL appliance.
Viewing Reports 49
Page 50

4. Expand the Bandwidth tree and click Over Time. The Over Time page appears.
5. The bar graph displays the amount of bandwidth transferred during each day of the specified time
period.
6. The table contains the following information:
• Date—when the sample was taken.
• Connections—number of hits.
• MBytes—number of megabytes transferred.
• % of Usage—percentage of megabytes transferred during this day, compared to the time period.
For example, if 100,000 megabytes of data was transferred during the time period and 25,000
megabytes was transferred on one day, the % of Usage field will display 25%.
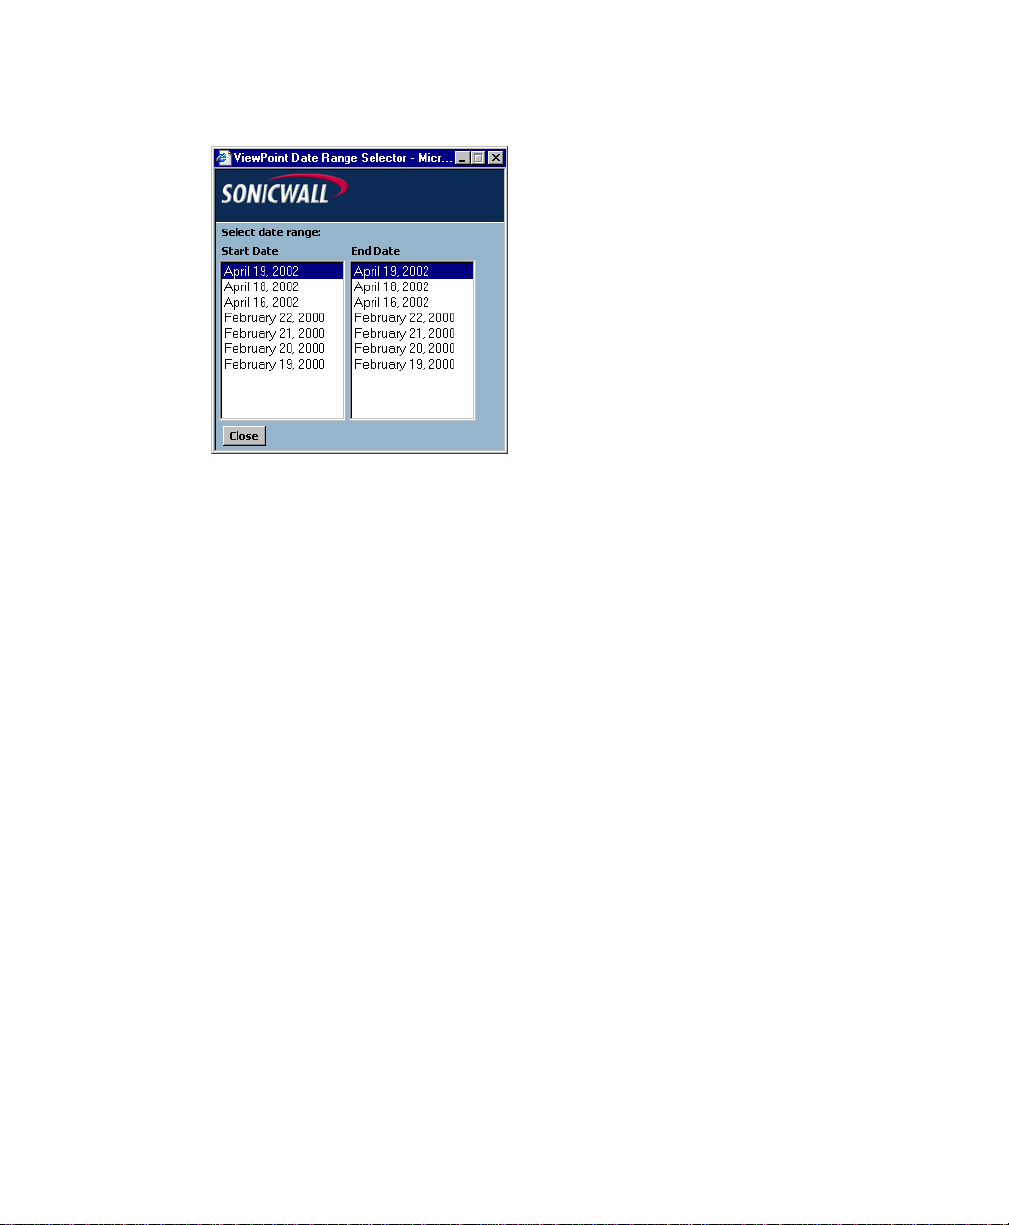
7. To change the date range of the report, click Settings. The Reporting Date Range Selector dialog box
appears.
50 SonicWALL ViewPoint User Guide
Page 51

8. Select the starting and ending dates to view.
9. When you are finished, click Close. SonicWALL ViewPoint displays the report for the selected date
range.
Note: These settings stay in effect for all reports during your active login session. Once you log out,
the settings will be reset to the default values embedded in the software.
Viewing the Top Users of Bandwidth Over Time
The Top Users report displays the users who used the most bandwidth on the specified date.
To view the Top Users Over Time report, follow these steps:
1. Start and log into SonicWALL ViewPoint.
2. Click the Reports tab.
3. Select a SonicWALL appliance.
4. Expand the Bandwidth tree and click Top U s er s O v er T i m e. The Top Users Over Time page appears.
Viewing Reports 51
Page 52

5. The pie chart displays the percentage of bandwidth transferred by each user.
6. The table contains the following information:
• Users—the IP address of the user.
• Connections—number of events or “hits.”
• MBytes—number of megabytes.
• % of MBytes—percentage of megabytes transferred by this user, compared to all users. For
example, if 1000 megabytes of data was transferred during this period and 200 megabytes was
transferred by the top user, the % of MBytes field will display 20%.
52 SonicWALL ViewPoint User Guide
Page 53

7. To change the date range of the report, click Settings. The Reporting Date Range Selector dialog box
appears.
8. Select the starting and ending dates to view.
9. When you are finished, click Close. SonicWALL ViewPoint displays the report for the selected date
range.
Note: These settings stay in effect for all reports during your active login session. Once you log out,
the settings will be reset to the default values embedded in the software.
Viewing Service Usage Reports
Service reports provide information on the amount of data transmitted through the selected SonicWALL
appliance by each service.
Service reports are useful for revealing inappropriate usage of bandwidth and can help determine network
policies. For example, if there is a large spike of bandwidth usage, you can determine whether this is
caused by regular web access, someone using FTP to transfer large files, an attempted Denial of Service
(DoS) attack, or another service.
Note: The single firewall report appears in firewall's local time. You cannot view services reports for a
group of firewalls.
SonicWALL ViewPoint can monitor known services as well as custom services. To add a service to monitor, refer to the documentation that accompanied the SonicWALL appliance.
Select from the following:
• To view service bandwidth usage in real time, see “Monitoring Service Usage in Real Time” on
page 54.
• To view a summary of the daily service bandwidth usage, see “Viewing the Services Summary
Report” on page 55.
Viewing Reports 53
Page 54

Monitoring Service Usage in Real Time
The Services Monitor displays service usage for the selected SonicWALL appliance in real time.
To view the Service Monitor, follow these steps:
1. Start and log into SonicWALL ViewPoint.
2. Click the Reports tab.
3. Select a SonicWALL appliance.
4. Expand the Services tree and click Monitor. The Monitor page appears.
5. The Services Monitor shows the amount of data transferred for each service during each sampling
period for the last five minutes. The sampling period is 15 seconds.
54 SonicWALL ViewPoint User Guide
Page 55

Viewing the Services Summary Report
The Services Summary report displays the amount of traffic handled by each service during each hour of
the specified day.
To view the Services Summary report, follow these steps:
1. Start and log into SonicWALL ViewPoint.
2. Click the Reports tab.
3. Select a SonicWALL appliance.
4. Expand the Services tree and click Summary. The Summary page appears.
5. The bar graph displays the amount of bandwidth used by each service during each hour of the day.
6. The table contains the following information:
• Protocol—the service.
• MBytes—number of megabytes.
• Events—number of events or “hits.”
• % of Events—percentage of events transferred by this service on the selected day, compared to
all other services. For example, if 10,000 events occurred during the day and 9,000 of the events
were handled by the HTTP service, the % of Events field will display 90%.
Viewing Reports 55
Page 56

7. SonicWALL ViewPoint shows today’s report. To change the date of the report, click Settings. The
Report Settings dialog box appears.
8. Select the year, month, and day to view.
9. When you are finished, click Close. SonicWALL ViewPoint displays the report for the selected day.
Note: These settings stay in effect for all reports during your active login session. Once you log out,
the settings will be reset to the default values embedded in the software.
Viewing Web Usage Reports
Web usage reports provide information on the amount of web usage that occurs through the selected SonicWALL appliance(s).
Web usage reports can be used to view web bandwidth usage by the hour, day, or over a period of days.
Additionally, you can view the top users of web bandwidth and view the most visited sites.
Note: The single firewall report appears in the firewall's local time. The aggregate multi-firewall report
appears in Universal Time, Coordinated (UTC) or Greenwich Mean Time (GMT).
Select from the following:
• To view a summary of the daily web bandwidth usage, see “Viewing the Web Usage Summary
Report” on page 57.
• To view a list of the top visited sites, see “Viewing the Top Sites” on page 58.
• To view the users who consume the most web bandwidth, see “Viewing the Top Users of HTTP
Bandwidth” on page 60.
• To view the top sites visited by each user, see “Viewing HTTP Bandwidth Usage by User” on
page 62.
• To view web bandwidth usage over a period of time, see “Viewing Bandwidth Usage Over Time” on
page 63.
• To view a list of the top visited sites over time, see “Viewing Top Sites Over Time” on page 65.
• To view the users who consume the most web bandwidth over time, see “Viewing Top Users Over
Time” on page 67.
56 SonicWALL ViewPoint User Guide
Page 57
• To view the top sites visited by each user over time, see “Viewing Bandwidth Usage By User Over
Time” on page 69.
Viewing the Web Usage Summary Report
The Web Usage Summary report contains information on the amount of HTTP bandwidth handled by a
SonicWALL appliance or group of SonicWALL appliances during each hour of the specified day.
To view the Web Usage Summary report, follow these steps:
1. Start and log into SonicWALL ViewPoint.
2. Click the Reports tab.
3. Select the global icon, a group, or a SonicWALL appliance.
4. Expand the Web Usage tree and click Summary. The Summary page appears.
5. The bar graph displays the amount of HTTP bandwidth transferred during each hour of the day.
6. The table contains the following information:
• Hour—when the sample was taken.
• Events—number of events or “hits.”
• MBytes—number of megabytes transferred.
Viewing Reports 57
Page 58
• % of MBytes—percentage of megabytes transferred during this hour, compared to the day. For
example, if 1000 megabytes of HTTP data was transferred during the day and 100 megabytes was
transferred at the 12:00 time period, the % of MBytes field will display 10%.
7. SonicWALL ViewPoint shows today’s report. To change the date of the report, click Settings. The
Report Settings dialog box appears.
8. Select the year, month, and day to view.
9. When you are finished, click Close. SonicWALL ViewPoint displays the report for the selected day.
Viewing the Top Sites
The Top Sites report displays the web sites that used the most HTTP bandwidth on the specified date. To
view the Top Sites report, follow these steps:
1. Start and log into SonicWALL ViewPoint.
2. Click the Reports tab.
3. Select a SonicWALL appliance.
58 SonicWALL ViewPoint User Guide
Page 59

4. Expand the Web Usage tree and click Top Sites. The Top Sites page appears.
5. The pie chart displays the percentage of bandwidth used to access the top sites.
6. The table contains the following information:
• Site—URL or IP address of the site.
• Hits—number of hits.
• MBytes—number of megabytes transferred.
• % of MBytes—percentage of megabytes transferred between this site, compared to all other
HTTP traffic. For example, if 10,000 megabytes of data was transferred during the day and 5,000
megabytes was transferred between the appliance and Ebay, the % of MBytes field will display
50%.
Viewing Reports 59
Page 60

7. By default, GMS Reporting shows today’s report, a pie chart, and the ten top sites. To change these
settings, click Settings. The Report Settings dialog box appears.
8. Select the number of sites to display from the Number of Sites list box.
9. Select the type of chart from the Chart Type list box.
10.Select the year, month, and day to view.
11.When you are finished, click Close. SonicWALL ViewPoint displays the report for the selected day.
Note: These settings stay in effect for all reports during your active login session. Once you log out,
the settings will be reset to the default values embedded in the software.
Viewing the Top Users of HTTP Bandwidth
The Top Users report displays the users who used the most HTTP bandwidth on the specified date.
To view the Top Users report, follow these steps:
1. Start and log into SonicWALL ViewPoint.
2. Click the Reports tab.
3. Select a SonicWALL appliance.
60 SonicWALL ViewPoint User Guide
Page 61
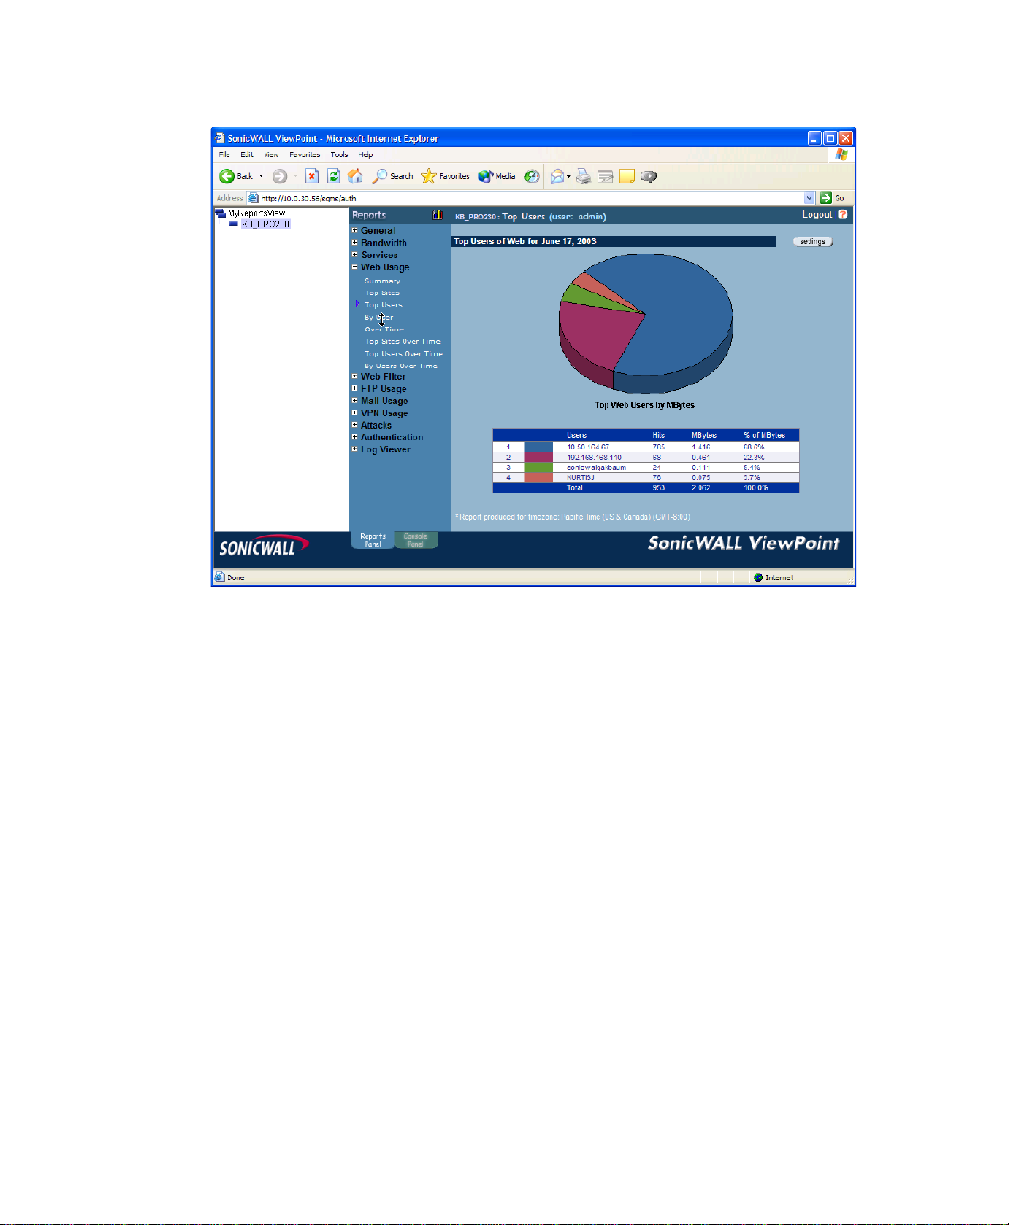
4. Expand the Web Usage tree and click To p U se rs. The Top Users page appears.
5. The pie chart displays the percentage of bandwidth transferred by each of the top users.
6. The table contains the following information:
• Users—the IP address of the user.
• Hits—number of hits.
• MBytes—number of megabytes transferred.
• % of MBytes—percentage of megabytes transferred by this user, compared to all users. For
example, if 1000 megabytes of data was transferred during the day and 200 megabytes was transferred by the top user, the % of MBytes field will display 20%.
Viewing Reports 61
Page 62
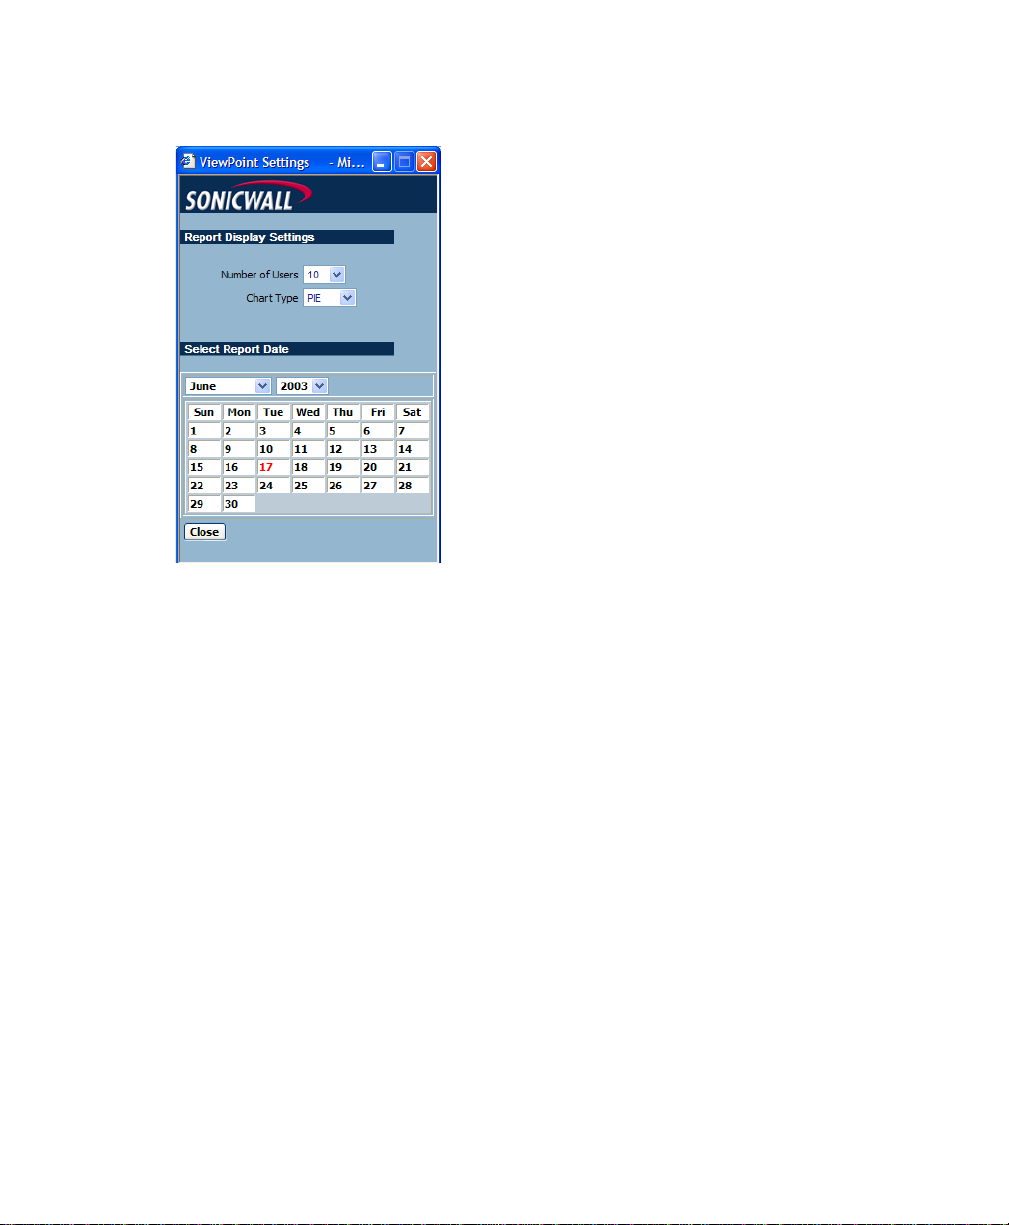
7. By default, GMS Reporting shows today’s report, a pie chart, and the ten top users. To change these
settings, click Settings. The Report Settings dialog box appears.
8. Select the number of users to display from the Number of Users list box.
9. Select the type of chart from the Chart Type list box.
10.Select the year, month, and day to view.
11.When you are finished, click Close. SonicWALL ViewPoint displays the report for the selected day.
Note: These settings stay in effect for all reports during your active login session. Once you log out,
the settings will be reset to the default values embedded in the software.
Viewing HTTP Bandwidth Usage by User
The By User report displays a list of all users, their top sites, the number of hits to each site, and the
amount of data transferred.
To view the By User report, follow these steps:
1. Start and log into SonicWALL ViewPoint.
2. Click the Reports tab.
3. Select a SonicWALL appliance.
62 SonicWALL ViewPoint User Guide
Page 63
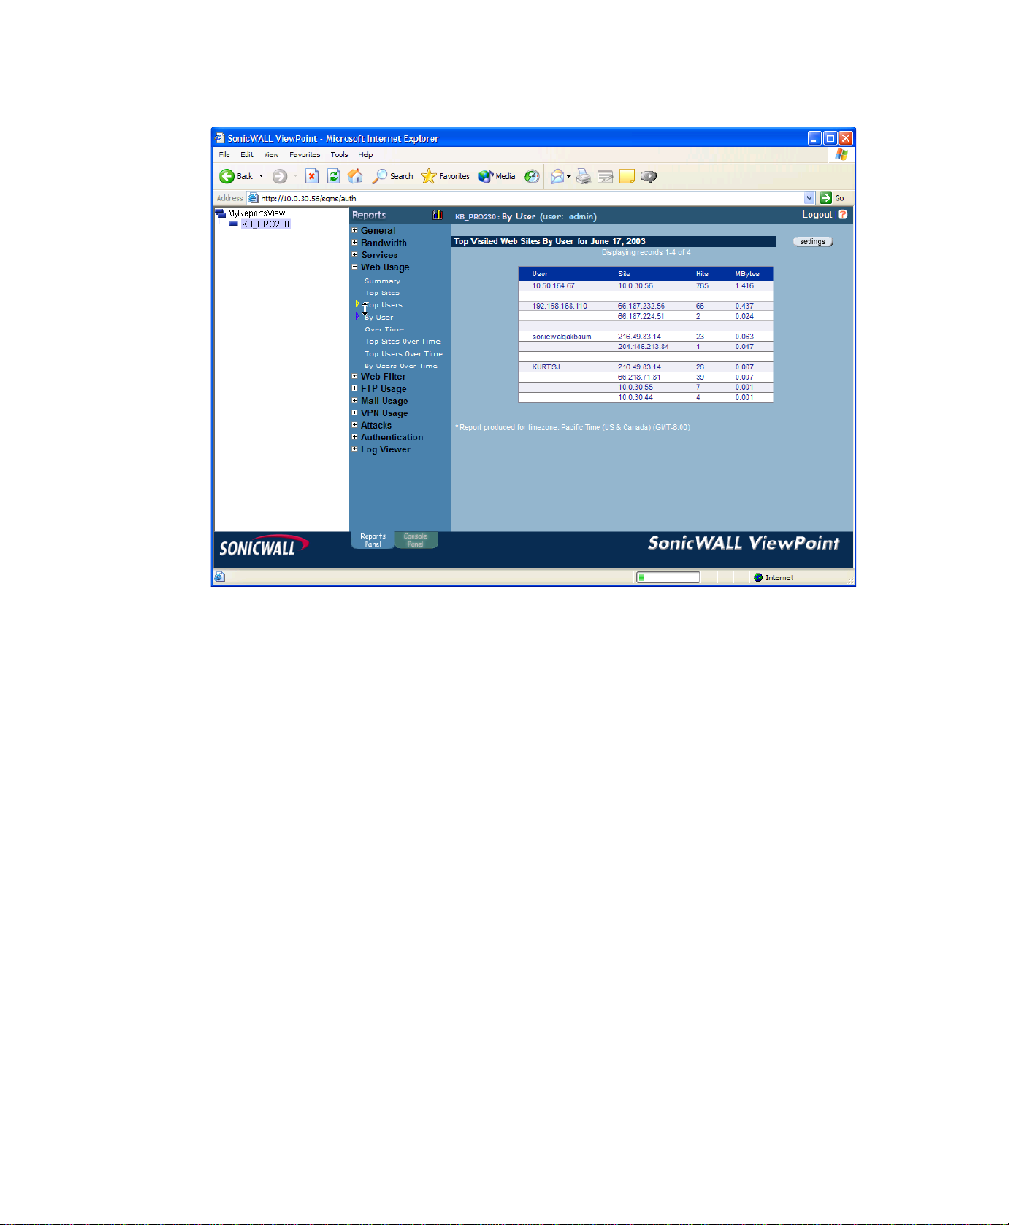
4. Expand the Web Usage tree and click By User. The By User page appears.
5. The table contains the following information:
• User—the IP address of the user.
• Site—the top five sites visited by the user.
• Hits—number of hits to each web site visited by the user.
• MBytes—number of megabytes transferred.
6. SonicWALL ViewPoint shows today’s report. To change the date of the report, click Settings. The
Report Settings dialog box appears.
7. Select the year, month, and day to view.
8. When you are finished, click Close. SonicWALL ViewPoint displays the report for the selected day.
Viewing Bandwidth Usage Over Time
The Web Usage Over Time report displays the daily amount of HTTP bandwidth handled by a SonicWALL appliance or group of SonicWALL appliances for the specified time period.
To view the Web Usage Over Time report, follow these steps:
1. Start and log into SonicWALL ViewPoint.
2. Click the Reports tab.
3. Select the global icon, a group, or a SonicWALL appliance.
Viewing Reports 63
Page 64

4. Expand the Web Usage tree and click Over Time. The Over Time page appears.
5. The bar graph displays the amount of HTTP bandwidth transferred during each day of the specified
time period.
6. The table contains the following information:
• Date—when the sample was taken.
• Connections—number of connections or hits.
• MBytes—number of megabytes transferred.
• % of Usage—percentage of megabytes transferred during this day, compared to the time period.
For example, if 100,000 megabytes of data was transferred during the time period and 25,000
megabytes was transferred on one day, the % of Usage field will display 25%.
64 SonicWALL ViewPoint User Guide
Page 65
7. To change the date range of the report, click Settings. The Reporting Date Range Selector dialog box
appears.
8. Select the starting and ending dates to view.
9. When you are finished, click Close. SonicWALL ViewPoint displays the report for the selected date
range.
Note: These settings stay in effect for all reports during your active login session. Once you log out,
the settings will be reset to the default values embedded in the software.
Viewing Top Sites Over Time
The Top Sites Over Time report displays the most visited web sites for the specified time period.
To view the Top Sites Over Time report, follow these steps:
1. Start and log into SonicWALL ViewPoint.
2. Click the Reports tab.
3. Select a SonicWALL appliance.
Viewing Reports 65
Page 66

4. Expand the Web Usage tree and click Top Sites Over Time. The Top Sites Over Time page appears.
5. The bar graph displays the amount of HTTP bandwidth transferred during each day of the specified
time period.
6. The table contains the following information:
• Site—URL or IP address of the site.
• Hits—number of hits.
• MBytes—number of megabytes transferred.
• % of KBytes—percentage of megabytes transferred between this site, compared to all other
HTTP traffic. For example, if 1,000 megabytes of data was transferred during the day and 500
megabytes was transferred between the appliance and Ebay, the % of MBytes field will display
50%.
66 SonicWALL ViewPoint User Guide
Page 67

7. To change the date range of the report, click Settings. The Reporting Date Range Selector dialog box
appears.
8. Select the starting and ending dates to view.
9. When you are finished, click Close. SonicWALL ViewPoint displays the report for the selected date
range.
Note: These settings stay in effect for all reports during your active login session. Once you log out,
the settings will be reset to the default values embedded in the software.
Viewing Top Users Over Time
The Top Users Over Time report displays the top users of bandwidth for the specified time period. To
view the Top Users Over Time report, follow these steps:
1. Start and log into SonicWALL ViewPoint.
2. Click the Reports tab.
3. Select a SonicWALL appliance.
Viewing Reports 67
Page 68

4. Expand the Web Usage tree and click Top Users Over Time. The Top Users Over Time page
appears.
5. The graph provides a graphical display of the percentage of bandwidth transferred by each of the top
users over the specified time period.
6. The table contains the following information:
• Users—the IP address of the user.
• Hits—number of hits.
• MBytes—number of megabytes transferred.
• % of MBytes—percentage of megabytes transferred by this user, compared to all users. For
example, if 1000 megabytes of data was transferred during the period and 200 megabytes was
transferred by the top user, the % of MBytes field will display 20%.
68 SonicWALL ViewPoint User Guide
Page 69

7. To change the date range of the report, click Settings. The Reporting Date Range Selector dialog box
appears.
8. Select the starting and ending dates to view.
9. When you are finished, click Close. SonicWALL ViewPoint displays the report for the selected date
range.
Note: These settings stay in effect for all reports during your active login session. Once you log out,
the settings will be reset to the default values embedded in the software.
Viewing Bandwidth Usage By User Over Time
The By User Over Time report displays a list of all users, their top sites, the number of hits to each site,
and the amount of data transferred for the specified time period.
To view the By User Over Time report, follow these steps:
1. Start and log into SonicWALL ViewPoint.
2. Click the Reports tab.
3. Select a SonicWALL appliance.
Viewing Reports 69
Page 70

4. Expand the Web Usage tree and click By User Over Time. The By User Over Time page appears.
5. The bar graph displays the amount of HTTP bandwidth transferred during each day of the specified
time period.
6. The table contains the following information:
• User—the IP address of the user.
• Site—the top five sites visited by the user.
• Hits—number of hits to each web site visited by the user.
• MBytes—number of megabytes transferred.
70 SonicWALL ViewPoint User Guide
Page 71

7. To change the date range of the report, click Settings. The Reporting Date Range Selector dialog box
appears.
8. Select the starting and ending dates to view.
9. When you are finished, click Close. SonicWALL ViewPoint displays the report for the selected date
range.
Note: These settings stay in effect for all reports during your active login session. Once you log out,
the settings will be reset to the default values embedded in the software.
Viewing Web Filter Reports
Web filter reports provide information on the number of attempts that users made to access blocked web
sites through the selected SonicWALL appliance(s). These reports include web sites blocked by the Content Filter List, customized keyword filtering, and domain name filtering.
Web filter reports can be used to view blocked site access attempts by the hour, day, or over a period of
days. Additionally, you can view the users that most frequently attempt to access blocked sites and the
most popular blocked sites.
Note: The single firewall report appears in the firewall's local time. The aggregate multi-firewall report
appears in Universal Time, Coordinated (UTC) or Greenwich Mean Time (GMT).
Select from the following:
• To view a summary of the blocked site access attempts, see “Viewing the Web Filter Summary
Report” on page 72.
• To view a list of the blocked sites that users attempted to access most often, see “Viewing the Web
Filter Top Sites Report” on page 73.
• To view the users who made the most attempts to access blocked sites, see “Viewing the Top Users
that Try to Access Blocked Sites” on page 75.
• To view the top blocked sites that each user attempted to access, see “Viewing the Top Blocked Sites
for Each User” on page 77.
Viewing Reports 71
Page 72

• To view blocked site access attempts over a period of time, see “Viewing Blocked Site Attempts Over
Time” on page 79.
• To view a list of the blocked sites that users attempted to access most often over time, see “Viewing
Blocked Site Attempts Over Time” on page 79.
• To view the users who made the most attempts to access blocked sites over time, see “Viewing the
Top Blocked Site Users Over Time” on page 83.
• To view the top blocked sites that each user attempted to access over time, see “Viewing the Top
Blocked Sites for Each User Over Time” on page 85.
Viewing the Web Filter Summary Report
The Web Filter Summary report contains information on the number of times users attempt to access
blocked sites for the specified day.
To view the Web Filter Summary report, follow these steps:
1. Start and log into SonicWALL ViewPoint.
2. Click the Reports tab.
3. Select the global icon, a group, or a SonicWALL appliance.
4. Expand the Web Filter tree and click Summary. The Summary page appears.
5. The bar graph displays the number of blocked sites that users attempted to access during each hour of
the day.
72 SonicWALL ViewPoint User Guide
Page 73
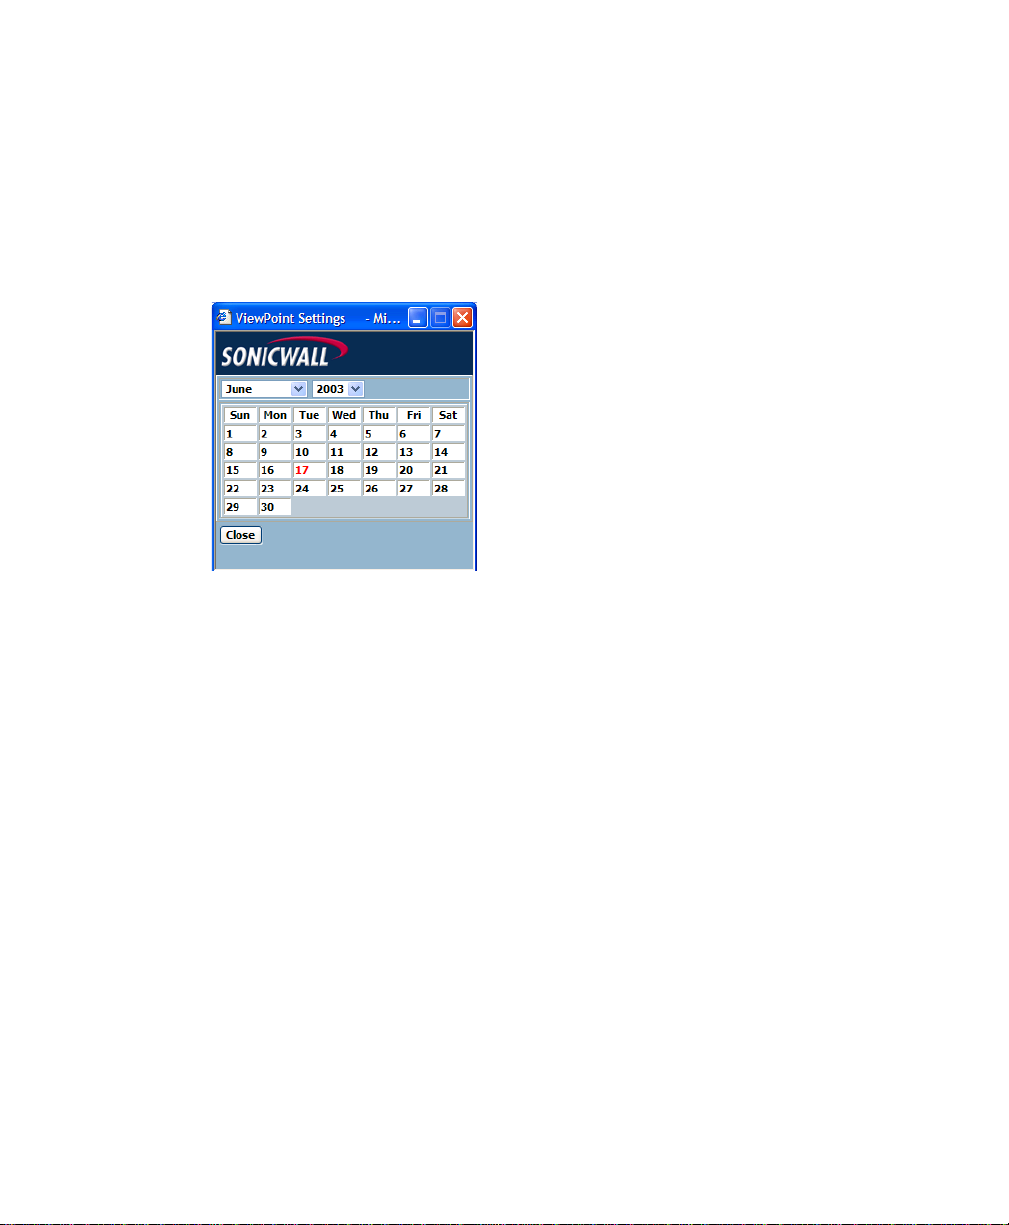
6. The table contains the following information:
• Hour—time when the sample was taken.
• Attempts—number of attempts to access blocked sites.
• % of Attempts—percentage of attempts during this hour, compared to the day. For example, if
100 attempts occurred during the day and 20 attempts occurred at the 12:00 time period, the % of
Attempts field will display 20%.
7. SonicWALL ViewPoint shows today’s report. To change the date of the report, click Settings. The
Report Settings dialog box appears.
8. Select the year, month, and day to view.
9. When you are finished, click Close. SonicWALL ViewPoint displays the report for the selected day.
Viewing the Web Filter Top Sites Report
The Web Filter Top Sites report displays the top blocked web sites that users attempted to access on the
specified date.
To view the Top Sites report, follow these steps:
1. Start and log into SonicWALL ViewPoint.
2. Click the Reports tab.
3. Select a SonicWALL appliance.
Viewing Reports 73
Page 74

4. Expand the Web Filter tree and click Top Sites. The Top Sites page appears.
5. The graph provides a display of the number of access attempts for each of the top twenty blocked web
sites.
6. The table contains the following information:
• Site—URL or IP address of the site.
• Attempts—number of attempts.
• % of Attempts—percentage of attempts to access the blocked site, compared to all other blocked
site attempts. For example, if 500 attempts were made during the day and 100 of those attempts
were for www.badsite.com, its % of Attempts field will display 20%.
74 SonicWALL ViewPoint User Guide
Page 75
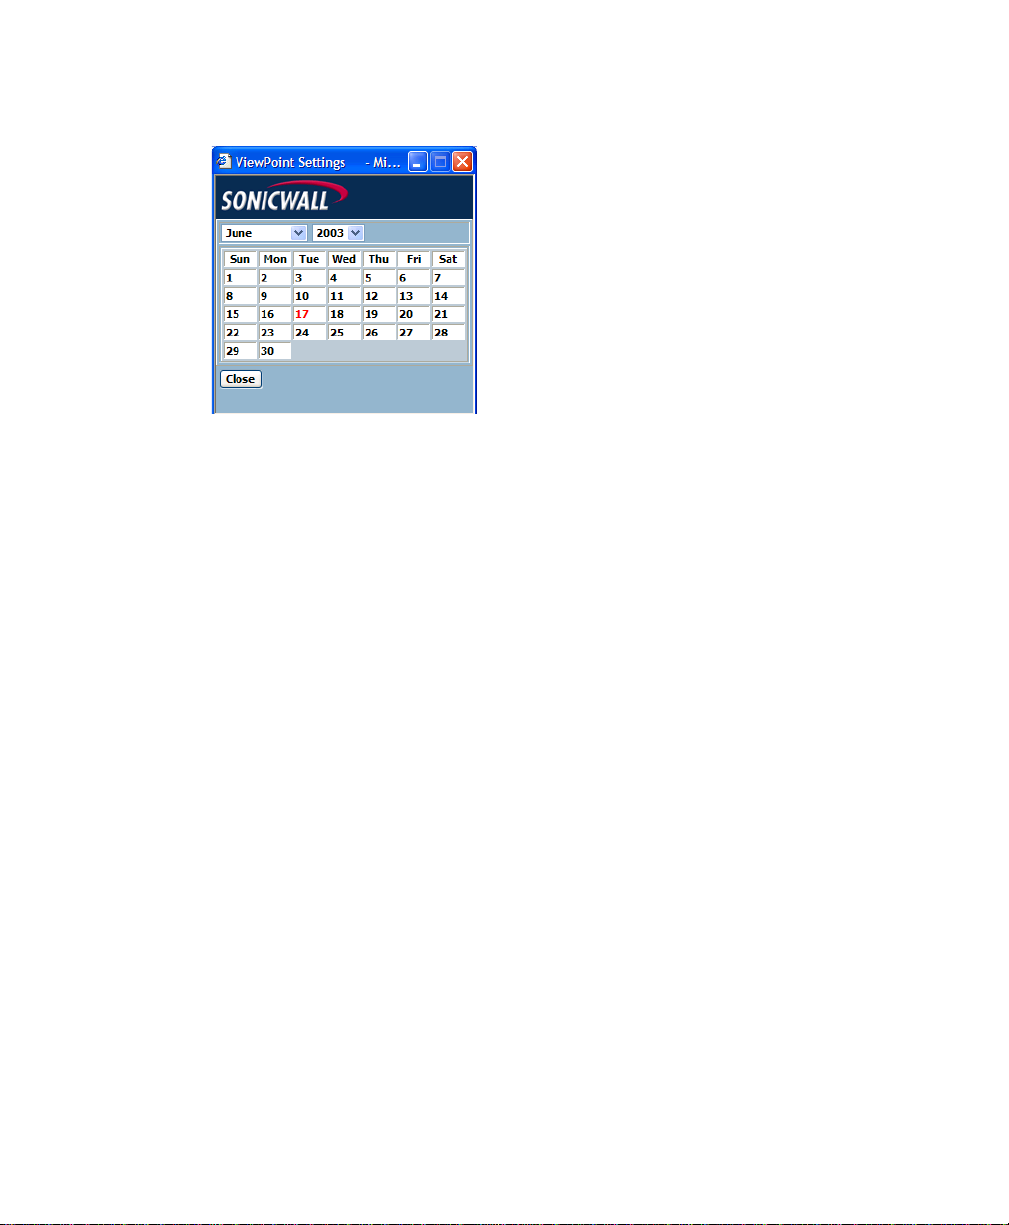
7. SonicWALL ViewPoint shows today’s report. To change the date of the report, click Settings. The
Report Settings dialog box appears.
8. Select the year, month, and day to view.
9. When you are finished, click Close. SonicWALL ViewPoint displays the report for the selected day.
Viewing the Top Users that Try to Access Blocked Sites
The Web Filter Top Users report displays the users who made the most attempts to access blocked sites
on the specified date.
To view the Top Users report, follow these steps:
1. Start and log into SonicWALL ViewPoint.
2. Click the Reports tab.
3. Select a SonicWALL appliance.
Viewing Reports 75
Page 76

4. Expand the Web Filter tree and click Top Use r s . The Top Users page appears.
5. The pie chart displays the top users with the most blocked site attempts.
6. The table contains the following information:
• Users—the IP address of the user.
• Attempts—number of attempts.
• % of Attempts—percentage of attempts to access the blocked site, compared to all other user
attempts. For example, if 500 attempts were made during the day and 250 of those attempts were
made by a single user, his % of Attempts field will display 50%.
76 SonicWALL ViewPoint User Guide
Page 77
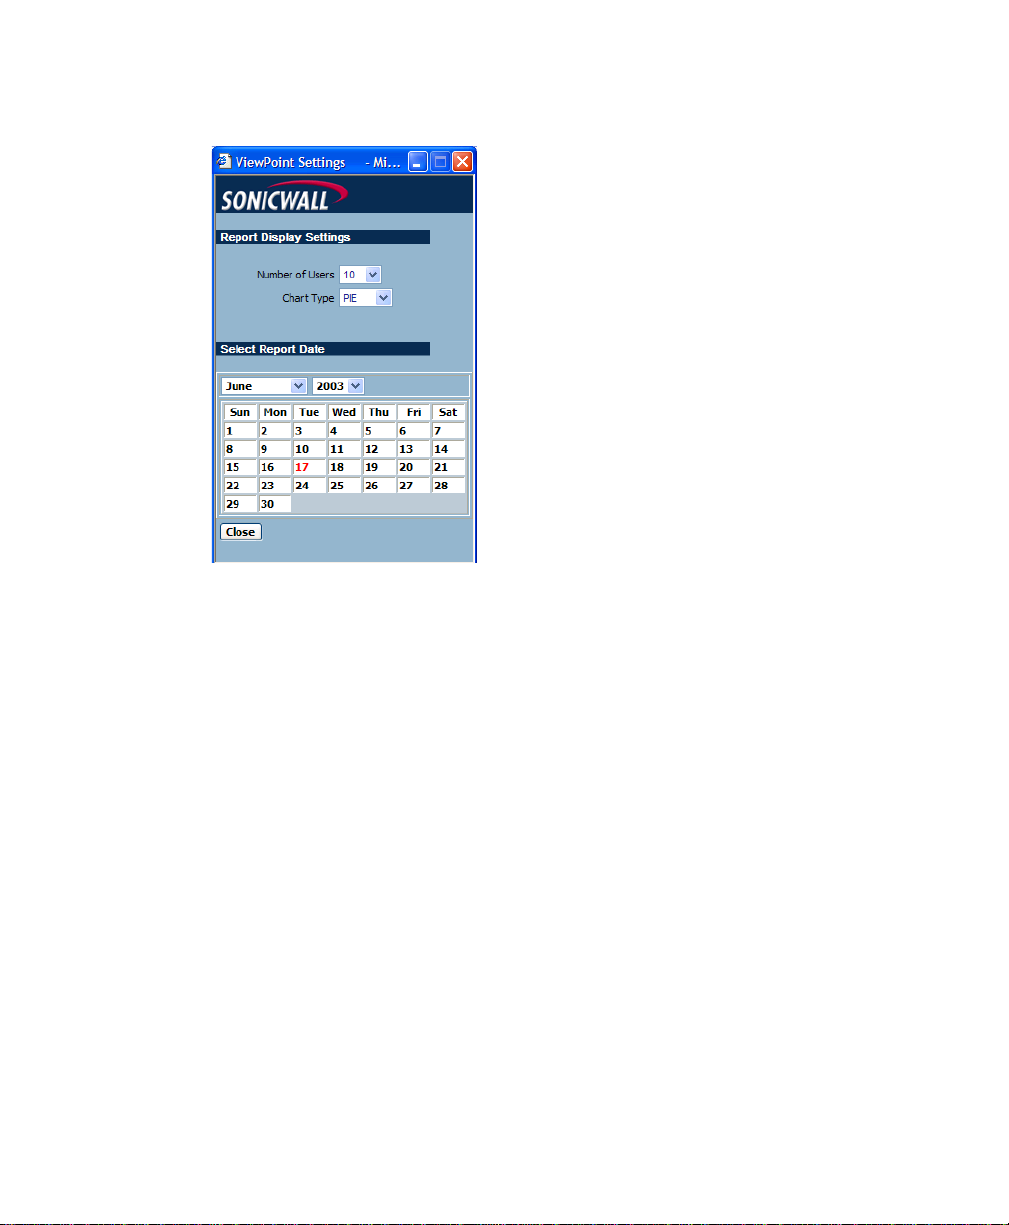
7. By default, GMS Reporting shows today’s report, a pie chart, and the ten top users. To change these
settings, click Settings. The Report Settings dialog box appears.
8. Select the number of users to display from the Number of Users list box.
9. Select the type of chart from the Chart Type list box.
10.Select the year, month, and day to view.
11.When you are finished, click Close. SonicWALL ViewPoint displays the report for the selected day.
Note: These settings stay in effect for all reports during your active login session. Once you log out,
the settings will be reset to the default values embedded in the software.
Viewing the Top Blocked Sites for Each User
The Web Filter By User report displays the top blocked web sites that each user attempted to access on
the specified date.
To view the Web Filter By User report, follow these steps:
1. Start and log into SonicWALL ViewPoint.
2. Click the Reports tab.
3. Select a SonicWALL appliance.
Viewing Reports 77
Page 78
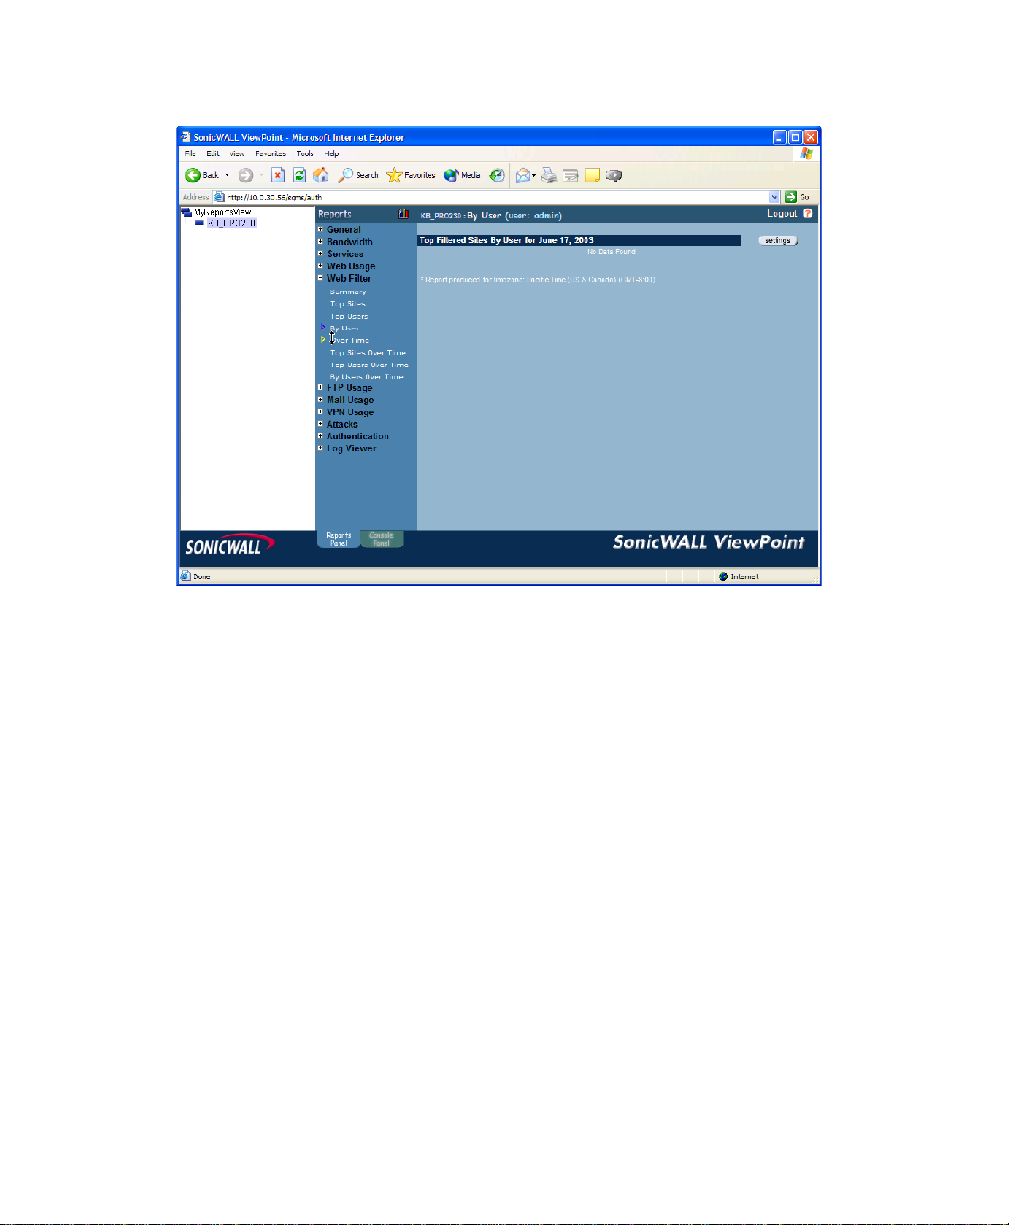
4. Expand the Web Filter tree and click By User. The By User page appears.
5. The table contains the following information:
• User—the IP address of the user.
• Site—the top five sites visited by the user.
• Attempts—number of attempts the user made to access each web site.
78 SonicWALL ViewPoint User Guide
Page 79

6. By default, SonicWALL ViewPoint shows today’s report, a pie chart, and the ten top users. To change
these settings, click Settings. The Report Settings dialog box appears.
7. Select the number of users to display from the Number of Users list box.
8. Select the type of chart from the Chart Type list box.
9. Select the year, month, and day to view.
10.When you are finished, click Close. SonicWALL ViewPoint displays the report for the selected day.
Note: These settings stay in effect for all reports during your active login session. Once you log out,
the settings will be reset to the default values embedded in the software.
Viewing Blocked Site Attempts Over Time
The Web Filter Over Time report displays the number of attempts that were made to access blocked web
sites for the specified time period.
To view the Web Filter Over Time report, follow these steps:
1. Start and log into SonicWALL ViewPoint.
2. Click the Reports tab.
3. Select the global icon, a group, or a SonicWALL appliance.
Viewing Reports 79
Page 80

4. Expand the Web Filter tree and click Over Time. The Over Time page appears.
5. The bar graph displays the number of attempts that were made to access blocked web sites during
each day of the specified time period.
6. The table contains the following information:
• Date—day when the sample was taken.
• Attempts—number of attempts to access blocked web sites.
• % of Attempts—percentage of attempts to access the blocked site on the day, compared to the
time period. For example, if 5,000 attempts were made during the time period and 500 were made
on one day, its % of Attempts field will display 10%.
80 SonicWALL ViewPoint User Guide
Page 81

7. To change the date range of the report, click Settings. The Reporting Date Range Selector dialog box
appears.
8. Select the starting and ending dates to view.
9. When you are finished, click Close. SonicWALL ViewPoint displays the report for the selected date
range.
Note: These settings stay in effect for all reports during your active login session. Once you log out,
the settings will be reset to the default values embedded in the software.
Viewing the Top Blocked Site Attempts Over Time
The Top Sites Over Time report displays the top blocked web sites for the specified time period.
To view the Web Filter Over Time report, follow these steps:
1. Start and log into SonicWALL ViewPoint.
2. Click the Reports tab.
3. Select a SonicWALL appliance.
Viewing Reports 81
Page 82
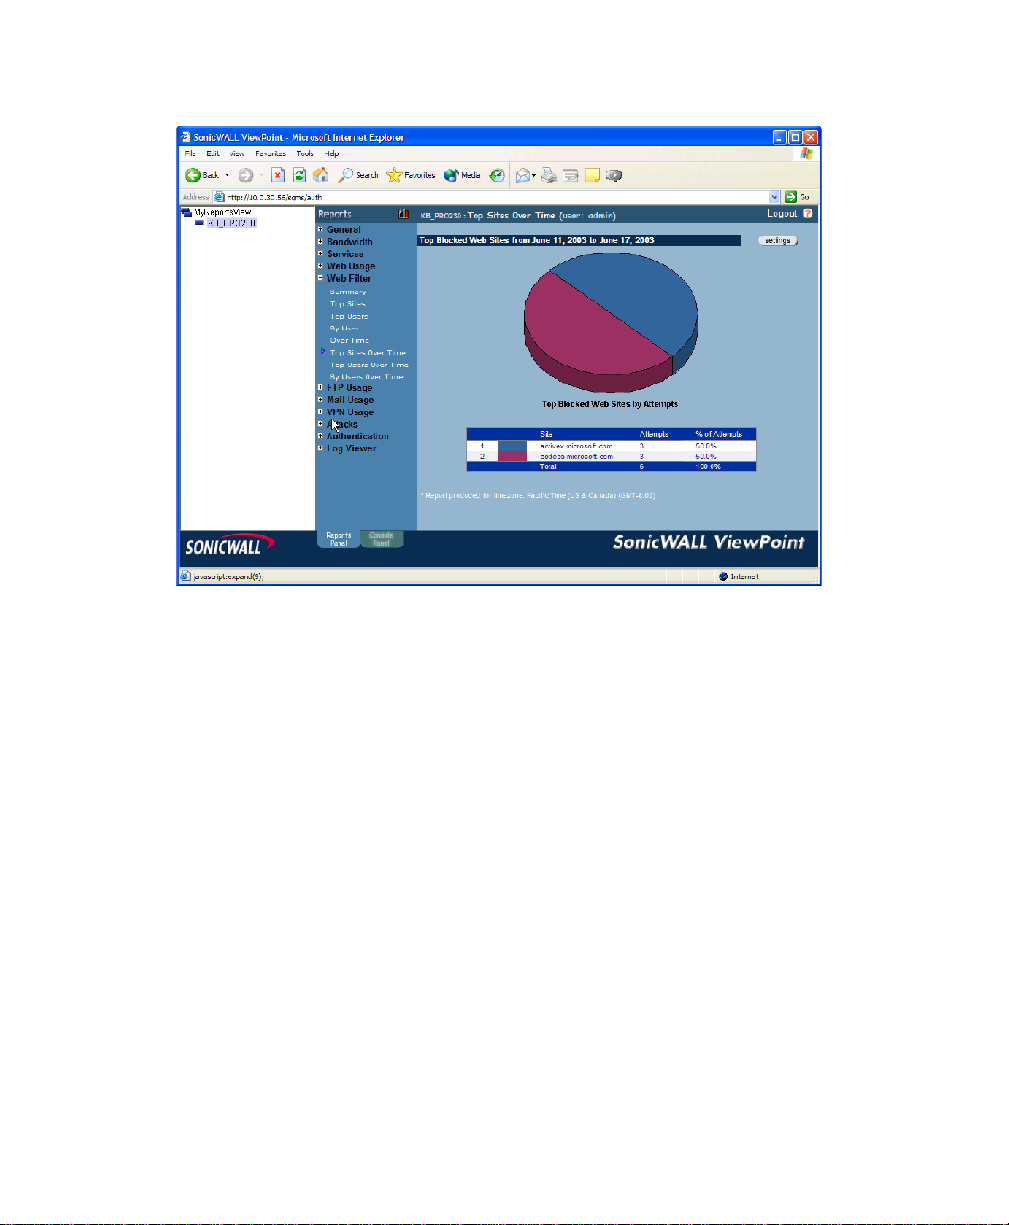
4. Expand the Web Filter tree and click Top Sites Over Time. The Top Sites Over Time page appears.
5. The graph displays the number of access attempts for each of the top blocked web sites during the
specified time period.
6. The table contains the following information:
• Site—URL or IP address of the site.
• Attempts—number of attempts.
• % of Attempts—percentage of attempts to access the blocked site, compared to all other blocked
site attempts. For example, if 500 attempts were made during the period and 100 of those
attempts were for www.badsite.com, its % of Attempts field will display 20%.
82 SonicWALL ViewPoint User Guide
Page 83

7. To change the date range of the report, click Settings. The Reporting Date Range Selector dialog box
appears.
8. Select the starting and ending dates to view.
9. When you are finished, click Close. SonicWALL ViewPoint displays the report for the selected date
range.
Note: These settings stay in effect for all reports during your active login session. Once you log out,
the settings will be reset to the default values embedded in the software.
Viewing the Top Blocked Site Users Over Time
The Web Filter Top Users Over Time report displays the users who made the most attempts to access
blocked sites during the specified time period.
To view the Top Users Over Time report, follow these steps:
1. Start and log into SonicWALL ViewPoint.
2. Click the Reports tab.
3. Select a SonicWALL appliance.
Viewing Reports 83
Page 84

4. Expand the Web Filter tree and click Top U s e rs O v er T i m e . The Top Users Over Time page appears.
5. The pie chart displays the top users with the most blocked site attempts.
6. The table contains the following information:
• Users—the IP address of the user.
• Attempts—number of attempts.
• % of Attempts—percentage of attempts to access the blocked site, compared to all other user
attempts. For example, if 500 attempts were made during the period and 250 of those attempts
were made by a single user, his % of Attempts field will display 50%.
84 SonicWALL ViewPoint User Guide
Page 85

7. To change the date range of the report, click Settings. The Reporting Date Range Selector dialog box
appears.
8. Select the starting and ending dates to view.
9. When you are finished, click Close. SonicWALL ViewPoint displays the report for the selected date
range.
Note: These settings stay in effect for all reports during your active login session. Once you log out,
the settings will be reset to the default values embedded in the software.
Viewing the Top Blocked Sites for Each User Over Time
The Web Filter By User report displays the top blocked web sites that each user attempted to access during the specified time period.
To view the By User Over Time report, follow these steps:
1. Start and log into SonicWALL ViewPoint.
2. Click the Reports tab.
3. Select a SonicWALL appliance.
Viewing Reports 85
Page 86

4. Expand the Web Filter tree and click By User Over Time. The By User Over Time page appears.
5. The table contains the following information:
• User—the IP address of the user.
• Site—the top five sites visited by the user.
• Attempts—number of attempts the user made to access each web site.
86 SonicWALL ViewPoint User Guide
Page 87

6. To change the date range of the report, click Settings. The Reporting Date Range Selector dialog box
appears.
7. Select the starting and ending dates to view.
8. When you are finished, click Close. SonicWALL ViewPoint displays the report for the selected date
range.
Note: These settings stay in effect for all reports during your active login session. Once you log out,
the settings will be reset to the default values embedded in the software.
Viewing File Transfer Protocol Reports
FTP usage reports provide information on the amount of FTP usage that occurs through the selected SonicWALL appliance(s).
FTP usage reports can be used to view FTP bandwidth usage by the hour, day, or over a period of days.
Additionally, you can view the top users of FTP bandwidth.
General bandwidth reports do not always provide a complete picture of network bandwidth usage. If a
large amount of FTP traffic occurs during peak times, you might need more bandwidth, you might need
to upgrade network equipment, or you might ask employees to use compression or transfer large files during non-peak times.
Note: The single firewall report appears in the firewall's local time. The aggregate multi-firewall report
appears in Universal Time, Coordinated (UTC) or Greenwich Mean Time (GMT).
Select from the following:
• To view a summary of the daily FTP bandwidth usage, see “Viewing the FTP Summary Report” on
page 88.
• To view the users who consume the most FTP bandwidth, see “Viewing the Top Users of FTP Bandwidth” on page 89.
Viewing Reports 87
Page 88

• To view FTP bandwidth usage over a period of time, see “Viewing FTP Bandwidth Usage Over
Time” on page 91.
• To view the users who consume the most FTP bandwidth over time, see “Viewing FTP Bandwidth
Usage Over Time” on page 91.
Viewing the FTP Summary Report
The FTP Summary report contains information on the amount of FTP bandwidth handled by a SonicWALL appliance or group of SonicWALL appliances during the specified day.
To view the FTP Summary report, follow these steps:
1. Start and log into SonicWALL ViewPoint.
2. Click the Reports tab.
3. Select the global icon, a group, or a SonicWALL appliance.
4. Expand the FTP Usage tree and click Summary. The Summary page appears.
5. The bar graph displays the amount of FTP bandwidth transferred during each hour of the day.
6. The table contains the following information:
• Hour—when the sample was taken.
• Events—number of FTP events.
• MBytes—number of megabytes transferred.
88 SonicWALL ViewPoint User Guide
Page 89

• % of MBytes—percentage of megabytes transferred during this hour, compared to the day. For
example, if 1000 megabytes of FTP data was transferred during the day and 100 megabytes was
transferred at the 12:00 time period, the % of MBytes field will display 10%.
7. SonicWALL ViewPoint shows today’s report. To change the date of the report, click Settings. The
Report Settings dialog box appears.
8. Select the year, month, and day to view.
9. When you are finished, click Close. SonicWALL ViewPoint displays the report for the selected day.
Viewing the Top Users of FTP Bandwidth
The Top Users report displays the users who used the most FTP bandwidth on the specified date.
To view the Top Users report, follow these steps:
1. Start and log into SonicWALL ViewPoint.
2. Click the Reports tab.
3. Select a SonicWALL appliance.
Viewing Reports 89
Page 90
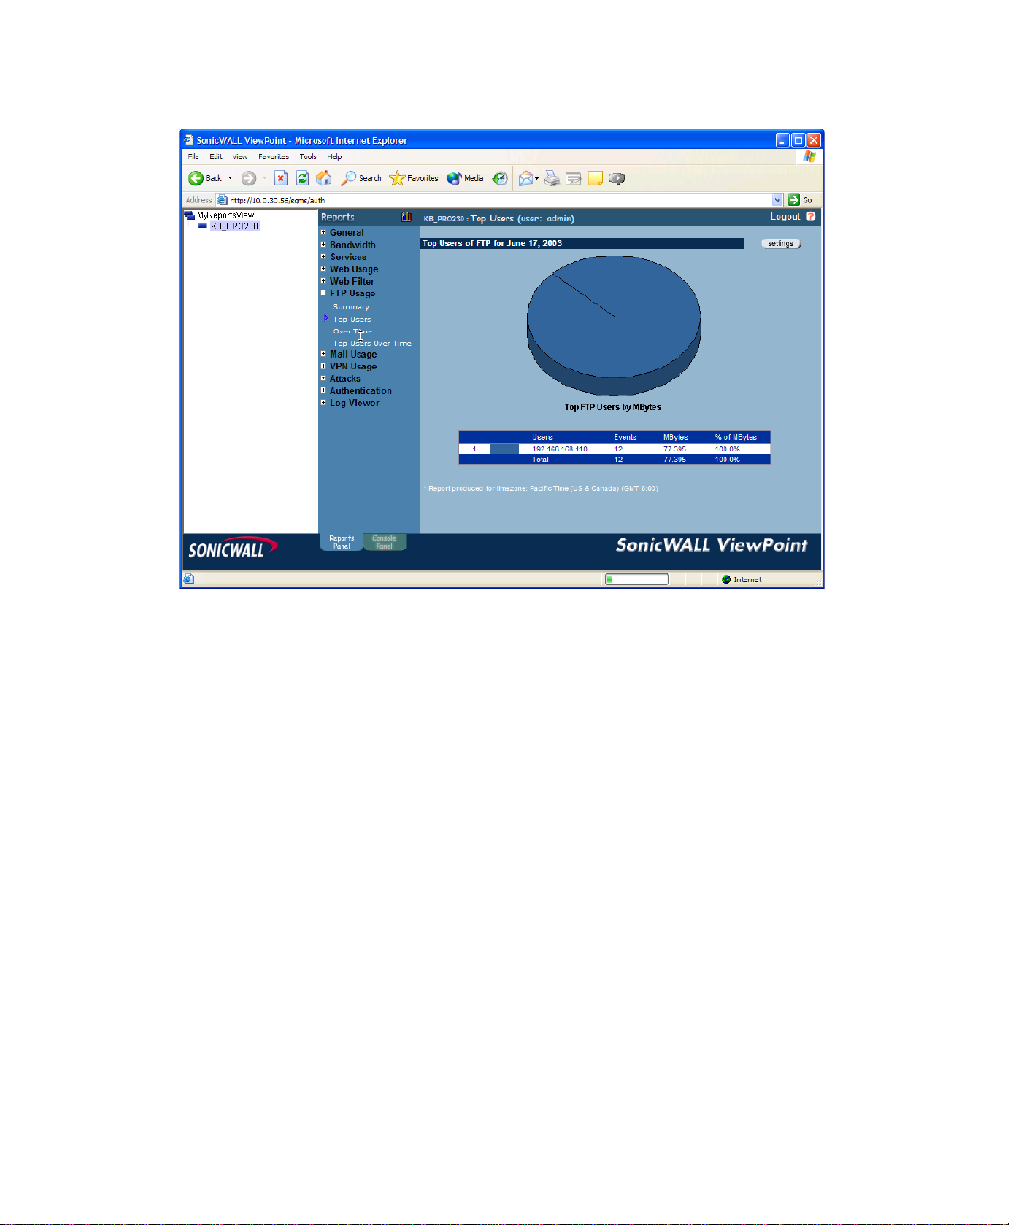
4. Expand the FTP Usage tree and click Top U sers . The Top Users page appears.
5. The pie chart displays the percentage of bandwidth used by each user.
6. The table contains the following information:
• Users—the IP address of the user.
• Events—number of FTP Events.
• MBytes—number of megabytes transferred.
• % of MBytes—percentage of megabytes transferred by this user, compared to all users. For
example, if ten megabytes of data was transferred during the day and two megabytes was transferred by the top user, the % of Mbytes field will display 20%.
90 SonicWALL ViewPoint User Guide
Page 91

7. By default, SonicWALL ViewPoint shows today’s report, a pie chart, and the ten top users. To change
these settings, click Settings. The Report Settings dialog box appears.
8. Select the number of users to display from the Number of Users list box.
9. Select the type of chart from the Chart Type list box.
10.Select the year, month, and day to view.
11.When you are finished, click Close. SonicWALL ViewPoint displays the report for the selected day.
Note: These settings stay in effect for all reports during your active login session. Once you log out,
the settings will be reset to the default values embedded in the software.
Viewing FTP Bandwidth Usage Over Time
The FTP Usage Over Time report displays the daily amount of FTP bandwidth handled by a SonicWALL
appliance or group of SonicWALL appliances for the specified time period.
To view the FTP Usage Over Time report, follow these steps:
1. Start and log into SonicWALL ViewPoint.
2. Click the Reports tab.
3. Select the global icon, a group, or a SonicWALL appliance.
Viewing Reports 91
Page 92

4. Expand the FTP Usage tree and click Over Time. The Over Time page appears.
5. The bar graph displays the amount of FTP bandwidth transferred during each day of the specified
time period.
6. The table contains the following information:
• Date—when the sample was taken.
• Connections—number of FTP connections.
• MBytes—number of megabytes transferred.
• % of Usage—percentage of megabytes transferred during this day, compared to the time period.
For example, if 10,000 megabytes of FTP data was transferred during the time period and 2,500
megabytes of FTP data was transferred on one day, the % of Usage field will display 25%.
92 SonicWALL ViewPoint User Guide
Page 93

7. To change the date range of the report, click Settings. The Reporting Date Range Selector dialog box
appears.
8. Select the starting and ending dates to view.
9. When you are finished, click Close. SonicWALL ViewPoint displays the report for the selected date
range.
Note: These settings stay in effect for all reports during your active login session. Once you log out,
the settings will be reset to the default values embedded in the software.
Viewing the Top Users of FTP Bandwidth Over Time
The Top Users Over Time report displays the users who used the most FTP bandwidth for the specified
time period.
To view the Top Users Over Time report, follow these steps:
1. Start and log into SonicWALL ViewPoint.
2. Click the Reports tab.
3. Select a SonicWALL appliance.
Viewing Reports 93
Page 94
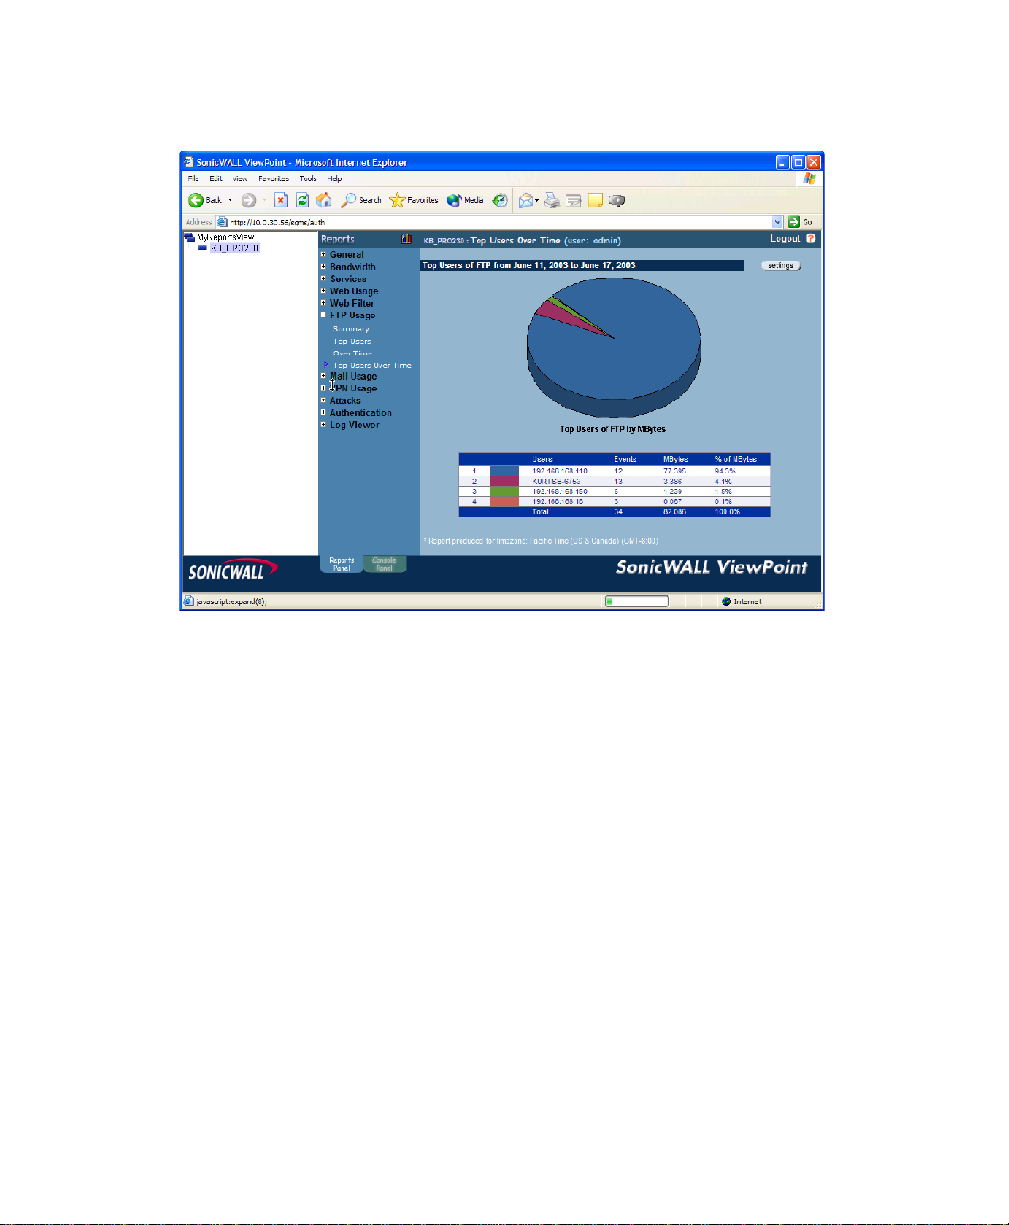
4. Expand the FTP Usage tree and click Top Users Over Time. The Top Users Over Time page
appears.
5. The pie chart displays the percentage of bandwidth used by each user.
6. The table contains the following information:
• Users—the IP address of the user.
• Events—number of FTP Events.
• MBytes—number of megabytes transferred.
• % of MBytes—percentage of megabytes transferred by this user, compared to all users. For
example, if ten megabytes of data was transferred during the period and two megabytes was
transferred by the top user, the % of MBytes field will display 20%.
94 SonicWALL ViewPoint User Guide
Page 95

7. To change the date range of the report, click Settings. The Reporting Date Range Selector dialog box
appears.
8. Select the starting and ending dates to view.
9. When you are finished, click Close. SonicWALL ViewPoint displays the report for the selected date
range.
Note: These settings stay in effect for all reports during your active login session. Once you log out,
the settings will be reset to the default values embedded in the software.
Viewing Mail Usage Reports
Mail usage reports provide information on the amount of mail usage that occurs through the selected SonicWALL appliance(s).
Mail usage reports can be used to view mail bandwidth usage by the hour, day, or over a period of days.
Additionally, you can view the top users of mail bandwidth.
Note: Mail usage reports include SMTP, POP3, and IMAP traffic.
General bandwidth reports do not always provide a complete picture of network bandwidth usage. If a
large amount of mail traffic occurs during peak times, you might want to take some of the following
actions:
• Add bandwidth
• Upgrade network equipment
• Ask employees to use compression or transfer large files during non-peak times
• Ask employees to place large files on an FTP site rather than sending them as mail attachments.
Note: The single firewall report appears in the firewall's local time. The aggregate multi-firewall report
appears in Universal Time, Coordinated (UTC) or Greenwich Mean Time (GMT).
Select from the following:
Viewing Reports 95
Page 96

• To view a summary of the daily mail usage, see “Viewing the Mail Usage Summary Report” on
page 96.
• To view the users who consume the most mail bandwidth, see “Viewing the Top Users of Mail Bandwidth” on page 97.
• To view mail usage over a period of time, see “Viewing Mail Usage Over Time” on page 99.
• To view the users who consume the most mail bandwidth over time, see “Viewing the Top Users of
Mail Bandwidth Over Time” on page 101.
Viewing the Mail Usage Summary Report
The Mail Usage Summary report contains information on the amount of mail handled by a SonicWALL
appliance or group of SonicWALL appliances during the specified day.
To view the Mail Usage Summary report, follow these steps:
1. Start and log into SonicWALL ViewPoint.
2. Click the Reports tab.
3. Select the global icon, a group, or a SonicWALL appliance.
4. Expand the Mail Usage tree and click Summary. The Summary page appears.
5. The bar graph displays the amount of mail sent and received during each hour of the day.
6. The table contains the following information:
96 SonicWALL ViewPoint User Guide
Page 97

• Hour—when the sample was taken.
• Events—number of mail events.
• MBytes—number of megabytes transferred.
• % of MBytes—percentage of megabytes transferred during this hour, compared to the day. For
example, if 10,000 megabytes of mail was transferred during the day and 1,000 megabytes was
transferred at the 12:00 time period, the % of MBytes field will display 10%.
7. SonicWALL ViewPoint shows today’s report. To change the date of the report, click Settings. The
Report Settings dialog box appears.
8. Select the year, month, and day to view.
9. When you are finished, click Close. SonicWALL ViewPoint displays the report for the selected day.
Viewing the Top Users of Mail Bandwidth
The Top Users report displays the users who sent and received the most mail on the specified date.
To view the Top Users report, follow these steps:
1. Start and log into SonicWALL ViewPoint.
2. Click the Reports tab.
3. Select a SonicWALL appliance.
Viewing Reports 97
Page 98

4. Expand the Mail Usage tree and click Top U se rs. The Top Users page appears.
5. The pie chart displays the percentage of mail sent and received by the top mail users.
6. The table contains the following information:
• Users—the IP address of the user.
• Events—number of mail messages sent and received.
• MBytes—number of megabytes transferred.
• % of MBytes—percentage of megabytes transferred by this user, compared to all users. For
example, if 10000 megabytes of data was transferred during the day and 2000 megabytes was
transferred by the top user, the % of MBytes field will display 20%.
98 SonicWALL ViewPoint User Guide
Page 99

7. By default, SonicWALL ViewPoint shows today’s report, a pie chart, and the ten top users. To change
these settings, click Settings. The Report Settings dialog box appears.
8. Select the number of users to display from the Number of Users list box.
9. Select the type of chart from the Chart Type list box.
10.Select the year, month, and day to view.
11.When you are finished, click Close. SonicWALL ViewPoint displays the report for the selected day.
Note: These settings stay in effect for all reports during your active login session. Once you log out,
the settings will be reset to the default values embedded in the software.
Viewing Mail Usage Over Time
The Mail Usage Over Time report displays the daily amount of mail handled by a SonicWALL appliance
or group of SonicWALL appliances for the specified time period.
To view the Mail Usage Over Time report, follow these steps:
1. Start and log into SonicWALL ViewPoint.
2. Click the Reports tab.
3. Select the global icon, a group, or a SonicWALL appliance.
Viewing Reports 99
Page 100

4. Expand the Mail Usage tree and click Over Time. The Over Time page appears.
5. The bar graph displays the amount of mail sent and received during each day of the specified time
period.
6. The table contains the following information:
• Date—when the sample was taken.
• Connections—number of mail messages.
• MBytes—number of megabytes transferred.
• % of Usage—percentage of megabytes transferred during this day, compared to the time period.
For example, if 10,000 megabytes of mail was transferred during the time period and 2,500
megabytes of mail was transferred on one day, the % of Usage field will display 25%.
100 SonicWALL ViewPoint User Guide
 Loading...