

Page 1

Capture Client
Activities, Logs, and Reports
Administration Guide
Page 2

Contents
Overview 3
Navigation 3
Description 5
Guide Conventions 5
About Web Activities 7
Web Activity Events 7
Web Activity Blocked Sites 8
Logs 10
Management Logs 10
Device Logs 11
Reports 12
Generating Reports 12
Scheduling Reports 13
Available Reports 14
Request Report 15
Schedule Reports 16
SonicWall Support 19
About This Document 20
Capture Client Activities, Logs, and Reports Administration Guide
Contents
2
Page 3

1
Overview
SonicWall®Capture Client provides a framework for managing and enforcing policy across endpoints in your
IT infrastructure. It shows you the level of coverage you have and the gaps that need to be plugged. This
document describes how to monitor the various kinds of data provided so you can follow up with the
appropriate action. These include:
l Web Activity Events
l Activities and Logs
l Reports
This section provides general information about Capture Client and includes the following:
l Description
l Navigation
l Guide Conventions
Navigation
When logging in to Capture Client for the first time, the Dashboard is the default view. If one of your tenants
is selected, you can get a quick summary of the number of infected devices, actives threats and critical
issues. You can also see a series of tiles showing the top items in each category. By scrolling down on the
Dashboard, you can see a summary of issues by group.
Capture Client Activities, Logs, and Reports Administration Guide
Overview
3
Page 4
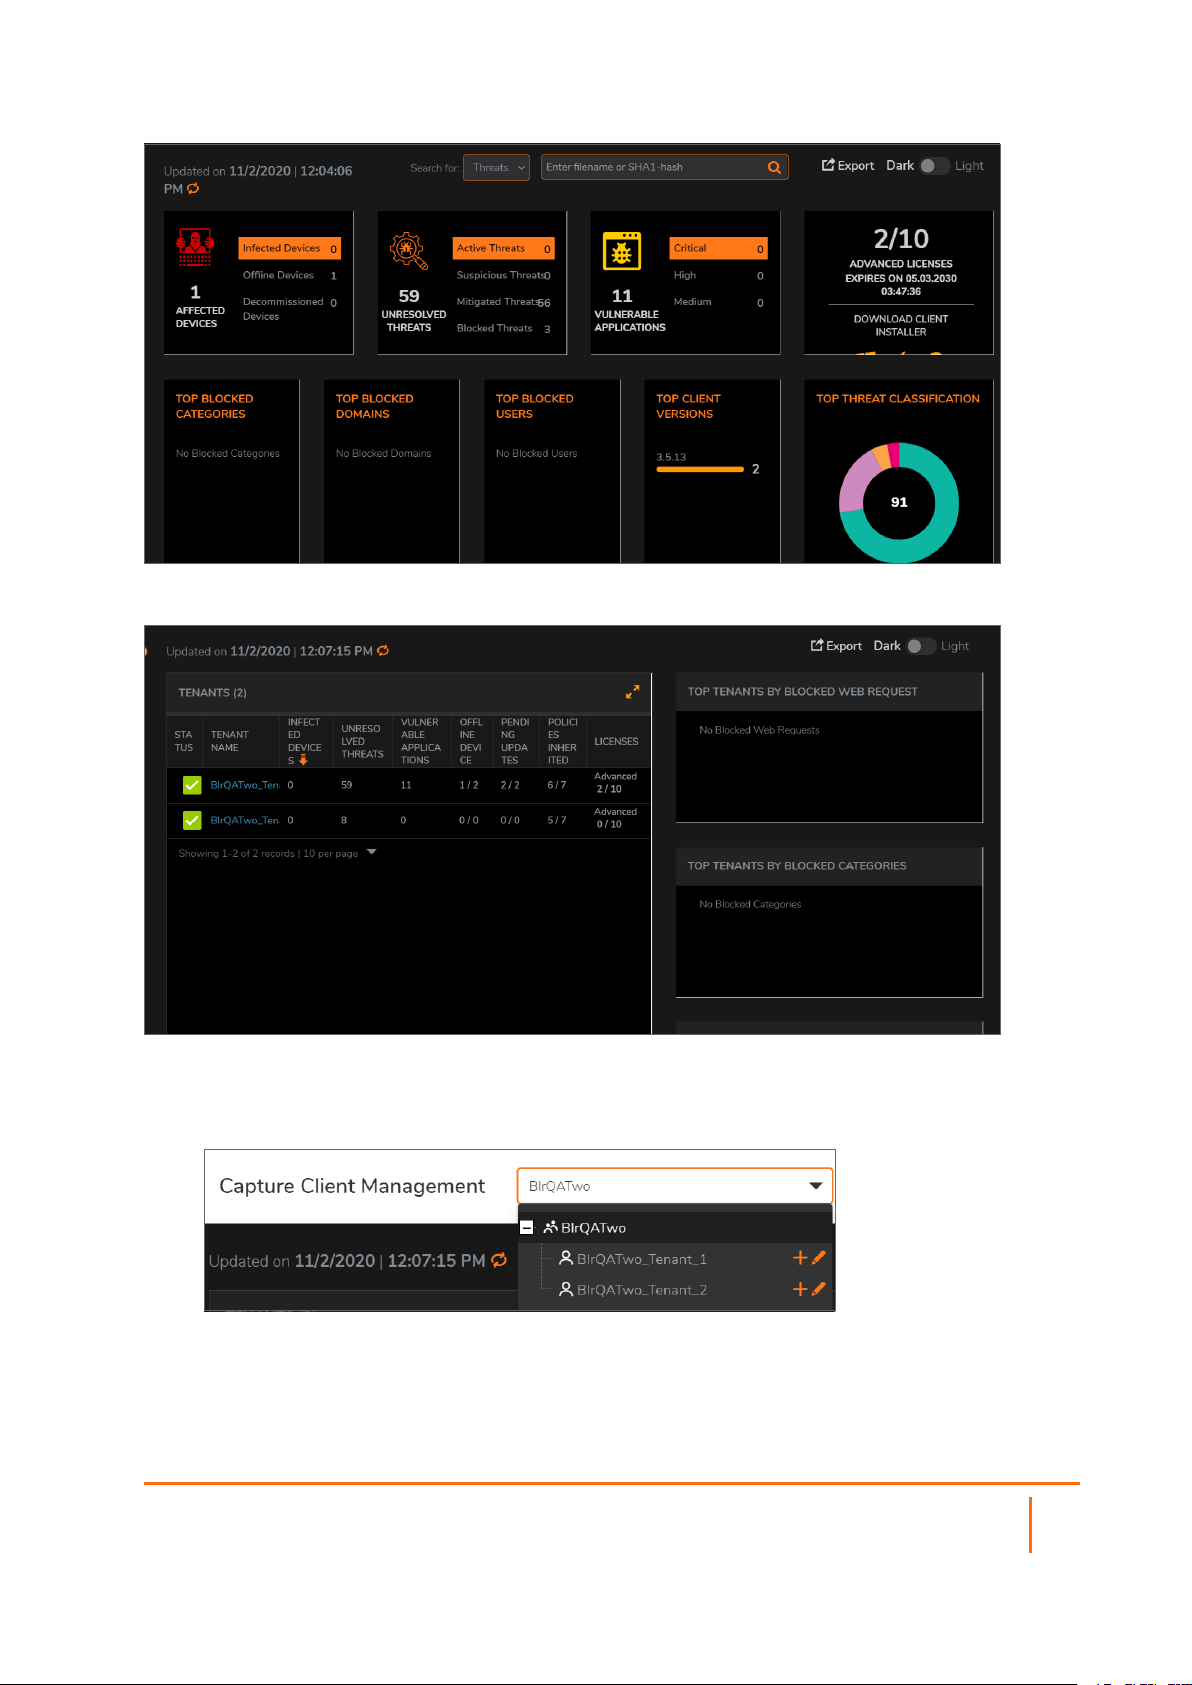
If the account is selected, the Dashboard information is summarized by tenants.
To change to the account/tenant option:
1.
Click the drop-down list, next to Capture Client Management, at the top of the page.
2.
Select the account or tenant view that you want.
Capture Client Activities, Logs, and Reports Administration Guide
Overview
4
Page 5

Description
SonicWall Capture Client is a client offering that delivers multiple client protection capabilities. With a nextgeneration malware protection engine powered by SentinelOne, the SonicWall Capture Client delivers
advanced threat protection with these key features:
l Continuous behavioral monitoring of the client that helps create a complete profile of file activity,
application & process activity, and network activity. This protects against both file-based and fileless
malware and delivers a 360⁰ attack view with actionable intelligence relevant for investigations.
l Multiple layered signatureless techniques include techniques for protecting cloud intelligence,
advanced static analysis and dynamic behavioral protection. They help protect against and
remediate well known, little known, and even unknown malware, without regular scans or periodic
updates. This maintains the highest level of protection at all times, without hampering user
productivity.
l Unique roll-back capabilities support policies that not only remove the threat completely but also
restore a targeted client to its original state, before the malware activity started. This removes the
effort of manual restoration in the case of ransomware and similar attacks.
l Cloud-based management console reduces the footprint and overhead of management. It
improves the deployability and enforceability of Endpoint Protection, irrespective of where the
endpoint is.
The size of your Capture Client tenancy is only limited by the number of endpoint licenses procured.
Guide Conventions
The following conventions are used in this guide:
Convention Use
Bold Text Used in procedures to identify
elements in the user interface
like dialog boxes, windows,
screen names, and buttons.
Also used for file names and
text or values you are being
instructed to select or type into
the interface.
Menu divider | Menu item > Menu item Indicates a multiple step menu
choice on the user interface.
For example, System Setup |
Users, Groups & Organizations
> Users means find the menu
or section divider System
Setup first, select Users,
Groups & Organizations, and
then select Users.
Computer code
Indicates sample code or text
to be typed at a command line.
Capture Client Activities, Logs, and Reports Administration Guide
Overview
5
Page 6

<Computer code italic>
Represents a variable name
when used in command line
instructions within the angle
brackets. The variable name
and angle brackets need to be
replaced with an actual value.
For example in the segment
serialnumber=<your serial
number>, replace the variable
and brackets with the serial
number from your device:
serialnumber=C0AEA0000011.
Italic Indicates the name of a
technical manual. Also
indicates emphasis on certain
words in a sentence, such as
the first instance of a
significant term or concept.
Capture Client Activities, Logs, and Reports Administration Guide
Overview
6
Page 7

About Web Activities
You can perform web content filtering with Capture Client’s policy management. You can configure policies
that allow or block access to various websites. This allows endpoint security and content filtering to be
managed from the same management console, simplifying administration. Refer to Capture
Client:Protecting Assets with Security Policies for more information on how to set up the web content
filtering.
NOTE: To configure web content filtering, the Capture Client Advanced License is required.
The web-activity reporting is a feature provided for easier monitoring. More details are provided in the
following sections:
l Web Activity Events
l Web Activity Blocked Sites
2
Web Activity Events
The Web Activity page provides analytics options you can use to evaluate various kinds of web actions. The
default view is the Events tab which shows a report for web-related events. The report includes the blocked
web site, the reason it was blocked, how many attempts were made, which device attempted the access,
and the user making the access.
To monitor the Web Activity Events:
1.
Navigate to Web Activity.
2.
Click the Events tab to review individual events triggered by Web Protection engine and Web
Content Filtering policy.
Capture Client Activities, Logs, and Reports Administration Guide
About Web Activities
7
Page 8

3.
To whitelist the websites that are listed in the Events tab and Blocked Web Site list:
a.
Hover over the blocked website and click Add to whitelist icon that appears at the end of the
row.
b.
In the confirmation dialog, select Action Approved, and then click Confirm.
4.
To filter the Blocked Web Site report:
a.
Click the Filter Panel icon.
b.
Select the BLOCK SOURCE options you want to include.
c.
Type the BLOCK REASON in the text field provided. The report is filtered based on the
parameters you provided.
5.
To search for a specific blocked web site, click on the Search icon and enter the text in the field
provided.
6.
Use the slider bar to adjust the period for the report. The options range from last 5 mins to all.
7.
Click the Download icon to download and save the Event list.
Web Activity Blocked Sites
The Blocked Web Sites tab on the Web Activity page provides details you can use to evaluate the blocked
sites. It shows a report that includes the blocked web site, the reason it was blocked, when it was first seen,
when it was last seen and the attempts blocked.
To monitor the Web Activity Blocked Web Sites:
1.
Navigate to Web Activity.
2.
Click the Blocked Web Sites tab, to review statistics for actual malicious websites visited, including
the users attempted to visit them and the number of attempts made.
Capture Client Activities, Logs, and Reports Administration Guide
8
About Web Activities
Page 9

3.
To whitelist the websites that are listed in the Events tab:
a.
Hover over the blocked website and click Add to whitelist icon that appears at the end of the
row.
b.
In the confirmation dialog, select Action Approved, and then click Confirm.
4.
To filter the Blocked Web Site report:
a.
Click the Filter Panel icon.
b.
Select the BLOCK SOURCE options you want to include.
c.
Type the BLOCK REASON in the text field provided. The report is filtered based on the
parameters you provided.
5.
To search for a specific blocked web site, click on the Search icon and enter the text in the field
provided.
6.
Use the slider bar to adjust the period for the report. The options range from last 5 mins to all.
7.
Click the Download icon to download and save the list.
Capture Client Activities, Logs, and Reports Administration Guide
About Web Activities
9
Page 10

Logs
Logs are generated from both Capture Client console and endpoints. Both management logs and device
logs are recorded. Access each by navigating to Activities & Logs > Logs.The Management tab is
displayed by default. Select the Devices tab to see the logs from the endpoints.
3
Topics:
l Management Logs
l Device Logs
Management Logs
The time period for the Management logs can be adjusted by sliding the orange marker along the scale at
the top of the list. The predefined options for the scale ranges from last 5 min to all.
At the top of the page, you can see the icons that allow you to do the following:
l
Filter the list: Click and select the boxes for the Priority options you want to filter on. The
options are Debug, Info, Warning, and Error.
l
Search: Click and enter the search string.
Capture Client Activities, Logs, and Reports Administration Guide
Logs
10
Page 11

l
Email logs: Click and confirm that you want to receive the mails for tenant activity logs.
l
Download logs: Click and confirm that you want to download the tenant logs.
Device Logs
The time period for the Devices logs can be adjusted by sliding the orange marker along the scale at the top
of the list. The predefined options for the scale ranges from last 5 min to all.
At the top of the page, you can see the icons that allow you to:
l
Filter the list: Click and check the boxes for the Priority and Device options you want to filter
on. The Priority options include Emergency, Alert, Critical, Error, Warning, Notice, Info, and
Debug.
l
Detailed view: click to expand the options in the table. Click it again to return to the simple view.
l
Email logs: Click and confirm that you want to receive the mails for tenant logs.
l
Download logs: Click and confirm that you want to download the tenant logs.
Capture Client Activities, Logs, and Reports Administration Guide
Logs
11
Page 12

Reports
Capture Client offers the ability to generate distributable reports on the health and threat trends for the
Capture Client deployment on the network. Reporting is an important function that allows administrators to
review how their network is being protected, what gaps exist, how threats are being addressed and what
actions they may need to take. The various reports can help communicate the value of deploying Capture
Client endpoint protection to the business stakeholders.
Generating Reports
To generate a distributable statistics report:
4
1.
Click Reports. You can view the Available Reports tab by default.
2.
Click the Request Report tab.
3.
Enter a name for the report that is being generated in the Report Name field and select the Time
Period for the data to be included in the report .
4.
Choose the sections and types of data should be included in the report. As you change options, the
contents list changes.
5.
To generate the report:
l To download the report to your system, select Download, and click Request Report.
l To send the report to your Email account, select Email, click Request Report. In the EMAIL
REPORT window, select the administrators email ID available in the dropdown or enter the
email ID, and click Send. You will receive the report as an email attachment from the
SonicWall team.
NOTE: You can select multiple email accounts as recipients of the report.Click Add or Remove
Capture Client Activities, Logs, and Reports Administration Guide
Reports
12
Page 13

to add and remove the mail IDs respectively.
The reports that are generated are available for download in the Available Reports page. To download the
report, hover over the report and click .
The reports that are sent through email are displayed on the page.
Scheduling Reports
Capture Client enables administrators to configure automated reports that are delivered at regular intervals
for the Capture Client deployment on the network. Scheduled reports help administrators to review the
health and threat status periodically.
To schedule reports:
1.
Click Reports.
2.
Click the Schedule Reports tab.
3.
Click +.
4.
Configure the following in the SCHEDULE INFO section:
l Name - this is the filename of the report.
l File Format—a PDF report is sent as an email attachment.
l Report Frequency—determines how often the report is generated. The options are: Daily,
Capture Client Activities, Logs, and Reports Administration Guide
Reports
13
Page 14
Weekly, and Monthly. If you select Daily, specify the time to receive the report. If you select
Weekly or Monthly, specify the day or date to receive the report.
l At - Specify the time when the report is sent as an email attachment.
5.
In the RECIPENTS section: enter the email address to receive reports to your Email account, and
click Add.You can click Remove or Add to remove or add more recipients respectively.
6.
Choose the sections and details to be included in the report. At the bottom of the screen, under
REPORT CONTENT, the contents of the report are listed. As you change options, the contents list
changes:
l Threats
l Capture ATP Events
l Devices
l Activities
l Web Protection
l Applications
l Tenants
7.
Click Save.
You will receive reports through email from the SonicWall team at the scheduled time, periodically, at the
frequency you have set.
After you schedule reports, you can deactivate (clear the selection next to the report’s name), delete, or edit
as needed. You can also download a sample report to see how a scheduled report looks when it is delivered.
Available Reports
Click Reports and the Available Reports tab is displayed by default. At the top of the page, you can see
the icons that allow you to filter or search the list. Some of the columns can be sorted in ascending and
descending order; just click the arrow where it appears next to select column headings.
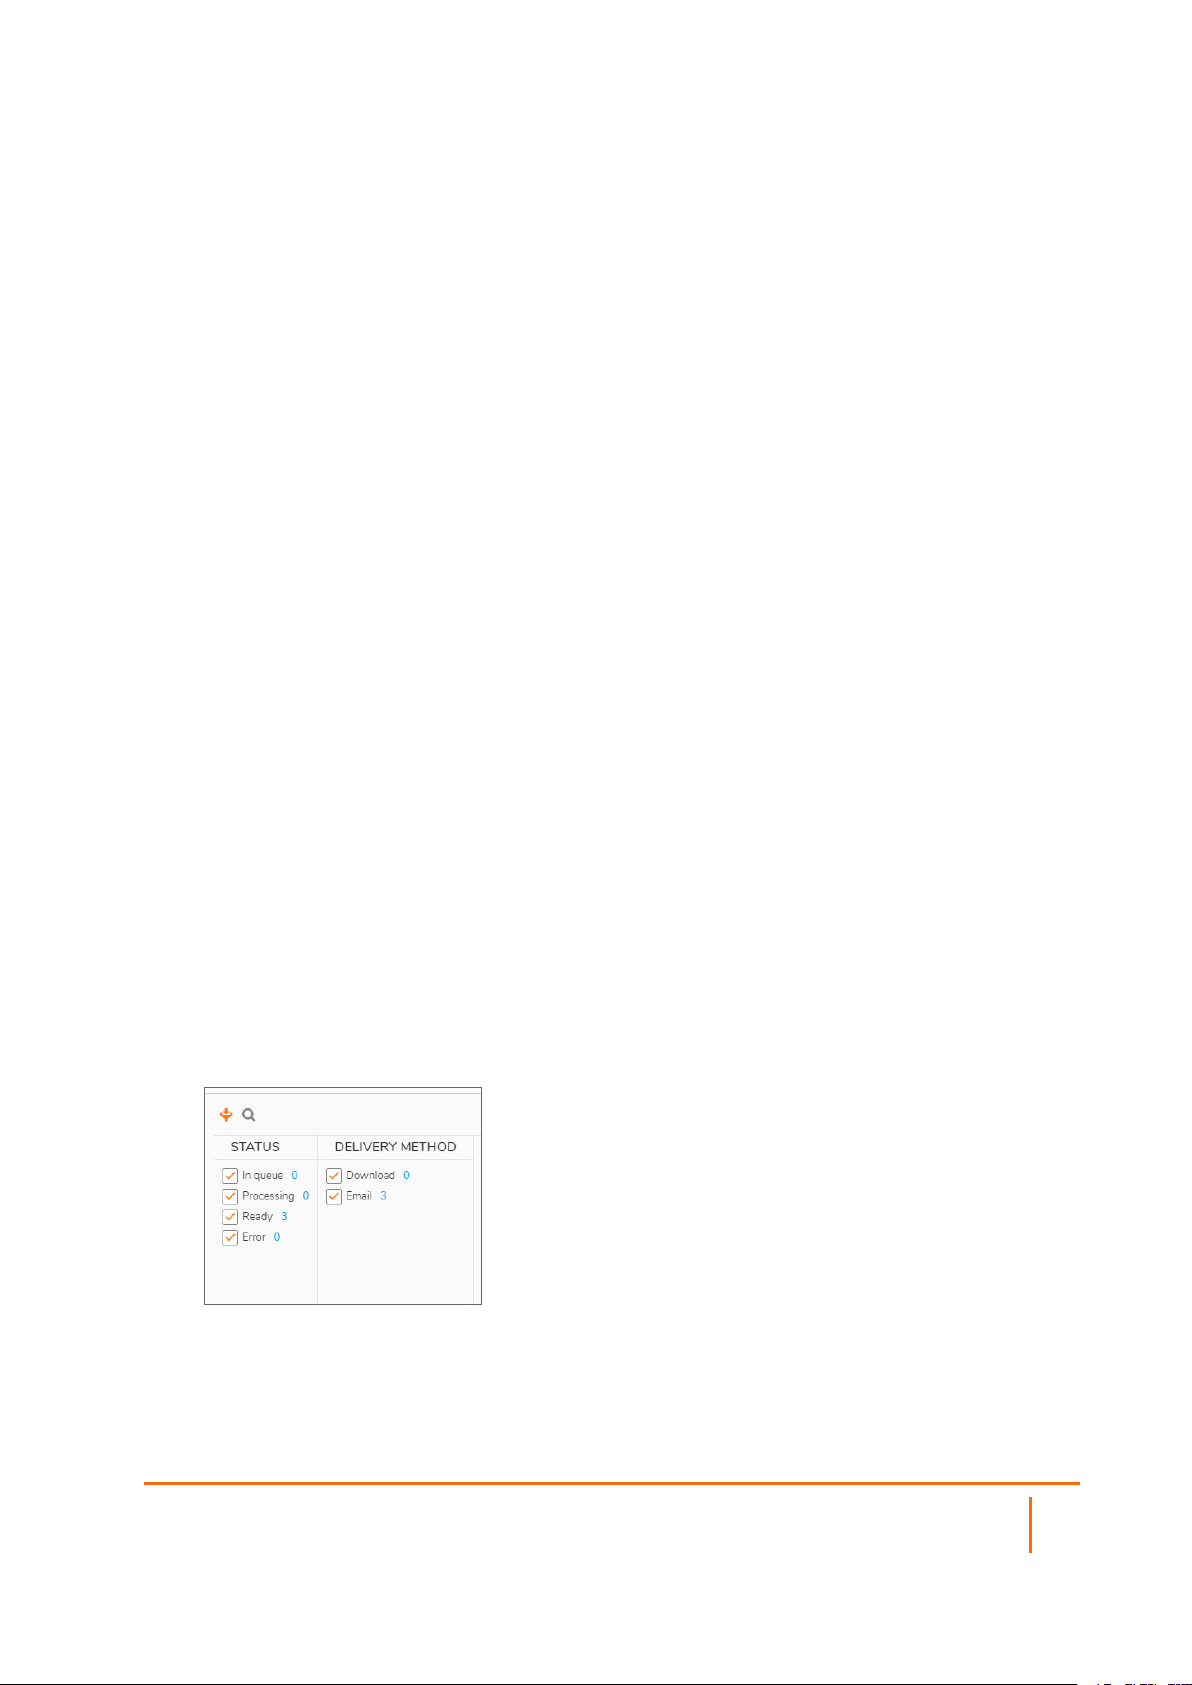
To filter the Available Reports:
1.
Navigate to Reports.
2.
Click the Filter icon.
3.
Select from the following to set your filter. You can select more than one item in each category.
l Status
l Delivery Method
As you select the criteria, the table immediately updates to reflect your choices.
Capture Client Activities, Logs, and Reports Administration Guide
Reports
14
Page 15

NOTE: The number of items available is listed beside each of the filter options.
To search the report:
1.
Click the Search icon.
2.
Type the search criteria in the field provided. As you type the report immediately updates with the
new data.
Request Report
You can use the Request Report option to define the content for customized reports.
To customize and request a report:
1.
Type the Report Name in the field provided.
2.
Specific the Time Period from the drop-down list. If you choose Custom, use the fields that appear
to set a custom period.
3.
For the Threats section:
a.
Choose one of the following from the drop down list:
l Do not include
l General Overview
l Detailed Information
b.
Select whether to Include threat history, Include list of unresolved threats, or both
4.
For the Capture ATP Events section:
a.
Choose one of the following from the drop-down list:
l Do not include
l General Overview
b.
Select whether to Include historical statistics, Include list of ATPdetections, or both.
5.
For the Devices section:
a.
Choose one of the following from the drop-down list:
l Do not include
l General Overview
b.
Select whether to Include historical statistics, Include full list of devices, or both.
6.
For the Activities section, choose one of the following from drop-down list:
l Do not include
l Threat-related activities
l All activities
7.
For the Web Protection section, choose one of the following from drop-down list:
l Do not include
l General Overview
l Detailed Information
Capture Client Activities, Logs, and Reports Administration Guide
Reports
15
Page 16

8.
For the Applications section:
a.
Choose one of the following from the drop-down list:
l Do not include
l General Overview
b.
Select whether to Include list of vulnerable applications, Include list of devices with
vulnerabilities, or both.
9.
For the Tenants section, choose one of the following from drop-down list:
l Do not include
l General Overview
10.
Select the Output Format. Currently PDF is the only option available.
11.
Select the Delivery Method: Download or Email.
Schedule Reports
Click Reports and select the Schedule Reports tab to set up your report schedule. At the top of the page,
you can see the icons that allow you to filter or search the list.
To add a scheduled report
1.
Navigate to Reports.
2.
Select the Schedule Reports tab.
3.
Click the Add icon (+).
Capture Client Activities, Logs, and Reports Administration Guide
Reports
16
Page 17

4.
Type the Name of the report in the field provided.
5.
Select the File Format.
6.
Set the Report Frequency:
a.
Select the interval from the drop-down list (Daily, Weekly, Monthly).
b.
Set the time for the report to run.
7.
In the Recipients section, you can select an administrator or add an email address for a new
recipient and then click Add.
8.
For the Threats section:
a.
Choose one of the following from the drop down list:
l Do not include
l General Overview
l Detailed Information
b.
Select whether to Include threat history, Include list of unresolved threats, both or
none.
Capture Client Activities, Logs, and Reports Administration Guide
Reports
17
Page 18

9.
For the Capture ATP Events section:
a.
Choose one of the following from the drop-down list:
l Do not include
l General Overview
b.
Select whether to Include historical statistics, Include list of ATPdetections, both or
none.
10.
For the Devices section:
a.
Choose one of the following from the drop-down list:
l Do not include
l General Overview
b.
Select whether to Include historical statistics, Include full list of devices, both, or none.
11.
For the Activities section, choose one of the following from drop-down list:
l Do not include
l Threat-related activities
l All activities
12.
For the Web Protection section, choose one of the following from drop-down list:
l Do not include
l General Overview
l Detailed Information
13.
For the Applications section:
a.
Choose one of the following from the drop-down list:
l Do not include
l General Overview
b.
Select whether to Include list of vulnerable applications, Include list of devices with
vulnerabilities, both, or none.
14.
For the Tenants section, choose one of the following from drop-down list:
l Do not include
l General Overview
15.
Click Save.
Capture Client Activities, Logs, and Reports Administration Guide
Reports
18
Page 19

SonicWall Support
Technical support is available to customers who have purchased SonicWall products with a valid
maintenance contract.
The Support Portal provides self-help tools you can use to solve problems quickly and independently, 24
hours a day, 365 days a year. To access the Support Portal, go to https://www.sonicwall.com/support.
The Support Portal enables you to:
l View knowledge base articles and technical documentation
l View and participate in the Community forum discussions at
https://community.sonicwall.com/technology-and-support.
l View video tutorials
l Access https://mysonicwall.com
l Learn about SonicWall professional services
l Review SonicWall Support services and warranty information
l Register for training and certification
l Request technical support or customer service
5
To contact SonicWall Support, visit https://www.sonicwall.com/support/contact-support.
Capture Client Activities, Logs, and Reports Administration Guide
19
SonicWall Suppor t
Page 20

About This Document
NOTE: A NOTE icon indicates supporting information.
IMPORTANT: An IMPORTANT icon indicates supporting information.
TIP: A TIP icon indicates helpful information.
CAUTION: A CAUTION icon indicates potential damage to hardware or loss of data if
instructions are not followed.
WARNING: A WARNING icon indicates a potential for property damage, personal injury, or
death.
Capture Client Activities, Logs, and Reports Administration Guide
Updated - November 2020
232-005520-00 Rev A
Copyright © 2020 SonicWall Inc. All rights reserved.
The information in thisdocument is provided in connection with SonicWalland/or its affiliates’ products. No license, express or
implied, by estoppel or otherwise, to any intellectual property right is granted by this document or in connection with the sale of
products. EXCEPT AS SET F ORTH IN THE TERMS AND CONDITIONS AS SPECIF IED IN THE LICENSE AGREEMENT FOR
THIS PRODUCT, SONICWALL AND/OR ITS AFFILIATES ASSUME NO LIABILIT Y WHATSOEVER AND DISCLAIMS ANY
EXPRESS, IMPLIED OR STATUTORY WARRANTY RELATING TO ITS PRODUCTS INCLUDING, BUT NOT LIMITED TO,
THE IMPLIED WARRANTY OF MERCHANTABILIT Y, FITNESS FOR A PARTICULAR PURPOSE, OR NON- INFRINGEMENT.
IN NO EVENT SHALL SONICWALL AND/OR ITS AFFILIATES BE LIABLE FOR ANY DIRECT, INDIRECT, CONSEQUENTIAL,
PUNITIVE, SPECIAL OR INCIDENTAL DAMAGES (INCLUDING, WITHOUT LIMITATION, DAMAGES FOR LOSS OF
PROFITS, BUSINESS INTERRUPTION OR LOSS OF INF ORMATION) ARISING OUT OF THE USE OR INABILIT Y TO USE
THIS DOCUMENT, EVEN IF SONICWALL AND/OR ITS AFF ILIATES HAVE BEEN ADVISED OF THE POSSIBILITY OF SUCH
DAMAGES. SonicWall and/or its affiliates make no representations or warranties with r espect to the accuracyor completeness of
the contents of this document and reserves the r ight to make changes to specificationsand product descriptionsat any time without
notice. and/or its affiliates do not make any commitment to update the information contained in this document.
For more information, visit https://www.sonicwall.com/legal.
End User Product Agreement
To view the SonicWallEnd User Product Agreement, go to: https://www.sonicwall.com/en-us/legal/license-agreements.
Open Source Code
SonicWall Inc. is able to provide a machine-readable copy of open source code with restrictive licenses such as GPL, LGPL, AGPL
when applicableper license requirements. To obtain a complete machine-readable copy, send your written requests, along with
certified check or money order in the amount of USD 25.00 payable to “SonicWallInc.”, to:
General Public License Source Code Request
Attn: Jennifer Anderson
1033 McCarthy Blvd
Milpitas, CA 95035
Capture Client Activities, Logs, and Reports Administration Guide
SonicWall Suppor t
20
 Loading...