

Page 1

This PDF is no longer being maintained.
Search the SolarWinds Success Center for more information.
Page 2

Copyright © 1995-2014 SolarWinds Worldwide, LLC. All rights reserved
worldwide. No part of this document may be reproduced by any means nor
modified, decompiled, disassembled, published or distributed, in whole or in part,
or translated to any electronic medium or other means without the written consent
of SolarWinds. All right, title, and interest in and to the software and
documentation are and shall remain the exclusive property of SolarWinds and its
respective licensors.
SOLARWINDS DISCLAIMS ALL WARRANTIES, CONDITIONS OR OTHER
TERMS, EXPRESS OR IMPLIED, STATUTORY OR OTHERWISE, ON
SOFTWARE AND DOCUMENTATION FURNISHED HEREUNDER
INCLUDING WITHOUT LIMITATION THE WARRANTIES OF DESIGN,
MERCHANTABILITY OR FITNESS FOR A PARTICULAR PURPOSE, AND
NONINFRINGEMENT. IN NO EVENT SHALL SOLARWINDS, ITS SUPPLIERS,
NOR ITS LICENSORS BE LIABLE FOR ANY DAMAGES, WHETHER ARISING
IN TORT, CONTRACT OR ANY OTHER LEGAL THEORY EVEN IF
SOLARWINDS HAS BEEN ADVISED OF THE POSSIBILITY OF SUCH
DAMAGES.
The SolarWinds, the SolarWinds & Design, ipMonitor, LANsurveyor, Orion, and
other SolarWinds marks, identified on the SolarWinds website, as updated from
SolarWinds from time to time and incorporated herein, are registered with the U.S.
Patent and Trademark Office and may be registered or pending registration in
other countries. All other SolarWinds trademarks may be common law marks or
registered or pending registration in the United States or in other countries. All
other trademarks or registered trademarks contained and/or mentioned herein are
used for identification purposes only and may be trademarks or registered
trademarks of their respective companies. Microsoft®, Windows®, and SQL
Server® are registered trademarks of Microsoft Corporation in the United States
and/or other countries.
Version 3.2, revised 11.05.2014
Page 3

About SolarWinds
About SolarWinds
SolarWinds, Inc develops and markets an array of network management,
monitoring, and discovery tools to meet the diverse requirements of today’s
network management and consulting professionals. SolarWinds products
continue to set benchmarks for quality and performance and have positioned the
company as the leader in network management and discovery technology. The
SolarWinds customer base includes over 45 percent of the Fortune 500 and
customers from over 90 countries. Our global business partner distributor network
exceeds 100 distributors and resellers.
Contacting SolarWinds
You can contact SolarWinds in a number of ways, including the following:
Team Contact Information
Sales 1.866.530.8100
http://www.solarwinds.com
Technical
Support
User
Forums
http://www.solarwinds.com/support, you need a customer account to
access the Customer Support area of the website.
http://www.thwack.com contains the community oriented user forums
Conventions
The documentation uses consistent conventions to help you identify items
throughout the printed and online library.
Convention Specifying
Bold Window items, including buttons and fields.
Italics Book and CD titles, variable names, new terms
Fixed font File and directory names, commands and code
3
Page 4

examples, text typed by you
Straight brackets, as
in [value]
Curly braces, as in
{value}
Logical OR, as in
value1|value2
SolarWinds User Device Tracker Documentation Library
The following documents are included in the User Device Tracker (SolarWinds
UDT) documentation library:
Document Purpose
Administrator
Guide
Evaluation
Guide
Provides detailed setup, configuration, and conceptual
information for SolarWinds UDT.
Provides an introduction to Orion User Device Tracker features
and instructions for installation and initial configuration.
Optional command parameters
Required command parameters
Exclusive command parameters where only one of the
options can be specified
Page Help Provides help for every window in the Orion User Device Tracker
user interface
Quick Start
Guide
Release
Notes
Provides installation, setup, and common scenarios for which
Orion User Device Tracker provides a simple, yet powerful,
solution.
Provides late-breaking information, known issues, and updates.
The latest Release Notes can be found at www.solarwinds.com.
4
Page 5

Contents
Contents
About SolarWinds 3
Contacting SolarWinds 3
Conventions 3
Contents 5
Chapter 1: Introduction 12
What is a Device? 12
What SolarWinds User Device Tracker Offers 12
How Does SolarWinds User Device Tracker Work? 13
Chapter 2: Installing SolarWinds User Device Tracker 14
Scalability 14
Requirements for SolarWinds UDT 14
UDT Server Software Requirements 14
Orion Server Hardware Requirements 16
Requirements for Virtual Machines and Servers 16
Requirements for the Orion database Server (SQL Server) 17
Additional SolarWinds UDT Requirements 19
FIPS Support 19
Server Sizing 20
SNMP Requirements for Monitored Devices 21
Enabling Microsoft Internet Information Services (IIS) 21
Enabling IIS on Windows Server 2003 and Windows XP 21
Enabling IIS on Windows Vista and Windows Server 2008 (R2) 22
Enabling IIS on Windows 7 23
Installing SolarWinds User Device Tracker 24
Activating Your License 26
Finishing SolarWinds UDT Installation 27
5
Page 6

Contents
Moving SolarWinds UDT to a New Server 28
Licensing 30
Maintaining Licenses with License Manager 31
Installing License Manager 31
Using License Manager 31
Excluding Orion Data Directories from Anti-Virus Scanning 32
Exclude for Windows XP/Server 2003 32
Exclude for Windows Vista/7/Server 2008 32
Running SolarWinds UDT 32
Internet Explorer Security Settings 33
Chapter 3: Discovering and Adding Network Devices 34
Adding Devices 34
Adding Ports 34
Network Discovery 34
Adding Multiple Devices (Network Sonar Discovery) 35
Using the Network Sonar Results Wizard 42
Adding a Node (ADD A SINGLE DEVICE) 43
Manage Nodes 44
User Device Tracker Port Discovery 44
Chapter 4: Adding Active Directory Controllers and Users 48
Manage Active Directory Administrator Credentials 48
Adding a New AD Credential 48
Editing an AD Credential 49
Deleting an AD Credential 50
Managing Active Directory Domain Controllers 50
Adding a New AD domain controller 50
Editing an AD domain controller 51
Assign a credential to an AD domain controller 51
6
Page 7

Contents
Deleting an AD Domain Controller 51
Setting up Polling of User Data Across Domains 52
Defining Credentials for Polling Across Domains 52
Adding a New AD Credential 54
Chapter 5: Viewing Device, Port, and User Status 55
Understanding the Device Tracker Summary 55
Understanding the Device Tracker Port Details 56
Viewing Node and Port Data in Tooltips 57
Node Tooltips 57
Port Tooltips 58
Understanding the Device Tracker User Details 58
Viewing User Data in Tooltips 59
User Tooltips 59
Chapter 6: Common Tasks with SolarWinds UDT 61
Finding the switch and port where a particular hostname, IP, or MAC
address is/was connected 61
Finding Endpoints in a Subnet 63
Finding a User’s Connections 64
Creating and Managing a Watch List 65
Chapter 7: Alerting and Reporting 66
Editing Alerts 66
Configuring SolarWinds UDT Alerts 66
Creating SolarWinds UDT-Specific Reports 68
Using Predefined SolarWinds UDT Reports 69
Viewing and Editing Reports 70
Filtering and Grouping Data in Resources 74
Grouping Applications 74
Filtering Data Using Filter Criteria 75
SQL Syntax 75
7
Page 8

Contents
Wildcards 75
Filtering by Custom Property 75
Filtering by Status 75
Built-in SQL Node Properties 76
SWQL Syntax 76
Wildcards 76
Filtering by Custom Property 76
Filtering by Built-in Properties 76
Examples 76
Filtering by Status 77
Built-in SWQL Nodes Properties 77
Chapter 8: Configuring SolarWinds UDT 79
Port Management 80
Manage Ports 80
User Device Tracker Discovery 80
Track Users and Endpoints 80
Manage Active Directory Domain Controller 81
Manage Watch List 81
UDT Settings 81
Polling Interval 81
Data Retention 81
Port Thresholds 81
View UDT Job Status 81
Advanced Settings 81
License Summary 82
UDT License Summary 82
thwack Community 82
UDT thwack Forum 82
8
Page 9

Contents
UDT Credentials 82
Account List 83
Credentials 84
Manage Windows Credentials 84
Customize 84
Customize Menu Bars 84
Color Scheme 84
External Websites 84
Manage Alerts 84
Manage Advanced Alerts 84
Product Updates 85
Available Product Updates 86
Orion Product Team Blog 86
Views 86
Manage Views 86
Add New View 86
Views by Device Type 86
Settings 86
Web Console Settings 86
Polling Settings 87
Orion Thresholds 87
UDT Settings 87
Details 87
Database Details 87
Polling Engines 87
Orion Core Details 87
License Details 87
Chapter 11: Using the Orion Web Console 89
9
Page 10

Contents
Logging in for the First Time as an Administrator 89
Windows Authentication with Active Directory 89
Using the Web Console Notification Bar 90
Editing Object Properties 91
Promoting a Node from ICMP to SNMP Monitoring 93
Viewing Node Resources 95
Administrative Functions of the Orion Web Console 96
Changing an Account Password 96
Orion Website Administration 96
Node and Group Management 97
Node and Group Management 97
Accounts 98
Customize 98
Manage Alerts 98
Product Updates 98
Views 99
Settings 99
Details 100
Viewing Secure Data on the Web 100
Orion General Thresholds 101
Orion General Threshold Types 101
Setting Orion General Thresholds 102
Using the Orion Web Console Message Center 103
Exporting Views to PDF 104
Creating a Custom Summary View 104
Chapter 12: Managing Groups and Dependencies 107
Managing Groups 107
Creating Groups 108
10
Page 11

Contents
Editing Existing Groups 109
Managing Group Members 110
Deleting Groups 110
Managing the Display of Group Status 110
Managing Dependencies 112
Creating a New Dependency 113
Editing an Existing Dependency 115
Deleting an Existing Dependency 116
Viewing Alerts on Child Objects 116
Chapter 13: Managing Web Accounts 118
Creating New Accounts 118
Editing User Accounts 120
User Account Access Settings 120
Setting Account Limitations 122
Defining Pattern Limitations 124
Setting Default Account Menu Bars and Views 125
Configuring an Account Report Folder 127
Configuring Audible Web Alerts 128
11
Page 12

Chapter 1: Introduction
SolarWinds User Device Tracker (SolarWinds UDT) allows you to monitor
devices and ports for your network. With SolarWinds UDT, you can analyze your
port usage and capacity and be alerted to issues before they occur.
SolarWinds UDT allows you to find where devices are connected in your network
and detailed information about capacity analysis. UDT regularly polls switches
and routers for information about what is connected to them. Based on this
information, SolarWinds UDT stores current and historical information about
where a device has been connected. It also provides alerts and reports about
devices connected to the network. For capacity analysis, SolarWinds UDT can
report on how many ports are used on switches currently, as well as over time, so
you can better understand the true utilization of the ports on your switches.
What is a Device?
A device is a MAC address, hostname, or IP Address. SolarWinds UDT allows
you to search on this information to find where the device is connected in the
network and where it has been connected in the past.
What SolarWinds User Device Tracker Offers
SolarWinds UDT provides focused device and port monitoring for network
engineers. SolarWinds UDT provides many features to help, including:
l Quickly find where a device (MAC address, hostname or IP Address) is
connected in the network
l Find out where a device has been connected in the past
l Find out what has been connected to a port over time
l Provides port capacity analysis for a switch (how many ports are being used,
including both monitored and un-monitored ports)
l Provides global port capacity analysis for used/available ports and network
capacity planning
12
Page 13
Chapter 1: Introduction
l Configure a watchlist to track when specific devices appear on the network
and alert when the devices appear
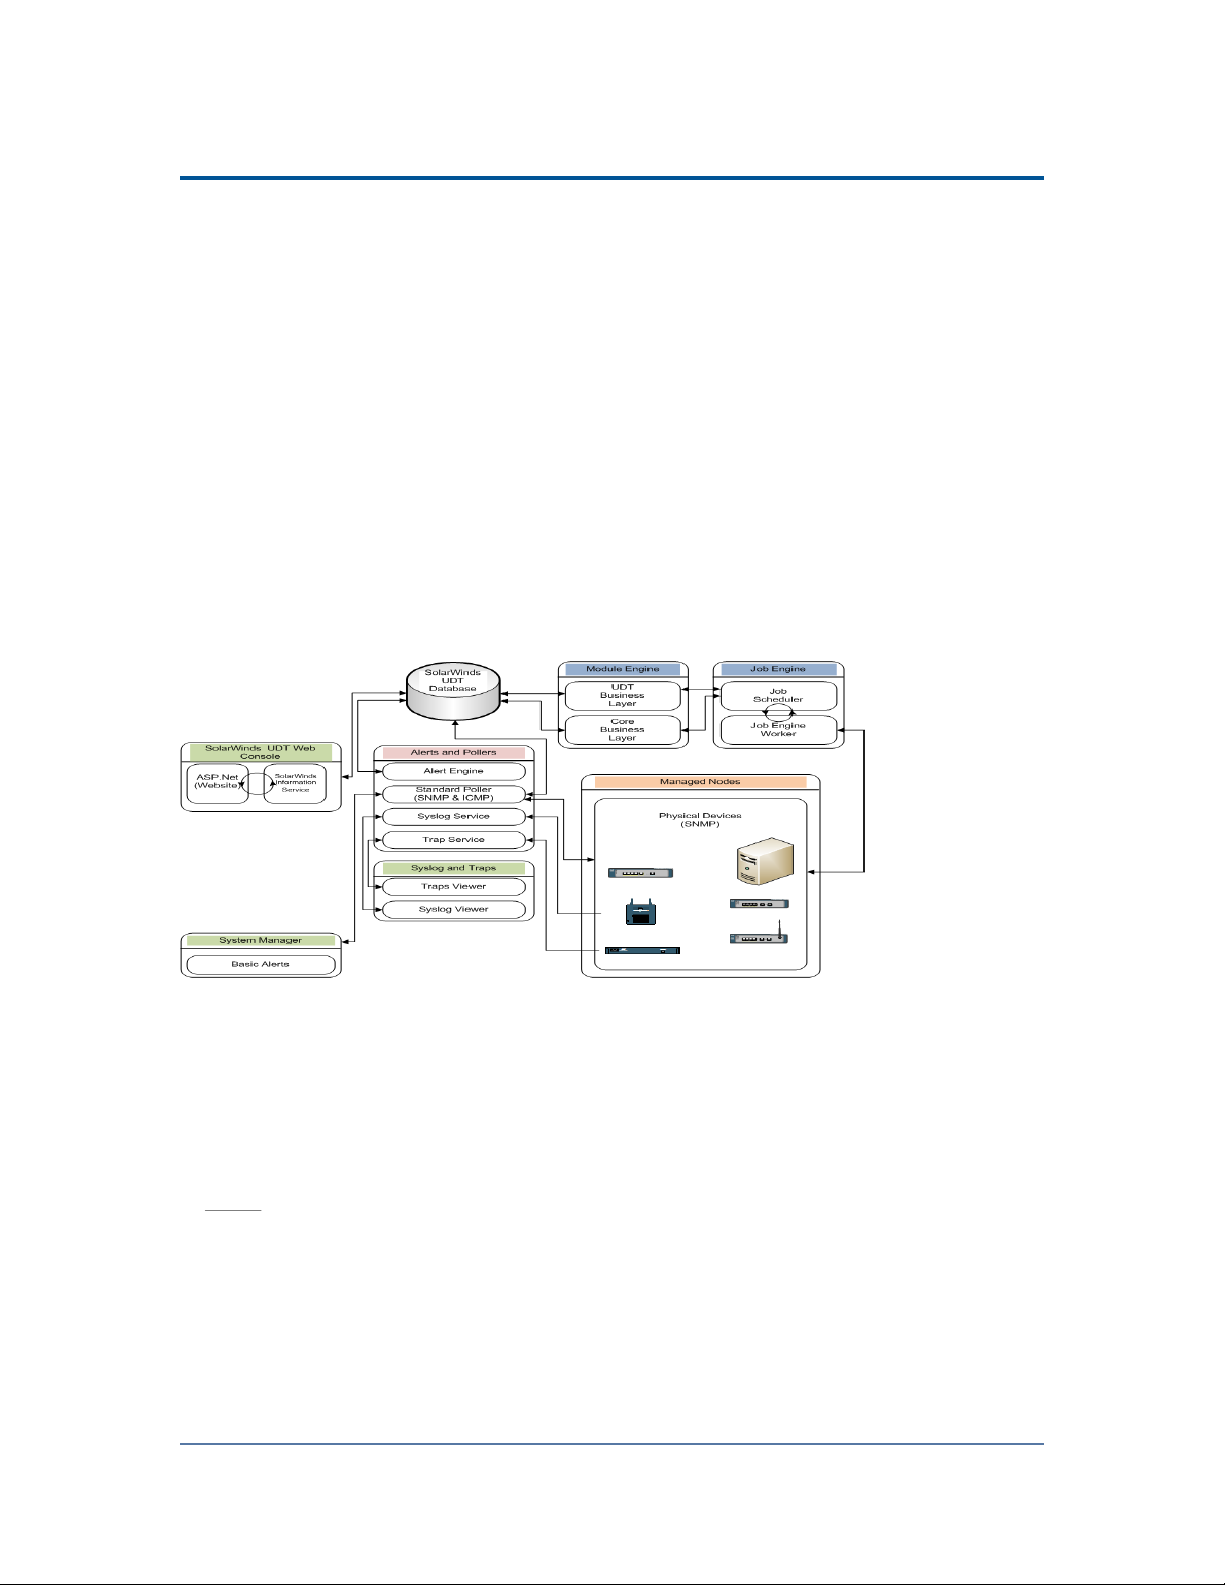
How Does SolarWinds User Device Tracker Work?
Using SNMP calls to your network framework, SolarWinds User Device Tracker
provides real time feedback on your applications and trending through statistics
stored in the Orion database. Keeping with the Orion common components
infrastructure, there are no agents installed on your servers and no remote
software to maintain. All calls are made in real time and displayed on a Web
Console accessible from any supported browser.
The following diagram provides an overview of the current SolarWinds UDT
architecture, including interations among SolarWinds UDT components, the
SolarWinds UDT database, and the managed devices on your network.
13
Page 14
Chapter 2: Installing SolarWinds User Device Tracker
Installing SolarWinds User Device Tracker (SolarWinds UDT) is a wizard-driven
process. Resource and space requirements are such that most deployments do
not require hardware updates to your Orion Server.
SolarWinds UDT is a standalone product. It can be installed by itself or with other
SolarWinds products (for example SolarWinds Network Performance Monitor) to
provide an integrated experience.
Scalability
By adding individual polling engines, you can transparently scale your
SolarWinds UDT installation to any environment.
Requirements for SolarWinds UDT
SolarWinds recommends installing your Orion product on its own server, with the
Orion database hosted separately, on its own SQL Server. Installations of multiple
SolarWinds UDT servers using the same database are not supported.
UDT Server Software Requirements
The following table lists minimum software requirements and recommendations
for your UDT server.
Software Requirements
Operating
System
Windows Server 2003, 2008 R2, 2012 or 2012 R2 with IIS in 32-bit
mode.
IIS must be installed. SolarWinds recommends that SolarWinds
software administrators have local administrator privileges to
ensure full functionality of local SolarWinds tools. Accounts limited
to use of the Orion Web Console do not require administrator
privileges.
14
Page 15

Chapter 2: Installing SolarWinds User Device Tracker
Notes:
l SolarWinds does not support production installations of
SolarWinds products on Windows XP, Windows Vista, or
Windows 7 systems.
l If you are installing SolarWinds UDT on Windows Server
2003, confirm that your full computer name is no longer than
15 characters in length. Windows Server 2003 trims any
characters beyond the fifteenth, and this may prevent
SolarWinds services from properly identifiying your UDT
server.
l While UDT is supported on Windows Server 2008 R2, it is not
supported on Windows Server 2008.
Web
Server
.NET
Framework
SNMP
Trap
Services
Web
Console
Browser
Microsoft IIS, version 6.0 and higher, in 32-bit mode.
DNS specifications require that hostnames be composed of
alphanumeric characters (A-Z, 0-9), the minus sign (-), and periods
(.). Underscore characters (_) are not allowed. For more information,
see RFC 952.
Note: SolarWinds neither recommends nor supports the installation
of any SolarWinds UDT product on the same server or using the
same database server as a Research in Motion (RIM) Blackberry
server.
Version 3.5. .NET Framework 3.5 SP1 is recommended.
Windows operating system management and monitoring tools
component
l Microsoft Internet Explorer 7 or later
l Mozilla Firefox 3 or later
l Google Chrome 8
15
Page 16

Orion Server Hardware Requirements
Orion Server Hardware Requirements
The following table lists minimum hardware requirements and recommendations
for your UDT server.
Note: Hardware requirements are listed by SolarWinds license level.
Hardware AL50, AL100, AL250,
or AL500
CPU
Speed
Hard Drive
Space
Memory 3 GB 4 GB 4 GB
Application
Ports
2.0 GHz 2.4 GHz 3.0 GHz
Note: Dual processor, dual core is recommended.
2 GB 5 GB 20 GB
Note: A RAID 1 drive for server operating system, SolarWinds
installation, and tempdb files is recommended. The SolarWinds
installer needs 1GB on the drive where temporary Windows system
or user variables are stored. Per Windows standards, some
common files may need to be installed on the same drive as your
server operating system..
161/SNMP and 443/SNMP. VMware ESX/ESXi Servers are polled
on 443.
17777/TCP open for Orion module traffic
17778/ HTTPS open to access the SolarWinds Information Service
API
AL1000 ALX
Requirements for Virtual Machines and Servers
SolarWinds installations on VMware Virtual Machines and Microsoft Virtual
Servers are fully supported if the following minimum configuration requirements
are met for each virtual machine.
Note: SolarWinds strongly recommends that you maintain your SQL Server
database on a separate physical server.
16
Page 17

Chapter 2: Installing SolarWinds User Device Tracker
Virtual
Machine
Configuration
Orion Requirements by License Level
UT2500, UT5000, or
UT10000
UT25000 or
UT50000
UTX
CPU Speed 2.0 GHz 2.4 GHz 3.0 GHz
Allocated
Hard Drive
Space
2GB 5GB 20GB
Note: Due to intense I/O requirements, SQL Server should be
hosted on a separate physical server configured as RAID 1+0.
RAID 5 is not recommended for the SQL Server hard drive.
Memory 3 GB 4 GB 4 GB
Network
Interface
Each virtual machine on which Orion is installed should have its
own, dedicated network interface card.
Note: Since Orion uses SNMP to monitor your network, if you are
unable to dedicate a network interface card to your Orion server,
you may experience gaps in monitoring data due to the low
priority generally assigned to SNMP traffic.
Requirements for the Orion database Server (SQL Server)
The following table lists software and hardware requirements for your Orion
database server. SolarWinds UDT license levels are provided as a reference.
Requirements UT2500, UT5000, or
UT10000
UT25000 or
UT50000
UTX
SQL Server SQL Server 2005 SP1 Express, Standard, or Enterprise
SQL Server 2008 Express, Standard, or Enterprise
SQL Server 2012 SP1 Express, Standard or Enterprise
SQL Server 2014 Express, Standard or Enterprise
Notes:
l Due to latency effects, SolarWinds does not recommend
installing your SQL Server and your SolarWinds UDT
17
Page 18

Requirements for the Orion database Server (SQL Server)
server or additional polling engine in different locations
across a WAN. For more information, see SolarWinds
Knowledge Base article, “Can I install my Orion server or
Additional Polling Engine and my Orion database (SQL
Server) in different locations across a WAN?”
l Either mixed-mode or SQL authentication must be
supported.
l If you are managing your SolarWinds UDT database,
SolarWinds recommends you install the SQL Server
Management Studio component.
l If your SolarWinds UDT product installs SQL Server
System CLR Types, a manual restart of the SQL Server
service for your SolarWinds UDT database is required.
l Use the following database select statement to check your
SQL Server version, service pack or release level, and
edition:
select SERVERPROPERTY ('productversion'),
SERVERPROPERTY ('productlevel'), SERVERPROPERTY
('edition')
CPU Speed 2.0 GHz 2.4 GHz 3.0 GHz
Hard Drive
Space
2 GB 5 GB 20 GB
Note: Due to intense I/O requirements, a RAID 1+0 drive is
strongly recommended the SQL Server database and
SolarWinds UDT data and log files. RAID 5 is not recommended
for the SQL Server hard drive. The SolarWinds UDT installer
needs at least 1GB on the drive where temporary Windows
system or user variables are stored. Per Windows standards,
some common files may need to be installed on drive as your
server operating system.
Memory 2 GB 3 GB 4 GB
The Configuration Wizard installs the following required x86 components if they
are not found on your SolarWinds UDT database server:
18
Page 19

Chapter 2: Installing SolarWinds User Device Tracker
l SQL Server System Common Language Runtime (CLR) Types. SolarWinds
products use secure SQL CLR stored procedures for selected, non-business
data operations to improve overall performance.
l Microsoft SQL Server Native Client
l Microsoft SQL Server Management Objects
Additional SolarWinds UDT Requirements
Enterprise-level SolarWinds UDT deployments with the potential for more than
50,000 ports may need additional computing resources above the standards
required for SolarWinds common components:
Ports Additional Requirements
Up to 50,000 No additional requirements
More than 50,000 8+ GB RAM
Note: If you are running Windows Server 2008, you must upgrade to Windows
Server 2008 R2, because SolarWinds UDT does not support Windows Server
2008 due to known WMI issues.
FIPS Support
FIPS (Federal Information Processing Standard) defines security and
interoperability standards for computers used by the U.S. federal government.
To enable FIPS in the Local Security Policy on Windows:
1. Click Start > Control Panel > System and Security > Administrative Tools,
and then double-click Local Security Policy.
2. Expand the Local Policies category in the left pane, and then click Security
Options.
3. Right-click System cryptography: Use FIPS compliant algorithms for
encryption, hashing, and signing.
4. In the context menu that is displayed, click Properties.
5. In the Local Security Setting tab, click Enabled and then click OK.
Note: FIPS can also be enabled as part of Group Policy.
19
Page 20

Server Sizing
SolarWinds UDT installations on Windows Server 2008 R2 and Windows 7
(supported for evaluation purposes only) require a Microsoft hotfix to realize the
FIPS-compatibility features of this release. For more information about this
required Microsoft hotfix, see the article http://support.microsoft.com/kb/981119.
As noted in the KB article, you need to enable FIPS first before applying the
Microsoft hotfix.
Server Sizing
SolarWinds UDT is capable of monitoring networks of any size, ranging from
small corporate LANs to large enterprise and service provider networks. Most
SolarWinds UDT systems perform well on 3.0 GHz systems with 4 GB of RAM,
using default polling engine settings. However, when monitoring larger networks,
you should give additional consideration to the hardware used and the system
configuration.
There are three primary variables that affect scalability. The most important
consideration is the number of monitored ports, nodes, and users. Systems
monitoring more than 50,000 elements require 8+ GB of RAM. The second
variable to consider is polling frequency. For instance, if you are collecting
statistics more frequently than the default, the system will have to work harder and
system requirements will increase. Finally, the number of simultaneous users
accessing SolarWinds UDT directly impacts system performance.
When planning an SolarWinds UDT installation, there are four main factors to
keep in mind with respect to polling capacity: CPU, memory, number of polling
engines, and polling engine settings. For minimum hardware recommendations,
see “Requirements”. For more information about polling engines, see Appendix A
of the SolarWinds User Device Tracker Administrator Guide.
In most situations, installing SolarWinds UDT and SQL Server on different
servers is highly recommended, particularly if you are planning to monitor a high
number of ports. If you experience performance problems or you plan to monitor a
very large network, you should certainly consider this option. This scenario offers
several performance advantages, as the SolarWinds UDT server does not
perform any database processing, and it does not have to share resources with
SQL Server.
If you plan to monitor 150,000 or more ports, SolarWinds recommends that you
install additional polling engines on separate servers to help distribute the work
load. For more information about sizing SolarWinds UDT to your network, contact
the SolarWinds sales team or visit www.solarwinds.com. For more information
20
Page 21

Chapter 2: Installing SolarWinds User Device Tracker
about configuring additional pollers, see the SolarWinds Orion User Device
Tracker Administrator Guide.
SNMP Requirements for Monitored Devices
SolarWinds UDT can monitor the performance of any SNMPv1-, SNMPv2c-, or
SNMPv3-enabled device on your network. Consult your device documentation or
a technical representative of your device manufacturer to acquire specific
instructions for configuring SNMP on your device.
Notes:
l To properly monitor devices on your network, you must enable SNMP on all
devices that are capable of SNMP communications
l If SNMPv2c is enabled on a device you want SolarWinds UDT to monitor, by
default, SolarWinds UDT will attempt to use SNMPv2c to poll the device for
performance information. If you only want SolarWinds UDT to poll using
SNMPv1, you must disable SNMPv2c on the device to be polled.
Enabling Microsoft Internet Information Services (IIS)
To host the Orion Web Console, Microsoft Internet Information Services (IIS) must
be installed and enabled on your SolarWinds UDT server. Windows Server 2003
and Windows XP require IIS version 6; Windows Server 2008 R2 and Windows
Vista require IIS version 7, as detailed in the following sections:
Enabling IIS on Windows Server 2003 and Windows XP
The following procedure enables IIS on Windows Server 2003 and XP.
To enable IIS on Windows Server 2003 and Windows XP:
1. Click Start> Control Panel> Add or Remove Programs.
2. Click Add/Remove Windows Components.
3. Select Application Server and confirm that it is checked.
4. Click Details.
5. Select Internet Information Services (IIS) and confirm that it is checked.
6. Click Details.
21
Page 22

Enabling IIS on Windows Vista and Windows Server 2008 (R2)
7. Select World Wide Web Service and confirm that it is checked.
8. Click Details.
9. Select World Wide Web Service and confirm that it is checked.
10. Click OK.
11. Click OK on the Internet Information Services (IIS) window.
12. Click OK on the Application Server window.
13. Select Management and Monitoring Tools and confirm that it is checked.
14. Click Details.
15. Select both Simple Network Management Protocol and WMI SNMP
Provider and confirm that they are checked, and then click OK.
16. Click Next on the Windows Components window, and then click Finish
after completing the Windows Components Wizard.
Note: You may be prompted to install additional
components, to provide your Windows Operating System
media, or to restart your computer.
17. If you are currently enabling IIS as part of an SolarWinds UDT
installation, restart the SolarWinds UDT installer.
Enabling IIS on Windows Vista and Windows Server 2008 (R2)
IIS is enabled automatically after UDT installation and prior to the start of the
Configuration Wizard. If the Configuration Wizard detects that IIS is not installed
on Windows 2008 R2, it installs IIS. The following manual procedure is provided
for Windows Vista, or in case problems occur with the automatic IIS installation for
Windows Server 2008 R2.
To enable IIS on Windows Vista and Windows Server 2008 R2:
1. Click Start> All Programs> Administrative Tools> Server Manager.
2. Click Roles in the left pane.
3. Click Add Roles on the right, in the main pane.
4. Click Next to start the Add Roles Wizard.
5. Check Web Server (IIS).
22
Page 23

Chapter 2: Installing SolarWinds User Device Tracker
6. If you are prompted to add features required for Web Server (IIS), click
Add Required Features.
7. Click Next on the Select Server Roles window.
8. Click Next on the Web Server (IIS) window.
9. Confirm that Common HTTP Features> Static Content is installed.
10. Check Application Development> ASP.NET.
11. Click Add Required Role Services.
12. Check both Security> Windows Authentication and Security> Basic
Authentication.
13. Check Management Tools> IIS 6 Management Compatibility.
14. Click Next on the Select Role Services window.
15. Click Install on the Confirm Installation Selections window.
16. Click Close on the Installation Results window.
17. If you are currently enabling IIS as part of an SolarWinds UDT
installation, restart the SolarWinds UDT installer.
Enabling IIS on Windows 7
SolarWinds only supports evaluations of SolarWinds UDT version 2.0 and higher
on Windows 7. These versions of SolarWinds UDT install and enable IIS
automatically.
The following manual procedure is provided in case problems occur with the
automatic IIS installation for Windows 7.
To enable IIS on Windows 7:
1. Click Start and then click Control Panel.
2. In Control Panel, click Programs and Features and then click Turn
Windows features on or off.
3. In the Windows Features dialog box, expand Internet Information
Services.
4. Expand the category for Web Management Tools and check IIS 6
Management Compatibility. (To do this, you must expand IIS 6
Management Compatibility and then check all of the sub-options
23
Page 24

Installing SolarWinds User Device Tracker
underneath.)
5. Expand the category for World Wide Web Services.
a.Expand the sub-category for Application Development
Features and check ASP.NET. Note that this also checks
several other options.
b.Expand the category for Common HTTP Features and
check Static Content.
c.Expand the category for Securityand check both Basic
Authentication and Windows Authentication.
6. Click OK.
Installing SolarWinds User Device Tracker
SolarWinds User Device Tracker offers an intuitive wizard to guide you through
installing and configuring the product.
SolarWinds User Device Tracker does not require Orion NPM. However, if you
are performing a clean install of SolarWinds UDT 2.0 and also want to install
Orion NPM, you should install Orion NPM version 10.2 or later before or after you
install SolarWinds UDT 2.0. For more information, see “Installing SolarWinds
Orion Network Performance Monitor” in the SolarWinds Orion Network
Performance Monitor Administrator Guide.
Note: If you have any additional SolarWinds UDT web consoles or pollers, you
must upgrade them too by repeating this procedure for each additional
SolarWinds UDT poller or web console. Be sure to use the correct installers for
pollers or web consoles, since these are different from the standard installer
package. For information about installing additional Orion Web Consoles or
pollers, refer to Appendix A in the SolarWinds User Device Tracker Administrator
Guide.
To install or upgrade SolarWinds User Device Tracker:
1. Using a local administrator account log on the server where you want to
install or upgrade SolarWinds UDT.
2. If you downloaded the product from the SolarWinds website, navigate
to your download location and launch the executable.
24
Page 25

Chapter 2: Installing SolarWinds User Device Tracker
3. If you are prompted to install requirements, click Install, and then
complete the installation, including a reboot, if required.
Notes:
l Downloading and installing Microsoft .NET
Framework 3.5 may take up to 20 minutes or
more, depending on your existing system
configuration.
l If a reboot is required, after restart, click
Install to resume installation, and then click
Next on the Welcome window.
4. If the Microsoft Installer Wizard detects that Microsoft Internet
Information Services (IIS) is not installed, select Suspend installation
to manually install IIS, click Next, quit setup, and then install IIS as shown
in one of the following sections, depending on your platform:
Note: The Orion Web Console requires that Microsoft IIS is
installed on the SolarWinds UDT Server. If you do not
install IIS at this point, you must install IIS later, and then
configure a website for the Orion Web Console to use.
5. Read the message about the Orion Improvement Program. If you are
willing to send anonymous data back to SolarWinds for product
improvement, click Send data. Otherwise, click Do not send data.
Note: You can stop sending this data at any time by
uninstalling the Orion Improvement Program using the
Control Panel.
6. Read the welcome message, and then click Next.
7. If you are upgrading, type Yes that you acknowledge creating a database
backup before installing the new version of UDT. For information on
creating a database backup see the Solarwinds user Device Manager
Administrator Guide.
25
Page 26

Activating Your License
8. Select I accept the terms of the License Agreement, and then click
Next.
9. Select an Installation Folder or accept the default, and then click Next.
10. Click Next to begin the installation.
11. Click Finish when the setup completes.
Activating Your License
After installing the software through the setup wizard, you are prompted to enter
the license activation key for your product. If you do not have an activation key,
the product runs in a time-limited evaluation mode.
To evaluate the software without a license:
Click Continue Evaluation.
To license the software on a server with Internet access:
1. Click Enter Licensing Information.
2. Select I have internet access and an activation key.
3. Click the http://www.solarwinds.com/customerportal link to access the
customer portal on the SolarWinds web site.
4. Log on to the portal using your SolarWinds customer ID and password.
5. Click License Management on the left navigation bar.
6. Navigate to your product, choose an activation key from the Unregistered
Licenses section, and then copy the activation key.
7. If you cannot find an activation key in the Unregistered Licenses
section, contact SolarWinds customer support.
8. Return to the Activate UDT window, and then enter the activation key in
the Activation Key field.
9. If you access Internet web sites through a proxy server, click I access
the internet through a proxy server, and enter the proxy address and
port.
10. Click Next.
11. Enter your email address and other registration information, and then click
Next.
26
Page 27

Chapter 2: Installing SolarWinds User Device Tracker
To license the software on a server without Internet access:
1. Click Enter Licensing Information
2. Select This server does not have internet access, and then click Next.
3. Click Copy Unique Machine ID.
4. Paste the copied data into a text editor document.
5. Transfer the document to a computer with Internet access.
6. On the computer with Internet access, complete the following steps:
7. Browse to
http://www.solarwinds.com/customerportal/licensemanagement.aspx and
then log on to the portal with your SolarWinds customer ID and password.
8. Navigate to your product, and then click Manually Register License.
9. If the Manually Register License option is not available for your product,
contact SolarWinds customer support.
10. Provide the Machine ID from Step 5, and then download your license key
file.
11. Transfer the license key file to the server.
12. Return to the Activate UDT window, browse to the license key file, and
then click Next.
Finishing SolarWinds UDT Installation
After activating your license, you are prompted to configure SolarWinds UDT.
Doing so configures the SolarWinds UDT database, web site, and services to
work in your specific Orion environment.
Follow the directions in the Orion Configuration Wizard:
1. Click Next on the Orion Configuration Wizard Welcome window.
2. Configure the Database Settings for the SQL Server, and then click Next.
3. Select the option to create a new database or to use an existing one, and
then click Next.
4. Select the option to create a new account or to use an existing account,
and then click Next.
5. Select the Website Settings, and then click Next.
27
Page 28

Moving SolarWinds UDT to a New Server
6. Accept the SolarWinds services or plugins that are checked, and then click
Next. If you have not installed other modules, the UDT Job Engine Plugin
may be your only selectable option.
7. Review the configuration summary provided by the Configuration Wizard,
and then click Next.
8. Click Finish when the Configuration Wizard completes.
Moving SolarWinds UDT to a New Server
SolarWinds UDT encrypts your sensitive data with a security certificate stored on
the original SolarWinds UDT server. To grant a new server access to this
encrypted data, you must copy the original security certificate to the new server.
WARNING: If you do not replicate the original certificate, SolarWinds UDT on the
new server cannot access any credentials used by your component monitors, and
all of those component monitors will fail.
To replicate the original certificate:
1. Export the credential from the original server.
a. On the Start Menu, click Run, type MMC, and then
click OK.
b. On the File menu, click Add/Remove Snapin, and
then click Add.
c. Select Certificates and then click Add.
d. Select Computer account and then click Next.
e. Select Local computer and then click Finish.
f. Click Close.
g. Click OK.
h. Expand the Certificates (Local Computer) group.
i. Expand the Personal group.
j. Expand the Certificates group.
28
Page 29

Chapter 2: Installing SolarWinds User Device Tracker
k. Right-click SolarWinds Job Scheduler, point to All
Tasks on the shortcut menu, and then click Export.
l. Click Next in the Certificate Export Wizard.
m. Select Yes, export the private key, click Next, and
then click Next again.
n. Type and confirm a password for this private key, and
then click Next.
o. Specify the file name to which you want to save the
certificate, click Next, and then click Finish—the
certificate is saved with a .pfx file name extension.
2. Copy the .pfx certificate file to the new server.
3. Import the certificate to the new server.
a. On the Start Menu, click Run, type MMC, and then
click OK.
b. On the File menu, click Add/Remove Snapin, and
then click Add.
c. Select Certificates, and then click Add.
d. Select Computer account, and then click Next.
e. Select Local computer, and then click Finish.
f. Click Close.
g. Click OK.
h. Expand the Certificates (Local Computer) group.
i. Expand the Personal group.
j. Expand the Certificates group.
k. If there is a SolarWinds Job Scheduler Engine
item in the list, right-click SolarWinds Job
Scheduler Engine and select Delete from the
shortcut menu.
29
Page 30

Licensing
l. Right-click the Certificates—Personal—
Certificates node, point to All Tasks in the shortcut
menu, and then click Import.
m. Click Next in the Certificate Import Wizard.
n. Specify the .pfx certificate file you copied to the
server and then click Next.
o. Enter the password for the private key, check Mark
this key as exportable, and then click Next.
p. Select Place all certificates in the following store,
and then select Personal as the Certificate Store.
q. Click Next and then click Finish.
Licensing
The SolarWinds UDT license you purchase is based on the number of allowed
nodes and monitored ports. If more ports are selected for discovery than your
license allows, you will be prevented from continuing the discovery.
The SolarWinds UDT license tiers are:
Ports Nodes
2,500 2500
5,000 5000
10,000 10,000
25,000 25,000
50,000 50,000
Unlimited Unlimited
Contact SolarWinds about upgrading your SolarWinds UDT license if needed.
Note: SolarWinds UDT licenses do not have to mirror the license count of any
other installed Orion product. For example, you can install SolarWinds UDT with
a 50 node license on an Orion NPM server with an unlimited node license.
To see the available nodes and ports remaining in your license:
30
Page 31

Chapter 2: Installing SolarWinds User Device Tracker
1. Log on to the Orion Web Console with an administrator account.
2. Click DEVICE TRACKER.
3. Click UDT Settings.
4. Click UDT License Summary.
Note: As an alternative, you can also click License Details in the Settings page to
view the allowed and current nodes and monitored ports.
Maintaining Licenses with License Manager
SolarWinds License Manager is an easily installed, free utility that gives you the
ability to migrate Orion licenses from one computer to another without contacting
SolarWinds Customer Service. The following sections provide procedures for
installing and using License Manager:
l Installing License Manager
l Using License Manager
Installing License Manager
Install License Manager on the computer from which you are migrating currently
licensed products.
Note: You must install License Manager on a computer with the correct time. If
the time on the computer is even slightly off, in either direction, from Greenwich
Mean Time (GMT), you cannot reset licenses without contacting SolarWinds
Customer Service. Time zone settings neither affect nor cause this issue.
To install License Manager:
1. Click Start> All Programs> SolarWinds> SolarWinds License
Manager Setup.
2. Click I Accept to accept the SolarWinds EULA.
3. If you are prompted to install the SolarWinds License Manager
application, click Install.
Using License Manager
You must run License Manager on the computer where the currently licensed
SolarWinds product is installed before you can migrate licenses to a new
31
Page 32

Excluding Orion Data Directories from Anti-Virus Scanning
installation. The following procedure deactivates currently installed licenses that
can then be transferred to a new installation.
To deactivate currently installed licenses:
1. Click Start> All Programs> SolarWinds> SolarWinds License
Manager.
2. Check the products you want to deactivate on this computer.
3. Click Deactivate.
4. Specify your SolarWinds Customer ID and password when prompted, and
then click Deactivate.
Note: Deactivated licenses are now available to activate on a new computer.
When you have successfully deactivated your products, log on to the computer on
which you want to install your products, and then begin installation. When asked
to specify your licenses, provide the appropriate information. The license you
deactivated earlier is then assigned to the new installation.
Excluding Orion Data Directories from Anti-Virus
Scanning
Anti-virus programs may lock files used by the SolarWinds Job Engine v2 during
scanning. This can cause the SolarWinds Job Engine v2 services to stop and
restart, causing delayed polling and gaps in data for a poll cycle.
SolarWinds recommends that you exclude certain Orion data directories
(depending on your Windows platform) from your anti-virus scanning to improve
performance and stability:
Exclude for Windows XP/Server 2003
C:\Documents and Settings\All Users\Application Data\SolarWinds
Exclude for Windows Vista/7/Server 2008
C:\ProgramData\SolarWinds
Running SolarWinds UDT
To run SolarWinds UDT:
Click Start > All Programs > SolarWinds Orion > Orion Web Console.
32
Page 33

Chapter 2: Installing SolarWinds User Device Tracker
The Orion Web Console is displayed. You can login by default by entering the
User name Admin and no password. Then click LOGIN.
Internet Explorer Security Settings
If you are using Internet Explorer, SolarWinds recommends that you add the URL
of your Orion website (http://FullOrionServerName/), the URL of SolarWinds
support (http://support.solarwinds.com), and about:blank to the list of trusted
sites.
If you do not add these URLs to the list of trusted sites, you may see Internet
Explorer dialogs that contain messages similar to the following regarding
blocking website content:
Content from the website listed below is being blocked by the Internet Explorer
Enhanced Security Configuration.
<website>
To add the specified URLs to your trusted sites list, click the Add… button in the
Internet Explorer dialog.
33
Page 34

Chapter 3: Discovering and Adding Network Devices
This chapter describes the process of discovering network devices and ports and
then adding them to the Orion database.
Adding devices in SolarWinds UDT is a two-step process. First you add network
devices to monitor, and then you add the ports on those devices to monitor.
Adding Devices
These are the ways to add devices in SolarWinds UDT:
l Network Discovery (Settings > Getting Started with Orion)
l Manage Nodes (HOME > All Nodes)
The method recommended largely depends on the number of devices to be
added. When you install and run SolarWinds UDT for the first time, you will be
taken to the Network Sonar Discovery Wizard.
Adding Ports
After you after discovered network devices, you use DISCOVER MY PORTS
option in Discovery Central to discover and add ports to SolarWinds UDT.
Network Discovery
The Network Discovery Category in Discovery Central includes two options for
discovering network devices.
The Network Sonar Discovery option quickly discovers and adds a larger
number of devices across your enterprise to your Orion database. When you first
start UDT, the Network Sonar Discovery Wizard is displayed automatically.
The ADD A SINGLE DEVICE option is for adding a single device to your
monitored nodes (as reflected in the All Nodes resource.
34
Page 35

Chapter 3: Discovering and Adding Network Devices
Adding Multiple Devices (Network Sonar Discovery)
SolarWinds products employ the easy-to-use Network Sonar Discovery Wizard to
direct you in the discovery of devices on your network. Before using Network
Sonar Discovery, consider the following points about network discovery in
SolarWinds UDT:
l The Network Sonar Discovery Wizard recognizes network devices that are
already in your Orion database and prevents you from importing duplicate
devices.
l CPU and Memory Utilization charts are automatically enabled for your
Windows, Cisco Systems, VMware, and Foundry Networks devices.
l The community strings you provide in the Network Sonar Discovery Wizard
are only used for SNMP GET requests, so read-only strings are sufficient.
The following procedure steps you through the discovery of devices on your
network using the Network Sonar Discovery Wizard.
To discover multiple devices on your network:
1. If the Network Sonar Discovery Wizard is not already open, click
Start> All Programs> SolarWinds Orion> Configuration and AutoDiscovery> Network Discovery.
2. If you want to create a new discovery, click Add New Discovery, click
Add New Discovery.
3. If you have already defined a network discovery, a number of options
are available on the Network Sonar Discovery tab. Select one of the
following:
l If you want to edit an existing discovery before using it, select
the discovery you want to edit, and then click Edit.
l If you want to use an existing discovery to rediscover your
network, select the discovery you want to use, click Discover Now,
and then complete the Network Sonar Results Wizard after dicovery
completes.
l If you want to import some or all devices found in a defined
discovery that you may not have already imported for
monitoring, select a currently defined discovery, and then click
Import All Results.
35
Page 36

Adding Multiple Devices (Network Sonar Discovery)
l If you want to import any newly enabled devices matching a
defined discovery profile, select a currently defined discovery, and
then click Import New Results.
l If you want to delete an existing discovery profile, select a
currently defined discovery and then click Delete.
4. If the devices on your network do not require community strings
other than the default strings public and private provided by
SolarWinds UDT, click Next on the SNMP Credentials view.
5. If any of your network devices require community strings other than
public and private or if you want to use an SNMPv3 credential,
complete the following steps to add the required SNMP credential.
Note: Repeat the following procedure for each new
community string. To speed up discovery, highlight the
most commonly used community strings on your network,
and then use the arrows to move them to the top of the list.
a. Click Add New Credential, and then select the SNMP
Version of your new credential.
b. If you are adding an SNMPv1 or SNMPv2c
credential, provide the new SNMP Community String.
c. If you are adding an SNMPv3 credential, provide the
following information for the new credential:
l User Name, Context, and Authentication Method
l Authentication Password/Key,
Privacy/Encryption Method and Password/Key, if
required.
d. Click Add.
6. Click Next on the SNMP Credentials view.
7. If you want to discover any VMware VCenter or ESX Servers on your
network, confirm that Poll for VMware is checked, and then complete the
following steps to add or edit required VMware credentials.
36
Page 37

Chapter 3: Discovering and Adding Network Devices
Note: Repeat the following procedure for each new
credential. To speed up discovery, use the arrows to move
the most commonly used credentials on your network to
the top of the list.
a. Click Add vCenter or ESX Credential.
b. If you are using an existing VMware credential,
select the appropriate credential from the Choose
Credential dropdown menu.
c. If you are adding a new VMware credential, select
<New Credential> in the Choose Credential
dropdown menu, and then provide a new credential
name in the Credential Name field.
d. Add or edit the credential User Name and
Password, as necessary.
e. Confirm the password, and then click Add.
Note: SolarWinds recommends against using
non-alphanumeric characters in VMware credential
names.
8. Click Next on the Local vCenter or ESX Credentials for VMware view.
9. If you want to discover devices located on your network within a
specific range of IP addresses, complete the following procedure.
Note: Only one selection method may be used per defined
discovery.
a. Click IP Ranges in the Selection Method menu, and
then, for each IP range, provide both a Start address and
an End address.
Note: Scheduled discovery profiles should not
use IP address ranges that include nodes with
dynamically assigned IP addresses (DHCP).
b. If you want to add another range, click Add More, and
then repeat the previous step.
37
Page 38

Adding Multiple Devices (Network Sonar Discovery)
Note: If you have multiple ranges, click X to
delete an incorrect range.
c. If you have added all the IP ranges you want to poll,
click Next.
10. If you want to discover devices connected to a specific router or on a
specific subnet of your network, complete the following procedure:
Note: Only one selection method may be used per defined
discovery.
a. Click Subnets in the Selection Method menu.
b. If you want to discover on a specific subnet, click
Add a New Subnet, provide both a Subnet Address and
a Subnet Mask for the desired subnet, and then click Add.
Note: Repeat this step for each additional
subnet you want to poll.
c. If you want to discover devices using a seed router,
click Add a Seed Router, provide the IP address of the
Router, and then click Add.
Notes:
Repeat this step for each additional seed router
you want to use.
Network Sonar reads the routing table of the
designated router and offers to discover nodes
on the Class A network (255.0.0.0 mask)
containing the seed router and, if you are
discovering devices for an Orion NPM
installation, the Class C networks
(255.255.255.0 mask) containing all interfaces
on the seed router, using the SNMP version
chosen previously on the SNMP Credentials
page.
Networks connected through the seed router
are NOT automatically selected for discovery.
38
Page 39

Chapter 3: Discovering and Adding Network Devices
d. Confirm that all networks on which you want to conduct
your network discovery are checked, and then click Next.
11. If you already know the IP addresses or hostnames of the devices
you want to discover and include in the Orion database, complete the
following procedure:
a. Click Specific Nodes in the Selection Method menu.
b. Type or paste in the IP addresses or hostnames of the
devices you want to discover for monitoring into the
provided field.
Note: Type only one IP address or hostname
per line.
c. Click Validate to confirm that the provided IP addresses
and hostnames are assigned to SNMP-enabled devices.
d. If you have provided all the IP addresses and
hostnames you want to discover, click Next.
12. Configure the options on the Discovery Settings view, as detailed in the
following steps.
a. Provide a Name and Description to distinguish the
current discovery profile from other profiles you may use to
discover other network areas.
Note: This Description displays next to the
Name in the list of available network discovery
configurations on the Network Sonar view.
b. Position the slider or type a value, in ms, to set the
SNMP Timeout.
Note: If you are encountering numerous SNMP
timeouts during Network Discovery, increase
the value for this setting. The SNMP Timeout
should be at least a little more than double the
time it takes a packet to travel the longest route
39
Page 40

Adding Multiple Devices (Network Sonar Discovery)
between devices on your network.
c. Position the slider or type a value, in ms, to set the
Search Timeout.
Note: The Search Timeout is the amount of
time Network Sonar Discovery waits to
determine if a given IP address has a network
device assigned to it.
d. Position the slider or type a value to set the number of
SNMP Retries.
Note: This value is the number of times
Network Sonar Discovery will retry a failed
SNMP request, defined as any SNMP request
that does not receive a response within the
SNMP Timeout defined above.
e. Position the slider or type a value to set the Hop Count.
Note: If the Hop Count is greater than zero,
Network Sonar Discovery searches for devices
connected to any discovered device. Each
connection to a discovered device counts as a
hop.
f. Position the slider or type a value to set the Discovery
Timeout.
Note: The Discovery Timeout is the amount of
time, in minutes, Network Sonar Discovery is
allowed to complete a network discovery. If a
discovery takes longer than the Discovery
Timeout, the discovery is terminated.
13. If you only want to use SNMP to discover devices on your network,
check Use SNMP only.
Note: By default, Network Sonar uses ICMP ping requests
to locate devices. Most information about monitored
40
Page 41

Chapter 3: Discovering and Adding Network Devices
network objects is obtained using SNMP queries.
14. If multiple Orion polling engines are available in your environment,
select the Polling Engine you want to use for this discovery.
15. Click Next.
16. If you want the discovery you are currently defining to run on a
regular schedule, select either Custom or Daily as the discovery
Frequency, as shown in the following steps:
Notes:
l Scheduled discovery profiles should not use
IP address ranges that include nodes with
dynamically assigned IP addresses (DHCP).
l Default Discovery Scheduling settings
execute a single discovery of your network
that starts immediately, once you click
Discover.
l Results of scheduled discoveries are
maintained on the Scheduled Discovery
Results tab of Network Discovery.
a. If you want to define a custom discovery schedule to
perform the currently defined discovery repeatedly in
the future, select Custom and then provide the period of
time, in hours, between discoveries.
b. If you want your scheduled discovery to run once
daily, select Daily, and then provide the time at which you
want your discovery to run every day, using the format
HH:MM AM/PM.
17. If you do not want to run your network discovery at this time, select
No, don’t run now, and then click Save or Schedule, depending on
whether you have configured the discovery to run once or on a schedule,
respectively.
If you want your Network Sonar discovery to run now, click Discover to start
your network discovery.
41
Page 42

Using the Network Sonar Results Wizard
Note: Because some devices may serve as both routers and switches, the total
number of Nodes Discovered may be less than the sum of reported Routers
Discovered plus reported Switches Discovered.
After the Network Sonar Discovery Wizard completes the node discovery and
imports results, if you click FINISH, you are taken directly to Discovery Central.
Using the Network Sonar Results Wizard
The Network Sonar Discovery Results Wizard directs you through the selection of
network devices for monitoring, and it opens whenever discovery results are
requested, either when the Network Sonar Discovery Wizard completes or when
either Import All Results or Import New Results is clicked for a selected
discovery.
The following steps detail the selection of discovered objects for monitoring in
SolarWinds UDT.
To select the results of a network discovery for monitoring in SolarWinds UDT:
1. On the Device Types to Import page, check the device types you want
SolarWinds UDT to monitor, and then click Next.
Note: If you are not sure you want to monitor a specific
device type, check the device type in question. If, later, you
do not want to monitor a selected device, simply delete the
device using Web Node Management.
2. If you are discovering devices for an Orion NPM installation, check the
interface types you want SolarWinds UDT to monitor on the Interface
Types to Import page, and then click Next.
Note: If you are not sure you want to monitor a specific
interface type, check the interface type in question. If, later,
you do not want to monitor a selected interface, delete it
using Web Node Management.
3. On the Volume Types to Import page, check the volume types you want
SolarWinds UDT to monitor, and then click Next.
Note: If you are not sure you want to monitor a specific
42
Page 43

Chapter 3: Discovering and Adding Network Devices
volume type, check the volume type in question. If, later,
you do not want to monitor any volume of the selected
type, delete the volume using Web Node Management.
4. If you want to import nodes, even when they are already known to be
polled by another polling engine, check the option in the Allow
Duplicate Nodes section.
5. If you are discovering devices for an Orion NPM installation, check
valid states for imported interfaces on the NPM Import Settings page, and
then click Next.
Note: By default, SolarWinds UDT NPM imports interfaces
that are discovered in an Operationally Up state.
However, because interfaces may cycle off and on
intermittently, the Import Settings page allows you to select
interfaces found in Operationally Down or Shutdown
states for import, as well.
6. If there are any devices on the Import Preview that you do not ever
want to import, check the device to ignore, and then click Ignore.
Selected nodes are added to the Discovery Ignore List.
7. Confirm that the network objects you want to monitor are checked on the
Import Preview page, and then click Import.
8. If you are discovering devices for an Orion NPM installation, after the
import completes, click Finish.
Note: Imported devices display in the All Nodes resource.
Adding a Node (ADD A SINGLE DEVICE)
As its name indicates, you use the ADD A SINGLE DEVICE option in Discovery
Central if you only need to add a single device.
Note: The Add a Node option (All Nodes > Manage Nodes) provides a second
way to add a single node using the same wizard screens as in the following
steps.
To add a single device:
43
Page 44

Manage Nodes
1. Click Settings near the top right of the application window.
2. Click Discovery Central in the Getting Started with Orion category.
3. Click ADD A SINGLE DEVICE.
4. Enter appropriate values in Define Node and then click Next.
a. In Hostname or IP Address, specify either value and
check Dynamic IP Address (if you intend to monitor
through SNMP), ICMP (if you want an up/down
indication through network ping), or External (NA for
SolarWinds UDT).
b. In SNMP Info, select the version, port, and enter the
correct read and read/write access string information.
5. Choose appropriate node resources to monitor.
6. Check Scan device for ports.
7. Based on the list of discovered ports, check the ones that you want UDT to
monitor.
8. Review the polling properties and adjust as needed. When you are ready,
click OK, ADD NODE.
Manage Nodes
Manage Nodes is recommended to delete, edit, list resources, manage, and
unmanage a smaller number of devices across your enterprise.
To access Manage Nodes, click Settings near the top right of the application
window. Then click Manage Nodes in the Node and Group Management
category.
Click Add a Node in the Getting Started with Orion category to add a single
device to your enterprise.
User Device Tracker Port Discovery
When you have finished discovering network devices and importing them into the
Orion database, you must discover the Ethernet ports on those devices whose
connections you want SolarWinds UDT to monitor.
44
Page 45

Chapter 3: Discovering and Adding Network Devices
To do this, you use the DISCOVER MY PORTS option in Discovery Central.
To discover ports:
1. Click Settings near the top right of the application window.
2. Click Discovery Central in the Getting Started with Orion category, and
then click DISCOVER MY PORTS.
3. If you are planning to monitor users in UDT, click Add Administrator
Credentials.
a. Enter a Credential Name. For example, if this
credential were the one that you want UDT to use in
polling the AD domain controller for user accounts,
you should call it ‘Administrator’.
b. Enter a User Name (Domain\Username) that is
known within a specific domain.
c. Enter and confirm the appropriate password, then
click Next.
Note: Whatever account you enter must have appropriate
permissions on the AD domain controller for the tasks for
which UDT would use it. The permission required to get
user details is Administrator.
4. Select the desired device classification in the Group By list.
5. Select the desired devices in the tree and then click NEXT. The discovery
begins.
Note: If you install SolarWinds UDT on a machine that already
has NPM installed (same DB), then you will be able to add ports
from any of those existing here.
6. The Advanced Filtering Options are displayed to reduce the number of
ports to actively monitor.
7. Expand the Advanced Filtering Options tree and select the desired
options:
45
Page 46

User Device Tracker Port Discovery
a. Check Active Status or Inactive Status depending
on whether you want to actively monitor the ports or
not.
b. Check Trunk if you only want to select trunk (uplink)
ports in the filter. If Trunk is not checked, then both
trunk ports and access ports will be selected in the
filter.
c. Specify Port Range using values separated by
commas. HP uses a convention of 1-48. Cisco uses
a row/port notation (and a switch/row/port notation for
stacked switches). An example for Cisco is: 0/1-48,
1/1-48,1/1-24 etc.
d. Specify VLAN as an integer ranging from 1-4095.
You can provide a comma-separated list or range.
For example: 1,2,5,6-20,66.
e. Specify Port Description for each port by specifying
a different description on each line using strings, *, or
regular expressions. For information about using
regular expressions, refer to Appendix C, “Regular
Expression Pattern Matching.”
8. Expand the Device tree at the bottom of the page and select the desired
ports:
9. Click Filter All Ports Below to apply the selected filtering options to the
selected ports. If you want to undo the filtering, deselect the Advanced
Filtering Options chosen previously and click Filter All Ports Below.
Then click the check box next to the Name column (or the check box next
to each desired device name) to restore all the discovered ports.
10. Click NEXT to begin monitoring the selected ports.
11. If no new Active Directory Domain Controllers were discovered, and you
want to monitor users with UDT, you will need to add the relevant AD
domain controllers after finishing the discovery wizard.
In the meantime, click IMPORT.
Details on the ports successfully imported are listed.
46
Page 47

Chapter 3: Discovering and Adding Network Devices
12. If you want to setup devices on a Watch List, so that you are alerted when
they are seen on the network, click Next.
a. Click Add Device.
b. Add the MAC address, IP address, or hostname.
c. Give the device a descriptive name by which to
recognize it in alerts.
d. Click OK.
13. Click OK, I’M DONE to return to Orion Summary Home, or click SETUP
WATCH LIST to set up a watch list for selected hostnames and MAC
addresses on your monitored ports.
47
Page 48

Chapter 4: Adding Active Directory Controllers and Users
This chapter follows the process of adding an Active Directory domain controller
into UDT and using it to track the activity of AD-associated users on your network.
UDT tracks user activity by reading an event log on the AD domain controller.
Reading that log requires, UDT to have the Event LogReader permission on each
AD controller through which it is tracking user activity.
Before you add an AD domain controller, and begin tracking the user accounts
that are associated with it, you must first create appropriate credentials for UDT to
use in interacting with it.
Manage Active Directory Administrator Credentials
Click Manage Active Directory Administrator Credentials in the UDT Settings
section to create, edit, and delete credentials the UDT uses to communicate with
AD domain controllers.
Adding a New AD Credential
Follow these steps to add a new AD credential into UDT.To add a new credential:
1. Click Manage Active Directory Administrator Credentials in the UDT
Credentials area in UDT Settings (Settings > UDT Settings).
2. Click Add UDT Credential.
Enter a Credential Name. For example, if this credential were the one that
you want UDT to use in retrieving event log data from an AD domain
controller, you might call it Event Log Reader.Enter a User Name
(Domain\Username) that is known within a specific domain.
Note: Whatever account you enter must have appropriate
permissions on the AD domain controller for the tasks for which
48
Page 49

Chapter 4: Adding Active Directory Controllers and Users
UDT would use it. The permission required to access the Event
Log is Event Log Reader.
So continuing the example, if this credential is the one that you want UDT to
use in retrieving user login data from an AD domain controller, you should
obtain from the AD domain controller administrator a user account with the
Event Log Reader permission; and enter that username.
3. Enter and confirm the appropriate password, then click OK.
Editing an AD Credential
1. Follow these steps to edit an AD credential into UDT.To edit a
credential:Click Manage Active Directory Administrator Credentials in the
UDT Credentials area in UDT Settings (Settings > UDT Settings).
2. Click the Credential Name in the list, then click Edit Credential.
3. Make your changes.
a. Enter a Credential Name. For example, if this credential
were the one that you want UDT to use in retrieving event
log data from an AD domain controller, you might call it
Event Log Reader.
b. Enter a User Name (Domain\Username) that is known
within a specific domain.
Note: Whatever account you enter must have
appropriate permissions on the AD domain
controller for the tasks for which UDT would
use it. The permission required to access the
Event Log is Event Log Reader.
So continuing the example, if this credential is the one that
you want UDT to use in retrieving user login data from an
AD domain controller, you should obtain from the AD
domain controller administrator a user account with the
Event Log Reader permission; and enter that username.
49
Page 50

Deleting an AD Credential
c. Enter and confirm the appropriate password, then click
OK.
Deleting an AD Credential
Follow these steps to delete a credential.To delete a credential:
1. Click Manage Active Directory Administrator Credentials in the UDT
Credentials area in UDT Settings (Settings > UDT Settings).
2. Click the Credential Name in the list, then click Delete Credential.
Managing Active Directory Domain Controllers
UDT uses Active Directory domain controllers to retrieve information about user
activity on the network devices.
The following sections explain how to add, edit, and delete AD domain controllers
from within UDT.
Adding a New AD domain controller
Follow these steps to add a new AD domain controller into UDT.To add a new
domain controller:
1. Click Manage Active Directory Domain Controller in the Track Users and
Endpoints area in UDT Settings (Settings > UDT Settings).
2. Click Add AD Domain Controller. Enter a hostname or IP address under
Define Node.
3. Check Active Directory Domain Controller in Additional Monitoring Options.
Select the appropriate credential for UDT to use with this AD domain controller.
The UDT software automatically populates User Name and Password based on
the values you entered when you created the credential.
4. Click Next.
5.Select the node resources to monitor, then click Next.
6. Check Scan device for ports if you want to monitor the ports on this AD domain
controller.
7. Review the properties you defined. When you are ready, click OK, ADD
NODE.
Note: The Domain Controller Polling Interval indicates how
50
Page 51

Chapter 4: Adding Active Directory Controllers and Users
often UDT updates its information about user activity within the
domain.
8. Click Advanced Settings under UDT Settings on the User Device Tracker
Settings page (Settings > UDT Settings).
9. Review and adjust as needed the AD User Update Interval to match the rate at
which AD user information is updated. This setting determines how often UDT
polls the AD domain controller for user information.
10. After the polling interval, review the user information available from this AD
domain controller in the All User Logins resource on the UDT Summary view.
Editing an AD domain controller
Follow these steps to edit a AD domain controller.To edit a domain controller:
1. Click Manage Active Directory Administrator Credentials in the UDT
Credentials area in UDT Settings (Settings > UDT Settings).
Select the AD domain controller in the list.
2. Click Submit.
Assign a credential to an AD domain controller
Follow these steps to assign a credential to an AD domain controller. To assign a
credential:
1. Click Manage Active Directory Administrator Credentials in the UDT
Credentials area in UDT Settings (Settings > UDT Settings) and select
one or more AD domain controllers in the list.
2. Click Assign security log access credentials and select the relevant
credential.
3. If you are ready to assign the credential to the selected node(s), click OK.
Deleting an AD Domain Controller
Follow these steps to delete a domain controller.To delete a domain controller:
1. Click Manage Active Directory Administrator Credentials in the UDT
Credentials area in UDT Settings (Settings > UDT Settings).
Select one or more AD domain controllers in the list.
2. Click Delete.
51
Page 52

Setting up Polling of User Data Across Domains
3. If you want to delete the node from UDT, select Delete node and data from
UDT only.
4. If you want to delete the node from all Orion products, select Delete node
from all modules.
5. Click Delete.
Setting up Polling of User Data Across Domains
Enabling UDT to poll user data—essentially, by retrieving event log data—on an
AD domain controller outside the local domain of the UDT server requires setup
both in UDT and the AD domain controller.
UDT supports the following methods for getting event log data from another
domain:
l Eventing6
This is the preferred method and depends on the AD domain controller
running Windows 2008 R2.
l WMI
This method is supported across Windows platforms.
UDT collects user information through a scheduled job (REL). Two settings—
UDT.GetUserInfoThroughWMIForEventing6 (turned-off by default),
UDT.GetUserInfoThroughWMI (turned-on by default and should not be changed)
—determine how UD collects the information.
Defining Credentials for Polling Across Domains
Keep in mind these requirements when you set-up your credentials for accessing
an AD domain controller outside the local UDT server domain.
l The UDT user account must be part of the target domain.
l The UDT user account must either be a member of the Administrators group
on the target domain controller or a limited account with privileges to access
the remote security event log and directory service on the remote domain
controller. If UDT is using a limited account the account must be a member
of these groups:
52
Page 53

Chapter 4: Adding Active Directory Controllers and Users
o
Domain Users
o
Distributed COM Users
o
Event Log Readers
l As an alternative, you can use these instructions to give the account the
relevant privileges.
l The UDT account must be able to access certain WMI namespaces.
Setting WMI Namespace Security:
You configure access to WMI namespaces through these steps on the target AD
domain controller.
1. Open Administrative Tools (Control Panel > Administrative Tools)
2. Double-click Computer Management.
3. Expand the Services and Applications and double-click WMI Control.
4. Right-click WMI Control, and then select Properties.
5. On the Security tab, expand the tree under Root.
6. Select CIMv2 and then click Security.
7. Click Advanced.
8. Click Add
9. Enter the account name in the text box and then click OK.
10. Confirm that Apply to is set to This namespace and subnamespaces.
11. Select the Allow check boxes for Execute Methods, Enable Account, and
Remote Enable.
12. Click OK.
13. Select directory and then click Security.
14. Repeat steps 7-12.
Note: The Custom Security Descriptor (CustomSD) in Windows 2003 Server may
obstruct retrieval of user data even though the connection is open.
53
Page 54

Adding a New AD Credential
After you have the desired account setup for WMI access on the AD domain
controller, you can add the account credentials to UDT. To do that, see “Adding a
New AD Credential
Adding a New AD Credential
Follow these steps to add a new AD credential into UDT.
To add a new credential:
1. Click Manage Active Directory Administrator Credentials in the UDT
Credentials area in UDT Settings (Settings > UDT Settings).
2. Click Add UDT Credential
3. Enter a Credential Name. For example, if this credential were the one that
you want UDT to use in retrieving event log data from an AD domain
controller, you might call it Event Log Reader.
4. Enter a User Name (Domain\Username) that is known within a specific
domain.
Note: Whatever account you enter must have appropriate permissions on the AD
domain controller for the tasks for which UDT would use it. The permission
required to access the Event Log is Event Log Reader. See the section on
“Defining Credentials for Polling Across Domains” if the AD domain controller for
which you are setting up UDT credentials resides in a domain outside the domain
of the UDT server.
54
Page 55

Chapter 5
Chapter 5: Viewing Device, Port, and User Status
The following sections provide a short list and overview of the views and
resources provided with User Device Tracker that reveal status information.
Understanding the Device Tracker Summary
The Device Tracker Summary view provides the following resources. You can
customize which of these resources appear on the page by clicking Customize
Page.
All UDT Nodes
The All UDT Nodes resource provides a list of nodes, grouped by node
property, with a status icon and the node name displayed for each node.
Expanding a node displays the ports for the node with a status icon and the
port name displayed for each port.
Total Ports Currently Used
Provides a chart with the total number and percentage of used and free
ports.
All User Log Ins
Provides a list of users logged in within the footprint of the monitored
network. Logins are listed by most to least recent.
User Search (type in a username) to limit the list to the logins by a specific
user.
Active Alerts
Provides a list of the active alerts associated with UDT devices and ports.
Top XX Nodes by Percent Ports Use
Provides a list of the nodes with the highest percent of ports used. Because
comparing disparate statistic measurements is of limited use, we suggest
55
Page 56

Chapter 5: Viewing Device, Port, and User Status
you create Statistic Data resource containing filters to limit the statistic
sources.
Device Watch List
Displays the Device Watch List.
Ethernet Ports Used Over Time
Provides a chart of the ethernet ports used over time with a menu of view
options for:
o
Last 7 days
o
Last 30 days
o
Edit Chart
o
View Chart Data
o
View Chart Data in Excel
Last 25 Events
Provides a list of the last twenty-five events associated with UDT.
Understanding the Device Tracker Port Details
The Device Tracker Port Details view opens when you click on a specific port on
a node in UDT Nodes; and provides the following resources. You can customize
which of these resources appear on the page by clicking Customize Page. You
may see different resources depending on the item you are viewing.
Port Details
Provides a list of port properties, including the port name, port number, MAC
addresses of the devices connected to the port, VLANs, and Duplex mode.
Click EDIT to specify the following port details information:
o
Maximum Number of IPV4 Addresses to Display – specifies the
maximum number of connected IPV4 addresses to display in the GUI.
o
Maximum Number of IPV6 Addresses to Display – specifies the
maximum number of connected IPV6 addresses to display in the GUI.
o
Maximum Number of MACs to Display – specifies the maximum number
of connected MAC addresses to display in the GUI.
56
Page 57

Viewing Node and Port Data in Tooltips
Port History
Provides a table of port history information, including the time period,
connected IP addresses, connected MAC addresses, and hostnames.
Click EDIT to specify the following port history information:
o
Maximum Number of Rows to Display – specifies the maximum number
of rows to display in the history table for the GUI.
Viewing Node and Port Data in Tooltips
Node and port tooltips in SolarWinds UDT provide immediate status overviews of
monitored nodes and ports. To view a quick overview of any monitored node or
port in the web console, hover over a node or port. Depending on the selected
device, the information in the following tables is displayed immediately.
Node Tooltips
Hover over… To see…
Node Status Current status of the node (up, down, warning, unplugged, or
unmanaged)
IP Address The IP address currently assigned to the selected node
Machine Type The vendor icon and vendor description of the selected node
Average
Response
Time
Packet Loss The percent of all transmitted packets that are lost by the
CPU Load The percent of available processing capacity on the selected
Memory Used The percent of available memory on the selected node that is
The measured average response time of the selected node as of
the last node poll
selected node as of the last node poll
node that is currently used as of the last node poll
currently used as of the last node poll
57
Page 58

Chapter 5: Viewing Device, Port, and User Status
Port Tooltips
Hover over… To see…
Port Name Name of the port.
Oper Status Operational status of the port (up, down).
Admin Status Administrative status of the server (up, down, warning,
unplugged, or unmanaged).
Interface Type The interface type of the port.
Active Connection Whether the connection is active or not.
VLAN Displays information about the VLAN.
Duplex Displays the Duplex mode: FullDuplex, HalfDuplex, or
Unknown.
number of
connected IPs
number of
connected MACs
Number of connected IP addresses
Number of connected MAC addresses
Understanding the Device Tracker User Details
Device Tracker User Details view opens when you click on a specific user listed
under All User Log Ins; and provides the following resources. You can customize
which of these resources appear on the page by clicking Customize Page. And
you can export the view to a PDF file by clicking Export to PDF.
User Details
Provides a list of details associated with the user account, including the
user’s display name, first and last name, title, department, office, company,
manager, assistant, email addresses, group memberships, phone number,
street address, city, state, zip code and country/region.
Click EDIT to specify the maximum number of email addresses or groups to
display for this user and the maximum number or details (rows) to display for
from the user record.
58
Page 59

Viewing User Data in Tooltips
Note: the UDT database receives all the information from the AD domain
controller that the administrator has not blocked due to internal or other
policies.
All Endpoint Log Ins
Provides a searchable list of endpoints on which this specific user has
logged in, including the endpoint name, most recent log in time.
Use the Search window to see data only related to a specific endpoint.
Click Show All to see a complete list for this user that extends beyond the
row limit set for the resource display.
Click EDIT to specify the number of rows to display.
Viewing User Data in Tooltips
User tooltips in SolarWinds UDT provide immediate status overviews of
monitored users. To view a quick overview of any monitored user in the web
console, hover over a user in the list. Depending on the selected user, and the
policies on the AD domain controller, the information in the relevant user record is
displayed. This table includes an example of the information commonly available;
most fields are self-explanatory.
User Tooltips
Hover over… To see…
User The user name on the relevant AD domain controller.
Title The user’s title within the company.
Office Ther user’s home office within the company.
Department The user’s department within the company.
Company The user’s company.
Address The user’s company address.
City The city in which the user’s office is located.
State The state in which the user’s office is located.
Zip Code The relevant USPS postal code.
Country/Region The country in which the user is based.
59
Page 60

Chapter 5: Viewing Device, Port, and User Status
60
Page 61

Chapter 6: Common Tasks with SolarWinds UDT
The following sections provide a scenario-based overview of using SolarWinds
UDT.
This chapter contains the following sections:
l Finding the switch and port where a particular hostname, IP, or
MAC address is connected now or in the past
l Finding Endpoints in a Subnet
l Finding a User’s Connections
l Creating and managing a Watch List
Finding the switch and port where a particular
hostname, IP, or MAC address is/was connected
Scenario: I need to find the switch and port where a particular hostname, IP, or
MAC address is now connected or was connected in the past in order to respond
to a security or network problem.
To find the switch and port where a particular hostname, IP, or MAC address is
connected:
1. Click the DEVICE TRACKER tab, if not already selected.
2. Locate UDT Search (just below the menu bar near the top right of the
page).
3.
Click the menu button in the search box, and select the desired option(s)
for the search.
Note: MAC addresses are stored without formating; you
can successfully search for a MAC address with format
61
Page 62

Chapter 6: Common Tasks with SolarWinds UDT
xxxx.xxxx.xxxx or xx-xx-xx-xx-xx-xx or xx:xx:xx:xx:xx:xx.
4. Enter the desired term for the search.
This example uses IP address ’10.199.0.3’ as the target device.
In general, specific matches are required sought unless wildcards are used
in the search term. This means that if you search for laptop and there is a
machine named laptop01, you will not find it unless you search for laptop01
or laptop* (or other valid wildcard search).
5.
Press Enter or click the search button to begin the search.
The search results are displayed in a scrollable, tabular view. For each
item, the following information is displayed in columns:
l Match Item
l Match Type
In this example, searching on subnet ’10.199.*’, we get a list of one item and
the software automatically navigates to the Device Tracker Endpoint Details
for ’10.199.0.3’, showing us:
Node Port Node Name Connection Duration Connection Type
A1 Core-4500 24 days, 8 hours, 5 minutes Endpoint IP Address
(Router) Core-4500 24 days, 8 hours, 5 minutes Endpoint IP Address
Notes:
l Search returns a separate row each for active and inactive
connections.
l If you cannot find a device, but know that it is connected, search
using the MAC address to find the port that points to a physical
location. MAC addresses are stored without formating.; you can
successfully search for a MAC address with format
xxxx.xxxx.xxxx or xx-xx-xx-xx-xx-xx or xx:xx:xx:xx:xx:xx.
62
Page 63

Finding Endpoints in a Subnet
6. To monitor this endpoint as a node, click Start monitoring as a node under
Endpoint details.
Finding Endpoints in a Subnet
Scenario: I need to find all endpoints currently on a subnet.
To find all endpoints on a subnet:
1. Click the DEVICE TRACKER tab, if not already selected.
2. Locate UDT Search (just below the menu bar near the top right of the
page).
3.
Click the menu button in the search box, and select the desired option(s)
for the search.
Note: MAC addresses are stored without formating; you can
successfully search for a MAC address with format xxxx.xxxx.xxxx or
xx-xx-xx-xx-xx-xx or xx:xx:xx:xx:xx:xx.
4. Enter the desired term for the search.
This example uses IP address ’10.199.3.*” as the target subnet.
In this case we are searching for an exact match. In general, specific
matches are required sought unless wildcards are used in the search term.
This means that if you search for laptop and there is a machine named
laptop01, you will not find it unless you search for laptop01 or laptop* (or
other valid wildcard search).
More wildcard examples:
l Fa1* – (when used with Port Number search option) matches
any port number that begins with Fa1 followed by any
characters.
l MAC Address: 00:0C*
l IP Address: 10.10.10.*
l Cisco3750-* (assuming each of three stacked switches were
added as individual devices, using a common naming
convention like Cisco3750-1, Cisco3750-2, Cisco3750-3; in this
63
Page 64

Chapter 6: Common Tasks with SolarWinds UDT
search you would select the ‘Connected To’ drop-down list
beside Search).
5.
Press Enter or click the search button to begin the search.
The search results are displayed in a scrollable, tabular view:
Match Item Match Type
10.199.3.1 Endpoint IP Address
10.199.3.10 Endpoint IP Address
10.199.3.100 Endpoint IP Address
10.199.3.101 Endpoint IP Address
10.199.3.102 Endpoint IP Address
10.199.3.103 Endpoint IP Address
… …
6. From the search results, you can select an item and then click Add
To Watch List in order to add the item to the device watch list.
Finding a User’s Connections
Scenario: I need to find the endpoint(s) where a specific user is or has been
connected to the network.
To find a user connection:
1. Click the DEVICE TRACKER tab, if not already selected.
2. Locate UDT Search (just below the menu bar near the top right of the
page).
3.
Click the menu button in the search box, and select user name.
4. Enter the user name to search (in this example, “Anais.Nin”) press Enter or
click the search button to begin the search.
64
Page 65

Creating and Managing a Watch List
With a successful search the software automatically navigates to the Device
Tracker User Details for domain\Anais.Nin, showing us the user’s
connections in the All Endpoint Log Ins resource:
Endpoint Name Most Recent Log In Time
10.110.67.21 12/14/2011 4:24:15 PM
10.110.67.68 12/13/2011 1:02:00 PM
Creating and Managing a Watch List
Scenario: I need to create a watch list to be alerted when particular IP or MAC
addresses are connected to the network.
This scenario assumes that you already have discovered appropriate nodes and
ports.
To create a watch list:
1. Click the DEVICE TRACKER tab, if not already selected.
2. Click Settings near the top of the web console.
3. Click Discovery Central in the Getting Started with Orion category.
4. Click DISCOVER MY PORTS to run the Device Tracker Discovery wizard.
You are given a chance to set up a watch list in the last step of the wizard.
5. Click SETUP WATCH LIST on the RESULTS page of Device Tracker
Discovery wizard.
6. Click FINISH on the WATCH LIST page of Device Tracker Discovery
wizard to set up a watch list to monitor MAC addresses, IP addresses, and
hostnames on the network by watching their activity.
65
Page 66

Chapter 7: Alerting and Reporting
The following sections provide an overview of the alerting and reporting
capabilities built into SolarWinds UDT.
Editing Alerts
SolarWinds UDT provides device alerts you can use with Orion Advanced Alert
Manager to actively monitor and respond to detected issues.
Note: Only advanced alerts may be used for SolarWinds UDT-specific purposes.
Basic alerts cannot be configured to trigger on SolarWinds UDT conditions or
events.
Configuring SolarWinds UDT Alerts
Configuring an alert for SolarWinds UDT is similar to configuring an alert for Orion
Network Performance Monitor.
The UDT alerts currently available are:
l Alert me when a new MAC address appears on network
l Alert me when a Hostname appears on the network
l Alert me when watch list item becomes active
To configure a default UDT alert:
1. Log on to the Windows server hosting SolarWinds UDT.
2. Click Start> All Programs> SolarWinds Orion> Alerting, Reporting,
and Mapping > Advanced Alert Manager.
3. Click Configure Alerts. This opens the Manage Alerts window.
4. Select the relevant UDT alert in the list.
5. Click Edit.
6. Click the Trigger Condition tab.
7. Select the appropriate UDT item from the Type of Property to Monitor
66
Page 67

Chapter 7: Alerting and Reporting
list.
8. Adjust the trigger condition as needed.
Most likely you do not need to adjust this statement. For example, the
default trigger for “Alert me when a new MAC address appears on the
network” is ‘Is New MAC is equal to 1’. In this case there are only two
values possible, ‘1’ and NULL.
To set up the alert trigger action:
These steps use “Alert me when watch list item becomes active” as
the alert being setup.
9. Click the Trigger Actions tab (with the relevant UDT alert still open).
10. Click Add New Action.
11. Select Log the Alert to the NetPerfMon Event Log, and then click OK.
l The next steps build the message that will appear in the Orion Event
Log when the “Alert me when watch list item becomes active” alert is
triggered.
12. Type a string in the message field that begins a statement of the alert.
Keep in mind that you will be inserting variables that the software
populates with values at runtime; so you are building your message
around the variables.
l For example, if you want to give the Watch item type and node
involved in the triggered alert, you might begin your alert statement
with “Watch list type” in the message field and leave the cursor sitting
at the end of the phrase.
13. Click Insert Variable.
14. Select the relevant variable category from the list and then select the
appropriate varible.
l Continuing with the Watch list alert as an example, select Watch List
from the Variable Category list, select WatchItemType from the
Select A Variable list.
67
Page 68

Creating SolarWinds UDT-Specific Reports
15. Click Build Selected Variable.
l You now should see the phrase “Watch item type ${WatchItemType}”
in the message box. At runtime, the Orion software fills in the variable
based on the triggered alert and publishes the appropriate message
in Orion Even Log.
l The next variable will add the relevant Watch list node into the Event
Log message.
16. Position the cursor at the end of the message under construction in the
message box and type "of node". Click Insert Variable when you are
finished.
17. Select General from the Variable Category list, select NodeName from
the Select A Variable list, and then click Build Selected Variable.
You now should see the phrase “Watch item type ${WatchItemType} of
node ${NodeName}” in the message box.
18. Position the cursor at the end of the message under construction in the
message box and type " is ". Click Insert Variable when you are finished.
19. Select Watch List from the Variable Category list, select Present from the
Select A Variable list, and then click Build Selected Variable.
Note: The full message should read " The watch item type
${WatchItemType} of node ${NodeName} is ${Present}".
20. Click OK to close the Log Alert window.
21. Click OK to close the Edit Alert window.
22. Click Done to close the Manage Alerts window.
If any of your items in the Watch list become connected to the network, you will
now see a line item for each in the Event Log.
Creating SolarWinds UDT-Specific Reports
SolarWinds UDT information is easily presented in a variety of formats using
SolarWinds Orion Report Writer. SolarWinds provides Report Writer as a quick
and easy way for you to extract data from your database, including SolarWinds
UDT statistics, for presentation in a useful form. A number of predefined
68
Page 69

Chapter 7: Alerting and Reporting
SolarWinds UDT-specific reports are available with your installation of
SolarWinds UDT. Report Writer also enables custom SolarWinds UDT report
creation, as necessary, using criteria and conditions you choose. When you have
finished editing your reports, you can view them through the Web Console and
print them with the click of a button.
A report scheduling application is available to all customers with a current
maintenance agreement. This tool schedules automatic email reports that can be
sent to individual users or groups of users. Log in to the customer portal of
www.solarwinds.com and download the Report Scheduler.
Report Writer capabilities are further enhanced when they are used in conjunction
with the Custom Property Editor. Custom properties are available for report
sorting and filtering.
Using Predefined SolarWinds UDT Reports
The following historical SolarWinds UDT reports are immediately available with
your SolarWinds UDT installation.
The following UDT predefined reports are included with Report Writer:
UDT Capacity:
l UDT Capacity
l VLAN Devices
UDT: Connected Devices:
l Active Endpoints (per node)
Generates a report including the IP Address, DNS Name, MAC Address,
Port Name, VLAN, and Connection Type.
l Connected MAC and IP Addresses
Generates a report including the Node, Port Number, Port Name, MAC
Address(es)(connected), and IP address(es)(connected).
l List of IPv6 Addresses
Generates a list of endpoints with IPv6 address
l OUI Summary Report
69
Page 70

Viewing and Editing Reports
Generates a report including the MAC Prefix (OUI), Company, and Endpoint
Count.
l OUI Report
Generates a report including the MAC Address and Company.
l UDT Unused Ports
Generates a report including the Node, Date/Time, Ports Used (percent).
UDT Users:
l User History Report
Viewing and Editing Reports
Before you can use Report Writer, you must have collected at least a few minutes
worth of data in a database that is populated with the devices that you want to
monitor.
As an example, the following procedures use the Connected MAC and IP
Addresses report.
Use the following procedures to view a predefined UDT report.
To view a predefined UDT Report:
1. Click Start> All Programs> SolarWinds Orion> Alerting, Reporting,
and Mapping> Report Writer.
2. File> Open.
3. Select Connected MAC and IP Addresses in the list.
4. Click Execute SQL.
5. Click Preview.
6. Click Print if you want a printed copy of the report with the current snapshot
of data.
Use the following procedures to edit a predefined UDT report.
To edit a predefined UDT Report:
70
Page 71

Chapter 7: Alerting and Reporting
1. Click Start> All Programs> SolarWinds Orion> Alerting, Reporting,
and Mapping> Report Writer.
2. Click File> New Report.
3. The example calls for a report MAC and IP addresses, so select UDT
Connected MAC and IP Addresses, and then click OK.
4. By default the Connected MAC and IP Addresses report appears in the
UDT Connected Devices Report Group.
You can modify the group as needed; for example, you might want to define
a group called “My Reports” that runs a variation on this predefined report.
71
Page 72

Viewing and Editing Reports
5. Select Landscape for the paper orientation, and then confirm that Make
this Report availablefrom the Orion website is checked.
6. Click Select Fields.
7. Review the current Field .selections.
8. To change the order of defined Field values, right click the relevant Field
value and click Move current field forward (to reposition one slot down in
the list) or Move currrent field backwards (to reposition one slot up in the
list).
9. Click Execute SQL Query to view the reordered report data in the preview
window.
72
Page 73

Chapter 7: Alerting and Reporting
Note: Column widths are adjustable. To change a column width,
place your cursor on the column divider and drag it to a different
position.
10. Click Select Fields.
11. For any Field item click the sort asterisk and select the desired sort type
(none, ascending, or descending) to affect the sort order for the report.
12. Click Execute SQL Query to view the report in the resorted form.
13. Click Time Frame.
14. Adjust the time frame as needed.(for example, switch to a Relative Time
Frame, with the past 7 Days as the data range).
15. If you want to break down the report day-by-day, click Summarization
and specify your choices.
73
Page 74

Filtering and Grouping Data in Resources
16. If you want to filter your report, click Filter Results and specify filter rules,
as on the Select Fields tab.
17. Click File> Save to save your work.
Filtering and Grouping Data in Resources
You can reorganize and filter data within a resource using SQL or SolarWinds
Query Language (SWQL), a SQL-like filter syntax. The filter description on each
resource tells you whether to use SQL or SWQL.
Grouping Applications
The following procedure walks you through changing the way node data is
grouped in a resource.
To group resource data by category:
1. Log on to the Orion Web Console.
2. Click the DEVICE TRACKER tab.
3. Click EDIT on the resource with the grouping you want to change.
4. Select the category that you want to group by from the Level 1 list.
5. If you want to group by more subcategories, select additional categories
from the Level 2 and the Level 3 lists.
6. Click SUBMIT.
74
Page 75

Chapter 7: Alerting and Reporting
Filtering Data Using Filter Criteria
The following procedure explains how to limit the data sources in a resource by
setting filter criteria in SQL syntax. For more information about the filter syntax,
see “SQL Syntax” on page75.
To filter node data using filter syntax:
1. Log on to the Orion Web Console.
2. Click the DEVICE TRACKER tab.
3. Click EDIT on the resource that you want to change.
4. Type your filter criteria in the Filter Nodes (SQL) field.
5. Click SUBMIT.
SQL Syntax
Some resources allow you to filter data using the SQL syntax described below.
Wildcards
The wildcard character in SQL syntax is: *.
Example: Node.Caption Like 'AX3*'
Filtering by Custom Property
The property syntax to filter by custom property is:
dataType.CustomProperty.propertyName
Example filter to only show nodes with the custom property City that matches
Atlanta:
Node.CustomProperty.City = 'Atlanta'
Filtering by Status
To filter by the status, you must know the valid status levels.
Level Status
0 Unknown
1 Up
75
Page 76

Built-in SQL Node Properties
2 Down
3 Warning
14 Critical
Example filter to only show monitors that are not down:
MonitorStatus.Availability<>2
Built-in SQL Node Properties
Nodes.Caption Nodes.NodeID Nodes.Status
SWQL Syntax
Some resources allow you to filter data using the SWQL syntax described below.
Wildcards
The wildcard character in SWQL syntax is: %.
Example: Node.Caption Like 'AX3%'
Filtering by Custom Property
The property syntax to filter by custom property is:
dataType.CustomProperties.propertyName
Example filter to only show nodes with the custom property City that matches
Atlanta:
Node.CustomProperties.City = 'Atlanta'
Filtering by Built-in Properties
Many properties have the same name between data types. To prevent ambiguity,
SolarWinds UDT prefixes the property names with the data type.
Examples
Example filter to show data from Cisco devices:
Node.Vendor = 'Cisco'
Example filter to show data from Windows Server 2003-2008 applications:
76
Page 77

Chapter 7: Alerting and Reporting
Application.Name = 'Windows Server 2003-2008'
Example filter to show data from devices beginning with "AX3":
Node.Caption Like 'AX3%'
Example filter to show data from Process Monitor – SNMP type component
monitors:
Monitor.ComponentType = 8
Filtering by Status
To filter by the status property, you must know the valid status levels.
Level Status
0 Unknown
1 Up
2 Down
3 Warning
14 Critical
Example filter to only show monitors that are not down:
MonitorStatus.Availability<>2
Built-in SWQL Nodes Properties
Node.AvgResponseTime Node.CPULoad Node.Caption
Node.Contact Node.DNS Node.Description
Node.GroupStatus Node.IOSImage Node.IOSVersion
Node.IPAddress Node.LastBoot Node.LastSync
Node.Location Node.MachineType Node.MaxResponseTime
Node.MemoryUsed Node.MinResponseTime Node.NodeID
Node.ObjectSubType Node.OrionID Node.PercentLoss
77
Page 78

Built-in SWQL Nodes Properties
Node.PercentMemoryUsed Node.ResponseTime Node.Severity
Node.Status Node.StatusDescription Node.SysName
Node.SysObjectID Node.SystemUpTime Node.TotalMemory
Node.Vendor Node.VendorIcon
78
Page 79

Chapter 8: Configuring SolarWinds UDT
You can configure SolarWinds UDT and its port information, watch list, and
settings through the Orion Web Console by using the UDT Settings page.
To configure SolarWinds UDT:
1. Log on to your Orion Web Console with an Administrator account.
Note: Initially, Admin is the default administrator user ID
with a blank password.
2. Click the DEVICE TRACKER tab.
3. Click UDT Settings.
Refer to the sections that follow for details about the administrative commands
available in each category:
l Port Management
o
Manage Ports
o
User Device Tracker Discovery
l Track Users and Endpoints
o
Manage Active Directory Domain Controller
o
Manage Watch List
l Track Users and Endpoints
o
Polling Interval
79
Page 80

Chapter 8: Configuring SolarWinds UDT
o
Data Retention
o
Port Thresholds
o
View UDT Job Status
o
Advanced Settings
l License Summary
o
UDT License Summary
l thwack Community
o
UDT thwack Forum
l UDT Credentialsthwack Community
o
Manage Active Directory Administrator Credentials
Port Management
The Port Management category gives you access to the commands that allow you
to manage and discover ports.
Manage Ports
Click Manage Ports in the UDT Settings section to add, configure, and delete
ports.
User Device Tracker Discovery
Click User Device Tracker Discovery in the UDT Settings section to discover
ports.
Track Users and Endpoints
The Track Users and Endpoints category gives you access to the commands that
allow you to setup user tracking and manage a device watch list..
80
Page 81

Manage Active Directory Domain Controller
Manage Active Directory Domain Controller
Click Manage Active Directory Domain Controller option to add, edit, and
delete AD domain controllers UDT uses to obtain user data.
Manage Watch List
Click Manage Watch List in the UDT Settings section to add or delete endpoints
to/from a Device Watch List
UDT Settings
The UDT Settings category gives you access to the commands that allow you to
view and manage global UDT settings.
Polling Interval
Click Polling Interval in the UDT Settings section to determine how frequently
UDT polls a node for port status and what endpoints are connected to the port.
Data Retention
Click Data Retention in the UDT Settings section to specify how long
SolarWinds UDT keeps historical information in the database. By default this is
90 days.
Port Thresholds
Click Thresholds in the UDT Settings section to set the level at which a port will
be included in a High Port Utilization Report.
View UDT Job Status
Click View UDT Job Status in the UDT Settings section to view the status for the
UDT jobs for each node, showing the node name and IP address, job type, date
and time for the last time the job was run, date and time for the next time the job
will be run.
Click Poll Now to immediately run the corresponding UDT job.
Advanced Settings
Click Advanced Settings in the UDT Settings section to select more port types,
review and change settings that determine how frequently UDT contacts AD
domain controllers for user account updates, the overall limit for the number of
81
Page 82

Chapter 8: Configuring SolarWinds UDT
rows UDT could return in search results, and timeouts for SNMP polling, port
discovery, layer 3 device discovery, jobs (layer 2 and 3), DNS resolution jobs,
cached DNS data.
Click SAVE whenever you make changes to settings on this page.
License Summary
The License Summary category gives you access to the command that allows
you to view the license information summary.
UDT License Summary
Click UDT License Summary in the UDT Settings section to see a comparison
between the current number of nodes and volumes and the limits allowed by your
SolarWinds UDT license.
This page also displays the licensing information for both the Orion core and User
Device Tracker and shows the version of the applications that you are running.
thwack Community
The thwack Community category gives you access to the commands that allow
you to view and download useful information from the thwack community for
SolarWinds users.
UDT thwack Forum
Click UDT thwack Forum in the UDT Settings section to browse the information
provided in the UDT thwack Forum.
UDT Credentials
UDT Credentials allows you to add, edit, or delete the credentials by which UDT
will access AD domain controllers.
82
Page 83

Account List
Click Account List on the Settings page to open the Orion Website Accounts
view, providing an immediate overview of web console user account settings.
You may use this view to make changes to multiple accounts simultaneously and
immediately by clicking to check or clear options. Clicking an Account user
name opens the Account Manager for the selected account.
83
Page 84

Credentials
The Credentials category provides commands to add, edit, and delete
credentials.
Manage Windows Credentials
Click Manage Windows Credentials on the Settings page to add, edit, and
delete credentials that can access the Orion Web Console and UDT.
Customize
The Customize category provides commands to customize the navigation and
appearance of your Orion Web Console.
Customize Menu Bars
Click Customize Menu Bars on the Settings page to configure the menu bars
seen by individual users.
Color Scheme
Click Color Scheme on the Settings page to select a default color scheme for
resource title bars.
External Websites
Click External Websites on the Settings page to designate any external website
as an Orion Web Console view, appearing in the Views toolbar.
Manage Alerts
The Manage Alerts category gives you access to the commands that allow you to
edit, disable, enable, or delete currently configured advanced alerts.
Manage Advanced Alerts
Click Manage Advanced Alerts on the Settings page to view, edit, enable,
disable, and delete advanced alerts.
Editing Alerts
84
Page 85

To edit an alert:
1. Select the check box for the alert you want to edit.
2. Click Edit.
3. Modify the settings for the alert and then click OK.
Enabling Alerts
To enable an alert:
1. Select the check box(es) for the alert(s) you want to enable.
2. Click Enable.
Disabling Alerts
To disable an alert:
1. Select the check box(es) for the alert(s) you want to disable.
2. Click Disable.
Deleting Alerts
To delete an alert:
1. Select the check box(es) for the alert(s) you want to delete.
2. Click Delete.
3. Click Yes to confirm the alert deletion.
Creating New Alerts and Configuring Advanced Alerting Options
To create new alerts or configure advanced alerting options:
Click Start > All Programs > SolarWinds Orion > Alerting, Reporting and
Mapping > Advanced Alert Manager.
Product Updates
The Product Updates category provides commands to get up-to-date information
about using and upgrading SolarWinds UDT.
85
Page 86

Available Product Updates
Available Product Updates
Click Available Product Updates on the Settings page to configure regular
checks for SolarWinds UDT updates that can include version upgrades and
service packs.
Orion Product Team Blog
Click Orion Product Team Blog on the Settings page to view regular posts from
members of the Orion product team to help you take full advantage of features
provided by SolarWinds UDT and other Orion products.
Views
The Views category gives you access to the commands that allow you to manage
individual web console views as well as views for device and application types.
Manage Views
Click Manage Views on the Settings page to add, edit, copy, or remove individual
web console views.
Add New View
Click Add New View on the Settings page to add a custom view with the
information you want to view.
Views by Device Type
Click Views by Device Type on the Settings page to designate default views for
network nodes and interfaces.
Settings
The Settings category gives you access to the commands that allow you to
manage configuration settings for the Web Console, polling, SolarWinds UDT,
and thresholds.
Web Console Settings
Click Web Console Settings on the Settings page to customize the function and
appearance of both the Orion Web Console and the charts that are displayed as
resources in Orion Web Console views.
86
Page 87

Polling Settings
Click Polling Settings on the Settings page to define the configuration of polling
intervals, timeouts, statistics calculations, and database retention settings for your
SolarWinds UDT polling engine.
Orion Thresholds
Click Orion Thresholds on the Settings page to configure SolarWinds UDT
threshold settings.
UDT Settings
Click UDT Settings on the Settings page to configure SolarWinds UDT and its
ports and watch lists.
Details
The Details category gives you access to the commands that allow you to view
configuration details for the database, polling engines, licenses, and modules.
Database Details
Click Database Details on the Settings page to display details about the SQL
Server database currently used.
Polling Engines
Click Polling Engines on the Settings page to show the status and selected
configuration information for each currently operational polling engine.
Orion Core Details
Click Orion Core Details on the Settings page to display an information-only
page that displays details about your installation of the common components and
resources that all Orion products share, including information about your Orion
server, monitored object counts, and the version numbers of the executables and
DLLs required by any and all installed Orion products.
License Details
Click License Details on the Settings page to display details about both your
SolarWinds UDT license and your monitored network, including the number of
current monitored ports and allowed ports as well as the current nodes and
allowed nodes.
87
Page 88

License Details
This page also shows the version of the applications that you are running.
88
Page 89

Chapter 11: Using the Orion Web Console
The Orion Web Console is an integral part of the Orion family of products that can
be configured for viewing from virtually any computer connected to the Internet.
You can also customize the web console for multiple users and store individually
customized views as user profiles. Administrator functions are accessed by
clicking Settings in the top right of all Orion Web Console views.
Logging in for the First Time as an Administrator
When you launch the Orion Web Console, you are presented with a login view
requiring both a User Name and a Password.
To log in to the Orion Web Console:
1. Launch the Orion Web Console using either of the following methods:
l Click Start> All Programs> SolarWinds Orion> Orion Web
Console.
l Or launch a browser on your Orion server and enter http://ip_
address or http://hostname, where ip_address is the IP address of
your Orion host server, or where hostname is the domain name of
your Orion server.
2. Enter Admin as your User Name, and then click Login.
Notes: Until you set a password, you can log in as Admin with no Password.
After your first login, you may want to change the Admin password.
Windows Authentication with Active Directory
As of Orion Core version 2010.2, the Orion Web Console can authenticate Active
Directory users and users who are members of Active Directory security groups.
To enable Active Directory Windows authentication to the web console:
89
Page 90

Chapter 11: Using the Orion Web Console
1. Install and configure Active Directory on your local network.
2. If you want to enable automatic login for web console accounts using
Windows Authentication, configure the Orion Web Console as shown in
the following steps:
a.Click Start> All Programs> SolarWinds Orion>
Configuration and Auto-Discovery> Configuration
Wizard.
b.Check Website, and then click Next.
c.After providing the appropriate IP Address, Port, and
Website Root Directory, select Yes– Enable automatic
login using Windows Authentication.
d.Click Next, and then complete the Configuration Wizard.
3. Log in to the web console using the appropriate domain and user,
providing Domain\Username or Username@Domain as the web console
User name.
Notes:
l For more information about installing Active Directory on Windows Server
2003, see the Microsoft Support article, “How To Create an Active Directory
Server in Windows Server 2003”.
l For more information about Active Directory on Windows Server 2008, see
the Microsoft TechNet article, “Active Directory Services”.
Using the Web Console Notification Bar
Below the web console menu bar, the Orion notification bar provides
informational messages related to the following SolarWinds UDT features:
l If you have configured the Orion Web Console to check for product updates,
an announcement displays in the notification bar when an update, including
any upgrade, service pack, or hotfix, to SolarWinds UDT or any other Orion
modules you currently have installed becomes available.
l If you have configured the Orion Web Console to store blog posts, new and
unread posts to the Orion Product Team Blog are announced in the
90
Page 91

Editing Object Properties
notification bar.
l If you have currently configured a scheduled discovery, results display in the
notification bar when the discovery completes.
l If you are currently using SolarWinds UDT to monitor any VMware ESX or
ESXi Servers, the notification bar can display messages communicating the
number of ESX nodes found during any discovery, and, if any discovered ESX
nodes require credentials, the notification bar tells you. For more information
about managing ESX Servers, see “Virtualization” in the SolarWinds Orion
Network Performance Monitor Administrator Guide.
For more information about any displayed notification bar message, click More
Details and a web console view relevant to the displayed message opens.
To delete a posted message, either click Dismiss Message next to the displayed
message, or properly address the situation mentioned in the posted notification.
To remove the notification bar from your web console, click Close (X) at the right
end of the notification bar.
Managing all the monitored devices on your network is greatly simplified with the
Node Management feature of the Orion Web Console. Using this tool, you can
easily add and remove devices and quickly view and edit device properties. Any
user that has been granted node management rights can directly access the
Node Management tool either from any All Nodes resource or through the Orion
Website Administration page.
The following sections describe the various functions that allow you to view and
manage all your network devices from the Orion Web Console.
Note: The Node Management feature is accessible by clicking Manage Nodes
either in the header of any All Nodes resource or in the Node and Group
Management grouping of the Orion Website Administration page. The All Nodes
resource is included on the Orion Summary Home view by default, but you can
include it on any other web console view as well. Confirm that the All Nodes
resource is available on an appropriate Web Console view before continuing.
Editing Object Properties
The following procedure provides the steps required to edit monitored object
properties using the Node Management utility of the Orion Web Console.
To edit object properties in the Orion Web Console:
91
Page 92

Chapter 11: Using the Orion Web Console
1. Log in to the Orion Web Console as an administrator.
2. Click Settings in the top right of the web console, and then click Manage
Nodes in the Node and Group Management grouping.
3. Locate the object to edit using either of the following methods:
l Use the search tool above the node list to search your Orion
database for either the object you want to edit or the parent node of
the volume you want to edit.
l Select an appropriate Group by criteria, and then click the
appropriate group including either the node to edit or the parent of
the object to edit.
4. If you want to edit the properties of a monitored node, check the node
you want to edit, and then click Edit Properties.
5. If you want to edit the properties of a monitored object, click + next to
the parent node of the object you want to edit, check the object you want to
edit, and then click Edit Properties.
6. If you are editing the SNMP properties of a node, click Test after
providing new settings to confirm they are valid for the edited node.
7. If the selected node is a VMware ESX Server and you want to poll it for
data using the VMware API, Confirm that Poll for VMware is checked.
8. If you want to poll for ESX data using an existing ESX credential,
select the appropriate credential from the VMware credentials dropdown
menu.
9. If you want to poll for ESX data using a new ESX credential, complete
the following steps:
a. Select <New Credential> in the Choose Credential
dropdown menu, and then provide a new credential name
in the Credential Name field.
Note: SolarWinds recommends against using
non-alphanumeric characters in VMware credential
names.
b. Add the credential User name and Password, as
necessary.
92
Page 93

Promoting a Node from ICMP to SNMP Monitoring
c. Confirm the password, and then click Validate VMware
to confirm the credentials you have provided are valid for
the edited node.
10. Edit additional device properties as needed, and then click Submit.
Promoting a Node from ICMP to SNMP Monitoring
After adding a node to the Orion database as an ICMP only node, you may need
to promote the node to SNMP to start collecting additional statistics. the Node
Management utility of the Orion Web Console can easily promote your node to
SNMP without any loss of historical data.
To promote an ICMP only node to SNMP:
1. Log in to the Orion Web Console as an administrator.
2. Click Settings in the top right of the web console and click Manage
Nodes in the Node and Group Management grouping of the Orion Website
Administration page.
3. Locate the device to promote using either of the following methods:
l Use the search tool above the node list to search your Orion
database for the node you want to promote.
l Select an appropriate Group by criteria, and then click the
appropriate group including the node to promote.
4. Click Edit Properties, and then clear ICMP (Ping only).
5. In the SNMP area, select the SNMP Version for the promoted node.
Note: Orion uses SNMPv2c by default. If the promoted
device supports or requires the enhanced security features
of SNMPv3, select SNMPv3.
6. If you have installed multiple polling engines, select the Polling Engine
you want to use to collect statistics from the added node.
Note: This option may not be available if you are only
using one polling engine to collect information from your
93
Page 94

Chapter 11: Using the Orion Web Console
network.
7. If the SNMP port on the added node is not the Orion default of 161,
provide the actual port number in the SNMP Port field.
8. If the added node supports 64 bit counters and you want to use them,
check Allow 64 bit counters.
Note: Orion fully supports the use of 64-bit counters;
however, these high capacity counters can exhibit erratic
behavior depending how they are used. If you notice
peculiar results when using these counters, use the Edit
Properties view to disable the use of 64-bit counters on the
device in question, and then contact the hardware
manufacturer.
9. If you want to use SNMPv2c to monitor the promoted node, provide
valid community strings for the added node.
Note: The Read/Write Community String is optional, but
Orion does require the public Community String, at
minimum, for node monitoring.
10. If you want to use SNMPv3 to monitor the promoted node, provide the
following SNMPv3 credential settings:
l SNMPv3 Username and Context
l SNMPv3 Authentication Method and Password/Key
SNMPv3-Privacy/Encryption Method and Password/Key
Note: Read/Write SNMPv3 Credentials are optional, but
the public Community String is required, at a minimum,
for node monitoring.
11. If you want to edit an existing SNMPv3 credential set, select the name
of your set from the Saved Credential Sets list, and then edit the stored
settings..
12. If you want save the provided SNMPv3 credentials as a credential set,
provide a Name for your new credential set, and then click Save.
94
Page 95

Viewing Node Resources
13. Click Validate SNMP after entering all required credentials to confirm your
SNMP settings.
14. If you want to change the default polling settings for your promoted
node, edit the Node Status Polling or Collect Statistics Every values in
the Polling area, as appropriate.
Note: The Node Status Polling value refers to the period
of time, in seconds, between the node status checks Orion
performs on the promoted node. The Collect Statistics
Every value refers to the period of time between updates
Orion makes to displayed statistics for the promoted node.
15. If you have defined any custom properties for monitored nodes,
provide appropriate values for the promoted node in the Custom
Properties.
16. Click Submit when you have completed properties configuration for your
promoted node.
17. If you have successfully added the node, click OK on the dialog.
Viewing Node Resources
The List Resources feature of the Orion Web Console Node Management utility
allows you to immediately see all monitored interfaces, volumes, and interface
charts on a selected node, as shown in the following procedure.
To view a list of all resources present on a node:
1. Log in to the Orion Web Console as an administrator.
2. Click Settings in the top right of the web console.
3. Click Manage Nodes in the Node and Group Management grouping of the
Orion Website Administration page.
4. Locate the node to view using either of the following methods:
l Use the search tool above the node list to search your Orion
database for the node you want to view.
l Select an appropriate Group by criteria, and then click the
appropriate group including the node to view.
95
Page 96

Chapter 11: Using the Orion Web Console
5. Check the node you want to view from the list, and then click List
Resources on the Node Management toolbar.
Administrative Functions of the Orion Web Console
The following sections describe the primary administrative functions performed by
an Orion Web Console administrator.
l Changing an Account Password
l Orion Website Administration
l Viewing Secure Data on the Web
l Handling Counter Rollovers
Changing an Account Password
Orion Web Console administrators may change user account passwords at any
time, as shown in the following procedure.
To change an account password:
1. Log in to the web console as an administrator.
2. Click Settings in the top right corner of the web console.
3. Click Manage Accounts in the Accounts grouping of the Orion Website
Administration page.
4. Select the user account with the password you want to change, and then
click Change Password.
5. Complete the New Password and Confirm Password fields, and then click
Change Password.
6. Click Continue when the password is successfully changed.
Orion Website Administration
If you are logged in to the web console as an administrator, clicking Settings in
the top right corner of the web console.displays the Orion Website Administration
page, presenting a variety of tools to control the appearance and delivery of
96
Page 97

Node and Group Management
information to Orion Web Console users. The following options are available on
the Orion Website Administration page.
Node and Group Management
Before you can start monitoring your network you must designate the network
objects you want your Orion installation to monitor. The Getting Started with Orion
grouping provides direct links to the following discovery-related views so you can
quickly and easily start monitoring your network:
l Discovery Central provides a centralized overview of the types and number
of network objects you are monitoring with your Orion installation.
l Clicking Network Sonar Discovery opens the Network Sonar Discovery
Wizard. Network Discovery enables you to quickly discover devices across
your entire network for monitoring.
l Clicking Add a Node opens the Add Node Wizard directly.
Node and Group Management
The Node and Group Management grouping of the Orion Website Administration
page gives you access to the following web console views for managing nodes
and groups:
l Clicking Manage Nodes displays the Node Management page, where an
Orion Web Console administrator can immediately add, view, and manage all
network objects currently managed or monitored by your Orion installation.
l Clicking VMware Settings opens the VMware Settings view, where you can
view both a list of currently monitored VMware ESX Servers and a library of
the VMware credentials SolarWinds UDT uses to monitor your ESX Servers.
For more information, see “Virtualization” in the SolarWinds Orion Network
Performance Monitor Administrator Guide.
l Clicking Manage Dependencies opens the Manage Dependencies view.
Dependencies allow you to formalize dependent relationships between
monitored objects based on network topology or priority to eliminate the
potential for duplicated or redundant polling and alerting.
l Clicking Manage Groups opens the Manage Groups view. To a greater
degree than previously available with custom properties, groups enable you to
logically organize your monitored network objects.
97
Page 98

Chapter 11: Using the Orion Web Console
Accounts
The Accounts grouping of the Orion Website Administration page gives a web
console administrator access to the following web console configuration pages:
l The Manage Accounts link provides web console administrators access to
set and change account passwords, set user rights and access, and configure
the web console experience for all users.
l Clicking Account List opens the Orion Website Accounts view, providing an
immediate overview of web console user account settings. You may use this
view to make changes to multiple accounts simultaneously and immediately
by clicking to check or clear options. Clicking an Account user name opens
the Account Manager for the selected account.
Customize
The Customize grouping of the Orion Website Administration page offers options
to customize the navigation and appearance of your Orion Web Console on the
following pages:
l The Customize Menu Bars page allows an Orion Web Console administrator
to configure the menu bars seen by individual users.
l The Color Scheme page gives a web console administrator the ability to
select a default color scheme for resource title bars. The color scheme
selection takes effect immediately throughout the web console.
l The External Websites page enables an Orion Web Console administrator to
designate any external website as an Orion Web Console view, appearing in
the Views toolbar.
Manage Alerts
The Manage Alerts grouping provides a link to the Manage Advanced Alerts view,
where you can edit, enable, disable, and delete advanced alerts directly from the
web console.
Product Updates
The Product Updates grouping provides links to web console views offering
up-to-date information about using and upgrading SolarWinds UDT.
98
Page 99

Views
l The Available Product Updates view allows you to configure regular checks
for SolarWinds UDT updates that can include version upgrades and service
packs.
l The Orion Product Team Blog offers regular posts from members of the
Orion product team to help you take full advantage of features provided by
SolarWinds UDT and its modules.
Views
The Views grouping of the Orion Website Administration page gives an Orion
Web Console administrator access to the following view configuration pages:
l The Manage Views page enables a web console administrator to add, edit,
copy, or remove individual web console views.
l Clicking Add New View opens the Add New View page, where you can
define new web console views.
l The Views by Device Type page gives an Orion Web Console administrator
the ability to designate default views for network devices.
Settings
The Settings grouping of the Orion Website Administration page gives an Orion
Web Console administrator access to the following settings configuration pages:
Note: If you currently have any Orion modules installed, links to module settings
pages display in the Settings grouping. For more information about configuring
Orion module settings, see the Administrator Guide for your Orion module.
l Web Console Settings allow an Orion Web Console administrator to
customize the function and appearance of both the Orion Web Console and
the charts that are displayed as resources in Orion Web Console views. For
more information about configuring Orion Web Console and Chart Settings,
see “Orion Web Console and Chart Settings”.
l Polling Settings define the configuration of polling intervals, timeouts,
statistics calculations, and database retention settings for your SolarWinds
UDT polling engine.
l The Orion Thresholds page opens the Orion General Thresholds page,
where SolarWinds UDT threshold settings are configured.
99
Page 100

Chapter 11: Using the Orion Web Console
Details
The Details grouping of the Orion Website Administration page provides links to
the following pages containing information about your Orion installation:
Database Details
This is an information-only page that displays details about the SQL Server
database currently used by your Orion installation. In addition to current
version information and configuration settings for both your Orion server and
your database server, this page displays the total number of monitored
objects in the Orion database.
Polling Engines
Orion supports the implementation of multiple distributed polling engines.
Each engine can monitor and collect data from different parts of your
network. This page shows the status and selected configuration information
for each currently operational polling engine.
Orion Core Details
This is an information-only page that displays details about your installation
of the common components and resources that all Orion products share,
including information about your Orion server, monitored object counts, and
the version numbers of the executables and DLLs required by any and all
installed Orion products.
License Details
This is an information-only page that displays details about all Orion
products that you currently have installed. about both your Orion license and
your monitored network. This page also shows the version numbers of the
SolarWinds UDT products you are running and the versions of associated
DLLs.
Viewing Secure Data on the Web
In the interest of security, sensitive network information, such as community
strings, logins, and passwords, is not viewable in the web console. However, if
you have secured your network, you may check Allow Secure Data On Web
(advanced) in the Calculations and Thresholds area of the Orion Polling Settings
page to allow the passage of community strings through the web console.
Note: This setting does not affect the display of custom reports that you export to
the web.
100
 Loading...