

Page 1

User’s Guide
- SDS 200 -
- SoftScope -
PC Based Digital Oscilloscope
www.softdsp.com
Page 2

Copyright
This document is bei ng fur nishe d by
users of the SDS 200 and is furnished on as “AS IS” basis, that is, without any warranties,
whatsoever, expressed or implied.
SDS 200 and SoftScope are trademarks of
Other brand and product names are trademarks or registered trademarks of the respective
holders. Microsoft is a registered trademark and Windows, the Windows logo are registered
trademarks of the Microsoft Corporation.
Information in this document is subject to change without notice and does not represent a
commitment on the part of
soft
DSP Co., Ltd. All rights reserved.
soft
soft
DSP Co., Ltd.
DSP Co., Ltd. for inf ormation pur poses o nl y to licensed
soft
DSP Co., Ltd.
1
Page 3

FCC NOTICE
THIS DEVIDE COMPLIES WITH PART 15 OF THE FCC RULES.
OPERATION IS SUBJECT TO THE FOLLOWING TWO CONDITION:
(1) THIS DEVICE MAY NOT CAUSE HARMFUL INTERFERENCE, AND
(2) THIS DEVICE MUST ACCEPT ANY INTERFERENCE RECEIVED,
INCLUDING INTERFERENCE THAT MAY CAUSE UNDERSIRED
OPERATION.
This equipment has been tested and found to comply with the limits for a Class
B digital device, pursuant to part 15 of the FCC Rules. These limits are
designed to provide reasonable protection against harmful interference in a
residential installation. This equipment generates, uses and can radiate radio
frequency energy and, if not installed and used in accordance with the
instructions, may cause harmful interference to radio communication. However,
there is no guarantee that interference will not occur in a particular installation. If
this equipment does cause harmful interference to radio or television reception,
which can be determined by turning the equipment off and on, the user is
encouraged to try to correct the interference by one or more of the following
measures:
- Reorient or relocate the receiving antenna.
- Increase the separation between the equipment and receiver.
- Connect the equipment into an outlet on a circuit difference from that to which
the receiver is connected.
- Consult the dealer of an experienced radio/TV technician for help.
NOTE: The manufacturer is not responsible for any radio or TV interference
cause by unauthorized modifications to this equipment. Such modifications
could void the user’s authority to operate the equipment.
2
Page 4
WARRANTY
This softDSP instrument product is warranted to be free from defects in material and
workmanship for a per iod of one year from the date of s hipment. During the warranty period,
softDSP Co., Ltd. will at its option, either will repair or replace the defective product.
But, the foregoing warranty shall not apply to defects resulting from improper or inadequate
maintenance by the buyer, Buyer-supplied soft ware or interfacing, unauthor ized modification or
misuse, operation ou tside of the environmental spec ifications for the product, or improper site
preparation or maintenance.
Product Name PC Based Digital Oscilloscope
Model Name SDS 200
Warranty Period one year from the date of purchase
At the time of purchase
ASSISTANCE
Product maintenance agr eements and other cus tomer assistance agreem ents are available for
softDSP.
For any assistance, contact your nearest softDSP Sales and Service office. Addresses are
provided in this manual.
Our homepage address is “http://www.softdsp.com”.
3
Page 5

SAFETY SUMMARY
Do not install subs titute parts or perform any unauthorized modif ication to the product. Retur n
the product to a s oftDSP Sales and S ervice Office for servic e and repair to e nsure that safet y
features are maintained.
Observe Maximum Working Voltage
Do not use this product on bare wires above 42Vpk, AC 30Vrms and DC 60V.
Product Damage Precautions
Do not open the cover an d attempt any repairs. An ele ctr ic s hoc k or accident may be caused by
opening the cover or improper handling. If you suspect there is damage to this product, you
must have it inspected by qualified service personnel.
Do not drop the product. This product contains fragile components that can be damaged by high
impact. Take care to prevent the product from dropping on the floor or other hard surfaces.
To avoid electric shock, do not operate this product in wet or damp conditions.
Do not operate near flammable materials.
4
Page 6

Minimum System Requirements
To install and run SoftScope, you should have the following;
Operating System
Windows 98/ME/2000
CPU/Mainboard
Pentium 200MHz , USB equipped mainboard
Memory
32MByte
HDD
20MByte
Graphic Card
Microsoft DirectX supported
Screen resolution: 800x600
Color depth: 16bit
5
Page 7

Table of Contents
Ch 1. Introduction.............................................................................................1
1. What is SDS 200/SoftScope ?...............................................................1
SDS 200 ...........................................................................................1
SoftScope.........................................................................................2
2. Hardware Specification..........................................................................3
3. SoftScope Installation............................................................................5
4. SDS200 Setup.......................................................................................8
5. Setup sds200.inf Manually.....................................................................9
6. Warning! ..............................................................................................11
7. Calibration............................................................................................13
Ch 2. How to use SDS 200/SoftScope...........................................................14
1. Simple Measurement...........................................................................14
2. Basic Operations.................................................................................16
Change Vertical Scale(Volt/Div)......................................................16
Change Horizontal Scale(Time/Div)................................................17
Measurement Using Cursor............................................................19
Measurement by Icon.....................................................................20
Change Trigger Level & Trigger Point.............................................22
Single Shot/Stop Mode...................................................................23
Put Label on The Screen................................................................23
Print/Save Wavefor m......................................................................24
Ch 3. Advanced Technique ............................................................................26
1. Advanced Trigger.................................................................................26
Edge Trigger...................................................................................26
Logic Trigger...................................................................................27
Pulse Trigger...................................................................................27
Delay Trigger ..................................................................................27
2. FFT......................................................................................................28
3. Math.....................................................................................................29
6
Page 8

Ch 4. Toolbars, Menus, Dialog boxes & Screen Information......................30
1. Toolbar.................................................................................................30
2. Menu....................................................................................................31
File..................................................................................................31
View................................................................................................31
Channel..........................................................................................32
Display............................................................................................32
Math/FFT........................................................................................33
Run/Stop.........................................................................................33
Trigger............................................................................................33
Measure..........................................................................................33
Util ..................................................................................................34
Help................................................................................................34
3. Screen Information..............................................................................35
4. Option Dialog Box................................................................................37
Ch 5. Appendix ...............................................................................................38
1. Three Operational Modes of SDS 200.................................................38
Realtime mode................................................................................38
RIS(Random Interleaved Sampling) mode.....................................38
Roll mode........................................................................................38
2. Software Calibration............................................................................38
3. Firmware Update.................................................................................40
7
Page 9

Chapter 1. Introduction
Ch 1. Introduction
1. What is SDS 200/SoftScope ?
SDS 200
SDS 200 developed by softDSP Co., Ltd. is a portable PC-based Digital Oscilloscope.
High performance
SDS 200 has the following features: 200MHz analog bandwidth, 5GS/s equivalent sampling,
100MHz real-time sampling.
USB connected
SDS 200 uses USB that supports plug’n play, with 12Mbps communication speed.
Advanced trigger
SDS 200 has advanced trigger circuitry so that it can detect many complex signals.
Best performance for your dollar
SDS 200 has many features that is comparable to the high speed stand-alone DSOs. But it
costs a fraction of the price.
No external power required
SDS 200 does not need an external power source, because it is bus-powered from USB.
1
Page 10

Chapter 1. Introduction
SoftScope
SoftScope is a Windows software that controls SDS 200.
Easy to use
SoftScope is easy to use. It is intuitive and easy to understand.
Big screen
SoftScope uses 500 x 400 screen size.
Various data format processing
SoftScope can save waveform in the following formats: text file, jpg/bmp graphic file, MS
excel/word file.
Fast screen update rate
SoftScope uses Mic rosoft DirectX , so that it gi ves upto s creens per secon d update rate. ( under
Windows98, Pentium II environment)
Many kinds of measurements
SoftScope has 23 measurement functions.
The analog scope effect
SoftScope uses digital persistence and histogram method so that the display resembles an
analog oscilloscope screen.
2
Page 11
Chapter 1. Introduction
2. Hardware Specification
Input
Max. sample rate Realtime sampling: 100 MS/s using one channel, 50MS/s using two
channels
Equivalent sampling: 5GS/s
Channels 2
Bandwidth 200 MHz (-3dB)
Single shot bandwidth:20MHz
Vertical resolution 9 bits/channel
Gain range 10mV ~ 10V/div @ x1 probe
(10mV, 20mV, 50mV, 100mV, 200mV, 500mV, 1V, 2V, 5V, 10V/div
1,2,5 sequence)
100mV ~ 100V/div @ x10 probe
1V ~ 1000V/div @ x100 probe
Range 8 divisions
Offset level +/-4 divisions
Coupling AC, DC
Offset increments 0.02 div
Impedance 1M ohm
DC accuracy +/-3%
Input protection 42Vpk (DC + peak AC < 10 kHz, without external attenuation)
Timebase
Timebase range 2ns/div ~ 10s/div
( 2ns, 4ns, 10ns, 20ns, 40ns, 100ns, 200ns, 400ns, 1us,
2us, 4us, 10us, 20us, 40us, 100us, 200us, 400us, 1ms,
2ms, 4ms, 10ms, 20ms, 40ms, 100ms, 200ms, 400ms, 1s,
2s, 4s, 10s /div 1-2-4 sequence)
Acquisition mode
Equivalent sampling: 2ns/div ~ 4us/div
Range 10 divisions
Pre/Post trigger 0% ~ 1000%
Time resolution 200ps
Buffer size 10K samples
Realtime sampling: 10us/div ~ 400ms/div
Roll mode: 1s/div ~ 10s/div
3
Page 12
Chapter 1. Introduction
Trigger
Type Edge trigger: Rising edge, falling edge
Logic trigger: AND, NAND, OR, NOR, XOR, XNOR
Pulse trigger: Less than width, more than width (10ns ~ 167ms)
Delay trigger: By event (1~16,777,215), by time (10ns ~ 167ms)
Mode Auto, Normal and Single
Autoset Yes
Range 10 divisions
Trigger level +/-4 divisions
Settabillity 0.02 div increments
Math
Measurements Vp-p, Vmax, Vmin, Vmean, Vrms, Vamp, Vhigh, Vlow, positive
overshoot, negative overshoot, cycle mean, cycle rms, period,
frequency, positive pulse width, negative pulse width, rise time
(10%~90%), fall tim e (10%~90%), positiv e duty cycle, negat ive duty
cycle
Cursor Time/frequency difference, voltage difference
Frequency only in FFT mode
Math Addition, Subtraction, Multiplication, Division
FFT Rectangular, Hanning, Hamming, Blackman Window
Physical
Interface Universal Serial Bus (USB)
Power No external power source required.
Bus-powered from USB
Dimensions 5.1" x 4.4" x 1.5"
4
Page 13
Chapter 1. Introduction
3. SoftScope Installation
Caution!) You must install ‘SoftScope’ before using SDS 200.
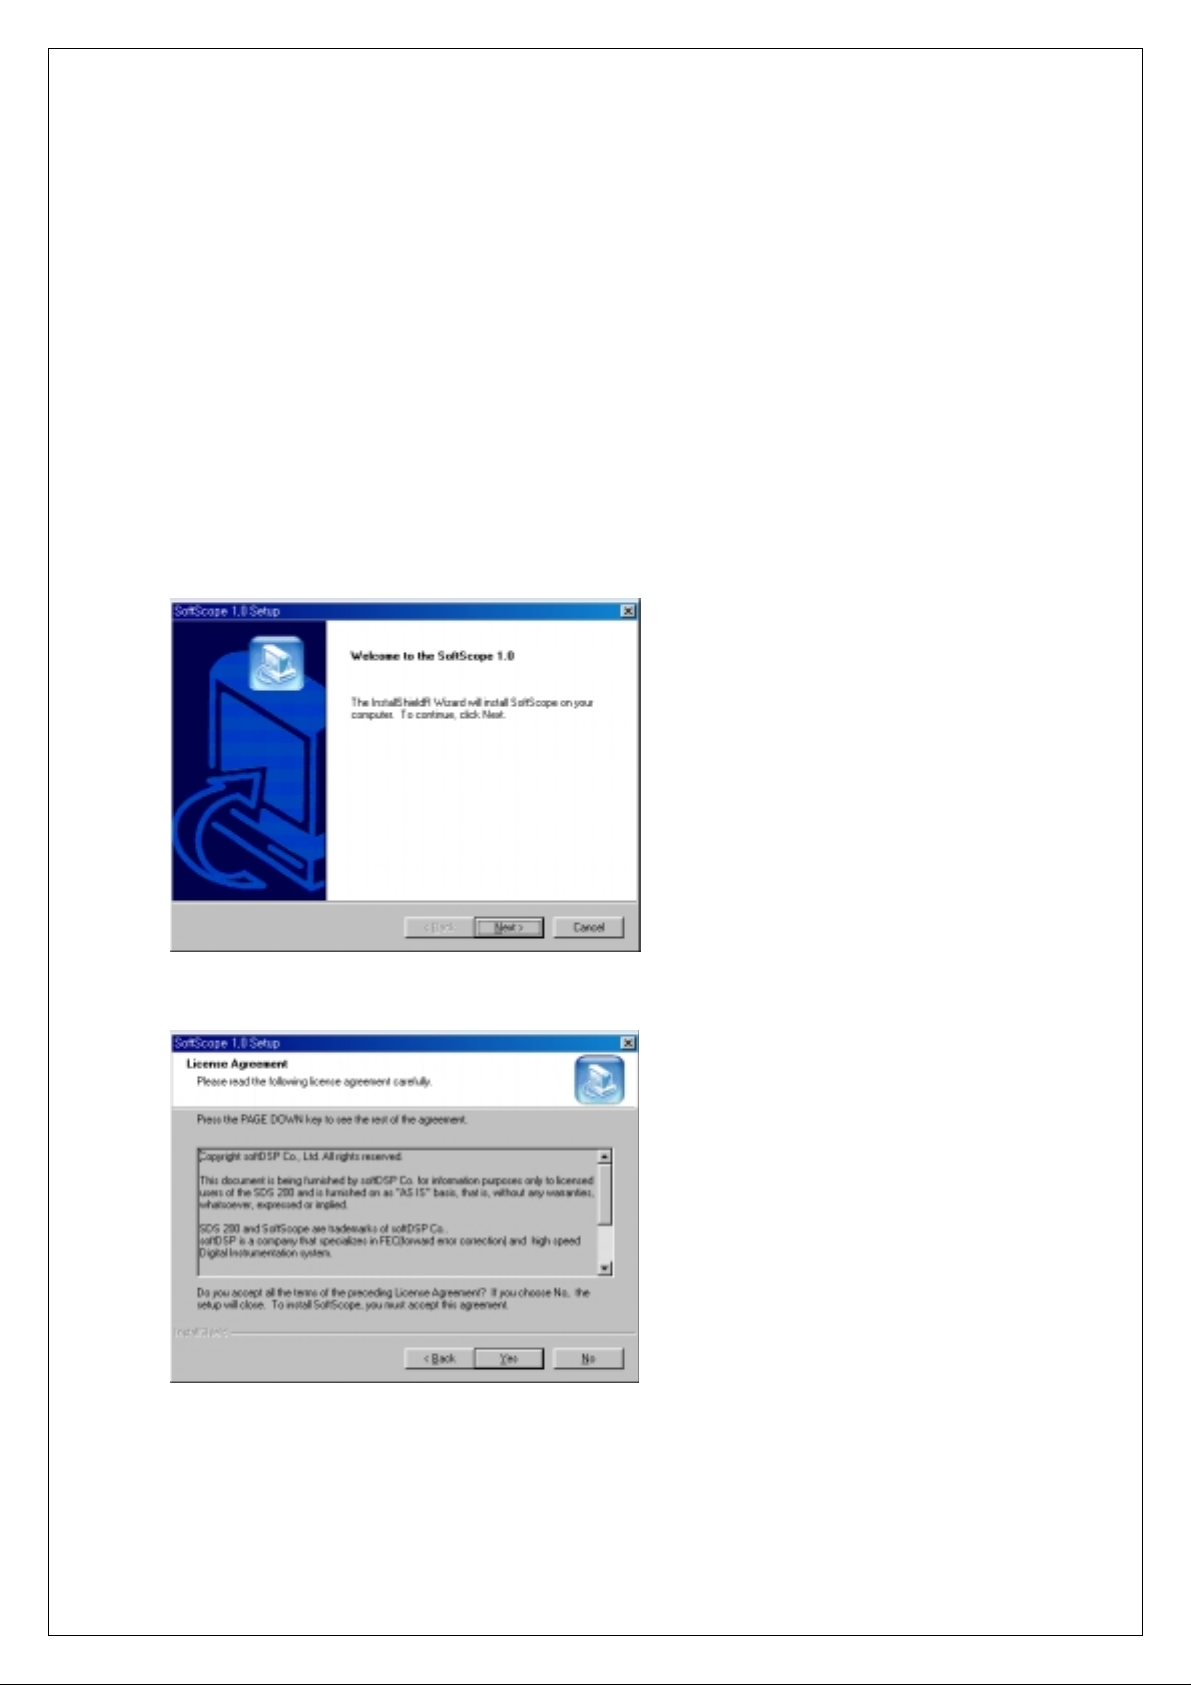
1. While in Windows, insert the installation CD into the CD-ROM drive.
2. The installatio n should start up a utomatically. Otherwise in Windows Explorer, switch to the
CD-ROM drive and run Setup.exe.
3. The SoftScope Installation is started. Click Next to continue.
4. If you accept the license agreement, click Yes to continue.
5
Page 14
Chapter 1. Introduction
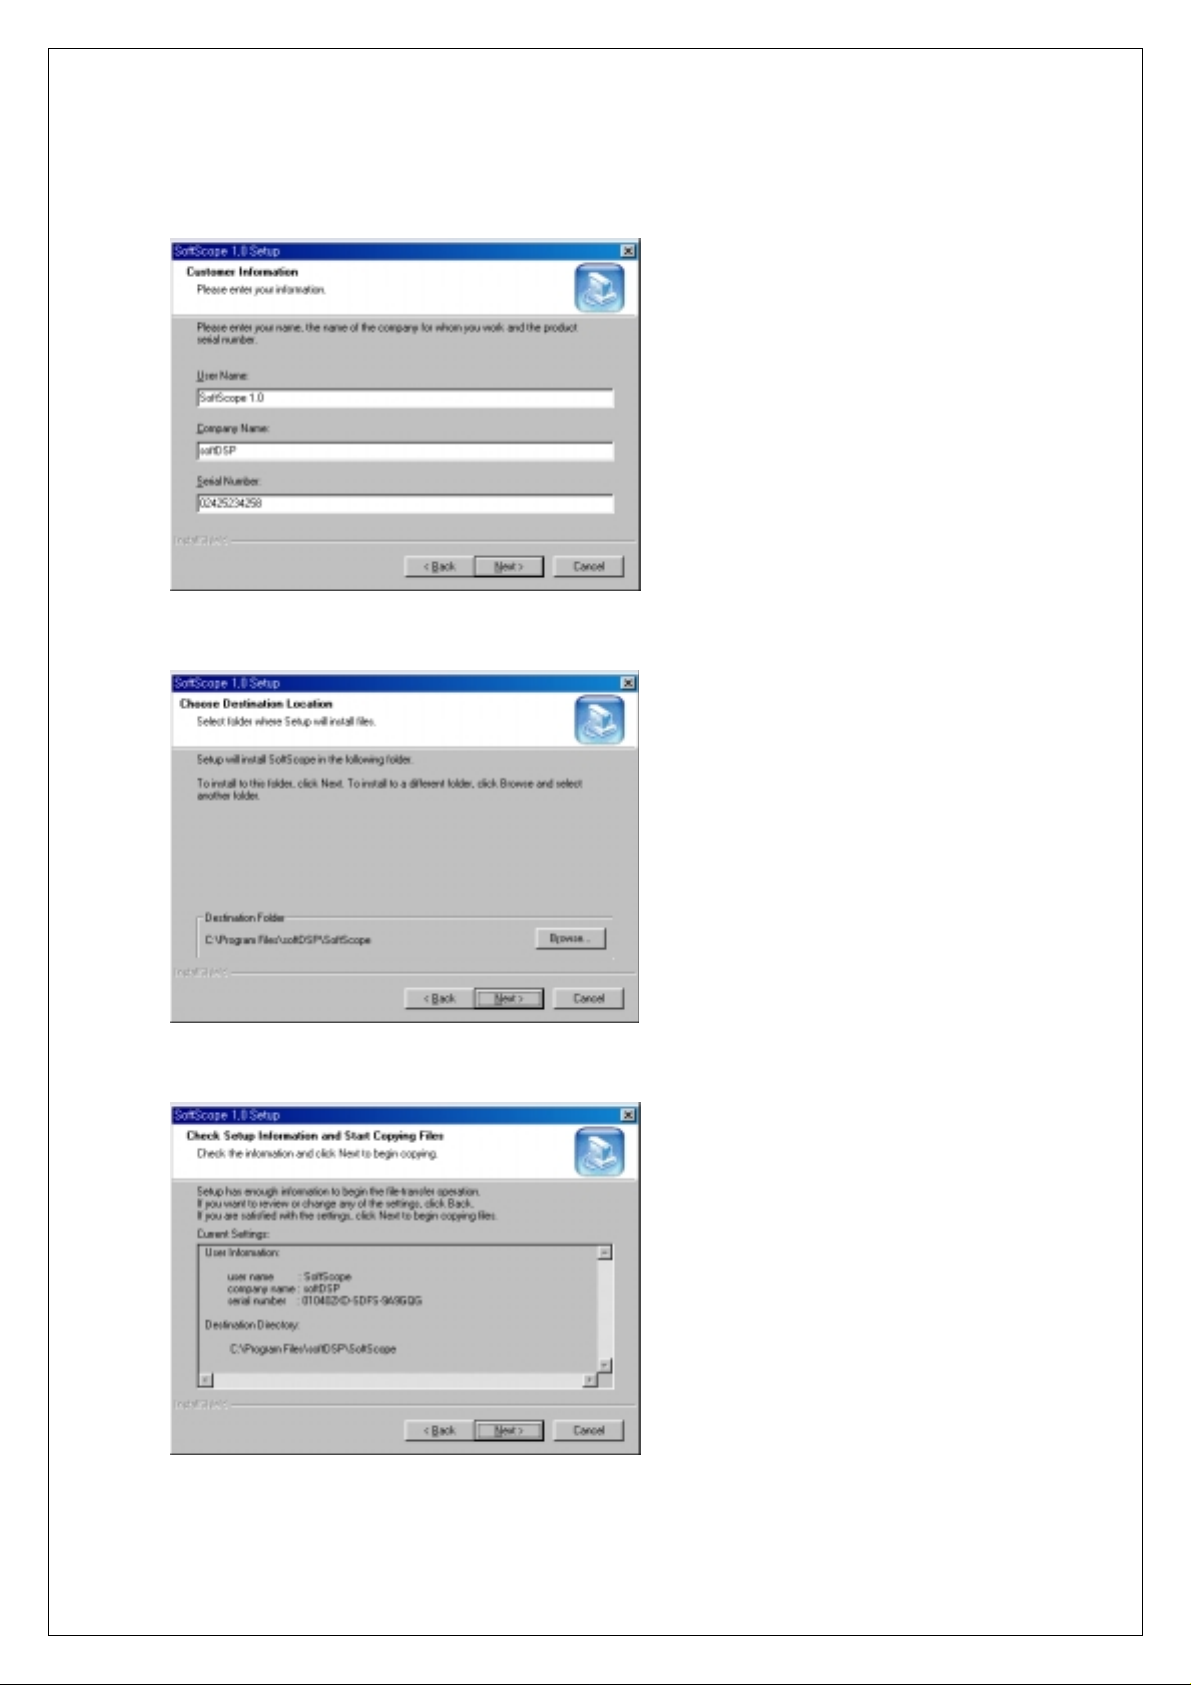
5. Fill in the user information and serial number. Click Next to continue.
6. Choose a destination directory. Click Next to continue.
7. Check the setup information. Click Next to start copying of files.
6
Page 15
Chapter 1. Introduction
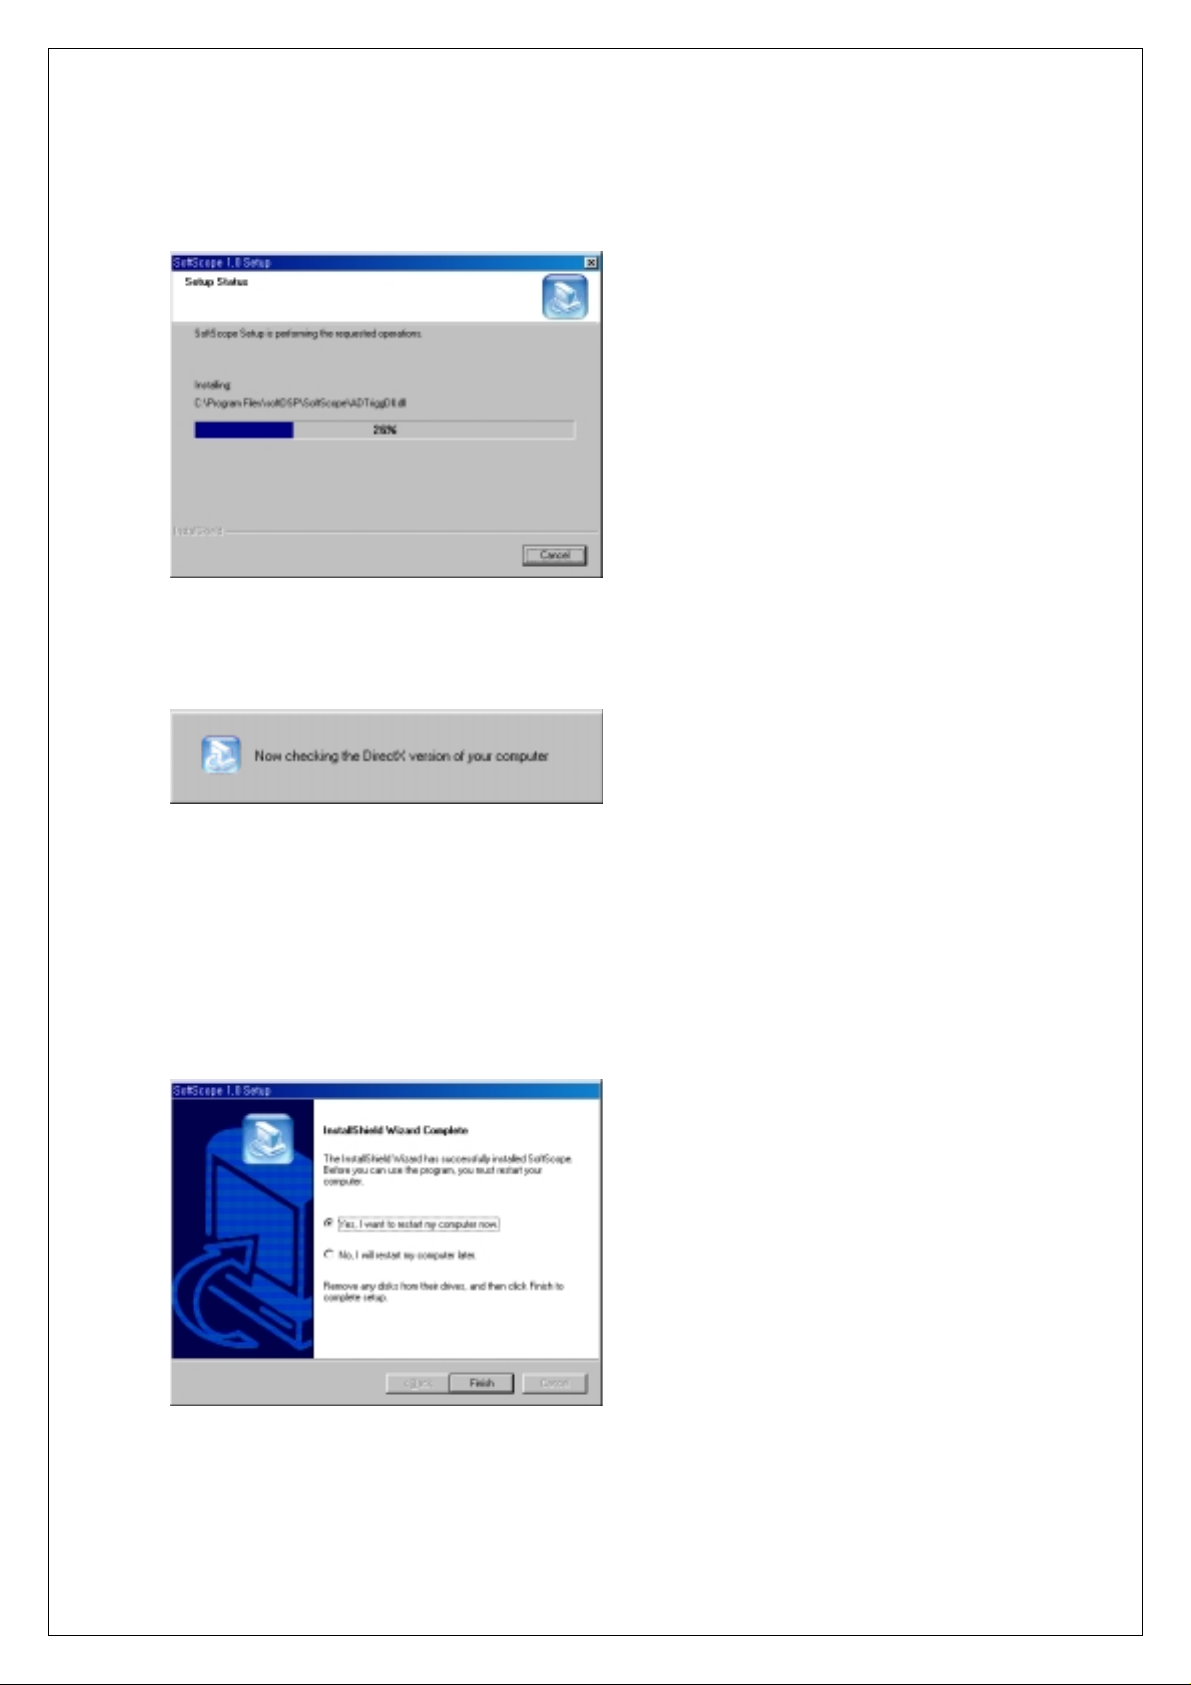
8. This Status dialog is displayed during copying of files.
9. After Installing SoftScope, the installation program will check the DirectX version of your
computer. If it is later than 6.0, the installation program will skip the DirectX Setup.
9.1 If it is earlier than 6.0, the DirectX Setup will start up automatically.
9.2 Follow the directions of the DirectX Setup.
9.3 You will see the Res tart message box in the last step of DirectX Set up. Click Ok, but
your computer will not restart in this step, it will go to step 10.
Caution!) You must install DirectX 6.0 or later to use SoftScope.
10. Check Yes and click Finish to reboot your computer.
Caution!) Reboot your computer to use SoftScope correctly.
11. The installation is complete.
7
Page 16
Chapter 1. Introduction
4. SDS200 Setup
Caution!) SoftScope must be installed before using SDS 200. This setup process is done
once; at the first time of connection.
1. Connect the A-Type Plug of USB cable to your PC’s USB port.
2. Connect the B-Type Plug of USB cable to SDS 200’s USB port.
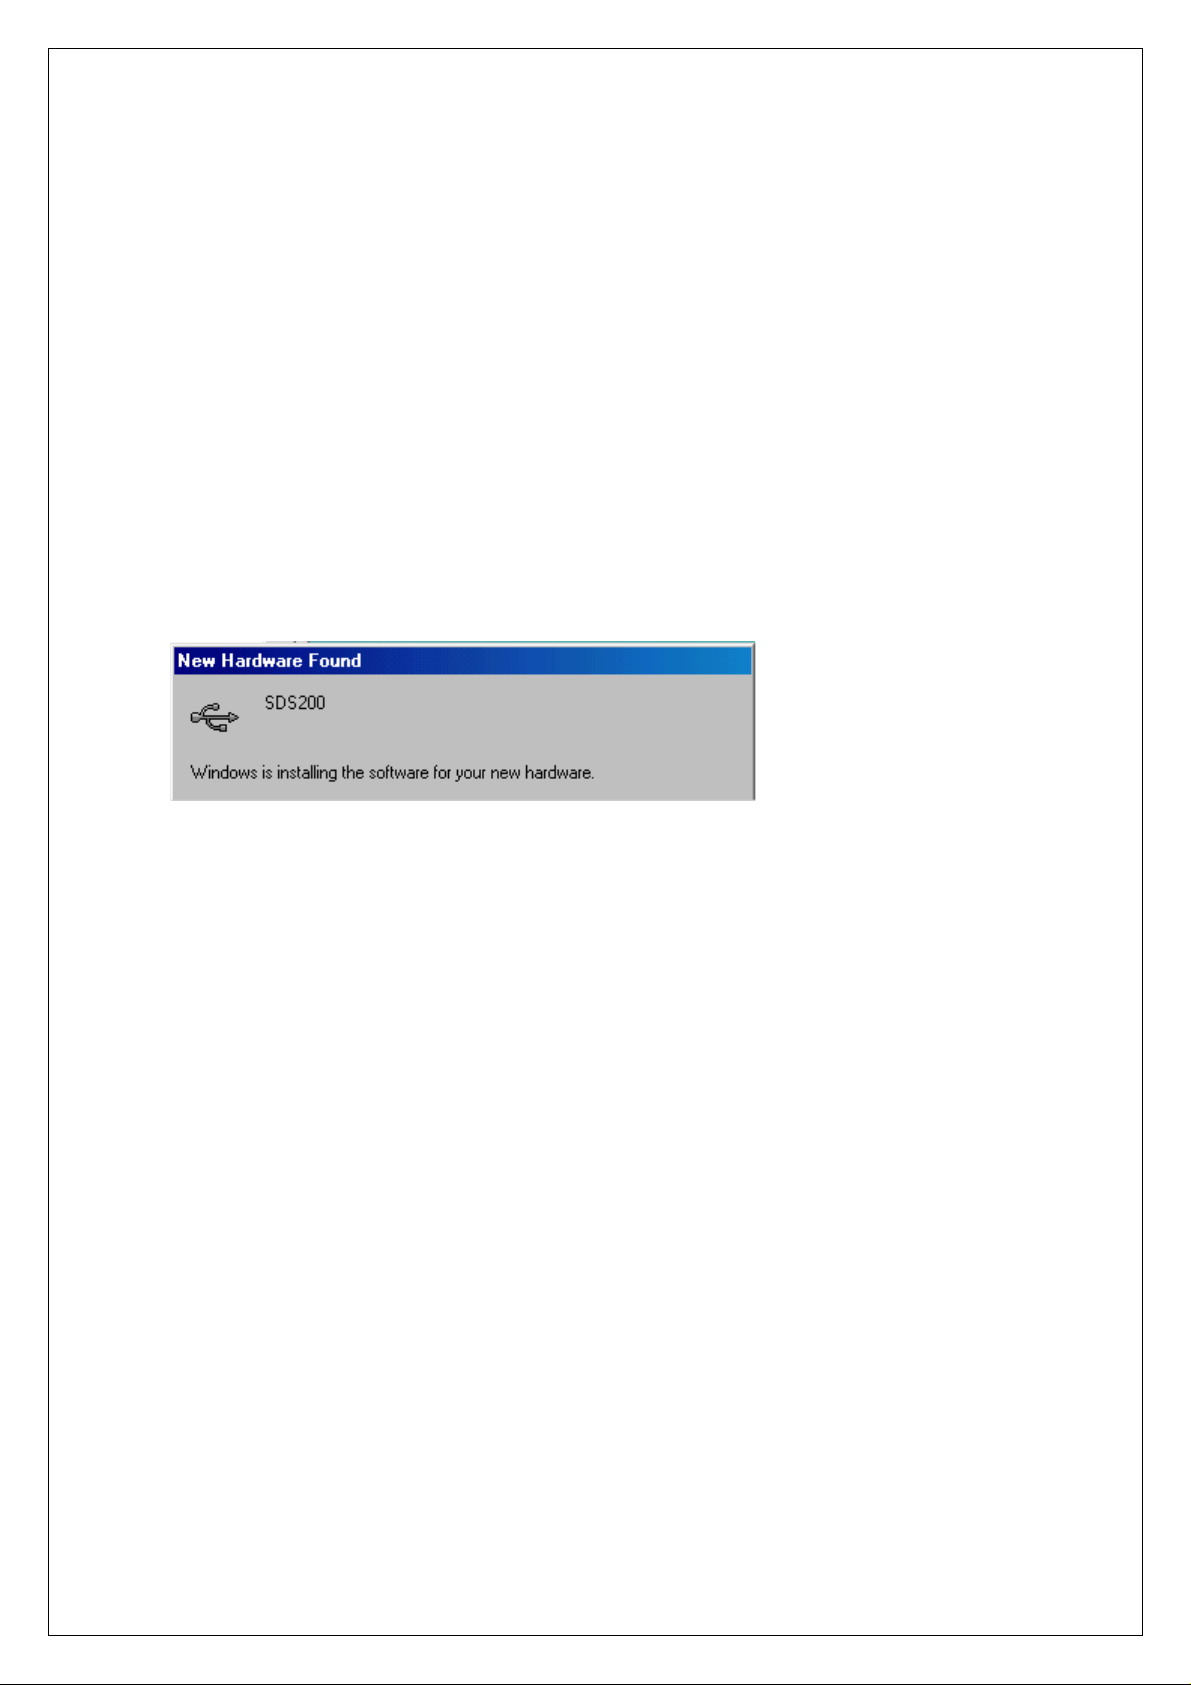
3. SDS 200 will be detected automatically. (The picture is captured under Windows98 SE
environment)
8
Page 17
Chapter 1. Introduction
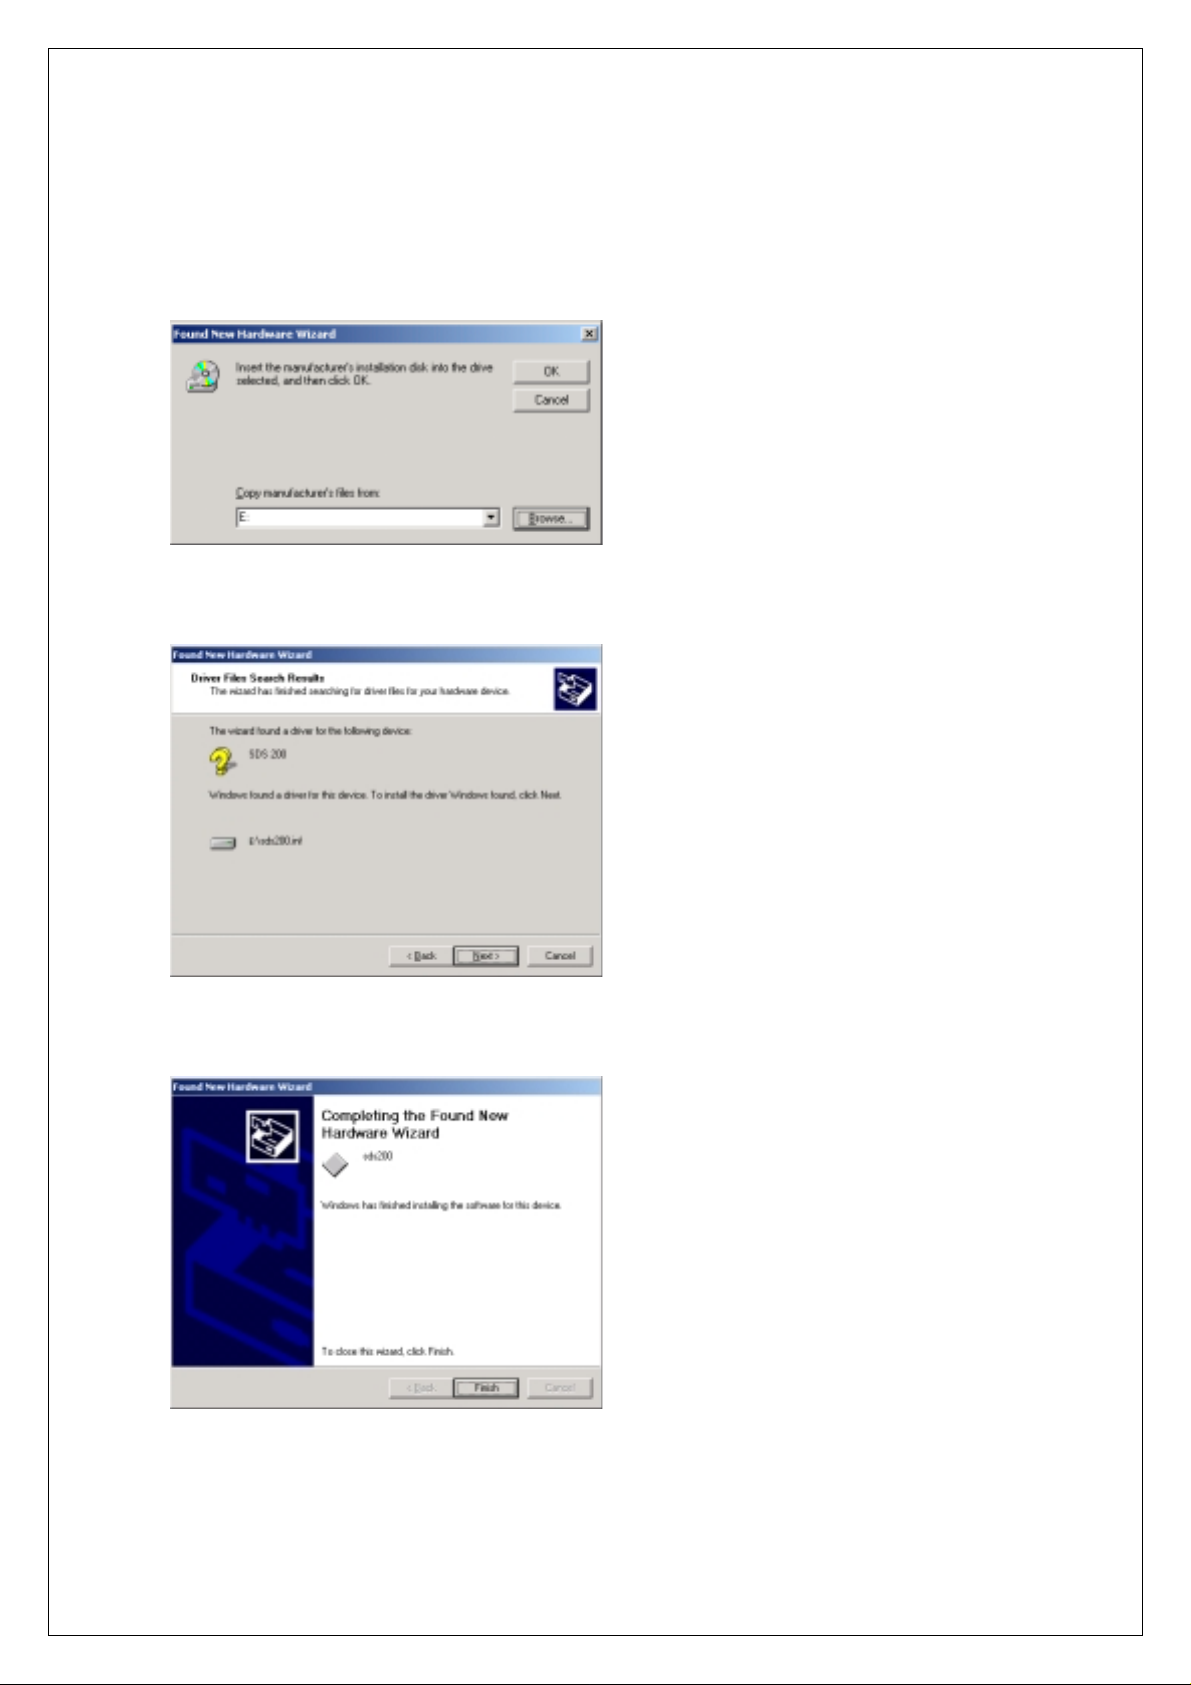
5. Setup sds200.inf Manually
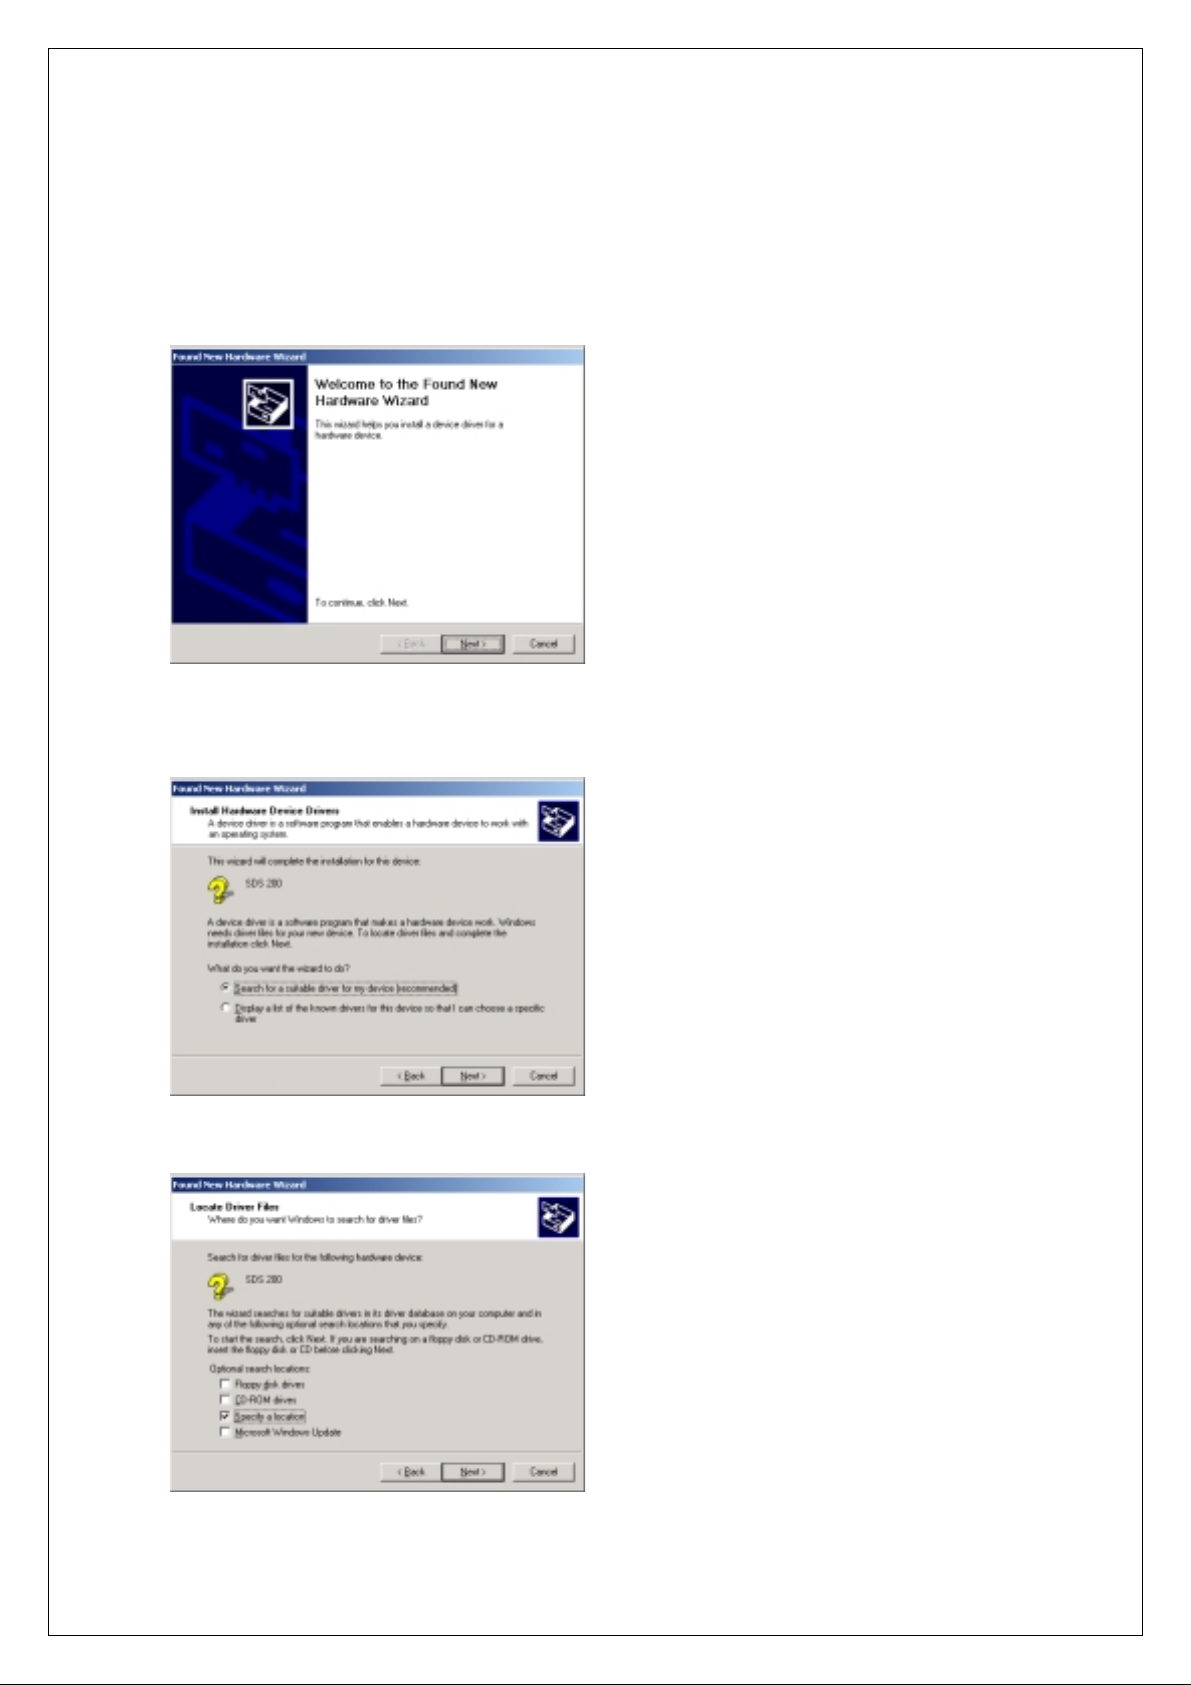
When sds200.inf file is not be detected automatically, you see the following dialog box.
In this case you must install sds200.inf file manually.
1. Choose ‘Search for a suitable driver for my device’ button. Click Next to continue.
2. Specify a location. Click Next to continue.
9
Page 18
Chapter 1. Introduction
3. The sds200.inf f ile is located in SoftScope CD-R OM root directory. Specify the location by
either entering or browsing.
4. sds200.inf file is detected automatically. Click Next to continue.
5. Click Finish.
10
Page 19
Chapter 1. Introduction
6. Warning!
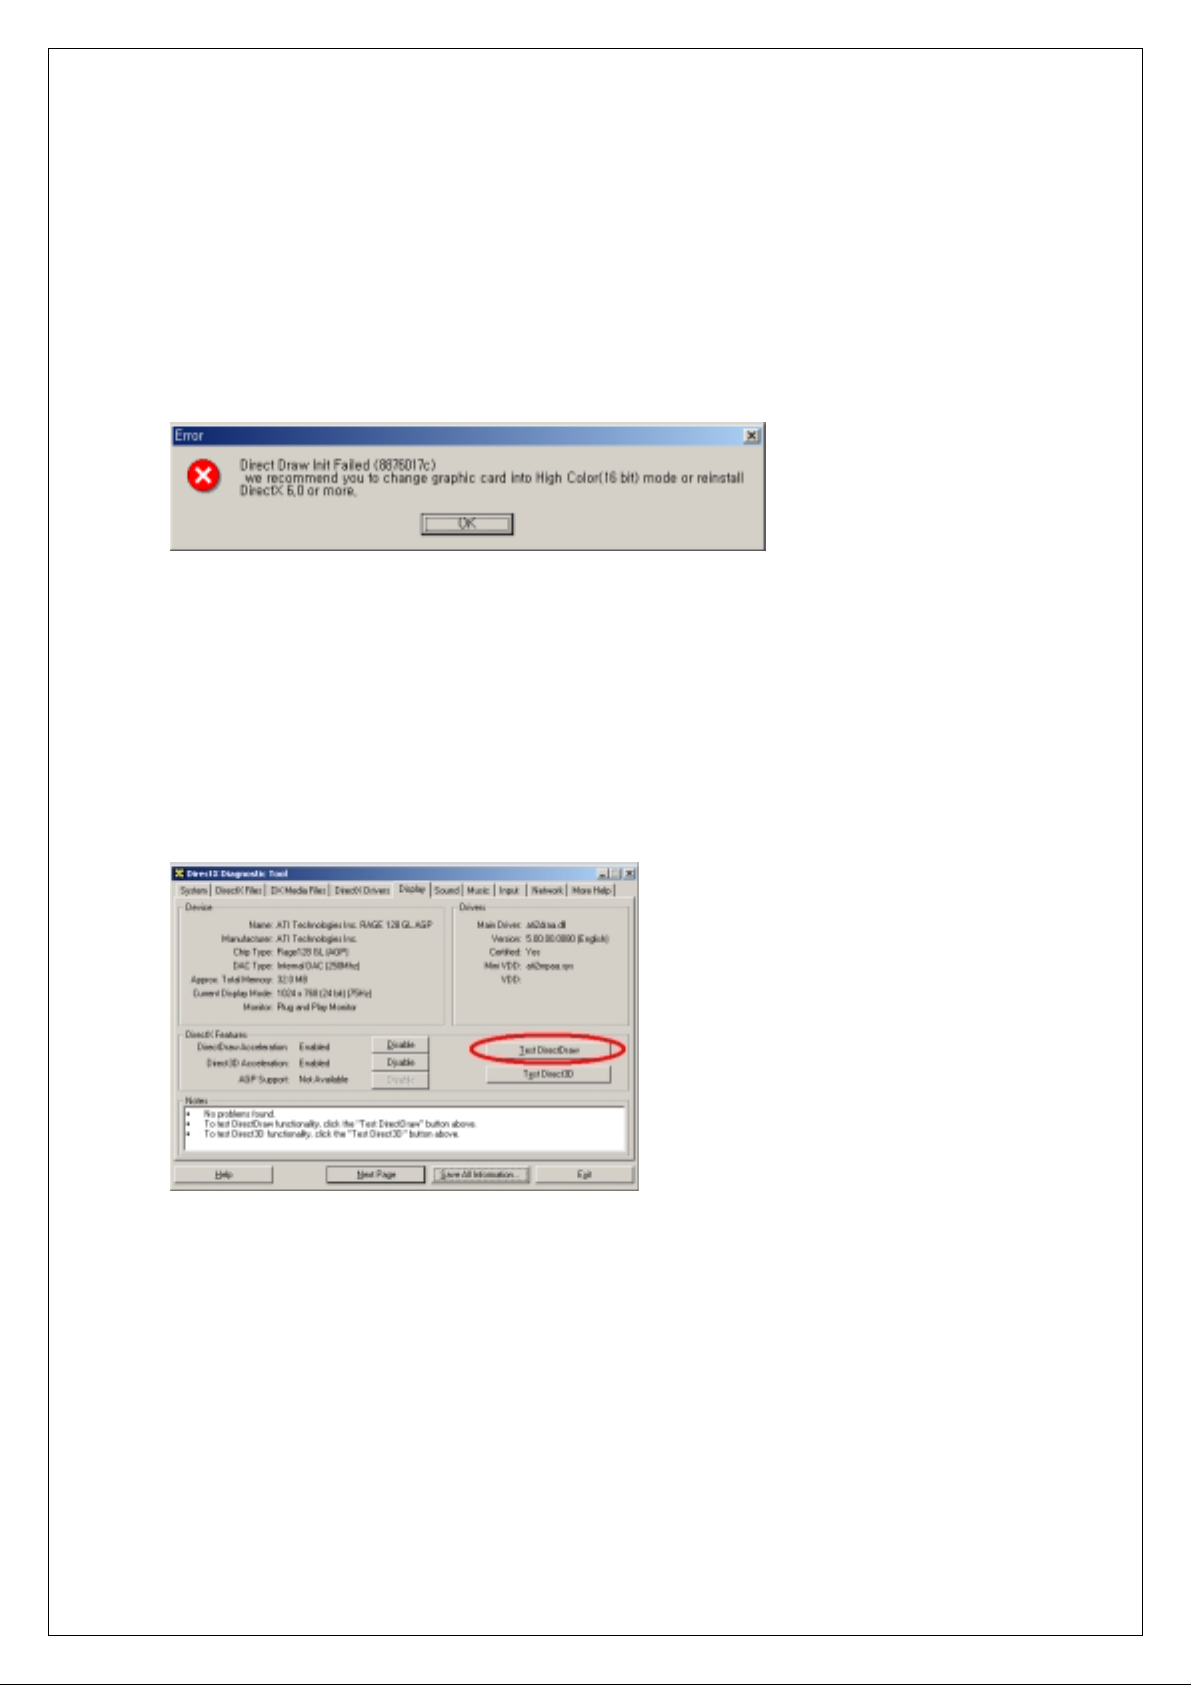
We recommend using High Color(16 bit) mode. With some graphic cards with 32 bit color depth,
SoftScope doesn't work. SoftScope doesn’t support 24 bit color mode.
If you see the following error message when you run SoftScope. Check the following two items.
Check if DirectX is installed and work well.
Under Window98 environm ent, run DXDiag.ex e which is in C:\ Program Files\DIR ECTX\SETUP
directory(The default directory may be different if you choose other directory at DirectX setup).
Under Windows2000 environment, run DXDiag.exe which is in C:\WinNT\System32.
Under WindowsME environment, run DXDiag.exe which is in C:\WinNT\System.
In the <display> section, run <DirectDraw Test>.
Check if DirectX works well.
11
Page 20
Chapter 1. Introduction
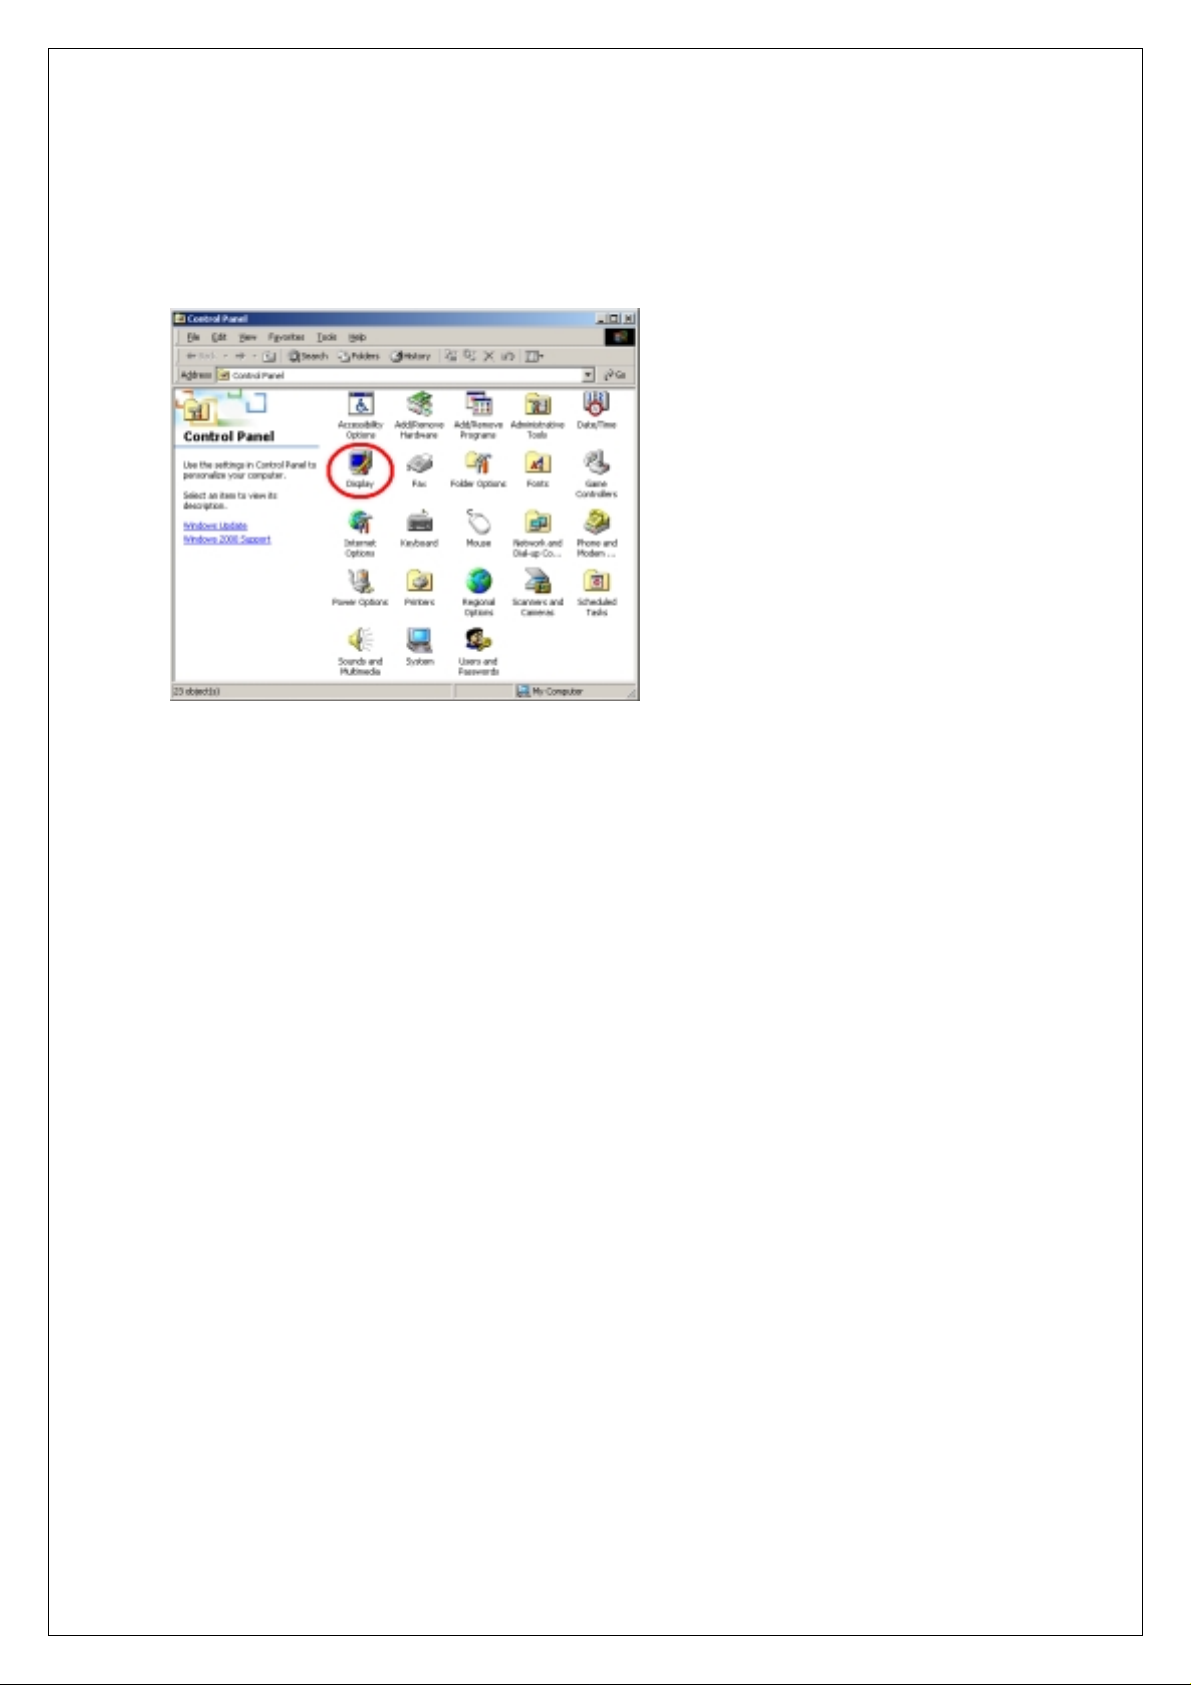
Check if you're using High Color(16 bit) mode.
Under Control Panel choose ‘Display’ applet.
3. Set High Color (16bit) mode and click OK to continue.
12
Page 21
Chapter 1. Introduction
7. Calibration
SDS 200 calibration
1. When manufactured, SDS 200 is calibrated manually to obtain maximum performance.
2. You may calibrate SDS 200 5 or 6 months after purchase.
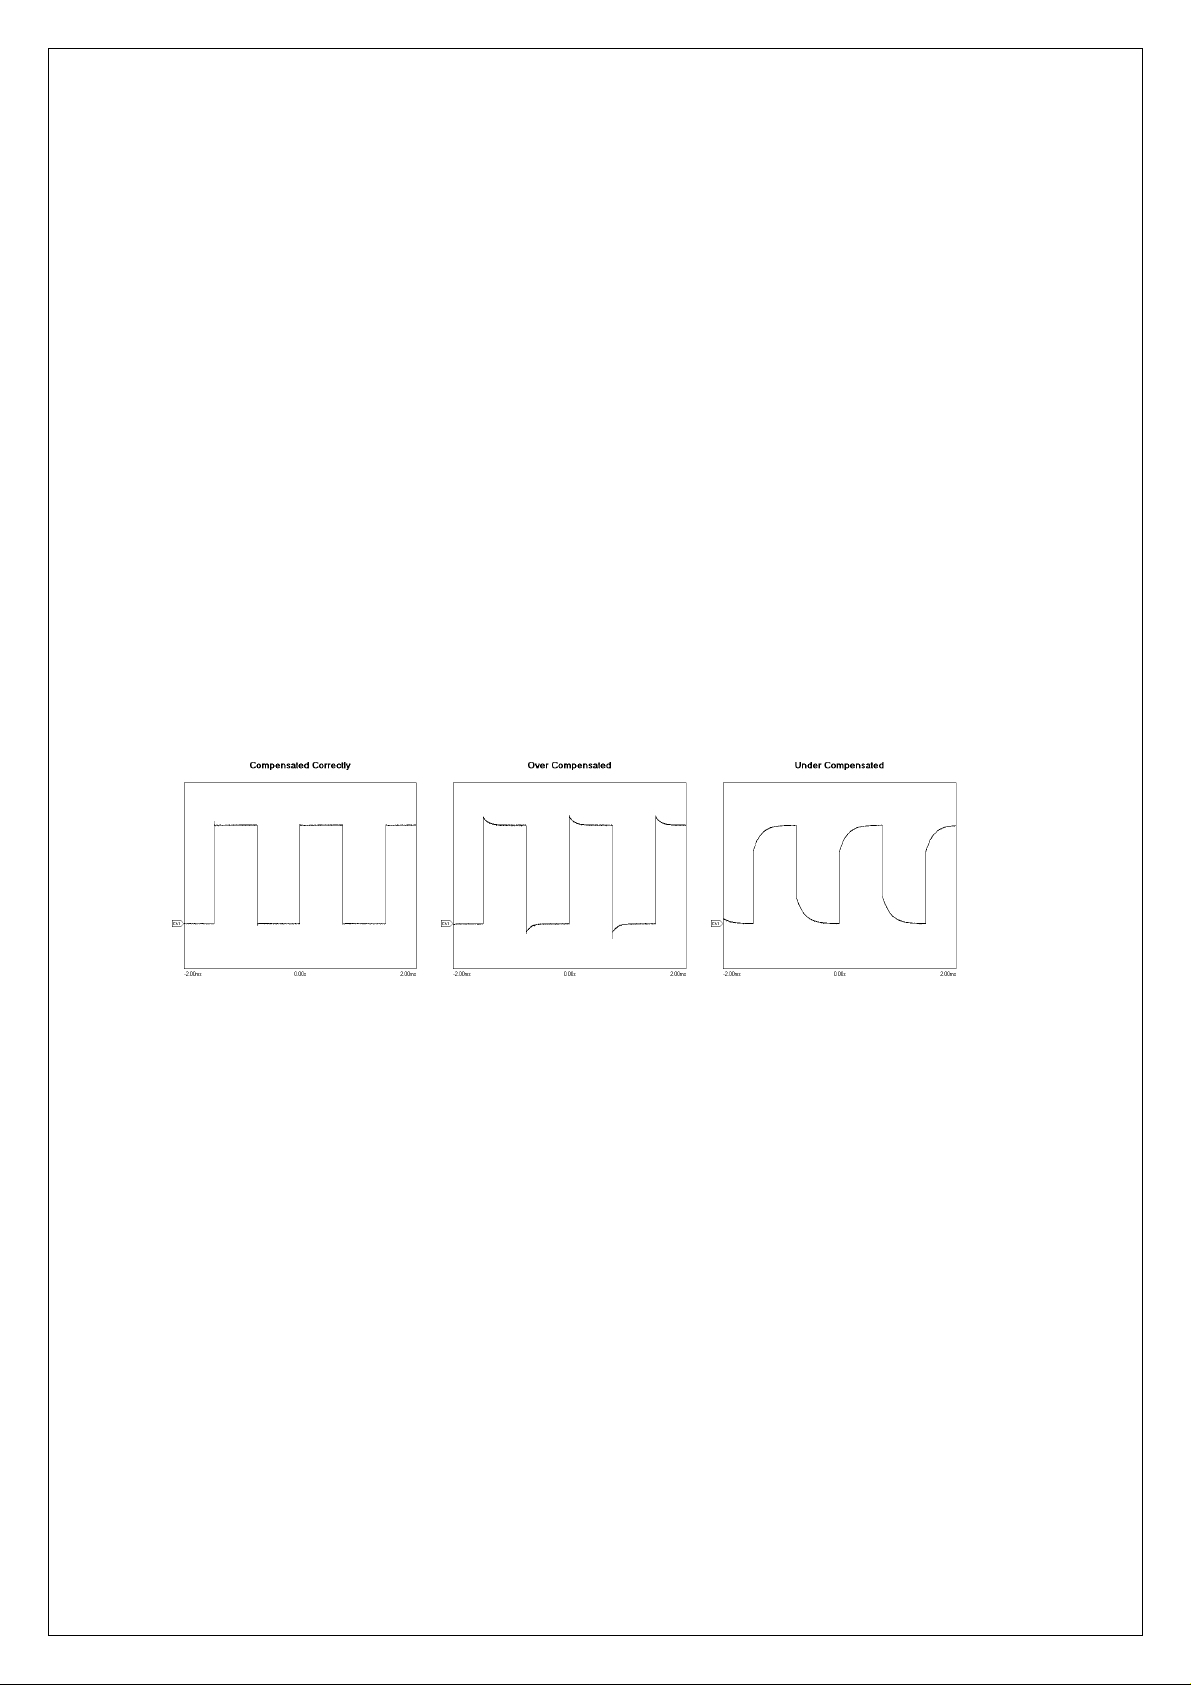
Probe Compensation
1. You must use a probe with more than 200MHz bandwidth to get undistorted signal.
2. Probe should be compensated whenever it is connected for the first time.
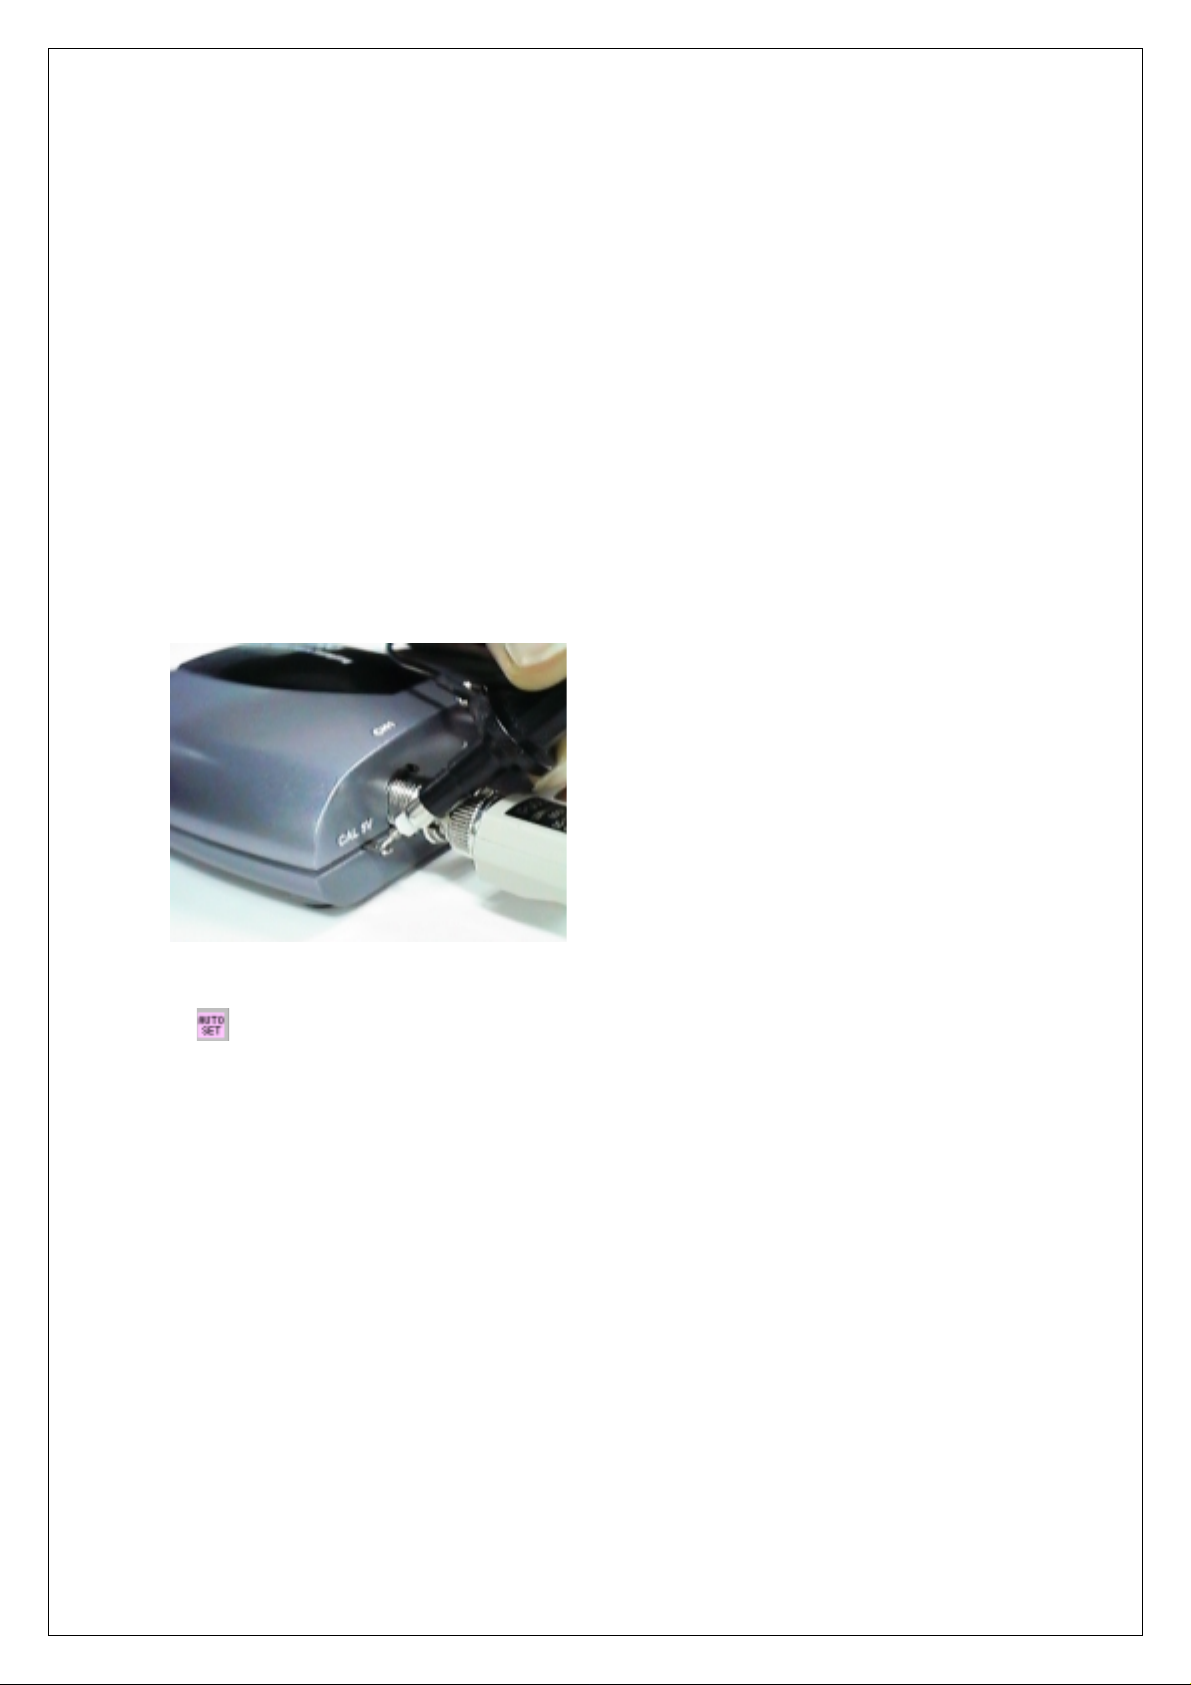
3. Connect calibration signal to channel 1, then push AUTOSET.
4. Check the shape of the displayed waveform.
5. Adjust the probe until the displayed waveform is compensated.
13
Page 22
Chapter 2. How to use SDS 200/SoftScope
Ch 2. How to use SDS 200/SoftScope
1. Simple Measurement
1. Start SoftScope.
2. SoftScope check s the internal state of SDS 200 , USB communication status and then read
initialization data.
3. Connect channel 1 probe to the calibration terminal.
Push the autoset button.
4.
5. SoftScope sets vertical/horizontal scale automatically.
6. Join dots to a solid line.
A. SoftScope displays the data from SDS200 as a dotted line.
B. To see the waveform more clearly, push the line-join icon.
7. Add persistence effect.
A. Persistence effect is analog-scope like effect that remembers the history of displayed
waveforms. With persistence effect, you can see the more frequent line clearer.
B. Change the persistence effect coefficient.
14
Page 23

Chapter 2. How to use SDS 200/SoftScope
8. Change the intensity of the waveform.
A. Just as in changing the persistence effect, you can change the intensity.
B. By changing the scroll bar in the menu, you can see a more/less distinct line.
15
Page 24
Chapter 2. How to use SDS 200/SoftScope
2. Basic Operations
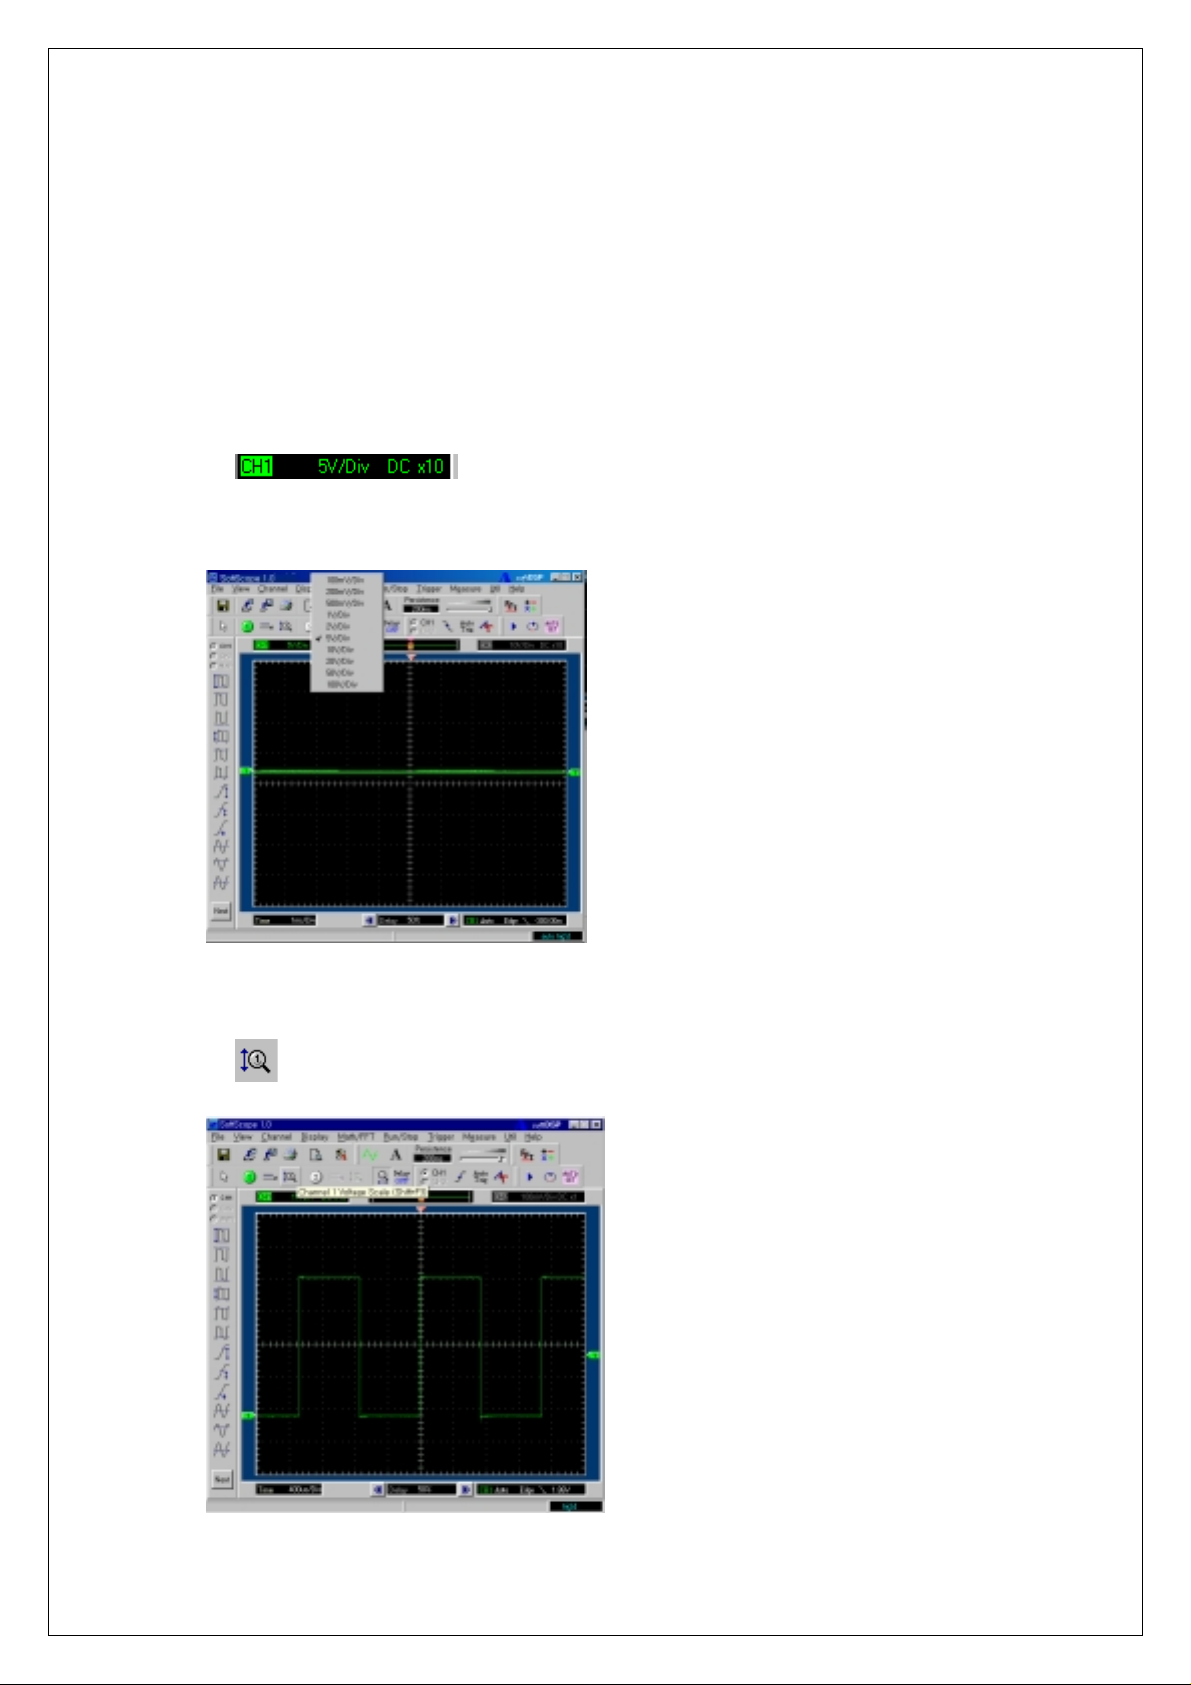
Change Vertical Scale(Volt/Div)
1. Change vertical scale(volt/div) from panel.
A.
B. Set the volt/div scale with mouse or keyboard.
C. Vertical scale is changed.
2. Change vertical scale(volt/div) with mouse button.
Push voltage scale change panel.
A.
Push voltage scale change icon.
16
Page 25
Chapter 2. How to use SDS 200/SoftScope
B. Mouse icon is changed to number 1.
C. Push the left/right mouse button to change volt/div.
D. With mouse that supports scroll button, change the voltage offset.
3. Change vertical scale(volt/div) from menu and hot-key.
A. Channel ÆCh1 Setting ÆVolt Scale
B. Press the appropriate hot-key.
4. Change AC/DC setting.
A. Push the AC/DC icon to change.
B. Push the same button once more to restore.
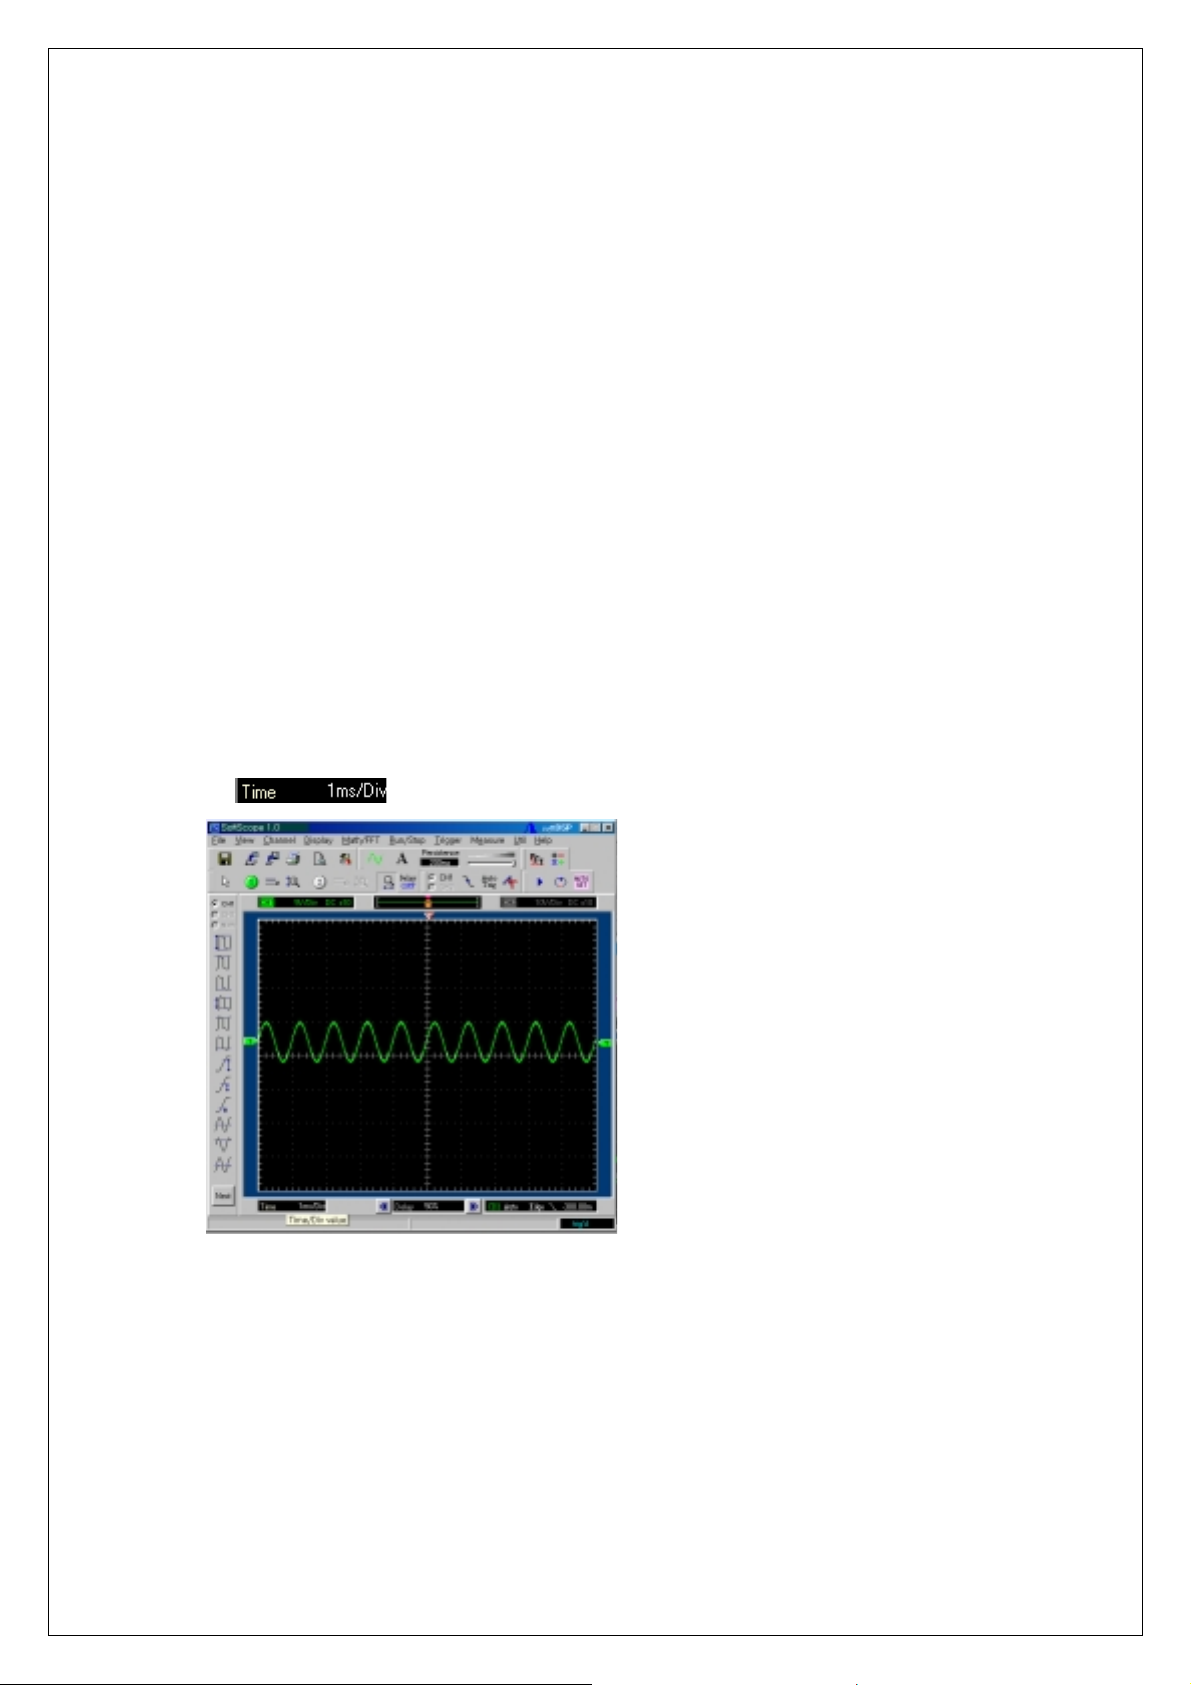
Change Horizontal Scale(Time/Div)
1. Change horizontal scale(time/div) from panel.
A.
Push time scale change panel.
B. Set the time/div scale with mouse or keyboard.
17
Page 26
Chapter 2. How to use SDS 200/SoftScope
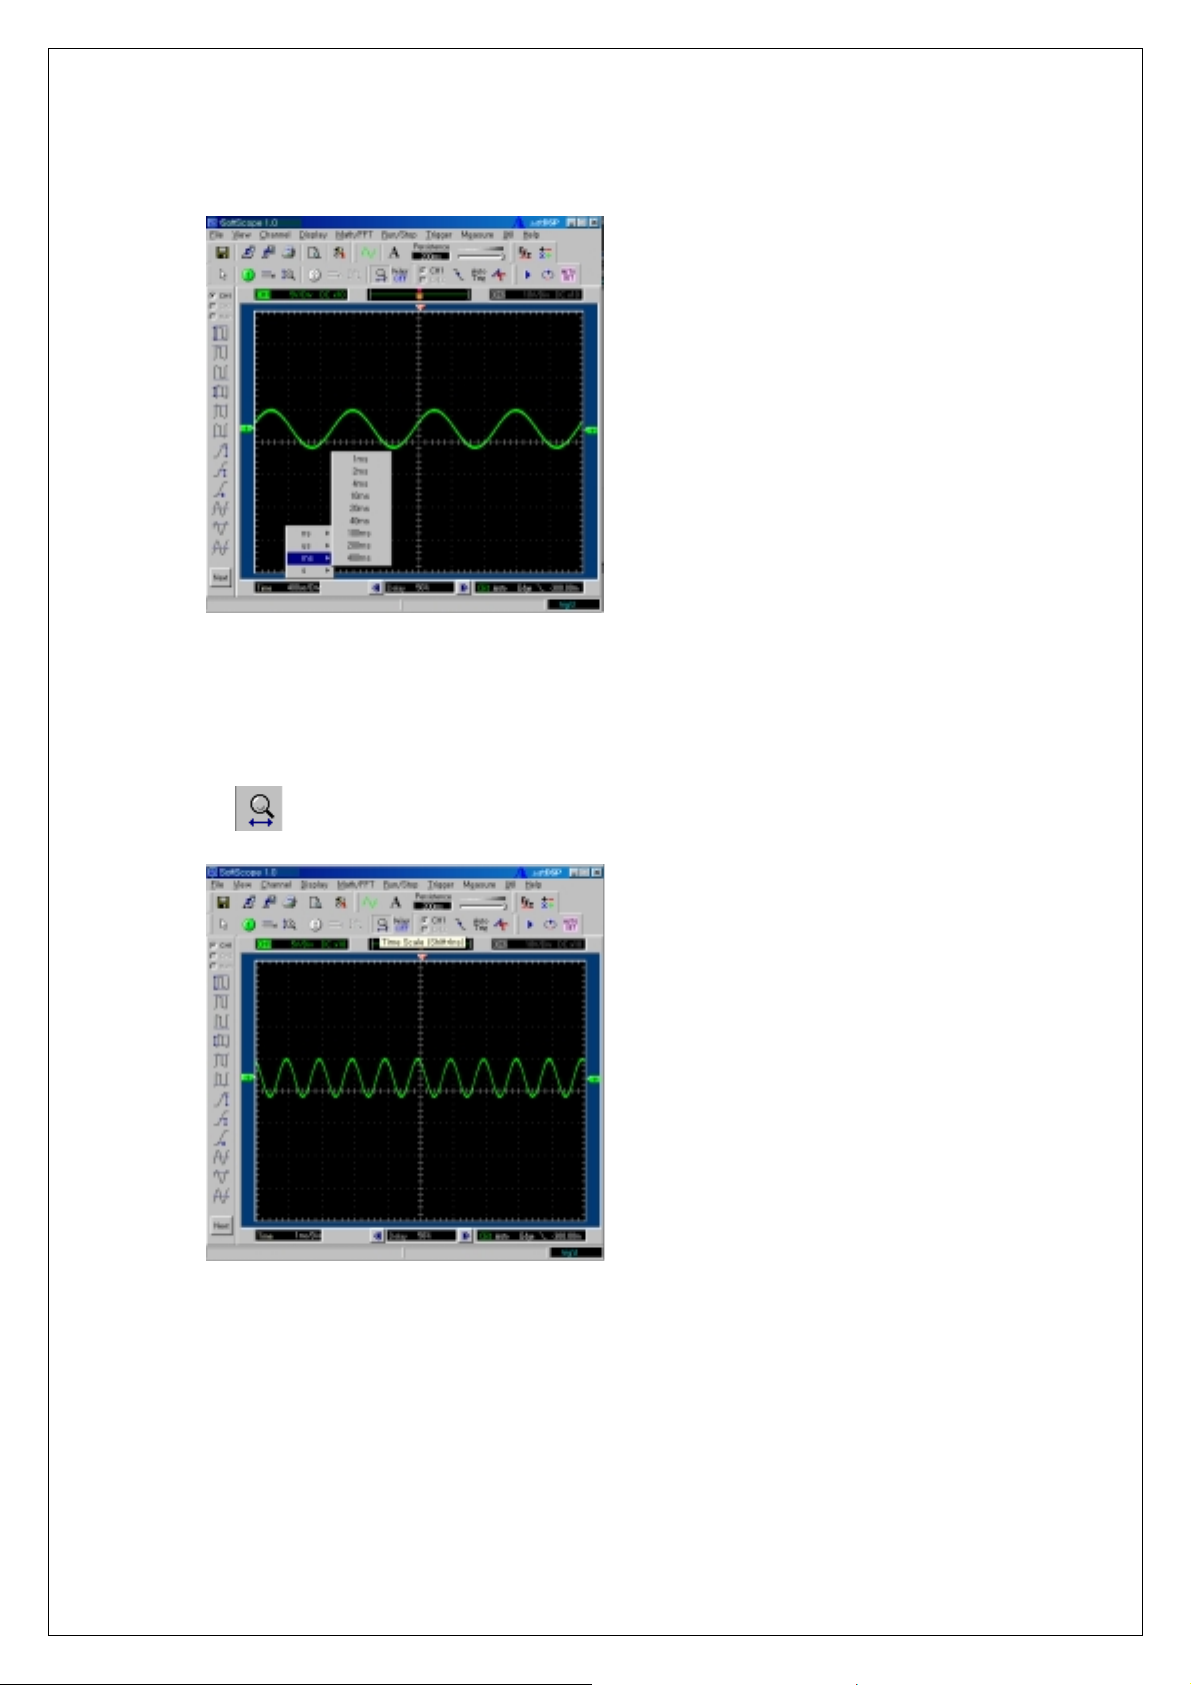
C. Horizontal scale is changed.
2. Change horizontal scale(time/div) with mouse button.
A.
Push time scale change icon.
B. Cursor is changed to “T”.
C. Push the left/right mouse button to change volt/div.
D. With mouse that supports scroll button, change the trigger point.
18
Page 27
Chapter 2. How to use SDS 200/SoftScope
3. Change horizontal scale(time/div) from menu and hot-key.
A. Channel Æ Time Scale.
B. Press the appropriate hot-key.
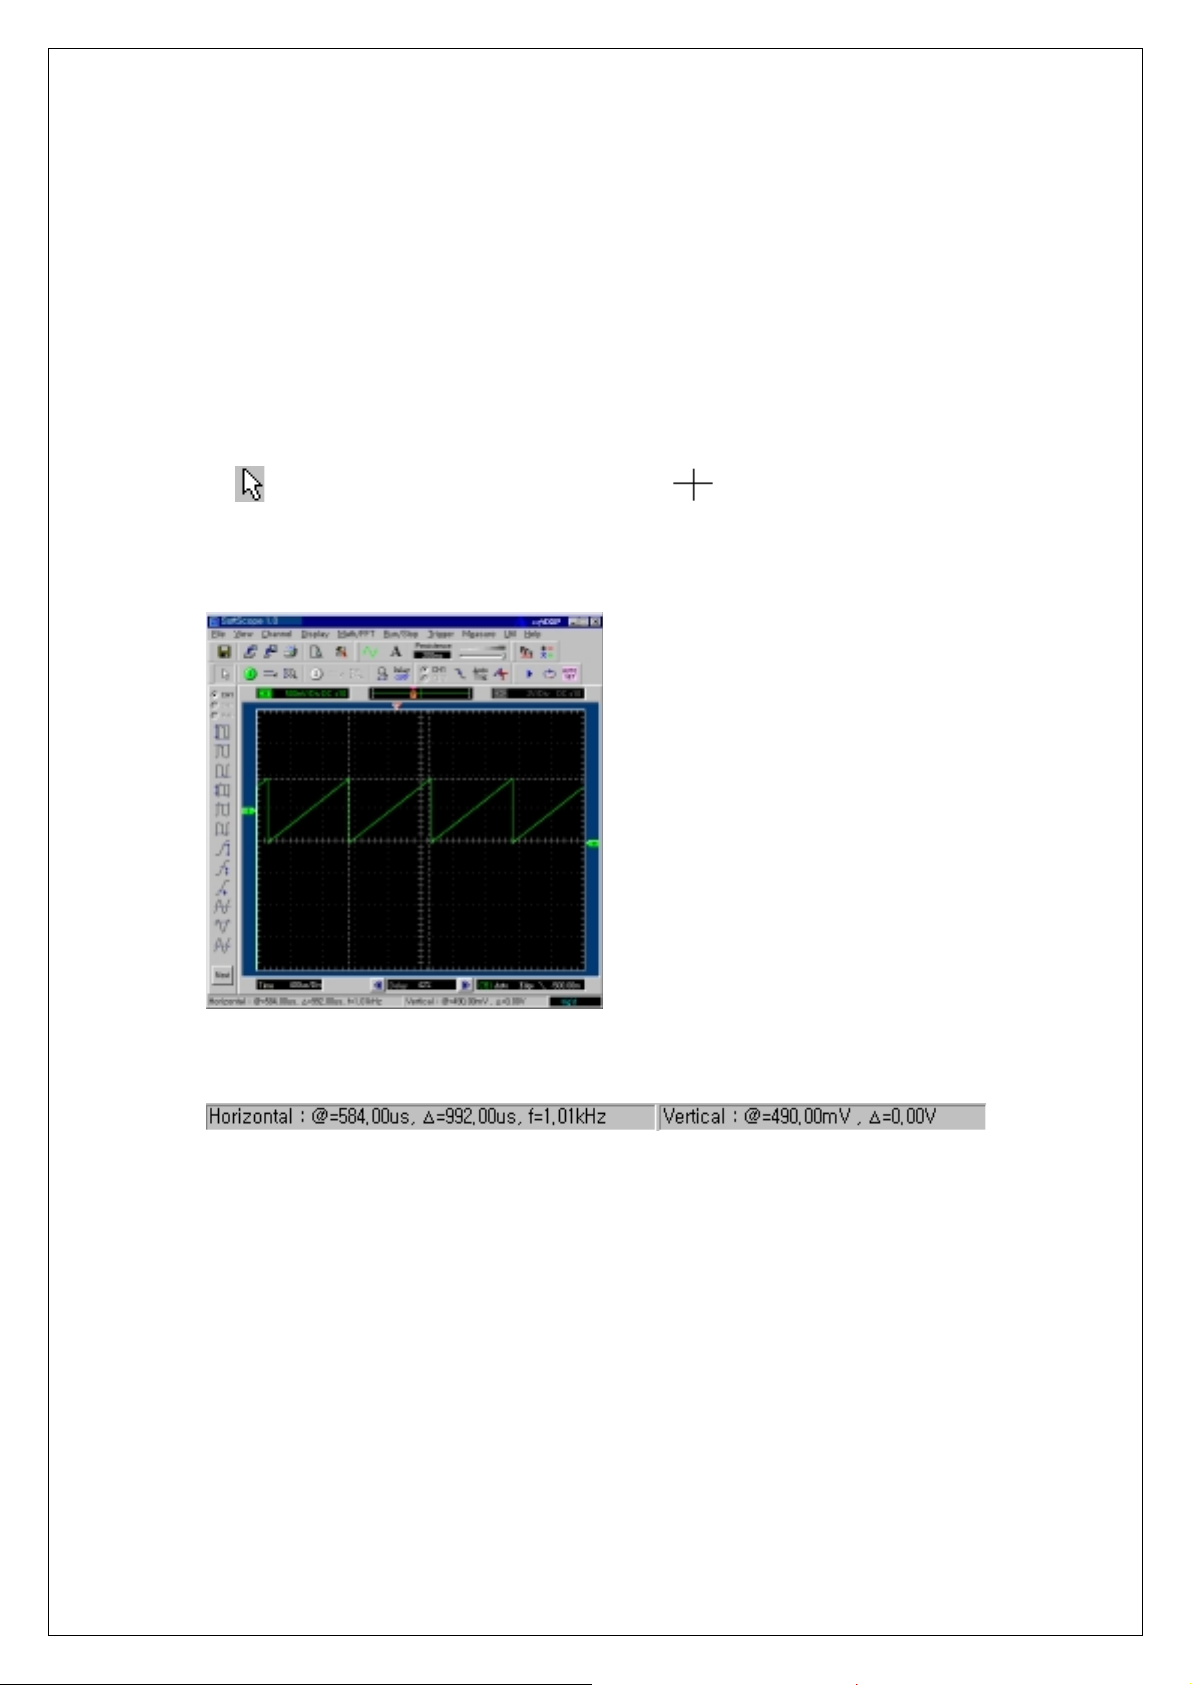
Measurement Using Cursor
Measure voltage and time offset simply using mouse.
Push icon and the cursor is changed to cross .
A.
B. Push left mouse button, and the cross lines appear.
C. Drag the mouse button to the point you want to measure.
D. Release the lef t mouse button, the voltage differ ence and time differenc e will be shown
at the status bar.
E. Push right mouse button, and the cross lines disappear.
19
Page 28
Chapter 2. How to use SDS 200/SoftScope
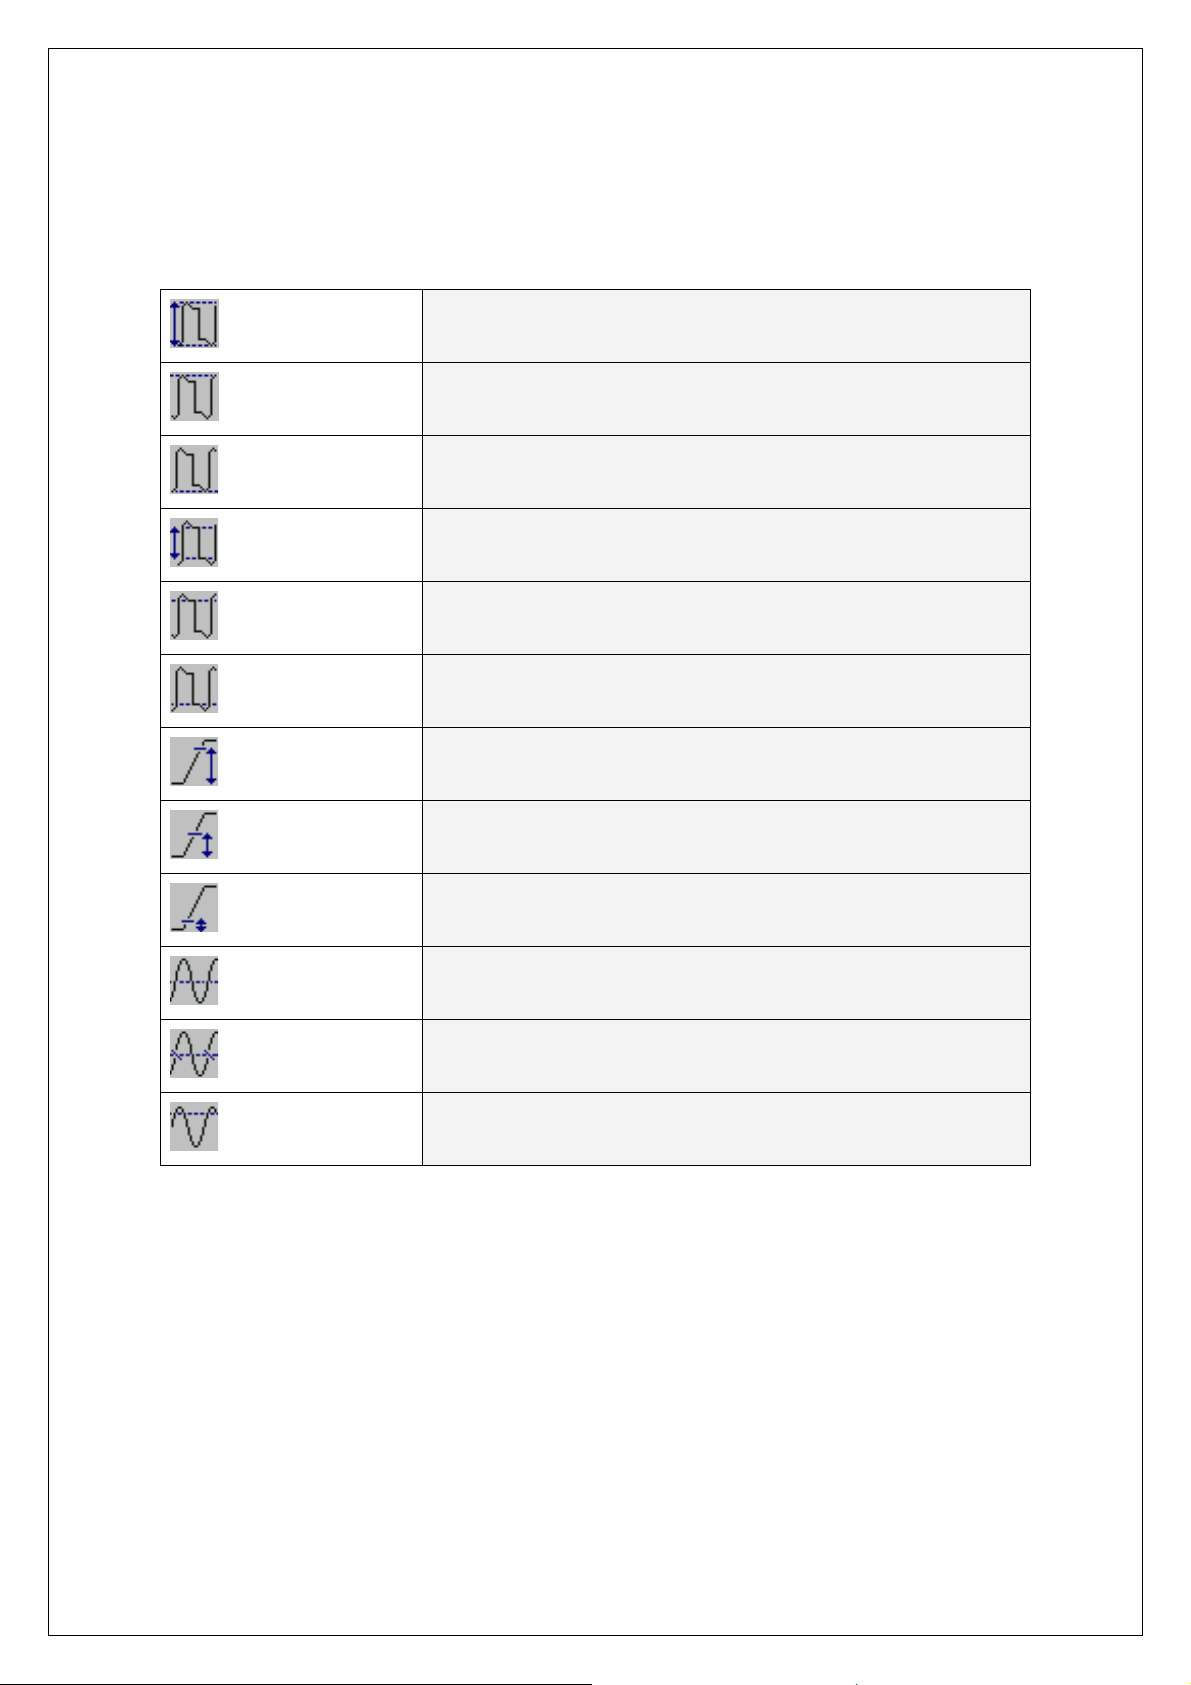
Measurement by Icon
SDS 200 has many measurement functions.
-Peak-to-peak = Max – Min
Pk-Pk
Max
Min
Amp
Base
Top
-Measured over the entire waveform
-Voltage of the absolute maximum level
-Measured over the entire waveform
-Voltage of the absolute minimum level
-Measured over the entire waveform
-Amp = Base – Top
-Measured over the entire waveform
-Voltage of the statistical minimum level
-Measured over the entire waveform
-Voltage of the statistical maximum level
-Measured over the entire waveform
Upper threshold
Middle threshold
Lower threshold
Mean
Cycle mean
RMS
-Voltage of the 90% level from base to top
-Voltage of the 50% level from base to top
-Voltage of the 10% level from base to top
-The arithmetic mean over the entire waveform
-The arithmetic mean over the first cycle in the waveform
-The Root Mean Square voltage over the entire waveform
20
Page 29
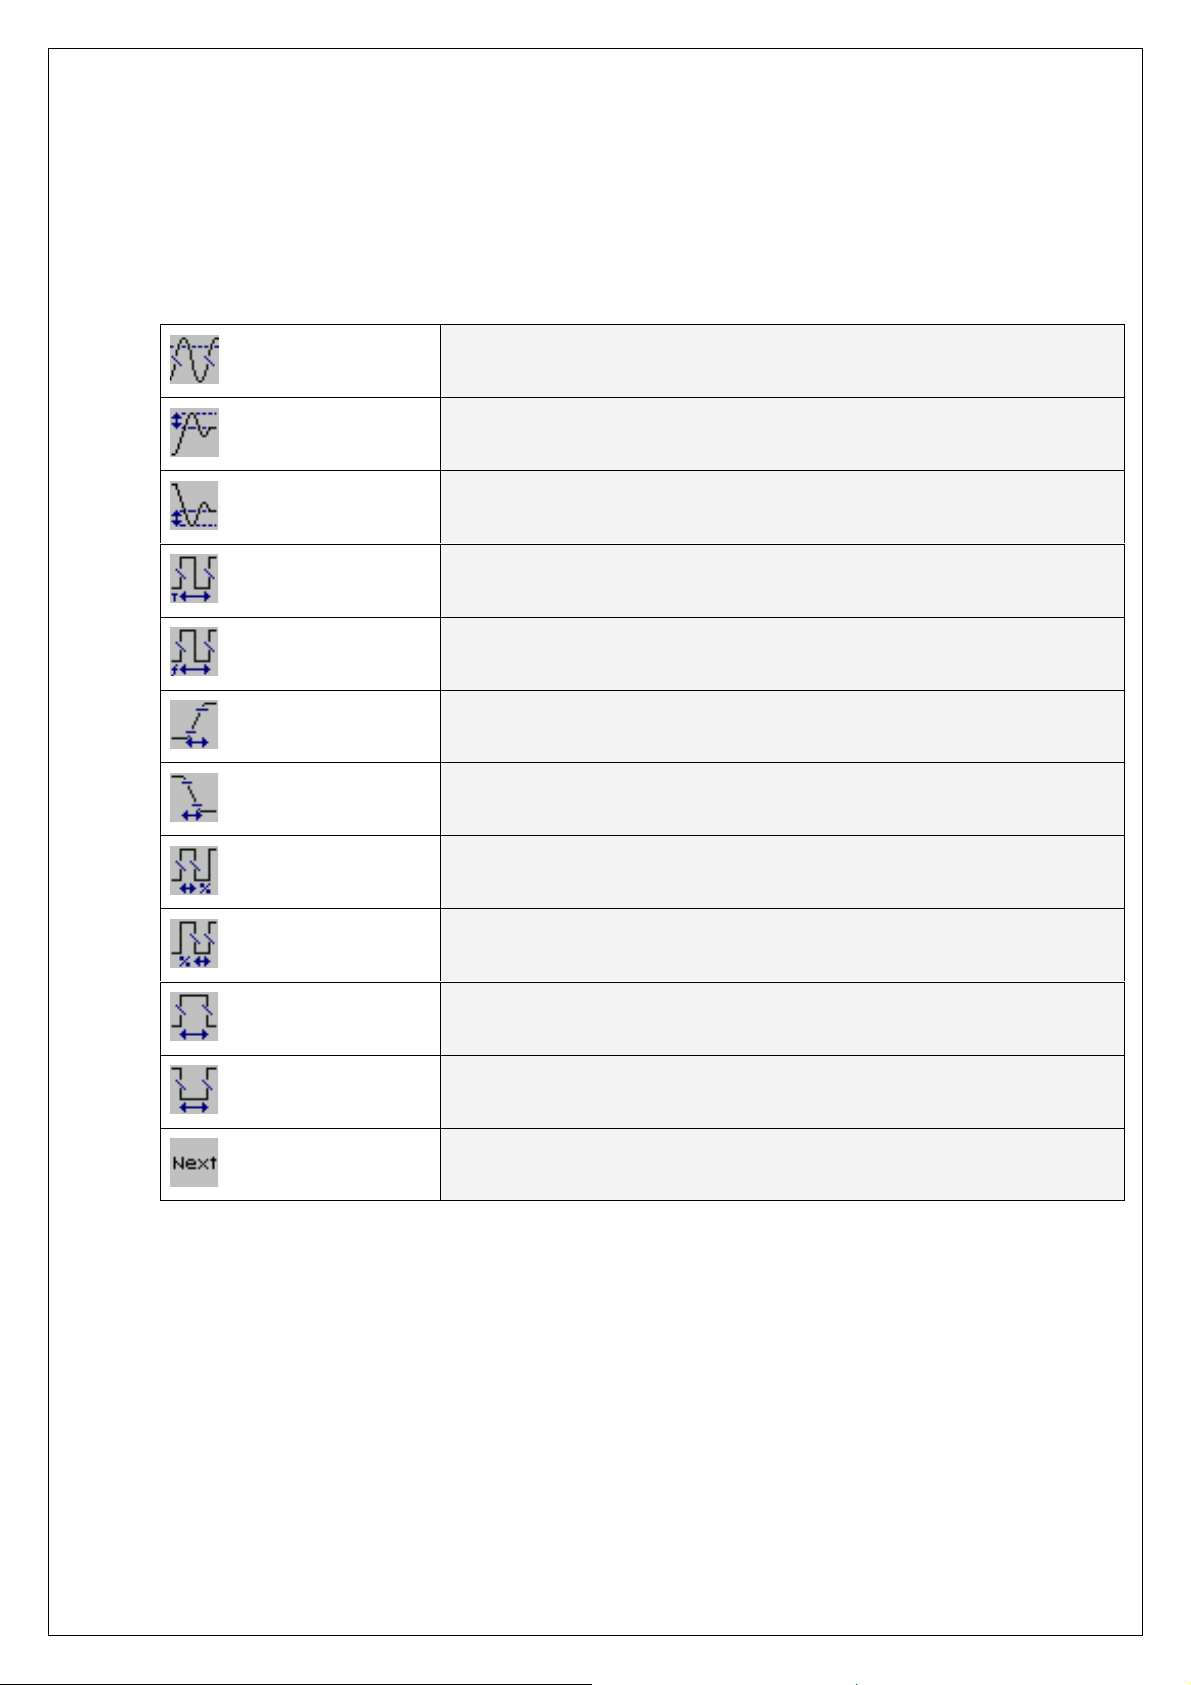
Cycle RMS
Positive Overshoot
Negative Overshoot
Period
Frequency
Chapter 2. How to use SDS 200/SoftScope
- The Root Mean Square voltage over the first cycle in the waveform
- Positive Overshoot = (Max - Top)/Amp x 100 %
- Measured over the entire waveform
- Negative Overshoot = (Base - Min)/Amp x 100 %
- Measured over the entire waveform
- Time to take for the first signal cycle to complete in the waveform
- Measured in seconds
- Reciprocal of the period of the first cycle in the waveform
- Measured in Hertz(Hz)
Rise time
Fall time
Positive Duty Cycle
Negative Duty Cycle
Positive Pulse Width
Negative Pulse Width
Next
- Time taken from lower threshold to upper threshold
- Time taken from upper threshold to lower threshold
- Positive Duty Cycle = (Positive Pulse Width)/Period x 100%
- Measured of the first cycle in waveform
- Negative Duty Cycle = (Negative Pulse Width)/Period x 100%
- Measured of the first cycle in waveform
- Measured of the first positive pulse in the waveform
- The time between the 50% amplitude points
- Measured of the first
- View next icons
21
Page 30
Chapter 2. How to use SDS 200/SoftScope
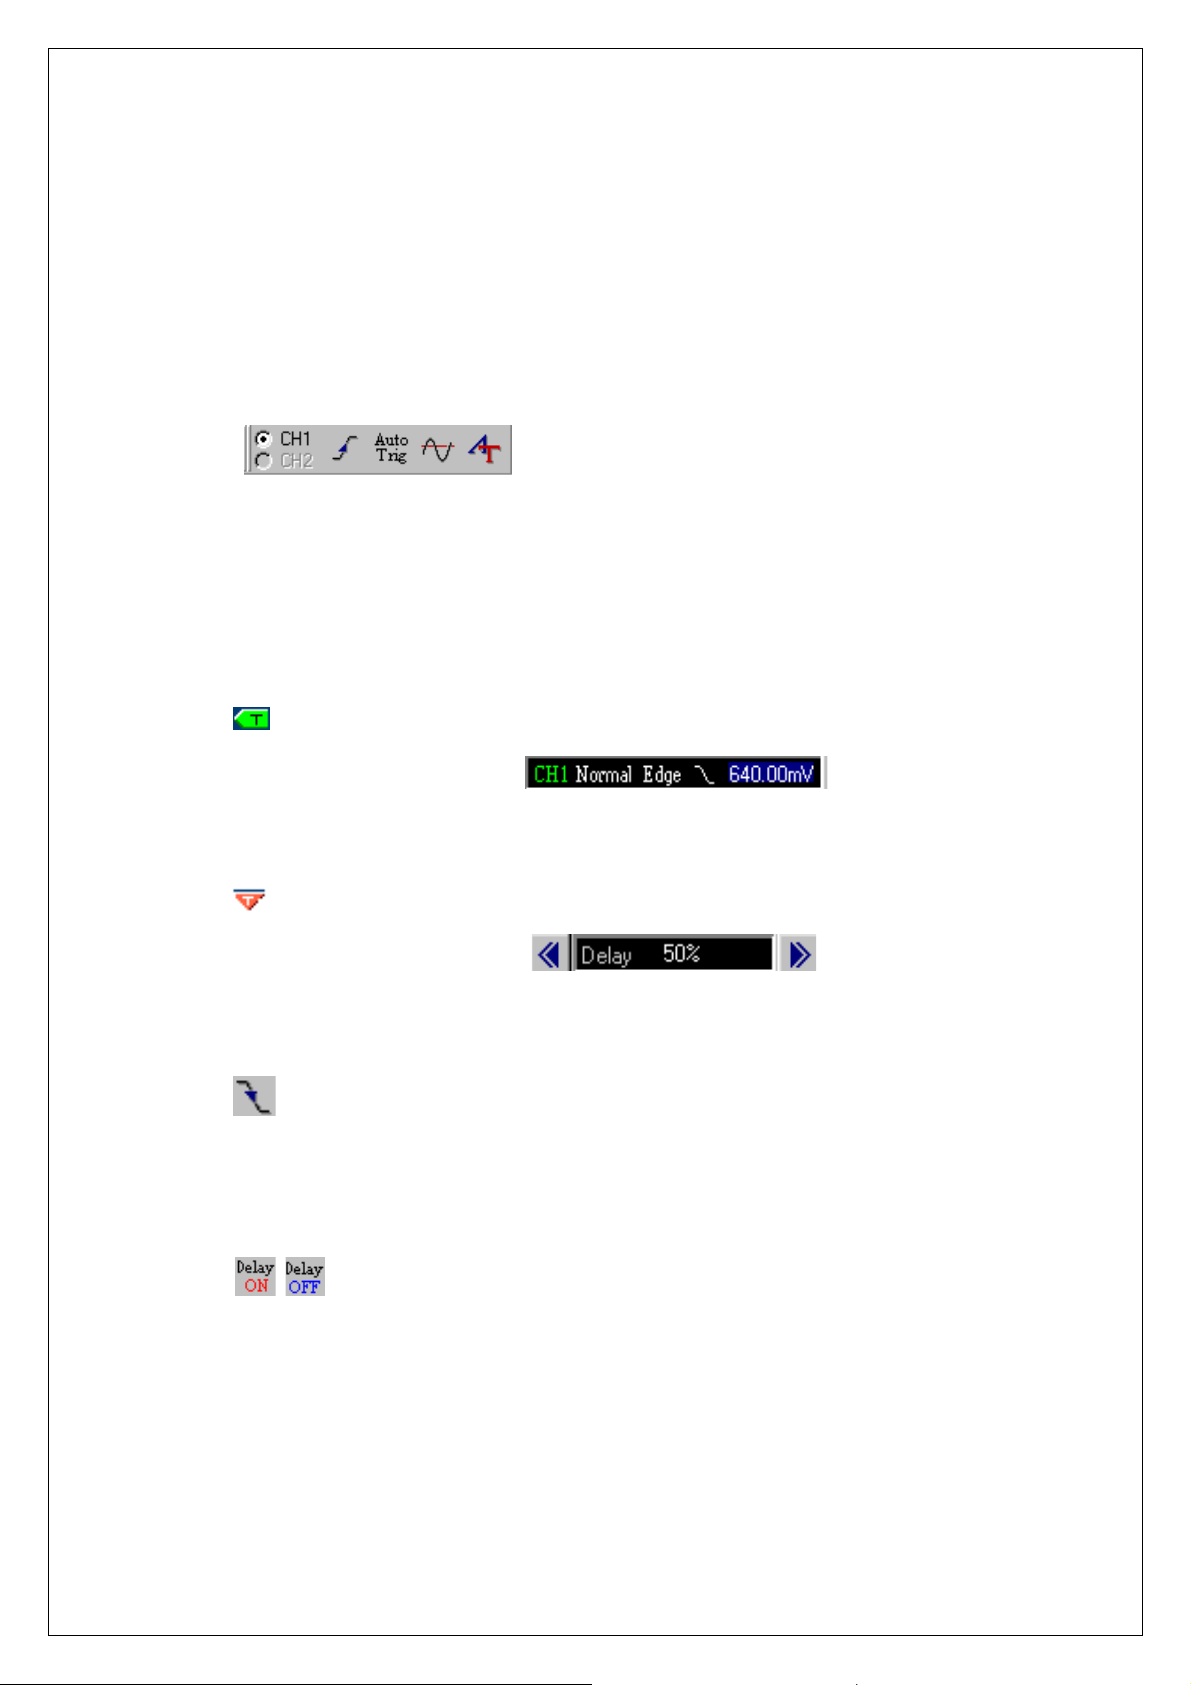
Change Trigger Level & Trigger Poi nt
1.Set the trigger input source.
A. With only one cha nnel on, trig ger inp ut source is autom aticall y set to the c hannel. W ith 2
channels on, you can choose trigger input source between the two.
B. Change trigger source from the radio-button.
C. Change trigger source from menu bar.
EX) Trigger Æ Trigger Source CH1 or CH2
D. Change trigger input source using hot key.
2. Change the trigger level.
A.
B. Input the trigger level from editor
3. Change the trigger point.
A.
B. Input the trigger point from editor.
4. Change the trigger condition.
A.
B. Use menu or hot-key. ( Trigger Æ Trigger Up/Down )
5. Set delay on/off.
Move the trigger level icon, you can move the trigger level.
Move the trigger point icon, you can move the trigger point.
Push the trigger up/down icon to change trigger condition.
A.
B. When delay on, the trigger point separates from the horizontal expansion point. The
Push the delay button to set delay on or off.
horizontal expansion point stays at the center of the screen.
22
Page 31
Chapter 2. How to use SDS 200/SoftScope
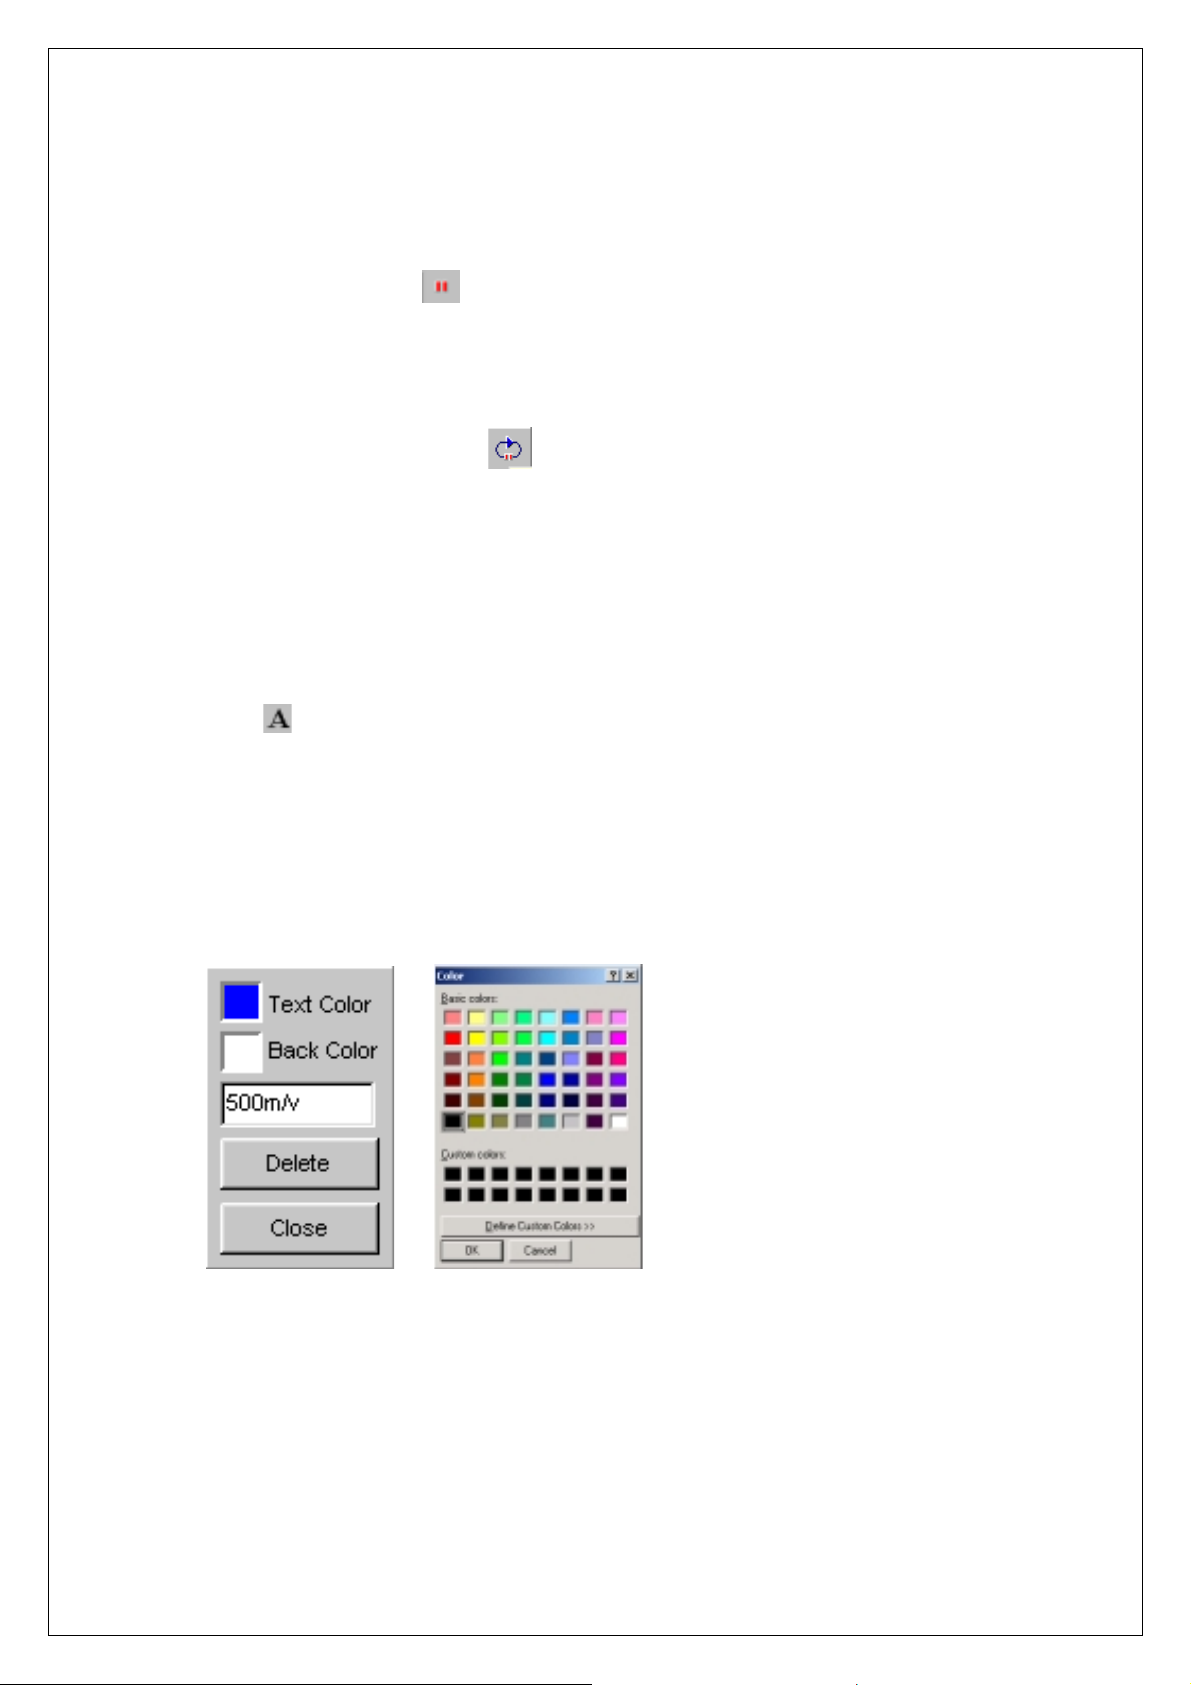
Single Shot/Stop Mode
1. Change state to stop or single shot.
A. Push the stop button
B. Every operation is the same as in the running state.
2. Single-shot action.
A. Push the single-sho t button
you set.
B. Single-shot is available only in Real Time mode.
C. Push the single-shot button again to pause, SDS 200 waits for the trigger signal again.
, SDS200 is in stop state.
to ac quire only 1 waveform af ter the trigger condition
Put Label on The Screen
1. Add a label on the screen.
Push the label icon.
A.
B. The mouse cursor is changed to 'I' shape.
C. Push the left mouse button.
D. Input string.
E. Change the text/back color.
F. Push the confirm button to finish.
G. Change the label by clicking the label again.
23
Page 32
Chapter 2. How to use SDS 200/SoftScope
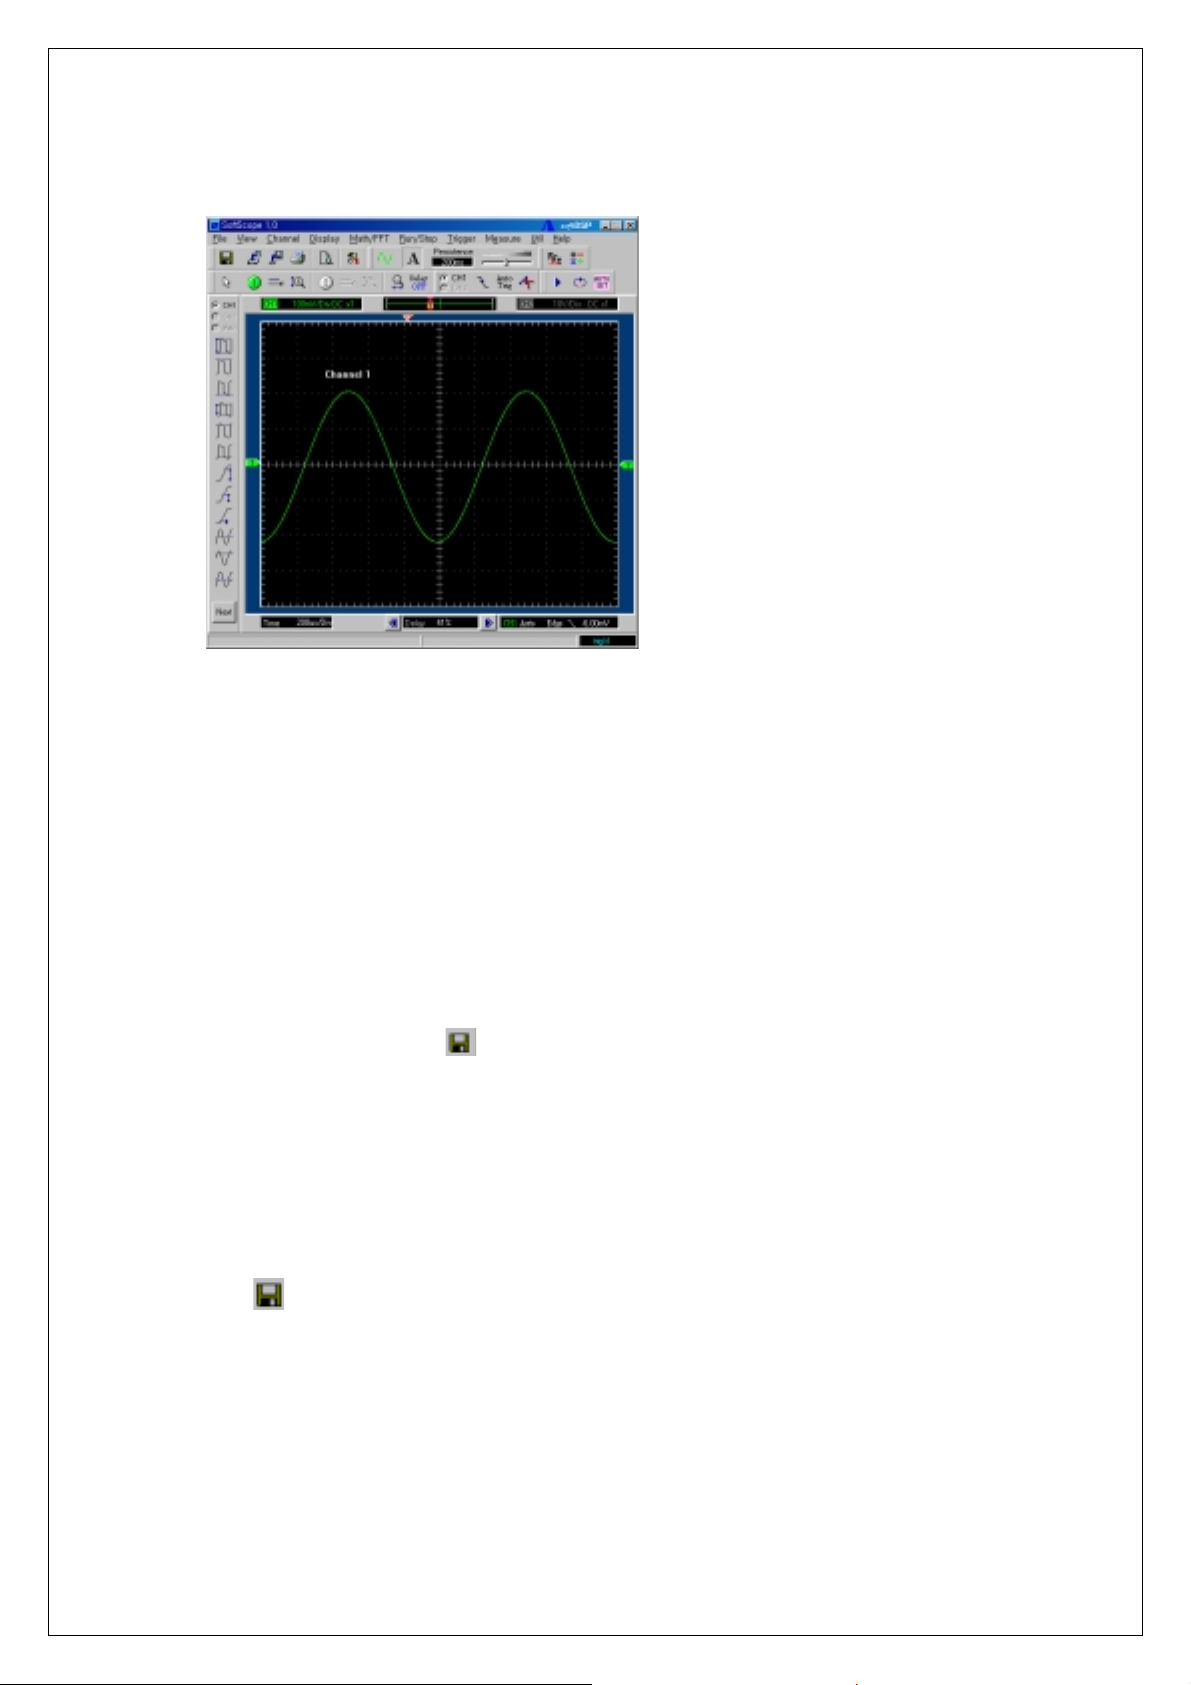
Print/Save Waveform
1. Save acquired waveform in the following formats.
A. Text File
B. JPG/BMP File
C. Excel File
D. Word File
2. Save as text format.
A. Push the save button
B. Enter the directory that you want to save the data file in.
C. Enter the name of data file that you want to save.
D. Select type 'DAT' at option.
E. Push the save button.
3. Save as JPG/BMP format.
and the dialog box appears.
A.
Push the save button.
B. Enter the title you want to give.
C. Enter the directory you want to save the data file in.
D. Enter the name of data file you want to save.
E. Select type 'BMP/JPG' at option.
F. Push the save button.
24
Page 33

Chapter 2. How to use SDS 200/SoftScope
4. Copy the image into clipboard.
A. Select Copy from the File menu.
B. Waveform is copied into clipboard.
C. Paste the image into any program that supports clipboard paste.
5. Transfer the data to MS Excel using ActiveX automation.
A. Select Copy at the File menu.
B. MS Excel is activated and then data is transferred by using ActiveX.
6. You can save the data to MS Word using ActiveX automation.
A. Select Copy at the File menu.
B. MS Word is activated and then data is transferred by using ActiveX.
7. Print the waveform.
A.
Push the print button.
Push the preview button to preview the image.
B.
C. Push 'OK' button.
25
Page 34
Chapter 3. Advanced Technique
Ch 3. Advanced Technique
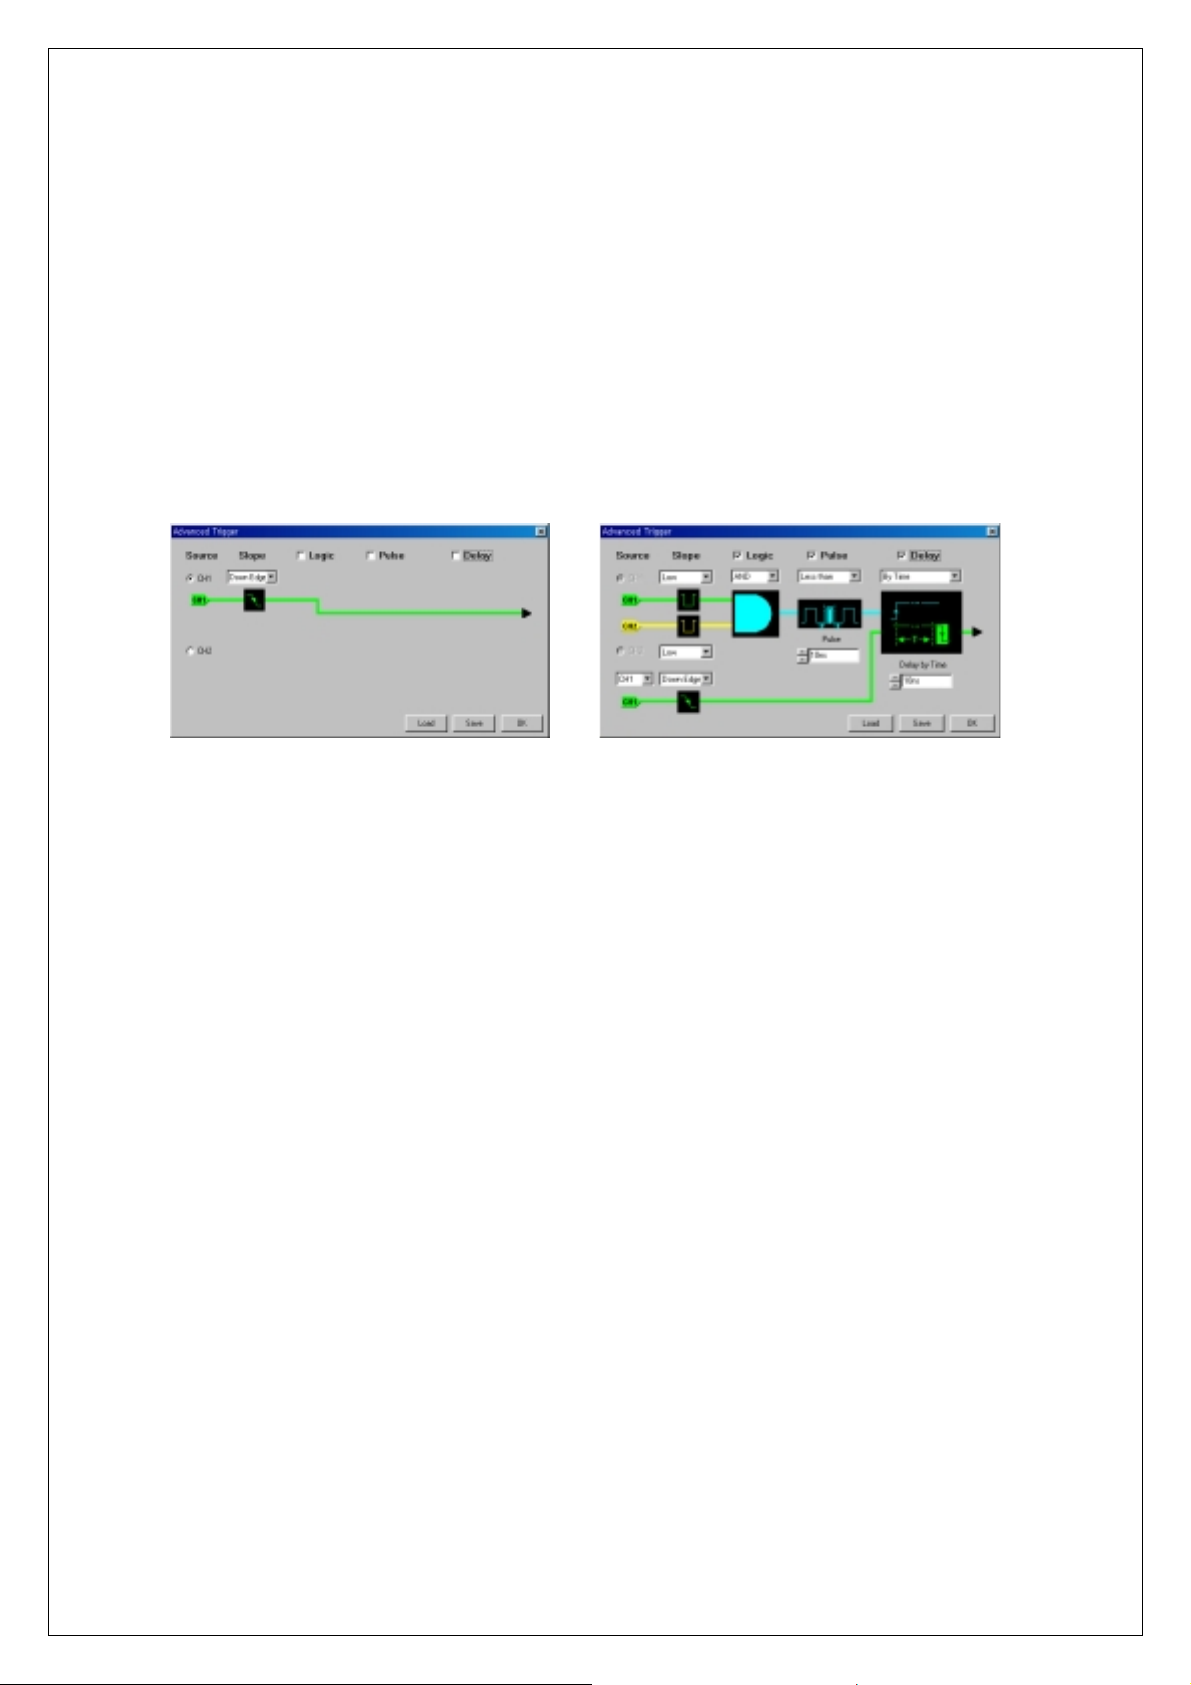
1. Advanced Trigger
You can return to normal trigger mode by uncheck Logic, Pulse, Delay check box in the
advanced trigger dialog box.
(Normal trigger mode) (Advanced trigger mode)
Edge Trigger
The Edge Trigger generates a trigger when the source signal passes through a specified level
in either positive or negative direction, set by the user. This is the same trigger type found in a
conventional analog oscilloscope. The source, the slope and the level must be set for Edge
Trigger operation.
Source
Slope
Level
: CH1/CH2
-Selects the trigger source.
: Up Edge/Down Edge
-Selects the slope of the source.
: +/- 4 vertical screen divisions (Full screen range)
-Selects the level of the input signal where the Edge Trigger is generated. The level is
selected by trigger level pointer at the right-hand side of the display screen and the source
is selected from the tool bar radio button.
26
Page 35

Chapter 3. Advanced Technique
Logic Trigger
The Logic Trigger generates a trigger depending on the logical relation between the state of the
two input channels. AND, NAND, OR, NOR, XOR, XNOR Logic Triggers are available and the
two input states can be negated if selected.
Ch1 state
Ch2 state
Logic type
: High/Low
-Selects the state of channel 1 signal for Logic Trigger input
: High/Low
-Selects the state of channel 2 signal for Logic Trigger input
: AND, NAND, OR, NOR, XOR, XNOR
-Selects logic type
Pulse Trigger
The Pulse Trigger generates a trigger if the pulse width of the input signal is either less or more
than the preset time.
Equation
: Less than/More than
- Selects whether the trigger is generated when the pulse is less than or more than the
preset pulse time value.
Time
: 10ns ~ 167ms
- Selects the pulse width time
Delay Trigger
The Delay Trigger generates a trigger by waiting for a preset time or number of events after a
primary trigger from combination of edge, logic and pulse trigger is generated and when the first
trigger from the secondary trigger source is detected.
Equation
Delay condition
: By time/By event
- Selects the delay condition either by time or by event.
: By time (10ns ~ 167ms)/By event (1 ~ 16,777,215 events)
27
Page 36
Chapter 3. Advanced Technique
Secondary trigger source
- Selects the trigger source of the secondary trigger.
Secondary trigger slope
- Selects the slope of the secondary trigger.
: CH1/CH2
: Rising/Falling
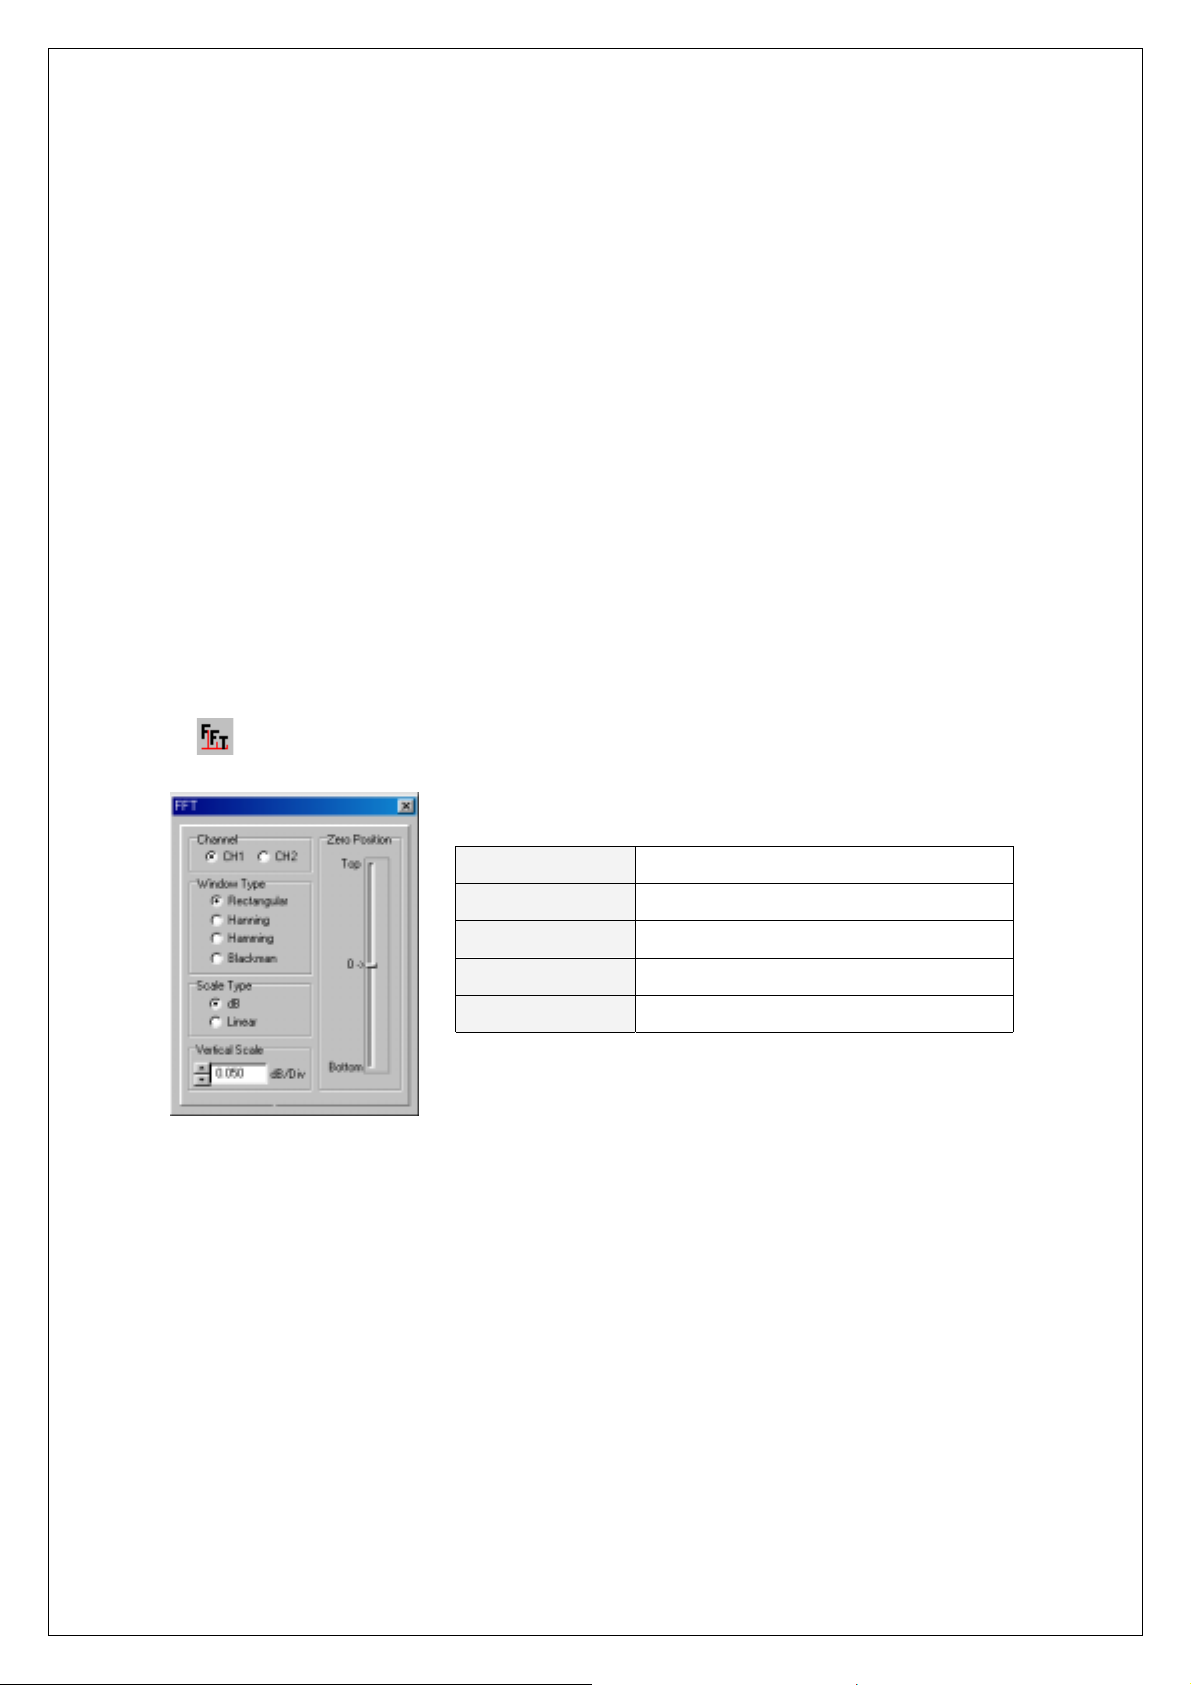
2. FFT
Analyze the frequency component of the waveform using FFT(Fast Fourier Transform).
1.
Push the FFT icon, and the FFT dialog box is appears.
Channel Sets input source to FFT analyze
Window Type Sets digital filter type
Scale Type Sets y scale to Linear or Log scale
Vertical Scale Sets vertical scale
Vertical Scale Sets offset
2. Move the FFT cursor over the FFT waveform to see the frequency component.
28
Page 37
Chapter 3. Advanced Technique
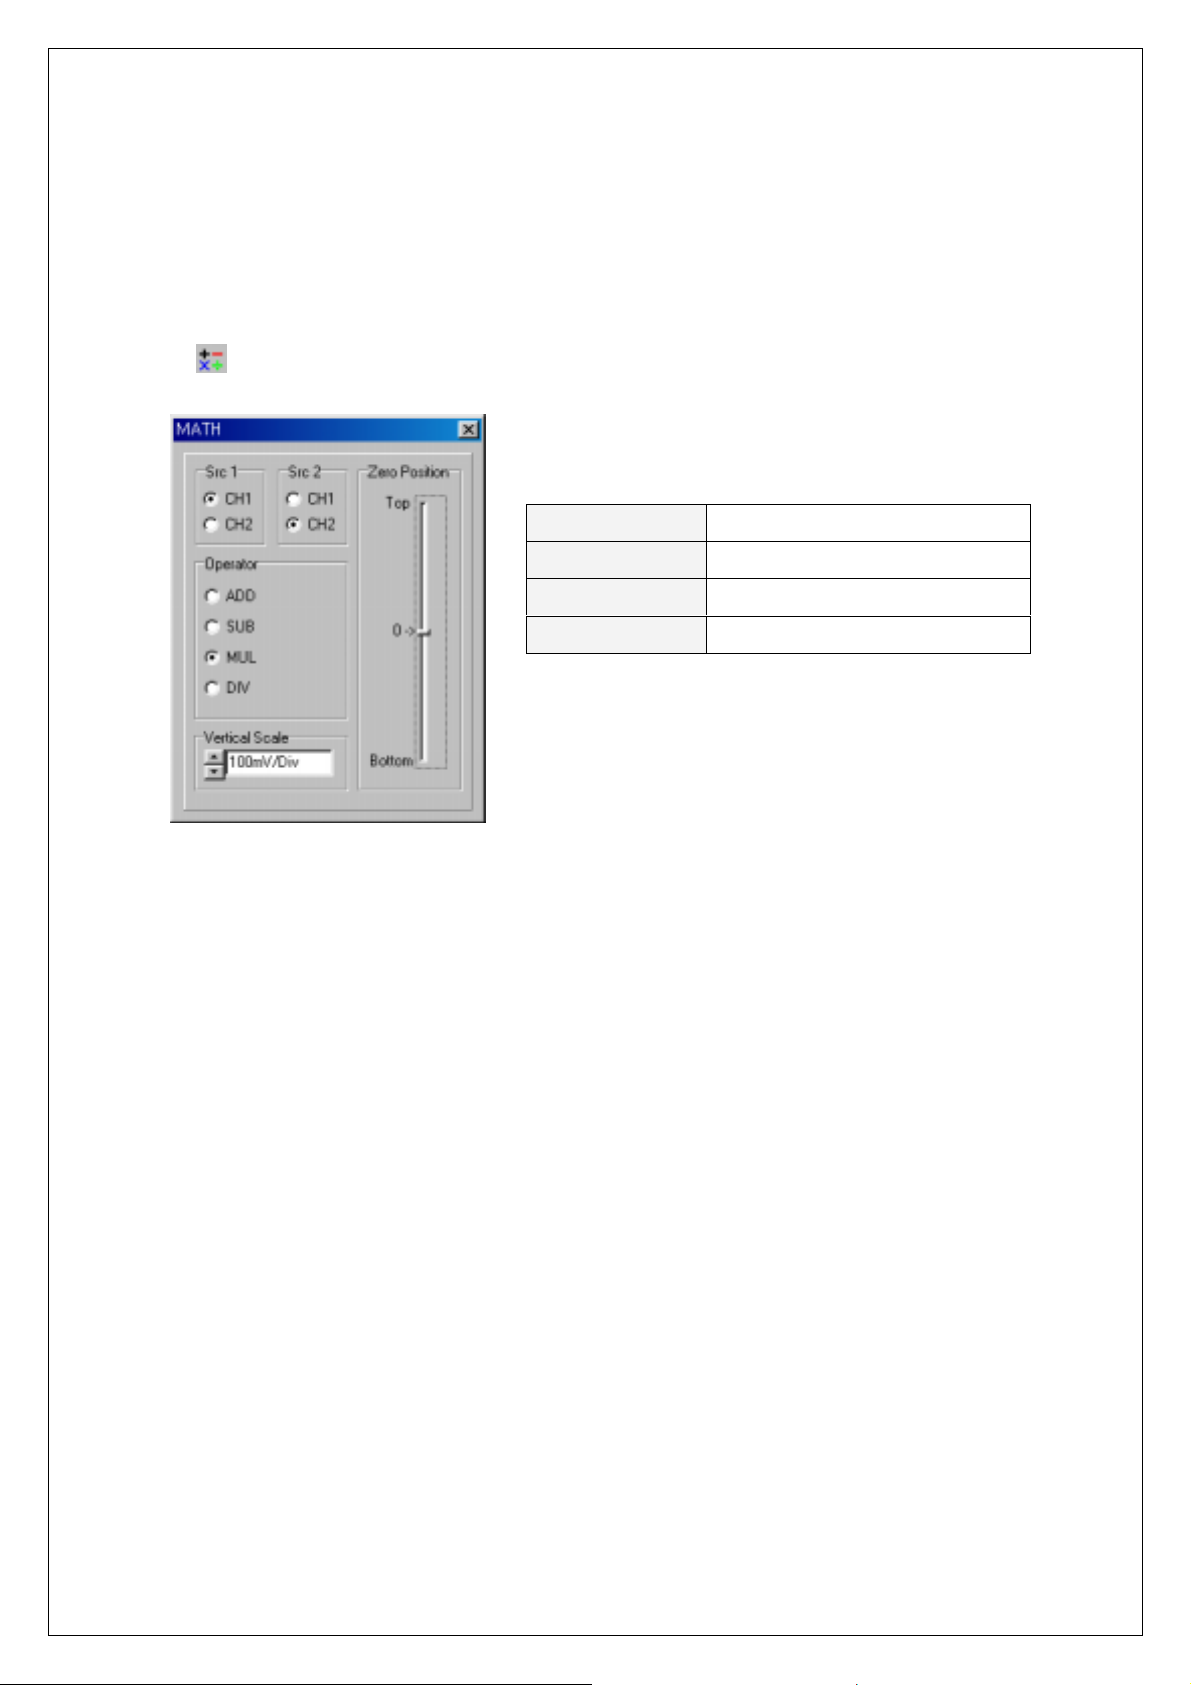
3. Math
Add/Subtract/Multiply/Divide the two waveforms.
1.
Push the Math icon.
Src1/Src2 Sets input source.
Operator Sets operation method
Vertical Scale Sets vertical scale
Zero Position Sets offset
2. Select source 1, source 2 and operator from the dialog box.
29
Page 38
Chapter 4. Toolbar, Menu & Dialog box
Ch 4. Toolbars, Menus, Dialog boxes &
Screen Information
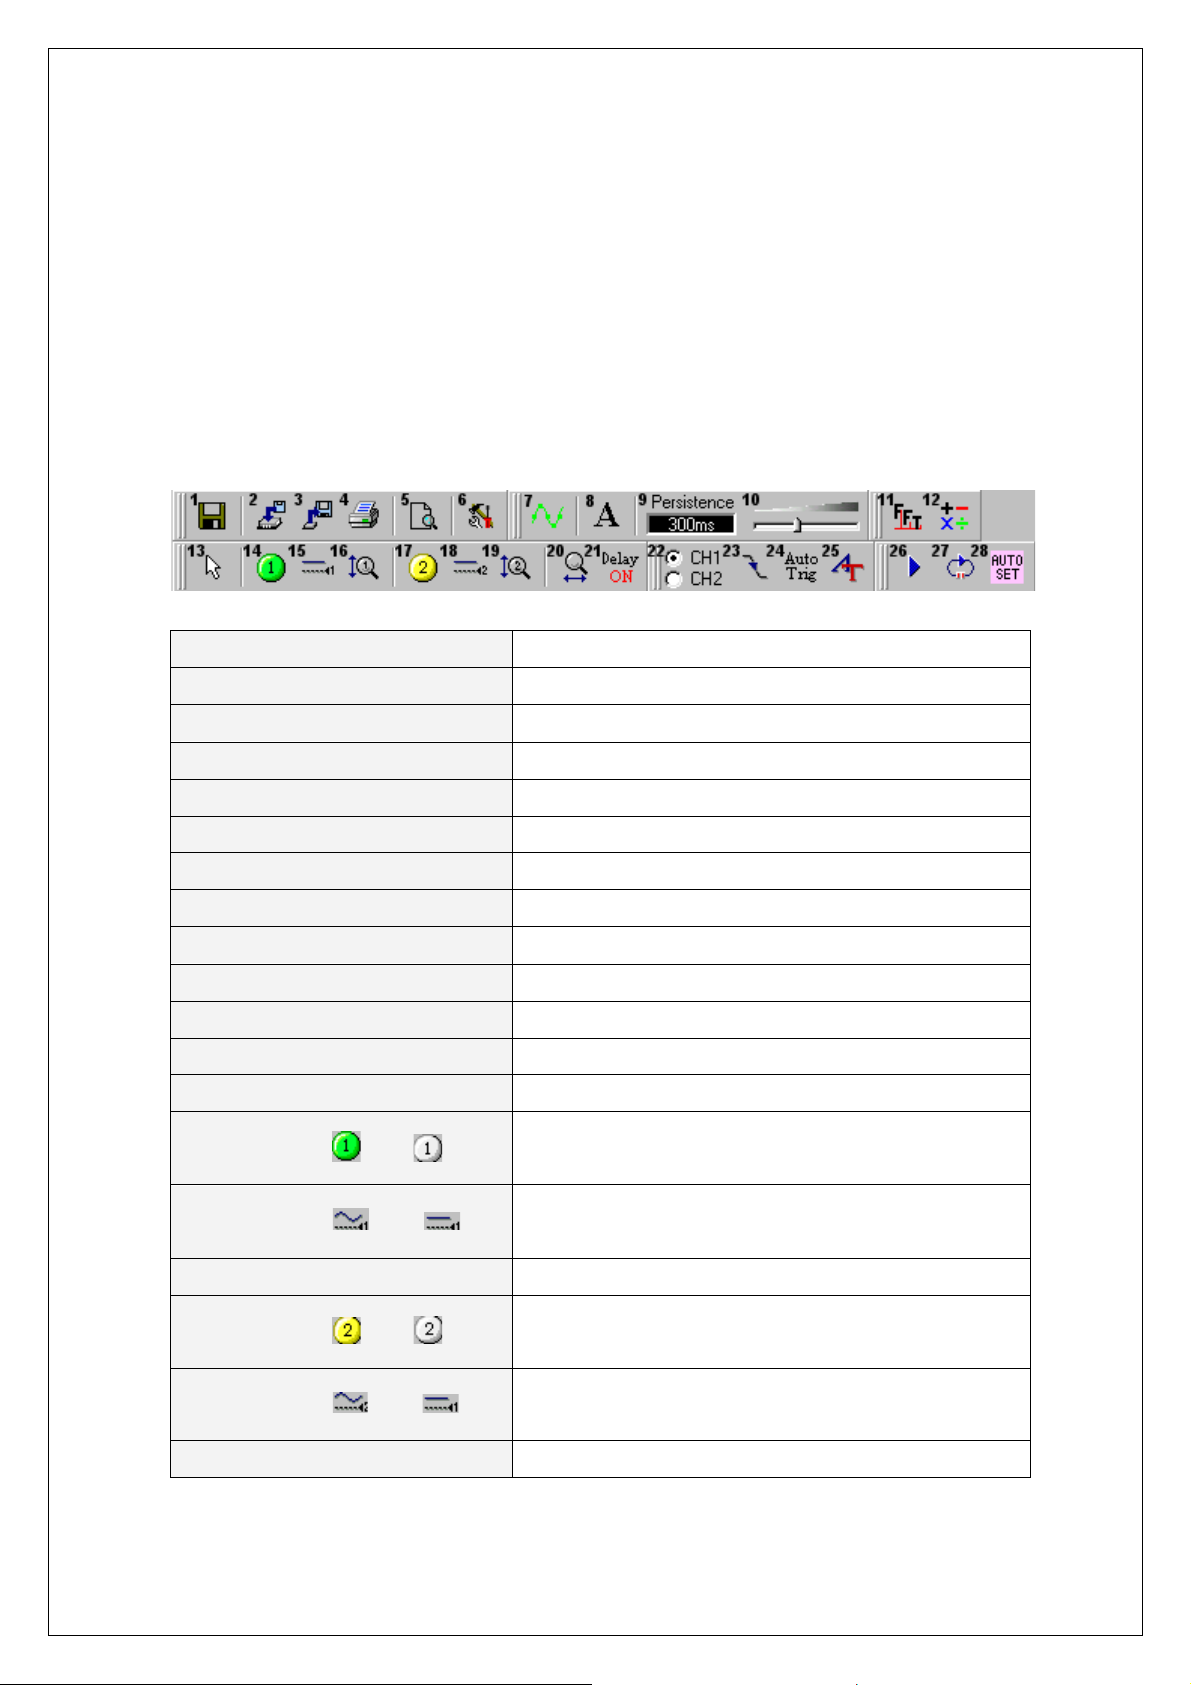
1. Toolbar
1. Save As
2. Load State
3. Save State
4. Print
5. Preview
6. Option
7. Line Join
8. Label
9. Persistence
10. Intensity
11. FFT
12. Math
13. Cursor
14. Channel 1 On
15. Channel 1 AC
/ Off
/ DC
-Saves current waveform as dat, bmp or jpg file
-Loads state file into current state
-Saves current state to file
-Prints current waveform
-Previews current waveform
-Shows option dialog box
-Joins the dots to lines
-Shows label on the screen
-Sets persistence time
-Sets intensity of the waveform
-Shows FFT dialog box
-Shows Math dialog box
-Shows measurement cursor
-Sets channel 1 on
-Sets channel 1 off
-Selects DC coupling
-Selects AC coupling
16. Channel 1 Voltage Scale
17. Channel 2 On
18. Channel 2 AC
19. Channel 2 Voltage Scale
/ Off
/ DC
-Changes vertical scale factor of Channel 1
-Sets channel 2 on
-Sets channel 2 off
-Selects DC coupling
-Selects AC coupling
-Changes vertical scale factor of Channel 2
30
Page 39
Chapter 4. Toolbar, Menu & Dialog box
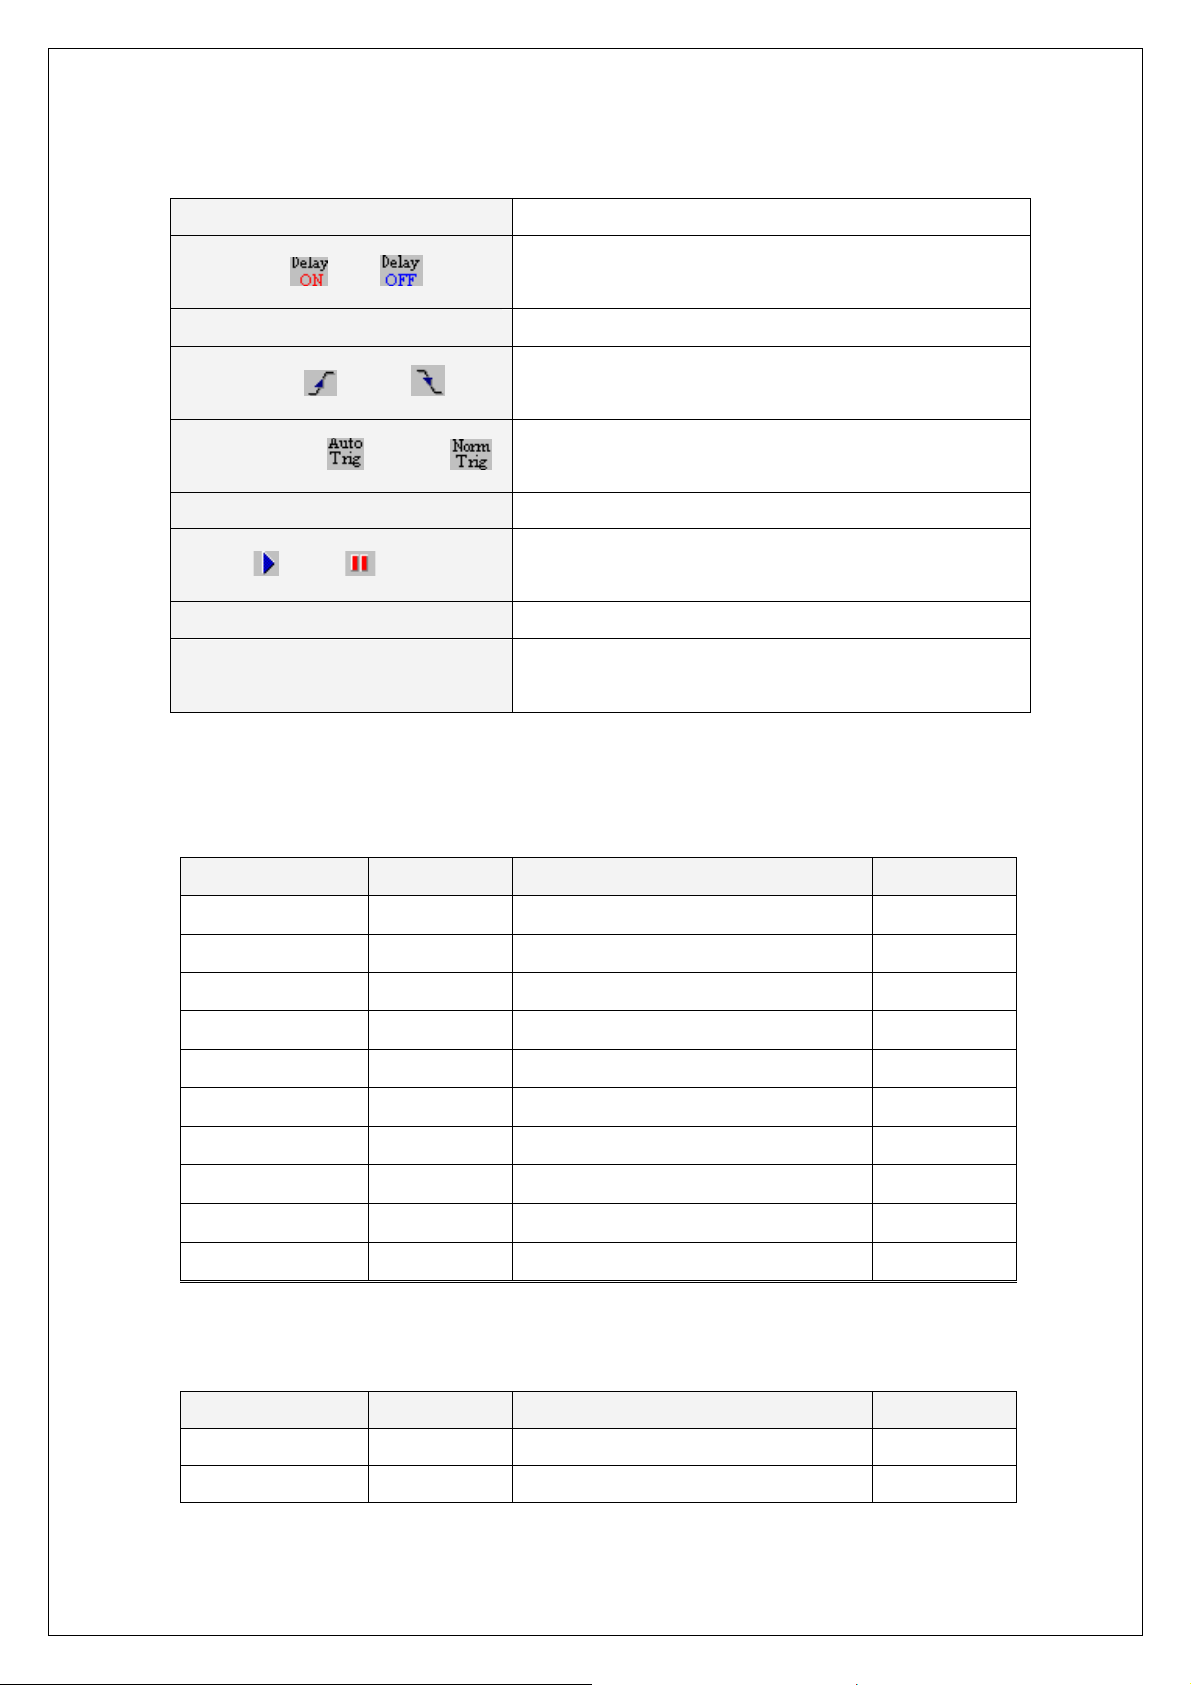
20. Time Scale
21.Delay On
22. Trigger Source
23. Trigger Up
24.
Trigger auto
25. Advanced Trigger
26. Run
27. Single Shot
28. Autoset
/ Stop
2. Menu
/ Off
/ Down
/ Normal
-Changes horizontal scale factor
-Sets trigger delay on
-Sets trigger delay off
-Sets trigger source to a specific channel
-Triggers on the rising edge of the signal
-Triggers on the falling edge of the signal
-Enables free running waveform acquisitions
-Triggers only on valid trigger events
-Shows advanced trigger dialog box
-Starts waveform acquisitions
-Stops waveform acquisitions
-Executes a single-shot acquisition
-Adjusts the vertica l, horizontal, and trigger controls for
a usable display automatically
File
Name Sub Menu Operation Hot-key
Load State
Save State
Save As
Save As Word
Save As Excel
Copy
Option Selects the waveform or screen option F6
Preview Previews the waveform F7
Print Prints the waveform Ctrl + P
Exit
Loads file to current file
Saves current state to file
Saves waveform as b
Saves waveform as word file
Saves waveform as excel file
Saves waveform to clipboard
Stops the SoftScope and return
mp, jpg, dat file
F2
F3
Ctrl +S
F4
F5
Ctrl + C
Ctrl + X
View
Name Sub Menu Operation Hot-key
File Toolbar Shows/Hides File Toolbar Ctrl + F1
Display Toolbar Shows/Hides Display Toolbar Ctrl + F2
31
Page 40
Chapter 4. Toolbar, Menu & Dialog box
FFT/Math Toolbar Shows/Hides FFT/Math Toolbar Ctrl + F3
Channel Toolbar Shows/Hides Channel Toolbar Ctrl + F4
Trigger Toolbar Shows/Hides Trigger Toolbar Ctrl + F5
Run/Stop Toolbar Shows/Hides Run/Stop Toolbar Ctrl + F6
Channel
Name Sub Menu Operation Hot-key
CH1 Setting On/Off
AC/DC
Volt Scale ‘+’
Volt Scale ‘-’
Select Volt/Div
Probe Attenuation
CH2 Setting On/Off
AC/DC
Volt Scale ‘+’
Volt Scale ‘-’
Select Volt/Div
Probe Attenuation
‘+’ Increases Time/Div Shift + Ins Time Scale
‘-‘ Decreases Time/Div Shift + Del
Select Time Changes Time Ctrl + T
Delay On/Off Changes Delay ON/OFF Ctrl + D
Changes ON/OFF
Changes AC/DC
Increases Voltage
Decreases Voltage
Changes Volt/Div
Changes Probe Attenuation
Changes ON/OFF
Changes AC/DC
Increases Voltage
Decreases Voltage
Changes Volt/Div
Changes Probe Attenuation
Shift + F1
Shift + F2
Shift + F3
Shift + F4
Shift + F5
Shift + F6
Shift + F7
Shift + F8
Shift + F9
Shift + F10
Shift + F11
Shift + F12
Cursor Changes Cursor ON/OFF Ctrl + U
Display
Name Sub Menu Operation Hot-key
Line Join Joins the waveform with line Ctrl + J
Label Inserts text to waveform Ctrl + L
Persistence Changes the persistence effect Ctrl + E
Intensity + Increases intensity of waveform Ctrl + Inc
Intensity - Decreases intensity of waveform Ctrl + Del
32
Page 41
Chapter 4. Toolbar, Menu & Dialog box
Math/FFT
Name Sub Menu Operation Hot-key
Math Calculates several signal Ctrl + M
FFT Changes signal to FFT Ctrl + F
Run/Stop
Name Sub Menu Operation Hot-key
Run/Stop Starts/Stops acquiring waveform Ctrl + R
Single Shot Begins Single Shot operation Ctrl + H
Auto Set Changes horizontal/vertical scale for waveform Ctrl + A
Trigger
Name Sub Menu Operation Hot-key
Trigger Source CH1 Selects CH1 from trigger source Shift+Ctrl+F1
Trigger Source CH2 Selects CH2 from trigger source Shift+Ctrl+F2
Trigger Up/Down Selects Up/Down from Trigger Up/Down Shift+Ctrl+F3
Normal/Auto Selects Normal/Auto from Trigger Normal/Auto Shift+Ctrl+F4
Advanced Trigger Selects Advanced trigger Shift+Ctrl+F5
Measure
Name Sub Menu Operation Hot-key
Volt Peak to Peak
Maximum
Minimum
Amplitude
Top
Measurement of Peak to Peak Voltage
Measurement of Maximum Voltage
Measurement of Minimum Voltage
Measurement of Amplitude Voltage
Measurement of Top Voltage
Ctrl+Alt + P
Ctrl+Alt + X
Ctrl+Alt + N
Ctrl+Alt + A
Ctrl+Alt + T
Base
Upper
Middle
Lower
Mean
Cycle Mean
RMS
Measurement of Base Voltage
Measurement of Upper Voltage
Measurement of Middle Voltage
Measurement of Lower Voltage
Measurement of Mean Voltage
Measurement of Cycle Mean Voltage
Measurement of RMS Voltage
33
Ctrl+Alt + B
Ctrl+Alt + U
Ctrl+Alt + M
Ctrl+Alt + L
Ctrl+Alt + E
Ctrl+Alt + C
Ctrl+Alt + R
Page 42
Chapter 4. Toolbar, Menu & Dialog box
Cycle RMS
Positive Overshoot
Negative Overshoot
Time Period
Frequency
Rise Time
Fall Time
Positive Duty Cycle
Negative Duty Cycle
Positive Pulse Width
Negative Pulse Width
Measurement of Cycle RMS Vo ltage
Measurement of Positive Overshoot Voltage
Measurement of Negative Overshoot Voltage
Measurement of Period
Measurement of Frequency
Measurement of Rise Time
Measurement of Fall Time
Measurement of Positive Duty Cycle
Measurement of Negative Duty Cycle
Measurement of Positive Pulse Width
Measurement of Negative Pulse Width
Ctrl+Alt + Y
Ctrl+Alt + S
Ctrl+Alt + G
Ctrl+Alt + I
Ctrl+Alt + F
Ctrl+Alt + R
Ctrl+Alt + Z
Ctrl+Alt + E
Ctrl+Alt + D
Ctrl+Alt + W
Ctrl+Alt + H
Util
Name Sub Name Operation Hot-key
Zero Calibration Begins offset calibration Shift+Ctrl+F6
Help
Name Sub Name Operation Hot-key
Help Shows help file F1
About Displays about Dialog Box F9
34
Page 43
Chapter 4. Toolbar, Menu & Dialog box
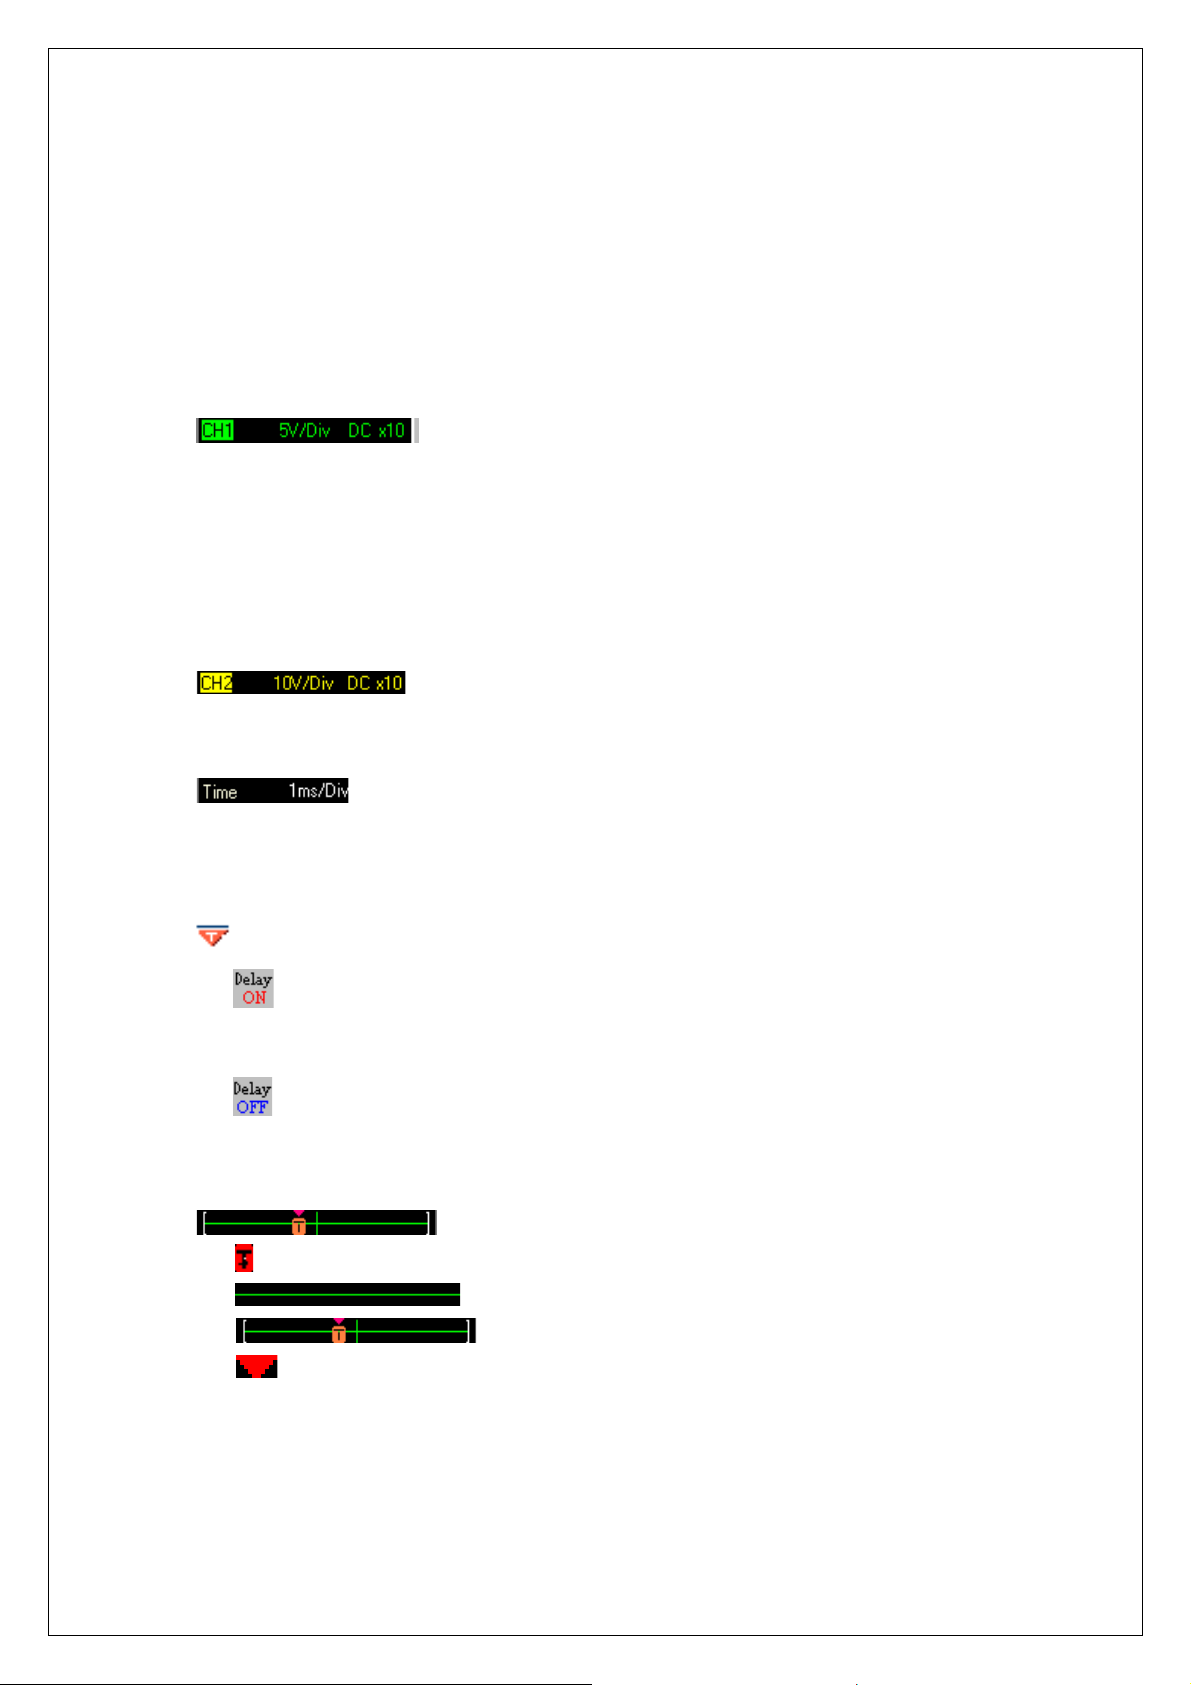
3. Screen Information
SoftScope has the following windows to show the internal states and settings.
1.
A. Click on this window, to change the voltage setting.
B. The following information is displayed.
a. Volt/Div
b. AC/DC coupling
c. 1:1/10:1 probe
2.
A. Same as channel 1
3.
A. Click on this window to change the time setting.
B. The current time/div setting is displayed.
4.
: Trigger point information window
A.
W hen SDS 200 is in a de lay-on state it shows the curr ent trigger poin t using time
: Time information window
: Channel 1 Information window
: Channel 2 Information window
5.
dimension.
B.
A.
B.
C.
D.
W hen SDS 200 is in a delay-off state it shows the current trigger point using %
scale.
: Trigger point display window
The trigger point shows the trigger position in the acquired waveform.
This line shows the whole acquired waveform.
You can see the data currently showing using [ ] mark.
This mark shows the reference point when horizontal scale(time/div) is changed.
35
Page 44
Chapter 4. Toolbar, Menu & Dialog box
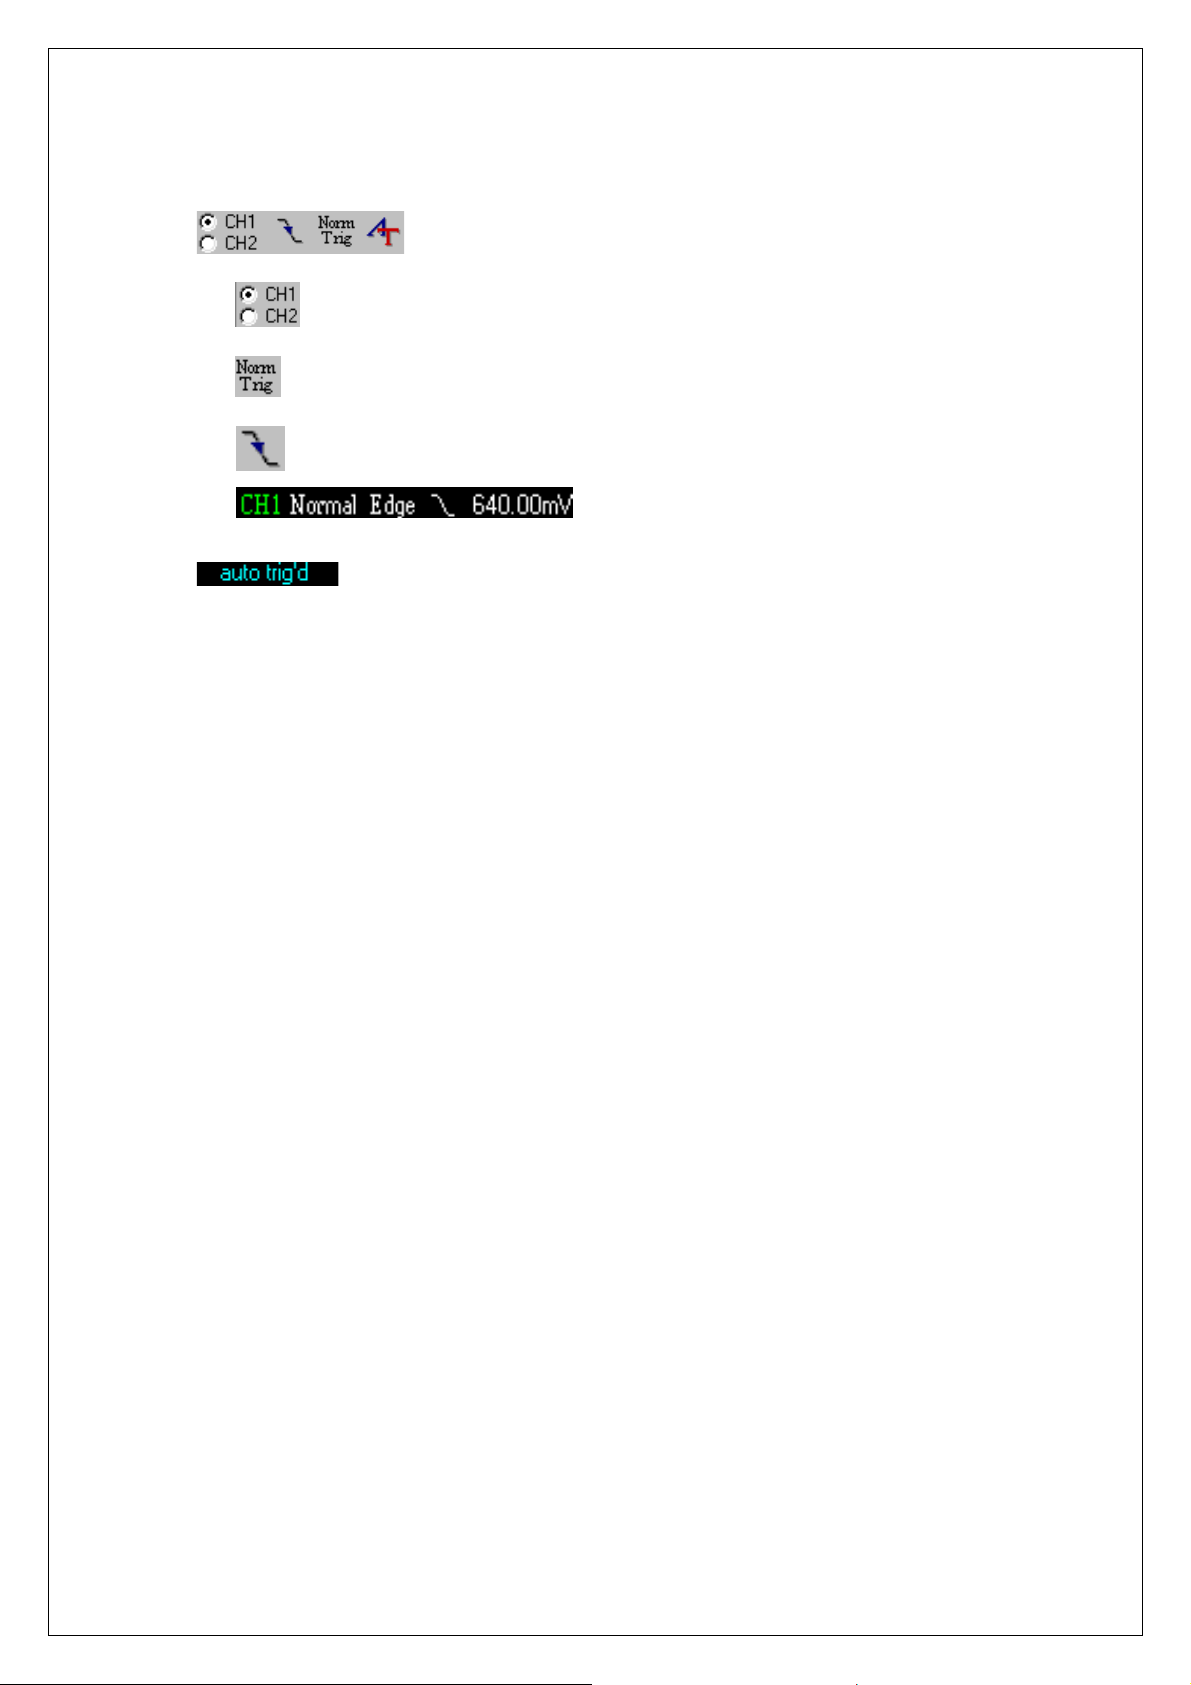
6.
A.
B.
C.
D.
7.
A. 'Auto trig'd' - Trigger signal is automatically generated because of no valid triggered
signal.
B. Waiting – SDS 200 is waiting for the incoming trigger.
C. Trig'd – Acquired waveform is triggered.
D. RIS waiting – SDS is waiting for the incoming trigger in the RIS mode.
Trigger source selection radio button
Trigger mode (Auto/Normal)
Trigger condition (Up edge/Down edge)
: Trigger state of current acquired waveform
: Trigger state selection tool bar
Triger state display window.
36
Page 45
Chapter 4. Toolbar, Menu & Dialog box
4. Option Dialog Box
Title On -Check to include title on file/print output
Title -Use to set the title on file/print output
Format -Sets color or Black or white type
Include -Check to include informations
Grid View -Sets the graticule type
Channel Color Level -Sets color level of waveform
-Check to display waveform in color
37
Page 46
Chapter 5. Appendix
Ch 5. Appendix
1. Three Operational Modes of SDS 200
Realtime mode
In realtime mode SDS 200 acquires 10,000 sample data from the input source.
It can show the real data sim ultaneously. But because of the sampling spee d limit of A/D
converter, it is limited only to 10us/div time/div.
RIS(Random Interleaved Sampling) mode
In RIS mode SDS ac quires wavef orm as well as TDC value, an d rearrange th e waveforms
using the TDC value to form one waveform.
For example, with firs t acq uisit ion sam pled data f orm s wavef orm A. W ith second ac quisitio n
sampled forms waveform B. Over and over again waveforms are interpolated to give a
complete waveform. SDS 200 has a 200ps time resolution in RIS mode.
Roll mode
To handle low frequency signa ls, SD S 200 has a r ol l m ode. In rol l m ode acquir ed wavef orm
is displayed and m oved from the right side of the scr een to the left. As a resu lt, it appears
that the waveform is moving constantly.
SDS 200 operates each mode in the following time scale base:
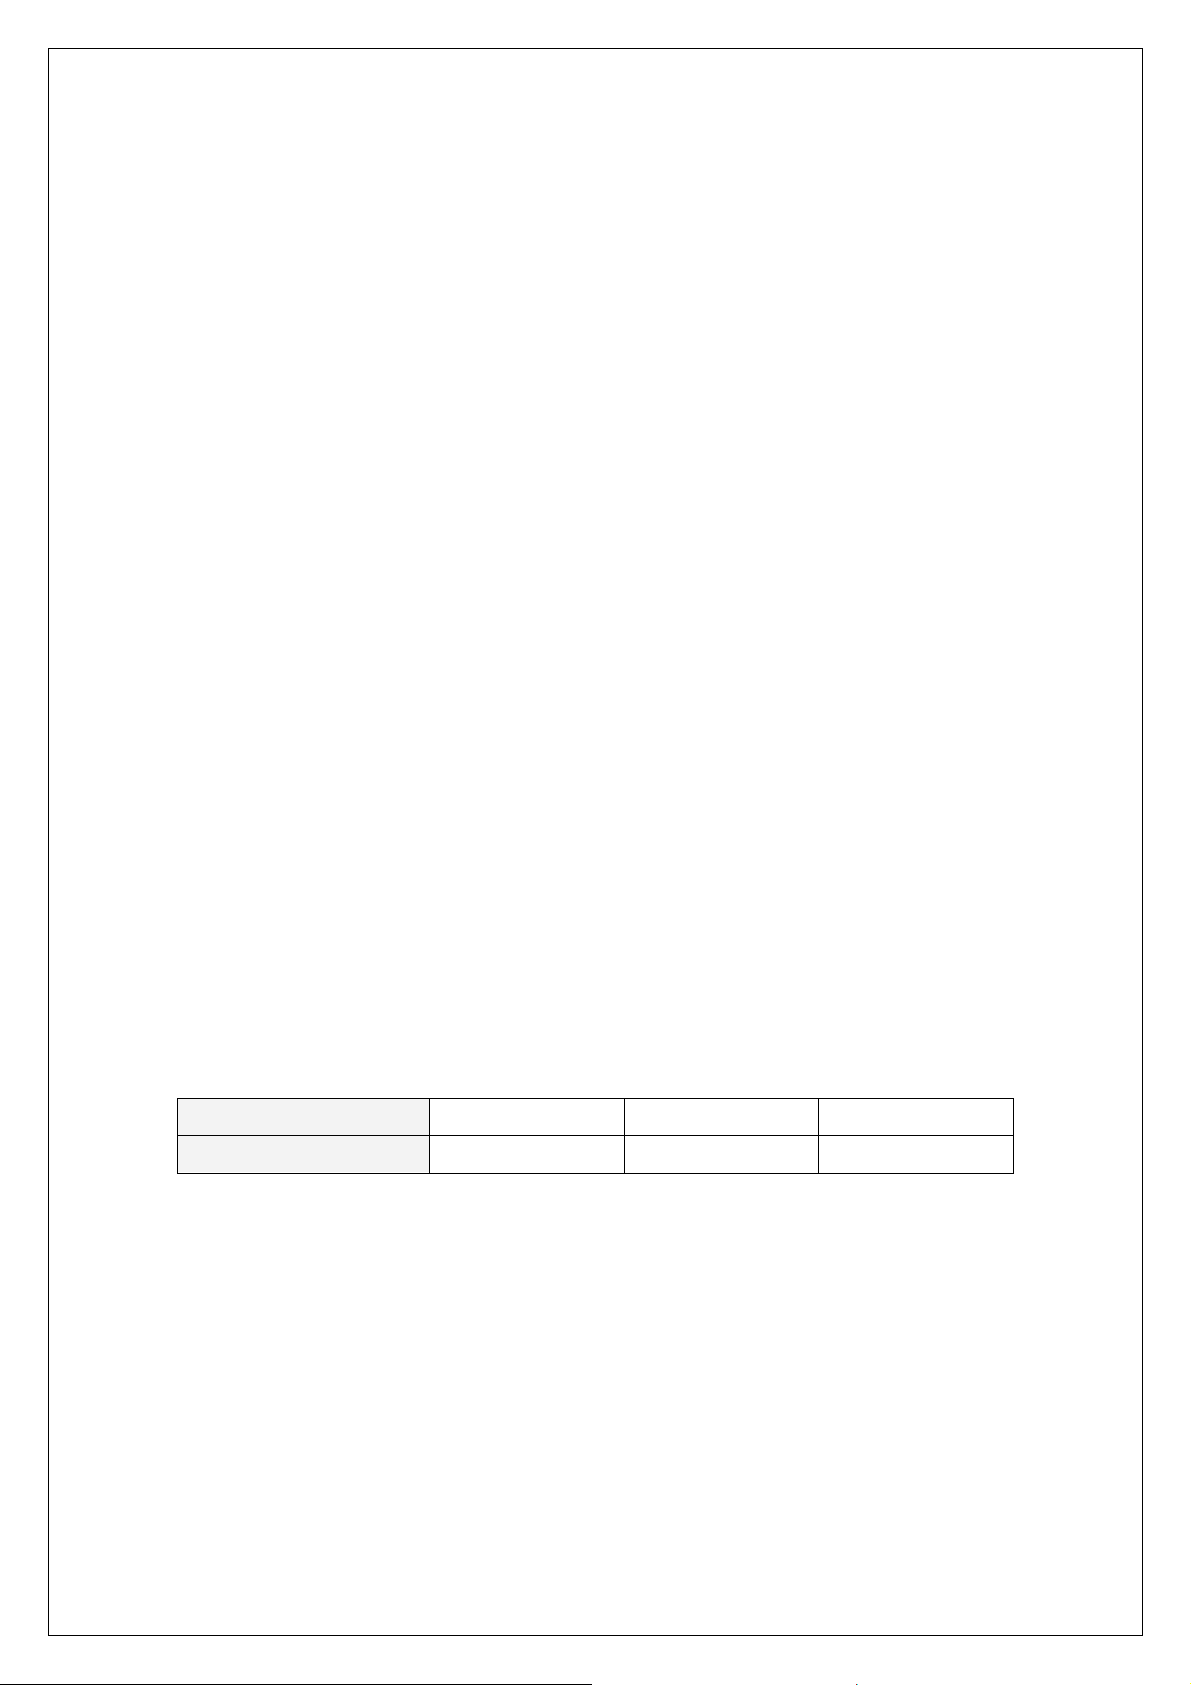
Time/Div 2ns~4us 10us~400ms 1s~10s
Sampling Mode RIS mode Realtime Mode Roll Mode
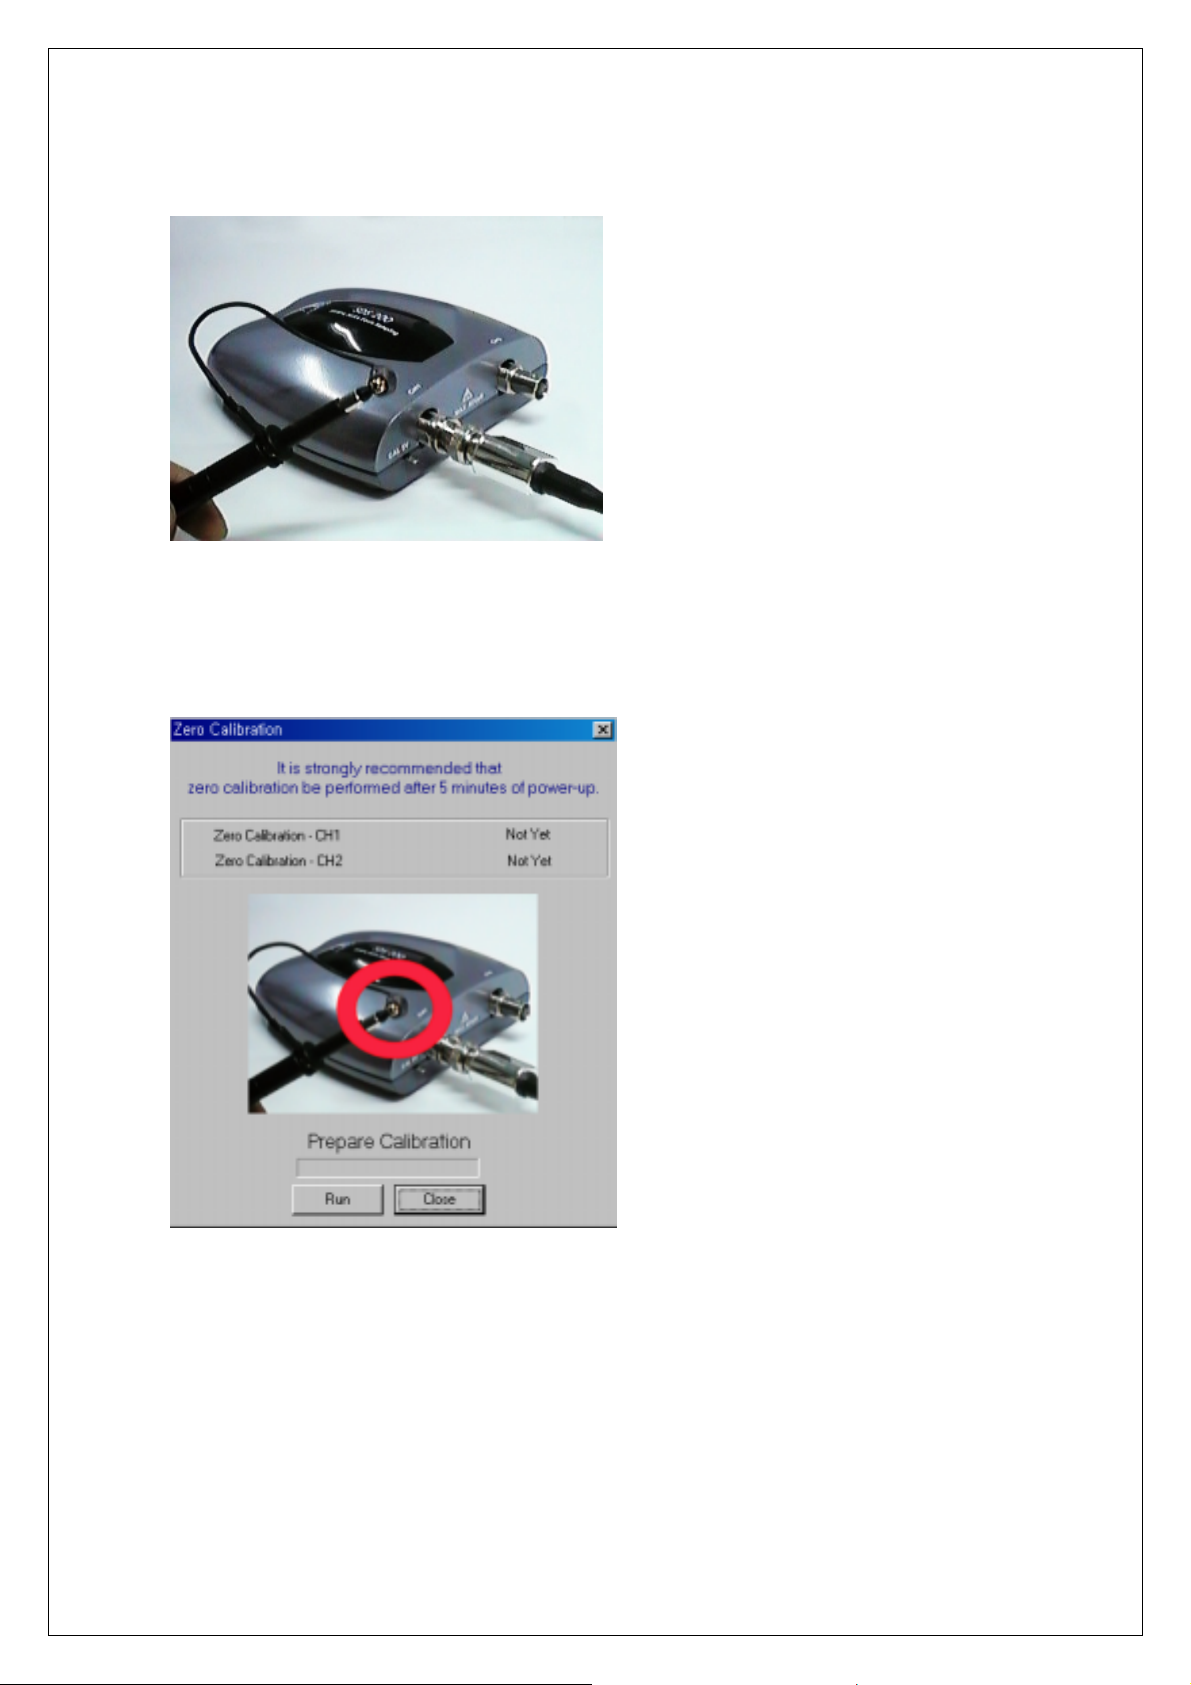
2. Software Calibration
It is necessary for you to calibrate regularly to make the measurements as accurate as possible
1. Short input signal as shown below.
38
Page 47
Chapter 5. Appendix
2. Select Zero Calibration from menu.
3. Zero calibration dialog box appears.
4. Calibration is done automatically.
39
Page 48
Chapter 5. Appendix
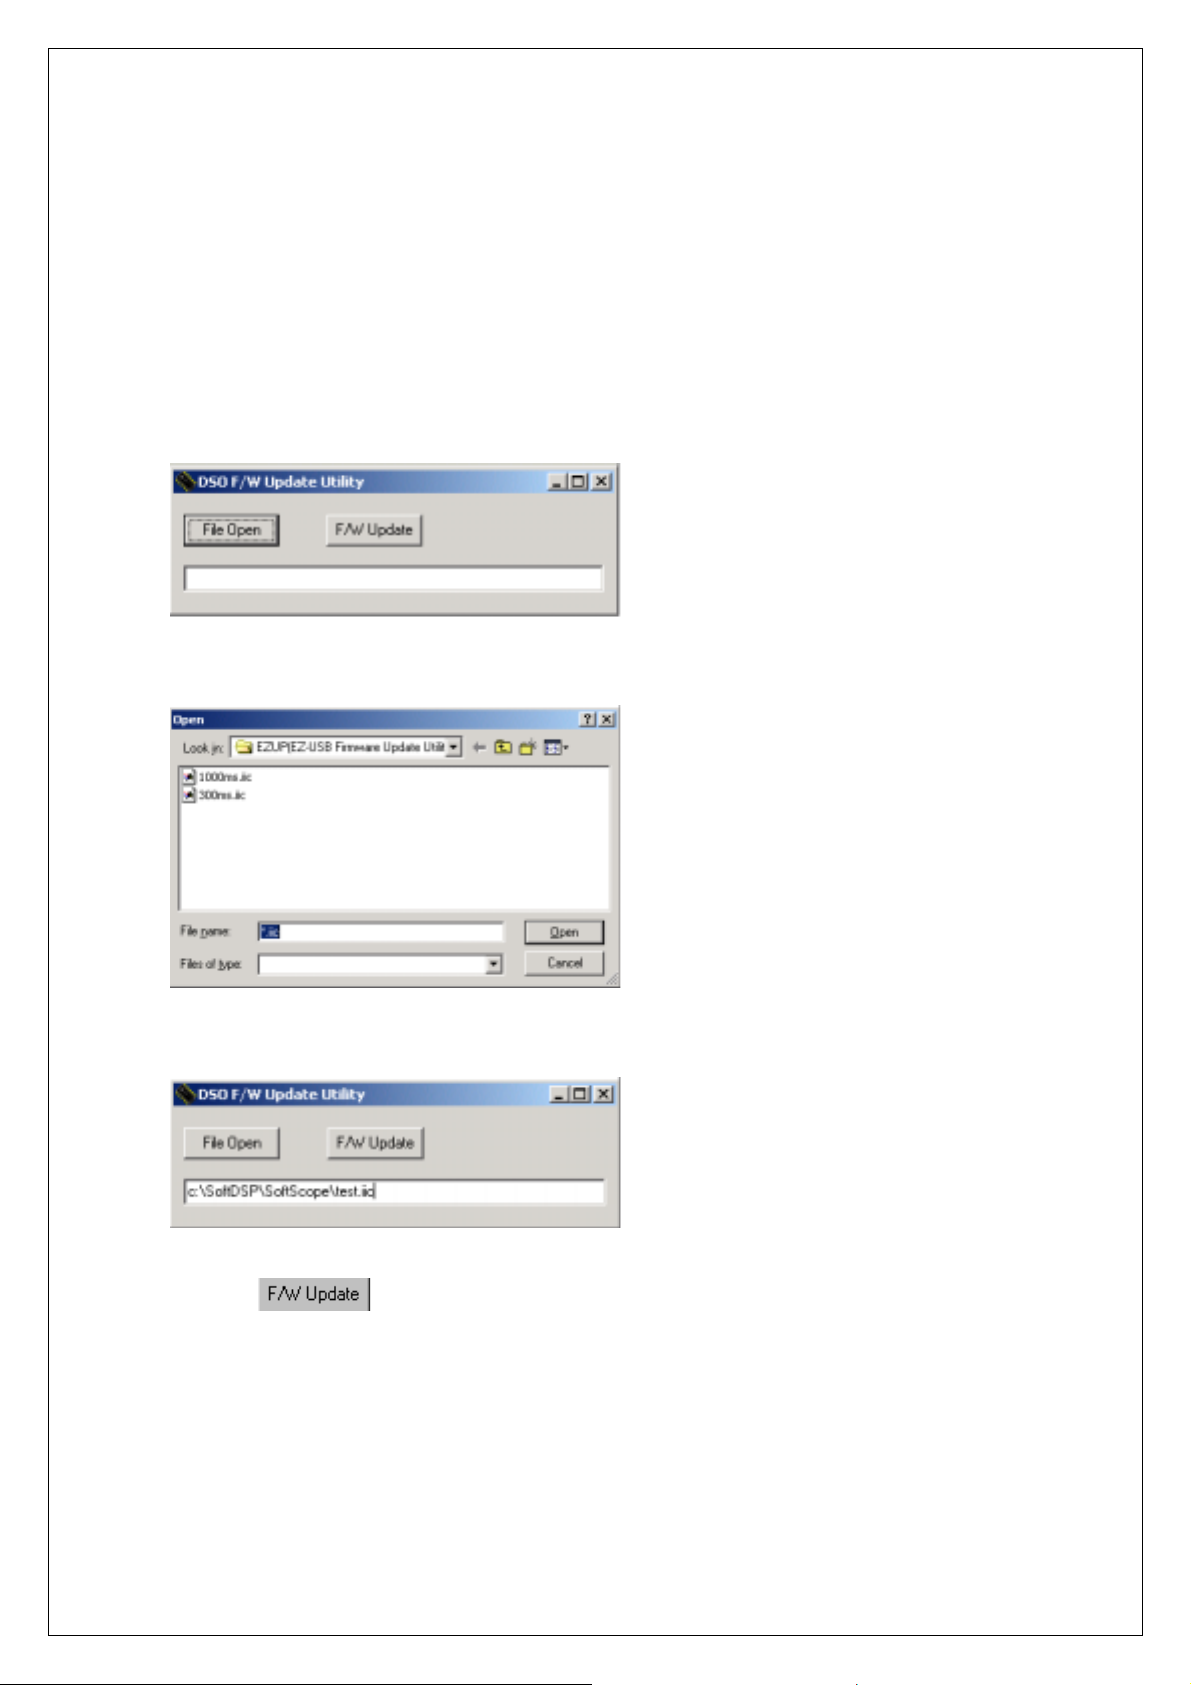
3. Firmware Update
You can download new firmware from softDSP website(www.softdsp.com).
1. Connect SDS 200 to PC.
2. Download a new firmware. (.iic file format)
3. Run ezup.exe software.
4. Select File Open.
5. From Dialog Box choose the firmware(.iic) file.
6. Select
7. Firmware is updated automatically.
, F/W update.
40
 Loading...