

Smith & Larson Audio Wofer Tester 2 User Manual
Woofer Tester 2
User Guide

Smith & Larson Audio
PO Box 229
Savage, MD 20763
USA
Phone +1 781.259.1804 • Email: tech@woofertester.com

Table of Contents
GENERAL
1. INSTALLATION & SETUP ............................................................................................ 5
1.1. GETTING TO KNOW YOUR WOOFER TESTER 2 ........................................................................5
1.2. INSTALLING THE SOFTWARE ..............................................................................................5
1.3. SETTING UP THE HARDWARE .............................................................................................7
1.4. CONNECTING THE WOOFER TESTER...................................................................................10
2. NAVIGATION............................................................................................................ 11
2.1. MENU BAR ..................................................................................................................12
2.2. TESTS, SIGNAL CONTROL AND REAL-TIME METER WINDOW ....................................................12
2.3. WT CONTROL WINDOW .................................................................................................14
2.4. SETUP CONTROL WINDOW..............................................................................................17
2.5. OVERLAY WINDOW .......................................................................................................21
2.6. T/S ENTRY WINDOW ....................................................................................................22
2.7. X-Y PLOT WINDOW ......................................................................................................23
2.8. VIEW MENU OPTIONS....................................................................................................24
2.9. WOO FILES & SCREEN CONFIGURATION ............................................................................29
2.10. VIEWING, FORMATTING & CONVERTING RESULTS .................................................................30
2.11. OPTIONS MENU............................................................................................................32
2.12. TOOLS MENU...............................................................................................................36
2.13. PRINTING FILES/GRAPHS................................................................................................38
2.14. EXPORTING RESULTS .....................................................................................................39
2.15. HELP MENU.................................................................................................................39
3. CALIBRATION .......................................................................................................... 40
3.1. CALIBRATION, COMPONENT & LINEAR TESTING....................................................................40
3.2. LOW POWER PORT CALIBRATION......................................................................................40
3.3. CAPACITOR MEASUREMENT .............................................................................................45
4. THIELE-SMALL DRIVER MEASUREMENT.................................................................. 46
4.1. REVEALING THE THIELE-SMALL MODEL USING ELECTRICAL TESTS .............................................46
4.2. FINDING MASS AND SPRING CONSTANTS THAT SET FREE AIR RESONANCE FS ..............................46
4.3. DRIVER Q...................................................................................................................47
4.4. DRIVER FREQUENCY DEPENDENT INDUCTANCE (LE IS NOT SIMPLE INDUCTANCE)...........................48
4.5. NON LINEAR SUSPENSION AND MOTOR CHARACTERISTICS ......................................................48
4.6. THE THIELE SMALL TESTS (WHAT IS MEASURED).................................................................49
4.7. Q AND FS TEST (LAUNCH FROM 'Q,FS TEST' BUTTON)...........................................................49
4.8. VAS TEST (LAUNCH FROM 'VAS TEST' BUTTON)....................................................................51
Woofer Tester 2 User Guide v1.1 © Smith & Larson Audio 3

4.9. BOX TEST (LAUNCH FROM BOX TEST BUTTON).....................................................................52
4.10. MAKING A SUITABLE TEST BENCH.....................................................................................52
4.11. DRIVER BREAK-IN.........................................................................................................53
4.12. ARBITRARY IMPEDANCE PLOTS (ARB1 AND ARB2 BUTTON)...................................................54
5. DRIVER SIMULATION AND BOX DESIGN................................................................. 55
5.1. SIMULATION AND PHYSICAL BOX DESIGN............................................................................55
5.2. FIRST PASS SIMULATION ................................................................................................56
6. IN-BOX ELECTRICAL TESTING ................................................................................. 57
6.1. BOX ELECTRICAL TEST...................................................................................................57
6.2. AUTO-ALIGN VBOX (ALIGN SIMULATED AND IN-BOX IMPEDANCE) .............................................57
6.3. SIMULATED VERSUS MEASURED IN-AIR RESPONSE ................................................................58
7. ADVANCED THIELE SMALL TESTING: AC COMPRESSION ........................................ 59
7.1. AC COMPRESSION TESTING.............................................................................................59
8. TEST TOOLS AND CALCULATORS ............................................................................. 61
8.1. ALIGNING THE TESTER FOR MEASURING CAPACITORS ............................................................61
8.2. ZOBEL CALCULATOR ......................................................................................................63
9. DEMONSTRATION FILES .......................................................................................... 64
9.1. CONDUCTING A SIMPLE ELECTRICAL TEST...........................................................................64
9.2. THIELE-SMALL SIMULATOR & BOX DESIGN DEMONSTRATION ...................................................65
10. DIGITAL SIGNAL PROCESSING TERMINOLOGY AND CONCEPTS ........................ 68
10.1. NYQUIST SAMPLING THEOREM .........................................................................................68
10.2. RECONSTRUCTION FILTERS .............................................................................................68
10.3. UP-SAMPLING FILTERS...................................................................................................68
4 © Smith & Larson Audio Woofer Tester 2 User Guide v1.1
INSTALLATION & SETUP
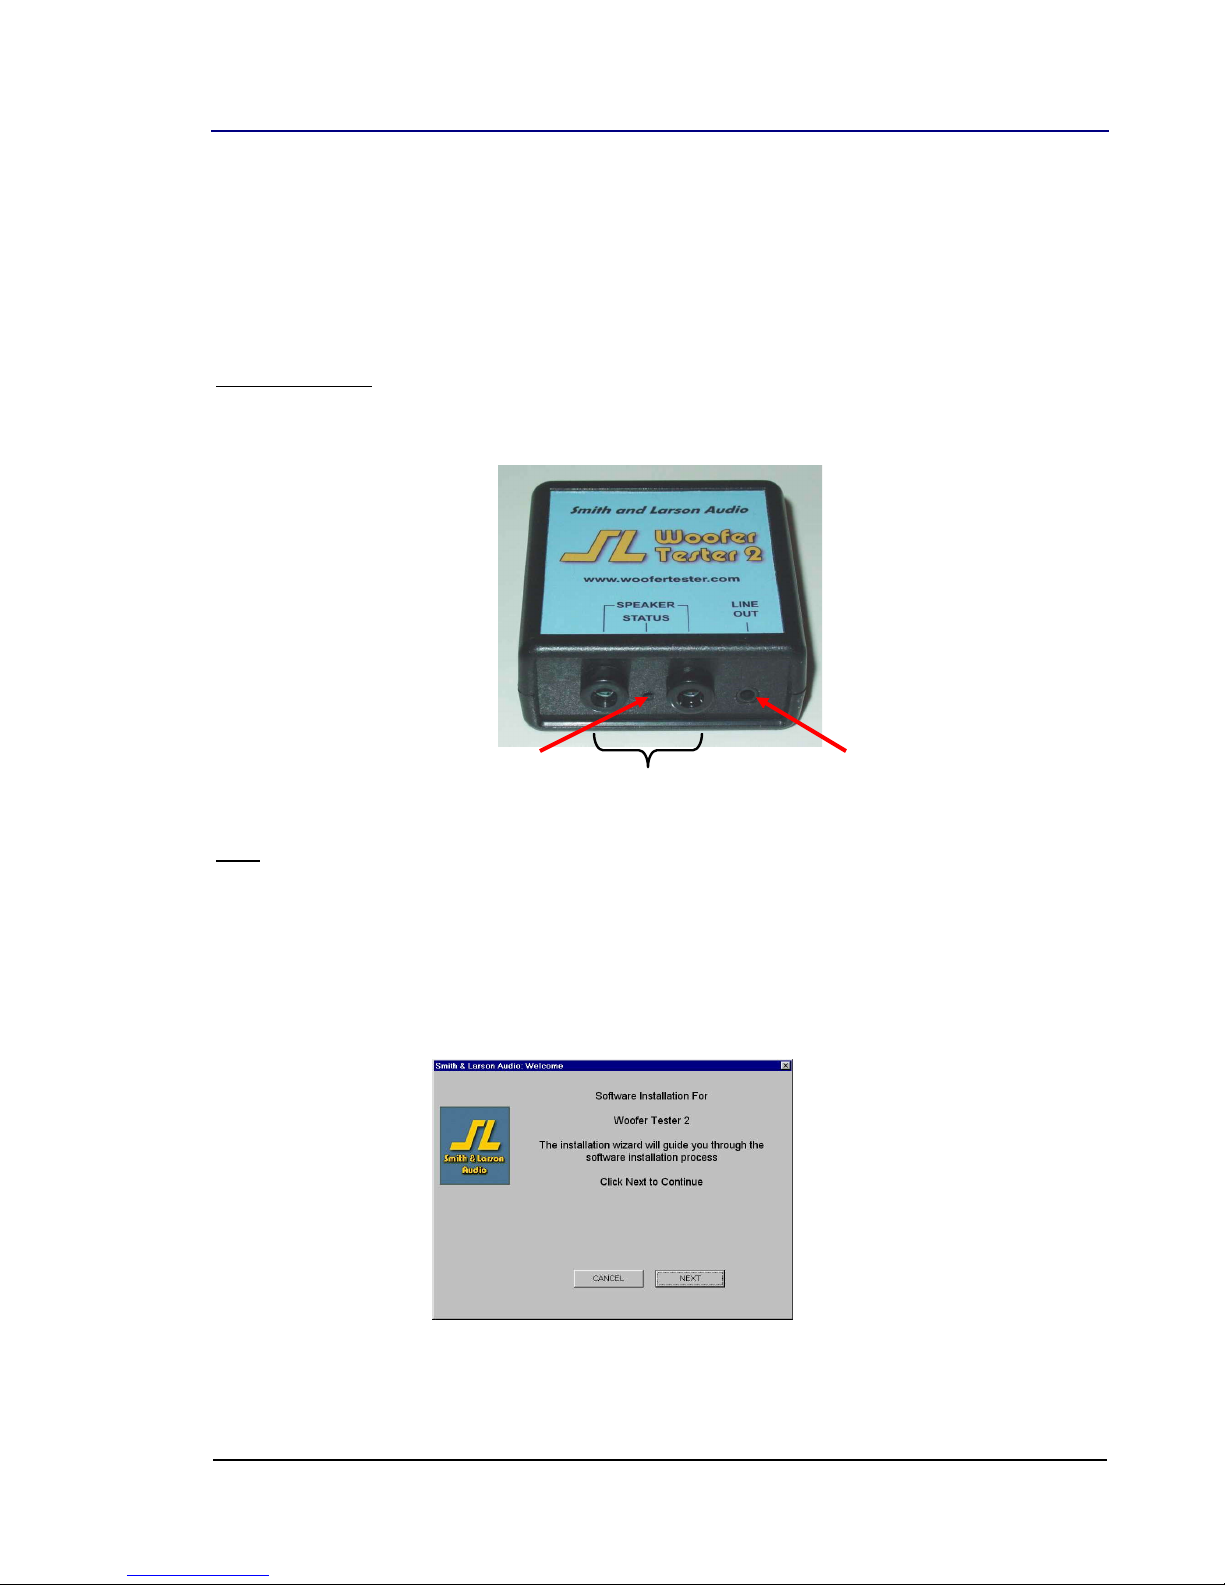
3mm MiniPlug
line-out port
Power LED window
Speaker Test Load
1. INSTALLATION & SETUP
1.1. Getting to know your Woofer Tester 2
Woofer Tester 2 Front
The front of the test measurement box contains the speaker test load connections, a power indicator LED and a mini-jack
(headphone) connector for supplying a break in test tone to an external amplifier. The backside contains the USB port.
Note: The WT2 uses about 50 mA @5V from the USB port. Most USB ports will supply this directly.
1.2. Installing the Software
SWINSTALL
1. Insert the CD-ROM into your computer. If the installation process does not start automatically, run setup.exe from
the CD-ROM. This will start the software install wizard:
Woofer Tester 2 User Guide v1.1 © Smith & Larson Audio 5
INSTALLATION & SETUP
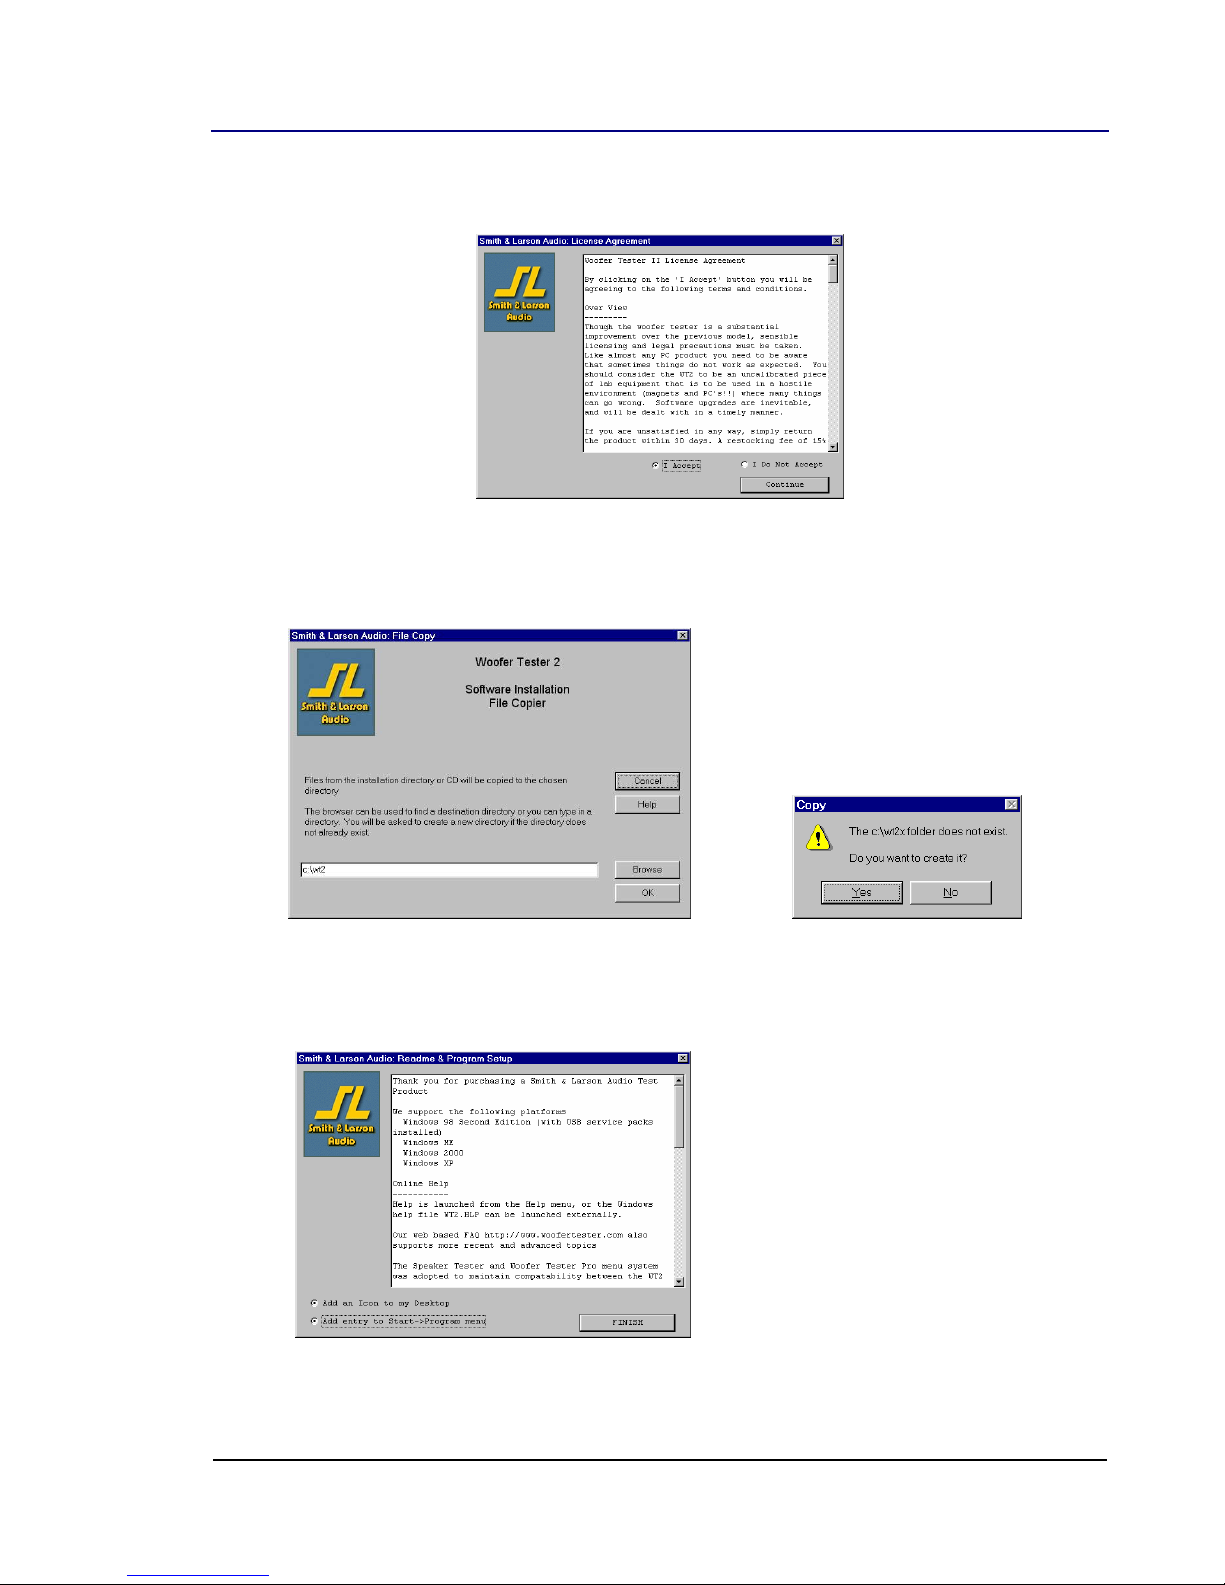
2. Click Next. The next dialog box shows the license agreement. Please read it and select “I agree” if you concur
and then click Continue to proceed with the installation.
3. Next, select an existing directory using Browse or create a new one by typing a name in the text box. The default
action is to create a WT2 directory on your C: Drive. You can choose a different or new directory. Click OK to
continue.
4. The last step in the software installation shows you the latest readme.txt file and asks if you want to add a
desktop icon and an entry in the Windows
software installation is now complete.
Start
Program
. Select the appropriate options and click Finish. The
6 © Smith & Larson Audio Woofer Tester 2 User Guide v1.1
INSTALLATION & SETUP
1.3. Setting up the Hardware
HWSETUP
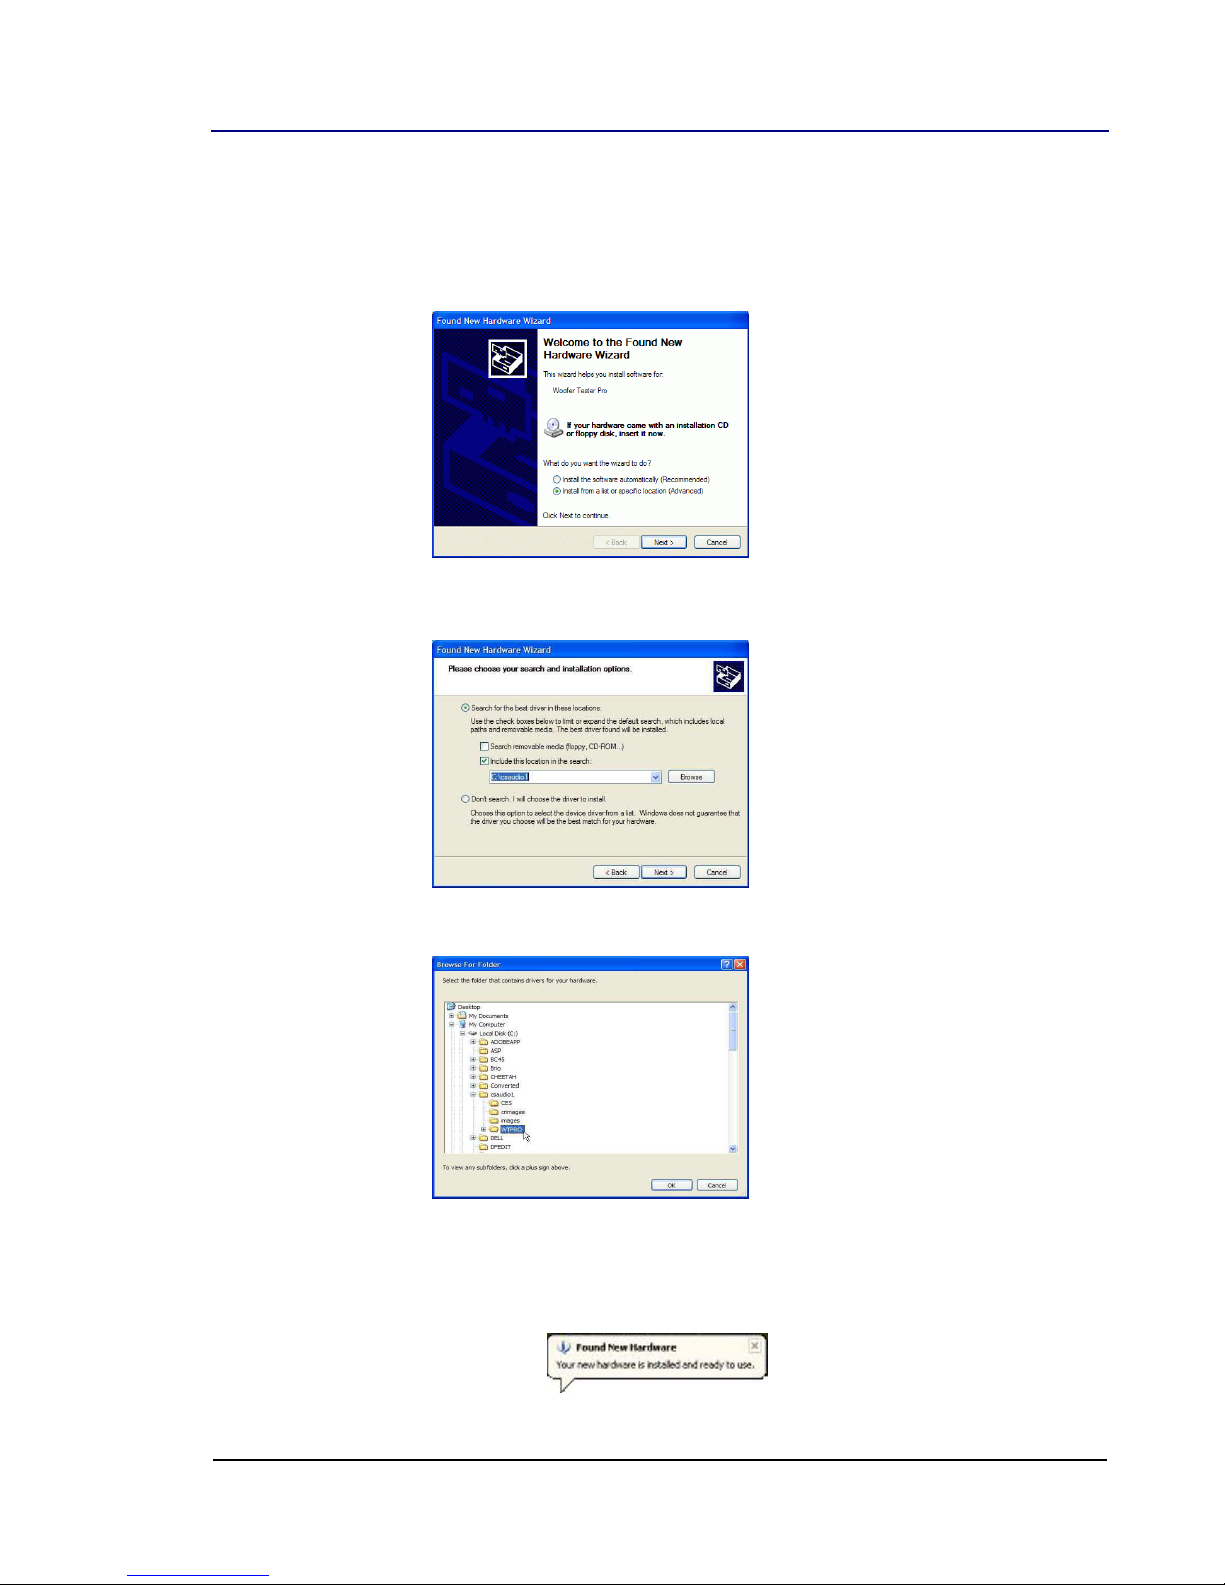
1. To setup the hardware, connect the USB cable between the WT2 and computer’s USB port. Windows will indicate
new hardware has been detected and the following dialog box pops open:
2. Select the “Install from a list of specific location (Advanced)” option and click Next
The following dialog box appears:
3. Click the Browse button. In the file dialog box that opens, select the WT2 directory that you created earlier
and click OK.
4. Click Next. When file copying is complete, click Finish to complete the installation.
5. Plug in the WT2. In Win XP You will see a system tray message that your new hardware is installed and the
hardware setup is now complete.
Woofer Tester 2 User Guide v1.1 © Smith & Larson Audio 7
INSTALLATION & SETUP
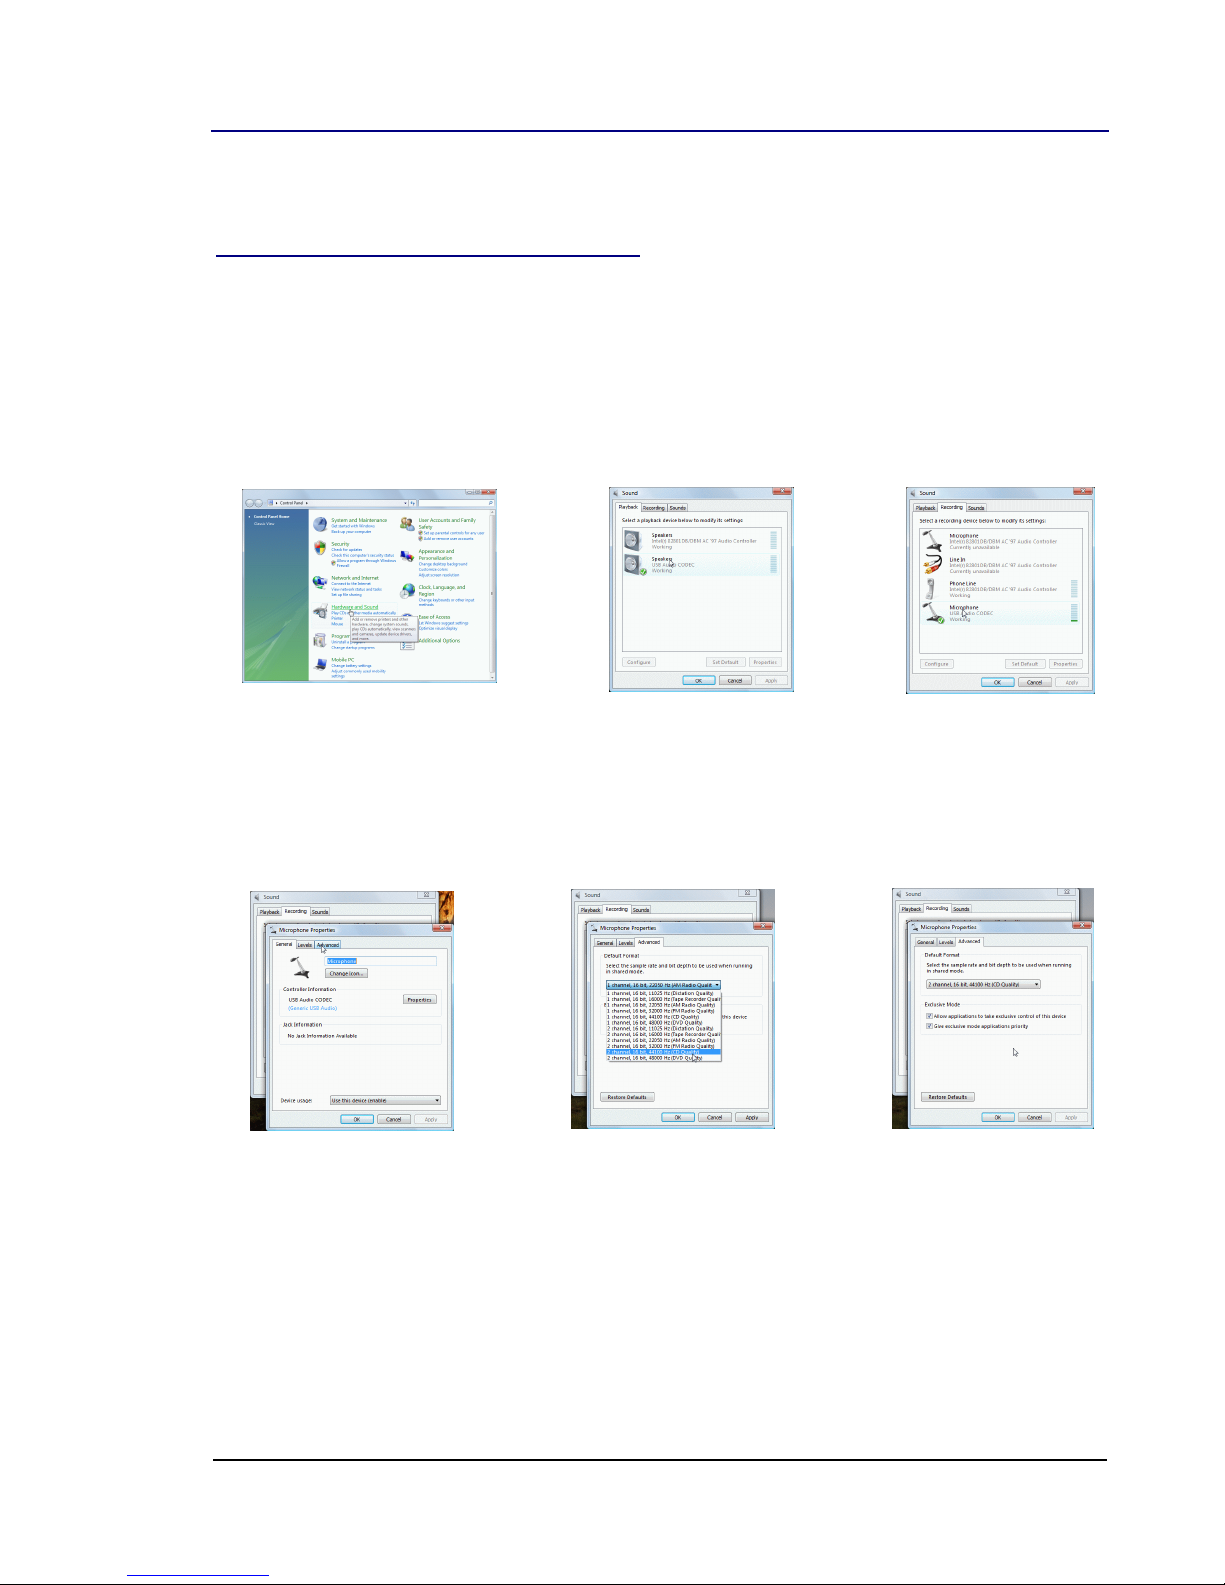
Additional Steps for Windows Vista Users
When Windows Vista installs the ‘USB Audio Device’ driver, the initial default will be set for 1 channel 22 kHz. This must be
changed for the Tester to operate properly. The changes made here may revert back if the operating system is updated, or
a new audio device is installed.
1. From the Start menu, open the Control Panel and select ‘Hardware and Sound’. The Woofer Tester will be
identified as using an ‘USB Audio Codec’.
2. Click on the ‘Recording’ tab and look for the Microphone that uses the ‘USB Audio Codec’.
3. Click on the microphone properties, and then select the ‘Levels’ tab.
4. Next, click on the ‘Advanced’ tab and change the settings to 2 channels, 44100 Hz sampling rate. Check the two
‘Exclusive Mode’ check boxes giving the tester application control of the device. Click OK.
8 © Smith & Larson Audio Woofer Tester 2 User Guide v1.1
INSTALLATION & SETUP
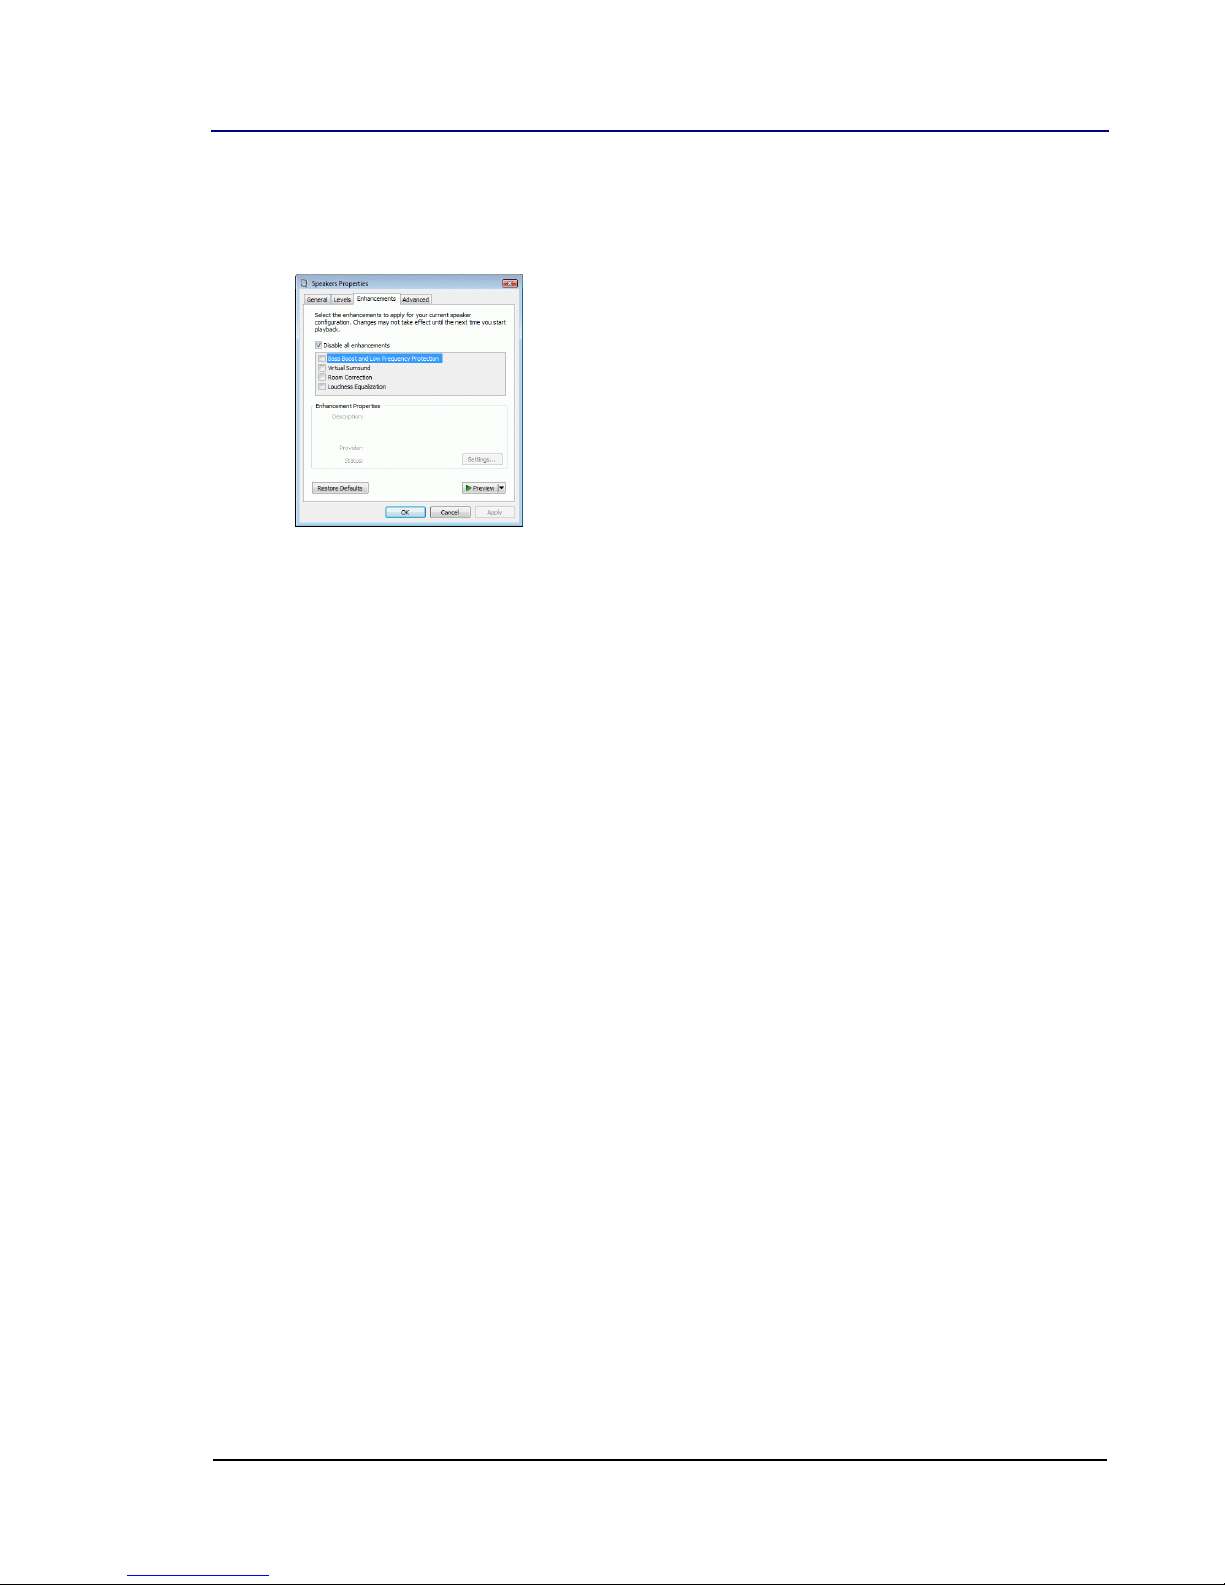
5. Repeat Step 4 for the ‘Playback’ tab (2 channel 44100 Hz sampling).
6. Go to the ‘Enhancements’ Tab and make sure that the ‘Disable all enhancements’ checkbox is selected.
7. Make sure that the Playback, Record and Woofer Tester sampling rates all match. 44100 Hz is the recommended
sampling rate for Vista and is the default setting on the Woofer Tester. Sampling rates are changed in the
pull-down menu or from the ‘Comp & Size’ tab in the Setup Control window.
Options
Software Installation Notes
The software can be installed by directly copying files from the CD, or by using the SETUP.EXE installation program. There
are no Windows registry entries made and the only drivers required should already be available.
Windows Generic USB Driver Installation Notes
When the tester is plugged into your system you may find that the drivers are already installed and there is nothing to do. If
not, Windows will identify that a 'USB Audio Codec' has been installed and the new hardware wizard will start. Following the
wizard's instructions will configure the Windows default driver for USB Audio Devices. This may require you to install drivers
from the Windows installation CD.
Windows always assumes that any newly installed device will become the new default device. This will redirect your PC's
default sound output to the tester. You will want to disable this by going into the Windows control panel and changing the
default sound device.
Woofer Tester 2 User Guide v1.1 © Smith & Larson Audio 9

INSTALLATION & SETUP
! WARNING !
DO NOT CONNECT ANYTHING EXCEPT FOR A DRIVER TO THE LOW POWER TEST PORT
1.4. Connecting the Woofer Tester
Basic Thiele Small testing and parameter extraction does not require more than a few milli-amps of current, which is easily
powered by the USB port.
Connecting a Driver
The provided test leads with a banana jack at one end and alligator clips at the other will be used to connect drivers to the
Woofer Tester. Calibration resistors (and shorts) are also used during the calibration routine. These will be connected
directly to the Woofer Tester, or to the end of the test lead depending on the parameter being measured.
Connecting lineout to an amplifier for breaking in a driver
Before testing a driver, it is often desirable to break the driver in for an hour or two. Basically, 'fresh' driver parameters are
not the same as when the driver has been exercised for some time. This is accomplished, and with far less voice coil
heating, by using a test tone frequency equal to the driver’s free air resonance Fs. The 1/8” mini-jack line level output can
be connected to an amplifier to provide this signal. Frequency is controlled from the control window.
Note: Since the Woofer Tester must share PC resources, dropouts may occur if the operating system becomes overloaded.
Using only software to control signal levels is therefore not advised. A pre-amplifier or an integrated amplifier with a volume
control allows you to set the software level to maximum and then cut back the level manually.
10 © Smith & Larson Audio Woofer Tester 2 User Guide v1.1
NAVIGATION
2. NAVIGATION
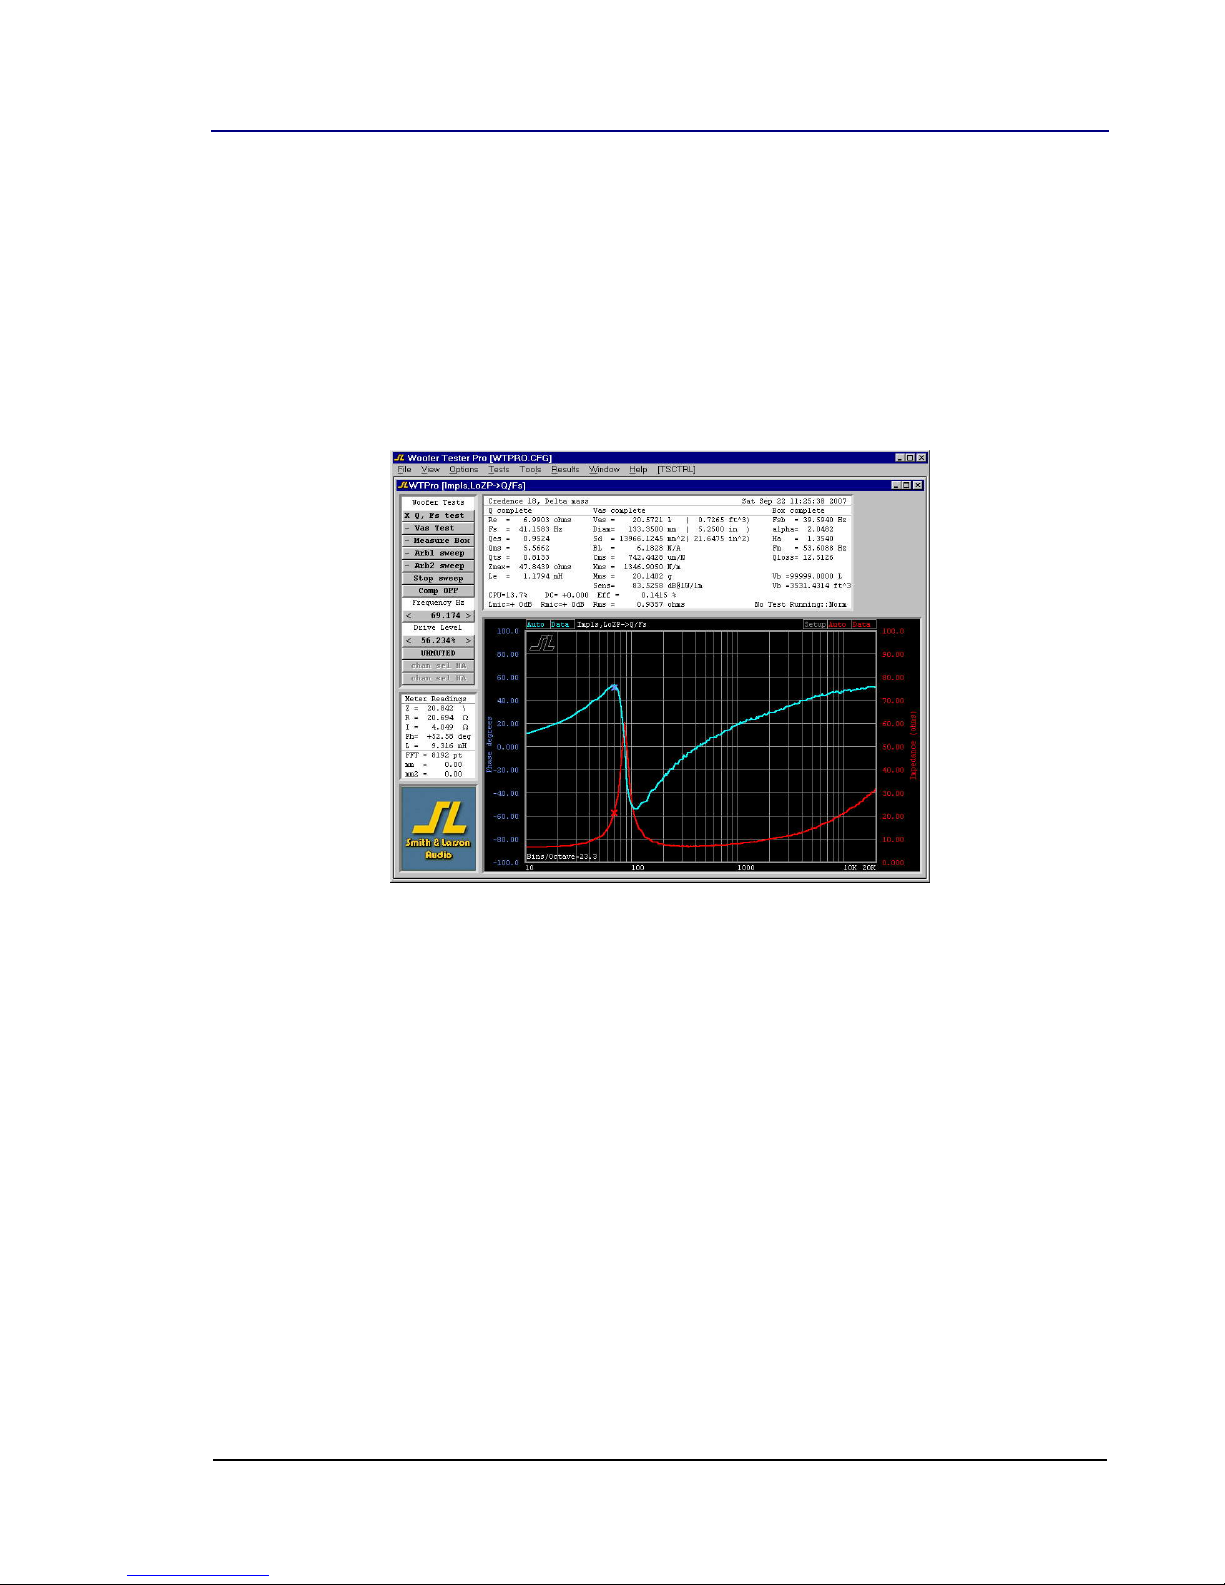
This section of the user guide gives an overview of the software features, explains how to view, print and export results and
configure system settings. Now that you have connected up your WT2 and started the software, you will see the main
window shown below. The program consists of an outer Frame window that then contains multiple child windows.
Figure 2-I - Main Window
Woofer Tester 2 User Guide v1.1 © Smith & Larson Audio 11
NAVIGATION
Menu
Functions
File
Open and create WOO Files (described in the next section), export results to various file formats
and capture graphics
View
Open test windows, set graphing options and customize screen
Options
Configure sweep parameters, measurement frequency, drive level, signal mode, sample rate,
buffer size, set microphone gains, button modes and select operational modes
Tests
Calibrate and conduct measurements
Tools
Set atmospheric conditions for tests, calculate effective size of non-circular speaker, design an air
core inductor
Results
Export test results to the editor, format output, convert electrical results into effective box
parameters, design a tank circuit
Window
Arrange windows on screen
Help
Help on using the Woofer Tester
Test and Data
Selection
Test Frequency and
Signal Level
Real-Time Meter
2.1. Menu Bar
On the top of the screen is the menu bar with eight pull-down menus from which you can perform the following functions:
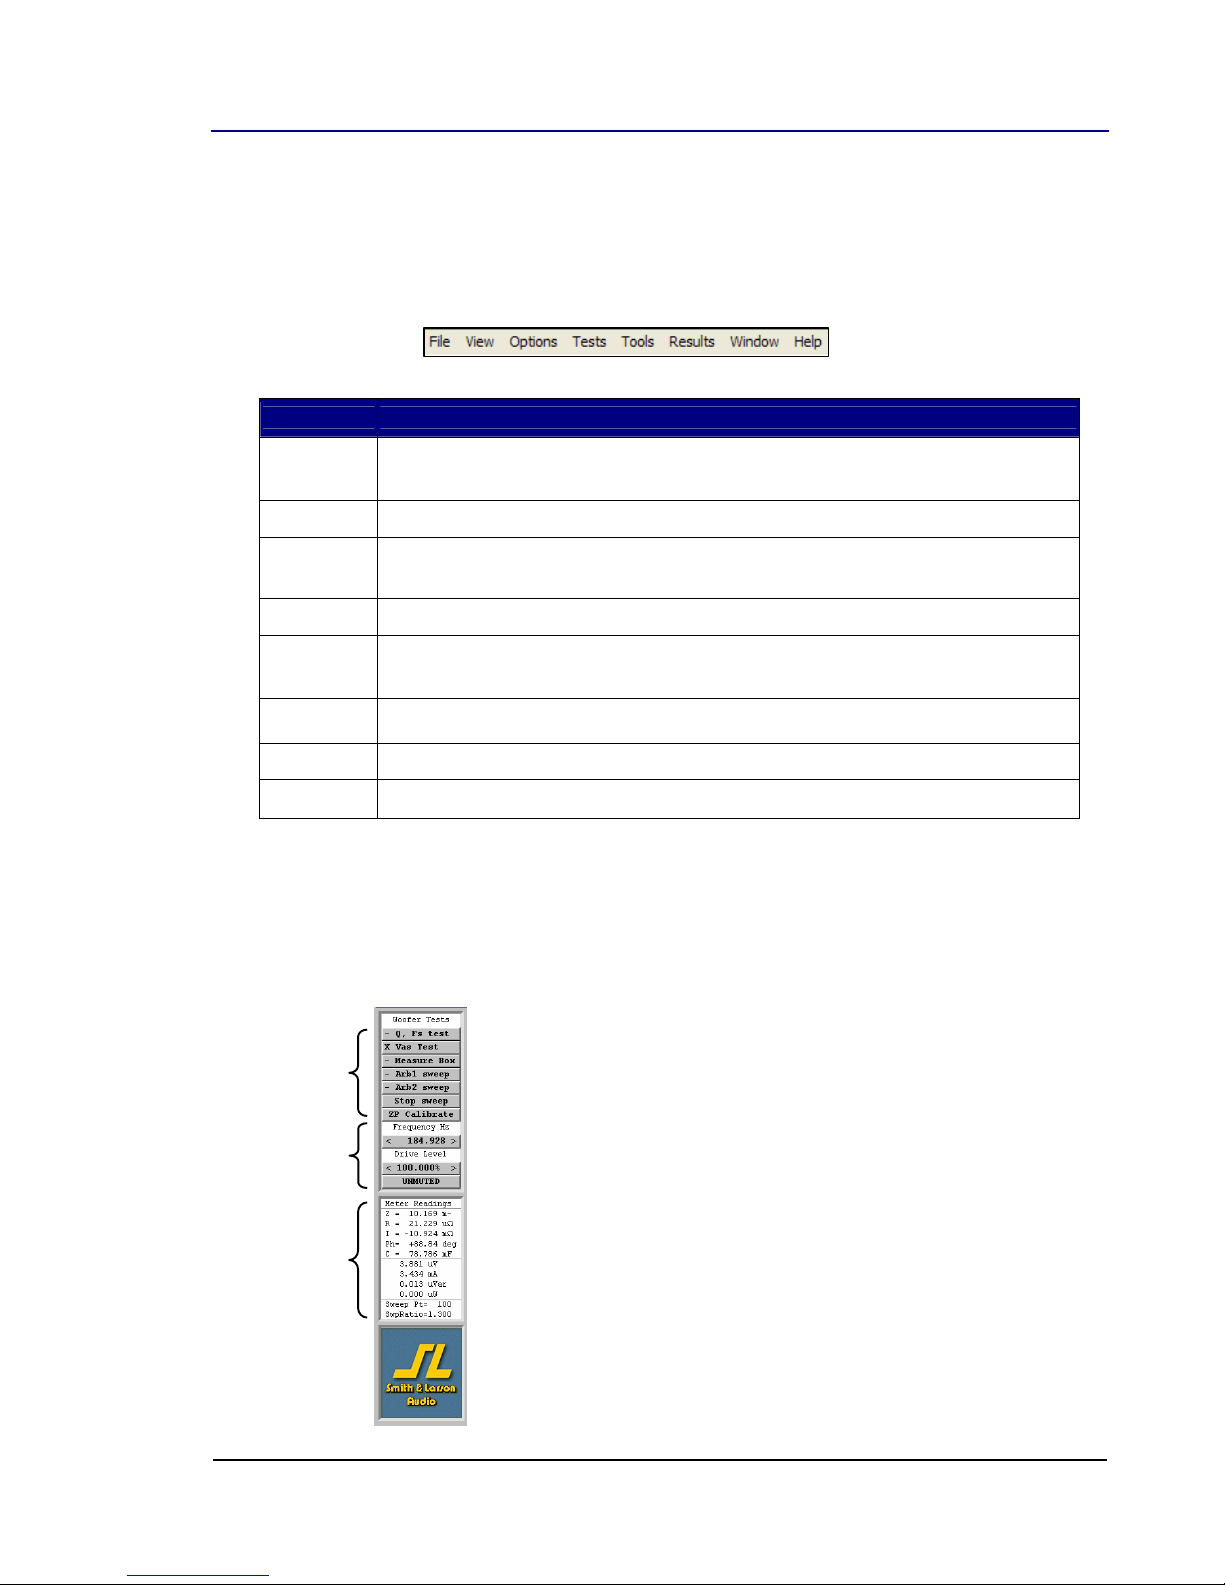
2.2. Tests, Signal Control and Real-time Meter Window
Figure 2-II – Tests, Signal Control and Real-time Meter Window
The left hand side of the screen contains the Thiele Small Test buttons, the signal
frequency, level controls and the real-time meter window as shown in the picture on
the left.
12 © Smith & Larson Audio Woofer Tester 2 User Guide v1.1
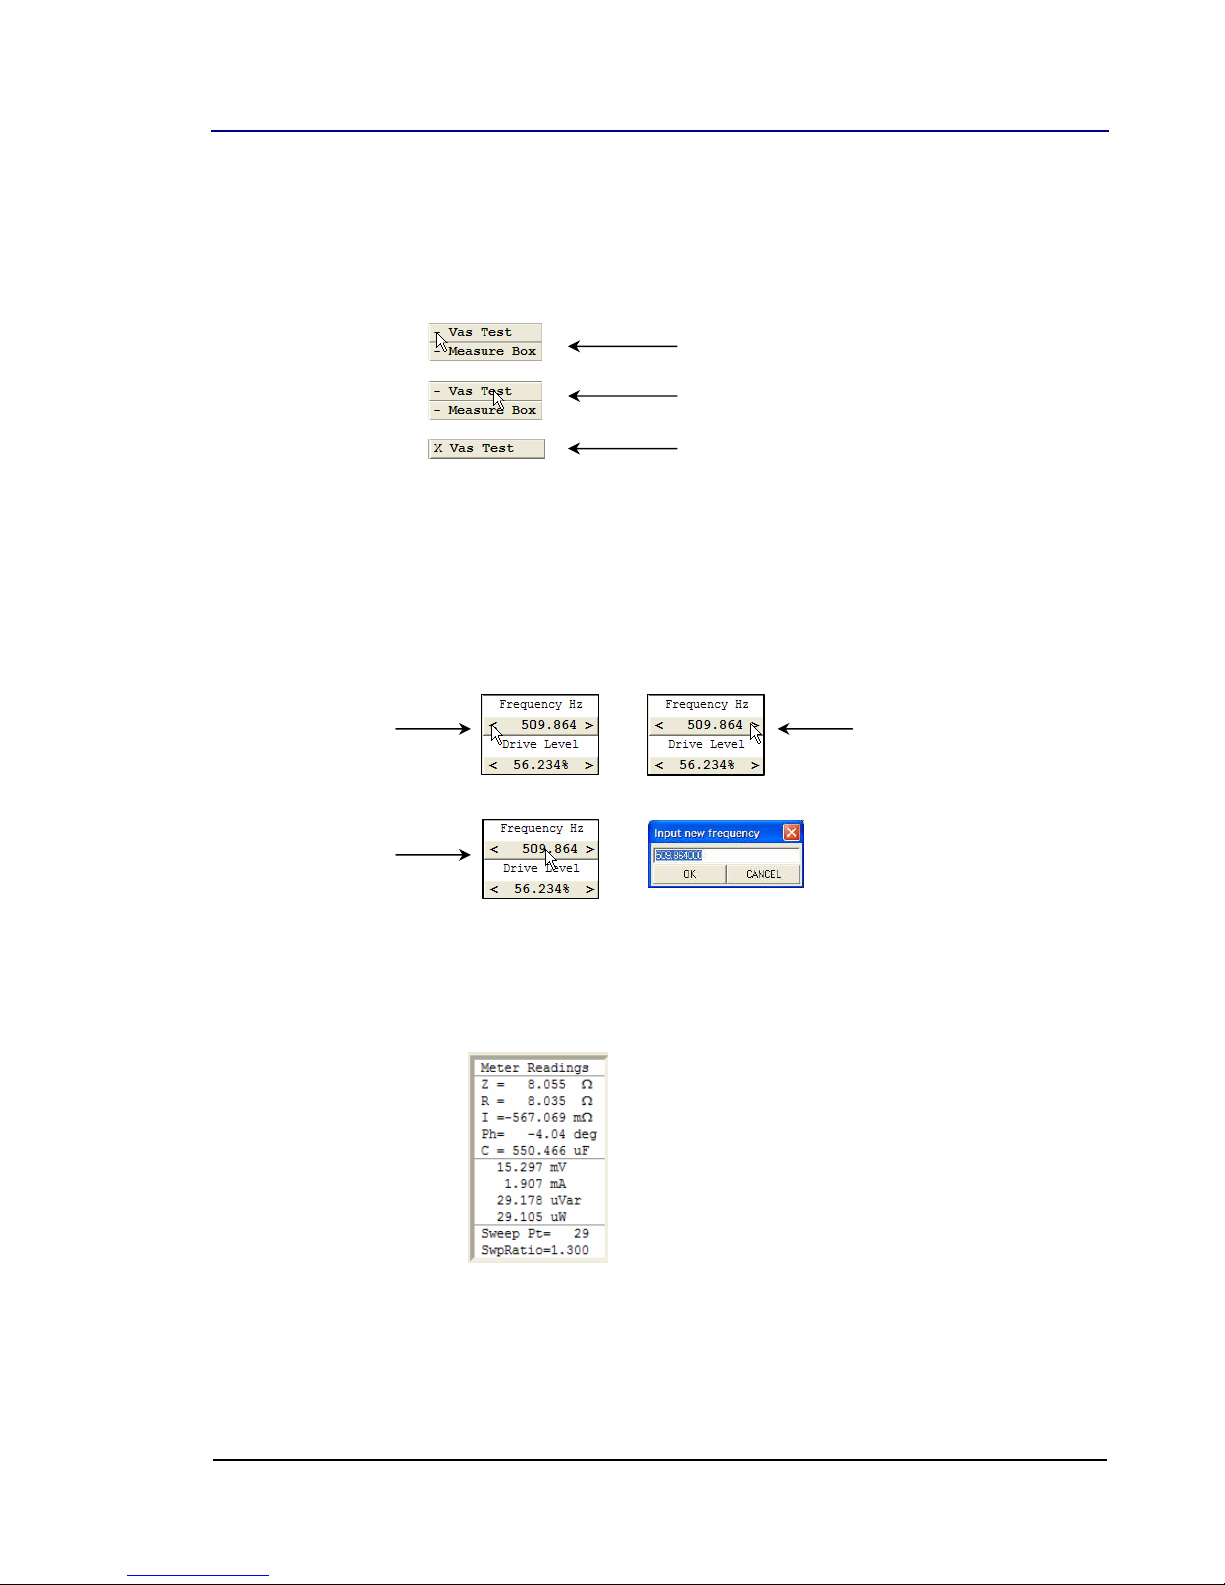
NAVIGATION
Click on the left side of the button to switch
the data view
‘X’ indicates current data view
Click the button on the right or middle to
conduct this test
Decrease levels by clicking on
the left
Increase levels by clicking on
the right
Click button in the middle to
bring up a dialog box
Enter desired value and click
OK
Buttons with Multiple Click Regions
Buttons can consist of multiple click regions. The first five buttons, Q/FS Test, Vas Test, Measure Box, Arb1 sweep and
Arb2 sweep have two regions. Clicking the button on the left changes the data view in the main window. Clicking the
button in the middle or on the right conducts the test:
STOP-RUN-RUNn/Stop Sweep/Start Sweep button
This buttons text changes depending on if the signal mode is SINE wave sweep, or real time processing. If the mode is realtime, the button is split into three active STOP, RUN and RUNn regions. The stop mode action (what halts) is set in the
Options pull down menu or Size&Comp tab.
Clicking the Frequency Hz and Drive Level buttons on the left decreases the frequency and drive level while clicking on
the right increases them. Clicking the buttons in the middle brings up a dialog box to enter a specific value.
Real-time Meter Output
The measurement window below the buttons shows the main real-time outputs of the ongoing test. It also indicates the
current sweep point and sweep ratio, which are variable settings that can be changed in the Options menu.
Woofer Tester 2 User Guide v1.1 © Smith & Larson Audio 13
NAVIGATION
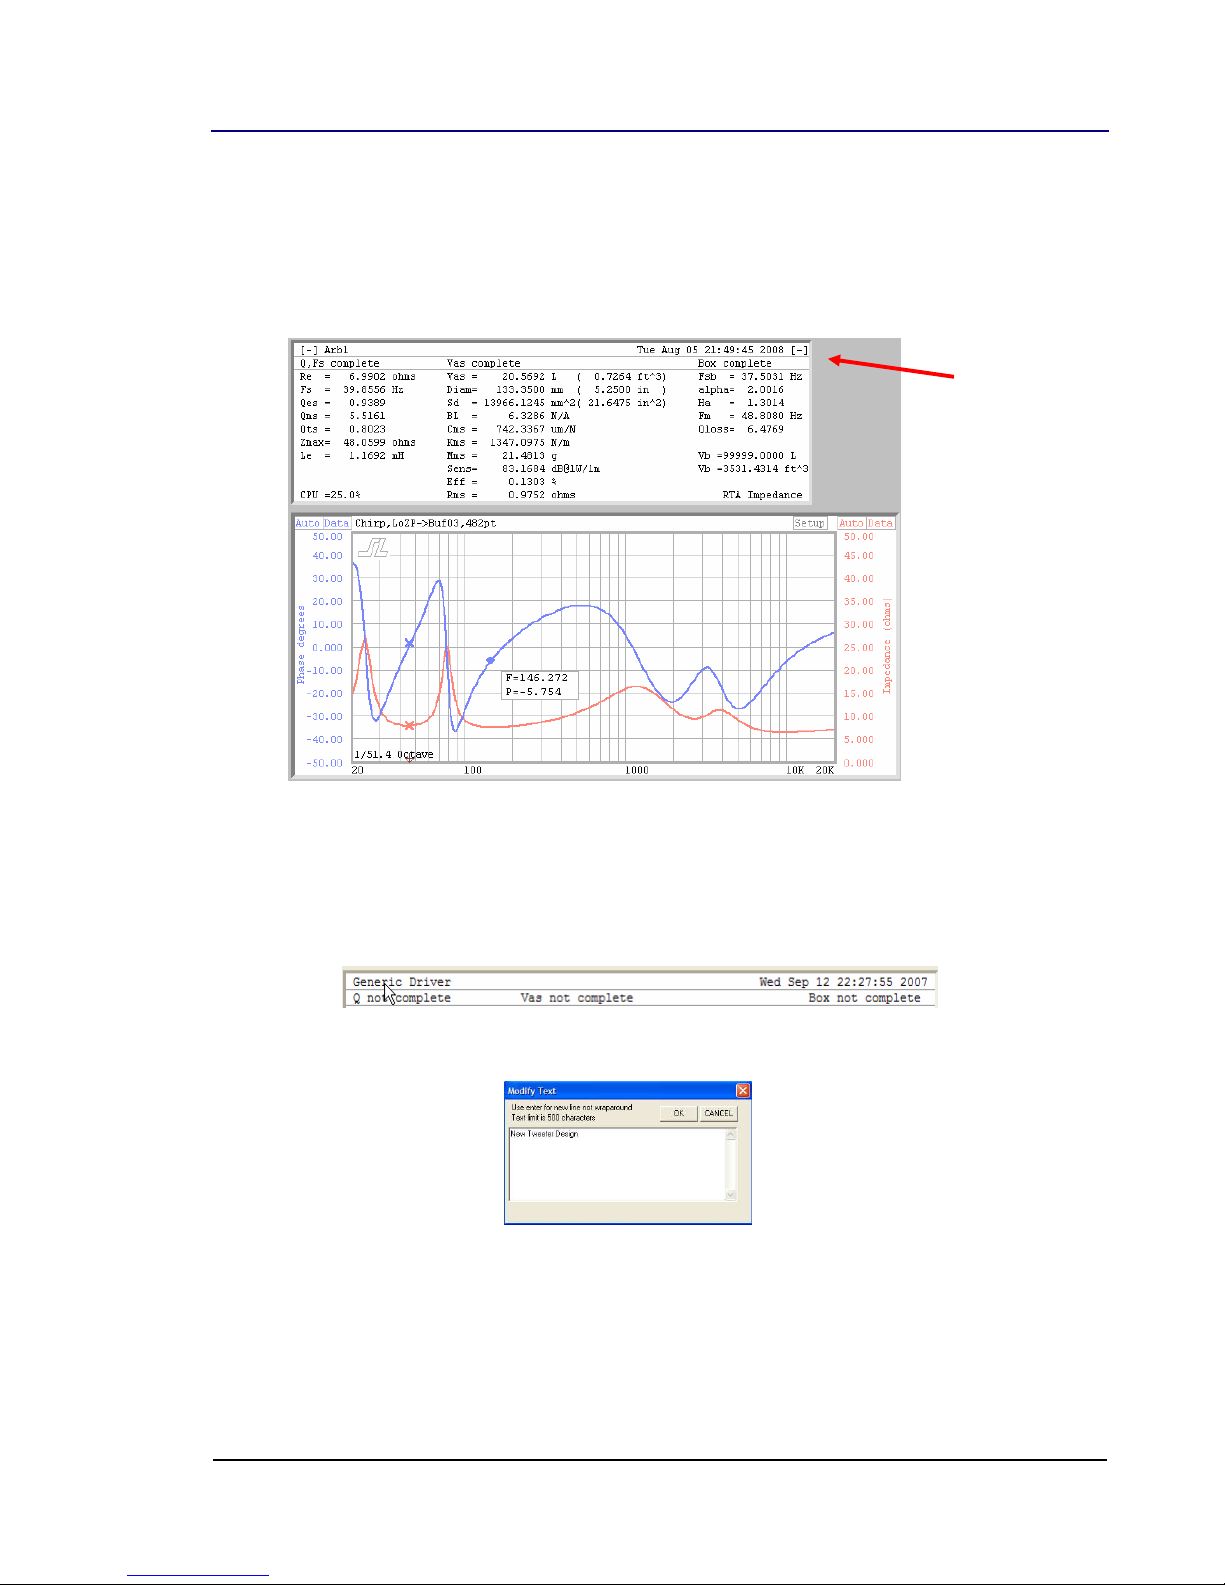
Minimize
Maximize
Text
2.3. WT Control Window
The WT control window consists of a results area on top and a graphing area on the bottom. The results area shows the
output of the latest Q/FS, Vas and Box tests. The results area can be minimized or maximized using the [-] and [+] buttons.
Changing the Title in the Output Window
Clicking on the first row of the output area pops up a dialog in which the graph title can be changed. This title will also be
entered into the Setup Control Window ‘Overlay’ tab that controls overlay and active data destination buffers:
14 © Smith & Larson Audio Woofer Tester 2 User Guide v1.1
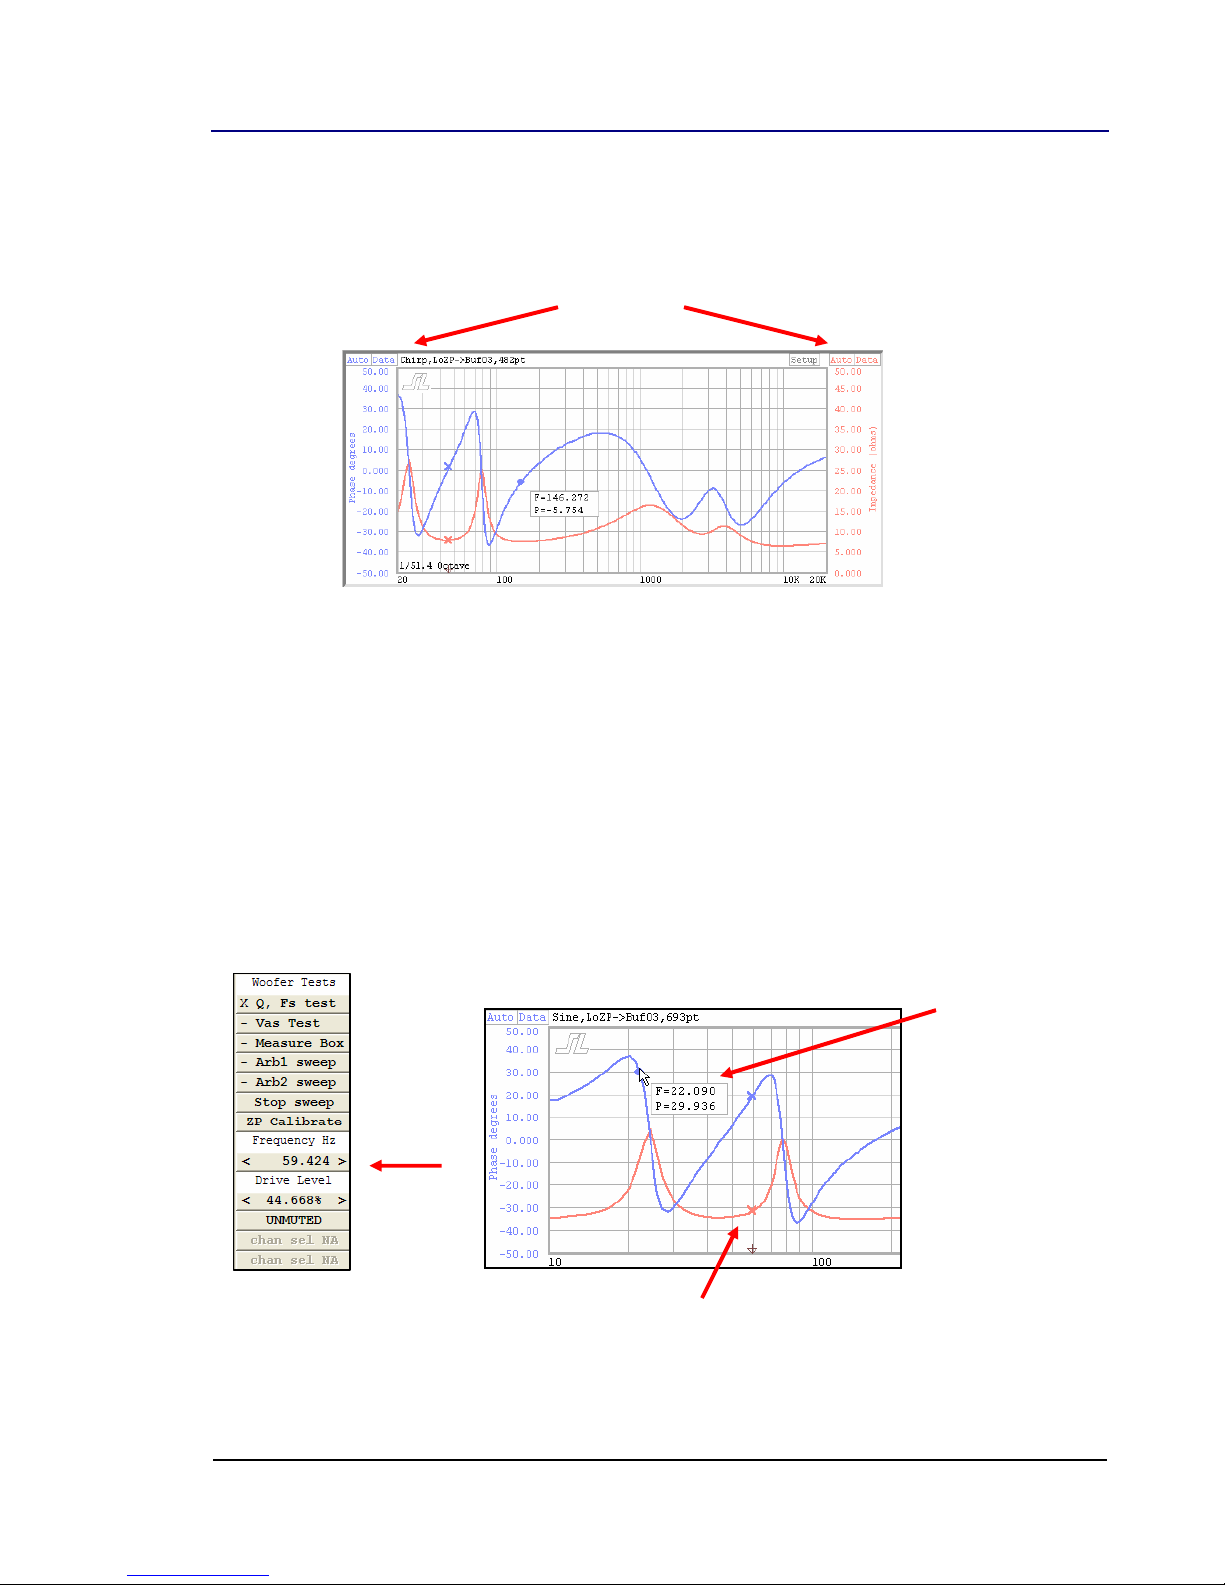
NAVIGATION
X’s show the current measurement frequency and values
Current
measurement
frequency
Buttons
Interpolated Hover
Data
Buttons in the Graphing Area
The graphing area displays sweep and real-time signals that are generated. There are two groups of buttons at the top of
the graph; two in the left corner and three in the right corner labeled Setup, Auto and Data.
Auto – Single clicking this button turns autoscaling on and off. With autoscaling turned on, the range of the phase
degree or response axis automatically adjusts to fit the data. This is useful in the initial stages of a new driver test,
where you do not yet know what levels of response you will get from the driver. Turning autoscaling off fixes the
range of the x or y axis at the current level.
Data – The Data button on the left turns the phase response line off while the button on the right turns the
response line off. Clicking the button again, turns the lines on again.
Setup – This button opens the Setup Control window, which is described in section 2.4
Setting the Measurement Frequency
The two Xs in the graph mark the current data measurements at the selected test frequency. This data is also displayed in
the real-time meter window. When enabled, clicking on the graph will change the current measurement frequency. As the
mouse hovers over a data line an additional value is interpolated from the known data points (the drawn line) and displayed.
This disappears as the mouse moves away:
Woofer Tester 2 User Guide v1.1 © Smith & Larson Audio 15

NAVIGATION
New measurement is processing
(spinning ‘/’ on Z reading)
New measurement is complete
(indicated by ‘Ω’ on Z reading)
Adding/Removing Datapoints from the Graph
After you have measured a driver, depending on the number of data points used in the measurement, you might find pieces
of a curve that are not smooth. The missing curve segments can then be smoothed out by adding additional measurement
points:
1. Go to the
this option is checked
2. Left-click on the segment of the curve that you want to smooth out. The frequency will change and the measurement
Xs will move to that location.
3. Wait for data processing to complete. Processing is complete when the impedance reading in the real-time
measurement window displays an Ω sign.
Options
menu
Left Mouse Button Action
Set Frequency Control in WT Control Window
and make sure
4. Now click the right mouse button to add the new data point to the curve.
It is also possible to remove a bad data point from the graph:
1. Go to the
that it is checked
2. Hold down the Shift key and move the mouse to the data point you want to remove. Notice how the Xs change color.
Options
menu
Left Mouse Button Action
Set Frequency Control in WT Control Window
and make sure
3. While holding down the Shift key, right click the mouse button to delete the data point.
16 © Smith & Larson Audio Woofer Tester 2 User Guide v1.1
NAVIGATION
Note:
Each signal type will have a different drive level and frequency content characteristic. Sine wave signals are pure
tones and provide the highest possible signal density at a particular frequency.
Broadband or ‘real-time’ signals contain all frequencies at the same time. The processing speed of these signals (i.e.
time to get results) is convenient, however energy is spread across the entire spectrum decreasing signal-to-noise
ratios. Additionally, non-linear distortion in the device being tested can lead to computation errors. In theory, all
real-time signals will give the same result, but this is not always the case, especially at higher power levels.
The Impulse mode, for example, has more low frequency content than the MLS or NOISE mode making it more
suitable for measuring a woofer. Conversely, MLS and Noise are good for measuring tweeters. Care should however
be taken with the MLS and Chirp sine modes, as these modes have zero crest factor meaning the low and high
frequency energy can be quite high.
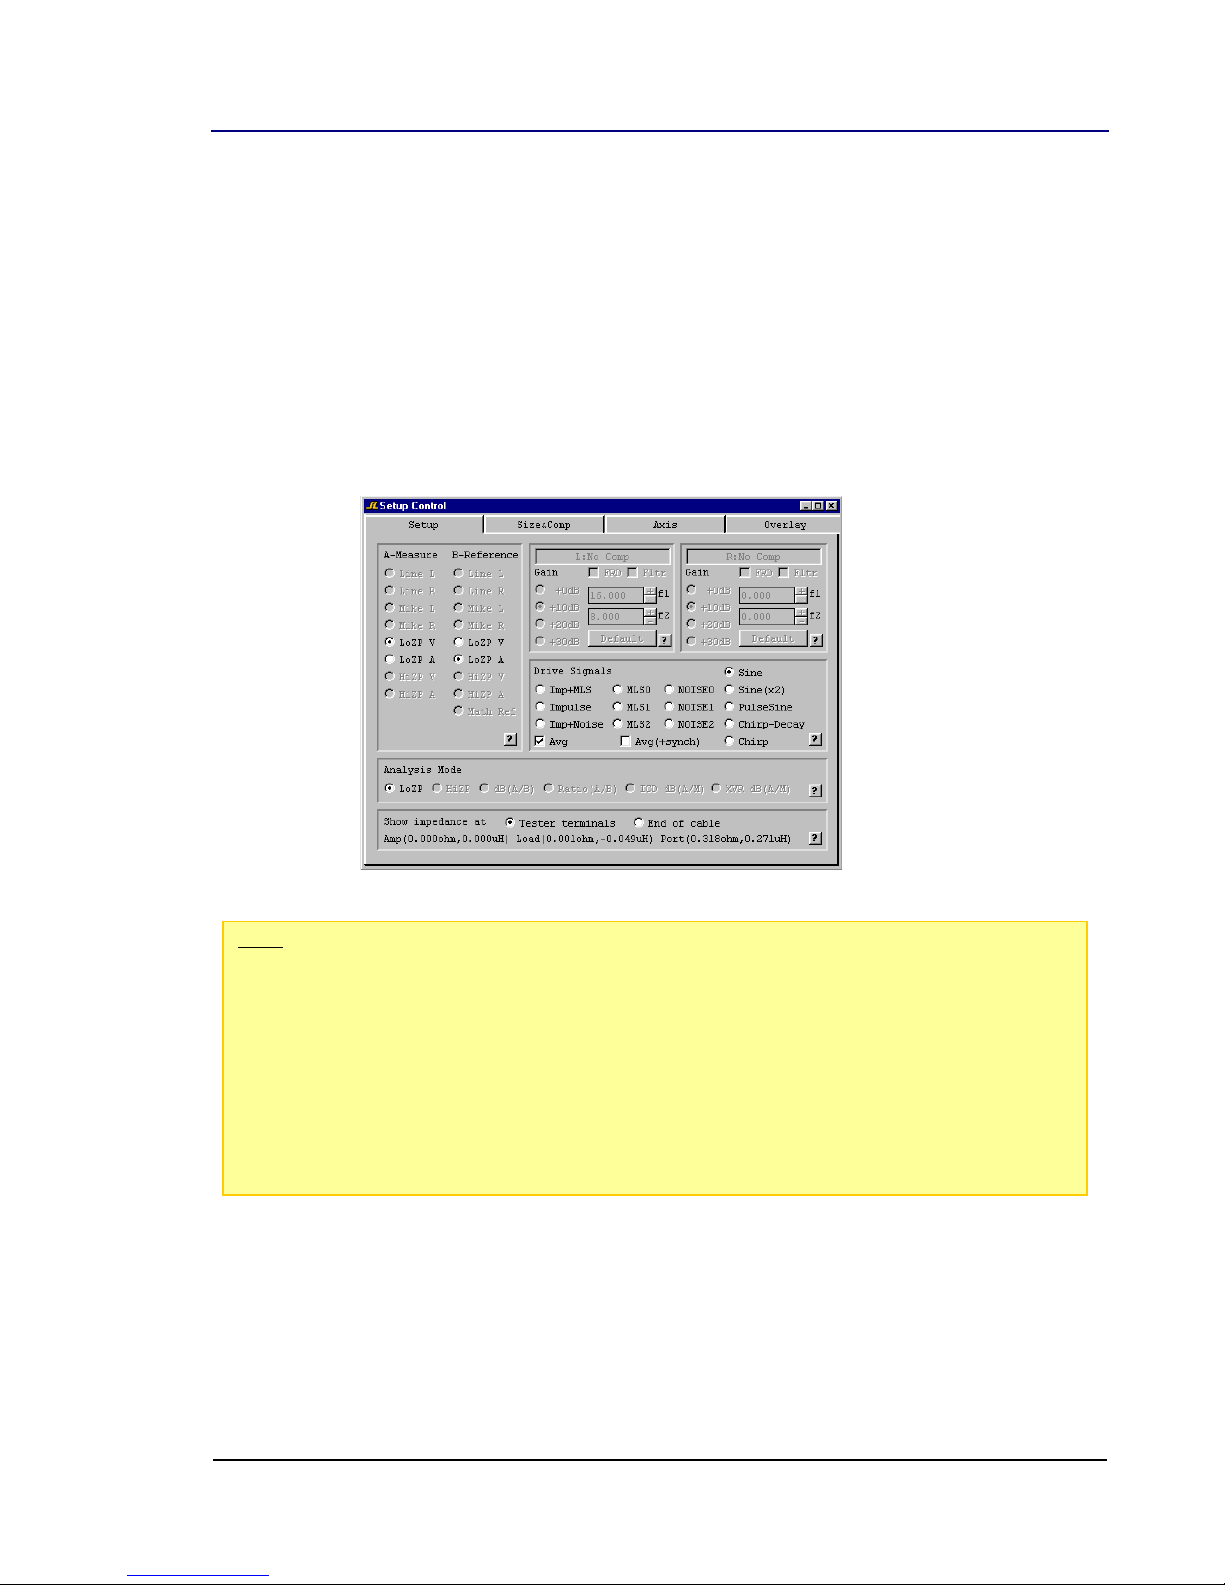
2.4. Setup Control Window
Calculation of Impedance
Impedance is mathematically defined as the ratio of Voltage to Current. These signals are shown in the 'measured' and
'reference' signal columns as LoZP V and LoZP A. The other signal selection options (available for the Speaker Tester and
Woofer Tester Pro) are blanked out. Microphone gain and compensation is also disabled.
Setting the Measurement and Reference Signals
The 'Setup & Control' window is opened from the
The ‘Setup’ tab then shows the measured 'A' and 'B' reference sources as well as the test and signal types. Only the low
power port options are selectable.
View
menu or by clicking the Setup button in the WT Control window.
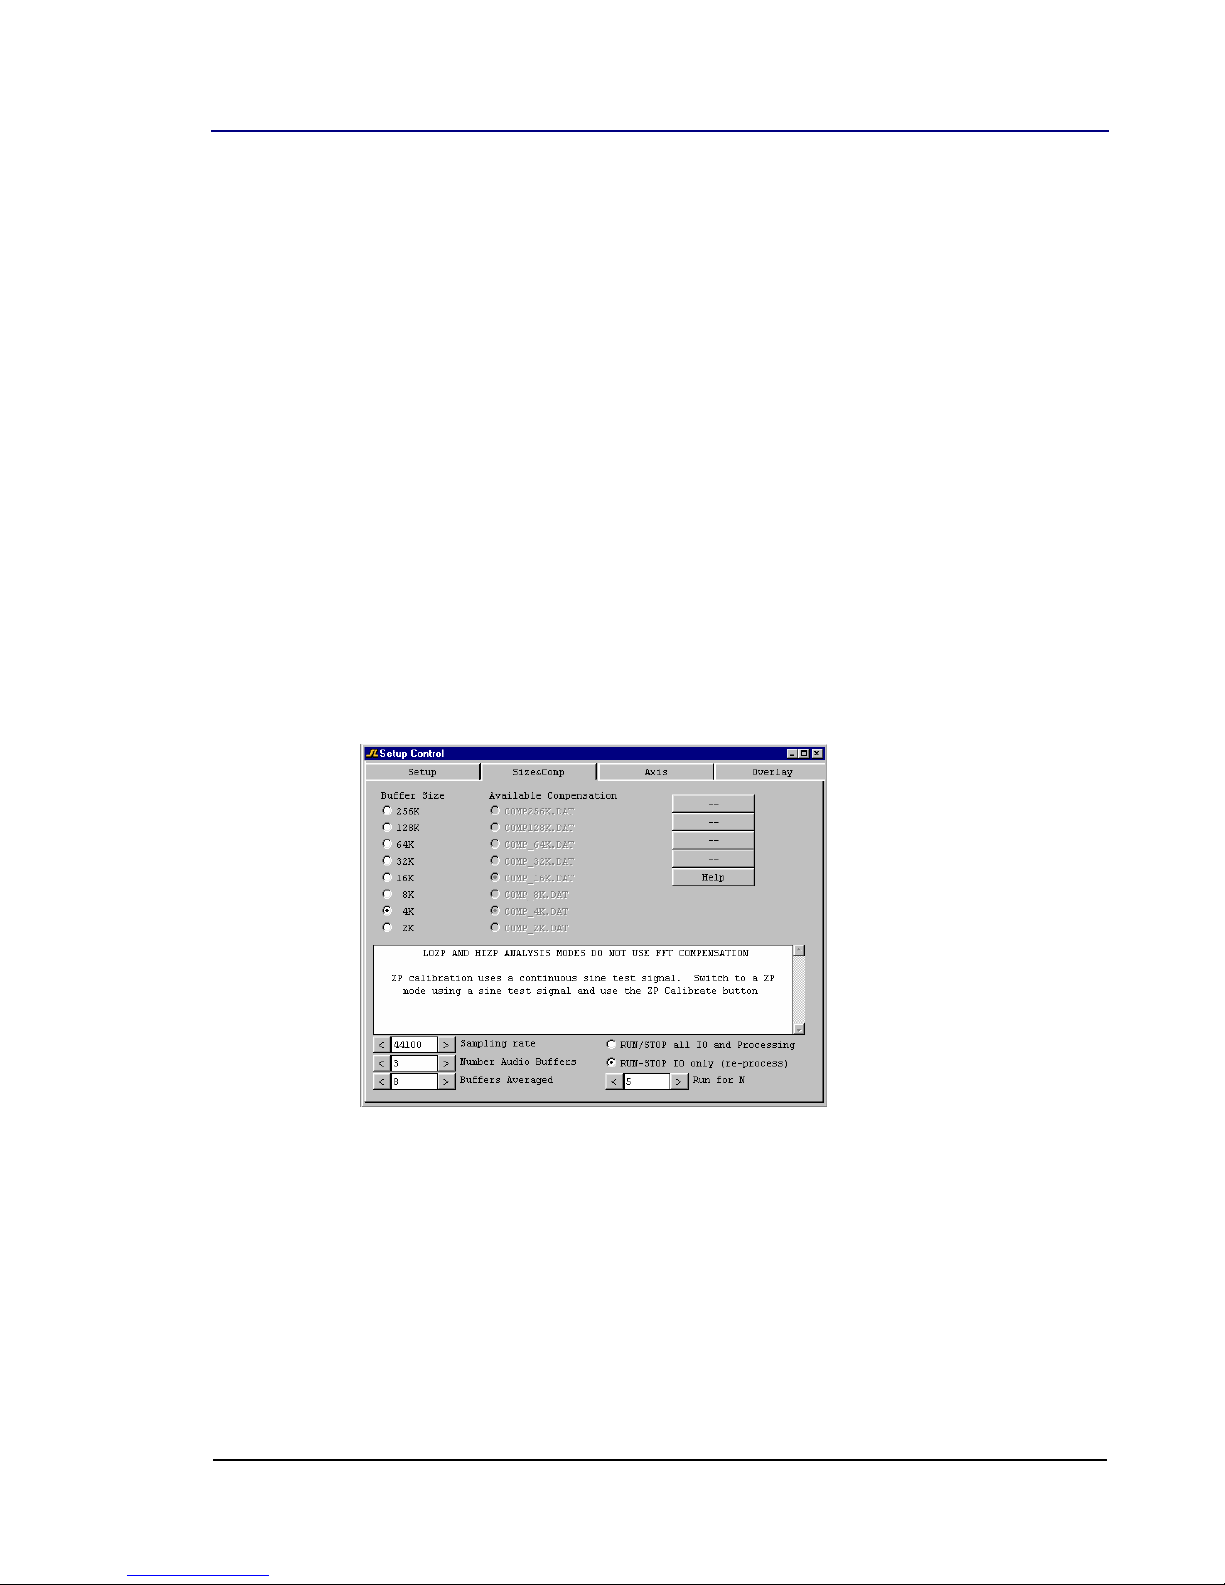
Size & Comp: Buffer Size Selection
The current buffer size is set using the radio buttons on the left hand side. As the current buffer size (used for FFT and
continuous sine) size is increased, the computation window becomes longer in time and frequencies are defined with greater
resolution. You can trade buffer size for speed.
‘Zero reference’ compensation options are not selectable for the WT2.
Woofer Tester 2 User Guide v1.1 © Smith & Larson Audio 17
NAVIGATION
The number of Windows buffers used and the number of frames used to create averaged results is set at the bottom of this
window.
Number Audio Buffers - Audio buffering requires at least two buffers, one for computing and one to be passed
to the operating system for input or output. This is known as double buffering. The idea is that if the OS becomes
busy the buffer will be large enough not to have a data interruption. Since the Tester is averaging data and the
frame sizes can vary, adding an additional audio buffer can sometimes help.
Buffers Averaged - Box-car averaging computes a return value from the average of the last N frames. This
reduces noise, but it also slows down response. Larger FFT sizes, more Windows audio buffers and longer box car
averaging all slow down response time.
RUN/STOP all IO and Processing - When a real-time processing signal mode is stopped using the
STOP-RUN-RUNn button, analog input is halted, output is zeroed and data processing halted. This freezes the
display.
RUN/STOP IO only (allow re-process) - When a real-time processing signal mode is stopped using the
STOP-RUN-RUNn button, analog input is halted and the output is zeroed. However, data processing continues
allowing adjustment of the impulse time gate, octave binning and similar data processing.
RUN for N - Clicking the right hand side of the STOP-RUN-RUNn button will cause the analog IO to operate for
N frames and then halt. To operate properly, N must be set higher than the number of audio buffers+2. This
count is needed to flush old or incomplete frames through the hardware and software.
18 © Smith & Larson Audio Woofer Tester 2 User Guide v1.1
NAVIGATION
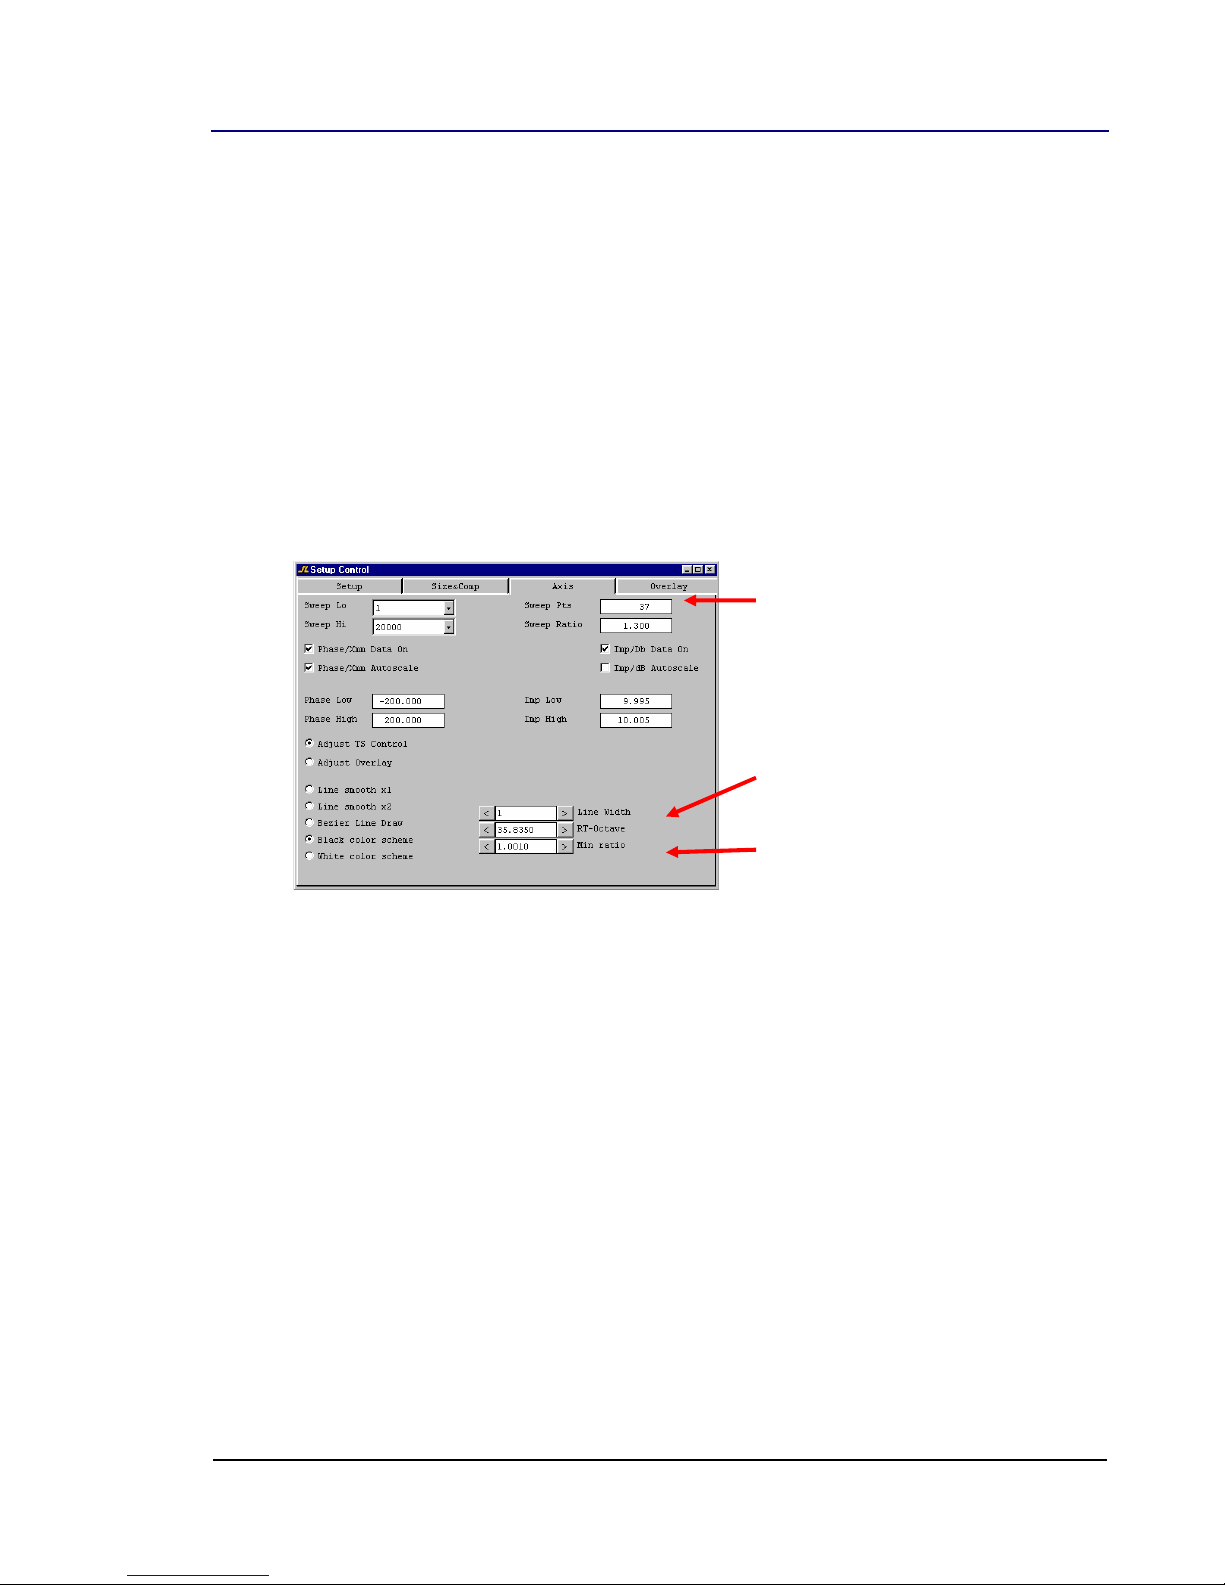
Real-Time Octave Binning
Test Bailout Ratio
Sine mode test points
sweep ratio^N = SweepHi/Lo
Axis Control
The Axis control tab is identical to the Axis dialog that opens when the left hand side of graph window is clicked except this is
a child window. A child window allows you to select and work in other windows. The controls in this window include:
X- display Extents: Low and high frequency limits
Y- Extents: Y axis min and max limits (one for each half-buffer).
Line Smoothing: Drawn line positions are effected (not data averaging).
Real-Time Octave Binning: Complex real-imaginary data is averaged before becoming display data.
Line width and color schemes: Set black or white background
Sweep Points and Sweep Ratio: SweepRatio^N = SweepHi/SweepLo
Test Bailout Ratio: This is the final frequency step that will be taken as the Q,Fs and Vas tests zero in on their
final values. Smaller values will take longer time to complete, but will result in more accurate frequency readings.
Woofer Tester 2 User Guide v1.1 © Smith & Larson Audio 19
NAVIGATION
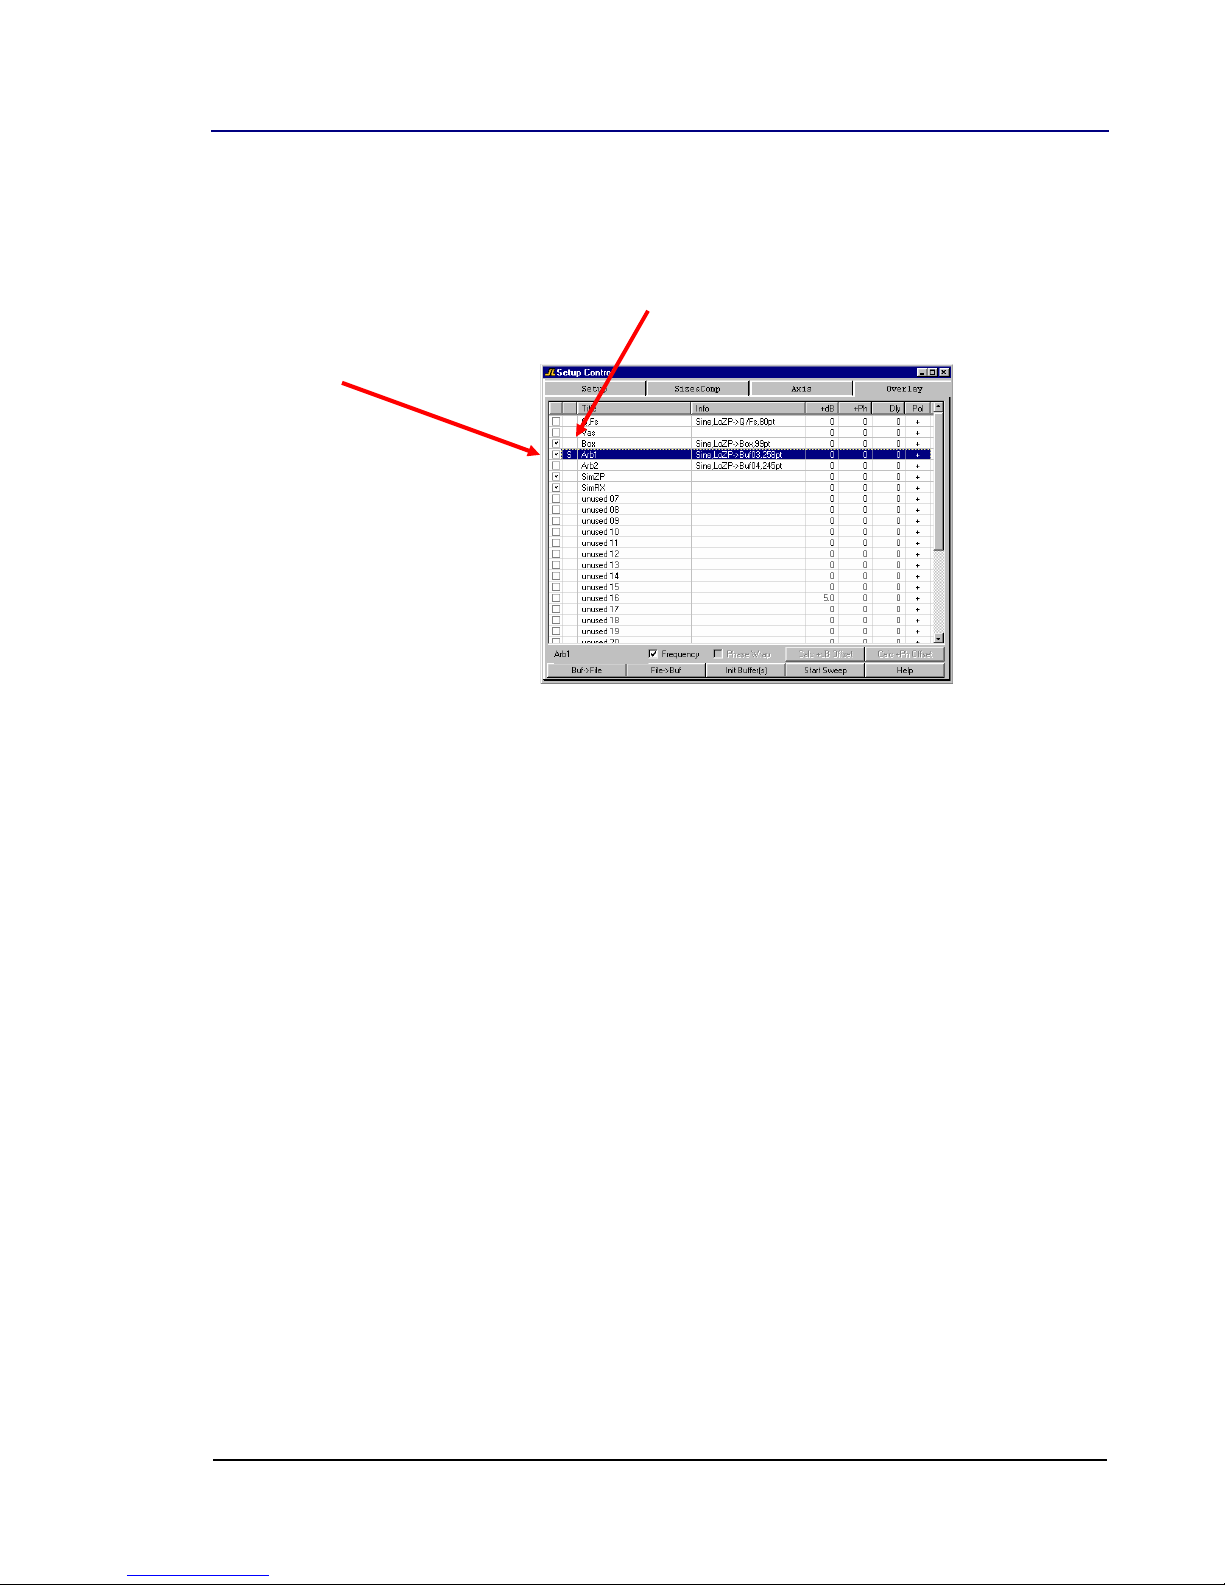
Buffers Displayed in Overlay Window
Box, ARB1, SimZP and SimRx
ARB1 is Data Destination
Displayed in TS Control Window
Overlay (Data Display) Control
The Overlay tab is used to enable one data buffer for data entry in the TS Control child window and up to 32 data overlays in
the Overlay child window. The first column is used to enable multiple overlays, and the second to enable the current
destination buffer.
Title Column
Each buffer can be given a unique name by clicking in the list box. Some buffers will have pre-assigned names that go with a
particular usage. For example, the first buffer is assigned to the Q/Fs test procedure and is therefore traditionally assigned that name,
as are the first seven buffers.
Info Column
The info column contains information about how a buffer was configured when it was activated. This process is automatic. If you type
something in this column it may be overwritten.
+dB, +Ph, Dly and Pol Columns
The data entered in these columns is used to shift response curves (impedance is not affected) up and down. Additional phase
polarity (enter + or -) and wrapping control is provided, whereby a time shift (in data samples) can be applied to the raw data before
it is processed.
Left-Button Sets
If the Frequency option is selected, the current test frequency can be set using a left mouse click in the graph area of the WT Control
window (or Overlay window, if the same buffer is enabled). If the Phase Wrap option is selected, a time delay (in data samples) will
be calculated that will cause the phase to unwrap until it equals the selected mouse point. This is an easy way to set values in the
Delay column.
Buf->File and File->Buf Buttons
These buttons are used to save and restore the currently selected file to an external file. This option allows you to virtually extend the
number of buffers beyond 32.
STOP-RUN-RUNn button
The button text changes depending on whether the signal mode is SINE wave sweep, or real-time processing. If the mode is realtime, the button is split into three active STOP, RUN and RUNn regions. The stop mode action (what halts) is set in the
down menu or ‘Size&Comp’ tab. This button is also found in the WT Control window.
Options
pull
20 © Smith & Larson Audio Woofer Tester 2 User Guide v1.1
NAVIGATION
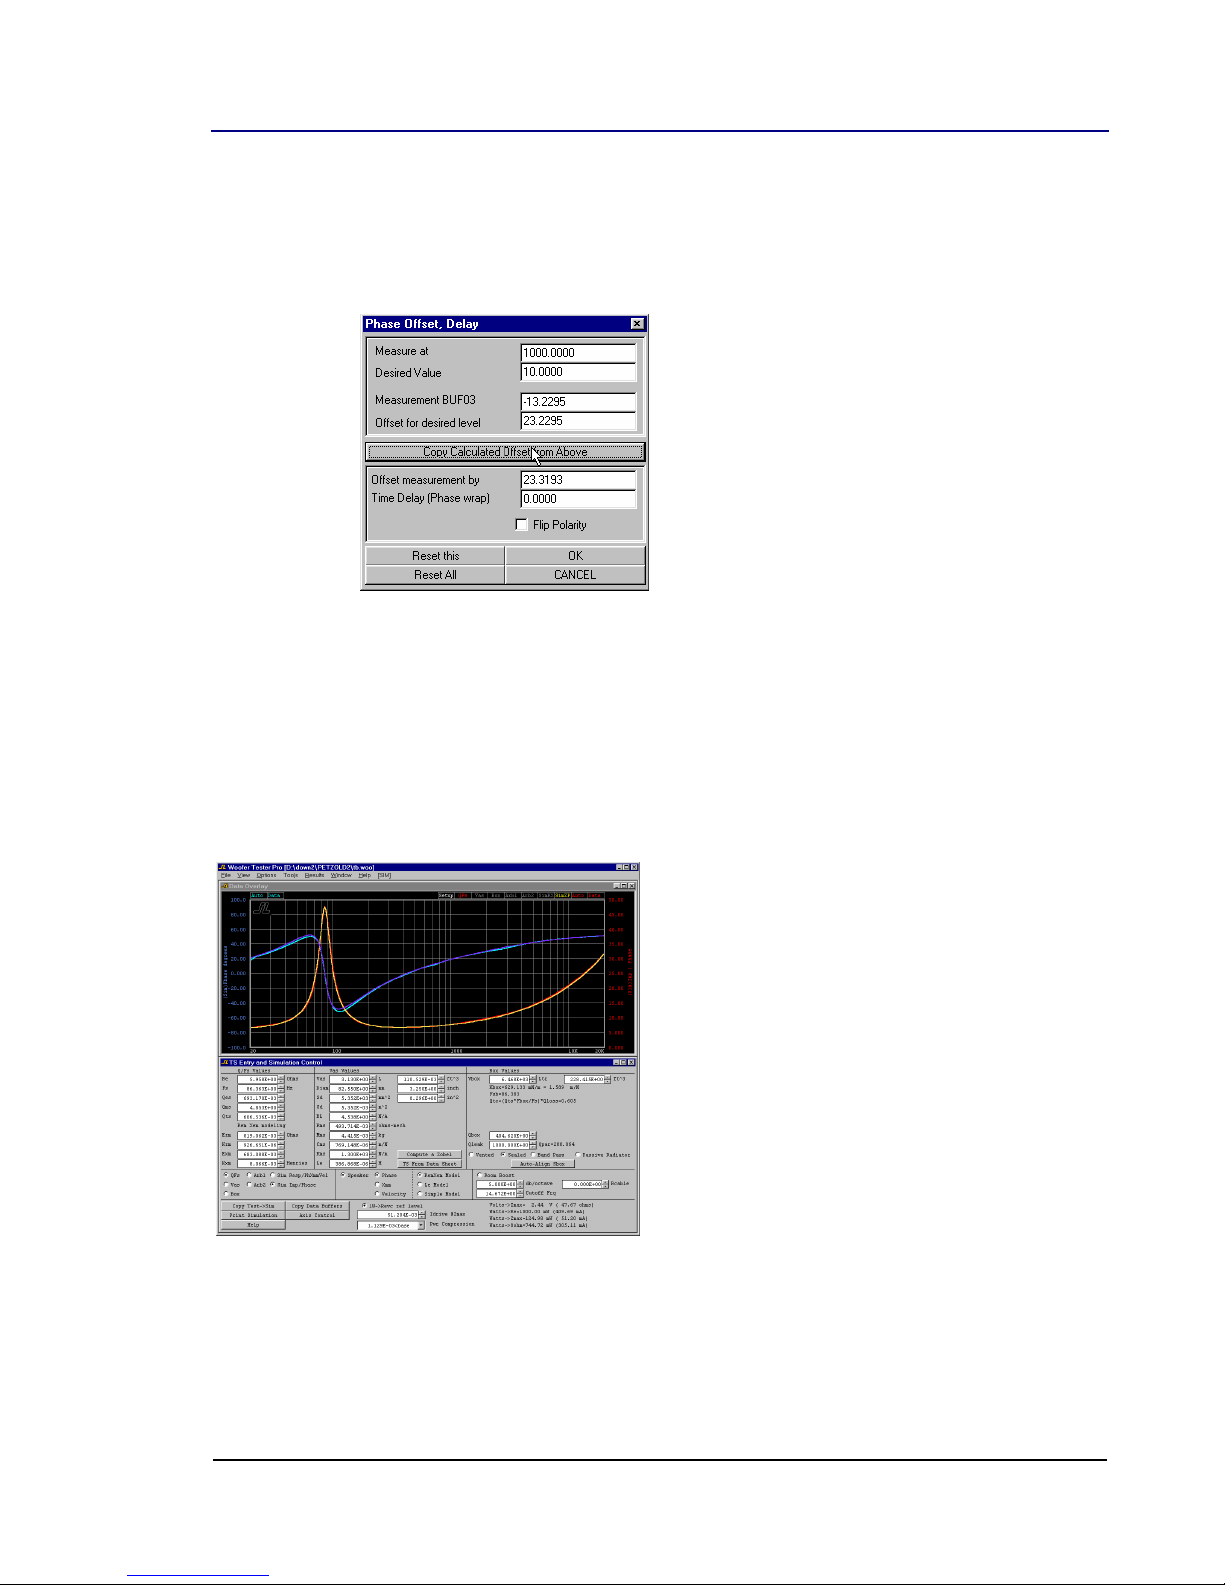
Calc +dB Offset, Calc +Ph Offset
These buttons open the following dialog box. A frequency entered into the ‘Measure at’ field will fill the Measurement field
with the value at frequency, in this case –13.2295. If the desired value at frequency is then 10.0, the required offset
difference would be –13.2295-10 or –23.2295. Clicking on the Copy Calculated Offset from Above button enters the
offset into the Overlay Control.
2.5. Overlay Window
The overlay window compares multiple data sets including response and impedance data from the Thiele-Small simulator.
The graph display is similar to the WT Control window except that it includes a row of data buffer selection buttons along the
top. This view shows an overlay of the in-box electrical impedance and impedance from the simulator.
The image below compares the measured Fs/Q data from a 4” mid-bass driver to the simulated impedance and phase using
a large box to simulate ‘open air’. The extremely close fit is a good indication that the model is accurate.
Woofer Tester 2 User Guide v1.1 © Smith & Larson Audio 21
NAVIGATION
Tip:
An overlay of the simulated and measured impedance will show how well the auto-align feature has
guessed the effective box size, tuning and Q. Manually adjusting the simulation parameters will
sometimes achieve an even tighter fit.
Copy Test
Data Into
SImulator
Auto align simulator to measured box
impedance
Select Box Type
Buttons select an
Overlay of simulated and
measured response and phase
Simulated and
measured Response
and Phase are an
accurate match
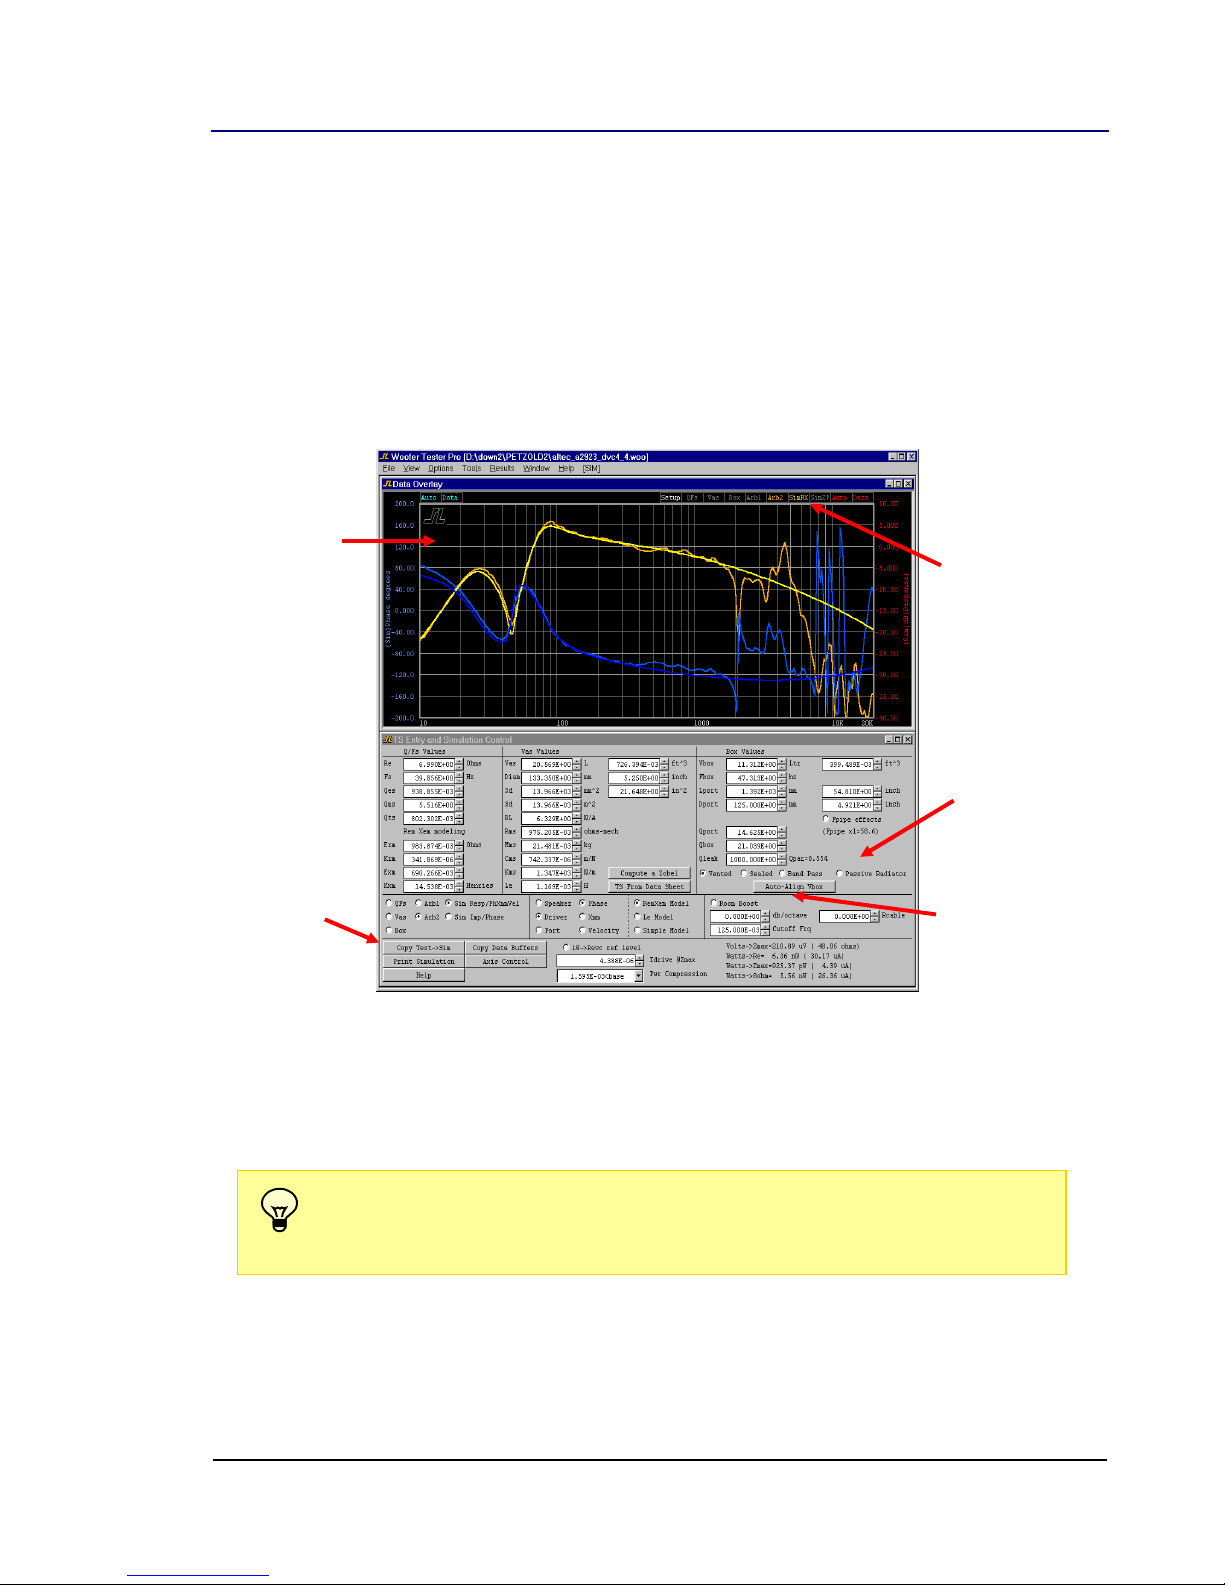
2.6. T/S Entry Window
The Thiele Small Entry window is used to both, design and verify box designs. Vented, sealed, passive radiator and band
pass box models are supported. Other advanced features include the automatic alignment of the simulator to measured box
values, simulation of frequency dependent inductance (Le, Rem, Xem), pipe resonance effects, various Q loss factors, small
room and car boost effects, selection of TS models from compression tables and cable loss. This example shows how well
the measured and then simulated vented box model has been matched to the actual in air response (measured with the WTPro).
The overlay window is used to view simulated response or impedance curves. As shown in the example above this can be
very useful when comparing simulated and measured impedance or response. T/S data is normally copied from the test
environment, but T/S parameters from a manufacturer’s data sheet can also be entered manually. Once in the simulator,
parameters become adjustable. Parameter adjustments in the simulator only affect the simulator. If necessary, simply
recopy from the test environment.
22 © Smith & Larson Audio Woofer Tester 2 User Guide v1.1
 Loading...