

Page 1

™
EliteView
SNMP-Based
Network Management Software
for Windows
™
User Guide
EliteView 6.10
Page 2

Page 3

EliteView™
User Guide
SNMP-Based Network Management Software for Windows
™
6 Hughes
Irvine, CA 92618
Phone: (949) 679-8000
June 2003 R02
Page 4

Information furnished by SMC Networks, Inc. (SMC) is believed to be accurate and
reliable. However, no responsibility is assumed by SMC for its use, nor for any infringements
of patents or other rights of third parties which may result from its use. No license is granted
by implication or otherwise under any patent or patent rights of SMC. SMC reserves the right
to change specifications at any time without notice.
Copyright © 2003 by
SMC Networks, Inc.
6 Hughes
Irvine, CA 92618
All rights reserved.
Trademarks:
SMC is a registered trademark; EliteView, EZ Stack, TigerSwitch and TigerStack are trademarks of SMC Networks, Inc. Other
product and company names are trademarks or registered trademarks of their respective holders.
Page 5

Licence Agreement
The Purchaser MUST read this agreement before using the software provided in this package. As used in this Agreement the
terms “You”, “Your”, “LICENSEE”, and “Purchaser” refer to the licensee of the SOFTWARE and accompanying written
materials in this package, as described below. If you do not agree to the terms of this License Agreement, return the
package, unused, to the point of purchase for a refund of any license fee which you paid.
1. Grant of license
SMC Networks, Inc. (SMC) grants to you a non-exclusive right to use one copy of the program (hereinafter the
“SOFTWARE”). The SOFTWARE is provided by SMC on CD-ROM. SMC also grants to you a non-exclusive right to use
the programs on the enclosed CD-ROM (hereinafter the “SOFTWARE”) on one local area network. SMC reserves all rights
not expressly granted to the LICENSEE.
2. Ownership of license
All SOFTWARE, and each copy thereof, remains the property of SMC and/or one or more of its licensors. This license is
not a sale of any SOFTWARE, or of any copy. You disclaim forever any rights of ownership in any SOFTWARE, or in any
copy. The only rights that you obtain with respect to any SOFTWARE are those expressly set forth in this License
Agreement.
3. Copy restriction
You acknowledge that the SOFTWARE and accompanying written materials are copyrighted and entitled to protection
under the copyright laws of nations where the SOFTWARE is installed, and under international conventions. Except for
the copying of SOFTWARE as expressly permitted in the next sentence, you may not copy any SOFTWARE or
accompanying written materials, or any portion of any of them, or remove any copyright or proprietary notice from any
of them; and you agree not to allow any other person or entity to do so. Subject to these restrictions, you may make
copies of the SOFTWARE solely for backup purposes.
4. Use restriction
As the LICENSEE, you may physically transfer the SOFTWARE from one computer to another within a licensed local area
network. You may not distribute copies of the SOFTWARE or accompanying written materials to others. Furthermore,
the LICENSEE is not permitted to modify, disassemble, reverse or de-engineer, or create any derivative works based on
the SOFTWARE.
5. Transfer restrictions
This SOFTWARE is licensed only to you, the LICENSEE, and may not be transferred to anyone without prior written
consent of SMC. Any authorized transferee of the SOFTWARE shall be bound by the terms and conditions of this
Agreement. In no event may you transfer, assign, rent, lease, sell or otherwise dispose of the SOFTWARE on a temporary
or permanent basis except as expressly provided herein.
6. Termination
This license agreement is effective until terminated by SMC. This license may be terminated without notice by SMC if the
LICENSEE fails to comply with any provision of this license. Upon termination, it is the LICENSEE’s obligation to destroy
the written materials and all copies of the SOFTWARE. Further use of the SOFTWARE components will be in violation of
this license.
Limited Warranty
The Warranty Period for the media on which the SOFTWARE is recorded is for 5 years from the date of its delivery to the
original user as evidenced by a receipt.
You must give SMC prompt written notice within the Warranty Period of any warranty claim. Conditioned on your
providing prompt written notice to SMC within the Warranty Period, SMC shall, as your sole and exclusive remedy, repair
or replace media not conforming to this warranty, or accept return of any such nonconforming media. The election of
whether to repair, replace, or refund shall be SMC’s, in its sole discretion.
EXCEPT FOR THE EXPRESS WARRANTY SET FORTH ABOVE IN THIS LIMITED WARRANTY SECTION, THERE ARE NO
WARRANTIES, EITHER EXPRESS OR IMPLIED. THE SOFTWARE IS PROVIDED AS IS, WITH ALL FAULTS. SMC
DISCLAIMS AND EXCLUDES ANY AND ALL WARRANTIES, INCLUDING WITHOUT LIMITATION ANY AND ALL IMPLIED
WARRANTIES OF MERCHANTABILITY, FITNESS FOR A PARTICULAR PURPOSE, AGAINST INFRINGEMENT AND THE
LIKE, AND ANY AND ALL WARRANTIES ARISING FROM ANY COURSE OF DEALING OR USAGE OF TRADE.
Page 6

L
IMITED WARRANTY
YOU ACKNOWLEDGE THAT YOU ARE NOT RELYING ON SMC’S SKILL OR JUDGEMENT TO SELECT OR
FURNISH SUITABLE GOODS.
PRODUCTS AND SERVICES PROVIDED BY SMC ARE NOT DESIGNED, INTENDED OR AUTHORIZED FOR USE IN
ANY LIFE SUPPORT OR OTHER APPLICATION WHERE PRODUCT FAILURE COULD CAUSE OR CONTRIBUTE TO
PERSONAL INJURY OR SUBSTANTIAL PROPERTY DAMAGE. IF YOU APPLY ANY PRODUCT OR SERVICE
PURCHASED OR LICENSED FROM SMC TO ANY SUCH UNINTENDED OR UNAUTHORIZED USE, YOU SHALL
INDEMNIFY AND HOLD SMC, ITS AFFILIATES AND THEIR RESPECTIVE SUPPLIERS, HARMLESS AGAINST ALL
CLAIMS, COSTS, DAMAGES AND EXPENSES ARISING, DIRECTLY OR INDIRECTLY, OUT OF ANY SUCH
UNINTENDED OR UNAUTHORIZED USE, EVEN IF SUCH CLAIM ALLEGES THAT SMC OR ANY OTHER PERSON
OR ENTITY WAS NEGLIGENT IN DESIGNING OR MANUFACTURING THE PRODUCT.
Limitation of Liability and Damages
IN NO EVENT SHALL SMC BE LIABLE FOR INCIDENTAL, INDIRECT, SPECIAL, PUNITIVE, OR CONSEQUENTIAL
DAMAGES; OR FOR LOST PROFITS, SAVINGS OR REVENUES OF ANY KIND; OR FOR ANY ACTUAL DAMAGES IN
EXCESS OF $100,000; REGARDLESS OF THE FORM OF ACTION, WHETHER BASED ON CONTRACT; TORT;
NEGLIGENCE OF SMC OR OTHERS; STRICT LIABILITY; BREACH OF WARRANTY; OR OTHERWISE; WHETHER OR NOT
ANY REMEDY IS HELD TO HAVE FAILED OF ITS ESSENTIAL PURPOSE, AND WHETHER OR NOT SMC HAS BEEN
ADVISED OF THE POSSIBILITY OF SUCH DAMAGES.
SMC Networks, Inc.
6 Hughes
Irvine, CA 92618
Page 7

ABOUT THIS GUIDE
About This Guide
Welcome to EliteView network management software (version 6.10). This guide describes the procedures for
installing and using this program. Detailed instructions on how to use every module and practical examples
make it easy for you optimize the performance and efficiency of your network.
General Manual Coverage
This manual is your guide to using EliteView to manage all your network resources. It covers the following
topics:
Introduction to EliteView Chapter 1
Software Installation Chapter 2
Getting Started Chapter 3
Mapping Out Your Network Chapter 4
Basic Management Tools Chapter 5
SNMP MIB Management Chapter 6
Logging Network Statistics Chapter 7
Managing Events Chapter 8
Using RMON Chapter 9
Conventions Used in this Manual
This manual uses a variety of editorial and typographical conventions to help you locate and
interpret information easily. These conventions are:
italics Italicized words refer to keyboard keys you have to press, menu options you
have to select to invoke an action, or a section in this manual or another
manual you can consult for reference.
For example: <Enter>, Reboot
Courier New Words shown in Courier New typeface are used to represent screen displays,
filenames, or commands you must enter to initiate an action.
Additional References
System Help
Help files may be accessed directly from EliteView via on-line help. To get help, select Help
from the menu bar and then click on Index. Last-minute information regarding EliteView has been
recorded in the README.TXT file.
i
Page 8

ABOUT THIS GUIDE
ii
Page 9

TABLE OF CONTENTS
CHAPTER 1 INTRODUCTION ............................................................................................ 1-1
General Description ...............................................................................................................1-1
Management Functions .......................................................................................................... 1-2
Application Interface .............................................................................................................1-2
Features of EliteView ............................................................................................................1-3
CHAPTER 2 INSTALLATION .............................................................................................. 2-1
Installation for EliteView .......................................................................................................2-1
System Requirements ...................................................................................................... 2-1
Using SETUP to Install EliteView ...................................................................................2-2
Software Installation ........................................................................................................2-2
CHAPTER 3 GETTING STARTED ....................................................................................... 3-1
Overview................................................................................................................................3-1
Network Interface ........................................................................................................... 3-1
Event-Driven, Modular Architecture .............................................................................. 3-1
EliteView Modules .................................................................................................................3-2
Data Logging and Event Management .................................................................................3-4
Starting EliteView ................................................................................................................... 3-6
CHAPTER 4 DEFINING THE NETWORK CONFIGURATION ........................................................ 4-1
Quick Guide to Map Building ..............................................................................................4-1
Discovery ................................................................................................................................4-2
Name Database Manager ...................................................................................................... 4-5
Creating Network Maps......................................................................................................... 4-7
CHAPTER 5 NETWORK TOOLS ........................................................................................ 5-1
Setting Addresses with the BOOTP Server .........................................................................5-1
Probing Devices with the Alive Test ...................................................................................5-5
Downloading Files with the TFTP Server ...........................................................................5-7
Telneting to Other Computers on the Network ..................................................................5-8
CHAPTER 6 SNMP MIB MANAGEMENT .......................................................................... 6-1
MIB Compiler ......................................................................................................................... 6-1
Starting the MIB Compiler ..............................................................................................6-2
MIB-2 Viewer.........................................................................................................................6-5
MIB-2 Directory ...............................................................................................................6-6
System Information .......................................................................................................... 6-6
Interface Administration ..................................................................................................6-7
Interface Statistics ............................................................................................................6-8
MIB Browser .......................................................................................................................... 6-9
Basic Functions of MIB Browser....................................................................................6-9
iii
Page 10

T
ABLE OF CONTENTS
Menu Description ......................................................................................................... 6-10
Accessing Device Values ............................................................................................. 6-11
CHAPTER 7 COLLECTING DATA WITH LOG MANAGER ........................................................... 7-1
Overview................................................................................................................................7-1
Editing a Log Process ............................................................................................................. 7-2
Modifying a Log Process .................................................................................................7-3
Log Controls ............................................................................................................................7-4
Viewing Log Data ..................................................................................................................7-4
Using the Log Database Manager ..................................................................................7-4
Using the Graphic Display Dialog Box .........................................................................7-5
Defining Filter Formulas........................................................................................................7-6
Filter Formula ...................................................................................................................7-6
Filter Formula Syntax ...................................................................................................... 7-7
Defining Threshold Formulas ...............................................................................................7-9
Threshold vs. Filter Formula........................................................................................... 7-9
Accuracy ........................................................................................................................... 7-9
Threshold Formula ...........................................................................................................7-9
Threshold Formula Syntax ........................................................................................... 7-10
CHAPTER 8 MANAGING EVENTS ...................................................................................... 8-1
Understanding the Event Manager ....................................................................................... 8-1
Starting the Event Manager .............................................................................................8-1
Defining Events ......................................................................................................................8-2
Pre-Defined “System” Events .........................................................................................8-2
Defining “User” Events ...................................................................................................8-2
Defining Event Actions..........................................................................................................8-2
Using Special Text........................................................................................................... 8-4
Event Data ........................................................................................................................8-4
Receiving SNMP Traps with the Trap Manager.................................................................. 8-5
Limitations of Trap Messages .........................................................................................8-5
Trap Types .......................................................................................................................8-5
Trap Manager ................................................................................................................... 8-6
Posting Messages to the Report Window ............................................................................8-6
CHAPTER 9 USING RMON ........................................................................................... 9-1
Introduction............................................................................................................................. 9-1
A Brief Description of RMON ........................................................................................9-1
Starting the RMON Manager ........................................................................................... 9-2
RMON Utilities .......................................................................................................................9-3
Statistics Group ................................................................................................................9-3
History Group ..................................................................................................................9-8
Alarm and Event Groups .............................................................................................. 9-10
iv
Page 11

T
ABLE OF CONTENTS
Host Group .................................................................................................................... 9-12
Host Top N Group........................................................................................................ 9-14
Matrix Group ................................................................................................................. 9-16
Filter and Capture Groups ........................................................................................... 9-19
APPENDIX A TYPICAL ELITEVIEW APPLICATIONS ................................................................ A-1
Adding a New MIB Using the MIB Compiler .................................................................... A-1
Managing a Third-Party Device Using the MIB Browser ................................................. A-2
Using the Log and Event Managers to Monitor the Network ........................................... A-3
Customizing EliteView to Receive Third-Party Traps ....................................................... A-6
Exporting Logged Data to Other Software ......................................................................... A-7
APPENDIX B CUSTOMIZING ELITEVIEW ............................................................................ B-1
EliteView’s Initialization Files .............................................................................................. B-1
Inside the NETMGR.INI File ................................................................................................ B-1
Changing Parameters in NETMGR.INI .......................................................................... B-2
The [system] Section....................................................................................................... B-3
The [device] Section ....................................................................................................... B-3
The [tools] Section .......................................................................................................... B-4
The [bitmaps] Section ..................................................................................................... B-6
The [util] Section ............................................................................................................. B-8
The [tftp] Section ............................................................................................................ B-9
The [startup] Section ..................................................................................................... B-10
The [discover] Section .................................................................................................. B-11
Inside the TRAP.INI File..................................................................................................... B-11
The [generic] Section ................................................................................................... B-12
The [enterprise] Section ............................................................................................... B-13
Specific Trap Sections .................................................................................................. B-13
APPENDIX C SNMP ENVIRONMENT ................................................................................ C-1
SNMP Roles ........................................................................................................................... C-1
Managing Data ......................................................................................................................... C-1
Objects .................................................................................................................................... C-2
table.index notation ............................................................................................................ C-2
iso origin ............................................................................................................................ C-3
Branches ............................................................................................................................ C-3
APPENDIX D TECHNICAL REFERENCES ............................................................................. D-1
RFC Reports ........................................................................................................................... D-1
Industry-Related Documentation ......................................................................................... D-2
APPENDIX E PERFORMANCE TIPS..................................................................................E-1
Optimize Your Computer System .........................................................................................E-1
Minimize Unnecessary Resources ........................................................................................E-1
Other Tips .............................................................................................................................. E-1
APPENDIX F SPECIFICATIONS .......................................................................................... F-1
v
Page 12

T
ABLE OF CONTENTS
Product Overview .................................................................................................................. F-1
Features and Specifications ...................................................................................................F-1
APPENDIX G CODEBASE 6.0 DLL SUB-LICENSE AGREEMENT ............................................... G-1
APPENDIX H TROUBLESHOOTING ....................................................................................H-1
EliteView Map: Icon Stays Red ........................................................................................... H-1
Discovery: No Nodes Found ............................................................................................... H-2
Trap Manager: MIB Variable Not Found ............................................................................ H-2
APPENDIX I ERROR MESSAGES ........................................................................................ I-1
EliteView................................................................................................................................. I-1
BOOTP Server ....................................................................................................................... I-3
BOOTP.DLL ............................................................................................................................ I-4
Discovery ................................................................................................................................ I-6
Event Manager...................................................................................................................... I-10
ICMP.DLL ............................................................................................................................... I-10
IPX.DLL ................................................................................................................................. I-13
Log Manager ......................................................................................................................... I-13
MESSAGE.DLL....................................................................................................................... I-13
MIB Browser ........................................................................................................................ I-14
MIB Compiler ....................................................................................................................... I-16
MIB.DLL ................................................................................................................................ I-19
MIB-2 Viewer....................................................................................................................... I-20
Report.................................................................................................................................... I-21
TFTP Server .......................................................................................................................... I-21
TFTP.DLL............................................................................................................................... I-23
Trap Manager ....................................................................................................................... I-25
APPENDIX J PRODUCT SUPPORT SERVICES .......................................................................... J-1
Technical Support Questions ................................................................................................ J-1
GLOSSARY
INDEX
vi
Page 13

CHAPTER 1
INTRODUCTION
EliteView provides a user-friendly interface for managing SMC brand and third-party network
devices. This software is specifically designed to support the efforts of the MIS manager, system
administrator(s), technical staff responsible for network management and maintenance, and
network operators who use the system on a daily basis.
EliteView provides all the tools you need to manage nearly any kind of network. You can readily
monitor the traffic load throughout the network and make the changes required to avoid major
crises ahead of time. This software is designed around an event-driven architecture, which allows
you to define event-handling routines that can automatically manage a wide variety of common
network tasks.
General Description
EliteView is based on the industry standard Simple Network Management Protocol (SNMP); and
provides protocol support for UDP/IP and IPX. EliteView is a Windows-based application used to
manage nearly every component in your network, from internetworking devices down to end-node
computer resources.
EliteView manages network devices using the comprehensive Management Information Base. This
MIB consists of various MIB modules which define basic system parameters for both general and
specific device types.
EliteView is based on a broad conceptual interface that permits it to manage any network device
that supports SNMP. By opening your network map and clicking on various objects, specific
management interfaces and system information can be readily accessed.
Interface statistics and traffic load can be illustrated by line charts. This information can be
automatically recorded by the Log Manager to maintain historical records. A powerful reporting
feature is also provided for recording significant information from any management window. Reports
can be edited, saved and retrieved again during a later session for subsequent analysis or
comparison.
Event management is a key feature of EliteView. By defining specific data filters and thresholds, you
can activate event-handling routines that help you keep the network functioning. You can easily
shut down malfunctioning ports, switch to backup systems, or reconfigure network connections; and
then restore system parameters back to normal values after component problems have been
resolved or the traffic falls off.
1-1
Page 14

INTRODUCTION
Management Functions
EliteView is a Windows-based software package. It provides state-of-the-art utilities which allow you
to perform the following network management tasks:
• Generate a detailed hierarchial map of your entire network configuration. These maps display the
current status of network nodes, and provide a hot link to the management module for each
device.
• Maintain centralized boot services that provide network addresses and information on system files
to download. Boot services are used to quickly reassign network addresses, and fetch filenames
required for downloading frequently modified system software for test devices.
• Monitor and log significant events and statistics. EliteView provides access to common MIB
variables, as well as specific parameters for SMC devices. Network statistics can then be displayed
in tabular or graphic form.
• Automatically respond to network problems with a variety of actions. By defining thresholds for
parameters based on device-specific criteria or traffic loading, you can invoke event handling
routines designed to warn the network manager of potential system problems or automatically
take corrective action.
• Quickly fetch or set MIB variables for network devices. Data in the Management Information Base
(e.g., RFC 1213 for generic internetworking devices) can be managed on an item-by-item basis or
with a user-defined profile that fetches or sets a group of related variables in a single action.
• Remotely manage or reconfigure network devices. SMC provides a wide variety of intelligent
networking devices which can be remotely managed via an SNMP agent. Software modules based
on an advanced graphic user interface are provided to manage every aspect of these devices
including hubs and switches. Extensive management functions are also provided for third-party
devices using the MIB Browser.
Application Interface
EliteView runs on a personal computer attached to the network you want to manage. Management
actions normally occur via the network map, through which you can activate the appropriate
software module simply by double-clicking on the concerned device or by selecting a target device
and then invoking the appropriate module from the menus. By sending commands across the
network, EliteView can directly manage a wide variety of SNMP-based devices.
Using this powerful management tool, you can generate a device map for a complete view of the
network, where each device is represented as an icon. Network devices can be added or deleted
manually, or located using Discovery. Device icons can be placed anywhere within a map using
simple drag and drop. Object attributes can also be easily changed.
1-2
Page 15
A full hierarchical representation can be generated by creating
submaps that expand to a more detailed view when selected.
Moreover, multiple submaps can be opened simultaneously. Each
device included in the map can be checked periodically to verify
that it is still attached to the network. When any device loses its
network connection, its icon will change to indicate device state,
and an alarm may be generated.
The standard method of starting EliteView is to double-click
on the EliteView icon, open your network map, select a target
device, and then invoke the required management module.
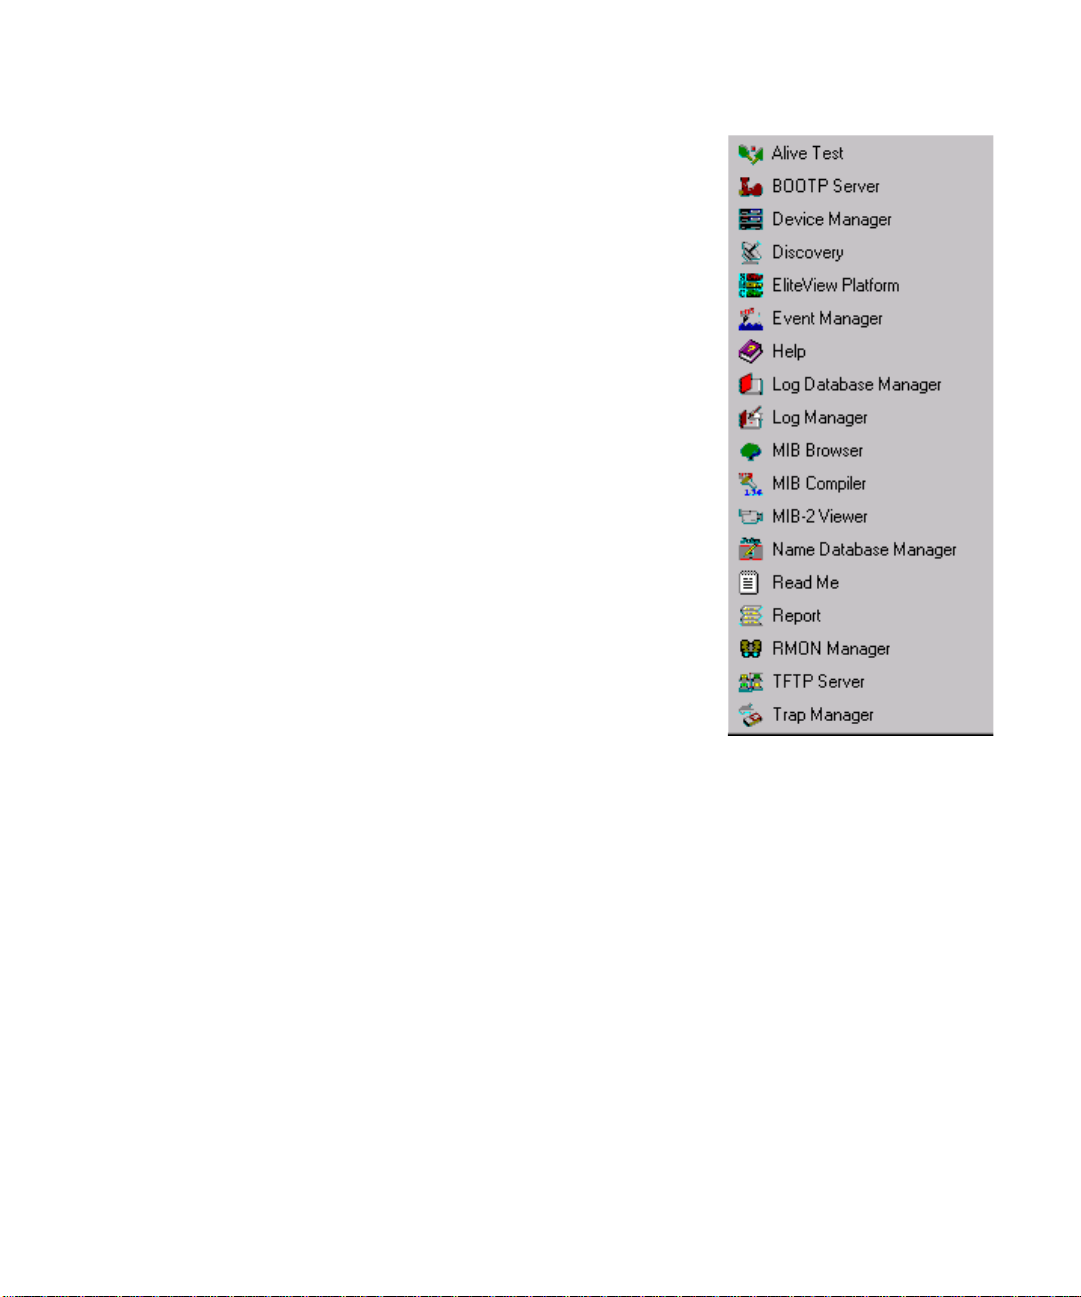
However, you can directly invoke any of the modules displayed
below.
The EliteView program group includes over twenty different
modules. The main program, labeled EliteView Platform, serves
as the platform through which you display the network map,
manage the network, and access any of the other management
modules.
Features of EliteView
INTRODUCTION
EliteView includes the following features:
• Windows-based SNMP network management.
• Manages unlimited number of network devices running SNMP
agent software.
• Provides detailed information on device parameters, such as statistics for the overall SNMP agent,
device component status, and network interface configuration/statistics.
• Management controls are displayed with graphic and text-oriented windows, which can be
accessed via the network map, or from a pull-down menu, for better functional grouping and a
more intuitive user interface.
• Hierarchical, interactive network management map with unlimited devices and network levels.
• Displays real-time graphical statistics for various counters including network traffic. Monitors the
status and traffic load of each attached device, e.g., displaying the number of incoming, outgoing
and discarded frames.
• Flexible event management allows you to log relevant factors on device status and traffic.
1-3
Page 16

INTRODUCTION
1-4
Page 17

CHAPTER 2
INSTALLATION
This chapter describes setup procedures for EliteView network management software (version 6.10).
EliteView can manage any of SMC’s network devices via standard and private MIB definitions; and also
manage any third-party device that has a resident SNMP agent via standard MIB definitions. Installation of
EliteView software designed to manage specific devices is covered in the corresponding manuals.
(Refer to “Additional References.”)
Installation for EliteView
EliteView can be readily installed on most Windows-compatible personal computers. The EliteView setup
program will guide you through this step-by-step procedure.
System Requirements
Before installing EliteView, please review these minimum computer and network system
requirements for a “dedicated” network management system (NMS).
Hardware:
• PC with an 80486DX2-66 CPU and 16MB memory
• 3.5-inch floppy drive and hard drive
• VGA adapter and display
• Mouse
• Network adapter
Software:
• Microsoft Windows 95
• Microsoft Windows 98
• Microsoft Windows NT 4.0
• Microsoft Windows 2000
• Microsoft Windows XP
2-1
Page 18

INSTALLATION
If you frequently use multiple Windows-based applications, you may need a more powerful environment to
run EliteView along with other applications. Otherwise, you may not be able to take advantage of EliteView’s
full range of management capabilities. Advanced system requirements include:
• Personal computer with a Pentium-133 processor (or higher)
• Local hard disk with a minimum of 40 MB free disk space
• SVGA color monitor with accelerated video adapter
• Minimum 32 MB of memory (RAM)
Note: Although EliteView uses about 20 MB of disk space, additional disk space is required for
user files.
Using SETUP to Install EliteView
The SETUP program will install EliteView from the distribution CD-ROM. This program decompresses
files and copies them to a location you specify on your hard disk.
To Start SETUP:
1. Start Windows.
2. Insert the EliteView installation CD-ROM in your drive.
3. From the Program Manager, choose File menu and select Run.
4. Type D:SETUP in the dialog box.
5. Click on OK to start SETUP.
6. Follow the on-screen instructions to install the software.
7. Follow the instructions to setup the network interface.
2-2
Page 19

CHAPTER 3
GETTING STARTED
Welcome to the EliteView network management program for Microsoft Windows. EliteView is a
powerful network management product that provides detailed device management functions,
along with a sophisticated graphic interface. The complete package is marketed as EliteView,
which includes the main EliteView program and over twenty core program modules. This chapter
provides an overview of the structure, and explains how the various EliteView modules are related.
Overview
EliteView is a flexible network management system based on international and industry standards.
It is a Windows-based program that runs on an inexpensive PC platform. This full-featured network
management software allows management of SMC or third-party network devices. In addition, it
supports an open platform for the development of any kind of management application.
EliteView can manage various SMC network devices
and examine the management information base in
third-party devices.
EZ Stack 10
TigerSwitch 100
Network Interface
EliteView can function on various network protocol
stacks for greater flexibility and efficiency. In the
Windows environment, EliteView can be configured to run on a Windows TCP/IP package with a
standard WINSOCKET interface. At the application level, network devices are managed via SNMP
over IP or IPX.
TigerSwitch 8
TigerStack II
EliteView
Event-Driven, Modular Architecture
Designed around an event-driven, multi-tasking architecture, EliteView consists of the main
program and supplementary modules. Each module works independently or in conjunction with
other modules. Running any module is as easy as invoking it from the main EliteView program, or
by simply double-clicking on the corresponding icon from the EliteView program group.
Network
Management Station
3rd Party
IP/IPX/Ethernet Node
3rd Party
SNMP Node
3-1
Page 20

GETTING STARTED
EliteView Modules
EliteView includes support for many SMC products, including the EZ Stack, TigerStack, and
TigerSwitch, series. This section briefly describes the basic support modules included in EliteView.
The modules for specific SMC products are described in the on-line help files.
Alive Test
This module tests the connection to any network node with ICMP messages. It sends an echo
request to the specified network node and gathers replies to determine device existence, round
trip delay time, and the ratio of successfully returned packets.
BOOTP Server
The BOOTP Server maintains a database of network addresses and a list of corresponding boot
files. BOOTP protocol runs on the UDP/IP stack. It is used by network devices to find out their
own IP address and the device initialization file(s) to download.
Discovery
This module is used to automatically detect active devices on the network by polling within a
specified network address range or community. Discovery sends commands out to the network
and waits for responses. When a device responds, EliteView queries its functionality. If it
responds correctly, a corresponding bitmap icon is added to the Discovery window.
EliteView Main Program
The main EliteView program provides the primary interface to all EliteView modules. The Tools
and Utilities menus provide access to nearly every module under EliteView. The main program
also provides all the tools you need to generate a detailed map of your network via menus and
tool buttons. Moreover, it supports MDI (Multiple Document Interface) which allows you to
simultaneously manage several submaps. After locating the required device on your map, simply
double-click on it to invoke the relevant management application.
3-2
Event Manager
This module serves as the management center for all events generated under the main EliteView
program, Log Manager and Trap Manager. In response to input from these modules, the Event
Manager can define and dispatch responses in various forms. Actions may range from sounding
an audible signal, displaying an on-screen message, logging the event into the report window,
running a user-specified program such as a beeper, fax, pager, email, etc. or logging the event
into a database for later analysis.
Log Utilities
The Log Manager can collect the current value of SNMP MIB variables at a specified interval. A
wide range of parameters on device status and network traffic can be sampled for selected nodes
and stored in the database for long-term analysis. This information is displayed with the Log
Database Manager in numeric form (including date, time and data).
Page 21

GETTING STARTED
MIB Browser
This module is a generic SNMP management tool used to browse device MIBs. By browsing MIBs, you
can send commands to get or set information defined in the MIB. Y ou can also set up profiles which are
used to fetch or set selected MIB variables as a group.
Information to be recorded into the Log Manager can be selected directly from the MIB. Moreov er, the MIB
Browser also provides a convenient editing tool which can be used to quickly extract information from the
MIB and store it for future reference or prepare it as a technical report.
MIB Compiler
This application compiles textual MIB files into database files specifically formatted for EliteView , which
allows relevant EliteView modules to access required information.
MIB-2 Viewer
This module provides an easy-to-use windowed interface to the MIB II (RFC 1213) management
information database. MIB II is maintained by each device that includes a resident SNMP agent. The
traditional approach displays information directly from the MIB , which requires a good understanding of
the overall hierarchial tree structure to locate the variables you need. The MIB-2 Viewer, on the other hand,
organizes this information in a set of commonly referenced items which are displayed in a convenient and
easily understood format.
Name Database Manager
This module provides a convenient means to map an easily remembered mnemonic name to each device in
the network. These names are then used in many other EliteView modules, which allows you to
conveniently specify any network device or view data using the name associated with each device.
Report
This module displays any system events or user-defined events specified in the Event Manager. The Report
window shows all network alarm messages in chronological order. Each entry is stamped with a time and
date.
RMON Manager
Remote Network Monitoring allows you to instruct a remote device to collect information or respond to
specified events on an independent basis. An RMON-capable device can independently perform a wide
range of tasks, significantly reducing network management traffic. It can continuously run diagnostics and
log network performance. If an event is triggered, the remote device can automatically notify the network
administrator of a failure and provide historical information about the event. If the remote device cannot
connect to the management agent, it will continue to perform any specified tasks and pass data back to the
management station the next time it contacts the remote device.
3-3
Page 22
GETTING STARTED
TFTP Server
This module is used to download agent software to the requesting device. It can be used to
download software to any EZ Stack, TigerStack, and TigerSwitch management module. For all
other SMC devices, downloading is performed via out-of-band mode. The TFTP server is also
used to perform file transfers between any two stations running EliteView.
Trap Manager
Trap Manager has no tangible user interface. It is only used to pass events to the Event
Manager. This module receives trap messages and converts them into events. By default, the
Trap Manager generates a “Trap” event and outputs a text message to the Event Manager
according to the pattern specified in TRAP.INI. These events are then handled according to the
options selected in the Event Manager.
Network Device Management Modules
Each of these modules supports advanced management functions for the corresponding
device. On-line help is provided for each of these devices. EliteView currently includes device
management modules for the EZ Stack, TigerStack and TigerSwitch series.
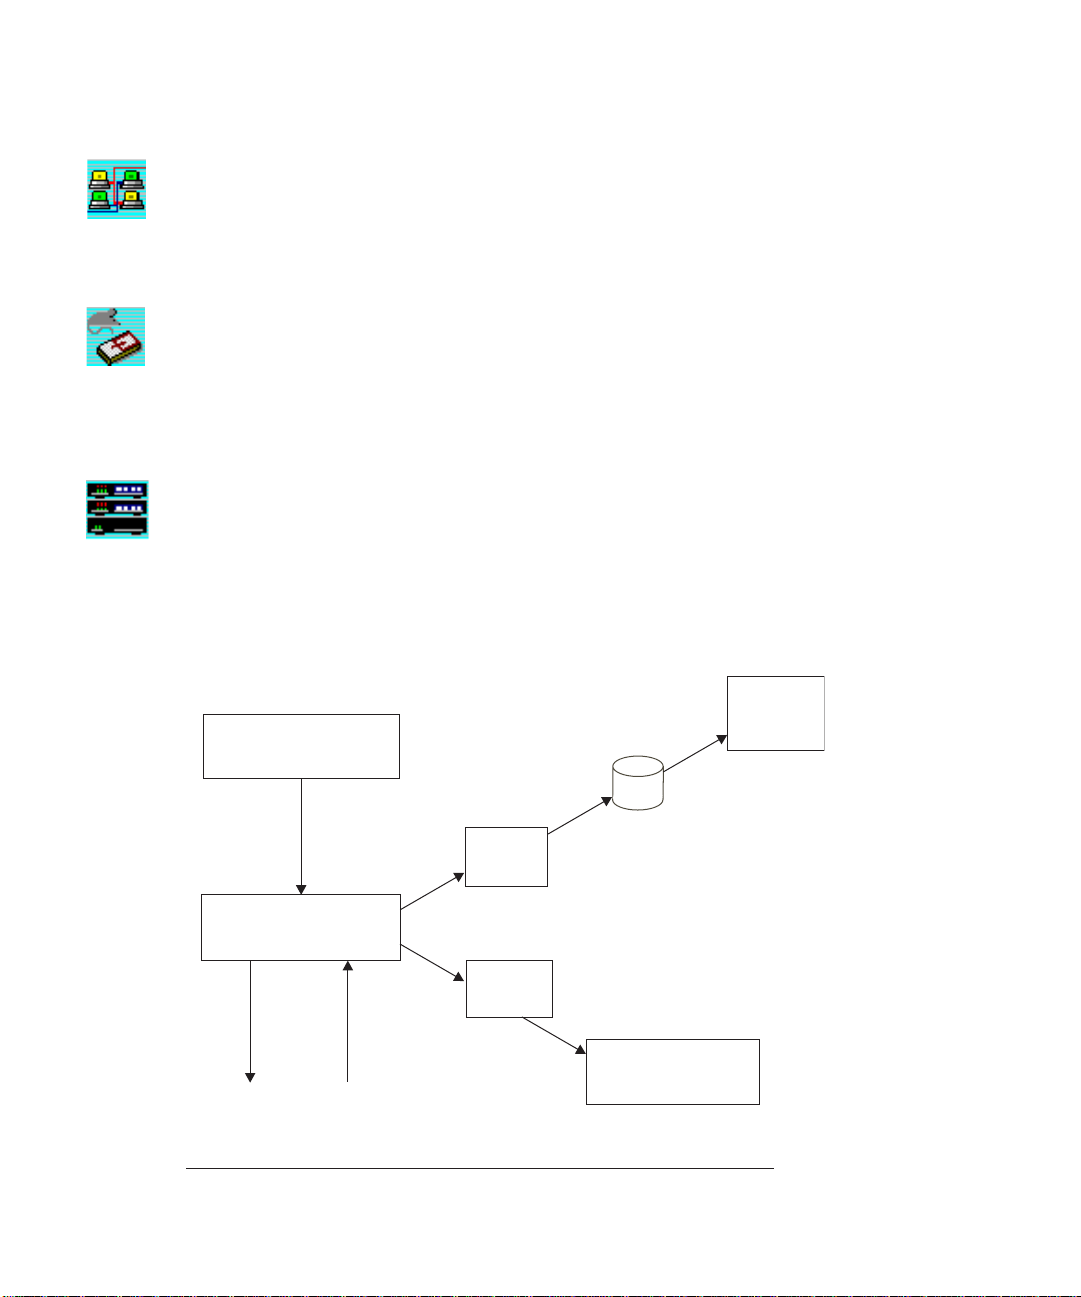
Data Logging and Event Management
The Log Manager and Event Manager modules play a key role in network management. The
following diagrams depict how they work.
3-4
Log Data
Manager
EliteView Application
Database
Filter
Log Manager
Threshold
send request
Trigger Event
get reply
network
Page 23
GETTING STARTED
The Log Manager periodically sends requests to target devices according to a fixed polling interval.
The target device receives the requests and send replies to the Log Manager.
The Log Manager then processes data in two different ways:
• Data passes through the filter you set; it may be saved in the database depending on the condition
specified in the filter.
• Data is checked against a threshold formula. If conditions are satisfied, the Log Manager automatically triggers the event associated with the log process.
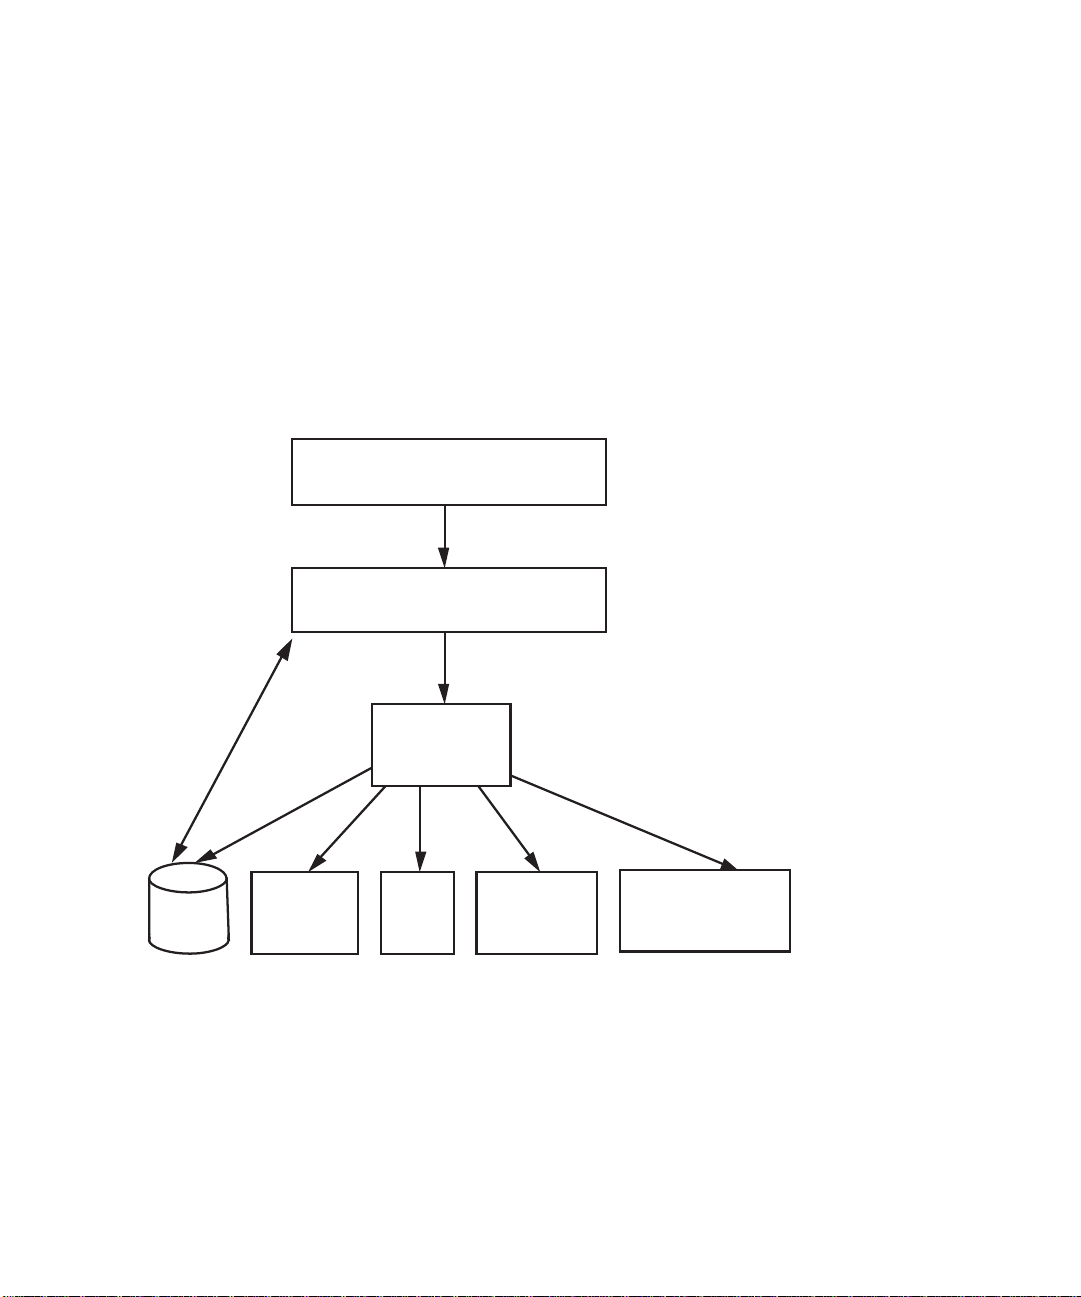
How the Event Manager Works
EliteView Application
trigger event
Event Manager
database
management
Run
Program
Action
Beep
Message Box
Display Message
in Report Window
The Event Manager receives input from EliteView applications such as the main EliteView program,
the Log Manager and the Trap Manager. Any named event may be triggered simply by satisfying the
user-defined threshold formula. Any triggered event is passed on to the Event Manager, which
activates the proper response, such as running a program, sounding an audible alarm, displaying a
message on screen, displaying a message in the Report window, or writing to the event database.
3-5
Page 24
GETTING STARTED
Starting EliteView
The main EliteView program provides an
intuitive interface to other program modules.
You can invoke specific management
applications (by clicking on the appropriate
device icon in the network map), verify current
network connections with Discovery, check
device response (via broadcast/search) with the
Alive Test, or fetch information about selected
devices using the MIB Browser.
Each module is closely integrated with the main EliteView program, and can be quickly invoked by
selecting the required function from the Utilities menus. For certain device-specific applications, first
select a target device from the network map and then select the required function from the Tools
menu. The overall relationship between the main EliteView program and its submodules is depicted
below.
Using the Main EliteView Program
To invoke the main EliteView program click on the EliteView icon. Many functions under the main
program provide support for network mapping. These functions include most of the toolbar
buttons, along with the File, Edit and Windows menus. Network mapping is described in the next
chapter, Defining the Network Configuration. After you map out your network, you will want to use
the other functions listed below.
EZ Stack 10
Alive Test
Bootp Server
TFTP Server
Discovery
Telnet
The menu items and tool buttons used on a regular basis are described below. The items used to
construct and maintain your network map are described in the next chapter.
TigerStack II
EliteView
Platform
TigerSwitch 8
TigerSwitch 100
Log Manager
Log Database
Event Manager
Trap Manager
MIB Browser
MIB-2 Viewer
Report
3-6
Page 25
Menu Label Description
(not shown here)
(not shown here)
GETTING STARTED
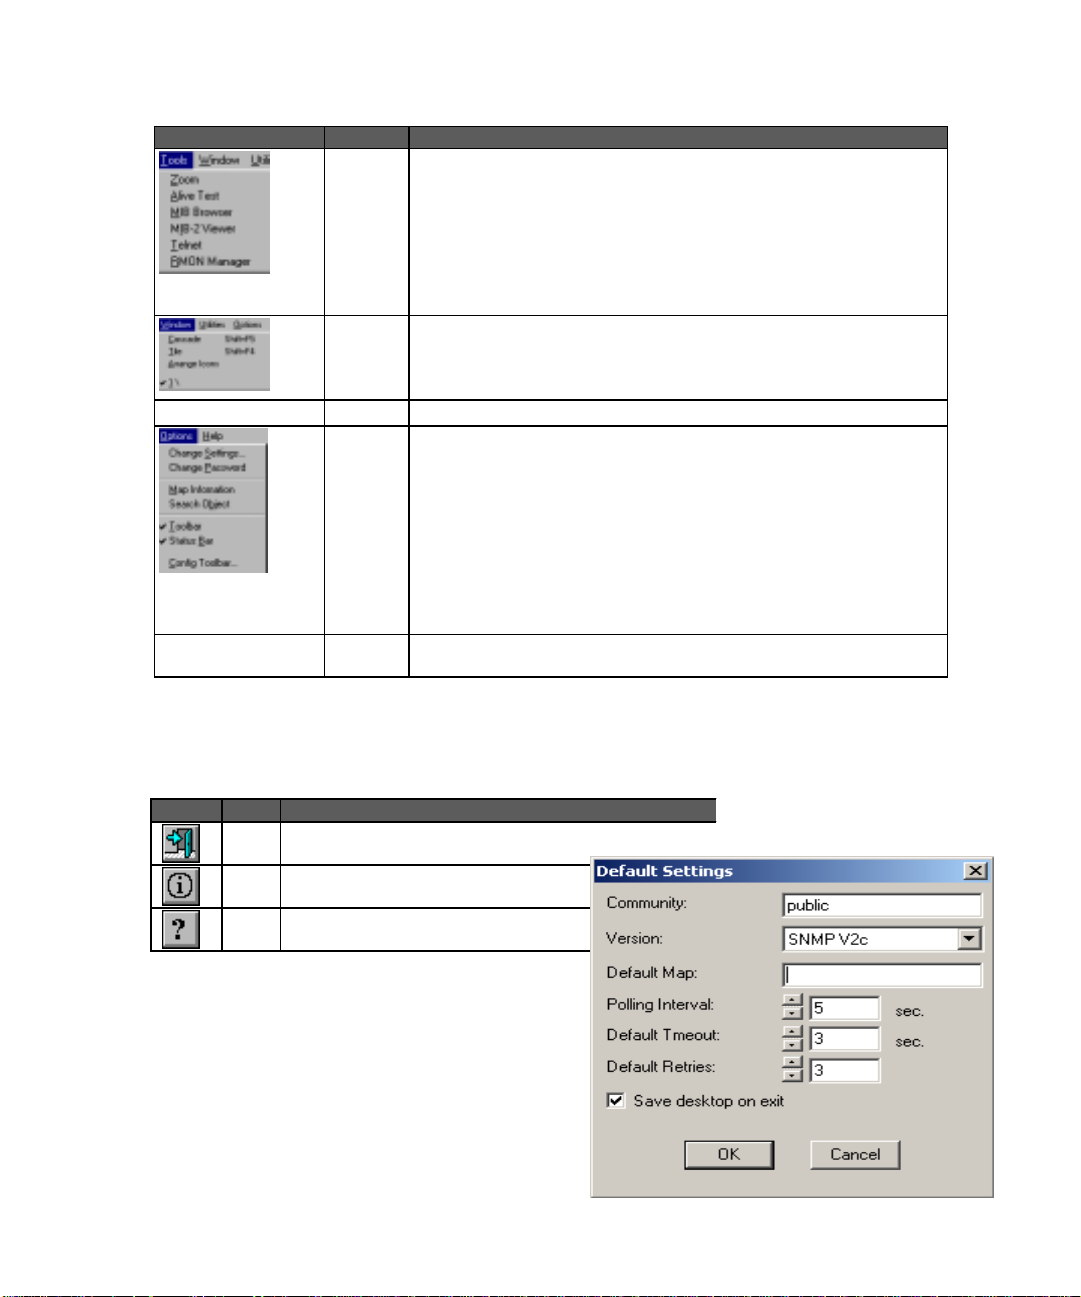
Tools Zoom - Opens the management module for the selected device.
Alive Test - Opens the Alive Test for the selected device.
MIB Browser - Opens the MIB Browser for the selected device.
MIB-2 Viewer - Opens the MIB-2 Viewer for the selected device.
Telnet - Opens a connection to another computer on the network through
which you can execute programs or access data as though attached locally.
RMON Manager - Provides access to to all nine RMON groups for recent SMC
products that support RMON.
Window Cascade - Arranges all open EliteView windows in cacaded fashion.
Tile - Arranges all curretly open EliteView windows in tiled fashion.
Arrange Icons - Arranges all EliteView icons on the screen.
select window - Switches to the selected EliteView window.
Utilities Accesses most EliteView modules.
Options Change Settings - Allows you to define the default map, SNMP community,
polling interval, default timeout, default retries, and whether or not to save the
desktop when EliteView is closed.
Change Password - Changes the password required to display the map.
Map Information - Displays all user-defined parameters for each device
included in the current map.
Search Object - Searches for a network device by address or label (the later of
which must be defined in the network map).
Toolbar & Status Bar - toggle buttons to display or hide these items.
Config Toolbar - Utility used to specify toolbar layout.
floating By clicking anywhere in the background of the EliteView program you can open
a menu that includes various functions relevant to the current module.
Many of the items included in the menu bar are also provided in the toolbar. The following table describes a
few of the buttons found in the main EliteView program. The other buttons, which are used for creating
network maps, are described in the following chapter.
Button Label Description
Shuts down the main EliteView program and all subordinate
Exit
modules.
About Displays the version number for this module.
Help Provides on-line help for this module.
Configuring Polling Parameters
Before directly accessing devices from the network
map, y ou should specify the default settings. These
defaults are provided as a convenience for you, and are
used by both the Add Object command and the
device management modules. Open the Default
Settings dialog box by selecting Change Settings from
the Options menu. Set an SNMP
3-7
Page 26
GETTING STARTED
community name and polling parameters which are applicable for your particular network environment.
Depending on your current configuration, you may need to provide any of the following information.
1. Define a Community describing the administrative relationship between SNMP entities.
2. Specify Version; SNMPv1 or SNMPv2c.
3. Specify the Polling Interval between sending requests, the Default Timeout to wait for a response, and
number of Default Retries to make contact. The settings displayed here
(i.e., 5, 3, 3) should be suitable for most environments.
Status Bar
The Status Bar serves two basic functions. It displays the status of any currently executing command, and
indicates the function of selected toolbar buttons. T o display the description for any toolbar button (in the
status bar at the bottom of the screen), position your mouse over the toolbar button, and hold down the left
mouse button. After viewing the description, slide your mouse off the interface button (without releasing the
mouse button). Note that descriptions for toolbar buttons are also provided in relevant sections throughout
this manual.
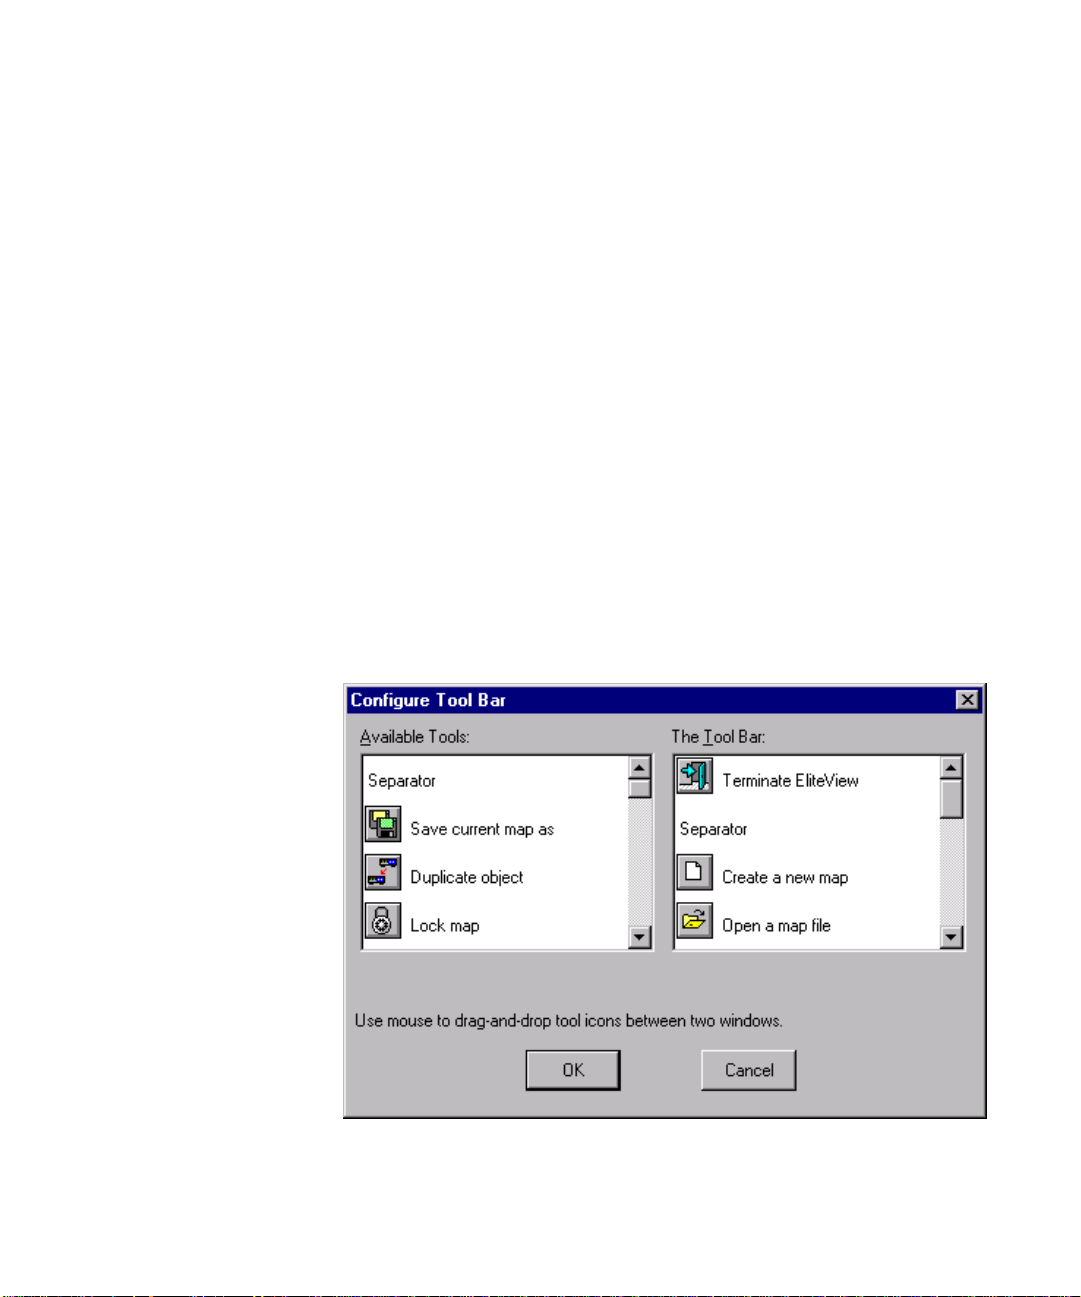
Configuring the Toolbar
The main program and other modules include an option that allows you to modify the toolbar layout to suit
your specific needs. Simply drag the icons you want from the Available Tools list into the required position in
the Tool Bar list.
Select any object from the
Available Tools list on
the left and drag it into
position in the Tool Bar
layout on the right.
3-8
Page 27
CHAPTER 4
DEFINING THE NETWORK CONFIGURATION
Before running any EliteView device management tools, first define the device interconnection
hierarchy, network addresses, and mnemonic names for each network node. If you don’t already
have this information mapped out, then use Discovery to help identify each device in your
network. This technique may also be used periodically to incorporate changes in the network
configuration.
After identifying the basic network configuration, use the Name Database Manager to assign
easily remembered names to each network device. And finally, in the last step, create a detailed
network map including all intermediate network hierarchy and subordinate devices. This map can
then be used to quickly open relevant device management tools by simply double-clicking on a
map object.
All the tools and techniques required to define your network configuration are described in this
chapter.
Quick Guide to Map Building
The simplest approach to creating a network map is listed below:
1. Use Discovery to locate network devices.
2. Move selected objects from Discovery onto the map by either of
the following methods -
• Drag objects directly onto the appropriate map.
• Use the Get Objects command to fetch objects based on
protocol type from the queue of discovered devices.
3. Use the Add Object command to define additional symbolic objects, such as a LAN Segment or Submap.
4. Draw in network connections using the toolbar in the EliteView
Platform program.
5. Save your map under an appropriate filename.
Command Menu
Discovery
Add Object(s) to
Name Database
Get Objects
Add Object
Modify Object
Draw Network
Connection
Save Map As
Utilities
Edit
Edit
Edit
File
4-1
Page 28
DEFINING THE NETWORK CONFIGURATION
Discovery
EliteView can automatically discover any device using a specified protocol (i.e., SNMP over
UDP/IP or IPX) by polling within a specified network community or address range.
EliteView’s Discovery module sends commands out to the network and waits for responses. Devices
are classified based on whether or not they have a resident SNMP agent. When a device responds,
EliteView queries for SNMP functionality. If a device has no resident SNMP agent, EliteView adds a
generic bitmap (to the window for discovered devices) based on protocol type. However, if a
device has an agent then EliteView tries to identify the device type. If the device is recognized, it
adds an object icon based on device type, otherwise it adds a generic bitmap to indicate that the
object has an SNMP agent and to show the associated protocol type.
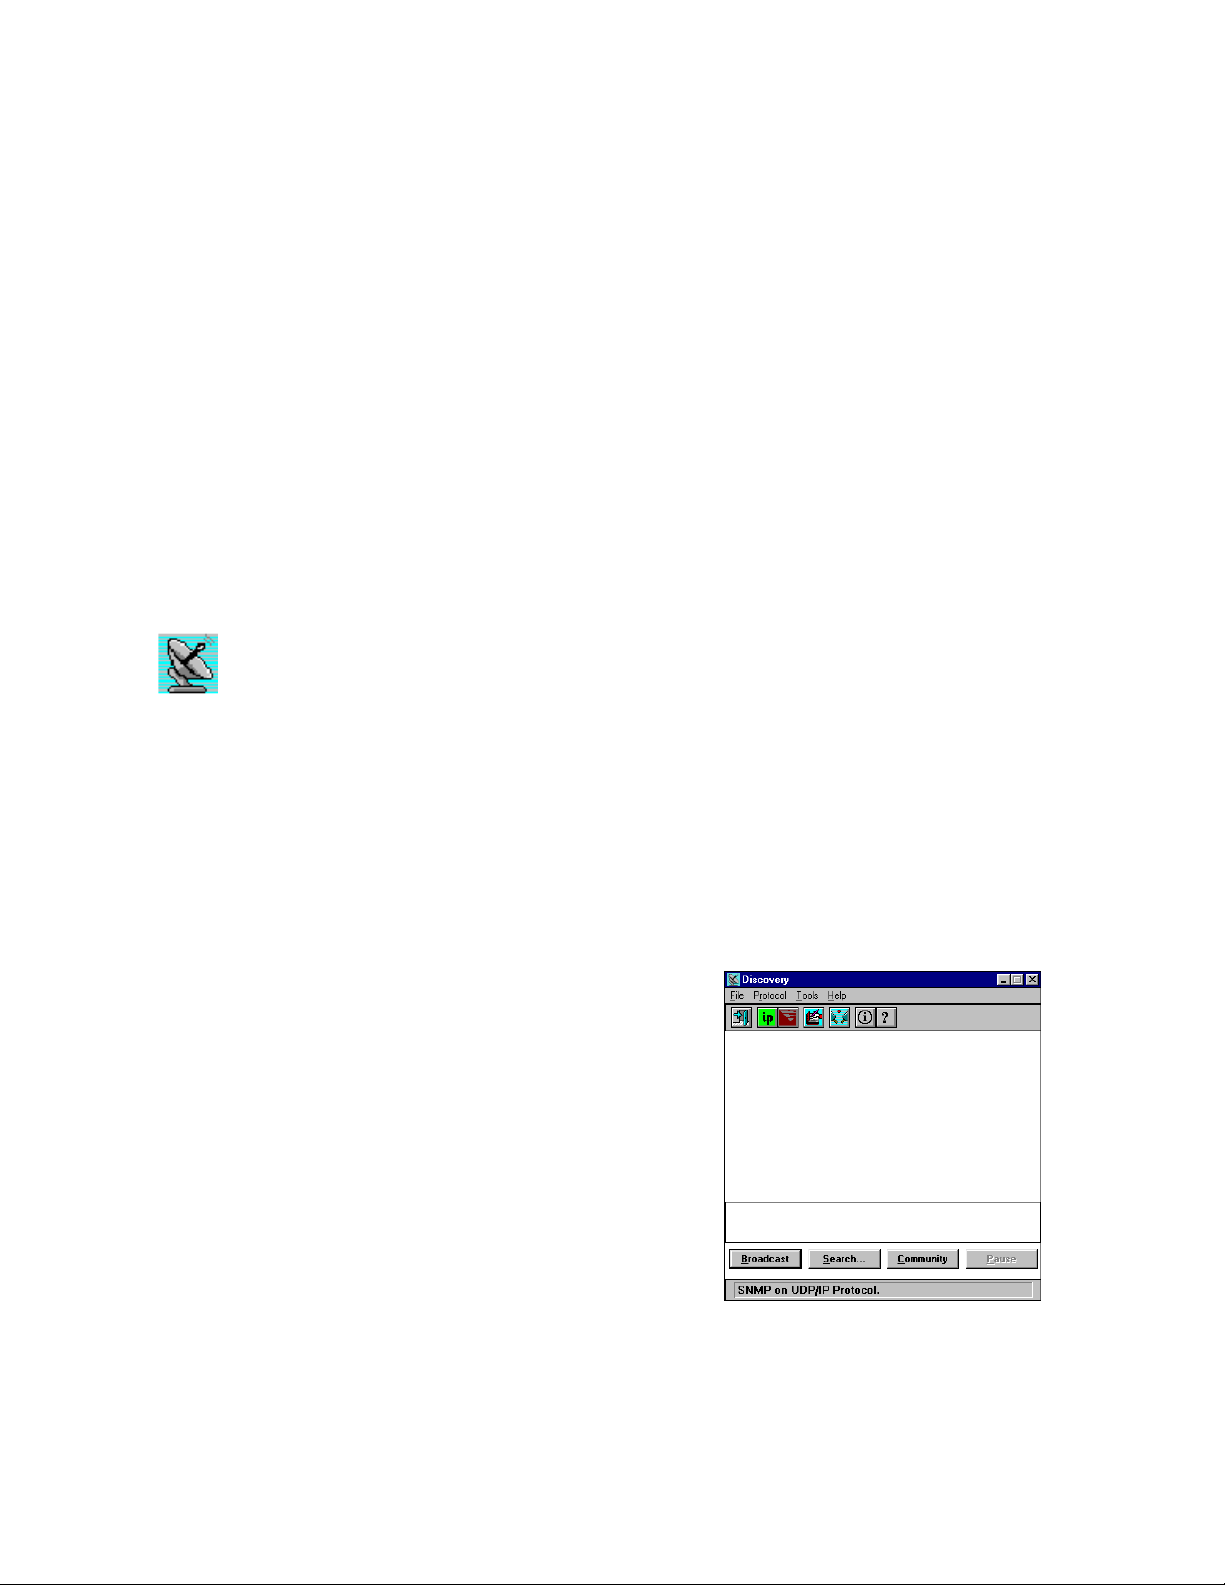
Using Discovery
Use Discovery to build your initial network map or to locate a specific device. After you have
located the concerned devices, drag them onto a network map where they can be used to
conveniently monitor your network.
You can select Discovery from the Utilities menu in the main EliteView program, or activate it by
clicking on the Discovery icon in the EliteView program group. Specify the required protocol and
then use Broadcast or Search to locate attached devices.
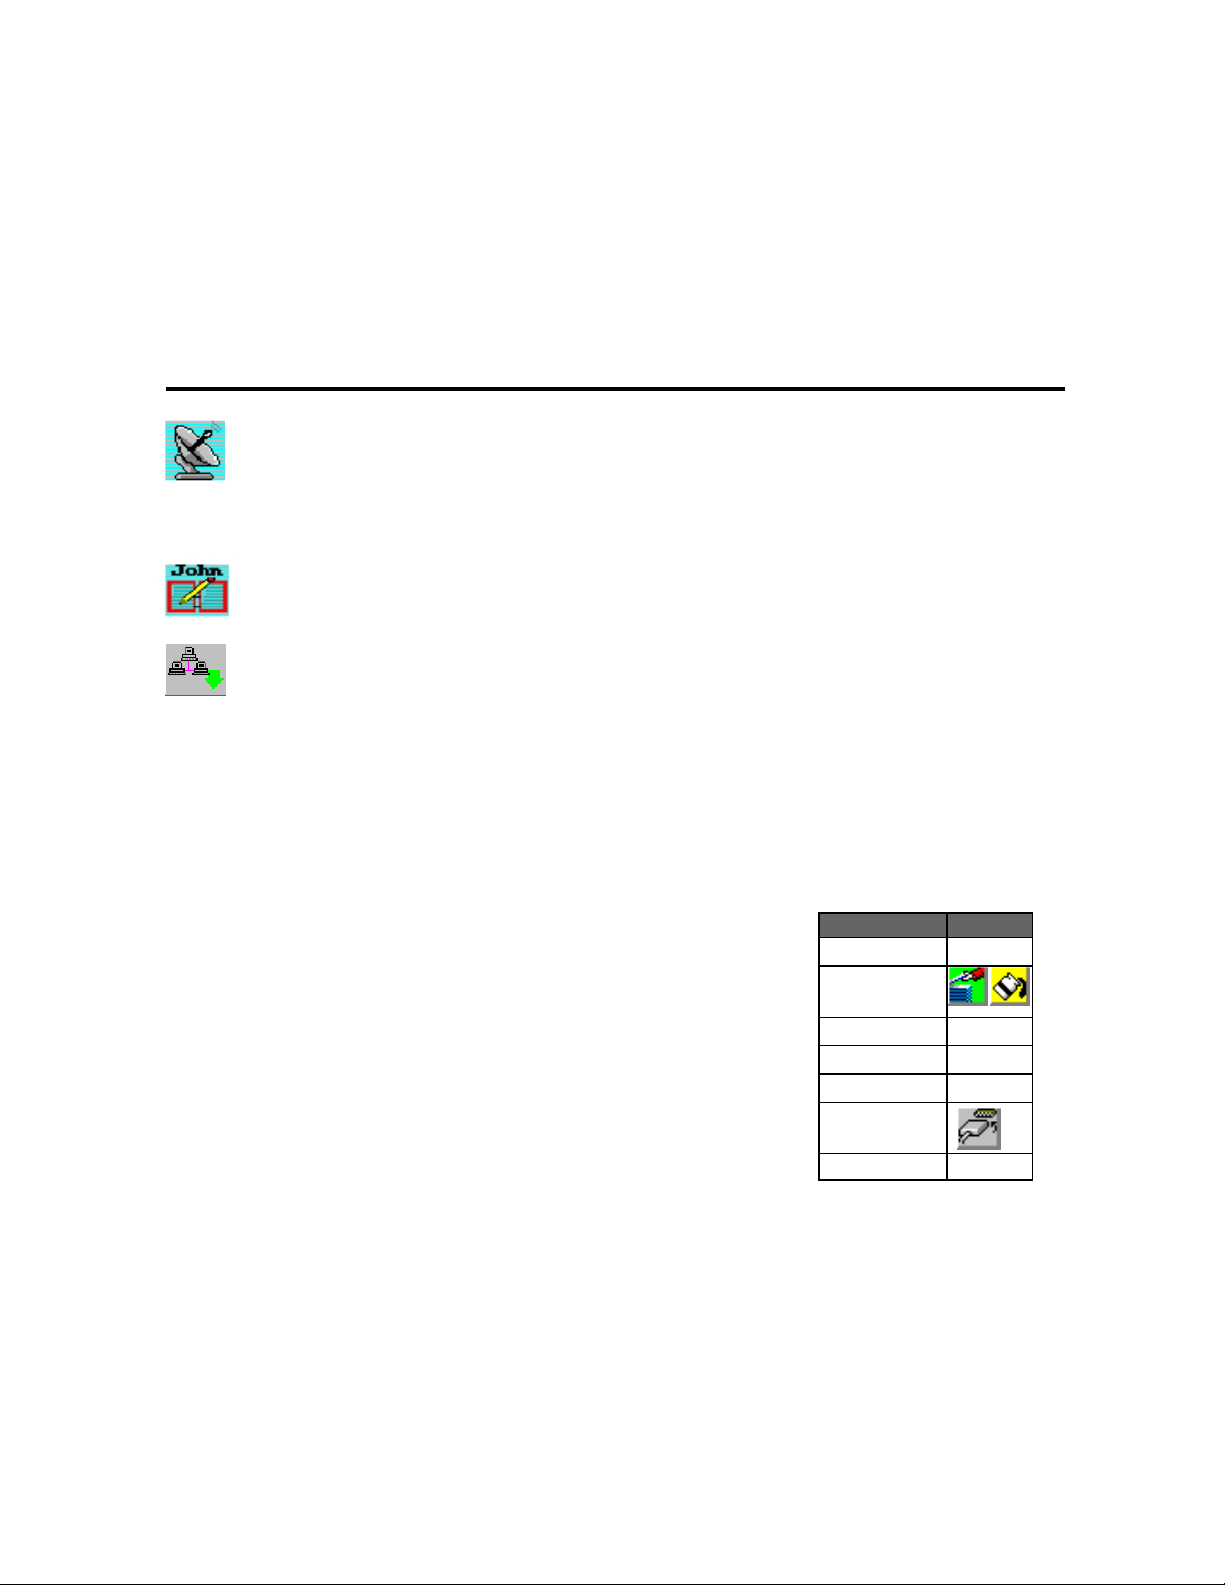
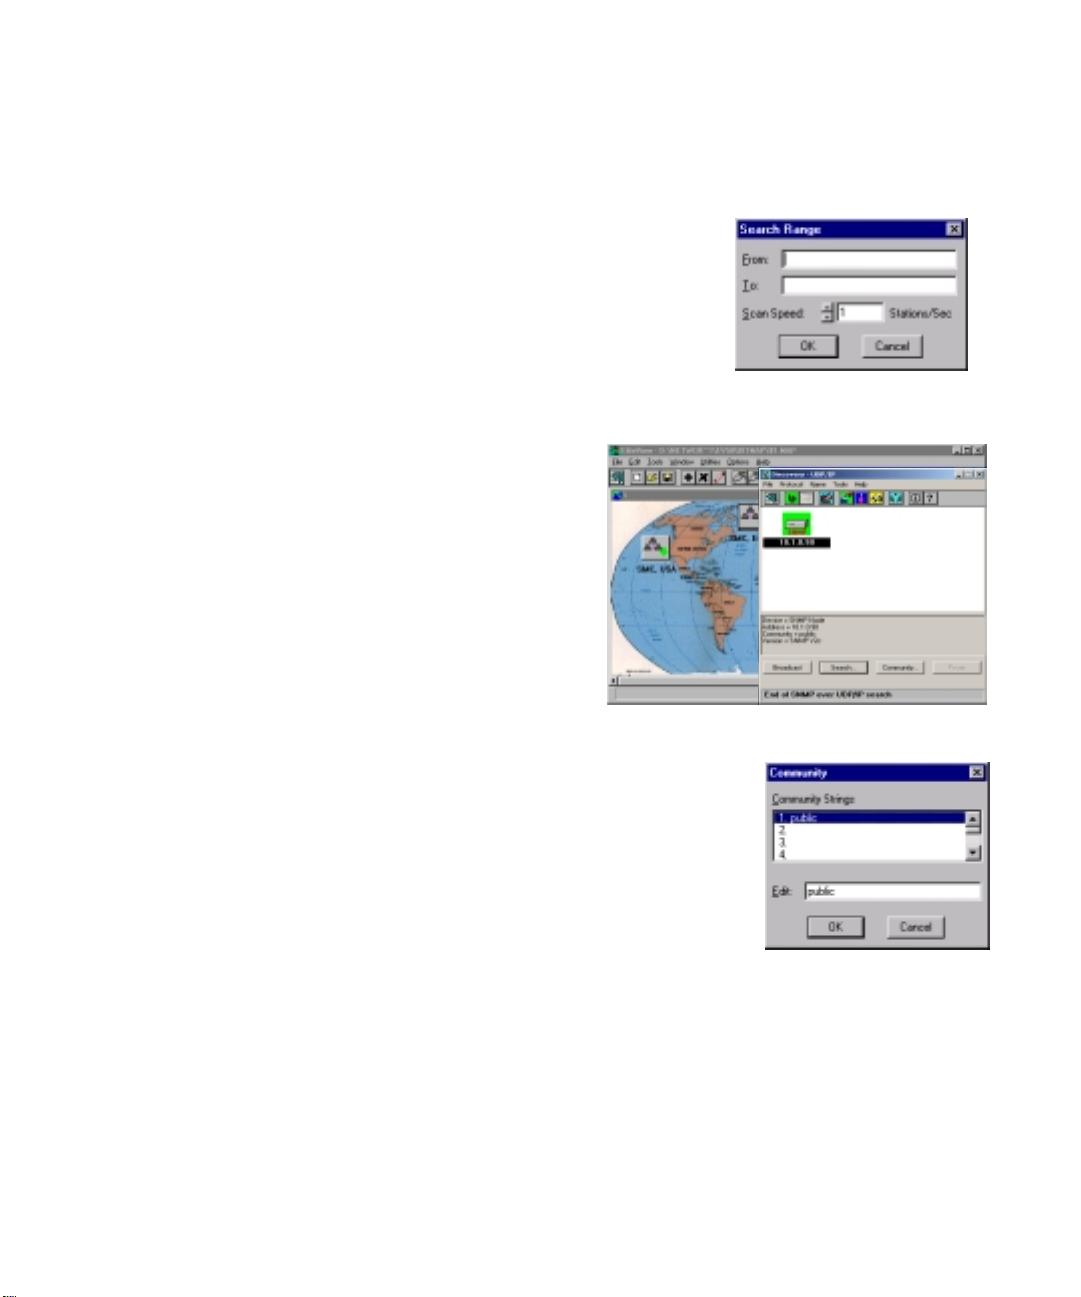
Using Discovery, EliteView can automatically identify responding devices and label them with the
correct address (based on the selected protocol). This
indicates the status of current network connections, and also
serves to validate the accessiblity of devices for subsequent
management. Once a device has been found, simply drag it
onto a map and then initiate the relevant management
module by clicking on the device icon.
When looking for devices using broadcast, you may need to
press the Broadcast button several times to ensure that all
attached devices have responded. For nodes that do not
respond to broadcast queries, use the Search function. In
general, it may be necessary to search for devices not
located in the same network with the EliteView
management station.
1) Select the appropriate network protocol.
2) Broadcast or Search for attached devices.
3) And drag key devices onto the
configuration map for later use.
4-2
Page 29
DEFINING THE NETWORK CONFIGURATION
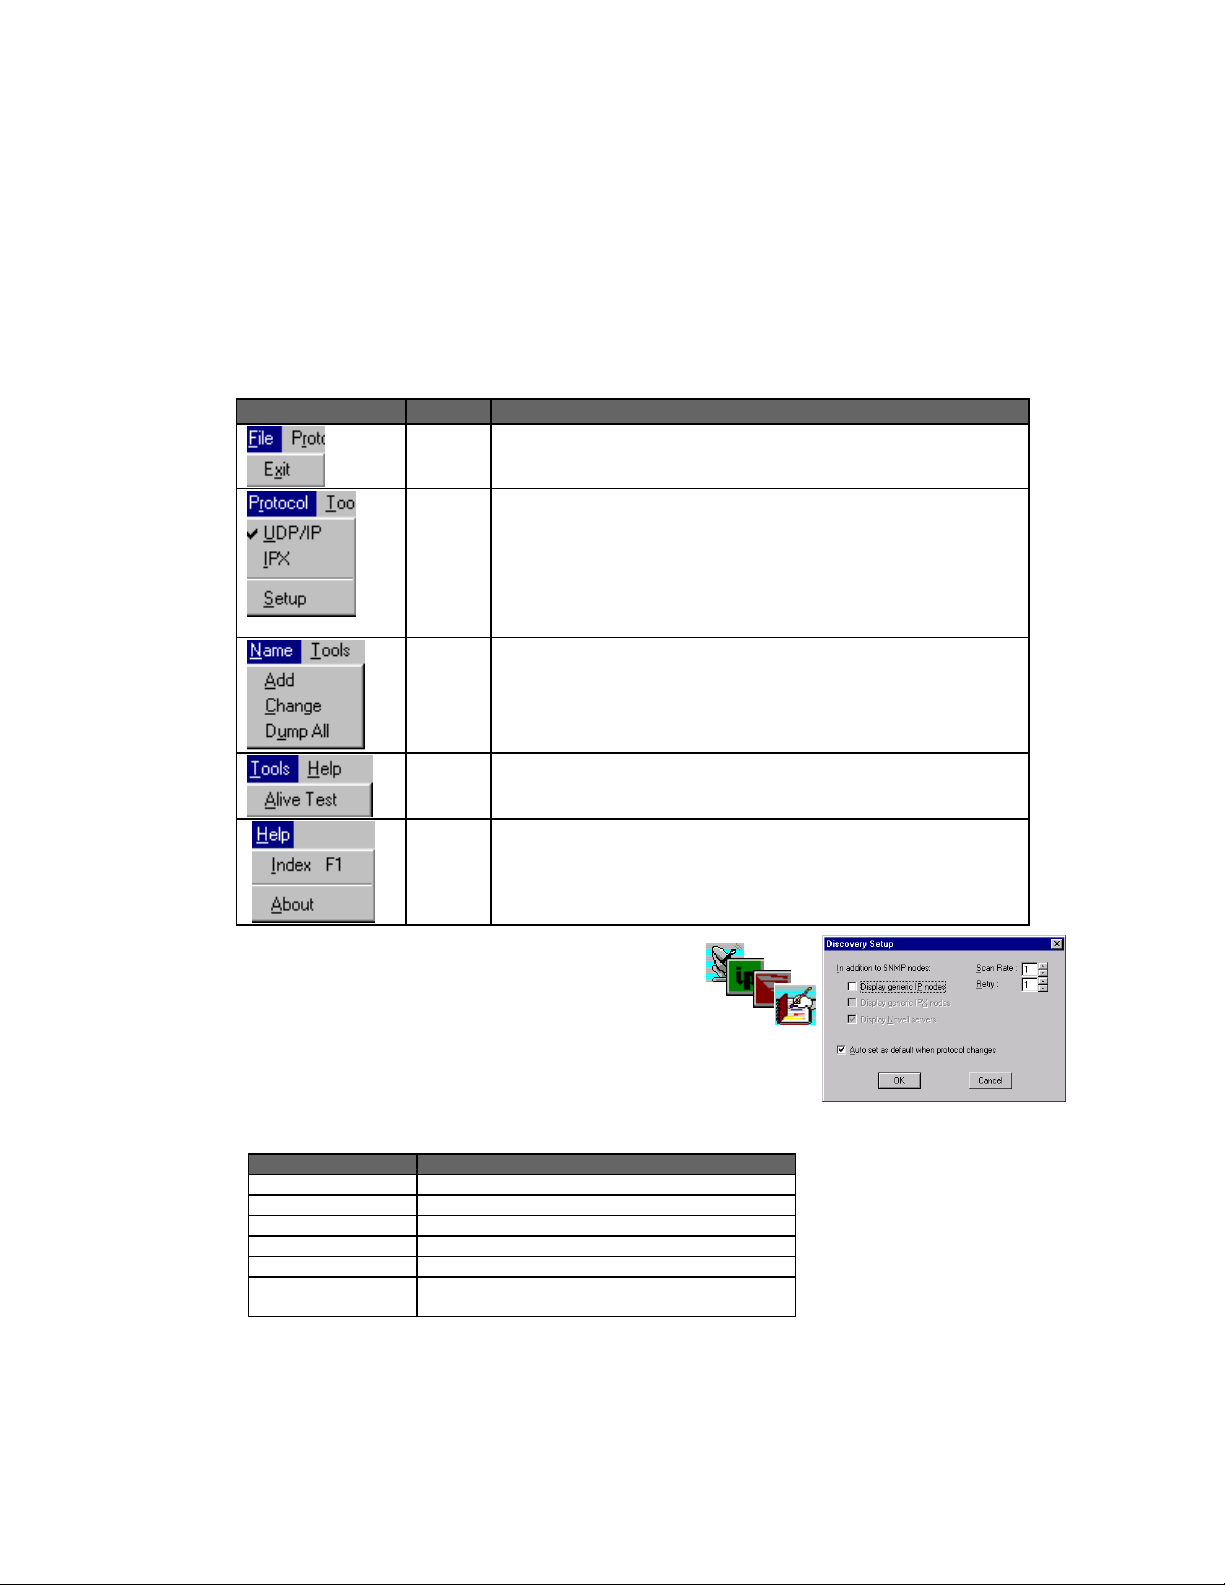
Menu Description
The menus provided for Discovery are briefly introduced below. Toolbar buttons are also described
in this section.
Menu Definitions
Menu Label Description
File Exit current module - Closes the Discovery window and exits to the
calling program (i.e., EliteView platform or Windows Program Manager).
Protocol
Protocol selection and advanced settings
Select the devices to display based on network prototocol -
UDP/IP - IP & ICMP, SNMP over UDP/IP agent
IPX - IPX, SNMP over IPX agent
Setup menu - Toggles display of devices without an SNMP agent; also
sets the scan rate and retry count.
Name Name database management - Provides editing functions for the
name database, including adding or modifiying object data. You can
also dump all the information gathered by Discovery into the Name
database.
Tools
Alive Test - The Alive Test is used to directly test device response.
Help Help and Version information - Provides detailed on-line help and
displays the version number for this software module.
To automatically discover devices:
1. From the Edit menu, choose Discovery.
2. Choose the appropriate network protocol.
3. If you need to change the search criteria for devices, open the Setup
dialog box using the toolbar.
Field Description for Discovery Setup Menu
Field Description
Display IP Node Display IP Nodes without an SNMP agent.
Display IPX Node Display IPX Nodes without an SNMP agent.
Display Novell Server Display Novell Servers.
Scan Rate The scan rate between broadcast requests.
Retry The number of times to query for device response.
Auto Set as default when
Protocol changes
Save the current setup as default when restarting
Discovery.
For TCP/IP Nodes -
1) Broadcast within same network.
2) Search for nodes across routers.
3) Many IP nodes without SNMP can
respond to ICMP queries.
For IPX Nodes -
1) Broadcast is sufficient.
2) Search is not available.
3) NetWare Servers use IPX protocol.
4-3
Page 30
DEFINING THE NETWORK CONFIGURATION
4. Click on Broadcast to transmit a query message and wait for responses from the local network. Broadcast is
also adequate for gathering global responses from IPX or Ethernet nodes located on different networks.
However, to find IP nodes on other networks, use the Search command
and provide a specific address range. If you are only interested in a
specific range of stations or need to search for stations that are difficult to
reach, then click on the Search button, specify the address range, and
adjust the scan rate if required. Discovery will search for devices within
the specified range.
5. The status line at the bottom of the Discovery window shows the status
of the search. To temporarily halt the process, press the Pause button;
press Resume to continue.
6. The message End of Search will appear when the discovery
process is completed.
7. Move selected objects from Discovery onto the map
by either of the following methods -
• Drag objects directly onto the appropriate map.
• Use the Get Objects command (under the Edit
menu) to fetch objects based on protocol type
from the queue of discovered devices.
8. Draw in the existing connections and save the
updated map. (Refer to Creating Network Maps for
detailed information on building a network map.)
Adding Community Strings to Discovery
Insert access control string for authorised
community members
Discovery will search for devices within the specified communities.
To include any communities other than “public,” add the appropriate
name to the Community dialog box. You can include all the
communities defined for your network in a broadcast or search
command. However, be aware that a blind search creates excess traffic.
Using a more conservative search will have less impact on network
performance.
To automatically discover devices in a community:
1. Click on Community to display a list of community strings.
2. To add or modify a community string, click on an entry in the list and edit the entry in the Edit field. Click OK
to continue or Cancel to abandon the new entry.
3. Click on Broadcast to begin searching for devices.
4-4
Page 31

DEFINING THE NETWORK CONFIGURATION
Exiting Discovery
To close this module,
1. From the File menu, choose Exit.
2. The Discovery program will be closed.
Name Database Manager
Device names assigned with the Name Database Manager are used
in many other EliteView modules to help you readily select or
identify network devices. The Name Database Manager can be
opened from the Utilities menu under the main EliteView program, or directly from the EliteView
group window by double-clicking on the icon shown here.
Also refer to the discussion on Updating the Name Database under the section on Discovery.
You can store information about network devices in the name database, including a name, network
address, physical address, network protocol, device type, and informal notes. For normal
maintenance, we recommend updating this information via Discovery. However, when you need to
view the entire database, you can use the Name Database Manager.
All items included in the menu bar (under the File, Control and Help menus) are also provided in
the toolbar. This table describes the basic editing tools.
Adding a New Entry
Click on the Add Record button to open this dialog box. Enter a suitable menmonic name, the
network address (i.e. UDP/IP or IPX), the physical device address, the network protocol
(i.e. IP or IPX), the functional device type, and any informal notes. Rememeber to indicate specific
device types for SMC network devices and generic designations for all other network devices. (Also
note that the Get MAC function is only
enabled for the UDP/IP protocol under
Windows 98, Windows NT 4.0 Service
Pack 4 or later, and Windows 2000.)
Deleting Device Entries
Use your mouse to highlight the
entries you want to delete and press
the delete button. (Note that the same
conventions are followed for selecting
multiple items as those used by the
Windows File Manager.)
4-5
Page 32

DEFINING THE NETWORK CONFIGURATION
Updating Device Entries
Use your mouse to highlight
the entry you want to
update. Then change any of
fields in the dialog box as
described above under
Adding a New Entry. Note
that when device
information is dumped from
Discovery, the Name field is automatically filled in using the
network address. Therefore, you should update each entry to
include a meaningful name for these devices. You can do this
directly from Discovery, but it may be easier using the Name
Database Manager, where the entire list of devices is readily
availble for reference.
Button Label Description
Add
Record
Delete
Record
Update
Record
Search
Records
Searching for Device Entries
You can easily display all device entries that meet your specified
search criteria. Simply click on the Search button and fill in the
following parameters:
• Search Mode - ALL or MATCHED
Adds a new entry into the name database.
Deletes an entry from the name database.
Updates a current entry in the name database.
Searches for specified record(s) in the name database
• Sort Key - Device Type, MAC address, Name or Protocol
• Sort Order - Ascending or Decending
• Search Keys - Name, Address, MAC Address, Protocol and
Device type
If you select a search mode of ALL, then the search keys are
disabled and all entries in the name database will be displayed. If
you select MATCHED search mode, you should include the device
name, network address, physical MAC address, protocol type, or device type, or any combination of
these. Also remember that the search for device name is case sensitive.
Creating Network Maps
Network maps are like road maps, they visually depict the entire network hierarchy. Network
administrators use them to trace out the connections between various network devices, and to
quickly activate dedicated management tools for a selected device. These maps describe the status
of network devices, their physical location, and their logical organization. This section describes how
to create, maintain and use network maps.
4-6
Page 33

DEFINING THE NETWORK CONFIGURATION
You can organize
network maps using
any number of
hierarchial levels.
The main EliteView program is used as the primary interface to most of the EliteView modules.
However, this is also where you create and edit network maps. The following menus are used for
map functions.
Menu Description for Map Functions
Menu Label Description
File New Map - Initializes required parameters to create a new network map.
Open Map - Opens an existing network map.
Save Map - Saves the current map along with any changes.
Save Map As - Saves the current map under a new name.
Exit - Exits EliteView, closing all subordinate modules.
Edit Add Object - Adds a new object to the map based on a textual description.
Modify Object - Allows you to modify any parameters for a map object.
Delete Object - Deletes the selected map object.
Duplicate Object - Copies the selected object, after which you should
reposition it on the map and modify any required parameters.
Connect - Draws in a device connection from the currently selected object to
the next object you click on.
Disconnect - Removes a connection from the currently selected object to the
next object you click on.
Lock - Prevents any changes from being made to the current map.
Unlock - Allows changes to be made to the current map.
Background Bitmap - Selects a bitmap file to use for the map background.
Text - Allows you to edit text that will be displayed on the map.
Arrange Objects - Orders objects in the map according to your specifications.
Get Objects - Moves objects from queue of devices (found by Discovery) onto
the network map based on selected protocol type or network identifier.
4-7
Page 34

DEFINING THE NETWORK CONFIGURATION
Menu Label Description
Options Change Settings - Allows you to define the default map which will be
automatically displayed every time you open the main EliteView program.
Change Password - Changes password required to display the current map.
Map Information - Displays all user-defined parameters for each device
included in the current map by means of the Report Program.
Search Object - Locates specified object within map based on label or address.
Many of the items included in the menu bar are also provided in the toolbar. The following table
describes these basic tools.
For information on menu items
or buttons that appear under
Button Label Description
Add New Object Adds a new object to the current map.
Delete Object Deletes an object from the current map.
the main EliteView module but
are not described in this
section, refer to “Using the
Main EliteView Program” in the
preceeding chapter.
Modify Object Modifies the description for an object.
Connect Object Connects the selected object to
another object.
Disconnect
Object
Disconnects the selected object from
another object.
Editing Map Objects
The Edit menu provides all the tools you need to compose a full-scale hierachical map of your entire
network. You may add or modify object descriptions, draw in physical connections, specify a bitmap
to display as the background image for your map, edit any labels or legends required for the map,
and then lock it to prevent further modification.
Adding a Map Object
The best approach to adding a map object is to first locate the target device using Discovery, drag
the object onto your network map, and then enter the additional information using the Modify
Object function. However, you may also add a new object based entirely on the textual description
provided under the Add New Object dialog box.
1. Click on the Add New Object button (or press <Insert>).
2. Select an object type. Specific types are provided for SMC network devices. EZ Stack, TigerStack
and TigerSwitch devices are SMC products. For all other network entities, select the appropriate
generic device type as described below.
Device Type Description
IP Node
LAN Segment
SNMP Node
Submap
Any device connected via IP network protocol.
A network backbone (i.e., view-only object).
Any network device that supports general
SNMP/UDP/IP or functions.
A “hot link” to a submap.
4-8
Page 35

DEFINING THE NETWORK CONFIGURATION
3. Fill in the dialog box with the object attributes described below.
Field Definitions for the Add Object Dialog Box
Attribute Description Example
Label Enter up to 16 characters. This label appears below the device icon. Mktg001, Bldg1020,
Hub42.32
Address The network address of the device. Enter in IP, IPX or Ethernet address
notation, depending on selected protocol type, where
IP - internet address and IPX - network number : node number.
Community The community string used to access the device. This text string must match
the community string stored in the device. (An incorrect community string will
prevent access to the device.)
Protocol The network protocol of UDP/IP or IPX. UDP
Polling Interval The interval between polling (in seconds). Setting a low value (2 seconds or
less) will generate excessive network traffic and make EliteView seem very
slow and unresponsive. While a very high value will make EliteView
insensitive to changes in device status.
Timeout After sending an SNMP request, EliteView will wait for an appropriate
response (in seconds). If the device does not respond before the specified
Retries
Monitor If this box is checked, then it will be polled at the specified time interval. If
timeout, EliteView will assume that the device is no longer accessible.
When a device does not respond within the Retries limit, the device is
assumed to be off-line. The event “Connection Lost” is announced and the
icon turns red. EliteView will continue polling for responses (unless Monitor
is turned off, as described in the next parameter).
this box is not checked, then polling is disabled. Note that the resources of
the network management station may become overtaxed if you attempt to
monitor an excessively large number of stations.
IP: 192.72.24.05
IPX: 000ACC01:
000000000001
public
5
3 (values greater than
3 are supported, but
not recommended)
10
Yes (checked)
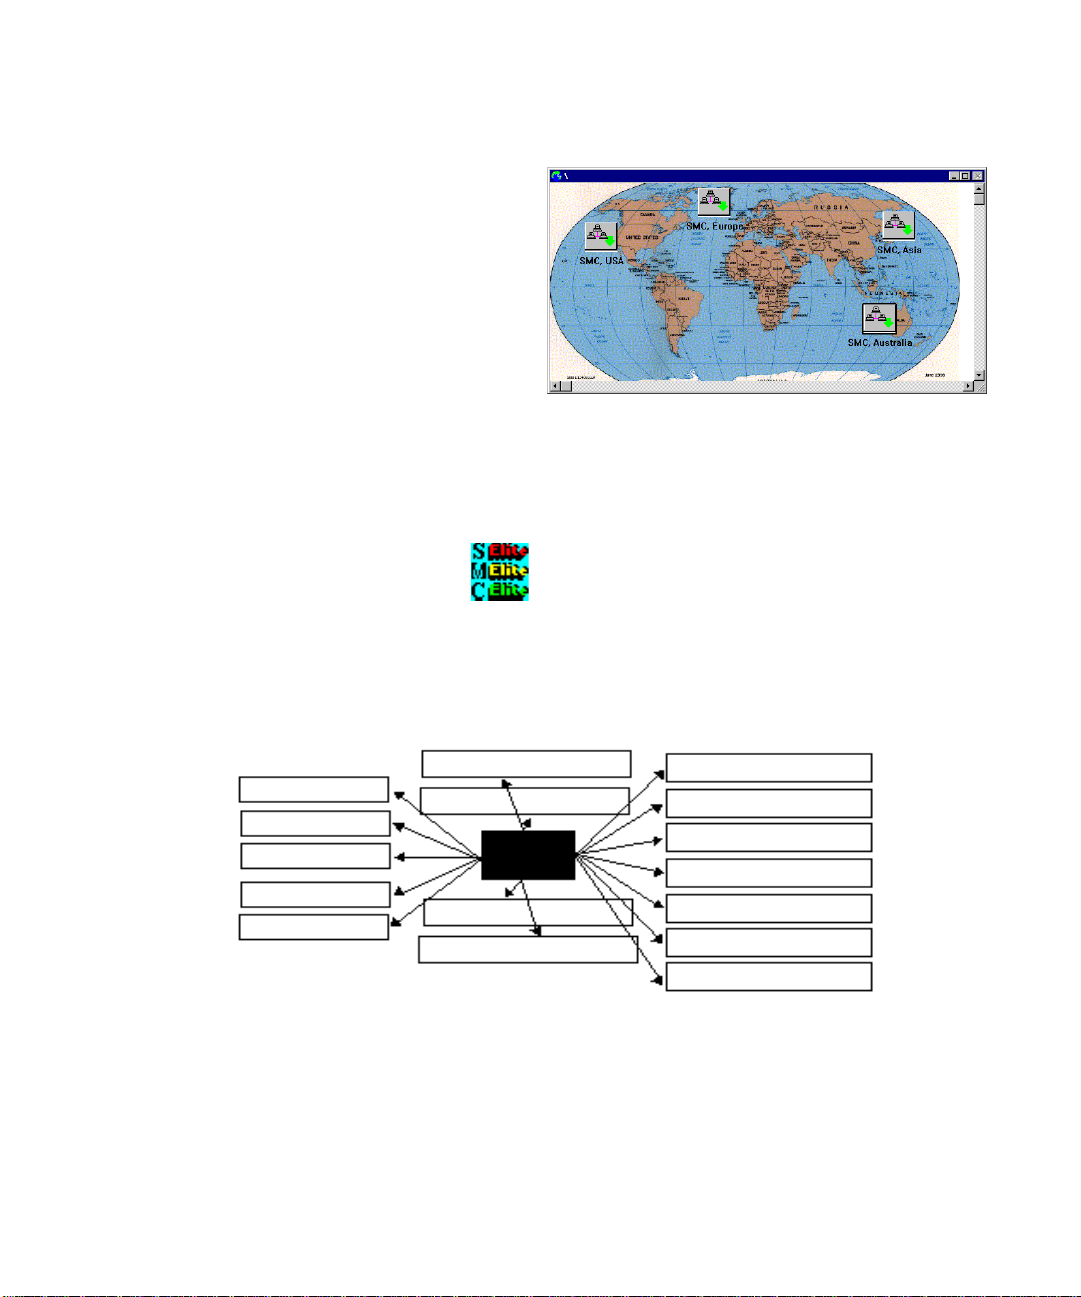
Sample Configuration
For large networks, you should break the map up into several
pieces that can be opened independently. The following
figure shows an example of the network map for our offices in
Europe. The submap icons are logical links to other maps. In
larger networks, you can represent the overall configuration as
logical network segments. To view a subordinate map, doubleclick on the corresponding submap icon. The display shows
the path name for the selected submap in the title bar.
Submaps may also be used to view different maps of the same network.
For example, you might use several maps showing -
• “\Network” as the physical view
• “\Organization” as the logical network hierarchy
• “\Offices” as the network organized by offices
4-9
Page 36

DEFINING THE NETWORK CONFIGURATION
At the next lower level you can depict the network backbone
for the selected network. A LAN Segment is a special kind of
view-only object that is designed to show a common backbone
on a network. The LAN segment is also commonly used to
depict various networks based on different protocols (e.g., UDP/
IP or IPX) connected to a common backbone.
To position the LAN segment on your map, you can stretch it by
dragging the length handles longer or shorter, or angle it by
rotating the end points.
At the lowest level, place the actual network devices and draw in all interconnections. This gives
you an accurate picture of the network and also lets you activate applicable management software
modules. For SMC’s nework devices, the corresponding device management module will be
activated when you double-click on the device icon.
Modifying Objects
1. Select a network device by clicking on its corresponding icon.
2. Click on the Modify Object button.
3. Modify any of the required parameters. Refer to the table on “Field Definitions for the Add Object
Dialog Box.” Be sure to follow the guidelines in this table when setting the Polling Interval or
Timeout.
4. Press OK to continue, or Cancel to abort any changes.
Deleting Objects
1. Select any map object by clicking on its icon.
2. Click on the Delete Object button, or press the Delete key on your keyboard.
If an icon cannot be deleted, the map view has been locked.
From the Edit menu, choose Unlock and repeat step 2 again.
Duplicating Objects
1. Select any map object by clicking on its icon.
2. From the Edit menu, choose Duplicate Object. A copy of the
object appears in the upper left corner of your map.
3. Drag the duplicate object to its new location and draw in any
corresponding network connections.
4. For most applications, you will want to modify the object
definition. Therefore, click on the Edit Object button and modify
field parameters such as Label and Address.
Moving Objects
Use “drag and drop” to move an object. Select any map object by clicking on its icon. Holding the
left mouse button down, move the outline of the device icon to its new location, and release the
mouse button. If an icon cannot be moved, the map view has been locked. From the Edit menu,
choose Unlock and try again.
4-10
Page 37

DEFINING THE NETWORK CONFIGURATION
Tip: When creating multiple views of the same network, use Duplicate Object to
make copies of objects, use the mouse to "drag and drop" icons to a new
location or another submap, and then use Edit Object to modify the
object’s description.
Object Status
When an object is first added to the map, the device is “offline.” If an
object's monitor flag is enabled, EliteView will begin polling the device
immediately. When the object first responds, device status changes to
“online” and a “device up” event is generated. If an object fails to respond
within the specified timeout and retry limits, device status changes to
“offline” and a “connection lost” event is generated. Changes in the status
of objects at lower hierarchial levels in the network map are also reflected in the icons at higher levels (i.e.,
submap icons change color to reflect changes in subordinate devices).
Note: To post changes in object status to the Report window, specifiy Device Up
or Connection Lost in the Action list for the Event Manager. For more
information on defining event responses, see Managing Events, Chapter 8.
Map Limitations
EliteView maps are designed without any arbitrary program limitations.
Practical limits are set by the available system resources.
4-11
Page 38

DEFINING THE NETWORK CONFIGURATION
4-12
Page 39

CHAPTER 5
NETWORK TOOLS
EliteView supports a wide range of network tools that can be accessed directly from the device
maps (see Creating Network Maps, Chapter 4) or from the Window’s Program Manager. This
chapter describes utilities designed to allow a device to identify its own IP address, to help the
network manager verify the existence of a device in the network, and to update device software
over the network.
Setting Addresses with the BOOTP Server
BOOTP is a protocol (running on the UDP/IP stack) used by network devices to find out their own
IP address and identify files which are to be subsequently downloaded to the client device.
Typically, IP addresses are assigned manually by the network administrator and recorded in the
device’s permanent storage for ready reference.
For many network sites, managing IP addresses can be a chore. The network manager needs a
convenient way to access every device and dynamically assign its logical address from a central
location. Since every device has a distinct physical network address, a server can run a special
network protocol that lets each device lookup its own IP address based upon its physical address.
Although there are many different address assignment protocols, BOOTP is one of the most
popular ones.
The BOOTP Protocol
The complete BOOTP protocol provides a wide variety of information services. However,
EliteView’s BOOTP Server only provides an IP address for device recognition and a filename for
subsequent downloading.
Once a request is received, the BOOTP server uses the client station’s physical address as a key to
find the client station’s IP address. It replies with the corresponding IP address and a path/
filename for a generic or specific device initialization file.
5-1
Page 40

NETWORK TOOLS
Here is how EliteView’s BOOTP protocol works:
1. A client station needs its IP address or filename information.
2. The client station sends a BOOTP request. Since it may not know its own IP address at this time,
it may send out a request via broadcast.
3. The EliteView BOOTP Server receives the request and uses the client station’s physical address
as a key to lookup the client station’s IP address. Next, the BOOTP Server looks up the filename
for the client station.
4. The BOOTP Server sends a reply message back to the MAC address initially provided by the
client.
A client station may frequently lookup a filename with BOOTP. For example, a filename may be
needed by the client station to download operating system software from a dedicated file server
using another protocol (e.g., TFTP). Since EliteView also provides a TFTP Server, the service
request can be completed entirely via EliteView.
If the client station provides a generic name, such as “unix” or “hubware,” the BOOTP Server will
reply with the corresponding filename in the server. This allows multiple file download services for
many kinds of devices. If the client station does not provide a generic name, the BOOTP server
returns the DEFAULT generic filename.
Starting the BOOTP Server
To open the BOOTP Database,
Choose BOOTP Server from the Utilities menu in
the main EliteView program, or directly from the
EliteView program group.
The dialog box for the BOOTP Server will display.
The screen has two parts. The upper half is the
list of address mappings, while the lower half is the list of file mappings. Each client station has the
following attributes:
Parameters Description Example
Name Node name. This value is not used by BOOTP, but is useful for the network manager. NetWareSV 2
MAC Address Physical address of this node. 0000e80a3e9c
IP Address IP network address 192.219.74.32
Subnet Mask This mask identifies the host address bits used for routing to specific subnets. 255.255.0.0
Default Gateway The gateway must be defined if the device is not located in the same IP segment as
Note A short memo field. SNMPDRV2.BIN
Boot File Mappings List of filename mappings. Generic names map to an actual filenames.
the BOOTP server.
10.1.0.254
5-2
Page 41

NETWORK TOOLS
Select an entry in the node list to display the Note and filename mapping for the selected node.
Each node in the BOOTP Server can have its own filename mapping list. This provides maximum
flexibility for the network administrator. Default mapping is also provided, where in most cases
per-node special mapping is not required. Click on the DEFAULT name to set both the IP and MAC
addresses to zero; this represents the default file mapping list.
To exit the BOOTP server, click on the Exit button.
Adding and Modifying Node Information
The BOOTP Server starts with a single entry called DEFAULT. No file
mapping is initially defined for this entry. To provide BOOTP service
based on generic information, add the entries you require to the file
map for the DEFAULT node. To service specific nodes, enter data for
each node.
To add a new node:
1. Click the Add Node button in the BOOTP Server dialog box. This
will bring up the Add Record dialog box.
2. Enter the following information in the record fields.
Parameters Description Example
Name Node name. Enter up to 14 characters. NetWare Server 2
MAC Address Physical address of the device. 0000E8C0A301
IP Address IP network address. 192.255.74.32
Subnet Mask This mask identifies the host address bits used for routing to
specific subnets.
Default Gateway The gateway must be defined if the device is not located in
the same IP segment as the BOOTP server.
Note Enter a note of 100 characters or less. Backup file server at Bldg 100-34.4
3. Click OK to accept the changes or Cancel to abort them.
New node information appears in the node address list.
255.255.0.0
10.1.0.254
To modify a node:
1. Click on the required node in the node address list.
2. Click the Edit Node button.
3. Make any changes to the current information.
4. Click on OK to accept the changes.
5-3
Page 42

NETWORK TOOLS
To delete a node:
1. Select a node entry by clicking on its address entry.
2. Click on the Del Node button.
The node entry and all associated file mappings are removed.
Adding Filename Mappings
The file mapping list shows every node defined.
To add a filename mapping:
1. Click on an entry in the node address list.
2. Click the Add... button in the File Mappings field to insert a new file map entry.
- The Add File Mapping dialog box will appear.
3. Input the generic name and filename, including the path.
4. Click OK to store the new mapping.
- The new entry will appear in the file mappings list.
To view the note and file mapping(s) for a node, click on the
required entry in the address list.
To change filename mappings:
1. Select the file mapping.
2. Click on the Edit button.
3. Change information in the Edit File Mapping dialog box.
4. Click OK to accept changes.
To delete a file mapping:
1. Select the file mapping.
2. Click on Del.
The filename mapping will be removed.
Default Information
EliteView’s BOOTP Server provides flexible filename mapping. However, you may find it most
convenient to establish a common default for most nodes on the network.
To define a default address with IP and physical addresses,
1. Select the “default” address (0.0.0.0).
2. Define file mappings applicable to all nodes on the network.
Every BOOTP request to lookup a filename will be checked in this priority:
1. Consult the specific node address.
2. If no address is found for the specified node, consult the default file mappings.
5-4
Page 43

NETWORK TOOLS
In addition to the explicit default file mappings, the BOOTP Server also provides implicit default file
mapping. When a node is included in the address list and the client station provides no generic filename, it is
asking for a default file mapping that you must provide. A DEFAULT filename must be defined for all
stations requiring this type of mapping. If a DEFAULT generic name is not defined, the request is ignored.
Probing Devices with the Alive Test
The Alive Test serves as a basic network monitor. It determines link status by sending packets between the
network management station (i.e., your PC) and the target node (e.g., gateway, hub or node). This test can be
initiated from the Tools menu in the main EliteView program, from the Discovery module, or directly from
the EliteView program group.
The Alive Test can be used with any IP or IPX device - including devices that do not support SNMP (like
gateways). It cannot be used with the Ethernet protocol. To discover the existence of a device, the Alive Test
uses “ICMP echo” for UDP/IP networks, and the IPX Diagnostic command for IPX nodes. If a device
responds correctly, it returns the message to the sender. When the echoed message is received by the sender, it
can determine:
• Existence of the target device
• Round trip delay time
• Relative network throughput (transmission speed, etc.)
• Return ratio (percentage of packets correctly returned)
To select a target device,
If you open the Alive Test from the EliteView program
group
or from the Discovery module, select the network protocol as
UDP/IP or IPX. Then specify the target address and polling
interval.
However, if you activate the Alive Test from within the main
EliteView program then follow these steps -
Initialization window displayed when opening
the Alive Test from the EliteView program
group or from Discover y.
5-5
Page 44
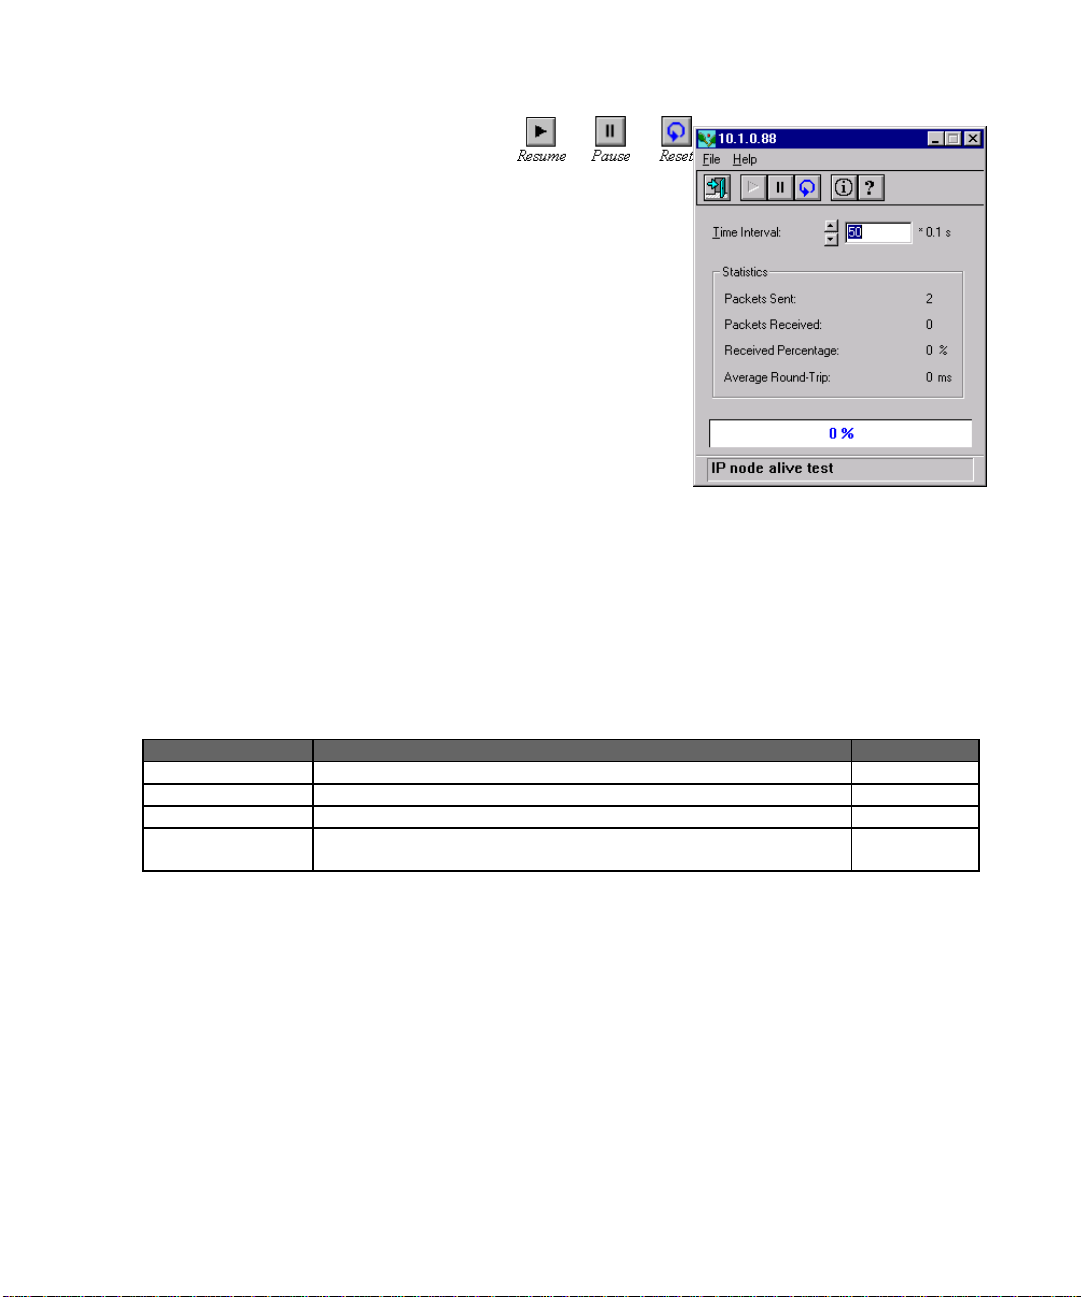
NETWORK TOOLS
1. Open a map containing the target device.
2. Select the device with your mouse.
3. From the Tools menu, select Alive Test.
Note that network protocol, target address, and polling
interval default to the object description as defined in the
EliteView map.
In a few seconds, a dialog box opens showing device status.
To adjust parameters for the Alive Test:
• Adjust the Time Interval by clicking the up/down arrow to
increase or decrease its value. Time interval is the duration
(in seconds) between the transmission of query messages
from your PC, the network management station (NMS).
• Click Pause to halt the Alive Test temporarily.
• Click Resume to re-start the Alive Test.
• Click Reset to clear all the statistics.
• Click Set to specify a gateway for the target device.
• To exit the Alive Test, click on Exit.
The Alive Test collects a number of statistics. These include:
Statistics Description Examples
Packets Sent Number of messages sent by Alive Test. 7
Packets Received Number of echoed messages received by Alive Test. 6
Received Percentage Ratio of messages received to messages sent. 85%
Average Round Trip Average time interval between the original message sent and the echoed
message received
Problem Solving with the Alive Test
The Alive Test helps determine a number of network conditions.
1. Symptom: No response with the Alive Test.
Condition:
No response is ever received during an Alive Test.
(packets received is 0).
Possible Cause:
The device does not exist or there is a cabling problem between your network management
station and the target device.
5-6
900 ms
Page 45

NETWORK TOOLS
2. Symptom: No response with EliteView (main program), but responds to the Alive Test.
Condition:
A device responds to Alive Test (packets received is not 0).
Possible Causes:
a. The target device does not support SNMP.
b. The community string for the target device does not match the setting for the object in the
EliteView map.
Downloading Files with the TFTP Server
Network devices frequently include embedded firmware (software stored in ROM or flash memory)
required for their operation. For example, SMC’s EZ family of manageable devices (e.g., the EZ
Stack 10) all include memory for an SNMP agent.
The trivial file transfer protocol (TFTP) is the most common standard for downloading files to
network devices. SMC uses TFTP to download files for most of its manageable networking
products.
Starting the TFTP Server
To start the TFTP Server, choose TFTP Server from the
Utilities menu in the main EliteView program or directly from
the EliteView program group.
Using the TFTP Server
EliteView’s TFTP Server provides a public directory for general downloading. The default directory
is C:\EV50\PUBLIC. Only files in this directory can be downloaded to a target device or transfered
to another server.
To configure the TFTP server, choose Setup from the File menu. The TFTP Setup dialog box will
open, displaying options for the download directory, the default timeout to wait for a service
response, and the default number of retries before terminating a connection attempt as described
below.
Parameters Description Example
C:\EV50\PUBLIC
5 seconds
3
Public Read Directory Default directory for all files for public downloading.
Default Timeout Maximum elapsed time (in seconds) TFTP will wait until it gets a response
from a target device. The optimal value depends on your specific network.
Default Retries Maximum number of attempts TFTP will try to get a response from the
target device before declaring that the session has failed.
Viewing the TFTP Process List
When the TFTP server receives a file
transfer request, an entry appears in the
process list window. For each entry, the
following parameters are displayed:
5-7
Page 46

NETWORK TOOLS
When the TFTP server receives a file transfer request, an entry appears in the process list window.
For each entry, the following parameters are displayed:
Parameters Description Example
Target Node The IP a d d r e ss of the device that initiates the TFTP file transfer se ssion. 192.74.255.74
Action Indicates file download or simple transfer. SEND
Filename The file being accessed. SNMPDRV.BIN
Progress Current status of the file transfer (based on a percentage of the file that has
already been transferred).
10%
Fetching Files from Other Servers
You can use the TFTP server as a client to
receive files from other TFTP servers.
To start a transfer session:
1. Choose Read File From... from the Service
menu.
2. A dialog box will appear requesting additonal
information. Check the box Keep File Upon
Failure to save a partial file transfer.
The required parameters are defined below.
Parameters Description Example
Target Address IP address of the target TFTP server. This is the source of the original file. 192.74.255.74
Remote Filename The file you want from the TFTP server. The path is restricted to the
EliteView public directory for security reasons.
Local Filename Name of the file after it has been received. SNMPDRV2.BIN
Keep File Upon Failure Click on this check box to save partial results when file transfer fails.
SNMPDRV.BIN
3. Click on the OK button to begin the transfer process. The Progress report is less complete here,
because TFTP cannot determine file size beforehand when transferring an arbitrar.05y file.
Telneting to Other Computers on the Network
Telnet is a TCP/IP application protocol that allows you to access a remote computer system
(e.g., a UNIX or SUN workstation) as though you were attached locally via a serial terminal. As long
as you have a user account on the target system and the necessary user priviledge, you can
execute any text command.
If you require frequent access to a particular workstation, you may want to include it in your
network map as.03 an IP Node.
To telnet into a workstation using your network map,
1. Select the appropriate IP node from the network map with your mouse.
2. Open the Tools menu under the main EliteView window and click on Telnet.
3. Log into the remote workstation.
5-8
Page 47

CHAPTER 6
SNMP MIB MANAGEMENT
For all of SMC’s intelligent network devices which include an SNMP-based management agent, you
can use the device management modules in EliteView to easily access and manage detailed
network information. EliteView’s map module allows you to intuitively “zoom in” on objects to see
low-level details on device hardware/software configuration and associated network interface
parameters. For all SNMP-based devices (both ours and third-party products), you can access the
complete SNMP Management Information Base (MIB) using the MIB Browser utility.
EliteView provides three basic MIB management utilities:
• MIB Compiler - Used to update or add modules to MIB database.
• MIB-2 Viewer - Displays MIB-II variables based on a functional grouping.
• MIB Browser - Provides full access to all MIB variables, such as MIB II, Bridge MIB, as well as
SMC private MIBs.
This chapter provides detailed information on managing your device database. The following
sections use objects you have added to your network map. If you do not have a network map, you
may want to turn to “Creating Network Maps” in Chapter 4. For more information about managing
specific devices, refer to the appropriate EliteView users guide.
MIB Compiler
The MIB Compiler is used to maintain the MIB database used by EliteView. Definitions for standard
objects, network devices, or private third-party devices can be compiled and included in this
database. All device management applications under EliteView consult this database when
accessing devices. Under normal use, rely on the setup program for new management applications
to automatically adjust the MIB database. However, if you need to modify the database yourself,
the compile operation can be carried out interactively, or as a batch process. Specific MIB databases
can also be unloaded when they are no longer in use, or out of date.
Tip: Compiling changes the MIB. Quit EliteView before running this process to make sure no
module accesses the database while it is being compiled.
6-1
Page 48

SNMP MIB MANAGEMENT
MIB Database
MIB.DBF, MIB.DBF and MIB.MDX - You can find these files in the EliteView directory. MIB text
files have the following format:
<MIB Name> BEGIN
.
.
.
END
Each MIB text file can contain several MIB modules, which we may call <MIB name>. EliteView
accesses external MIB variables via this name.
Starting the MIB Compiler
To run the MIB Compiler,
Select MIB Compiler from the EliteView program group.
It will automatically load the current MIB database as shown below.
6-2
Page 49

SNMP MIB MANAGEMENT
The following table describes each function.
Item Description Sample Display
MIB Module List Shows all the modules used by EliteView.
Compile Status
Filename The filename for a module to add or update smc8608.mib
Module The name of a module as recognized by the MIB database. SMC8608-MIB
Status Shows the current compile status. Merge
Line The current line being compiled. 145
Label The macro currently being processed.
Functions
Load Loads an MIB text file into the database. Filename:
C:\EV60\MIB\SMC.MIB
Unload Unloads an MIB module from the database. If the specified module
has any dependencies; i.e., has other modules attached to it, the
compiler will ask whether or not you wan t to unload the specified
module and all of its dependencies. This is analogous to deleting a
subdirectory – You cannot delete a subdirectory without first
deleting the files it contains.
To load a new MIB:
1. Select Load from the MIB Compiler.
2. Type the full name of the MIB file in the Filename field.
Current MIB: RFC1213-MIB
Each MIB file defines an MIB module. The MIB name is indicated at the beginning of the file as
in the example below, where the name of the module is given as RFC1213-MIB.
RFC1213-MIB DEFINITIONS::=BEGIN...
All MIBs are defined under the same tree, making MIB definitions related to one another.
The EliteView MIB database identifies MIB objects with names and modules. Each object has a
distinct name within a module, and each module may be loaded or unloaded at any time.
The MIB Compiler reads the specified MIB file and displays the names of the MIB objects as the file
is scanned. If any error occurs during this process, it will stop scanning and display the object label
and the line number near where the error occurred as in the example below:
6-3
Page 50

SNMP MIB MANAGEMENT
If an object identifier is not defined, the following message may appear on the screen:
If an unknown object identifier is found in the definition for OBJECT-TYPE, it will be reported
after all MIB objects are checked as in the following error message. In the example given below,
you should check the last line of the OBJECT-TYPE macro section.
Error: Lost connection for node sysObjectID
To unload MIB modules,
You can unload an MIB module when it is no longer needed, or when you wish to update or
replace it. Highlight the MIB you want to unload, list currently loaded modules, and then select
Unload. If other MIB modules link to the module you wish to unload, EliteView will ask you to
unload these modules first before you can successfully unload the required module.
To view the MIB Module List
Use the scroll bar next to the MIB Module List on the MIB Compiler. This list shows the modules
currently loaded in the MIB compiler.
Things to remember when using the MIB Compiler:
• The system always loads the current MIB database.
• To replace an MIB with its new version, first unload the older version and then load the new
version.
• If an error occurs during the loading or unloading process, the MIB Compiler automatically skips
the erroneous command and moves on to the next one.
6-4
Page 51

SNMP MIB MANAGEMENT
MIB-2 Viewer
The MIB-2 Viewer is a generic SNMP monitoring tool used to browse MIB II (i.e. the Management
Information Base defined by RFC 1213). By browsing through this MIB, you can access information
recorded in MIB II for any SNMP-compliant device attached to your network. However, to set MIB
variables, remember to use the MIB Browser.
Note that although all SNMP devices support MIB II, most groups are optional and may not be
implemented. Only System, Interface and SNMP groups are likely to be found on all systems.
You can invoke the MIB-2 Viewer from the Tools menu in the main EliteView program (preferably
after selecting a device from the EliteView map), or by clicking on the appropriate icon in the
EliteView program group. If you are not opening the MIB-2 Viewer directly from the EliteView
map, then you must also fill in the device interface parameters in the MIB2VIEW initialization dialog
box, including protocol type, target address, SNMP community, and polling specifications.
Once loaded, the MIB-2 Viewer begins searching for
definitions for the specified object in EliteView’s MIB database.
After the target data has been retrieved, open the directory
branches along the path leading to the required variable by
double-clicking on each intervening node. (Note that the icons
for collapsible nodes are highlighted at the top.)
After opening the required window, you can readily view all
the key variables associated with the selected topic. To copy
MIB data into the Output window, just press the Output
button. You can edit and save the information copied to the
Output window using the buttons provided in toolbar.
The toolbar for the MIB Viewer contains two basic button
groups for file management and output editing. After creating a
status report via cut & paste and manual annotation, be sure to save
your file before exiting EliteView. Note that a brief description of
every toolbar button is provided in the Status bar at the bottom of
the screen. (Refer to the description on how to use the Status Bar in
Chapter 3.)
A description of the menus and a few of the display
screens used by the MIB-2 Viewer is provided below. For
more detailed information of specific variables, refer to the
MIB Browser or the appropriate RFC.
6-5
Page 52

SNMP MIB MANAGEMENT
Menu Bar
The menu bar for the MIB-2 Viewer provides five key menus, namely, File, Edit, Search, Window
and Help. Clicking on any of these items will open a pull-down menu from which you can invoke
corresponding commands.
Menu Description
File Contains commands t o open and save report files (New, Open, Save, Save As), and to exit the host
management program (Exit).
Edit* Contains standard editing comman ds used in conjunction with the Output Window.
Search* Contains editing commands used to find or replace specified text in the Out put Window.
Window Contains standard commands for arranging your windows (Cascade, Tile) and icons (Arrange Icons), or
Help Used to invoke available on-line help functions, or to display the revision number for your current version of
* Only displayed in conjunction with the Output Window.
switching to anot her window.
EliteView.
MIB-2 Directory
The information displayed in the MIB-2 directory is presented in easily understood graphic
windows. A few of these windows are fully described below. For further details on the other
directory entries, please refer to textual descriptions provided
by the MIB Browser.
System Information
System information is extracted from the System Group in
MIB II (RFC 1213). It provides data on the SNMP agent
installed on the device being monitored.
System Information Window
System Information provides data on the SNMP agent.
Field Descriptions for System Information Window
Field Description
Description Name of the management agent, version number and release date.
Object ID Unique identifier for device model.
System Up for Time since the SNMP agent was last re-initialized.
Contact Name of contact person for this monitored node; and how to make contact.
Name Administrative designation for this node.
Location Physical location of this node.
Service Layers Internet protocol services offered by this node. The OSI model includes - (1) Physical, (2) Data Link,
(3) Network, (4) Transport, (5) Session, (6) Presentation, and (7) Application layers.
6-6
Page 53

Interface Administration
SNMP MIB MANAGEMENT
Data for this window is extracted from the Interface
Group in MIB II (RFC 1213). Each MAC frame type
supported by a physical network interface is listed as
This window provides a description and status
information on each subnetwork connected to
this system
a unique logical network interface in the display
window. (Refer to ifType in RFC 1156.) For
example, even though there may only by one
physical network interface on a monitored device, it
may concurrently support both ethernet-csmacd and
iso88023-csmacd. Also note that the same type may
be reported more than once where a logical
interface includes several valid subtypes. For
example, ethernet-802.2 and ethernet-II both fall
under ethernet-csmacd.
Field Descriptions for Interface Admin Window
Field Description
Interface (Index) A unique index for each subnetwork connection.
Description A textual description of the interface, which may include items such as the product name,
manufacturer, or version number for the hardware interface.
Type The interface type based on the physical/link protocols running immediat ely below the network layer,
e.g. ethernet-csmacd (where csmacd indicates Carrier Sense Multiple Access / Collision Detect ion).
Physical Address The interface address used at the protocol layer immediately below the network layer. This value will
be zero for interface types that do not support such an address.
Field Description
Interface State The requested state of the interface including the following items. Note that when the interface is in
testing mode, no operational packets can be passed.
up - ready to pass packets
down - not allowed to pass packets
testing - operating in a test mode
Operational State T he current operational status of the interface, including the same states as defined above for
Interface State, except where down indicates that the device is not capable of passing packets.
Specific Referenc e to a n MIB with definitions fo r th e media type (e.g., Eth e rn e t) u sed by the interface. If n o
information is available, this value will be zero.
6-7
Page 54

SNMP MIB MANAGEMENT
Interface Statistics
This window provides statistical information on the
traffic and associated errors for the selected interface.
Data for this window is extracted from the Interface
Group in MIB II (RFC 1213). An entry is included for
each subnetwork interface. This window provides
information on the amount of traffic passing through
this interface and the associated errors. This
information can also be displayed as a graph by
clicking STAT, or passed to the EliteView Log Manager
by clicking LOG and defining the required event
criteria. Refer to the sections on Viewing Statistics or
Adding a Log Process if these functions are required.
Field Description for Interface Statistics Window
Field Description
Interface (Index) A unique index for each subnetwork connection.
InOctets Total number of bytes received on the interface, including framing characters.
InUcastPkts Number of subnetwork unicast packets delivered to a higher-layer protocol.
InNUcastPkts Num ber of non-unicast packets (i.e., broadcast or multicast) delivered to a higher-layer protocol.
InDiscards Number of inbound packets that were discarded even though no errors were detected. One reason for
discarding such packets is lack of buffer space.
InError The number of inbound packets containing errors that prevented them from being delivered to a higher-
layer protocol.
OutOctets T otal number of bytes transmitted from the interface, including framing characters.
OutUcastPkts Total number of packets requested by higher-level protocols for retransmission to a unicast address,
including those either discarded or not sent.
OutNUcastPkts Total number of packets requested by higher-level protocols for retransmission to a broadcast or
multicast address, including those either discarded or not sent.
OutDiscards The number of outbound packets containing errors that prevented them from being delivered to a
higher-layer protocol. One reason for discarding such packets is to free up buffer space.
OutError Number of outbound packets that could not be transmitted due to errors.
Viewing Statistics
The STAT button is used to display a real-time graph of the corresponding counter read during
each polling interval.
Click Stat to display the corresponding graph.
Click on Config under the Option menu to change
parameters for the graph. The Config Statistics dialog
box appears. You can change the graph’s scale, ruler,
style (i.e., filled curve, curve (fill), and color, or reset the
graph. Click OK to return to the graph, or Cancel to
abort any changes.
Click on Exit under the Option menu to return to the
invoking window.
6-8
Page 55

SNMP MIB MANAGEMENT
Adding a Log Process
The Log button is used to define a new log process for the Log Manager.
The Log Manager performs the following basic functions:
• Periodically records values for device variables.
• Sets thresholds to trigger events when conditions are met.
Click on Log to display the Log Information dialog box.
Complete the entries for Log Name, Protocol, Target Address, Community,
Version, MIB Module, MIB Variable, Index, Filter, Threshold, Event Name,
Polling Interval, Start Time and Stop Time to provide precise control over
Logging operations. Refer to Chapter 7, “Collecting Data with the Log
Manager,” for a detailed explanation of the Log Information dialog box.
MIB Browser
The MIB Browser is a generic SNMP management tool used to browse MIBs. By browsing through the MIB,
you can send commands to get or set information defined in the MIB.
You can invoke the MIB Browser by selecting MIB Browser from the Tools menu in the main EliteView
program, or by clicking on the MIB Browser icon in the EliteView program group. Once loaded it begins
searching for definitions for the specified object in EliteView’s MIB database. After selecting a desired
variable, you may issue SNMP commands to get or set various device parameters.
Basic Functions of MIB Browser
1. The MIB Browser window provides access to the EliteView MIB database. The definitions for all known
MIB variables can be consulted here. This window also provides access to variables stored in managed
devices via the SNMP Get, Get Next, Get Bulk and Set commands. You can view any of these variables in
either ASCII or binary format, set values for variables that provide write access, pass specified variables to
the profile window, or specify a log process.
2. The output editor provides basic tools required to edit data retrieved from the target device. To open an
output window, click on the output button in the main toolbar, then set the output mode and retrieved
field entries using the Options menu.
3. The profile window is used to specify commonly referenced variables, which can be more easily accessed
and managed as variable sets. Use profile functions to modify the selected variable set, and to fetch or store
values as a set.
4. The log utility allows you to define new processes for the Log Manager, and quickly paste selected variables
into the filter and threshold fields.
6-9
Page 56

SNMP MIB MANAGEMENT
Menu Description
The menus provided for the MIB Browser are briefly introduced below. Menus are only enabled for applicable
windows as indicated in the Window field.
Menu Definitions
Menu Label Window* Description
File Tree
Profile
Output
Edit Output Editing Tool - Provides standard editing functions including cut
Search Output Search Functions - Provides search related functions.
Profile Profile Functions - Provides batch access to MIB variables.
File and Printer Access - Provides standard file access and
printer functions for the Output Editor window, open and save
functions for Profile files, and exit from the MIB Browser.
and paste, item selection, and word-wrap display.
6-10
SNMP Tree Access MIB Variables - Provides standard access commands
for MIB variables, along with utilities to add a new log process,
display a graph for a selected variable, or add the current
variable into the Profile window.
Tree Tree
UpTree
Navigate Tree - Provides options to open a new tree (where the
default sets the root at the currently selected node), expand or
collapse the current node (i.e., same as double-clicking on a
parent node), or move up the tree to the parent node (i.e., same
as using the UpTree button).
Page 57

Menu Label Window* Description
Options Tree
Profile
Output
Window Tree
Profile
Output
Polling - Adjust timing for data requests, including polling
interval, timeout, and retries. Set polling to comply with the
retries defined in the Polling Time dialog box, or opt to continue
polling until the queried device responds. Output - Set output to
display values in ASCII or binary, and select value fields to pass
to the Output Editor.
Manage Windows - Arrange windows or icons, or activate an
existing window.
Help Tree
Profile
Output
Help Facility - Access detailed help information about the MIB
Browser.
* Window - indicates the windows for which this menu is active.
Accessing Device Values
To fetch device values using the MIB Browser:
SNMP MIB MANAGEMENT
1. Start EliteView.
2. Open your network map. (Refer to Chapter 4 if you have not yet created your network map.)
3. Select the required device by clicking on it with the mouse.
4. Select MIB Browser from the Tools Menu. This will bring up the MIB Browser window.
5. If this is the first time you have used the MIB Browser, the New MIB Tree dialog box will
display. Open a new MIB tree by specifying the root variable :
a) Indicate whether the object type is a Label or numeric Object Identifier (e.g. the object
identifier for internet is 1.3.6.1).
b) Select the MIB containing the root from the scroll list.
c) Specify the tree root (or the name of the required object) in the Object edit box.
d) To use the first entry matching the specified prefix, clear the Find exactly check box. To set
the tree root at the exact variable as specified, mark the Find exactly check box. Click OK to
continue or Cancel to start the browser without a tree window.
6. If the MIB Browser is opened from within the EliteView Platform program, the protocol and
address of the selected device will be used. However, if the MIB Browser is activated directly
from the EliteView program group, the Program Information dialog box will be displayed for a
new tree. Specify the network protocol used for this device as UDP/IP or IPX. Verify the target
address, and then press OK to open the new tree window or Cancel to start the browser without
a specified tree.
6-11
Page 58

SNMP MIB MANAGEMENT
Select MIB Browser from the Tools
Menu of the main EliteView program,
specify the root for a new tree in the New
MIB Tree dialog box, and indicate the
network protocol used for the selected
device.
If this is not the first time you have used
the SNMP MIB Browser, EliteView
will automatically open the window(s)
last used.
SNMP window showing MIB description
as it appears in the MIB database
and value for the highlighted item.
Each subwindow may be resized by
dragging on the inner frame with your
mouse.
7. Locate the MIB variable you want to browse. Use the scroll bar to move the tree display up or down, and
double-click on any intermediate nodes in the path to the required variable to open the map for a lowerlevel hierarchy. After you have found the variable, press the Get Request button to fetch the required
information. The data display options are binary or ASCII. To change the output mode, use the Output
selection under the Options menu.
Tip: Object names may be duplicated in different MIB modules. For accurate results, be sure to enter the
correct node.
8. When you select any MIB variable, the textual description (as listed in the database) is automatically
displayed to the right of the tree. Standard entries in the list box include the MIB Name, Object ID, Type,
Access, Status, Range, Size, Description and more depending on the variable selected. The following table
describes each entry.
6-12
Page 59

SNMP MIB MANAGEMENT
Field Description of Object Parameters
Item Description
Label Standard name for MIB variable (as appearing in the MIB tree).
MIB Name Name of the MIB module to which the variable belongs.
Object ID Dotted-decimal identifier for current variable, indicating its exact location in the database structure.
Type Data type of the object. This is NULL if the object is a structure (i.e., not a real variable).
Access Refers to the way the data can be accessed. This item is only meaningful for real variables. Acceptable values
include “Read Only,” “Read/Write,” or “No Access.” Note that a Read-Only object does not support the “set”
operation.
Status Can be M A NDA T O RY , O PTIONAL or DEPRECATED. In general, a mandatory object must be implemented,
an optional object may be omitted, and a depreciated object may be taken out of a definition. However,
according to grouping conventions as defined in the standards, objects may be grouped such that all of them
are implemented, or omitted altogether. In such case these objects may have the status of MANDATORY but
not be implemented without violating the rules.
Index Index to current table entry. The IP address of the target device is commonly used as an index.
Value The value of the current variable. Value type depends on the specific variable.
Range Range of the variable in (x, y) format.
Size Size of the string data in number of bytes.
Description Text that briefly describes the use of the corresponding variable.
9. When you execute a Get Request (or double-click on an item in the MIB
tree) or Get Bulk Request, the value of the selected variable(s) is retrieved
from the managed device and displayed beneath the textual description.
However, note that when the Get Next request is executed, the next
variable actually retrieved may be several nodes away, so the ObjectID and
Index entries are also displayed.
10. The MIB database contains both simple variables and tables. For example,
the atEntry uses the IP address as a pointer to specific network
devices. When you expand a table by double-clicking on the
associated node, the Input Index dialog box will open to query
for the required table index. You can change the table index for
the current variable (provided it is a table) using the Index
button.
Object ID = 1.3.6.1.2.1.1
Index = 0
Value = SMC TigerSwitch 8 V01.01
11. You can modify the value of variables for which you have write
access (as indicated in MIB definition’s Access field). Once you
have located the required variable, click the Set Request button to
open the Input Value dialog box. The object and object type, as
defined in the MIB, are listed in this box. Input the new value,
ensuring that you use the correct type (as indicated in MIB
definition’s Type field). Then click OK to write this value into the
managed device, or Cancel to abort the change.
6-13
Page 60

SNMP MIB MANAGEMENT
12. If you need to pause/resume or discontinue a data request, click on the
appropriate buttons in the toolbar. To exit the MIB Browser, click on
the exit button.
13. You may display the real-time value for suitable variables
(i.e., types including counter, integer, gauge or time ticks) by clicking
on the Graphical Statistics button. (Refer to the section on Viewing
Statistics on
page 14.)
14. Use the Logging Data button to have the Log Manager periodically
record values for device variables or set thresholds to trigger events
when conditions are met. To pass a request to the Log Manager,
select the MIB variable from the SNMP tree you want to log by
highlighting it with your mouse. Then click on the log button to
open the LOG Information dialog box. Input the required
information to provide precise control over logging operations.
Using Profile Windows
If you frequently access a fixed set of variables, place them in a profile
for easy access and management. The profile window is used to define
or access commonly referenced variables. The functions provided by
this window allow you to modify the selected variable set, and fetch or
store values as a set.
The Profile Window provides a subset of MIB access commands, of which Object Information and Remove Object
apply specifically to the current item in the Profile window. In
additon to adding and removing objects, you can also execute get
and set requests from this menu. Object Information opens a
dialog box that displays object values, including the MIB name,
along with object label, ID, range, index and type. The dialog
box allows you to modify the value of the current variable or to
change the index for a table variable.
To create a profile:
1. Select New Profile from the File menu.
2. Verify the default entries in the MIB Browser dialog box. Select
the network protocol used for the target device as UDP or IPX.
Change the target address and community string if required.
3. Press OK to continue or Cancel to abort the operation. The
Profile window will open as shown
below.
6-14
Page 61

SNMP MIB MANAGEMENT
Note: To open an existing
profile, select Open
Profile from the File
menu.
To open the profile window,
select New Profile from the
File menu and enter the
target parameters in the
dialog box.
Select the required variables
from the MIB Tree window
and press the Add to Profile
button.
4. Select the required variable from the MIB Tree window
by highlighting it with your mouse and then pressing the
Add to Profile button.
5. The Add to profile dialog box will open, allowing you to
verify the selected variable and destination profile. Press
OK to include the selected variable in your profile or
Cancel to abort the selection.
6. MIB name, object label, table index and value fields for the selected variable will be added to
the Profile window. Note that the table index will be 0 if the selected item is not a table
variable, and the initial value displayed is <null>.
7. Use the editing buttons provided in the Profile window
toolbar to insert or remove variables, or to display the
MIB definition for any variable.
8. Use the data request buttons to get or set the values for
the profile set as a group. To cancel a request, use the
delete button.
9. After defining the required profile list, use the save file button to
write the profile to disk, or the open file button to start a new
profile.
6-15
Page 62

SNMP MIB MANAGEMENT
Using the Output Editor
The output editor is designed for creating system status reports based
on information you fetch from the MIB database. You can insert a
wide range of object information into the output editor using the data
request functions provided in the MIB Tree and Profile windows. The
output editor provides basic tools required to edit data retrieved from
the MIB.
To open an output window:
1. Click on the output button in the main toolbar to open the output window.
2. Select Output from the Options menu to open the Output Options dialog box. Mark the Output
to Editor checkbox,
select the output mode as
ASCII or binary, and select the
object information to display.
Then press OK to continue or
Cancel to abort the selected
output options.
3. Select the required variables
from the MIB Tree, and then
use Get, GetNext or Set
requests to insert information
into the output window. Get
or Set requests executed in the Profile window will also insert returned data into the Editor
window.
4. Use the editing functions provided in the output editor toolbar. (Refer to the description of how
to display information on toolbar buttons using the Status Bar in Chapter 3.) Note that edited
reports can be printed directly from the editor window or saved to disk for later reference.
6-16
Page 63

CHAPTER 7
COLLECTING DATA WITH LOG MANAGER
The Log Manager is a powerful tool for the network manager. By collecting relevant network statistics
periodically from all SNMP-compliant network devices, the Log Manager can:
• Record network characteristics (e.g., utilization, error rate)
Set thresholds to generate events when values are out of range
Provide the basis upon which you can predict future network load based on current usage and
plan for future requirements
The Log Manager is designed with a filtering mechanism that logs only the data you indicate. The Log
Manager works with other EliteView applications such as the Event Manager, Log Database Manager,
and the MIB Browser. Thresholds can be set to generate specific events to warn the network
manager of certain unique conditions. All information can be logged in a database and easily retrieved
in numeric or graphic form. You can pause logging at any time for a selected process or for the entire
system, if necessary.
Events specified in the Log Manager are passed to the Event Manager. In response to an event, an
audible alarm, on-screen message, or a user-defined application can be executed.
Overview
To view the Log Manager window, select Log Manager from the Utilities menu of the main EliteView
program, or from the EliteView program group. If needed, the Log Manager can be started
automatically along with the EliteView main program; see “Customizing EliteView,” Appendix B. The
Log Manager can also be invoked from other management modules, like the MIB Browser.
7-1
Page 64

COLLECTING DATA WITH LOG MANAGER
The Log Manager dialog box consists of a menu bar, a toolbar, a list
of all user-defined log processes, and a summary of log parameters
for the currently selected process. Note that the same functions are
provided in both the menu bar and toolbar.
The first step in using the Log Manager is to decide which MIB
variables you should log to solve a specific problem or just to
maintain a record of system performance. If you are not sure about
the MIB variables, refer to their description in the MIB Browser or in
the relevant RFC documents.
To display the current log parameters for any process, click on the
required process with your mouse. (The þ and || markers to left of
each process entry indicate whether this process is currently active
or paused.)
The toolbar provides access to all functions in the Log Manager.
The three key function groups include data display, process
editing, and process management. To delete, edit, activate or
pause a process, first identify the concerned process by clicking
on it with your mouse, and then select the appropriate function.
For a description of log parameters listed in the main window,
refer to the “Field Description for Log Manager/Information
Dialog Boxes” in the following section.
Editing a Log Process
EliteView’s powerful Log Manager gathers a wide variety of
network statistics based upon rules (i.e., log processes) you define. Using the Log
Manager, you can monitor any MIB variable for a target SNMP device. Each log
process defines the parameters under which data related to the specified MIB
variable is collected and placed in the central database. The Log Manager controls
the data collection activity, as well as allowing you to display and manipulate the data gathered as
described in the section on “Viewing Log Data.”
To add a new log process:
1. Click the “Add a new record” toolbar button.
2. Fill in the parameters in the Log Information dialog box. Process parameters are defined in the
table on the next page.
Not all parameters are required. Only Protocol, Target Address and Variable are mandatory.
7-2
Page 65

COLLECTING DATA WITH LOG MANAGER
Protocol - Click the down arrow to choose from UDP (default), IPX or Ethernet.
Target Address - Use appropriate notation for selected protocol.
Community - Community strings control access rights to network resources. Define your own
community string to prevent unauthorized access to critical resources. However, if you do not
have any special security concerns, then retain the default community string of public. Refer to
the description for object editing in “Defining the Network Configuration,” Chapter 4.
MIB Module - Includes standard MIBs based on the RFCs, device-specific MIBs, and private MIBs.
For variable names not duplicated in other MIB modules, the default of Any is sufficient
3. Choose OK to add the new log process or Cancel to abort your selections.
Field Description for Log Manager/Information Dialog Boxes
Parameters Description Example
Community2Community string used to access the target device. public
Log Name
Target Name1A user-defined name for this device stored in the Name Database. MIS Server
Target Address Network address of the target device. 192.72.24.232
Protocol Network transport protocol used to request data, i.e., UDP/IP, IPX or Ethernet. UDP
MIB Module
MIB Variable Name of the variable being polled, (as defined in the MIB database). hubTotalBytes
Index
Start Time Time to start log process. (YYYYMMDDHHMM) 199908260800
Stop Time Time to stop log process. (YYYYMMDDHHMM) 199908260800
Filter Formula used to filter information.
Threshold When true, this formula will generate an event and pass it to the Event Manager. R>100
Event Name Name of event enabled by Event Manager when threshold condition is met. CRITICAL
Polling Interval Elapsed time between data requests (sec). 30
Notes
1 - These variables only appear in the Log Manager dialog box.
2 - These variables only appear in the Log Information dialog box.
3 - If you are unsure if an index is required for a variable, first examine the specification for that variable under the MIB Browser.
2
Process identifier displayed in process list.
2
Module to search for variable. Select a specific module or Any module.
3
1
Index to entry in a table variable. 1
Short comment associated with this log process. If excess CRC errors
RFC1213-MIB
(VALUE > 100) AND
(TIME < 120000)
occur, check port 9
Modifying a Log Process
You can easily “fine tune” the parameters for any log process.
To modify a log process:
1. Highlight the relevant process in the Log Manager screen.
2. Open the Log Information by pressing the edit button.
3. Enter a new value for any parameter.
4. Click OK to accept the new value or click Cancel to abort any changes.
7-3
Page 66

COLLECTING DATA WITH LOG MANAGER
To delete a log process:
1. Highlight the relevant log process in the Log Manager.
2. Click the “Delete record” toolbar button.
Note that deleting a process also deletes all log files associated with that process.
Log Controls
The Log Manager has two basic toggle switches for logging:
• System Activate/Pause toggles all logging activities on/off.
• Log Activate/Pause toggles logging for a selected process.
Viewing Log Data
Log data is saved in dBASE-compatible files. EliteView offers several ways to view logged data. To
view a log file:
• Open Log Manager and double-click on the required process.
• Highlight a process with your mouse, and then press the numeric
or graphic data display icon. (Note that the numeric data display
icon is just another entry point for the Log Database Manager.)
• Open the Log Database Manager from the Program Manager.
Using the Log Database Manager
The Log Database Manager displays data from the different log
processes listed in the Log Manager window. Information in the log
database may be readily copied and shared with other
applications. Open the Log Database Manager as described
above. The numeric display posts information for data
matching the filter criteria up to the current polling interval,
including the date, time and specific data for the selected
variable. New Arrival shows the count for filtered data that
have not yet been included in the display. Refer to the
diagram on page 3-4 for an illustration of how the Log
Manager works.
7-4
Page 67

COLLECTING DATA WITH LOG MANAGER
File Menu
The file menu provides functions for retrieving log files, copying selected data to a specified file, or
moving specified data to another file.
To copy selected data to another file, use the Copy To.. command. This data is saved in standard
dBASE format (with a dbf extension) and may be accessed using a database program for further
processing.
To move selected data to another file, using the Move To.. command. Moved data disappears from
the database window. This data is saved in standard dBASE format (*.dbf) and may be accessed using
a database program for further processing.
To load a data file, select Load from the File menu, select the
required process from the Load list and press OK.
Note: The Load option is only enabled when the Log Database
Manager is opened from outside the Log Manager
(i.e., from the main EliteView program or from the
EliteView group window). When using the Log Manager,
the Log Database Manager will only load the process
selected from the Log Manager dialog box.
Edit Menu
The edit menu provides functions for deleting selected entries, copying data to the clipboard, and
refreshing the display.
To delete entries from the database, select the required items with your mouse, and then choose
Delete from the Edit menu. Note that deleting all entries will not remove the log file.
To copy entries from the log database to the clipboard, select the required items with your mouse,
choose Copy or Delete from the Edit menu, and then choose Paste from the target application.
Data is logged directly into a log file associated with each process. The Log Database Manager only
displays the data stored this file. The New Arrival line at the bottom of the dialog box indicates the
number of events recorded into the log file since the last time data was retrieved by the Log
Database Manager. To update the display, use the Refresh command.
Using the Graphic Display Dialog Box
Open the graphic display from the Log Manager by
selecting a process and clicking on the Graphic Data
Display button in the toolbar. This dialog box displays a
real-time graph of the count for data matched up to the
current polling interval.
Click Config to change the display parameters. The Config
Statistics dialog box appears. You can change the scale,
style (i.e., filled curve, curve, line) and color, or reset the
graph.
7-5
Page 68

COLLECTING DATA WITH LOG MANAGER
Click Config to change the display parameters. The Config
Statistics dialog box appears. You can change the scale, style (i.e.,
filled curve, curve, line) and color, or reset the graph.
To change the scale, you can adjust the display interval by sliding
the red slider up or down on the ruler, by defining a specific
interval in the edit box (located in the lower left corner of the
dialog box), or by editing the value for each tick mark in the edit
boxes next to the ruler. You can also change the ruler displayed
for the Configuration dialog box by clicking on Ruler... and
entering a new Base value and/or Unit of interval.
Be sure to reset the graph if necessary. Then click OK to return to the graph, or Cancel to abort any
changes.
Defining Filter Formulas
Filters may be defined for any log process. A filter sets the conditions that determine if data received
by the Log Manager will be saved into the log database. A filter is defined in the Filter field of the Log
Information dialog box (i.e., the dialog box opened when you create or edit a log process). If no filter
is defined, then all the data received is automatically logged.
Filter Formula
The filter formula uses Backus-Naur Form (BNF) as follows:
Filter::= SimpleExpression|
ComplexExpression|
<NULL> -- Nothing
SimpleExpression::=Variable rel_op Value
Variable::= "VALUE"| --Value of the data
"DATE" | --Date the data arrives
"TIME" --Time the data arrives
rel_op::= ">" | --Greater than
"<" | --Less than
">="| --Greater than or Equal to
"<="| --Less than or Equal to
"=="| --Equal
"!="| --Unequal
7-6
Page 69

COLLECTING DATA WITH LOG MANAGER
Value::=<INTEGER VALUE>| --Number represented in decimal digits, within the range
of a 4-byte unsigned integer.
<yymmdd>| --Eight digits representing a date.
<hhmmss> --Eight digits representing a time, in 24 hour format
ComplexExpression::=
"(" SimpleExpression ")" |
"(" ComplexExpression ")"|
ComplexExpression logic_op ComplexExpression
logic_op::="AND"| "OR"
Filter Formula Syntax
The filter formula can be a simple or complex expression.
Syntax for Simple Expressions
A simple expression conforms to the following syntax:
Variable Relation Value
Variable - Legal variables include:
VALUE -- Value of the data
DATE -- Date the data arrives
TIME -- Time the data arrives
Relation - Legal relations include:
> -- Greater than
< -- Less than
>= -- Greater than or Equal to
<= -- Less than or Equal to
== -- Equal
!= -- Unequal
Value - Legal values include:
<INTEGER VALUE> -- An unsigned integer, 0 ~ 4 bytes long.
<yyyymmdd> -- Eight digits representing a date, where yyyy stands for the year, mm
the month and dd the day
<hhmmss> -- Six digits representing time in 24-hour format, where hh stands for
hour, mm minutes and ss seconds
7-7
Page 70

COLLECTING DATA WITH LOG MANAGER
Syntax for Complex Expressions
A complex expression combines several simple expressions using logical operators. Each expression
must be enclosed in parentheses. The syntax for a complex expression follows:
(Simple Expression) Logical_Operator (Simple Expression)
As described in the previous section a simple expressions should have three basic elements, namely,
a Variable, Relation and Value. Legal values for each element are described under the syntax for
simple expressions.
Logical_Operator - Legal values include:
AND -- Both expressions must be true to meet a given condition
OR -- One true expression is enough to meet a given condition
Elements of Filter Formulas
Parameters Example Description
Variable VALUE Value of the data
Date when the value is reached
Time when the value is reached
Relation >
Value 256
Logical_Operator AND
<
>=
<=
==
!=
19990229
135501
OR
Greater than
Less than
Greater than or equal to
Less than or equal to
Equal
Not equal
Positive number (4 byte unsigned integer)
Date format (YYYYMMDD) for 2 Feb 1999
Time format (HHMMSS) for 01:55:01pm
Both statements must be true
Either statement may be true
Notes: 1. The equal to (==) and unequal (!=) expressions follow C language syntax.
2. If more than one expression is used to define a filter, first enclose each expression in
parentheses and then combine them with AND or OR. Parentheses are used to maintain
the order of evaluation. Otherwise conditions are evaluated from left to right.
3. If you want to test a log process without saving data into the database, set the filter
formula to an impossible condition; for example, (TIME<000000).
Example: Filter Formulas
Some possible filter formulas include:
• VALUE > 10000
• (VALUE > 100) AND (VALUE < 10000)
• ((DATE < 19990701) AND (TIME>120000)) OR
• ((DATE >=19990701) AND (TIME<120000))
7-8
Page 71

COLLECTING DATA WITH LOG MANAGER
In the last formula, data is filtered on (before 1 July 1994 after 12 noon) or (after 1 July 1994 before
12 noon).
A formula follows this basic syntax:
(Variable Relation Value Logical_Operator
(Variable Relation Value)
Defining Threshold Formulas
Thresholds are used to trigger events (which are defined in the Event Manager). EliteView’s
powerful Event Manager allows you to define an unlimited number of events corresponding to
specific actions. See the chapter 8, Managing Events for more information on defining event
response procedures.
EliteView’s Log Manager uses thresholds to trigger an event. For example, a critical event can be
handled whenever CRC errors exceed 5 per minute.
To set thresholds triggering certain events,
1. Define an event using the Event Manager, specifying an Event Name and Event Action.
2. Define threshold limits using the Log Manager. Fill in the Threshold field with the appropriate
formula. Also fill in other necessary fields in the Log Information dialog box.
Threshold vs. Filter Formula
A threshold formula is very similar to the filter formula. In a threshold formula, the value of the data or
the data rate can be used. For example, a threshold formula can monitor value fluctuations based on
rates per second, per minute, or per hour.
Accuracy
Data rates greater than one per second are accurate. In computing data rates per second, the Log
Manager calculates an average between each two consecutive data units.
Threshold Formula
The threshold formula uses Backus-Naur Form (BNF) as follows:
Threshold::= SimpleExpression|
ComplexExpression|
<NULL>-- Nothing
7-9
Page 72

COLLECTING DATA WITH LOG MANAGER
SimpleExpression::=Variable rel_op Value
Variable::= "R"| -- Value of data
"H"| -- Changes in data per hour
"M"| -- Changes in data per minute
"S" -- Changes in data per second
rel_op::= ">" | -- Greater than
"<" | -- Less than
">="| -- Greater than or Equal to
"<="| -- Less than or Equal to
"=="| -- Equal
"!="| -- Unequal
Value::=<INTEGER VALUE>| -- Number represented in decimal digits, within the range of a 4-byte
unsigned integer.
ComplexExpression::=
"(" SimpleExpression ")"|
"(" ComplexExpression ")"|
ComplexExpression logic_op ComplexExpression
logic_op::="AND"|"OR"
Threshold Formula Syntax
The threshold formula can be a simple or complex expression.
Syntax for Simple Expressions
A simple expression follows the following syntax:
Variable Relation Value
Variable - Legal variables include:
R -- Value of data
H -- Changes in data per hour
M -- Changes in data per minute
S -- Changes in data per second
Relation - Legal relations include:
> -- Greater than
< -- Less than
7-10
Page 73

>= -- Greater than or Equal to
<= -- Less than or Equal to
== -- Equal
!= -- Unequal
Value - Legal values include:
<INTEGER VALUE> -- An unsigned integer, 0 ~ 4 bytes long.
Syntax for Complex Expressions
Refer to the same section under Filter Formulas Syntax.
Elements of Threshold Formulas
Parameters Example Description
Variable R
Relation >
Value 256
Logical_Operator AND
H
M
S
<
>=
<=
==
!=
19990229
135501
OR
Actual value of the data
Data rate per hour
Data rate per minute
Data rate per secon d
Greater than
Less than
Greater than or equal to
Less than or equal to
Equal
Not equal
Positive number (4 byte unsigned integer)
Date format (YYYYMMDD) for 2 Feb 1999
Time format (HHMMSS) for 1:55:01pm
Both statements must be true
Either statement may be true
COLLECTING DATA WITH LOG MANAGER
Example: Threshold Formulas
Some possible threshold formulas include:
• R > 1000
• (M > 5) OR (H > 500)
• (S > 100) AND (R < 10000)
In the last formula, an event is triggered if (the data is changing at the rate greater than 100 per
second) or (the value is less than 10,000).
A formula follows this basic syntax:
(Variable Relation Value) Logical_Operator (Variable Relation Value)
7-11
Page 74

COLLECTING DATA WITH LOG MANAGER
7-12
Page 75

CHAPTER 8
MANAGING EVENTS
Understanding the Event Manager
Events are special conditions which occur during normal operation of network devices, and normally
require the network manager’s attention. Events are generated by the main EliteView program, the
Log Manager, and the Trap Manager.
In response to messages from the main EliteView program, the
Trap Manager or Log Manager, the Event Manager can dispatch
actions in any of five different ways.
• Sound audible signal
• Display on-screen message box
• Log event into an on-screen report window
• Run any user-specified program, e.g., BEEPER, FAX, EMAIL, etc.
• Log events into a database for later analysis
Unlike simplistic network monitoring, EliteView’s Event Manager can accept input and process the
event according to pre-defined rules.
Starting the Event Manager
The Event Manager automatically starts when the main EliteView program is invoked, and when any
system or user-defined event occurs. If the Event Manager is closed or hidden, simply select Event
Manager from the Utilities menu of main EliteView program or click on the Event Manager icon in
the EliteView program group to bring it up.
8-1
Page 76

MANAGING EVENTS
Defining Events
The Event Manager supports system and user events, as indicated in the Type field for the selected
event.
Pre-Defined “System” Events
Pre-defined system events include the following:
• Connection Lost - a device fails to respond after the specified number of retires.
• Device Up - a device which has previously been “down” is now responding.
• TFTP - a device is currently performing file transfer or download.
Trap - a device has issued a trap message and it has been received by the Trap Manager. The
Trap Manager translates the trap message into a readable text string.
Defining “User” Events
In addition to the pre-defined system events, the Event Manager supports user-definable events.
To add an event to the Event Manager,
1. From the EliteView main program window, choose Event
Manager from the Utilities menu.
2. Click on the Add button.
3. In the Add Event dialog box, enter a descriptive name of
the event.
4. Click on the OK button to accept the new event or click on Cancel to abort this action.
Defining Event Actions
In response to any system or user events, the Event Manager
can be used to take specific actions. The five basic actions are:
• Sound audible signal
• Display on-screen message box
• Log event into an on-screen report window
• Run any user-specified program, e.g., BEEPER, FAX, EMAIL.
• Log event into a database for later analysis
Press this button to view the event database
8-2
Page 77

To define an action:
1. Click on the event name
2. Enter annotation in the Note field (optional)
3. Click on one or more Actions (Beep, Show, Run, Send, Write)
Actions Description Example
Beep Sound an audible signal on the network
management station (i.e., your local PC).
Show message box Display a user-definded message in a text box
on the NMS’s screen. The message box
appears on top of all the other windows. When
the message appears, just click on the OK
button to dismiss the message.
This action is recommended for critical
events.
Run program Execute any Windows-based application. This
is ideal for sending a message to a pager,
email or FAX.
Send message to REPORT Pass a message to the EliteView REPORT
module. Report messages are time stamped
and shown in chronological order. In addition,
Report messages are shown in context with
one another.
This action is recommended for routine
events.
Write into database Put a message into the event database Excessive CRC errors on device
CRITICAL: Hub overheating
PAGER 408-555-4742
WARNING: Server disk > 90% full
MANAGING EVENTS
Example: Displaying a text file
When an important event occurs, you may display instructions for others to follow. For example,
a text file named URGENT.TXT might include information on how to contact key personnel who
can fix the problem (telephone number, pager number, etc.).
To display information with Windows Notepad:
1. Open the Event Manager.
2. Choose an event.
3. Click on the Run Program action and type
NOTEPAD [PATH]URGENT.TXT
4. Use the Windows Notepad program to create the file URGENT.TXT in the indicated directory.
When the specified event occurs, the text file URGENT.TXT will be automatically displayed using
Notepad.
8-3
Page 78

MANAGING EVENTS
Using Special Text
The Event Manager supports special text messages using the $$ and ## symbols in the text boxes.
• $$ is substituted with text provided by the source of the event. For example, Trap Manager will
pass a text string translated from the trap message provided by the device. If no trap messages
are available, then $$ will be null.
• ## is substituted with the network address of the device.
Example: Logging detailed messages
To log a detailed message in the database (or message box or report window), use the special
text substitutions (i.e., $$ or ##).
To make an entry in the database like
"192.75.255.32 TEMPERATURE EXCEEDS 85 DEGREES",
1. Choose an event name.
2. Check the box for Write into database.
3. In the adjacent text box, enter - ## $$
Event Data
Event data is stored in a dBASE-compatible file (EVENT_DT.DBF).
To view event data from the Event Manager:
1. Double-click on an event name, or click on the View Data button.
2. The Event Data window will show a listing of events.
Parameters Description Example
Date Date when the event occurred 07/16/1999
Time Time when the event occurred 13:33:48 (1:33 pm)
Device IP network address of the device 192.9.211.52
Description Text from “Write into database” Dropped server connection
3. Click the Close button to close the Event Data window.
8-4
Page 79

MANAGING EVENTS
To erase some or all event information:
1. From the Event Data window, select the target event line. To delete all event information, click
the Select All button. The selected entries are highlighted.
2. Click on the Delete button to delete highlighted events.
To print information from the event database:
1. From the Event Database window, click on the Print button.
2. Select the required events.
3. To set the print pointer at the beginning of the database, mark the radio button for From
Beginning. To set the pointer at the location where the last print operation terminated, mark the
radio button for From Last Printed Data.
4. Edit the From and To times if required.
5. Use the Print Setup button to verify your printer settings.
6. Press the Print button and then press Close.
Note: Event logs may be viewed by any application that can import a dBASE (.DBF) file, such as
FoxPro.
Receiving SNMP Traps with the Trap Manager
Trap is a protocol mechanism defined in SNMP by which managed devices report unique events to
the network management station. Devices can be set up to report specified conditions to EliteView
using Trap messages.
Limitations of Trap Messages
Trap messages are designed to report information that requires immediate attention. However,
the value of Traps is limited in SNMP because there is no guarantee these messages will be
delivered. Trap messages may be lost en route or ignored by the network manager.
Trap Types
There are two types of traps defined in the SNMP standard.
Generic trap is supported by all SNMP-compliant devices. The most common events include cold
start, warm start, link down, link up, SNMP authentication failure, and EGP neighbor loss. (EGP is
the Exterior Gateway Protocol used to exchang routing information.) Generic traps, numbered 0 to
5 in the “generic trap” field of the trap message, are defined in TRAP.INI.
Specific trap is supported according to the characteristics of the device. Specific traps are
numbered 6 in the “generic trap” field. A “specific trap” field identifies the trap type.
8-5
Page 80

MANAGING EVENTS
Trap Manager
EliteView’s Trap Manager collects trap messages and converts them into events. The Trap Manager
generates a “trap” event and outputs a text message according to the pattern specified in
TRAP.INI. These events are then handled by the Event Manager.
If the TRAP.INI file is changed, re-boot the Trap Manager by closing it and then starting it again.
The Trap Manager has no tangible user interface. When the main EliteView program is started, if
the Trap Manager is not loaded automatically (as defined in NETMGR.INI), then you can load it
from the Utilities menu, or from the Window’s Program Manager (by clicking on the Trap Manager
icon in the EliteView program group). When EliteView terminates, the Trap Manager is also closed.
Posting Messages to the Report Window
Both predefined and user-defined system activity may be specified in the Event Manager to be
posted to EliteView’s Report window. If any event criteria have been met, then this window will
display a chronological list of pertinent messages stamped by time and date.
To view the Report window, select Report from the Utilities menu of the main EliteView program,
or click on the Report icon in the EliteView program group.
The Report window shows user-definable messages in chronological order. Entries placed in the
Report window by the Event Manager include connection lost, device up, tftp, and trap messages.
Field Description for Report Menus
Menu Function
File Open - Opens any previously saved Report file.
Save - Saves the current Report file.
Save As - Save the current Report file under a new name.
Print - Prints the current file.
Exit - Closes the Report window.
Edit Copy - Copies the selected data into the Windows clipboard.
Search Find - Searches for the specified data.
Clear - Deletes all information from the Report window.
Find Next - Searches the next occurance of the specified data.
Find Previous - Searches the previous occurance of the specified data.
To copy from Report window to another Windows application,
1. Drag the mouse over the target text.
2. From the Edit menu, choose Copy.
3. Switch to another Windows application.
4. From the target application’s main menu, choose Paste from the Edit menu. The highlighted
text from EliteView Report will now appear in the target application.
8-6
Page 81

CHAPTER 9
USING RMON
Introduction
This chapter describes how to use Remote Monitoring (RMON) to more effectively monitor your
network. RMON provides a cost-effective way to monitor large networks by placing embeded or
external probes on distributed network equipment (i.e., hubs, switches or routers). EliteView can
access the probes embedded in recent SMC network products to perform traffic analysis,
troubleshoot network problems, evaluate historical trends, or implement proactive management
policies. RMON has already become a valuable tool for network managers faced with a quickly
changing network landscape that contains dozens or hundreds of separate segments. RMON is the
only way to retain control of the network and analyze applications running at multi-megabit speeds.
It provides the tools you need to implement either reactive or proactive policies that can keep
your network running based on real-time access to key statistical information.
RMON can be used to perform a wide range of mangement tasks, including:
• Troubleshoot problems
• Track down intermittent problems
• Locate bottlenecks
• Plan for network expansion
A Brief Description of RMON
Remote Monitoring allows you to instruct a remote device to collect information or respond to
specified events on an independent basis. An RMON-capable device can independently perform a
wide range of tasks, significantly reducing network management traffic. It can continuously run
diagnostics and log network performance. If an event is triggered, the remote device can
automatically notify the network administrator of a failure and provide historical information about
the event. If the remote device cannot connect to the management agent, it will continue to
perform any specified tasks and pass data back to the management station the next time it contacts
the remote device.
RMON is designed to limit the amount of traffic required by management applications. It consists of
an independent agent that resides on the managed device, and is charged with monitoring and
collecting information about network traffic or the status of the host device. The agent gradually
builds up information about the attached segment or VLAN, storing this information in the relevant
RMON database group. The client (or mangement agent) then periodically communicates with the
various RMON probes using SNMP protocol. It can then present a numeric or graphic summary of
the data collected from a large number of probes. However, if the probe encounters a critical event
(as defined by the management agent), it can automatically send a trap to the management agent
which will then respond to the event as determined by the Event Manager (see Chapter 8).
9-1
Page 82

USING RMON
Starting the RMON Manager
To use the RMON Manager, open any network map and select the RMON program from the menu bar . You
can also run the RMON Manager directly from the Start Menu by selecting the RMON Manager icon directly
from the EliteView program group.
When you start the RMON Manager, a Probe Information window will pop up requesting target
information. You must provide the following information:
1. Enter the Target Address of the device.
2. Define a Community name describing the administrative relationship (i.e., access rights) between
SNMP entities.
If you open the main application for the RMON Manager, the screen will display a detailed
description of the managed device as shown in the following example for a TigerSwitch
SMC6948L2
Field Description
Probe IP Address The IP addres s of the RMON prob e.
Description Description of the device, including manufacturer and model name.
Object Identifier The object identifier used to identify this device in the MIB tree.
On Since The time at which the device was turned on.
Contact The person responsible for man aging this devic e.
Name Name used for this device; such as a hierarchical network nam e.
Location Physical location of the device.
Services Netw o rk service s provided by the devic e, as specified in the seven-
Number of Interfaces Number of port interfaces provided by the device.
layer network protocol of the Open Systems Interconnection.
9-2
Page 83

RMON Utilities
The RMON Manager currently provides access to all nine RMON groups, as shown in the following
table. Most of SMC’s intelligent products provide support for mini-RMON (which include Statistics,
History, Alarms and Events). This selection covers key information required to manage your
network on a regular basis, and also switches, and especially on all backbone switches. An external
RMON probe that supports all nine RMON groups can then be used for extended troubleshooting
when needed.
Group Description
Statistics Shows bandwidth utilization, counters for network traffic, errors and collisions, as well as
packet size distribution
History Periodically samples and saves information from the statistics group.
Hosts Maintains statistics on each host attached to the network device monitored by the probe.
Host Top N Displays a specified subset of statistics for a selected number of top users.
Matrix Maintains statistics on traffic passing between node pairs.
Alarms Sets thresholds for RMON variables, which can subsequently trigger response events.
Events Defines the action to take when an alarm is triggered, including logging the alarm,
generating a trap message, or triggering a capture channel.
Filters Filters a stream of packets that match the specified criteria.
Capture Configures the buffers used to store packets generated from the Filter group.
Statistics Group
USING RMON
The Statistics Group includes all the tools you need to monitor your network for common errors and
overall traffic rates. When you open the Statistics Group the Control Table screen is displayed as
shown below. This table allows you to add, edit and delete items to be monitored, or to select a
specific index entry and then view the statistical data in numeric or graphic form.
Field Description
Total The total number of index entries contained in the Control Table.
Read Status The read status of information in the Statistics Control Table.
Index Index for table row. Creator can assign a value from 1 to 65,535.
Owner Name of person who created this entry in the Control Table.
Interface The port number of the interface on the device.
Status The current status of the index entry in the Control Table:
VALID, UNDER CREATION or INVALID
View Opens a graphical display of statistics for the selected index entry.
Add Opens a dialog box for creating a new entry in the Control Table.
Edit Opens a dialog box for editing a selected entry in the Control Table.
Delete Deletes the selected entry from the Control Table.
9-3
Page 84

USING RMON
Adding or Editing an Entry in the Control Table
Click on the Add (Edit) button in the Statistics Control Table to
add (edit) an index entry. The dialog box that opens includes
three fields (1) entry index number, (2) system interface
number, and (3) owner of this entry. The system automatically
generates an index number, but you can enter any number
from 1 to 65,535 that is not currently in use. Each interface
number equates to a physical media on the device being
monitored. This information can be found under MIB2 as shown to the right.
(See MIB Browser in Chapter 6.)
The interfaces to the SMC6508 switch and SMC5912/24 dual-speed hub are listed in the tables
below.
SMC6508 Interface Description
Interface Description
1 - 8 Ports 1 - 8 (10 Mbps port)
9 Port 9 (10/100 Mbps port)
10 Port 10 (100BASE-TX or 100BASE-FX port)
SMC5912/5924 Interface Description
9-4
Interface Desc ription
1 Agent board 100 Mbps interface
2 Agent board 10 Mbps interface
3 Serial port used for out-of-band connection
4 100 Mbps stack backplane
5 10 Mbps stack backplane
6
7
.
.
.
16
17
Stack Unit 1 100 Mbps segment
Stack Unit 1 10 Mbps segment
Stack Unit 6 100 Mbps segment
Stack Unit 6 10 Mbps segment
Page 85

USING RMON
Viewing Statistics
The RMON Manager collects statistics that allow you to quickly determine how the network
is performing. Information is provided on bandwidth utilization, packet types, errors and collisions,
as well as the distribution of packet sizes. Information is also included on peak utilization. Statistics
are displayed in both a numeric and graphic format that can be easily interpreted. To display
statistics for a specific entry, click on the View button in the Control Table. The various statistic
screens are shown below. The scale for the graphic displays are automatically adjusted to present
the best view possible. (However, note that the smallest increment on the vertical axis is limited to
0.05.). If necessary, you can reduce the polling interval to focus in a specific problem area, or
increase it to reduce the overall management traffic running on the network.
9-5
Page 86

USING RMON
9-6
Page 87

USING RMON
Statistics are provided for the following areas
Field Description
Utilization Displays the percentage of bandwidth utilized over the sample
period. It also shows the total count, the rate, and the rate of
change (delta) for packets and bytes seen on the interface.
Packets Displays the total count, the rate, and the rate of change (delta) for
all packets, broadcasts, multicasts, and dropped packets.
Errors and Collisions Displays the total count, the rate, and the rate of change for
CRC/alignment errors, undersize packets, oversize packets,
fragments, jabbers, and collisions.
Packet Size Displays the distribution of packet sizes, including the total count,
the rate, and the rate of change for each packet size.
The statistics for each area are further described in the following table.
Field Description
Utilization
Util%
(Now, Max, Min)
Packets/Bytes1This table displays packets and bytes.
1
Packets
Packets Packets (including bad, broadcast and multicast packets).
Broadcasts Broadcast packets.
Multicasts Multicast packets.
Drops The number of events detected when packets were dropped (due to a lack of resources condition in the
Errors and Collisions
CRC/Alignment Packets with a CRC or alignment error.
Undersizes Undersize packets.
Oversizes Oversize packets.
Fragments Packet fragments.
Jabbers Jabber errors.
Collsions Packet collisions.
Packet Size Distribution
Size Packet sizes are divided into six groups, 64 byte packets, 65 to 127, 128 to 255, 256 to 511, 512 to
Note: Value - Total since the Control Table entry was created.
Delta - The difference in the count since the last poll.
Rate - The rate per second over the last polling interval.
This table displays the current bandwidth utilization, plus the maximum and minimum utilization since
the statistics window was opened.
probe.
1
1
1023, and 1024 to 1518 bytes. Each size group is indicated as color bar for each polling time.
9-7
Page 88

USING RMON
Each of these windows includes a Menu bar and Tool bar with the following items:
Field Description
File Exit
Polling
View
Control! Control Table
Help On-line help
Polling Time (5 - 3600 seconds), Pause, Resume
All, Utilization, Packets, Errors and Collisions, or Packet Size Distribution
They also include a status bar at the bottom of the window that includes the following items:
Field Description
Control Index The index for the entry defined in the Statistics Control Table.
Interface The media interface of the device being monitored.
Polling Time The interval between polling samples.
Speed The speed of the media interface being monitored.
Owner The person who created this entry.
History Group
The History Group can be used to create a record of network utilization, packet types, errors and
collisions. You need a historical record of activity to be able to track down intermittent problems.
Historical data can also be used to establish normal baseline activity, which may reveal problems
associated with high traffic levels, broadcast storms, or other unusual events. Historical information
can also be used to predict network growth and plan for expansion before your network becomes
too overloaded.
The History Group includes all the tools you need to monitor your network for common errors and
overall traffic rates. When you open the History Group the Control Table screen is displayed as
shown below. This table allows you to add, edit and delete collection entries, or to select a specific
index entry and then view the historical data in numeric or graphic form.
Field Description
Total The total number of index entries contained in the Control Table.
Read Status The read status of information in the Statistics Control Table.
Index Index for table row (automatically assigned).
Owner Name of person who created this entry in the Control Table.
Interface The selected interface on this device (as defined in MIB2).
(Buckets) Requested The number of samples to record. (Default: 50)
(Buckets) Granted The number of samples allowed by the system.
(Sample) Interval The interval between taking samples. (Default: 1800 seconds)
Status The current status of this entry in the Control Table.
9-8
Page 89

USING RMON
Adding or Editing an Entry in the Control Table
Click on the Add (Edit) button in the History Control Table to add (edit) an index entry as shown
on the preceding page. Each interface equates to a physical media on the device being monitored.
This information can be found under MIB2 (see page 6-5). The number of buckets indicates the
number of samples to record. You should always be able to record the default of 50 buckets
without overflowing the agent’s memory. However, if more than 50 buckets are requested, the
number actually granted will depend on the amount of memory currently available. Once all the
buckets are filled, older data will be discarded. You also need to specify the interval at which to
take samples. For example, using a 30 second interval with 120 buckets will provide one hour of
historical samples.
Viewing History
The RMON Manager collects historical information on bandwidth utilization, packet types, errors and
collisions, as well as the distribution of packet sizes for each entry you define. Each sample shows
the interval’s start time. The information collected during the interval is displayed in both numeric
and graphic format for easy interpretation.
To display the history for a specific entry, highlight that entry in the Control Table and click on the
View button. The various history screens are shown below. The scale for the graphic displays are
automatically adjusted to present the best view possible. If necessary, you can reduce the polling
interval to focus in a specific problem, or increase it to reduce overall management traffic running
on the network.
9-9
Page 90

USING RMON
Alarm and Event Groups
The Alarm and Event Groups allow you to record important events or immediately respond
to critical network problems. The Alarm and Event Control Tables (shown below) are used
together to define specific criteria that will generate response events. (Note that you must
use the scroll bar to display all the columns in the tables.) These tables allow you to add, edit
and delete items, or to select a specific index entry and then view
the corresponding response event (from the Alarm Table) or triggered events (from the Event
table).
Adding or Editing an Entry in the Control Table
Alarm Control Table - Alarms can be set to test data over any specified time interval, and
can monitor absolute or changing values (such as a statistical counter reaching a specific
value, or a statistic changing by a certain amount over the set interval). Alarms can be set to
respond to either rising or falling thresholds. (However, note that after an alarm is triggered
it will not be triggered again until the statistical value crosses the opposite bounding
threshold as described in the following table.) Click on the Add (Edit) button in the Alarm
Control Table to add (edit) an index entry. The dialog box that opens is described in the
following table.
9-10
Page 91

USING RMON
Field Description
Index The system automatically generates an index number.
Owner The name of the person who configured the entry in the Control Table.
Interval The time interval in seconds over which data is sampled and compared with the rising or falling
Variable The object identifier of the MIB variable to be sampled. Only variables that resolve to an integer
Sample Type The method of sampling data, either Absolute or Delta. For an absolute sample the variable will be
Startup Alarm How the alarm is activated when the variable is compared to the thresholds. This can be set to
Rising Threshold An alarm threshold for the sampled variable. If the current value is greater than or equal to the
Falling Threshold An alarm threshold for the sampled variable. If the current value is less than or equal to the
Rising Event The index of the Event that will be used if a rising alarm is triggered. If there is no corresponding
Falling Event The index of the Event that will be used if a falling alarm is triggered. If there is no corresponding
Status The current status of the entry in the Control Table: Valid, Under Creation or Invalid
Event Control Table - If the response corresponding to the alarm has not yet been defined, click
on the Event button to open the Event Control table. Click on the Add (Edit) button in the Event
Control Table to add (edit) an index entry. The dialog box that opens is described in the following
table.
threshold.
value may be sampled.
compared directly to the thresholds. For a delta sample the last sample is subtracted from the
current value and the difference is then compared to the thresholds.
Rising, Falling, or Rising or Falling.
threshold, and the last sample value was less than the threshold, then an alarm will be generated.
(After a rising event has been generated, another such event will not be generated until the sampled
value has fallen below the Rising Threshold and reaches the Falling Threshold.)
threshold, and the last sample value was greater than the threshold, then an alarm will be
generated. (After a falling event has been generated, another such event will not be generated until
the sampled value has risen above the Falling Threshold and reaches the Rising Threshold.)
entry in the Event Control Table, or if this number is zero, then no event will be generated.
entry in the Event Control Table, or if this number is zero, then no event will be generated.
9-11
Page 92

USING RMON
Field Description
Index A number that identifies the row in the table.
Description A text comment that describes the entry in the Control Table.
Type The type of action that is taken for the alarm. This can be None, Log, Trap, or Log and Trap.
Community The SNMP community name that a trap manager must use to receive trap messages.
Displaying Events in the RMON Manager - The Event determines the action to take when an
alarm is triggered. The response to an alarm can include logging the alarm or sending a message to a
trap manager. To display each time an event was triggered by an alarm, first highlight an entry in
the upper half of the Event Control Table, and then click on the Log Button . The Log Table at the
bottom half of the Event Control Table window will display each time this event was triggered. It
shows the log index number, the time of an event, and the description of the event that activated
this entry. (Note that there are no display windows associated with the Alarm and Event groups
other than the control tables.)
Host Group
The Host Group can maintain statistics on all devices found on the network, with the only limitation
being the amount of available buffer space. A full set of statistics, as defined in the Statistics Group,
can be maintained for each unique address. This group is generally used as one of the last steps in
troubleshooting. For example, if a network device has triggered a predefined event, you can
configure the RMON probe to collect host information for the media interface where the problem
occurred. After you have collected the pertinent data, it can be sorted for analysis based on MAC
address, creation order, selected statistic, or errors.
When you open the Host Group the Control Table is displayed as shown below. Use this table to
select an interface on the monitored device, such as a hub’s repeater bus, a port on a switch, or a
SLIP interface used for device management. Click on the Add (Edit) button to add (edit) an index
entry. The dialog box that opens is described in the following table.
9-12
Page 93

USING RMON
Field Description
Index A number that identifies the row in the table.
Owner The person who created this entry.
Interface A media interface on the monitored device. (MIB-2: 1.3.6.1.2.1.2.2.1.2)
Table Size The number of host entries added to this table by the RMON probe.
Last Delete Time The last time data was deleted from this table due to lack of space.
Status Possible states include “under creation,” “valid,” and “invalid.”
Refresh Time for
Control Table
To view the data collected for a specific interface, highlight the concerned entry in the control table
and press the View button. When you open the host table, the RMON Manager will poll
the RMON probe for the most current information. Polling may take a while to complete depending
on the number of entries included in the table. Note that the polling status is displayed in the status
bar at the bottom of the screen.
The refresh interval for this control table.
Range: 5-600 seconds
9-13
Page 94

USING RMON
By default, the entries are sorted according to address, cumulative values are listed in the numeric
table at the top of the screen, and packets/second are displayed in the graph at the bottom of the
screen. The configuration and display options are lised below.
Field Description
File Exit
Polling
View
Tool
Control!
Help
Polling Time (5 - 3600 seconds), Pause, Resume
Table
Graph
Find
Sort
descending order. (You can also sort the table by clicking on any column header.)
Control Table
On-line help
- Cumulative, Delta
- Packets, Bytes, Errors
- Locates a specific MAC address in the host table.
- Sorts the table based on any of the displayed columns, in ascending or
Note: If an entry displays “Lost Track” when you click on it in the table, the record cannot be found
either because polling was stopped before completion, or the entry was deleted due to lack
of space.
Host Top N Group
The Host Top N Group can display the hosts with the highest recorded value for a selected
statistic. This group can be used to identify the most active hosts on the network in regard to
certain statistics. The values are displayed as an overall rate for a specified interval for a specific
number of top hosts. The group can be used to quickly identify the most active hosts based on a
certain statistic, such as those that are transmitting the most broadcast messages or those that are
reporting the largest number of errors.
Use the control table shown below to configure entries for the Host Top N group, including the
device interface, the statistic to monitor, the duration to monitor, and the number of top hosts to
list. Click on the Add (Edit) button to add (edit) an index entry. The dialog box that opens is
described in the following table.
9-14
Page 95

USING RMON
Field Description
Index A number that identifies the row in the table.
Owner The person who created this entry.
Host Index, Interface A media interface on the monitored device. (MIB-2: 1.3.6.1.2.1.2.2.1.2)
Rate Base The statistic to monitor (In Packets, Out Packets, In Bytes, Out Bytes, Errors, Broadcasts,
or Multicasts).
Remaining The monitoring time remaining (in seconds).
Duration The length of time to monitor the interface.
Requested Size The number of top hosts to list.
Granted Size The number of top hosts the probe is able to list.
Start Time The value of SysUpTime when this entry was last started.
Status Possible states include “under creation,” “valid,” and “invalid.”
Refresh Time for
Control Table
The refresh interval for this control table.
Range: 5-600 seconds
To view the data collected for a specific entry, highlight it in the control table and press the View
button. When you open the Host Top N table, the RMON probe start monitoring the interface. The
time remaining to monitor the interface is listed at the top of table.
9-15
Page 96

USING RMON
The entries are sorted according to the most active hosts, with the change in value (delta) and rate
of change shown by the table at the top of the screen, and the rate shown by the graph at the
bottom of the screen. The configuration and display options are listed below.
Field Description
File Exit
Polling
Control!
Help
Automatically resets polling time after each period is completed.
Control Table
On-line help
Matrix Group
The Matrix group can maintain statistics on conversations that occur between each pair of hosts on
the network. This group can display statistics for traffic transmitted from any source address, traffic
received by any destination address, or traffic passing between any host pair. For example, if an
alarm is set off for a high watermark on traffic loading, you can use the Host Top N group to identify
the hosts with the heaviest load, and then use the Matrix group to analyze the conversations taking
place. If a host is transmitting a lot of packets, but not receiving many responses, this may indicate a
faulty device. On the other hand, if a host is receiving a lot of traffic but is not responding, either the
host is overloaded and cannot keep up with the requests, or the network is overloaded and should
be segmented.
9-16
Page 97

USING RMON
Use the control table shown below to configure entries for the Matrix group, including the device
interface and owner. Click on the Add (Edit) button to add (edit) an index entry. The dialog box that
opens is described in the following table.
Field Description
Index A number that identifies the row in the table.
Owner The person who created this entry.
Interface A media interface on the monitored device. (MIB-2: 1.3.6.1.2.1.2.2.1.2)
Table Size The number of host entries added to this table by the RMON probe.
Last Delete Time The last time data was deleted from this table due to lack of space.
Status Possible states include “under creation,” “valid,” and “invalid.”
Refresh Time for
Control Table
The refresh interval for this control table.
Range: 5-600 seconds
To view the matrix data collected for a specific interface, highlight it in the control table and press
the View button. When you open the Matrix table, the RMON probe starts monitoring the interface.
The number of entries downloaded is listed in the status bar at the bottom of the table.
9-17
Page 98

USING RMON
By default, the entries are sorted according to the source address, cumulative values are listed in
the numeric table at the top of the screen, and packets/second are displayed in the graph at the
bottom of the screen. Since the graph displays rate, nothing will be displayed for the highlighted
entry if no activity was seen during the last polling interval. The configuration and display options
are listed below.
Field Description
File Exit
Polling
View Table
Tool
Control!
Help
Polling Time (5 - 3600 seconds), Pause, Resume
Graph
Find
Sort
descending order. (You can also sort the table by clicking on any column header.)
Control Table
On-line help
- Locates a specific MAC address in the matrix table.
- Sorts the table based on any of the displayed columns, in ascending or
- Cumulative, Delta, Specific Source/Destination
- Packets, Bytes, Errors
9-18
Page 99

Note: When specifying the view for a specific source-
destination pair, you can specify both the source and
destination, just the source or destination (using Any
Address as shown in this example),
or all the transmitted and received traffic for a specific
address pair (using Reverse direction).
Filter and Capture Groups
The Filter Group is used to generate a packet stream from the frames that match a specified
pattern, while the Capture Group is used to manage the storage buffers for packets captured by
the Filter Group. These groups can be used to capture network traffic associated with precisely
defined events. The captured data or trigger events can then be used to debug application
problems or fine-tune network performance. From captured data, you can view the associated
network protocol, summary information for each packet, or a detailed hexadecimal and ASCII
breakdown of all traffic (page 5-24).
Use the control table to configure and activate channels as described below.
USING RMON
9-19
Page 100

USING RMON
Field Description
Owner The person who created this entry.
Interface A media interface on the monitored device. (MIB-2: 1.3.6.1.2.1.2.2.1.2)
Data Control Indicates if the capture channel is enabled or not. The capture channel may be manually
enabled or disabled using the On/Off button. Or a Turn-On Event defined for this channel can
be used to enable it. Once enabled, the channel will start capturing packets that pass the filter.
Accepted/Captured Indicates the number of times this channel has accepted a packet, and the number of
packets currently in this capture buffer.
Buffer Status Indicates whether the buffer space is available or full (wrapped or locked).
Channel Index A number that identifies the channel in the channel table.
Buffer Control Index A number that identifies this buffer in the bufferControl table.
Description A comment provided by the user describing this channel.
Buffer Displays the buffer for the selected control entry.
Filter Displays the filter control table.
On/Off This button is used to manually enable or disable the capture channel.
Refresh Time for
Control Table
Separate Tables Displays a tabbed window with the channel, filter and buffer tables.
Configuring Filters - You can set up to 20 filters for each channel. Just highlight the concerned
channel and then press the Filter button. If you define more than one filter, they will be OR’ed
together and compared against data crossing the specified interface. To configure filters, click on
the Add (Edit) button to add (edit) an entry. The dialog box that opens is described in the following
table.
The refresh interval for this control table.
Range: 5-600 seconds
9-20
 Loading...