

SMA Sunnu Boy 3000TL, Sunnu Boy 4000TL, Sunnu Boy 5000TL User Manual
SB30_50TL_21-BA-BEN113410 | IMEN-SBXTL-21 | Version 1.0 EN
PV Inverters
SUNNY BOY 3000TL/4000TL/5000TL
User manual
AC
Abbreviationfor "alternating current".
Bluetooth
Bluetooth is a radio technology that allows the inverterand other communication devices to
communicate with each other. Bluetooth communication does not require visual contact between the
devices.
DC
Abbreviation for "direct current".
Electronic Solar Switch (ESS)
The Electronic Solar Switch is part of the inverter DC disconnection unit. Electronic Solar Switch must
be securely inserted into the bottom of the inverter and must
only be removed by electrically qualied persons.
PV
Abbreviation for photovoltaics.
Visual inspection
Check the inverter and cables for any signs of external damage. Contact your installer if you nd any
damage. Do not perform any repair work yourself.
Maintenance and Cleaning
Ask your installer to check for correct inverter operation at regular intervals.
If the display eld or the LEDs are dirty and you nd it dicult to read the operating data and
operating states of the inverter, clean the display and the LEDs with a damp cloth. Do not use any
corrosive substances (e.g. solvents, abrasives) for cleaning.
VISUAL INSPECTION, MAINTENANCE AND CLEANING
Symbole am Wechselrichter
Operation display
Bluetooth®. Bluetooth
communication active.*
An error has occurred. Inform your installer immediately.
There are special requirements for the grounding.
Symbole auf dem Typenschild
Beware of dangerous electrical voltage.
The inverter operates at high voltages. Any work on the inverter must be carried
out by electrically qualied persons only.
Beware of hot surface.
The inverter can become hot during operation. Avoid contact during operation.
Observe enclosed documentation.
The inverter must not be disposed of together with the household waste.
Further disposal information can be found in the enclosed installation manual.
CE mark. The inverter complies with the requirements of the applicable EC
guidelines.
Device class label The inverter is equipped with a wireless component that
complies with the harmonized standards.
Certied safety The inverter complies with the requirements of the Europe
Equipment and Product Safety Act.
RAL quality mark for solar products The inverter complies with the requirements of
the German Institute for Quality Assurance and Labeling.
In compliance with Australian mark
Direct current (DC)
Alternating current (AC)
The inverter is protected against penetration by dust particles and water jets from
any angle.
The inverter is transformerless.
* The Bluetooth® word mark and logos are registered trademarks owned by Bluetooth SIG, Inc. and any
use of these marks by SMA Solar Technology AG is under license.
EXPLANATION OF SYMBOLS
GLOSSARY
Installer contact
CONTACT
If you have technical problems, contact your installer. The following information is required in
order to provide you with the necessary assistance:
• Inverter device type
• Inverter serial number
• Type and number of PV modules connected
• Event number or display message on the inverter
• Optional equipment (e.g. communication products)
SMA Solar Technology AG
Sonnenallee 1
34266 Niestetal, Germany
www.SMA.de
SMA Service Line
Inverters: +49 561 9522 1499
Communication: +49 561 9522 2499
Fax: +49 561 9522-4699
E-mail: Serviceline@SMA.de
GRAPH POWER DISPLAY
MEASUREMENT ACCURACY
DISPLAY OF ENABLED FUNCTIONS
DANGER!
Electric shock caused by high voltage in the inverter.
Even when no external voltage is present, there can still be high voltages in the inverter.
• Electrical installation, repair and retrotting may only be carried out by a trained
electrically qualied person:
• Persons with limited physical or physical abilities may only perform activities on the
inverter after tuition and under supervision.
• Children may not play with the inverter. Children may not have access to an inverter
in operation.
CAUTION!
Risk of injury from touching the enclosure during operation.
Burns to the body.
• Only touch the lower lid of the enclosure during operation.
NOTICE!
Yield loss due to poor heat dissipation!
• Do not place any objects on the enclosure.
Green LED is on: Operation
Green LED is
ashing:
Waiting for sucient irradiation.
Red LED is on: Failure: contact installer.
Blue LED is on: The inverter has been incorporated into a Bluetooth network and can communicate
with other devices with identical NetID.
Blue LED is ashing: The inverter was identied via Sunny Explorer by setting the "Find device"
parameter.
The power and energy of the inverter are displayed in three elds: Power, Day and Total. The
display is updated every ve seconds.
Power
The power that the inverter is currently feeding into the grid.
Day
The energy fed into the grid on this particular day. This equals the
energy generated between the inverter's start-up in the morning to the
current time.
Total
The total energy that the inverter has fed into the grid during its entire
operating time.
The inverter energy is shown as a diagram on the display. The
daily graph is displayed by default. The right-hand ashing bar
of the diagram represents the current hour. If the inverter does not
feed any power to the grid over a longer period of time (e.g. in
darkness or if the PV modules are covered with snow), a gap is
inserted into the chart. The column for the current hour is updated
automatically every ve seconds.
After four seconds, the bar goes off for one second and then
displays the current value.
The display values may deviate from the actual values and must not be used as a basis for invoicing. The inverter's measured values are required for the system management and to control the current to be fed
to the grid. The inverter does not have a calibrated meter.
GRAPHIC DISPLAY
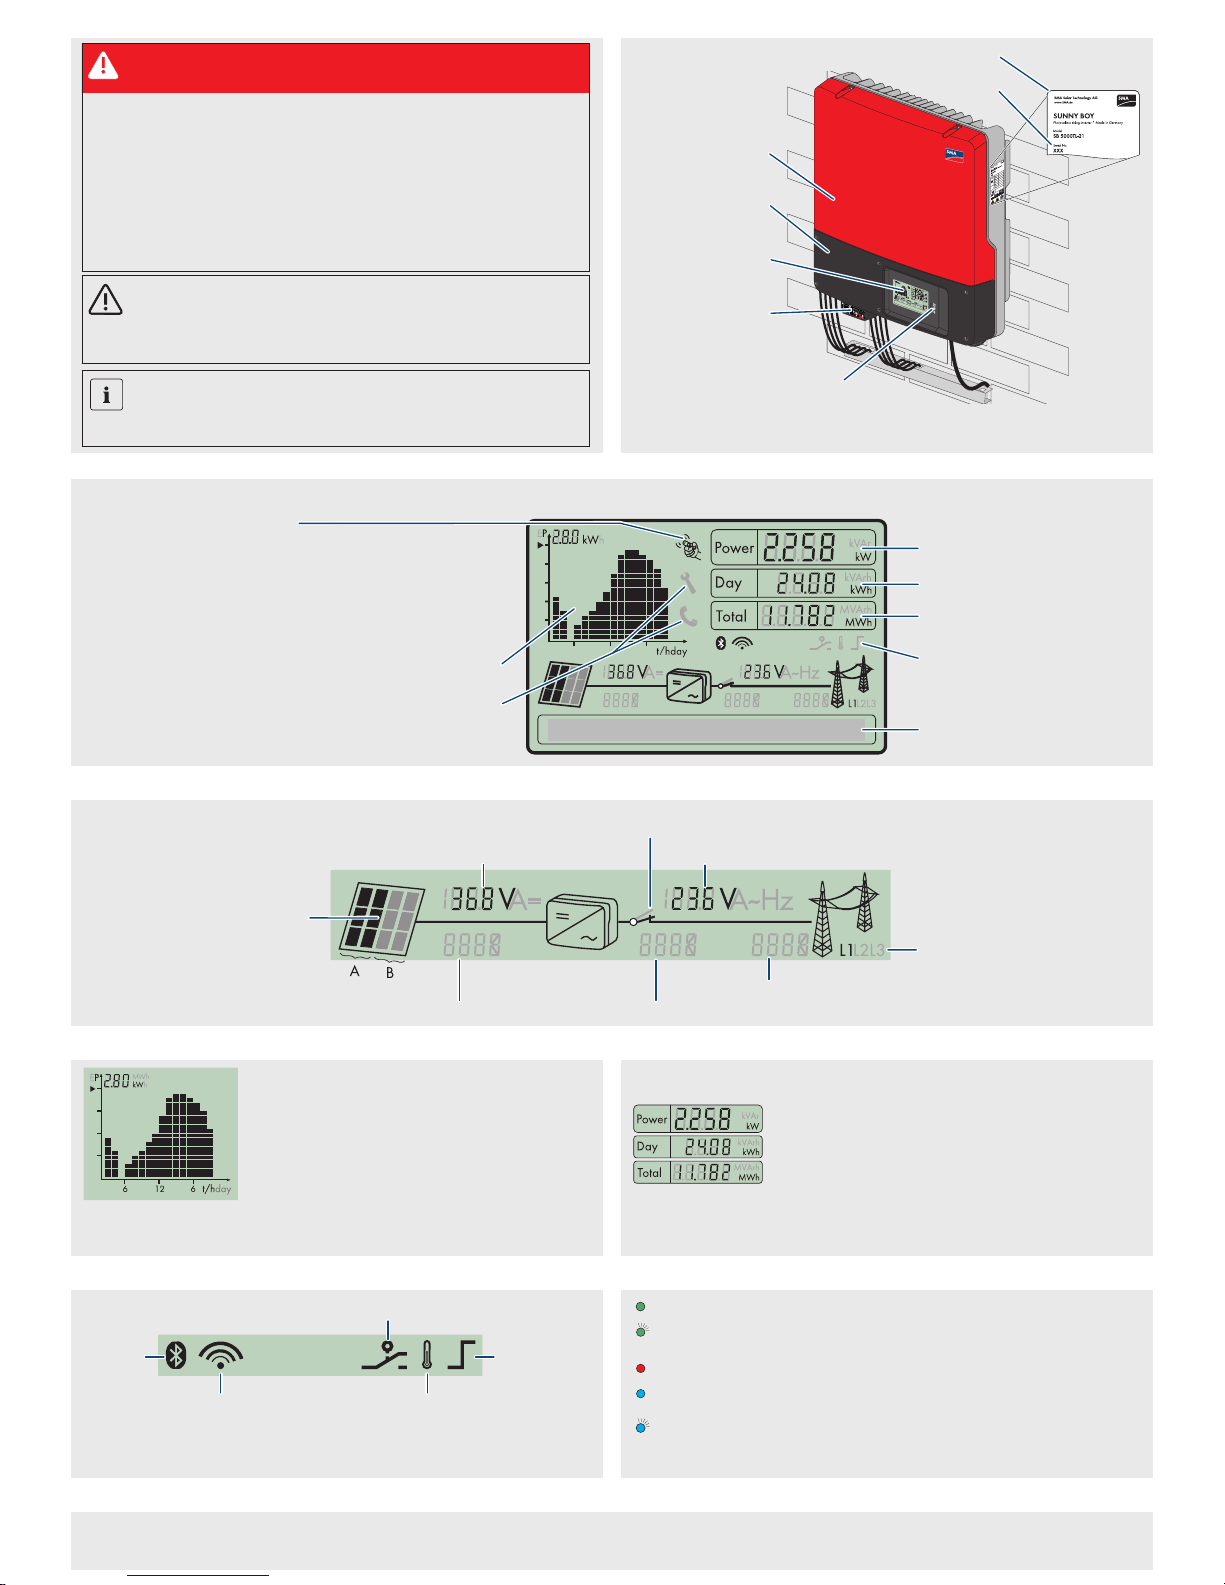
SAFETY INSTRUCTIONS PRODUCT OVERVIEW
Upper enclosure lid
Lower enclosure lid
Graphic display
Electronic Solar Switch
LEDs
serial number
Identication of the Sunny Boy by the type label
SYSTEM OVERVIEW
Current power
Daily energy
Total energy generated since the inverter
was installed
Text line for displaying an event
Graphical display of the inverter energy
The display updates the values of your PV plant every 5 seconds.
Tapping on the lower lid:
• Activates the background illumination
• Switching through the energy values of the past 16 feeding operations to the daily
energy values of the past 16 days
• Switches to the next text line
• 2 taps in quick succession: the inverter successively shows the rmware version,
the serial number of the description of the inverter, the Bluetooth NetID, and the
specied country standard and display language.
Disturbance: contact installer
Switch open: no feeding-in
Switch closed: feeding
Grid voltage/currentPV voltage/current
Grid event number
PV array event number
Inverter event number
Switching between input A and B every 10
seconds
LED
Phase Assignment
Display of Enabled Functions
Bluetooth is
switched on.
Multi-function relay is active
External output
limitation is active
Bluetooth connection with
other devices
Active
Power reduction due to excessive temperature
• Provide better ventilation for the inverter
• If the symbol is frequently displayed, contact
your installer.
 Loading...