

SKODA Self Study Program 90 – Increase customer satisfaction with the CSS study SSP-90-Increase-customer-satisfaction
Page 1

Increase customer satisfaction
with the CSS study
ŠKODA Service
Self-study programme
®
90
Page 2

Introduction
Ladies and gentlemen,
you are holding in your hand the 90th part of the selfstudy programme "Increase customer satisfaction with
the CSS". At fi rst you might ask yourself the question:
"What can I learn from this self-study programme?"
Or: "What can I use it for?"
The following is therefore an overview of the contents
of this self-study programme. We shall deal with the
subject of customer satisfaction and introduce you to
a model for its systematic improvement. You will learn
how customer satisfaction and customer loyalty with
the CSS system are monitored and how to analyse
weak points.
In addition, you will learn how to derive concrete measures from this analysis for your service work and plan
what is important for their implementation.
This self-study programme explains the basic functioning of the CSS. It is shown here pragmatically, how
a service operation integrates the CSS as a tool in the
systematic improvement for increasing customer satisfaction. This is why you should already be familiar with
the Škoda portal and its reporting method.
This self-study programme is aimed at the service
management, because it is their responsibility to
organise improvement measures. However, there is no
doubt: Best quality of service and customer satisfaction are the goals of all employees in the service.
For this reason it is essential to involve all service
employees in the planning and implementation of
improvement measures for customer satisfaction.
We hope you will enjoy reading this self-study
programme as well as learning from it and we wish
you abundant success for its implementation in your
company.
GB2
Page 3

Contents
1. Customer satisfaction and customer loyalty .......................................................................................................................4
2. Model for the systematic improvement of customer satisfaction ................................................................................9
3. Increase customer satisfaction and customer loyalty with the CSS ...........................................................................12
4. Improvement of customer satisfaction as a continuous process ................................................................................47
5. Test your knowledge ................................................................................................................................................................49
The groups of persons mentioned in the self-study programme about organisation refer to both
men and women. For reasons of readability and simplicity, the feminine form has not been used.
The CSS instrument is explained as much as possible, regardless of certain forms of representation. Layout, structure and navigation of the CSS portal change over time, however the basic
functioning remains the same. If screenshots from the CSS portal are shown in this self-study
programme, they only serve to illustrate particular aspects of the CSS analysis, but do not
explain the work with the portal.
3GB
Page 4

1. Customer satisfaction and customer loyalty
In this chapter you will learn:
– what is customer satisfaction
– what is customer loyalty
– that customer satisfaction is a prerequisite for customer loyalty and how the two are linked
– what factors infl uence customer loyalty and guarantee long-term success of the company.
1.1. Defi nitions
1.1.1. Customer satisfaction
The customer satisfaction refl ects the quality of services from the perspective of the customer. Every customer
of a car dealership has personal expectations, he perceives his environment differently and assesses individually
what he perceives. Hence not only the objective performance is important for the development of customer satisfaction, but mainly the performance perceived subjectively by the customer.
It is therefore important to know and use appropriate methods in order to make this subjective customer opinion
measurable and comparable.
Example:
The repair order was indeed successfully processed, however, the customer was not offered a drink by the service
advisor during the waiting period.
Depending on how important it is to the customer to spend the waiting period as pleasantly as possible, he will be
satisfi ed or dissatisfi ed in spite of objective order fulfi llment.
GB4
Page 5

The term customer satisfaction is the relationship between customer expectations and the fulfi llment of those
expectations. The customer then compares his expectations with the quality of services perceived subjectively.
If his expectation and the resulting performance match, this generally leads to customer satisfaction.
Three important rules for the service can derive from this:
1. If the customer expectation is fulfi lled, the customer is satisfi ed.
2. If the customer's expectations are exceeded, the customer is delighted and more than satisfi ed.
3. If the customer's expectations are not met, the customer is disappointed and dissatisfi ed.
1.1.2. Customer loyalty
Customer loyalty is when repeated contacts and business relationships (inquiries, interviews, repair orders,
purchases, etc.) between the customer and the car dealership come about. Establishing and maintaining a loyal
customer will depend on a long-term and continuous cooperation. An important aspect that can infl uence customer
loyalty positively is when the customer is satisfi ed repeatedly and when it is convenient for him to bring his vehicle
back to your repair shop.
For the economic success of a car dealership, customer loyalty is crucial among other factors.
5GB
Page 6

1.2. Relationship between customer satisfaction and customer loyalty
High customer satisfaction is an important prerequisite for high customer loyalty. One can say: Customer satisfaction
does not always and necessarily lead to customer loyalty, but a dissatisfi ed customer will never be faithful to the
repair shop!
The repair shop must therefore strive to make sure the customer is satisfi ed so that he will become a long-term
loyal customer. This creates signifi cant potential for the long-term economic success of the car dealership.
These include cost-effective direct advertising, etc., easier acquisition of new customers through referrals,
a good image, more orders, etc.
1.3. Infl uence on customer satisfaction and customer loyalty in relation to
long-term success of the company
Various studies estimate that the cost to acquire new customers are up to fi ve times as high as maintaining existing
customer relationships. Often it is more useful and cost-effective to keep a customer and to meet his expectations
or surpass them than to seek new customers. This assumes that the availability of new customers is limited and that
the customers can of course also use competing offers. Even though the circle of potential customers should be
relatively large, the satisfaction of existing customers is of enormous importance - dissatisfi ed customers act in a
circle of friends and acquaintances as "negative multipliers".
GB6
Page 7

Customer satisfaction and customer loyalty are therefore not an end but a means for the car dealership to achieve
economic goals. The characteristic variable for achieving these goals is the quality of services from the customer's
perspective.
Customer satisfaction and customer loyalty have a direct and lasting impact on the following economic
characteristic variables of the repair shop:
1. Performance guarantee of the business relationship
2. Growth opportunities
3. Profi tability
4. Price tolerance of the customer
Performance guarantee of the business relationship
The long-term duration of the relationship between the car dealership and the customer leads on both sides to
a higher error tolerance. Business relationships will not stop immediately if any of the parties involved do not
immediately comply with its obligations. Furthermore, it is diffi cult for competitors to acquire a loyal customer for
themselves.
Growth opportunities
Altogether, regular customers can provide higher overall sales at the car dealership through repetitive purchases,
repeated repair and service contracts or through cross-selling effects. The so-called cross-selling effect should
not be neglected.
If the customer is really satisfi ed, he will recommend the workshop to his friends, acquaintances and relatives
- that can easily gain new customers without additional costs.
Cross-selling
Cross-selling means in marketing, the sale of complementary products or services. For example: Inspection and
reserve oil or winter check and winter tyres.
Company's profi tability
The higher sales through regular customers and the lower costs for acquiring new customers can lead to
increased profi tability for the workshop.
Price tolerance of the customer
A high level of customer loyalty increases a sense of willingness to accept somewhat higher prices. Despite higher
prices, the customer continues to buy products, maintain and repair his vehicle and does not switch to the
competition.
7GB
Page 8
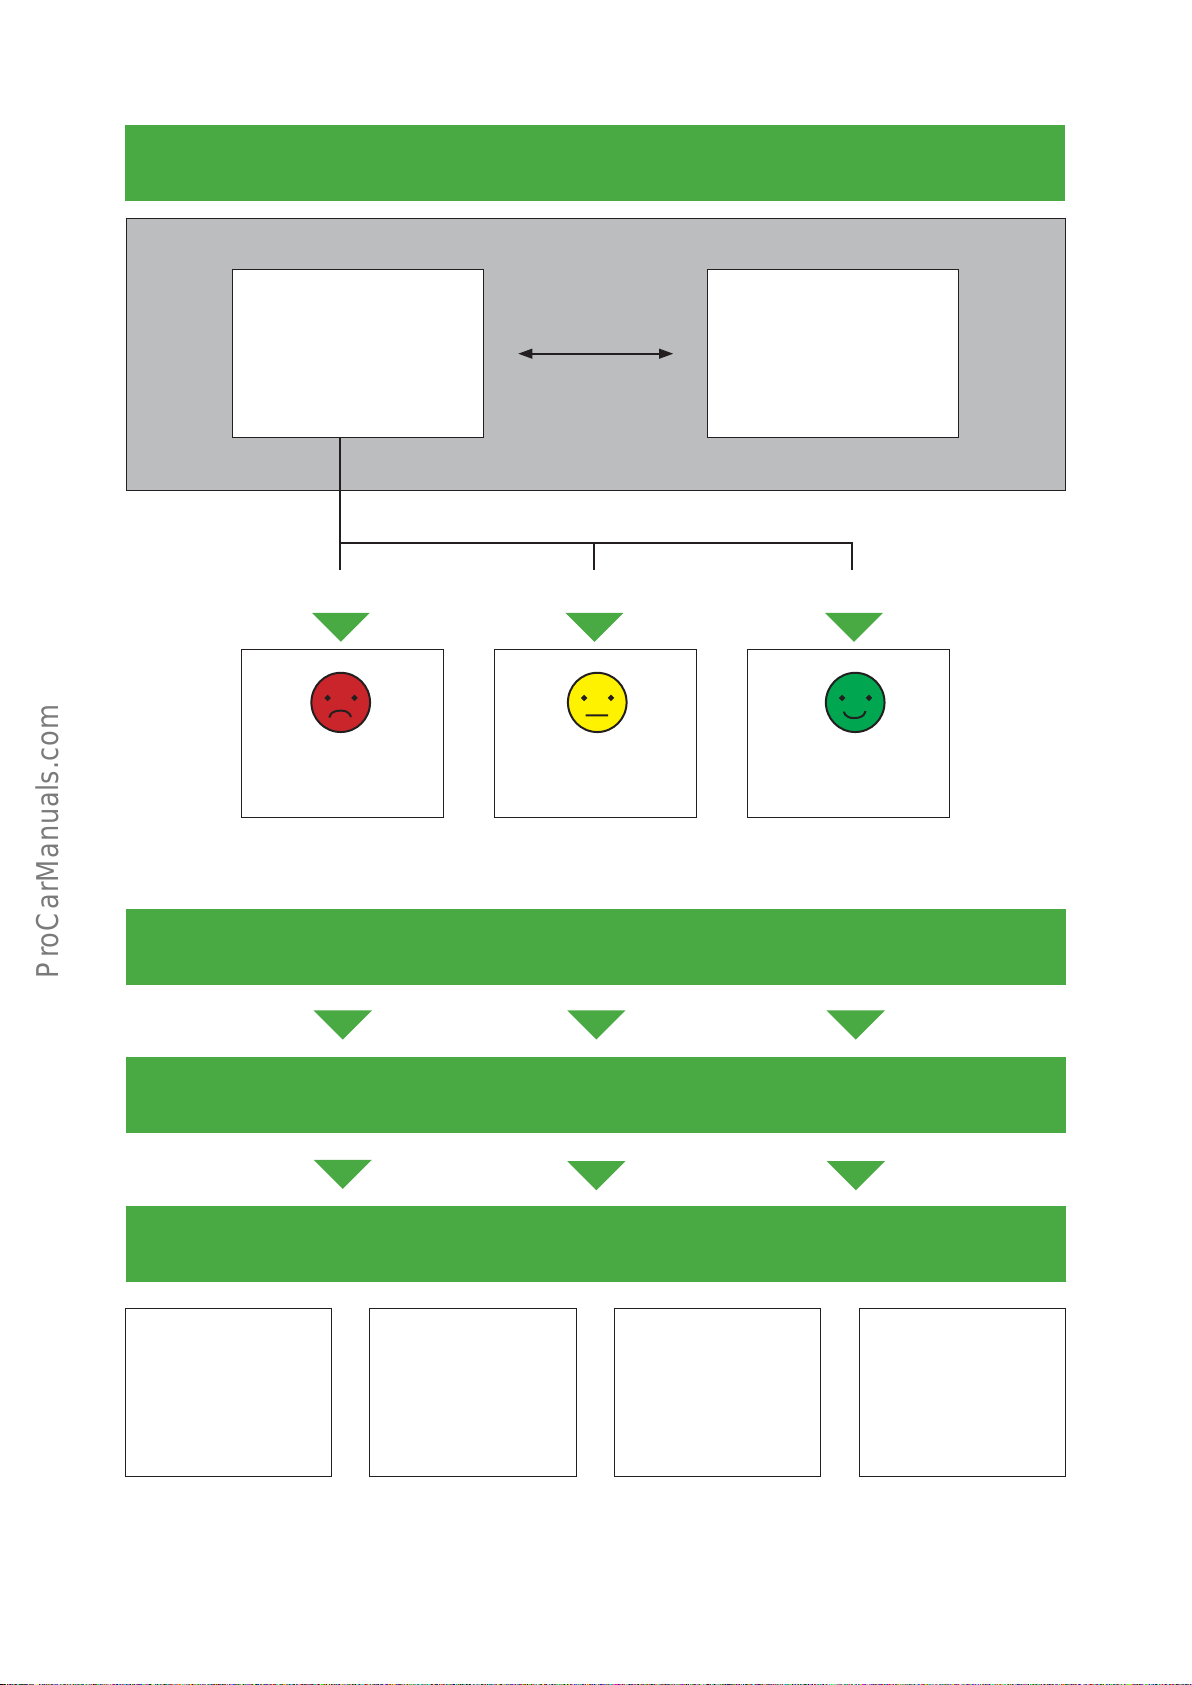
QUALITY
individual customer
expectations
not fulfi lled fulfi lled exceeded
dissatisfi ed /
disappointed
comparison
generally satisfi ed
quality perceived
subjectively
very satisfi ed /
more than satisfi ed
IMPACT ON LONG-TERM ECONOMIC RESULTS
Performance
guarantee of the
business relationship
Fig. 1
Infl uence of service quality on customer satisfaction, customer loyalty and long-term success of the company
CUSTOMER SATISFACTION
CUSTOMER LOYALTY
Company's profi tabilityGrowth opportunities
Price tolerance
of the customer
GB8
Page 9

2.
In this chapter you will learn:
– why it makes sense to plan and implement improvement measures systematically
– that regularly measuring customer satisfaction is a prerequisite for the development and testing of
improvement measures
– how the improvement of customer satisfaction is shown on a circulation model
As mentioned beforehand, a satisfi ed customer is an important prerequisite for the long-term success of the company. Each company should therefore seek to achieve high customer satisfaction and maintain it. To achieve visible
and lasting good results, new improvements must always be introduced systematically. A goal-oriented manager
must continuously determine and evaluate customer satisfaction and suggest appropriate measures on the basis of
the results and take relevant action. The systematic approach increases the success of the measures introduced and
also gives direction to the workshop manager and his team for their everyday decisions.
It is about determining customer satisfaction, improving the quality of services and optimising the relationships with
the customers.
Model for the systematic improvement of customer satisfaction
Service quality
The service quality received by the customer results from the quality of work and care
Quality of work + Quality of support = Quality of service
9GB
Page 10

The following circulation is based on the systematic improvement of customer satisfaction:
1. Determine the current status
2. Analyse the actual state
3. Analyse the causes
4. Derive and plan the measures
5. Implement the measures
6. (1.) Measure the achieved results / current status, etc.
1. Determine the current status
The measurement is used to determine professionally the actual state of customer satisfaction on the basis of a
representative selection of customers. The measuring result is a qualifi ed report, which can be used for further
analysis.
2. Analyse the actual state
Following the measurement, the measuring result must be analysed and the actual state can be determined.
The identifi cation of weak points in the company is therefore of particular importance.
3. Analyse the causes
Then the deeper causes of the identifi ed problems must be analysed and designated. If a remedy must really be
found, one cannot only work with the signs.
4. Derive and plan the measures
Only in this phase, concrete measures can be derived and planned - at this point a measurable goal and a set
period must be fi xed and a person responsible for the implementation must be designated.
5. Implement the measures
In the next step, the selected measures are implemented and the implementation is monitored.
Then the effectiveness of the actions is measured again based on the actual state and the circuit diagram closes
again through this.
The company can use the benefi ts of the standardised CSS process in many points of this circulation model, which
describes the process of systematically increasing customer satisfaction. This is explained in the following
sections.
GB10
Page 11
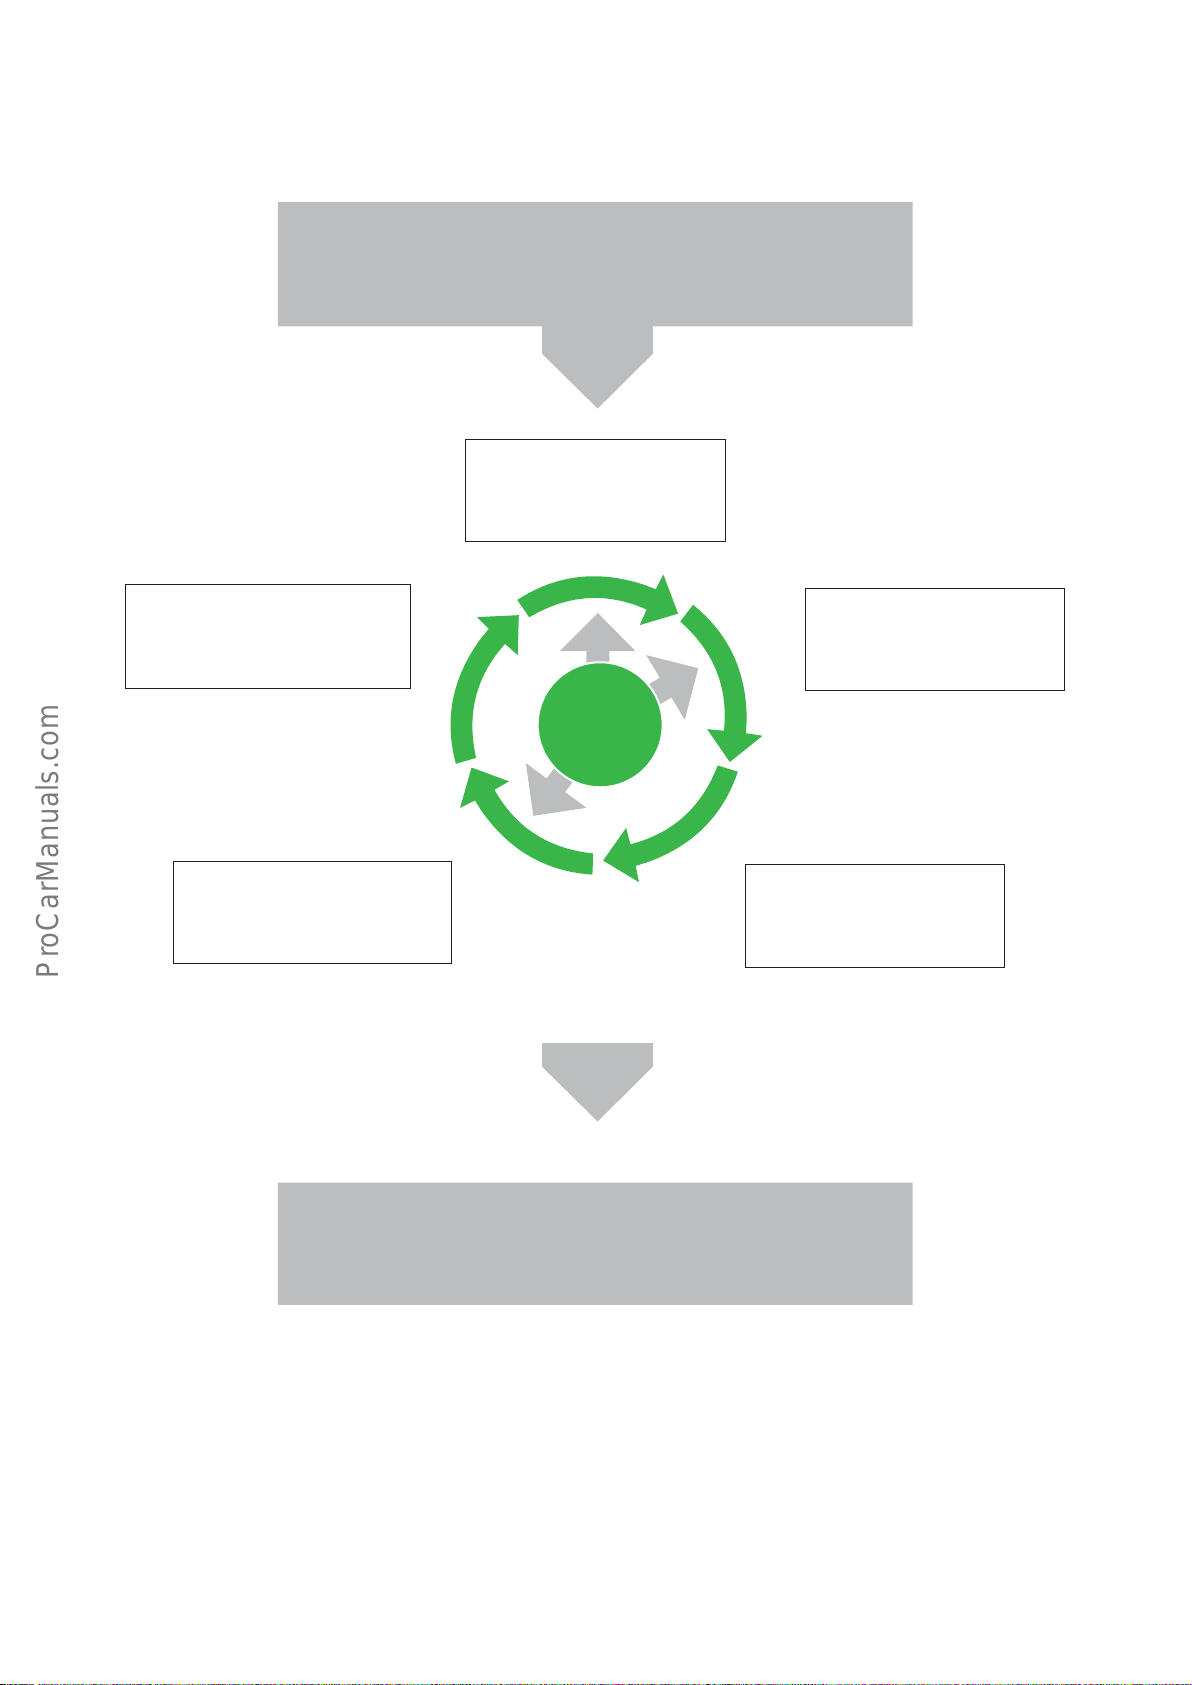
LOW CUSTOMER SATISFACTION
1.
Determine the
current status
5.
Implement the measures
4.
Derive and plan
the measures
2.
Analyse the
actual state
CSS
3.
Analyse the causes
CSS
HIGH CUSTOMER SATISFACTION
Fig. 2
Model for the systematic improvement of customer satisfaction
11GB
Page 12
3. Increase customer satisfaction and customer loyalty with
the CSS system
3.1. Determine the current status
In this chapter you will learn:
– about the structure of the CSS questionnaire
– about the criteria to select customers for this survey
– what is an optimal survey sample size for the CSS
– how the survey is conducted
– that there are different standards for evaluating the results
– that current and accurate information about the customer decides the quality of the report for the CSS
To improve customer satisfaction at company level, it must be measured how satisfi ed the customers are with the
respective company. This measurement is performed using the CSS system (Customer Satisfaction Survey).
The CSS is the study of measuring customer satisfaction at the level of the Škoda service companies.
CSS for the sale and service
The measuring of customer satisfaction is performed separately for sales and service. This self-study programme
is based on the CSS for the CSS area.
Basic information about CSS
Start The customer satisfaction (CSS) has been monitored since 2003. It was grad-
Areas Separate implementation for sales and after sales of the relevant markets
Makes Separate implementation for the makes Škoda, Volkswagen, Audi,
Development The CSS was developed by the companies GfK and TNS, which deal with the
Worldwide use Currently in all major markets, standardised telephone call for Škoda After
ually introduced in different markets and its design is constantly evolving.
Volkswagen Commercial Vehicles, Seat.
market research.
Sales (modifi cations only after approval of the manufacturer for technical and
cultural reasons).
GB12
Page 13
3.1.1. How is the questionnaire structured?
In chapter 1 was explained how customer satisfaction and customer loyalty are related. One can say: Customer
satisfaction does not always and necessarily lead to customer loyalty, but a dissatisfi ed customer will never be
faithful to the repair shop!
Four questions in the questionnaire of the CSS serve as common performance assessment and determination of
customer loyalty:
Question 1
Overall satisfaction with the service
Question 2
Recommendation
Question 3
Next visit
Question 4
Advantage when using the services
The answers to these four questions have the same importance in the customer retention index - customer
loyalty (see description of the key fi gures in chapter 3.2).
If you think about your experience during your last workshop visit,
how satisfi ed have you been with the service as a whole?
Would you recommend this service to your friends and colleagues?
Would you let your next repair or maintenance be carried out again in
this workshop?
Based on your requirements which you place on the service, how are
these requirements fulfi lled in comparison with other workshops?
13GB
Page 14

The CSS questionnaire contains questions on important individual aspects, which are based primarily on the
"service core process" and which can be assessed subjectively by the customer during the process and/or
from the result.
1
Appointments
– all superior aspects
(see page 15 bottom right)
- Consideration of appointment requests
2
Appointment preparation
– all superior aspects (see page 15 bottom right)
Order acceptance/order creation
– all superior aspects (see page 15 bottom right)
- (offer of a replacement vehicle)
- explanation of the workshop work prior to
the implementation
- description of the work on the vehicle
- preliminary information about the price
- price in compliance with the already
accomplished advance information
- delays in the company
3
2
The service
3
4
Repair/service provision
– all superior aspects
(see page 15 bottom right)
- correct execution of the work
- required time of work execution
- compliance with the completion date
- no repeated repair
1
4
Fig. 3
Questions of the CSS questionnaire
GB14
Page 15

These aspects are assigned in Figure 3 to the individual steps in the service core process.
In addition, some statistical questions including, for example, age and gender, as well as additional questions,
such as the main reason for the ultimate cause of the workshop visit are contained in this questionnaire.
7
Finishing process
– all superior aspects
(see bottom right)
6
Vehicle return/billing
- all superior aspects
(see below)
7
6
- Consideration of appointment requests
- explanation of work/billing
- price in compliance with the already
accomplished advance information
- delays in the company
Core process
5
Quality control/vehicle return preparation
– all superior aspects (see right)
5
Superior aspects for all steps in the
service core process:
- price-performance ratio
- friendliness of service employees
- expertise of service employees
-
response to concerns and wishes of the customers
15GB
Page 16

3.1.2. How are the customers for the CSS survey selected?
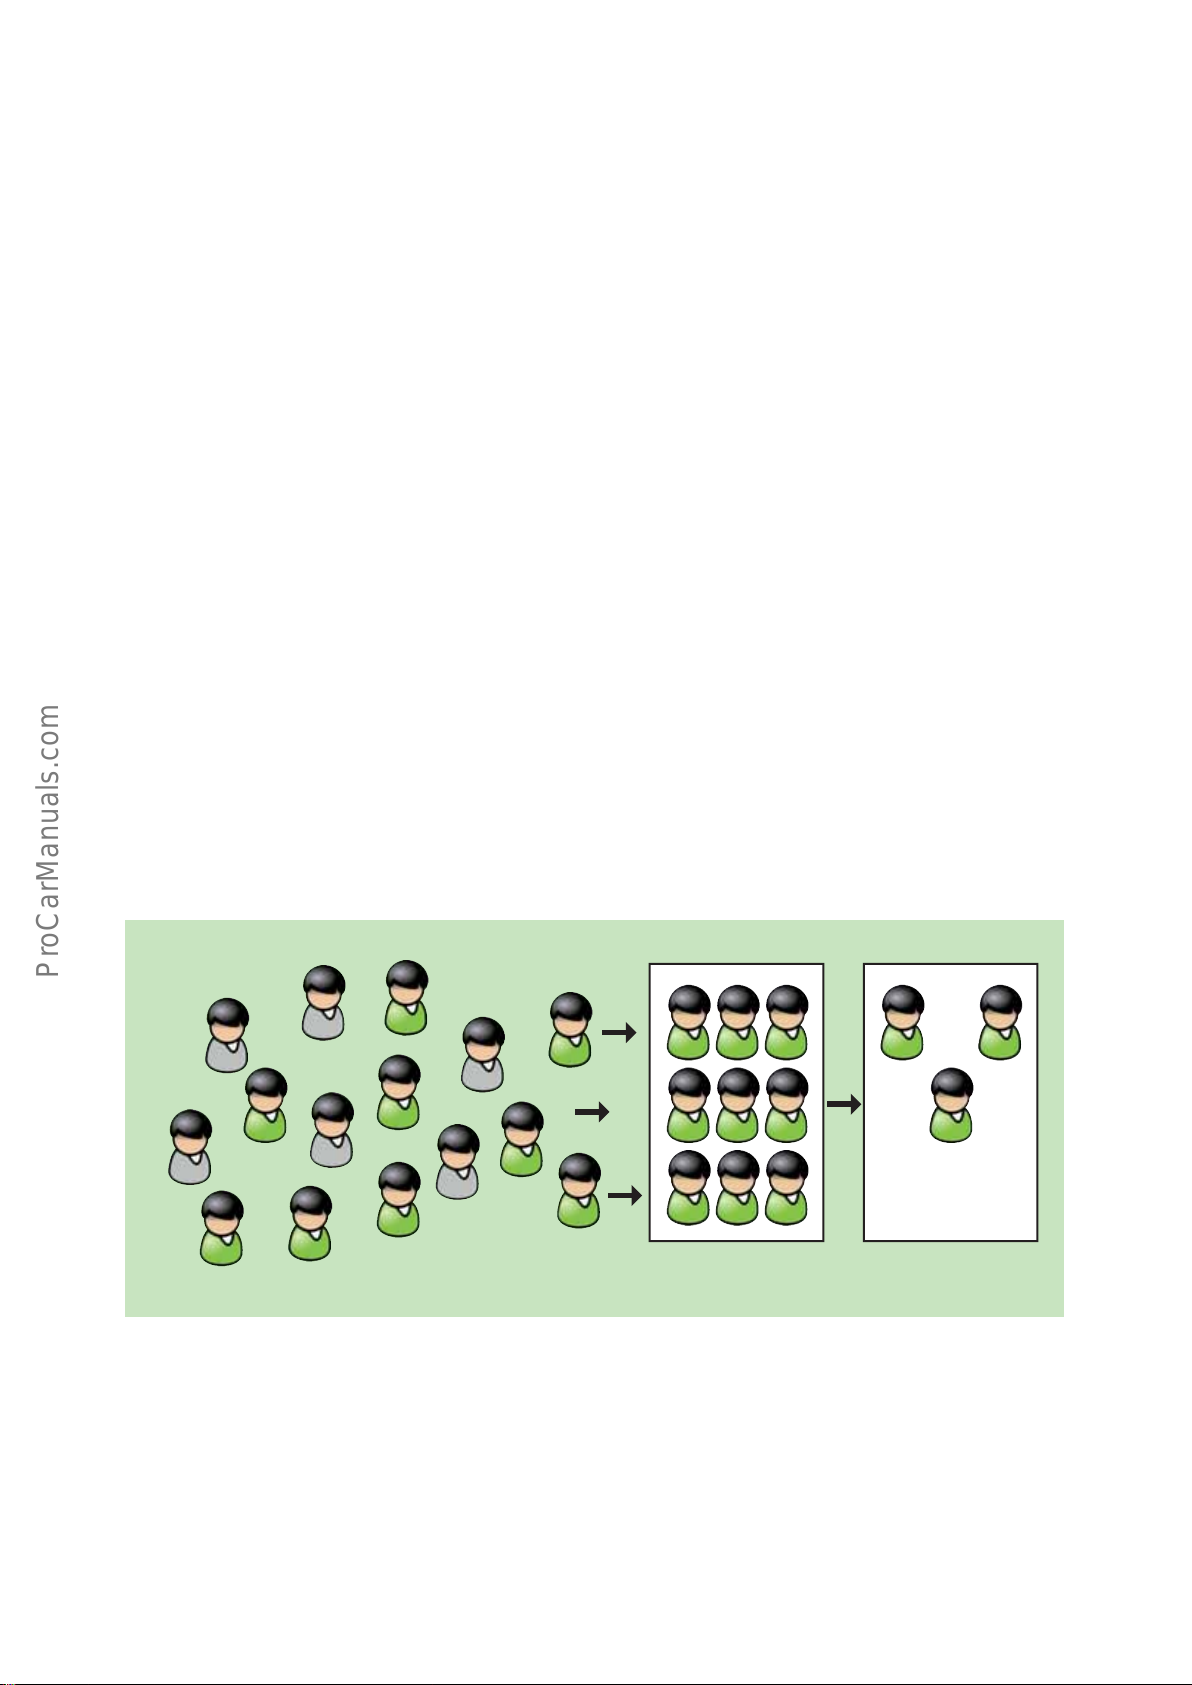
The CSS examination is performed for each Škoda repair shop on the basis of a representative selection of
customers (sample). The actual respondents are randomly selected from the so-called basic population.
The basic population is the sum of the customers that are acceptable for participation in the CSS examination.
Basic population
Not all workshop customers are suitable to participate in the CSS survey. The customer must meet the following
conditions in order to be included in the basic population and be part of the sample:
- It is a private customer or a self-employed customer with a small company. Customers from large companies
and fl eet customers (the target person is often diffi cult to reach) are acceptable only if they provide a contact
partner.
- The last workshop visit of the customer is in the relevant event month for which data collection is still running
(for the reporting periods, see chapter 3.1.4.).
All customers who meet these conditions, can theoretically be the respondents in the CSS examination.
In general, however, not all these customers are interviewed, but a certain number of customers is selected.
This group of selected customers is called sampling.
GB16
Page 17
Sample
In order to draw conclusions from the results of the investigation regarding the satisfaction of all customers of
the basic population, the sampling must meet certain criteria:
- It must be a sample selection, i.e. which does not favour any person during the selection. The respondents
must be randomly selected.
- A suffi ciently large number of customers must be questioned in order to achieve a reliable result. The optimal
sample size must be determined for this.
Fig. 4
Of all the customers of the company for sampling
All workshop customers Basic population
Sample
17GB
Page 18

Optimum size of the sample
The most accurate result would be obtained if one would ask all the customers. Such an overall survey would be
very costly. When performing the test again on a very small number of customers, it can be that the testimony in
several cases does not refl ect the opinion of the entire basic population. As a compromise between the highest
possible quality and the lowest possible cost, a reasonably accurate, but at the same time fi nancially reasonable
sample size must be defi ned.
Statistical methods assist us in this decision making. Such a calculation was performed beforehand for the CSS
with the result that a sample of 120 questionnaires (number of successful interviews conducted) in a calendar year
(12 individual waves, each of which represents one month) is optimal for each Škoda service operation.
Consequently, so that the sample for the whole year is divided equally, 10 questionnaires net per month are
allocated to each workshop. The increase in annual sampling would result in no signifi cant gain in accuracy.
For service companies with higher order numbers (more than 9000/year) the amount of samples is increased
proportionally by 20 questionnaires per month.
GB18
Page 19

3.1.3. How is the survey conducted?
The CSS survey is conducted as a telephone conversation which lasts several minutes. The interview time can
vary depending on the customer and the market (if necessary questions signifi cant for individual markets are
asked, which exceed the international CSS standard). The interviewer uses a computer program that guides him
through the questionnaire and allows immediate entry of the answers.
For the subsequent overall evaluation, the results of individual interviews must be comparable. Therefore, the
questionnaire is standardised for all interviews - the choice of answers and the order of the questions are
identical.
The market research is carried out as follows: The importer commissions a market research company to conduct
the telephone calls. The upstream address management is usually performed by a provider for address services,
the downstream reporting by a reporting agency (such as TNS, GfK and others).
The questions in the CSS questionnaire can be divided essentially into two different types of questions:
- questions on satisfaction
- questions on fulfi llment (yes/no)
Besides, there are questions that have different qualitative response alternatives (e.g., question 5 "The main
reason of the last workshop visit").
19GB
Page 20

Questions on satisfaction
With these questions, the degree of satisfaction with a particular aspect of performance is established.
The respondent is given fi ve response categories, from which he must select the most applicable one.
The alternatives are:
- extremely satisfi ed
- very satisfi ed
- satisfi ed
- less satisfi ed
- dissatisfi ed
Example
How satisfi ed are you with the explanation of the necessary workshop work prior to its implementation?
Following the defi nition given in Chapter 1, customer satisfaction results from a subjective comparison of the
service provided with the existing expectation. The result can vary within a range between non-fulfi llment via
fulfi llment up to over-fulfi llment.
This spectrum has been involved in the development of response options. Furthermore, the scale provides
a slightly more effective differentiation between high performances and "only" good performances.
GB20
Page 21

The more satisfi ed the customer is with the specifi c aspect, the better the "grade" (from 1 to 5) that the workshop
receives when calculating the average.
The average value is calculated from all the valid responses of the customers during the accounting period.
In addition to the average score as part of the results, the percentage distribution of responses in each category
of responses is given.
Response categories Importance
Extremely satisfi ed 1 +12 17 1 x 17 = 17 12 x 17 = 204
Very satisfi ed 2 +8 36 2 x 36 = 72 8 x 36 = 288
Satisfi ed 3 +4 28 3 x 28 = 84 4 x 28 = 112
Less satisfi ed 4 0 5 4 x 5 = 20 0 x 5 = 0
Dissatisfi ed 5 -4 4 5 x 4 = 20 -4 x 4 = -16
Total answers 90
Total p o i n t s 213 588
Average mark/average points 213/90 = 2,37 588/90 = 6,53 *
Example of the calculation:
Calculating the average value for a question on satisfaction (number of respondents = 90)
In the case of evaluation according to the group scale, the result is the number of points (-4 to 12).
Number of
(points per category)
Škoda VW group Škoda VW group
responses
Points for the overall result
In the case of the calculation according to the Škoda scale, the result is a "school grade" (1-5).
The evaluation between the two scales can be converted using the following formula:
Group scale = 4 x (4 - Škoda note)
Example, group result = 4 x (4 - 2.37) = 6.52*
* The difference is a result of rounding up.
21GB
Page 22

Questions on fulfi llment (yes/no)
Questions on fulfi llment serve to determine whether a particular aspect has been fulfi lled or not. Here, the
respondent generally answers "yes" or "no". In addition to the average score as part of the results, the
percentage distribution of responses in each category of responses is given.
Example
Has the promised completion date of the vehicle repair been kept? (Question 7E)
Note
In this case, there is a third possible answer: "Has not been agreed."
These possibilities are not offered to the respondent, but they can be coded if necessary and later be included in
the calculation.
The same applies to the next standard category of answers which is possible for all questions and also not
offered to the customer: "Unspecifi ed".
Response categories Importance
Yes/Has not been agreed 1 +12 63 63 x 1 = 63 12 x 63 = 756
No 5 -4 27 27 x 5 = 135 -4 x 27 = -108
Total answers 90
Total points 90 648
Average points 198/90 = 2,2 648/90 = 7,2
Example of the calculation:
Calculating the average value for a question on fulfi llment (number of respondents = 90)
Note
Conversion to the scoring according to the group scale, see page 21.
Number of
(points per category)
Škoda VW group Škoda VW group
responses
Points for the overall result
GB22
Page 23

3.1.4. Which standard applies to the measured levels of satisfaction?
When are the customers satisfi ed and when are they enthusiastic? There is no absolute standard for customer
satisfaction. The point value reached for a specifi c question at a specifi c time (e.g., 1.2 or 1.4) allows no assessment
of the results. In order to assess whether the satisfaction levels of the workshop are high or low, the calculated
values of the actual workshop must be compared with other data. This comparison is performed in the CSS,
in two ways.
- Comparison with benchmarks
- Comparison over time
Comparison with benchmarks
Here, the company-specifi c values are compared for example with the average values of all companies in a country, region, or the limit value of the top 20% companies. The comparison shows where the workshop is placed as
part of the respective reference group, where it achieves relatively good results, and where it is rather average
and in which fi elds the other workshops achieve higher customer satisfaction.
Comparison over time
In this approach, the current company values are compared with the values of the same company during a
previous period. The comparison shows how the values of customer satisfaction of the relevant workshop
have evolved over time, whether they are better or worse.
For both comparison variants, the CSS provides appropriate evaluations.
Benchmark
The reference value is designated as benchmark for the comparison analysis of the results.
Considered as standard benchmarks in the CSS are:
- National average: Weighted average of all companies in the country (Note: in order to take the higher number
of customers in larger workshops into account when calculating the national average, the average values of
the workshops are weighted according to their size, usually by the characteristic value "hours sold".
- Top 20 %: Average value of 20 % of the country's best companies.
23GB
Page 24
3.1.5. Reporting periods and sliding average values
The CSS survey is conducted continuously throughout the entire year. The monthly reports lead to results based
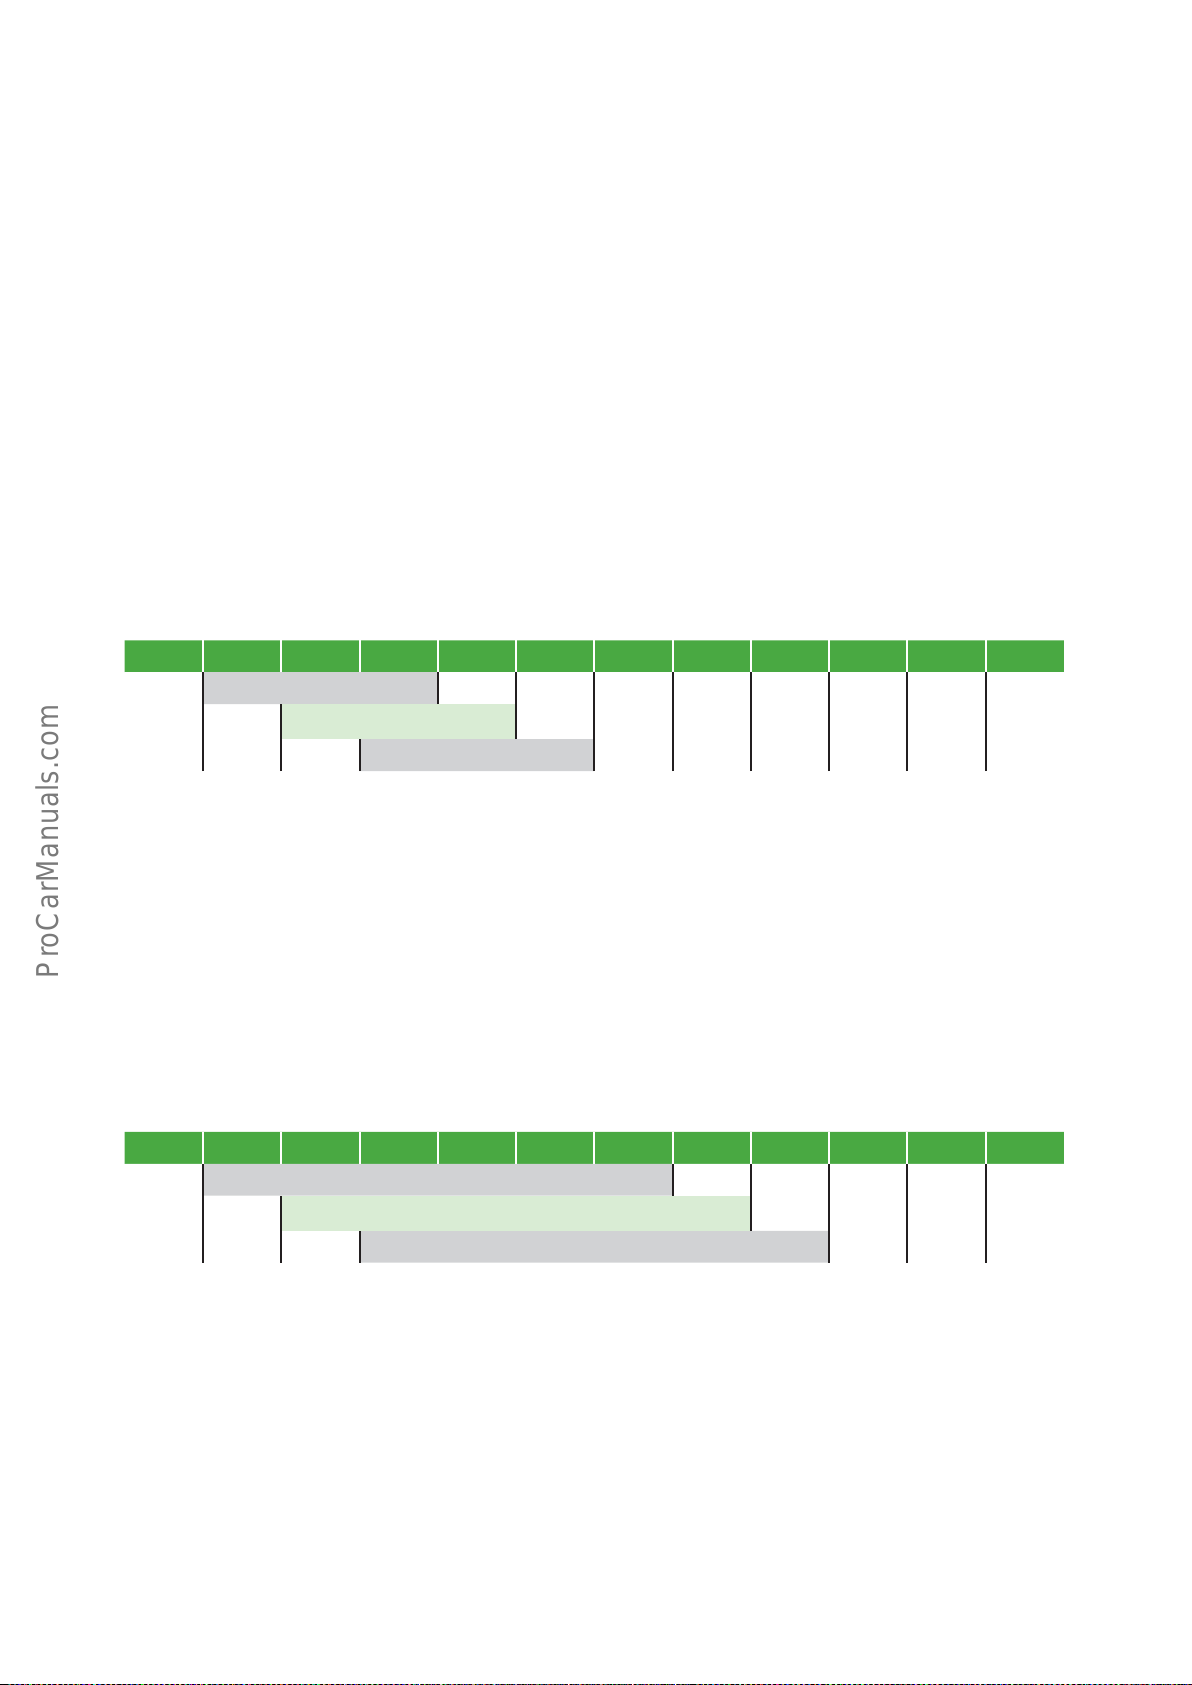
on the monthly averages. In addition, the results are also calculated based on various sliding average values.
Furthermore, the results are shown in the framework of the completed calendar quarter and accumulation of the
given year. In order to calculate a sliding mean value, all interviews of the current month and a certain number of
the previous months are summarised for the evaluation. 3 classic result presentations are used:
- 3 month overview
- 6 month overview
- 12 month overview
3 month overview
The results shown are a summary of the current month and the previous two months.
01/11 02/11 03/11 04/11 05/11 06/11 07/11 08/11 09/11 10/11 11/11 12/11
Report April 2011.
Report May 2011
6 month overview
The results shown are a summary of the current month and the previous fi ve months.
01/11 02/11 03/11 04/11 05/11 06/11 07/11 08/11 09/11 10/11 11/11 12/11
Report June 2011
Report July 2011
August 2011
September 2011
GB24
Page 25

12 month overview
The results shown are a summary of the current month and the previous eleven months.
01/11 02/11 03/11 04/11 05/11 06/11 07/11 08/11 09/11 10/11 11/11 12/11
Report December 2011
1st quarter 2nd quarter 3rd quarter 4th quarter
Accumulation
Advantages of sliding averages
- When considering monthly values, the results of the CSS survey for the given workshop fl uctuate strongly
from month to month. This can be caused by a small number of interviews, without the results being infl uenced by the actual change in quality. A very small number of interviews already lead to signifi cant changes in
the company's average value through individual customer judgments (e.g. a dissatisfi ed customer).
- By combining interviews of at least 3 months, the results are stabilised (target 30 cases). Higher reliability of
results is achieved with a 6 month overview (target 60 cases) and very high reliability of results for a 12 month
overview (target 120 cases).
- Sliding averages slow down completely or partially through seasonal effects (as a result of action months,
holidays, Christmas).
We therefore recommend to use the strategic analysis of the actual state, the 6 month or 12 month overview.
Ultimately, sliding averages promote a high reliability of results and thus allow reasonable and relevant action
planning. Hasty steps that could be made on the basis of individual extreme fl uctuations can thus be avoided.
25GB
Page 26

3.1.6. The quality of customer data infl uences the measuring quality
Measuring customer satisfaction is provided by the CSS, without the company carrying out its own survey.
In order to systematically track customer satisfaction levels and improve them, the service operation is dependent
on a high-quality measurement. Therefore each company has the task to enter the data of its customers in the
systems and pass it on so that during the course of sampling and interviewing, a high quality of the measurement
can be guaranteed. The service manager must ensure this.
The customer data for the CSS examination is generated and processed in most markets in the computer system
which is used by the workshop (Dealer Management System). A high quality of results is only achieved when all of
the required customer data for the CSS examination from all the orders is at least handed over once a week completely and without error to the editing interface. This applies particularly to small businesses, which otherwise do
not reach the required sample size.
GB26
Page 27

3.2. Analysing the actual state
In this chapter you will learn:
- about the key fi gures which help to analayse the actual state
First of all, the current situation of the workshop must be analised in order to assess customer satisfaction
systematically and improve it. Thereby, the strengths and weaknesses of the company must be determined.
Information about the current situation can be obtained from the measured data. However, the company must
not do this effort on its own. The CSS system provides - in addition to detailed results - in particular a number of
characteristic values and summaries of the individual questions.
These key fi gures and overviews are:
- Customer loyalty index (CRI)
- Performance criteria
- Analysis of strengths and weaknesses
Individual indicators and overviews are presented in the following subchapters and the procedure for analysing
the current situation is explained.
27GB
Page 28
3.2.1. Customer loyalty index
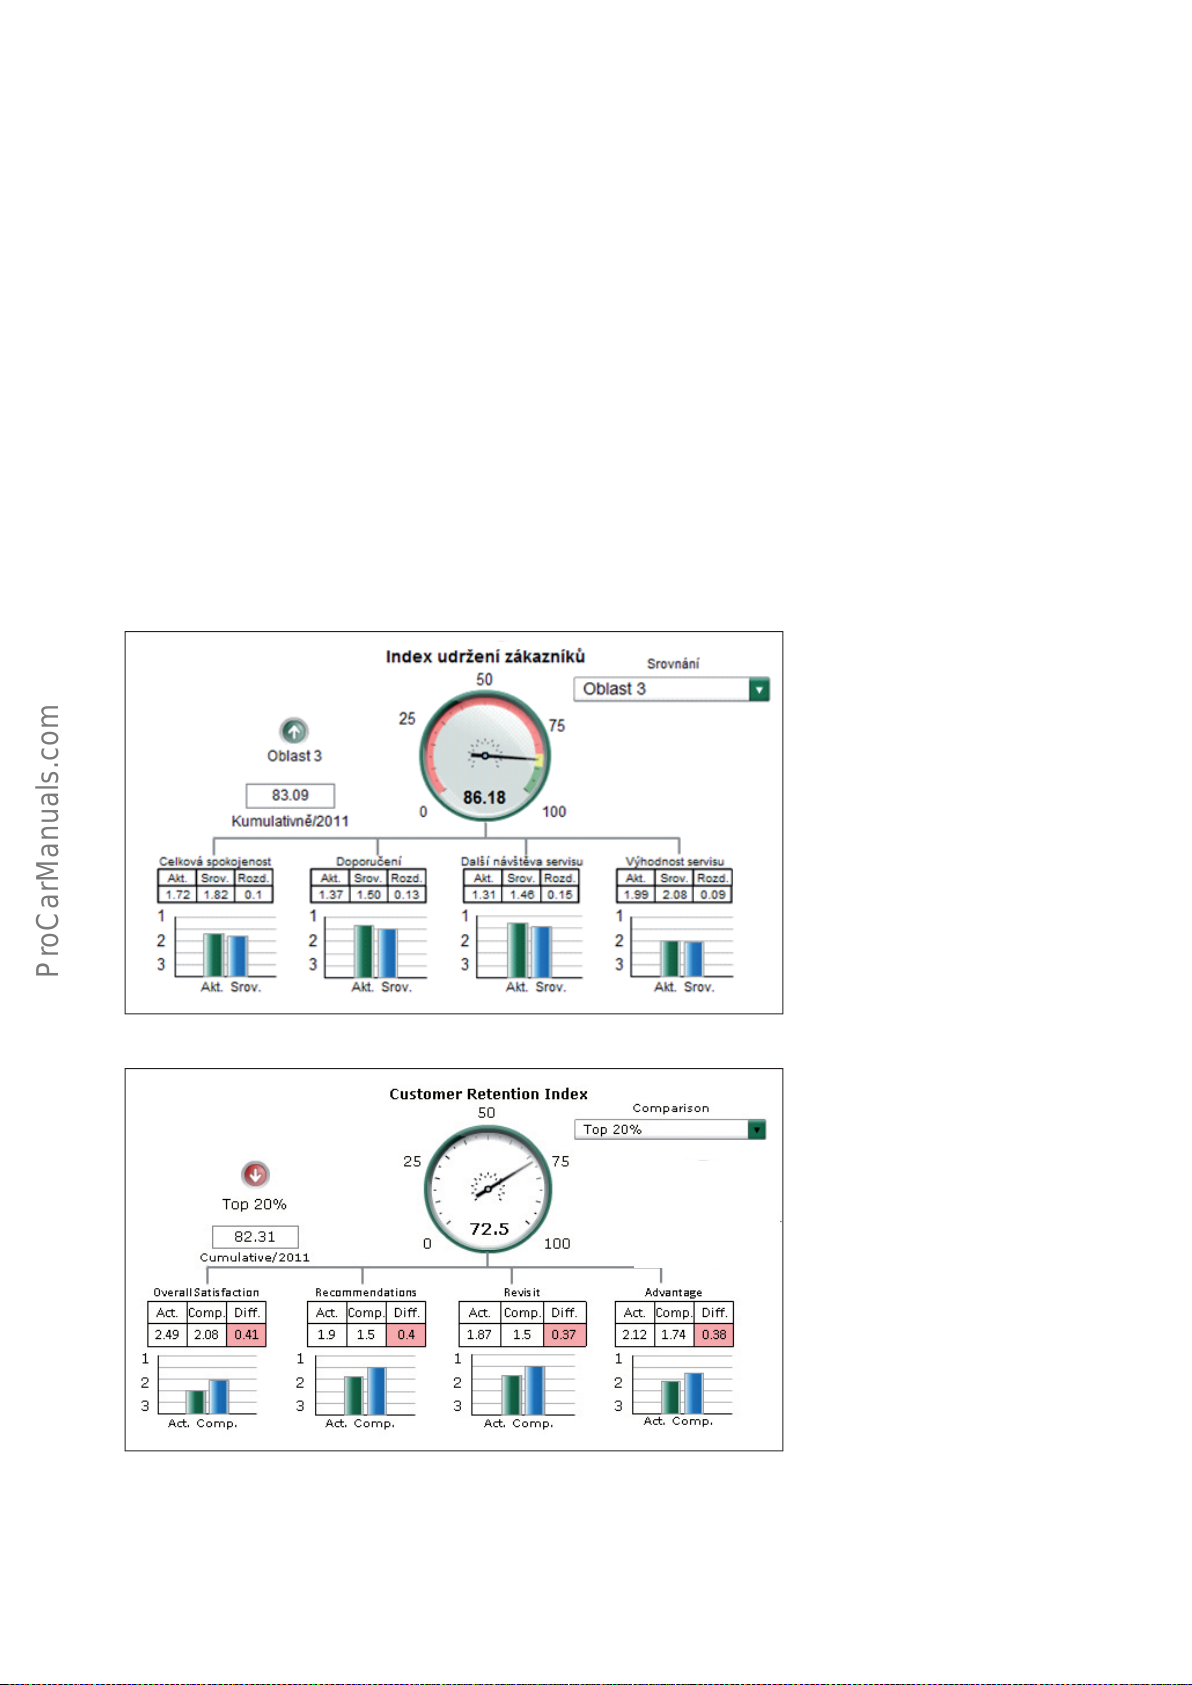
How strong the loyalty of a customer is to the service operation is established in the CSS by means of the
customer loyalty questions (see chapter 3.1).
Customers are bound more closely to the company:
- the higher their overall satisfaction with the last workshop visit
- the more likely they are to recommend this workshop to friends and colleagues,
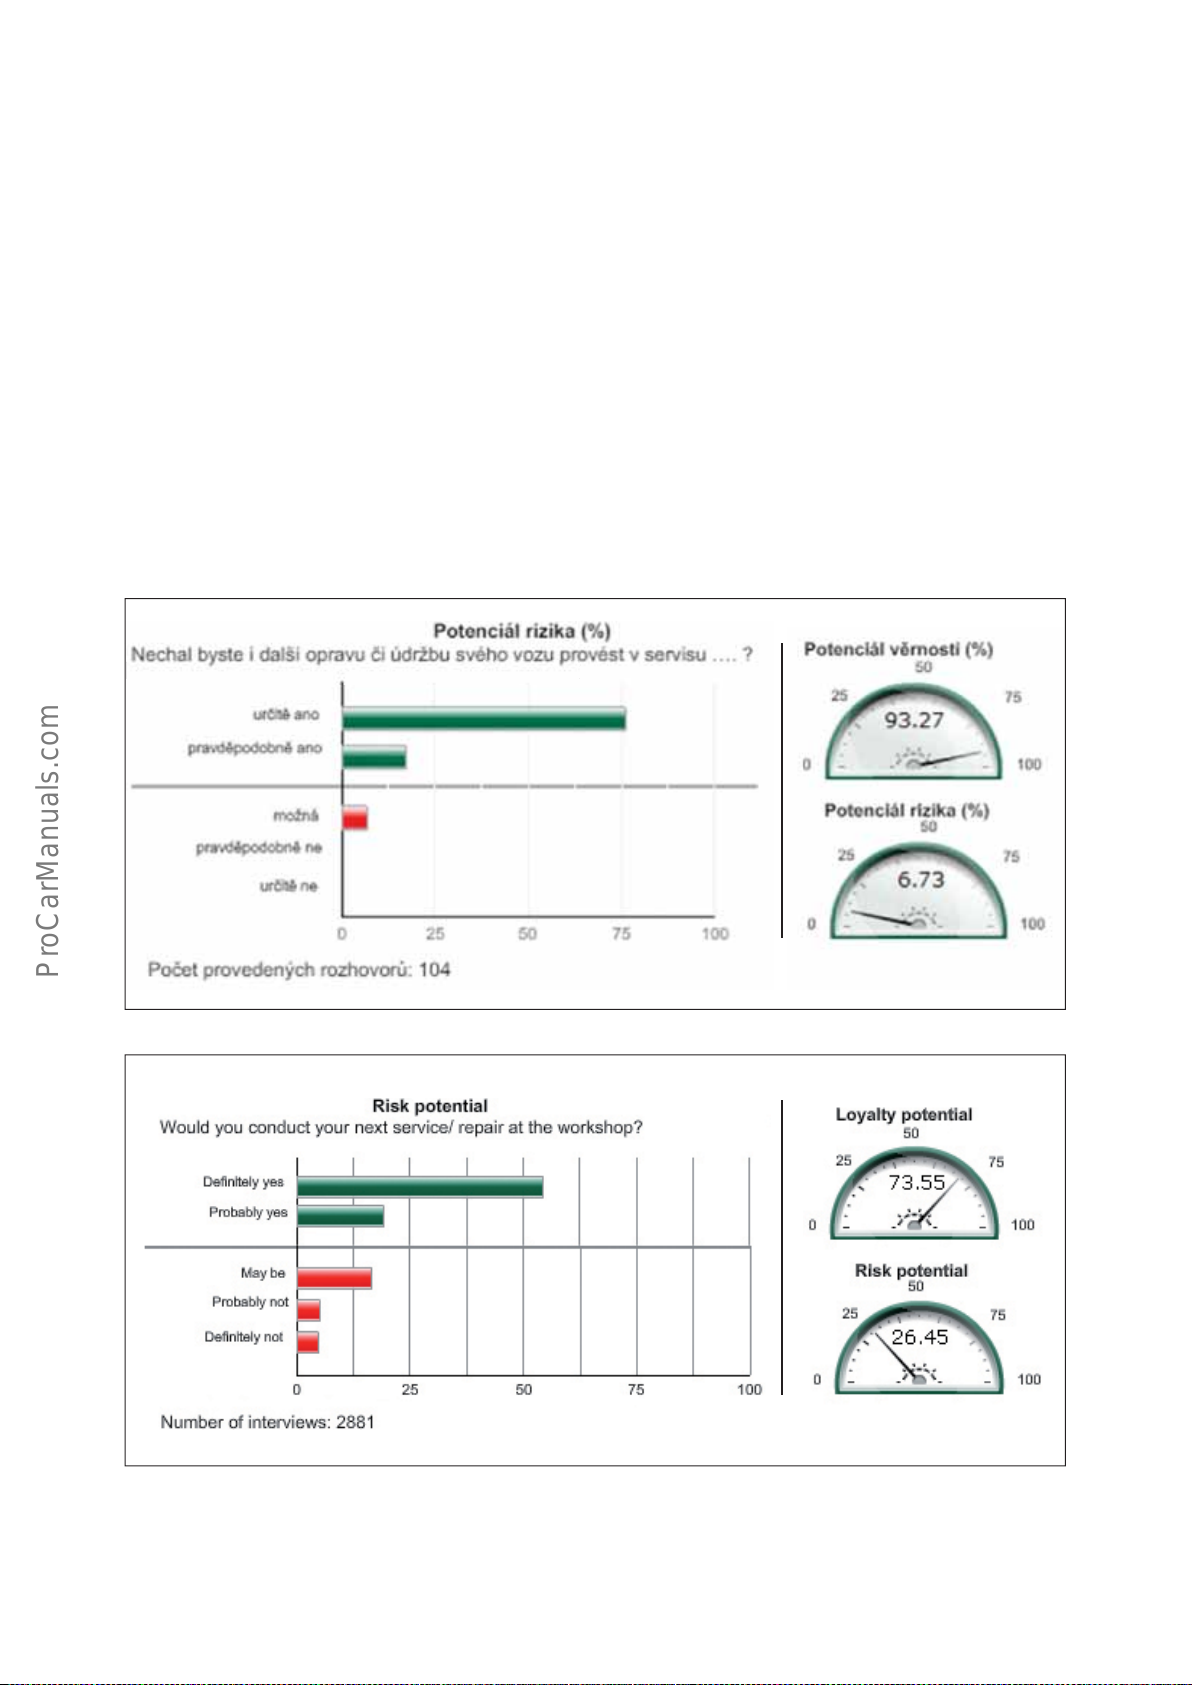
- the more likely they have their next repair or maintenance carried out again in the workshop (this question
is derived from the additional risk potential, see illustration on next page), the better their requirements are
fulfi lled in comparison with other workshops.
The mean value of these four aspects is the customer loyalty index.
* At the time of preparing this issue only Czech and English language versions were available.
Fig. 5
The customer loyalty index shown in the CSS portal (Report 10/2011); sample workshop)
GB28
Page 29
The customer loyalty index is very important because it captures the overall picture that the customer perceived
during his last visit to the workshop and refl ects the customer's perceptions.
The values of the customer loyalty index and the questions related to this can therefore not be directly infl uenced, because it is an overall picture of the customer in relation to the workshop which does not consider
specifi c services. If, however, the individual central services or characteristics signifi cantly improve or deteriorate,
so does the customer loyalty index develop in the same direction.
The greater the infl uence of a specifi c performance (for example, the explanation of the service work prior to their
implementation) or the entire subject area (e.g. the quality of the repair) on the customer loyalty index, the more
this index changes with the change in the result of the relevant performance or the specifi c subject area.
Therefore a statistical context exists, which is measurable.
The concrete measures will therefore always be geared towards the improvement of individual topics and
important issues.
Next visit to the workshop/potential risk
* At the time of preparing this issue only Czech and English language versions were available.
Fig. 6
Potential risk in the CSS portal (Report 01/2011; sample workshop)
29GB
Page 30
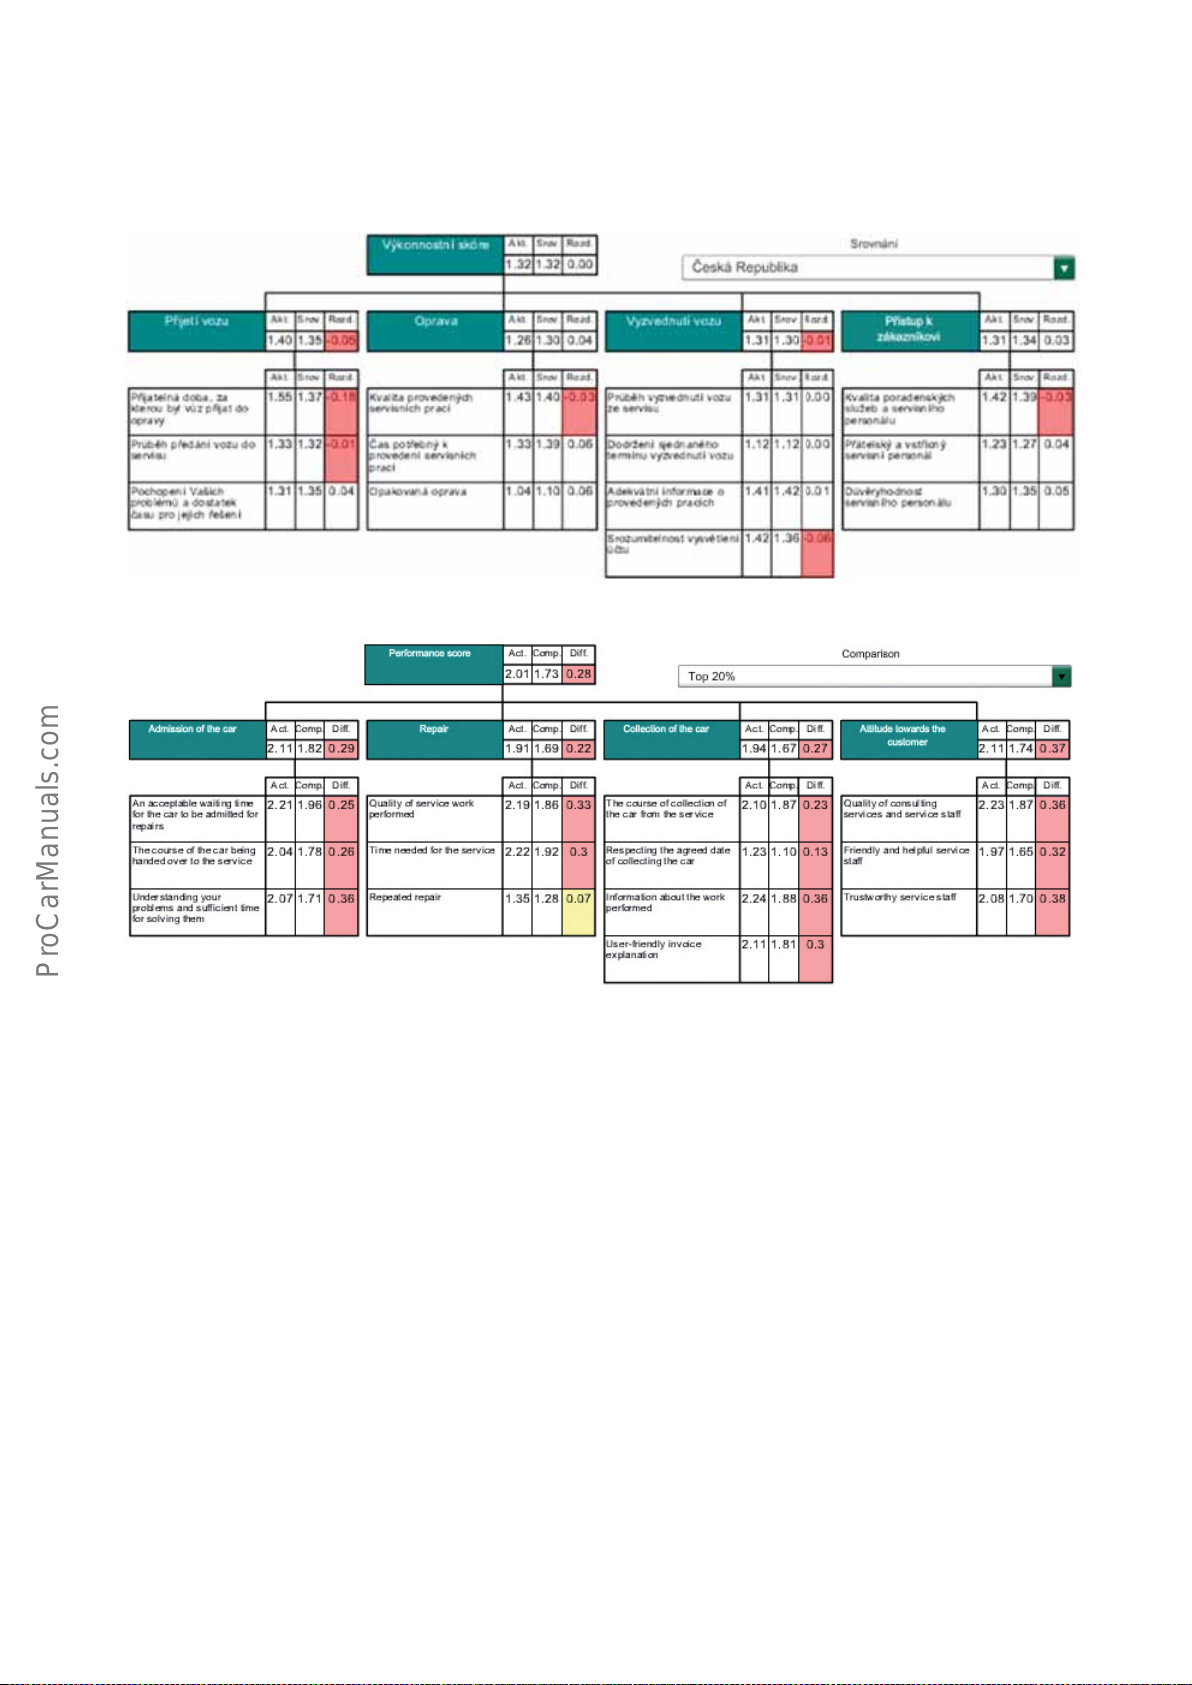
Moments of Truth
* At the time of preparing this issue only Czech and English language versions were available.
Fig. 7
Analysis of the strengths and weaknesses shown in the CSS portal (Report 01/2011; sample workshop).
* At the time of preparation of this language version the print screen was only available in Czech.
GB30
Page 31
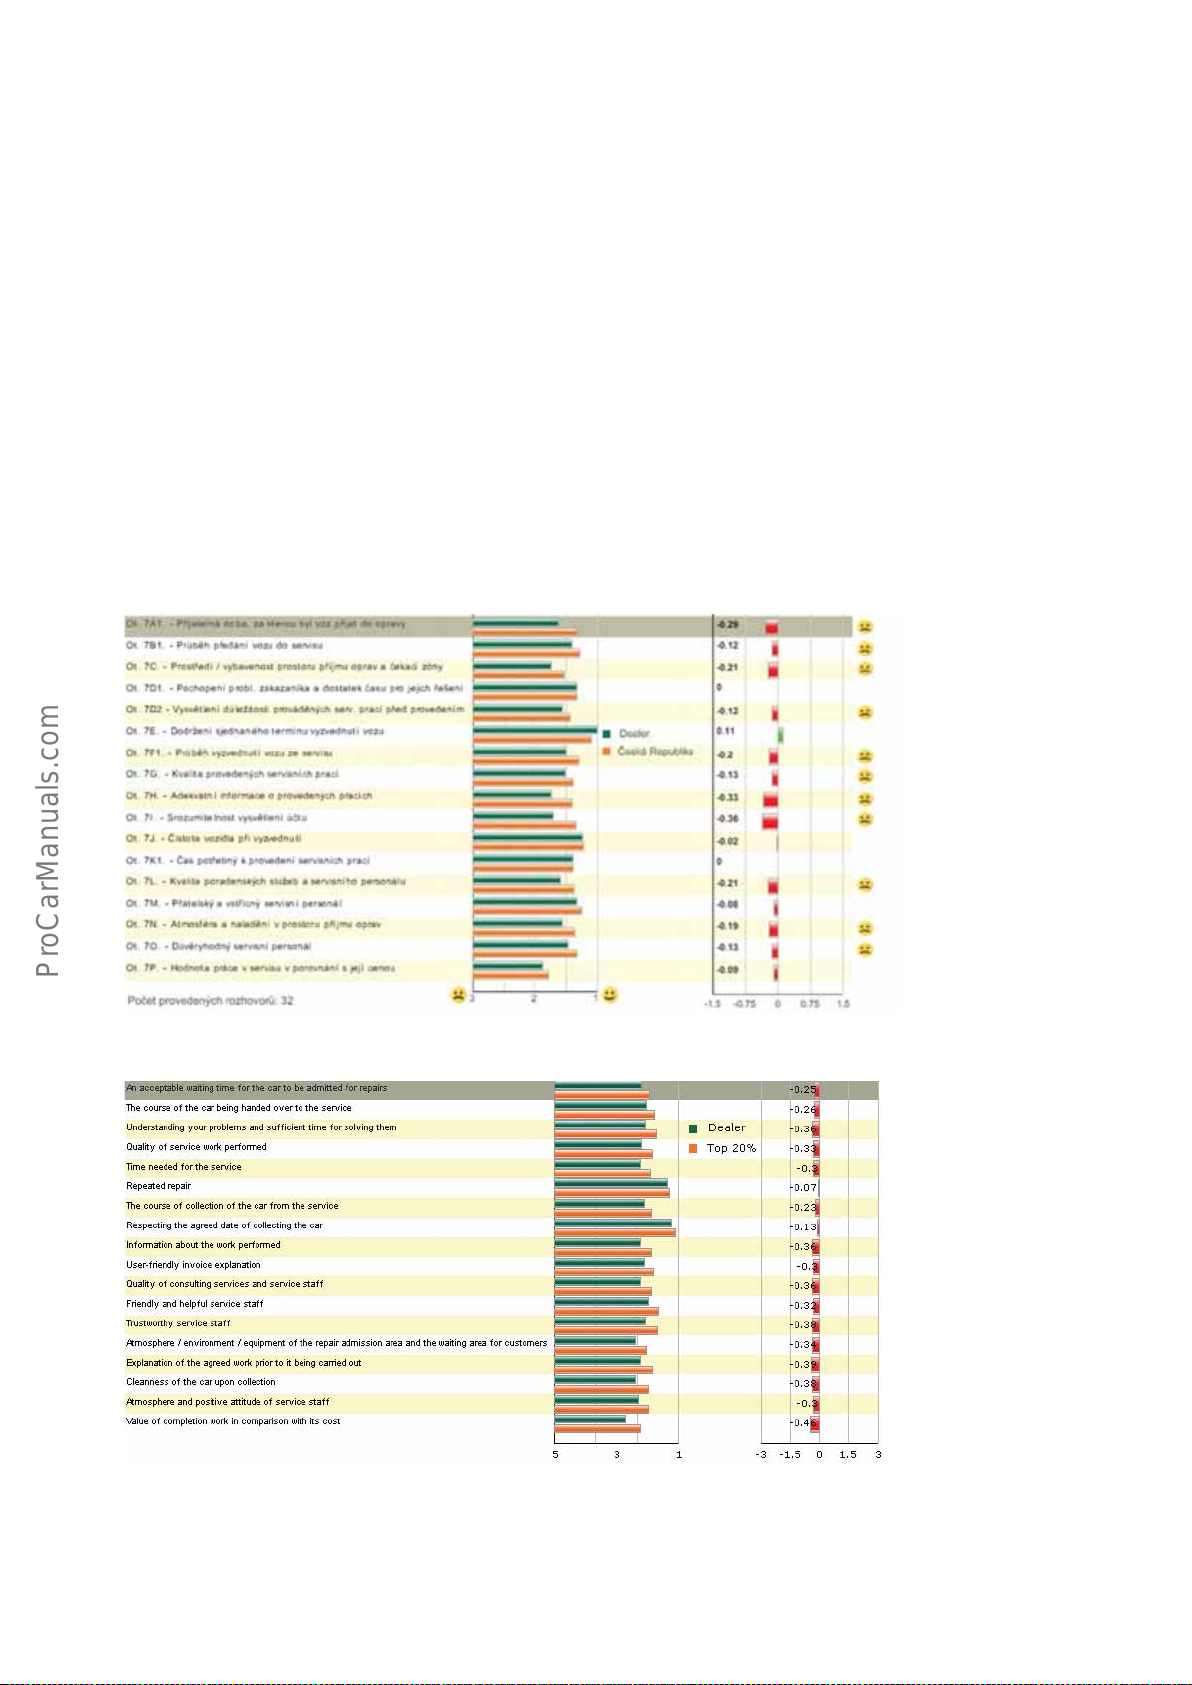
3.2.2. Moments of Truth
The moments of truth are those aspects of the questionnaire, which overall have the greatest relationship with
the customer loyalty index and/or a particularly high strategic importance for the Škoda brand.
The "Moments of Truth" consist of the following individual aspects:
- explanation of the workshop work prior to the implementation
- correct execution of the service work
- no repeated repair
- friendliness of service employees
- response to concerns and wishes of the customers
- explanation of work/billing
- price-performance ratio
* At the time of preparing this issue only Czech and English language versions were available.
Fig. 8
Moments of Truth in the CSS portal (Report 01/2011; sample workshop)
31GB
Page 32
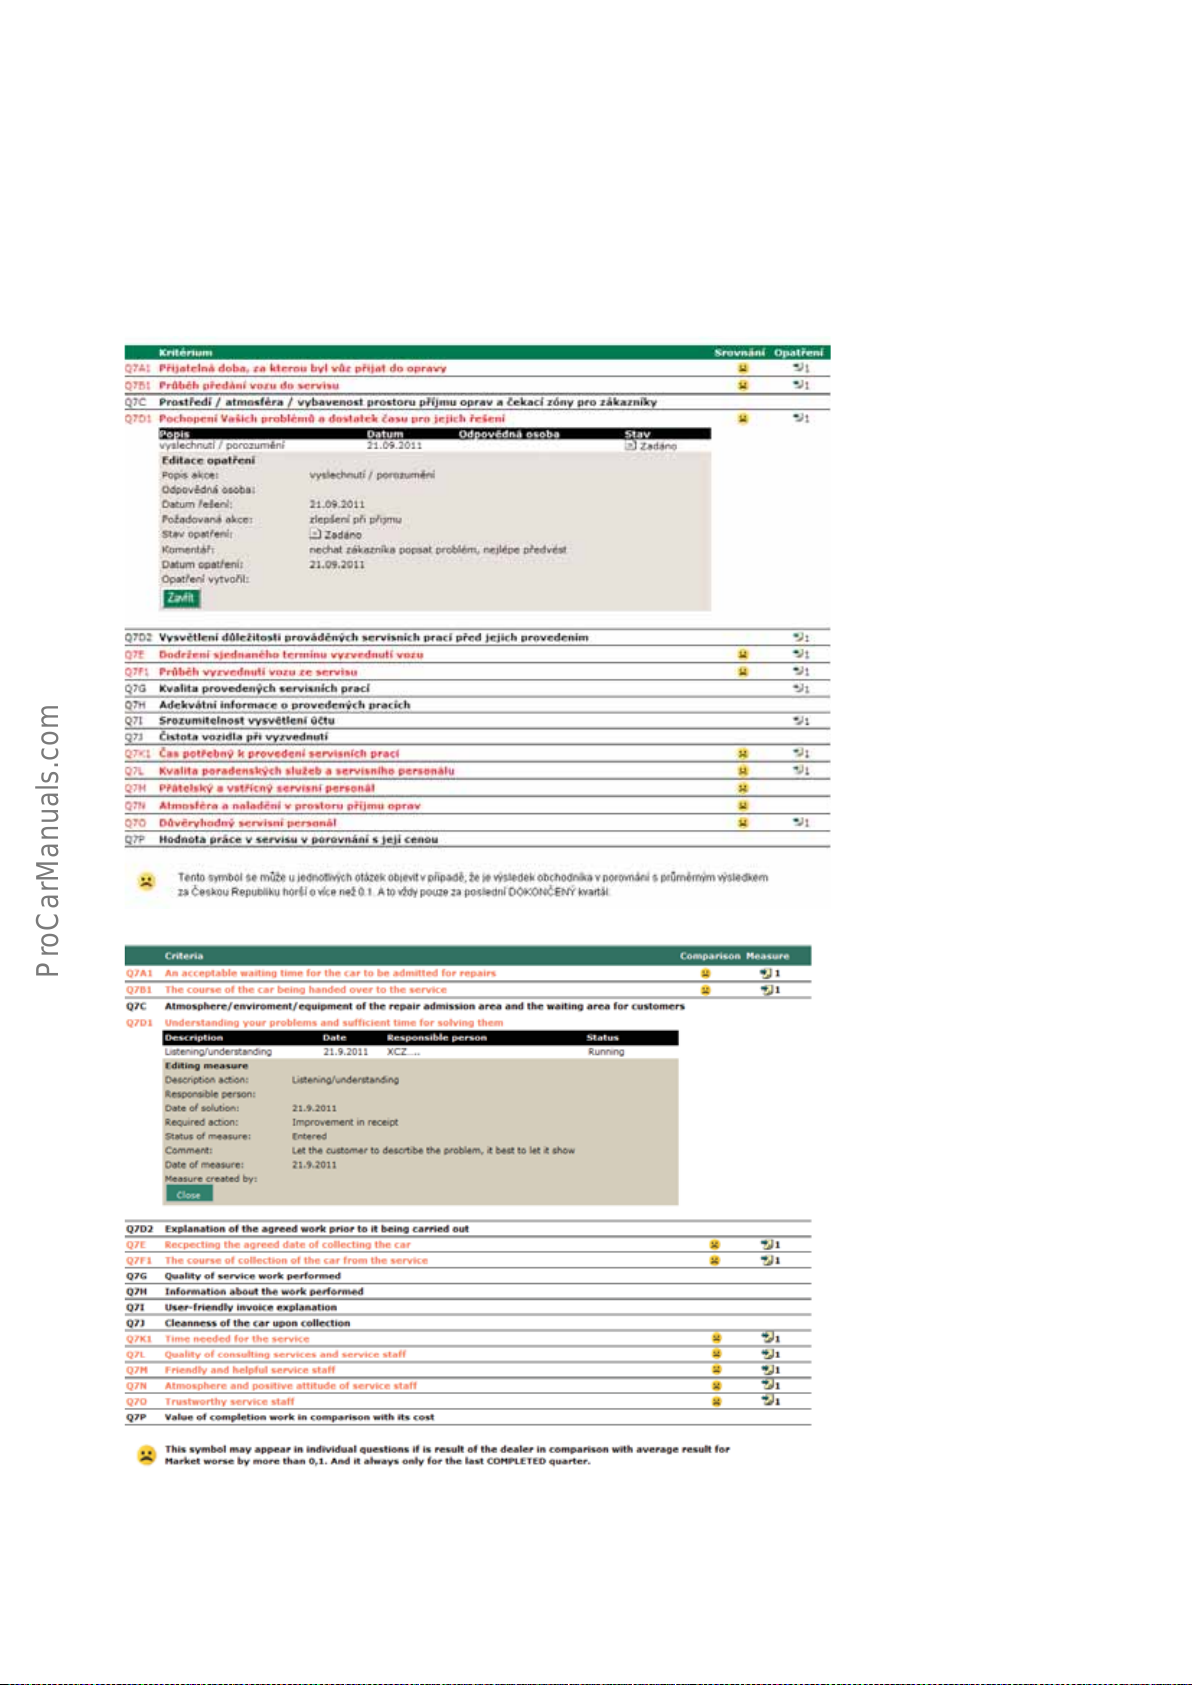
3.2.3. Analysis of strengths and weaknesses
Selected aspects are looked at more closely in the analysis of strengths and weaknesses. Questions from the CSS
questionnaire are addressed and grouped into logical themes, which also have a large impact on the customer
loyalty index. The analysis of strengths and weaknesses is a very good starting point for analysing the current
situation.
The following table shows the analysis of strengths and weaknesses from the CSS system on the opposite screenshot:
* At the time of preparing this issue only Czech and English language versions were available.
Fig. 9
Analysis of the strengths and weaknesses shown in the CSS portal (Report 01/2011; sample workshop).
GB32
Page 33
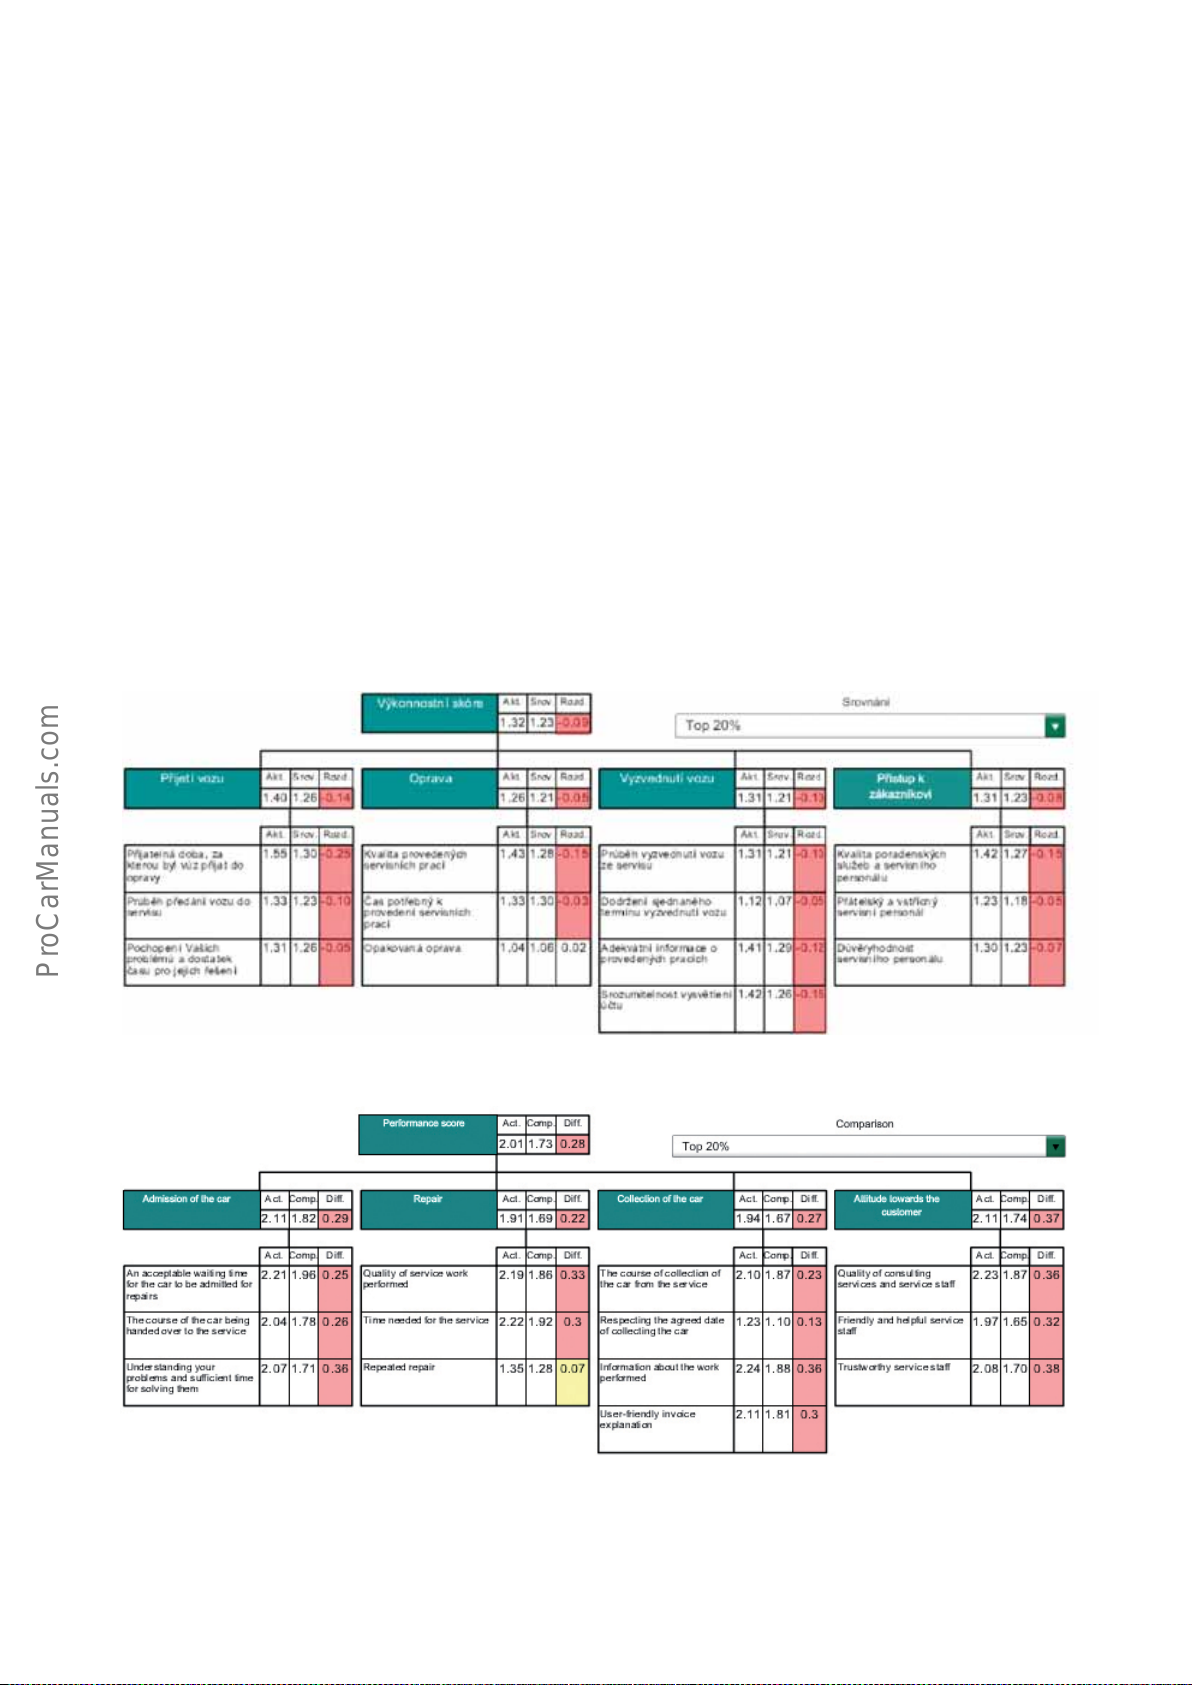
3.2.4. Quality characteristics
The quality characteristics always combine one or more statistically and contentwise related questions for the
topics.
The quality indicators can be considered topic display elements of customer loyalty. They are suitable for deeper
analysis of the actual state. For each indicator the value calculated from the mean value of the individual questions, which are part of this subject area, is displayed. For the fi rst stage of the analysis, the deviation of various
indicators of service quality from the benchmark is monitored.
When creating areas, standard benchmarks "national average" and "TOP 20%" can be selected (see fi g. 10).
A positive deviation shows strength of the workshop, a negative one weakness of the workshop. For quality
indicators with the highest negative deviation, the largest elimination measures exist.
In a second stage, the critical quality indicators are analysed in detail while considering the results of the relevant
individual questions. In addition, the temporal development of the individual results of the questions is considered.
* At the time of preparing this issue only Czech and English language versions were available.
Fig. 10
Quality indicator: Customer treatment with benchmark Top 20% and 12 month overview in the CSS portal.
33GB
Page 34

3.2.5. Procedure for the analysis
At the beginning of the analysis is the question "Where do we stand compared to other workshops?"
The reference value is always a benchmark. This general question should be further specifi ed:
1. What do we do better or at least as well as other workshops?
Here are our strengths! We should try to keep them long term and use them when communicating with the
customer.
2. What do other workshops do better?
Here we still have potential for improvement. We must work long term and permanently to improve these issues
3. What do other workshops do much better?
Here are our weaknesses which require immediate action. Other workshops have shown us that much better
results are possible. Such issues need systematic remedial action
During the continuous improvement process, the workshop manager with his team monitors whether the measures adopted indicate the desired effect. "Do our policies work in practice?" Meanwhile, are the effects resulting
from the CSS questions, which were regarded as critical by the customer, positive?
For checking, the development of the CSS results is monitored over time (see also chapter 3.5., section;
The "success of the measures introduced").
.
The "competition" must always be observed during these considerations. We are interested to what extent our
workshop can be improved in comparison with the benchmark: "Are we getting better in relation to other
workshops?"
All the main indicators and detailed questions are shown graphically in the CSS portal. The graphic illustration
basically allows both, the comparison of own results to a benchmark, such as the national average in the TOP 20%
and the examination of the values over time.
When analysing the current situation, the analysis of strengths and weaknesses provides specifi c information
about where immediate corrective action can be taken. For a detailed and deeper analysis of specifi c topics,
the quality characteristics, or the individual questions, which arise from these characteristics are used.
In the analysis it is important to focus on the weaknesses and take targeted, very specifi c measures for their
elimination. Usually it is more effi cient to focus more on some selected areas rather than trying to solve all
problems at once. In this case the motto "less is more" applies, especially when there are many areas in the
workshop that require costly remedial measures.
GB34
Page 35

3.3. Analyse the causes
In this chapter you will learn:
- that prior to meaningful improvement measures, a careful analysis of the causes is necessary
- what a fi shbone diagram is
- how this diagram helps when analysing the causes
- who was Kaoru Ishikawa
A central position in the overall model for the systematic improvement of customer satisfaction is the stage called
"analysis of the causes". This important stage is often underestimated in the daily operation of the workshop or
mixed with the analysis of the weaknesses or the development of measures. Only when separating the recognition of the weaknesses from the following cause analysis, practical and effective measures can be taken in the
next stage. Thus, the risk of ineffective measures that require great effort and do not bring the desired effect can
be minimised.
Note
At this point of the improvement process, it's all about the analysis of the causes, but not yet about working on the
solutions.
As already described in the preceding section, points can be recognised that require a remedy based on the analysis of weaknesses and strengths. The causes of the weaknesses can, however, not be directly recognised from
the CSS examination. Their identifi cation and designation follow in the next stage. At least now the team of the
workshop should also be included in the remedial procedure. Thus, knowledge of the structures and processes
are activated that are behind the actual opinions of the customers. When the employees are involved at this time,
they can identify more easily with the later changes that may follow. Thus it can be achieved that the employees
of the workshop take the quality of services rendered to heart and the future implementation of the measures
will not encounter any strong opposition.
35GB
Page 36

How can the causes be analysed effi ciently?
For the analysis of the causes, it is recommended to use the fi shbone diagram. The fi shbone diagram
(Ishikawa diagram) is a simple technique for the analysis of problems and their causes.
What is the fi shbone diagram?
In a fi shbone diagram all possible causes of a problem are graphically presented in the form of main and side
branches.
What is the fi shbone diagram?
The various causes of a problem will be illustrated with the help of this diagram, which makes a structured
approach to problem analysis possible. The fi shbone diagram is a particularly good tool for teamwork.
How does one proceed?
1. The problem must be clearly defi ned and confi rmed by the team.
2. The category of the causes must be defi ned and entered on the ends of the main branches.
3. The main causes must be determined and entered on the main branches of the diagram.
4. The secondary causes must be determined and entered on the side branches of the diagram.
5. The developed diagram must be discussed and evaluated.
Fishbone diagram (Ishikawa diagram)
The diagram was named after its shape - as one can see in our example - it looks like a fi shbone.
It owes its second name, Ishikawa diagram, to its inventor. Ishikawa Kaoru was a Japanese chemist who developed
a whole range of quality instruments, including this diagram which he invented in 1943.
GB36
Page 37
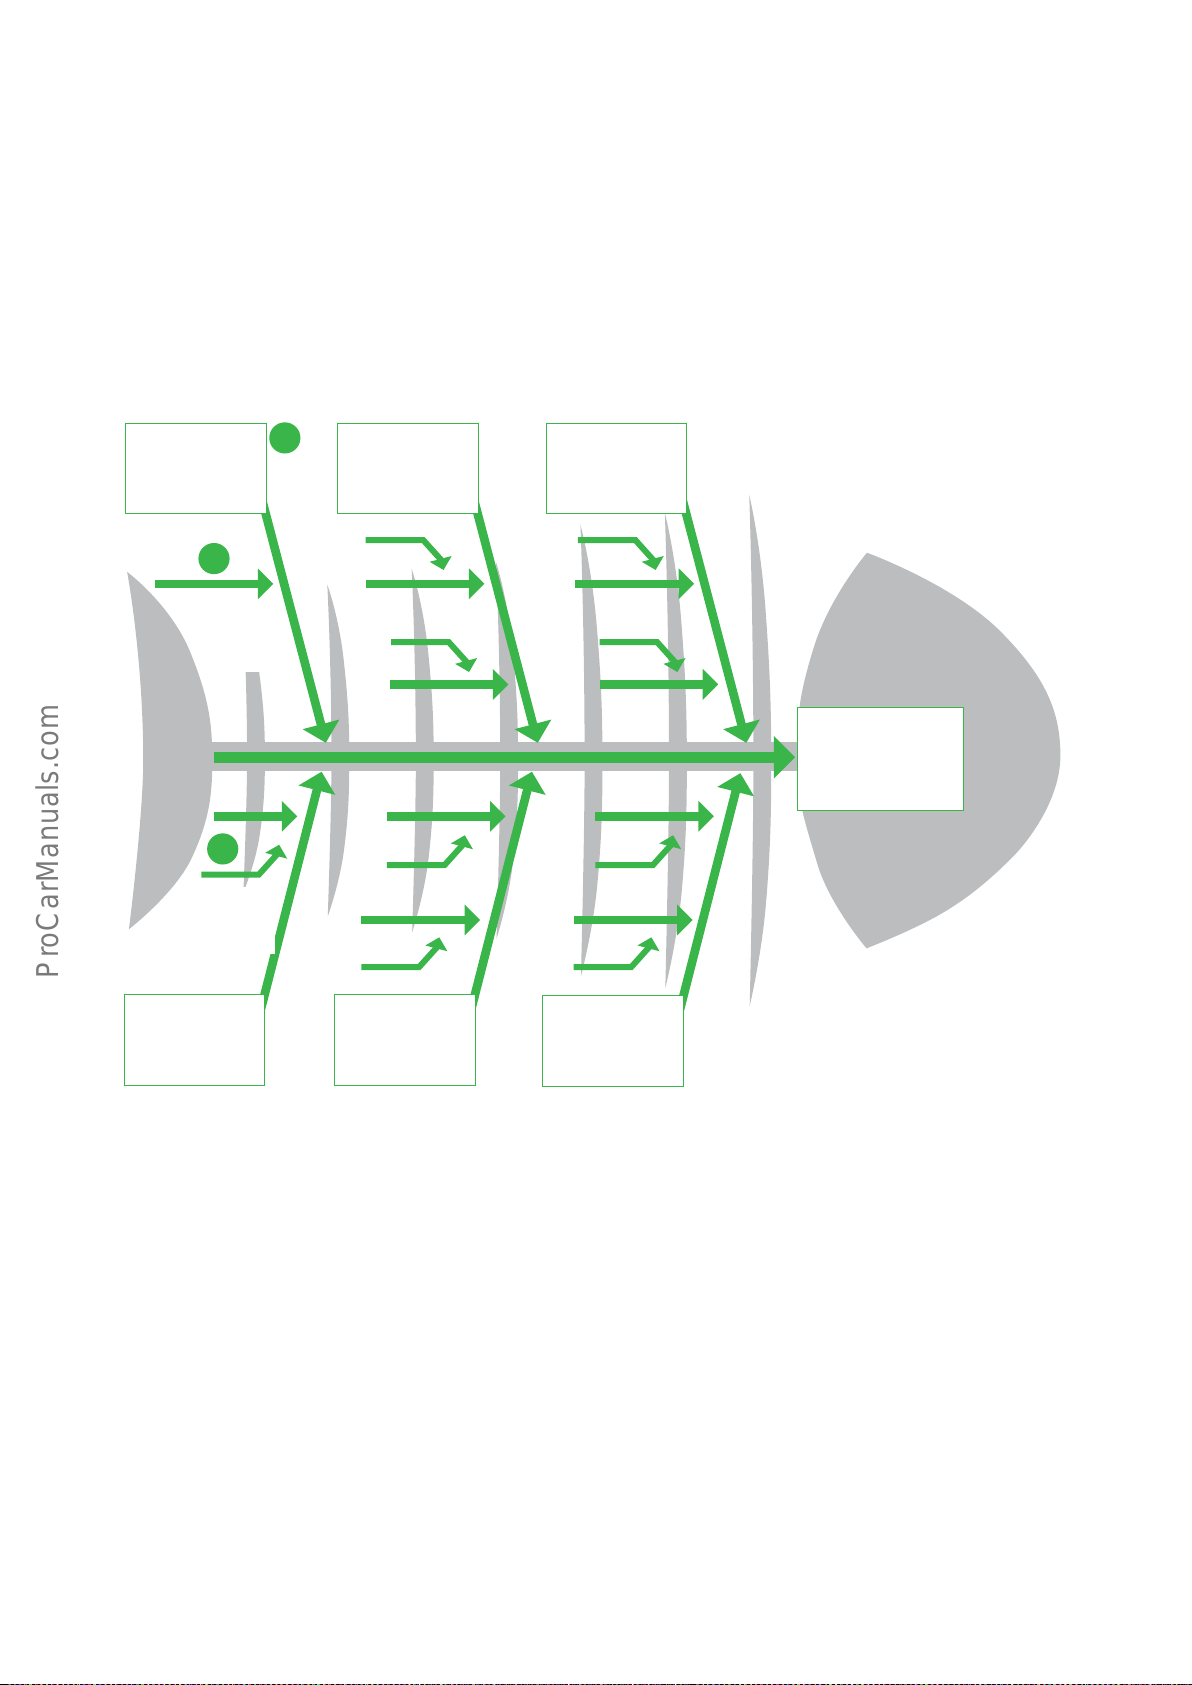
Category
3
Main
cause
4
Secondary
cause
Cause
2
Effect
1
Problem
Fig. 11
Design of the fi shbone diagram
37GB
Page 38

To better illustrate the approach to the problem "Explaining the importance of the workshop prior to performing
work" a fi shbone diagram is created (Question 7/D2).
To 1st and 2nd stage
The workshop manager defi nes both the problem and the individual categories. He enters the problem (1) "Explanation of the importance of the workshop prior to performing work" (Question 7/D2) - in the dedicated box
(fi sh head). Appropriate categories are entered on the ends of the main branches (2), for example, "personnel",
"processes / procedures", "equipment", etc.
The service manager should explain the problem and the category of causes to his team in advance, in order to
ensure their consent.
To 3rd and 4th stage
At this moment, the workshop manager and his team play a part. All participants bring their own ideas. It is important that no idea is disregarded - the spectrum must vary as widely as possible. Criticism or judgments about the
feasibility, order, etc. are not wanted at this time.
The main causes which are defi ned in our example ("client has little time," too little time per order ", etc.) are each
assigned to a category and entered in the corresponding main branch.
In the same way, one proceeds with the secondary causes (4), such as "all the customers come in the morning at
the same time", "time to explain the vehicle is not scheduled when making an appointment."
GB38
Page 39
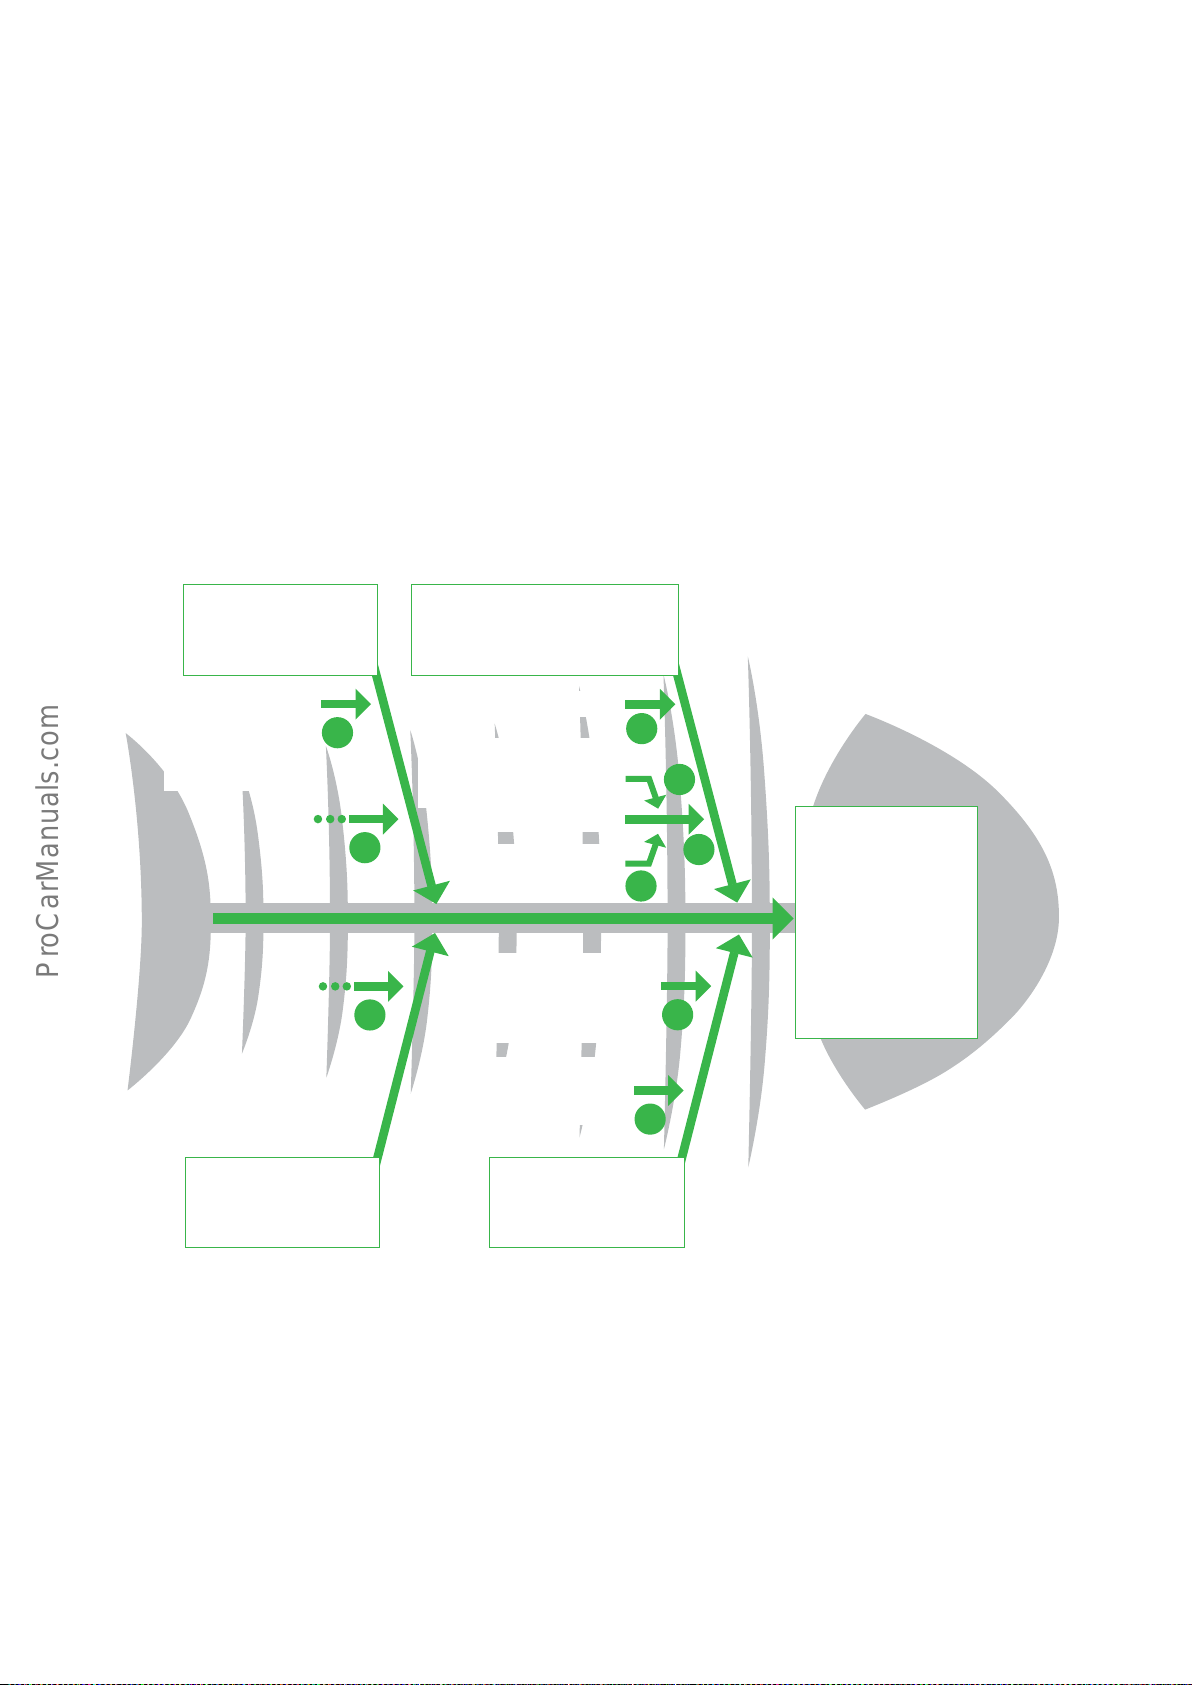
To 5th stage
The diagram is now complete. In the fi nal stage, the team evaluates the various causes. The aim of the evaluation is to select the most likely and most important causes. This selection forms the basis for the next work step
"derive and plan the measures" (see section 3.4.)
The order presented here is recommended, but not in every case (with the exception of point 1) mandatory for all
cases. The development of a fi shbone diagram is a creative process. Any changes, rearrangements and a different
order are not wanted when creating the diagram.
2
Equipment
not suffi cient margin
for meeting the
customer
2
Other
2
Processes, procedures
the customer has little time
an order
3
4
1
3
4
3
The customers
are not satis-
fi ed with the
explanation
of the service
work prior to its
implementation
(Question 7D2)
3
3
the time for the explana-
tion is not planned in when
scheduling the appointment
too little time for the order
all customers come
in the morning at the
same time
The service advisor does not
explain all service work of
3
too few service advisors
during the rush hour
3
2
Personnel
Fig. 12
Concrete example of a fi shbone diagram
39GB
Page 40
3.4. Derive and plan the measures
In this chapter you will learn:
- what measures can be derived and planned systematically
- which questions the team supports during this procedure
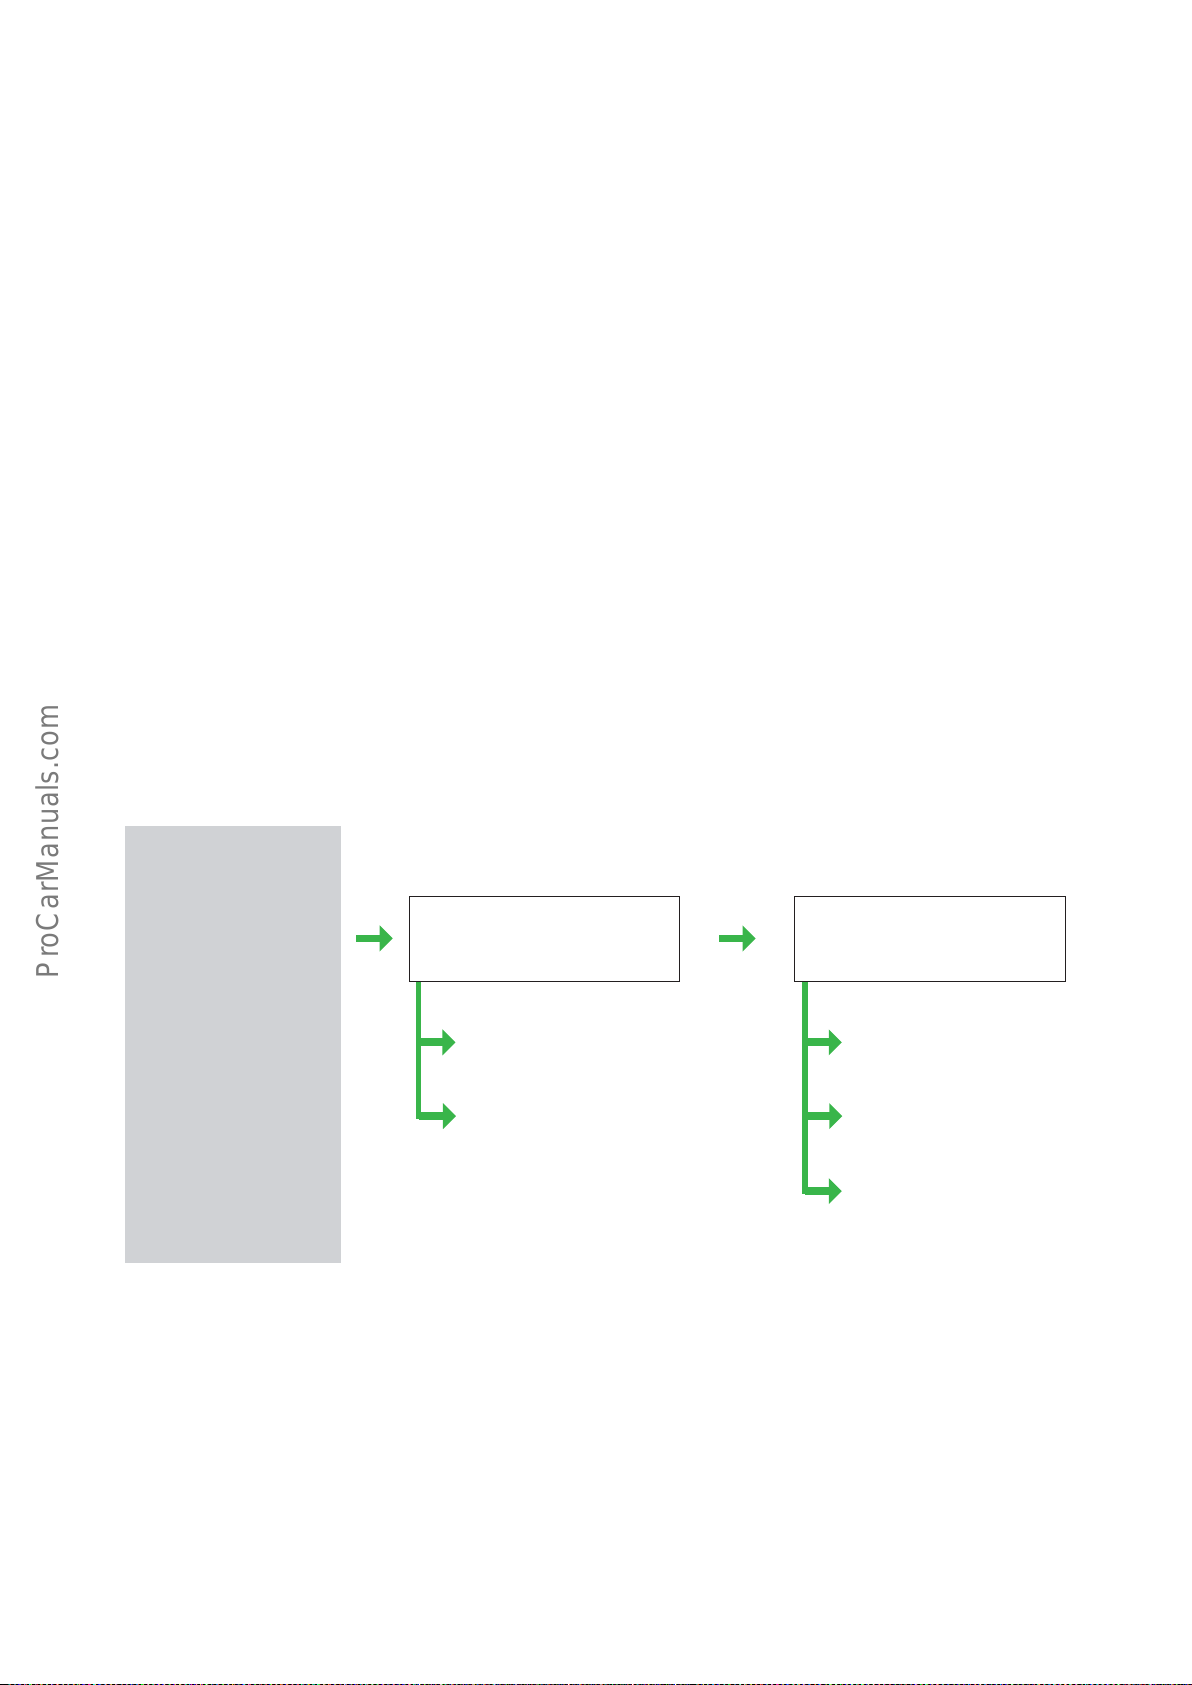
We have completed the analysis of causes. We can divide the next phase into two independent stages:
1. Propose measures
2. Plan measures
The specifi cations stipulated in these two stages must be meaningful, concrete, achievable and verifi able.
Answering the following questions is helpful in the derivation and planning of the improvement measures:
Causes identifi ed
1st cause
2nd cause
3rd cause
4th cause
Cause ...
1. Propose measures 2. Plan measures
Which measures should
be taken?
Which measures
should/can be taken?
What exactly should be
done?
How should it be done?
Who should do it and
until when?
Fig. 13
Derive and plan the measures
GB40
Page 41

3.4.1. Propose measures
Which measures should be taken?
Similar to the analysis of the causes in chapter 3.3. as many ideas as possible must fi rst of all be gathered.
All possible measures, related to a specifi c cause, are discussed. It is a creative process where it is important to
collect as many ideas as possible without already examining their measures.
Which measures should/can be taken?
The proposals from the pool of measures are now being worked out while assessing their feasibility.
Those measures are selected, which promise the greatest success.
3.4.2. Plan measures
What exactly should be done?
The more precisely is defi ned and described what needs to be done, the fewer misunderstandings and
ambiguities arise. The answer to this question should therefore help to plan specifi c actions.
How should it be done?
The more concrete is defi ned how the measure should be implemented, the clearer and easier is the implementation for the employees. These include among others the provision of funds and resources. Depending on the type
of measure, it may be important to determine the number, frequency or timing of activities to be undertaken.
Just because of these technical details, the employees should be involved in the planning process. Only then can
their creativity, knowledge and experience be used and the positive acceptance of the changes ensured in time.
The action plan will be implemented individually for individual workshops in the application "Feedback" and in the
application "action plan". The service partner must devote the possibility of direct response to quite specifi c
comments of his customers and to the areas where he does not achieve satisfactory results.
Who should do it and until when?
For the change process it is important that the decisions are controlled. Therefore, it should be determined who is
responsible for what measure and by when it should be implemented. When defi ning repetitive and/or long-term
activities, it must be stipulated on which dates the person in charge should be informed. Only in this way it can be
ensured that the implementation of planned measures is not forgotten in the future.
The proposed measures are always based on specifi c causes. You should consider all the peculiarities of the
workshop and its surroundings.
41GB
Page 42
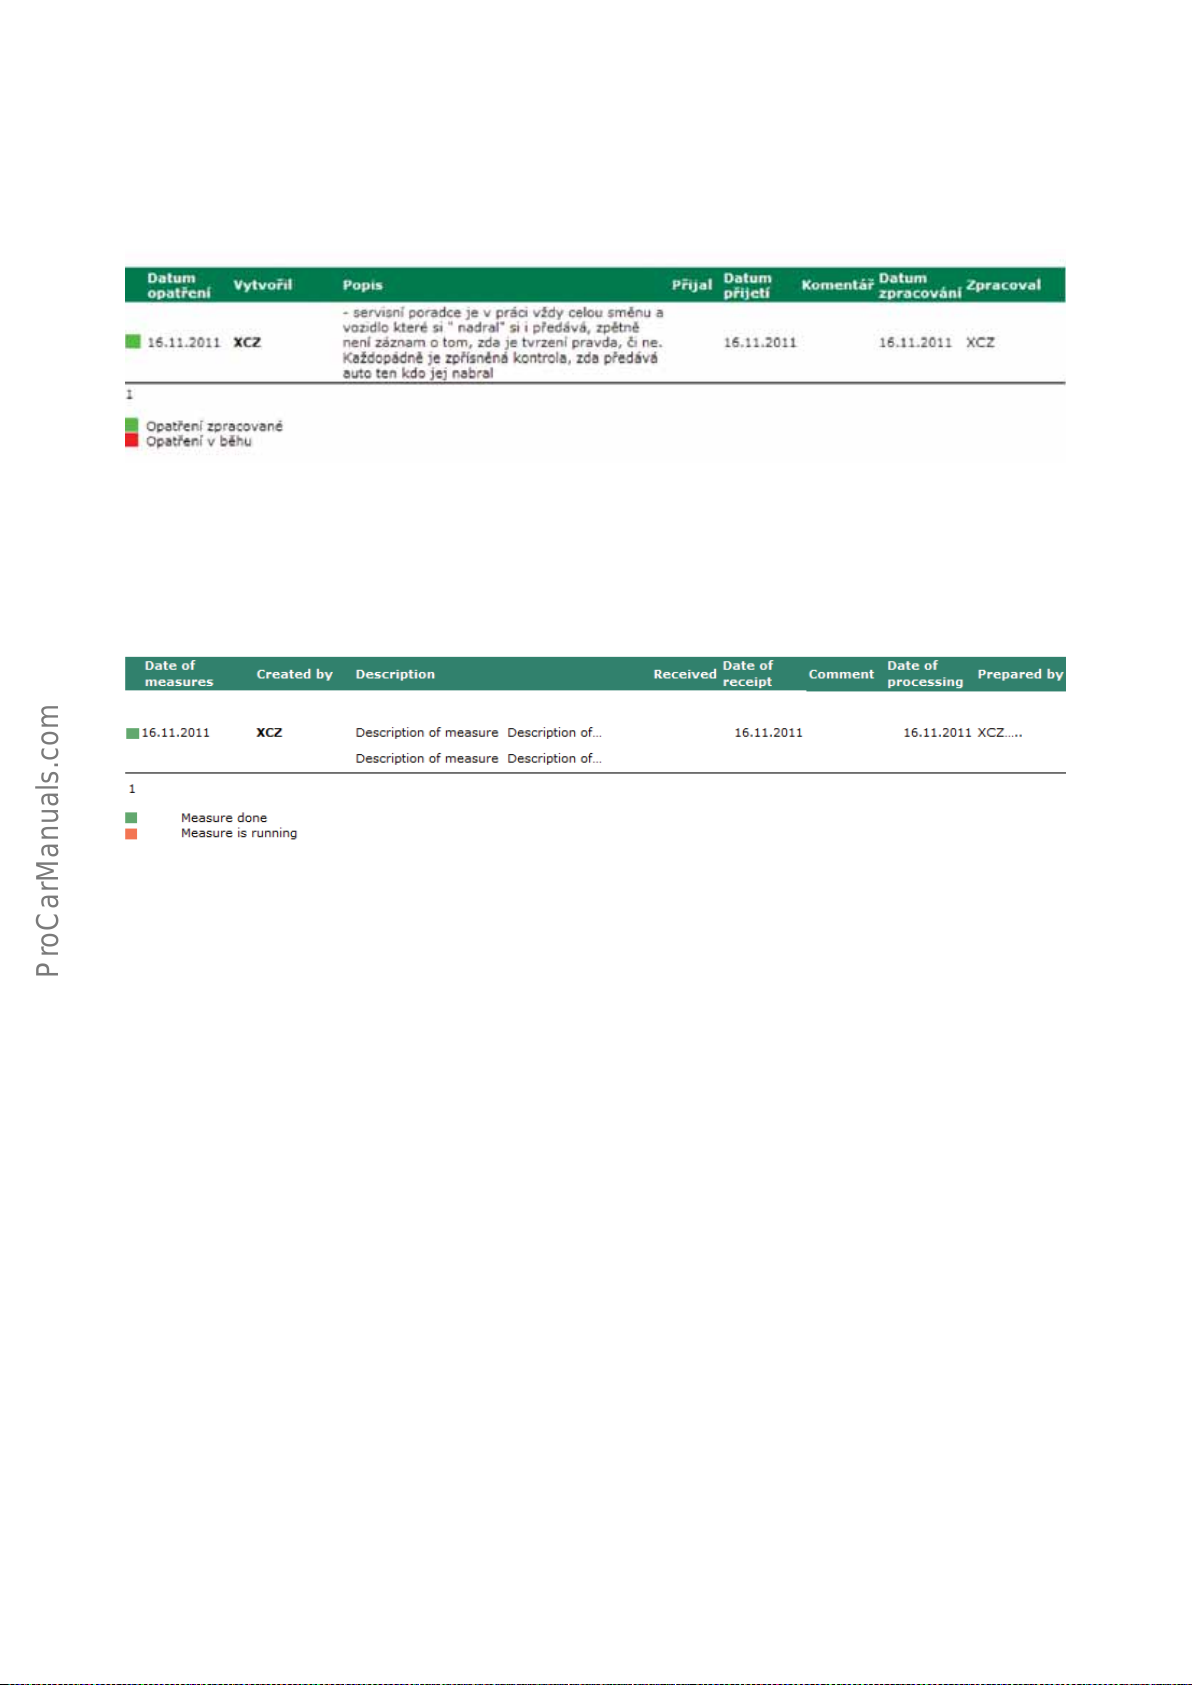
Catalog of CSS measures
* At the time of preparing this issue only Czech and English language versions were available.
Fig. 14
Measures proposed in the application "Feedback" CSS measures. Critical area: Explanation of the work in the workshop prior to conducting work on the basis of customer feedback (Question 7 H), Report 01/2011; sample workshop
GB42
Page 43
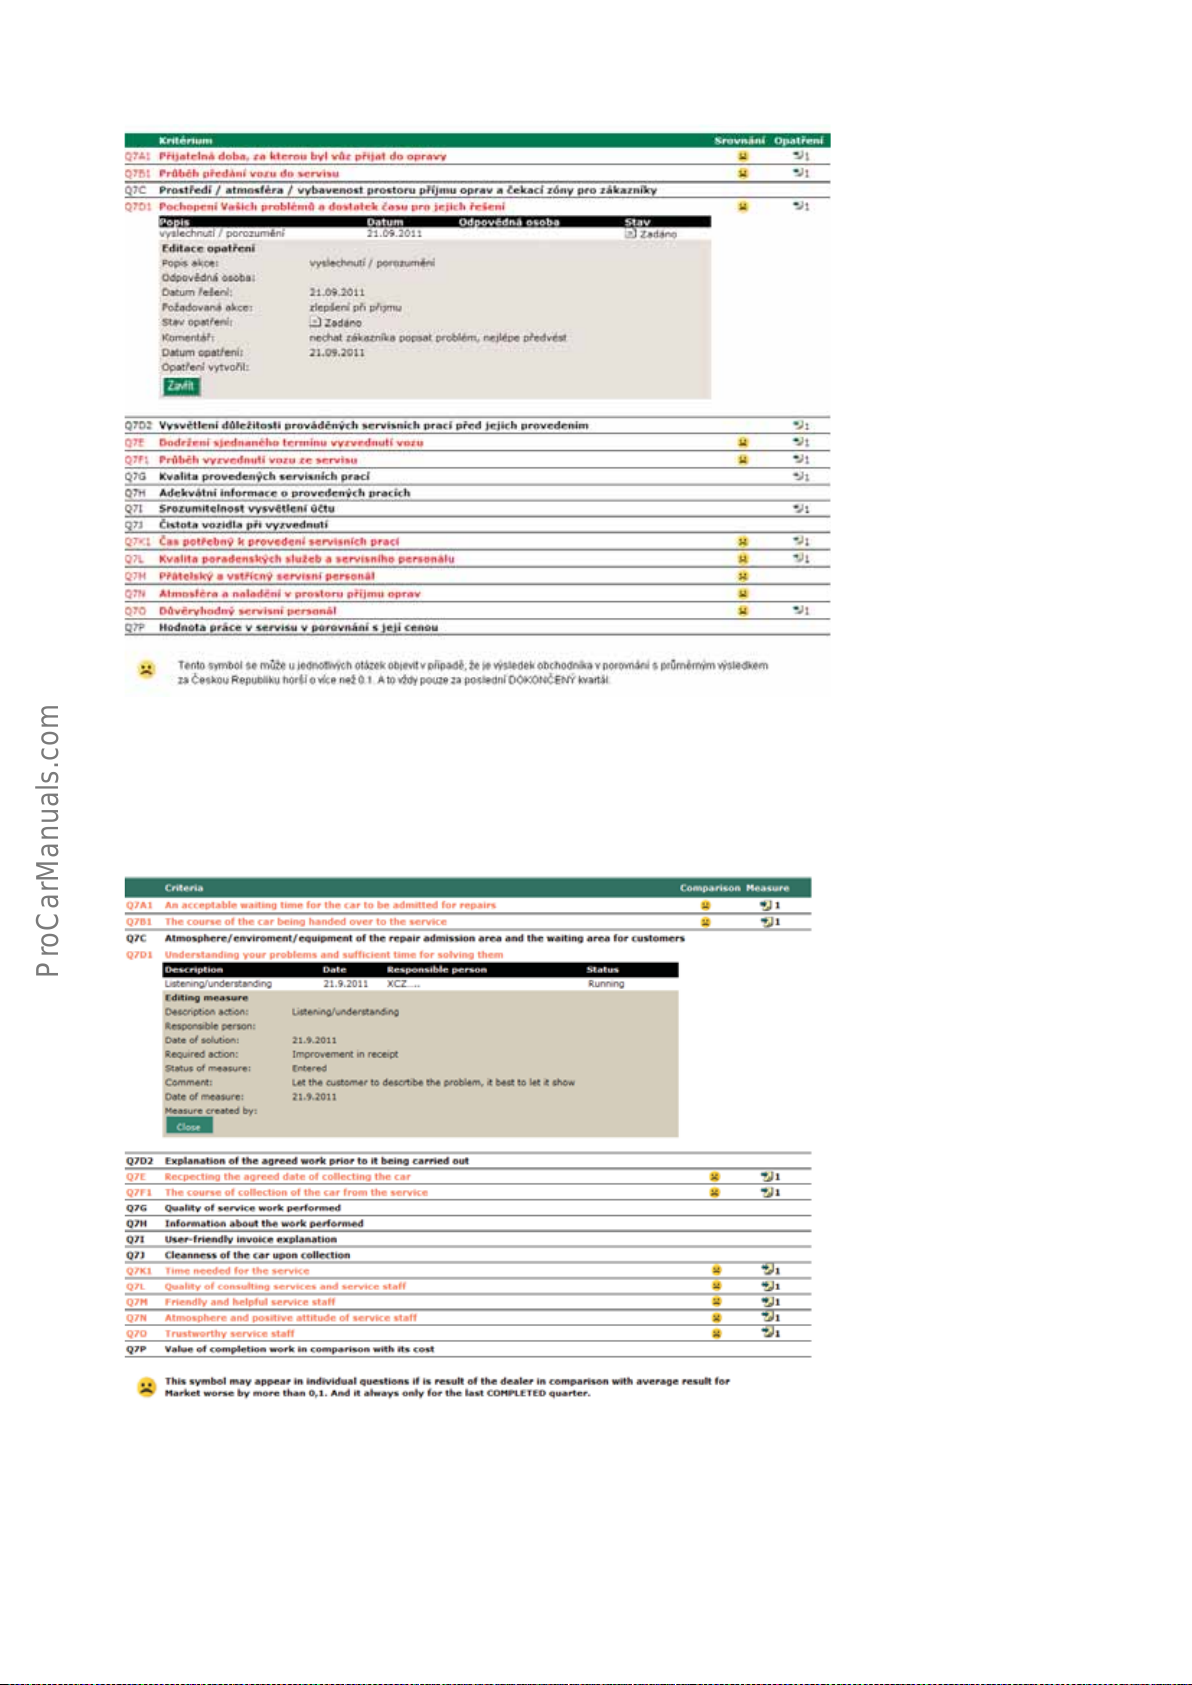
* At the time of preparing this issue only Czech and English language versions were available.
Fig. 15
Measures proposed in the application "action plan" CSS. Critical area: Understanding the problems and suffi cient
time for their solution (Question 7D.1), Report 01/2011; sample workshop
43GB
Page 44

3.5. Implement the measures
In this chapter you will learn:
- that the service manager can assist the implementation of the measures using competent leadership
- which specifi c management responsibilities the service manager has at this stage
- that it is important to consistently and continuously implement the planned measures for change
- which time system is useful when tracking the effects of the measures in the CSS system.
When all measures are fully planned, it is now a matter of implementing the project. All employees involved will be
asked to pitch in and work on their specifi c tasks. The elaborated and documented action plan serves as a guide.
Especially in the phase of implementation, the service performance can signifi cantly support the success of the
measures through competent employee management. It is the goal to turn all participating employees into active
employees.
Measures to improve customer satisfaction (e.g. extend the acceptance date or inform customers about faults
that still exist) are often designed to optimise the organizational processes within the company and to improve
communication with customers (e.g. welcome each customer with a handshake and name). This requires from all
parties involved to change their habitual ways of working.
The fi rst steps are often made with great effort and sometimes met with opposition. It is important for the
success that all service employees are constantly focused and working to implement the agreed changes.
It is important that the service management provides guidance during the procedure and sets a clear starting
signal right from the beginning. This might take place in the form of team meetings where the service manager
presents once more the objectives and the coordinated measures. Open questions can still be addressed at the
meeting before everybody begins with the implementation.
If the workshop introduces entirely new solutions, it usually takes some time until the new procedures are implemented. It is normal that not all works perfectly from the start. New procedures must be learned. When several
employees are involved in carrying out measures, regular meetings assist these learning experiences.
At the beginning of the support phase, the service manager has the task to provide intensive starting help for the
process of change. He should motivate his employees to implement together what has been planned beforehand.
It is important to take any concerns or opposition of employees seriously and assist them in fi nding solutions.
People oppose in order to protect whatever already exists, and this opposition usually arises because of fears
and insecurities, or if people assume that these changes will overtax them professionally or time-wise. Therefore,
it is important not to take this lightly. The workshop manager must respond and carefully break them down by
providing information and understanding. Only employees who accept the changes and are willing to change, can
participate actively in the implementation of the measures.
It is a further task of the service management to follow the progress of implementation and to monitor the
compliance with the deadlines set. The idea is to keep track and to manage them when diffi culties arise.
GB44
Page 45

Supportive measures
Thus, the workshop management can support the implementation of measures:
- Give a clear start signal
- Offer orientation for the procedure
- Motivate employees, especially at the beginning of the implementation
- Take opposition and concerns seriously and break them down with understanding and provide information
- Allow exchange of experience
- Monitor progress of implementation
- Guide and intervene when diffi culties occur
- Observe CSS values and inform the team about measurable results
A successful implementation would lead to changes in CSS values of the individual questions evaluated as critical
by the customer. Regular observation of the CSS results sheds light on the effectiveness of the measures.
During the regular observation of the CSS results, two aspects must be considered:
- the effectiveness of the measures introduced
- the infl uence of other factors
The effectiveness of the measures introduced
The successful implementation of measures is not immediately refl ected in the rapidly rising CSS values.
Taking into account that the CSS works with sliding mean values to safeguard a result (see chapter 3.1), the actual
results will be refl ected only gradually in the CSS values. The workshop should therefore not be discouraged if the
CSS values do not immediately improve in the next two months, following the measures which were introduced.
The implementation must be pursued consistently.
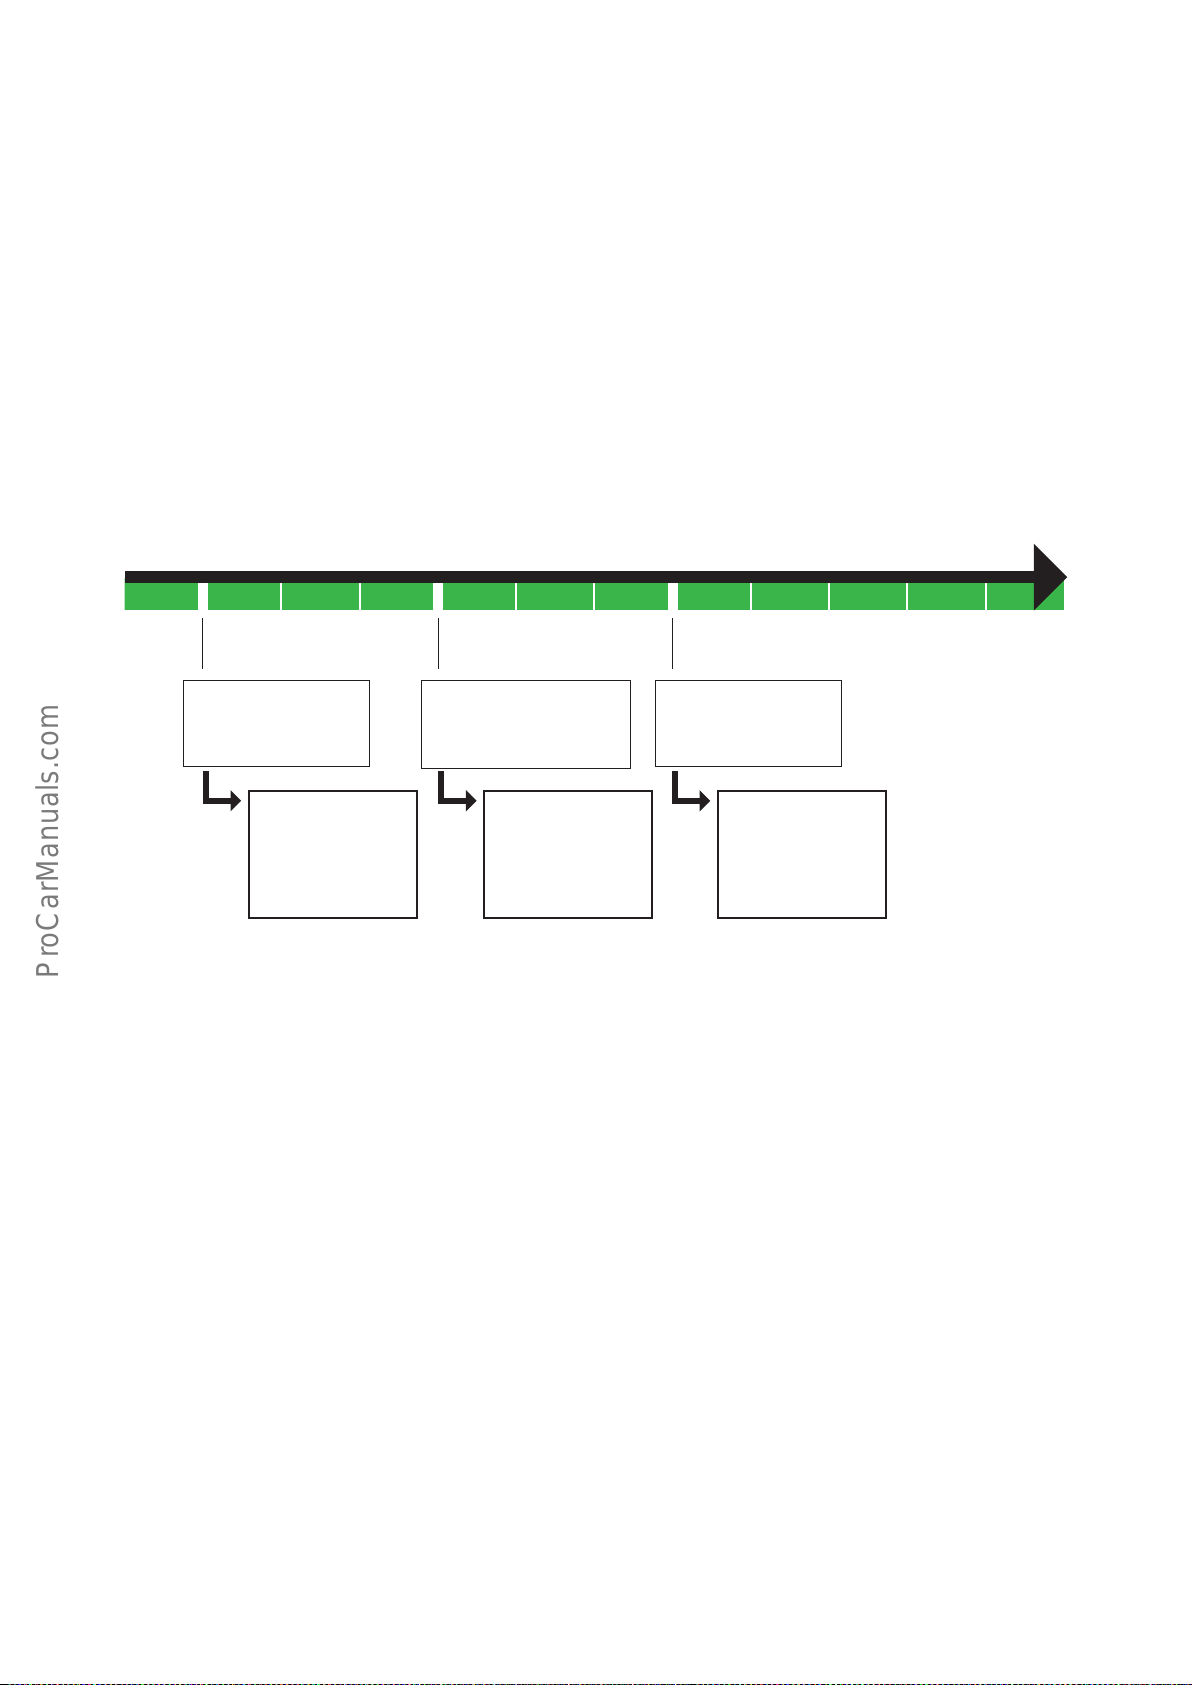
In general, positive effects are visible only in 3 to 6 months. Figure 16 shows that the development trend for the
measure introduced in the month 03/2011 only shows positive results in the month 06/2011. Then there are 100%
new interviews in the 3 month overview since the beginning of the measure.
45GB
Page 46
The infl uence of other factors
There are factors that change the customer satisfaction values positively and can be infl uenced by employees
(e.g., safety of procedure, friendliness, time for the customer). At the same time there are also external factors
that do not depend on the competence and motivation of the employees (e.g., seasonal infl uences, economic
crises, loss of reputation in case of recalls). There exist correlations between different factors. It is not always
possible to assign cause and effect in such a complex structure exactly to one another.
It is defi nitely wrong to conclude from the above aspects, that it is not necessary to take initiative for improving
customer satisfaction. Instead, it is important to bring about meaningful change, according to the procedure,
which is explained in this self-study programme.
03/2011
Introduction of
the measure
At this time, the
report 01/2011
is available
Fig. 16
Time system for tracking the effectiveness of the measures introduced based on the CSS reports
06/2011 09/2011
1. Examination of the
development trend
At this time, the
report 04/2011
is available
1. Reliable test
results
At this time, the
report 07/2011
is available
GB46
Page 47

4.
In this chapter the main points of the previous chapters are summarised. It is explained once more how the
procedure of measuring and improving customer satisfaction is obtained and what part the service quality
and the CSS play.
This self-study programme shows the approach for improving customer satisfaction as a cycle. It is clear from this
representation and further explanations, that it is a purposeful procedure.
A special feature of the CSS procedure is its circular nature - this shows that the measurement of customer
satisfaction and the implementation of corrective measures, which the workshop implements, are a continuous
process.
It is a rare business practice to achieve complete customer satisfaction and because the results achieved should
be kept long term, the (improvement) process can only be a continuous one. This means concretely for every car
dealership that it must consistently work on customer satisfaction. If the car dealership wants to achieve positive
changes and maintain good results, it must make regular and sustained efforts to reduce the weaknesses identifi ed in the CSS studies.
Improvement of customer satisfaction as a continuous process
The quality of service plays a key role. High quality in carrying out orders and high quality of customer care are
prerequisites for high customer satisfaction.
47GB
Page 48

Each employee in the service makes a valuable contribution to reach this goal. For this reason, all participating
service employees must actively be involved in working with the circulation model. The team can identify weaknesses, analyse the causes and develop measures. Aims and measures that were developed jointly, are often
better accepted and implemented.
If necessary services of external companies can also be included. In addition, external consultants can assist
when fi nding the causes and implementing measures (e.g., moderate) and accompany the process of change.
Nevermind in which way the process of improving customer satisfaction in the various car dealerships is
addressed specifi cally by the service managers and their teams - they have one thing in common:
If all parties have internalised the importance of customer satisfaction for the safety of their own workplace, if
they actively collaborate on solutions and are ready for changes in conduct and procedures, then it is possible to
achieve real progress.
The German writer and mathematician Georg Christoph Lichtenberg (1742-1799) once put it like this:
"I certainly cannot say whether it will be better if it is different, but this much I can say: it must be different if
it is to be better. "
GB48
Page 49

5. Test your knowledge
1. What is customer satisfaction?
................................................................ ...........................................................................................................................................
................................................................ ...........................................................................................................................................
................................................................ ...........................................................................................................................................
................................................................ ...........................................................................................................................................
................................................................ ...........................................................................................................................................
................................................................ ...........................................................................................................................................
................................................................ ...........................................................................................................................................
...................................................................................................................... .................................................................................
................................................................ ...........................................................................................................................................
................................................................ ...........................................................................................................................................
................................................................ ...........................................................................................................................................
2. What is customer loyalty?
................................................................ ...........................................................................................................................................
................................................................ ...........................................................................................................................................
................................................................ ...........................................................................................................................................
................................................................ ...........................................................................................................................................
................................................................ ...........................................................................................................................................
................................................................ ...........................................................................................................................................
................................................................ ...........................................................................................................................................
................................................................ ...........................................................................................................................................
................................................................ ...........................................................................................................................................
................................................................ ...........................................................................................................................................
3. How can you describe the relationship between customer satisfaction and customer loyalty?
................................................................ ...........................................................................................................................................
................................................................ ...........................................................................................................................................
................................................................ ...........................................................................................................................................
................................................................ ...........................................................................................................................................
................................................................ ...........................................................................................................................................
................................................................ ...........................................................................................................................................
................................................................ ...........................................................................................................................................
................................................................ ...........................................................................................................................................
................................................................ ...........................................................................................................................................
................................................................ ...........................................................................................................................................
4. What areas of a car dealership are infl uenced by customer loyalty and customer satisfaction?
................................................................ ...........................................................................................................................................
................................................................
................................................................ ...........................................................................................................................................
................................................................ ...........................................................................................................................................
................................................................ ...........................................................................................................................................
................................................................ ...........................................................................................................................................
................................................................ ...........................................................................................................................................
................................................................ ...........................................................................................................................................
................................................................ ...........................................................................................................................................
...........................................................................................................................................
49GB
Page 50

Questions for chapter 1
Customer satisfaction and customer loyalty
5. Why does it make sense to plan and implement improvement measures systematically?
................................................................ ...........................................................................................................................................
................................................................ ...........................................................................................................................................
................................................................ ...........................................................................................................................................
................................................................ ...........................................................................................................................................
................................................................ ...........................................................................................................................................
................................................................ ...........................................................................................................................................
................................................................ ...........................................................................................................................................
................................................................ ...........................................................................................................................................
................................................................ ...........................................................................................................................................
................................................................ ...........................................................................................................................................
................................................................ ...........................................................................................................................................
6. What is service quality composed of?
................................................................ ...........................................................................................................................................
................................................................ ...........................................................................................................................................
................................................................ ...........................................................................................................................................
................................................................ ...........................................................................................................................................
................................................................ ...........................................................................................................................................
................................................................ ...........................................................................................................................................
................................................................ ...........................................................................................................................................
................................................................ ...........................................................................................................................................
................................................................ ...........................................................................................................................................
................................................................ ...........................................................................................................................................
................................................................ ...........................................................................................................................................
7. What do the fi ve stages of the circulation model for systematically improving customer satisfaction consist of?
................................................................ ...........................................................................................................................................
................................................................ ...........................................................................................................................................
................................................................ ...........................................................................................................................................
................................................................ ...........................................................................................................................................
................................................................ ...........................................................................................................................................
................................................................ ...........................................................................................................................................
................................................................ ...........................................................................................................................................
................................................................ ...........................................................................................................................................
8. Which are the stages of the circulation model that are supported by the CSS?
................................................................ ...........................................................................................................................................
................................................................ ...........................................................................................................................................
................................................................ ...........................................................................................................................................
................................................................ ...........................................................................................................................................
................................................................ ...........................................................................................................................................
................................................................ ...........................................................................................................................................
................................................................ ...........................................................................................................................................
................................................................ ...........................................................................................................................................
................................................................ ...........................................................................................................................................
GB50
Page 51

Questions for chapter 2
Model for the systematic improvement of customer satisfaction
9. What is the CSS?
................................................................ ...........................................................................................................................................
................................................................ ...........................................................................................................................................
................................................................ ...........................................................................................................................................
................................................................ ...........................................................................................................................................
................................................................ ...........................................................................................................................................
................................................................ ...........................................................................................................................................
................................................................ ...........................................................................................................................................
10. The questions in the CSS questionnaire relate to what kind of customer experiences?
................................................................ ...........................................................................................................................................
................................................................ ...........................................................................................................................................
................................................................ ...........................................................................................................................................
........................................................... ................................................................................................................................................
................................................................ ...........................................................................................................................................
................................................................ ...........................................................................................................................................
11. What standards/benchmarks are valid for the common operational values of satisfaction?
................................................................ ...........................................................................................................................................
................................................................ ...........................................................................................................................................
................................................................ ...........................................................................................................................................
................................................................ ...........................................................................................................................................
................................................................ ...........................................................................................................................................
................................................................ ...........................................................................................................................................
................................................................ ...........................................................................................................................................
12. What are the two main question types in the CSS questionnaire?
................................................................ ...........................................................................................................................................
................................................................ ...........................................................................................................................................
................................................................ ...........................................................................................................................................
................................................................ ...........................................................................................................................................
................................................................ ...........................................................................................................................................
................................................................ ...........................................................................................................................................
................................................................ ...........................................................................................................................................
13. What does the term "sliding mean values" mean in connection with the CSS reports?
................................................................ ...........................................................................................................................................
................................................................ ...........................................................................................................................................
................................................................ ...........................................................................................................................................
................................................................ ...........................................................................................................................................
................................................................
................................................................ ...........................................................................................................................................
................................................................ ...........................................................................................................................................
...........................................................................................................................................
51GB
Page 52

Questions for chapter 3.1
Increase customer satisfaction and customer loyalty with the CSS: Measure the current status
14. How can the business ensure the quality of the CSS measurement through the quality of its customer data?
................................................................ ...........................................................................................................................................
................................................................ ...........................................................................................................................................
................................................................ ...........................................................................................................................................
................................................................ ...........................................................................................................................................
................................................................ ...........................................................................................................................................
15. What are the important key fi gures and compilations of individual questions for the analysis of the actual state?
................................................................ ...........................................................................................................................................
................................................................ ...........................................................................................................................................
................................................................ ...........................................................................................................................................
................................................................ ...........................................................................................................................................
.............................................. ..............................................................................................................................................................
................................................................ ...........................................................................................................................................
Questions for chapter 3.2
Increase customer satisfaction and customer loyalty with the CSS; Update actual state
16. What topics should be worked on fi rst and foremost for the systematic improvement?
................................................................ ...........................................................................................................................................
................................................................ ...........................................................................................................................................
................................................................ ...........................................................................................................................................
.................................................... ........................................................................................................................................................
................................................................ ...........................................................................................................................................
17. What is important when analysing the causes?
................................................................ ...........................................................................................................................................
................................................................ ...........................................................................................................................................
............................................... .............................................................................................................................................................
................................................................ ...........................................................................................................................................
................................................................ ...........................................................................................................................................
................................................................ ...........................................................................................................................................
18. Which instrument can be used to structure and illustrate the analysis of the causes?
................................................................ ...........................................................................................................................................
................................................................ ...........................................................................................................................................
................................................................ ...........................................................................................................................................
................................................................ ...........................................................................................................................................
................................................................ ...........................................................................................................................................
................................................................ ...........................................................................................................................................
GB52
Page 53

Questions for chapter 3.3
Increase customer satisfaction and customer loyalty with the CSS; analyse the causes
19. Name the fi ve stages when working with the fi shbone diagram!
................................................................ ...........................................................................................................................................
................................................................ ...........................................................................................................................................
................................................................ ...........................................................................................................................................
................................................................ ...........................................................................................................................................
................................................................ ...........................................................................................................................................
................................................................ ...........................................................................................................................................
20. Assign the two corresponding questions to the stage "development of measures".
................................................................ ...........................................................................................................................................
................................................................ ...........................................................................................................................................
................................................................ ...........................................................................................................................................
................................................................ ...........................................................................................................................................
................................................................ ...........................................................................................................................................
................................................................ ...........................................................................................................................................
Questions for chapter 3.4
Improve customer satisfaction and customer loyalty with the CSS study; derive and plan the measures
21. Assign the two corresponding questions to the stage "planning of the measures".
................................................................ ...........................................................................................................................................
................................................................ ...........................................................................................................................................
................................................................ ...........................................................................................................................................
................................................................ ...........................................................................................................................................
................................................................ ...........................................................................................................................................
................................................................ ...........................................................................................................................................
22. How can the service manager implement the improvement measures in the company?
................................................................ ...........................................................................................................................................
................................................................ ...........................................................................................................................................
................................................................ ...........................................................................................................................................
................................................................ ...........................................................................................................................................
................................................................ ...........................................................................................................................................
................................................................ ...........................................................................................................................................
53GB
Page 54

Questions for chapter 3.5
Improve customer satisfaction and customer loyalty with the CSS study; derive and plan the measures; implement
the measures
23. When is it possible as a rule to recognise positive effects of measures in the CSS reporting at the earliest?
................................................................ ...........................................................................................................................................
................................................................ ...........................................................................................................................................
................................................................ ...........................................................................................................................................
................................................................ ...........................................................................................................................................
................................................................ ...........................................................................................................................................
................................................................ ...........................................................................................................................................
................................................................ ...........................................................................................................................................
................................................................ ...........................................................................................................................................
................................................................ ...........................................................................................................................................
................................................................ ...........................................................................................................................................
................................................................ ...........................................................................................................................................
................................................................ ...........................................................................................................................................
24. Why is it important to take any concerns or opposition from employees seriously when implementing the measures?
................................................................ ...........................................................................................................................................
................................................................ ...........................................................................................................................................
................................................................ ...........................................................................................................................................
................................................................ ...........................................................................................................................................
................................................................ ...........................................................................................................................................
................................................................ ...........................................................................................................................................
................................................................ ...........................................................................................................................................
................................................................ ...........................................................................................................................................
................................................................ ...........................................................................................................................................
................................................................ ...........................................................................................................................................
................................................................ ...........................................................................................................................................
................................................................ ...........................................................................................................................................
................................................................ ...........................................................................................................................................
................................................................ ...........................................................................................................................................
................................................................ ...........................................................................................................................................
GB54
Page 55

Solution
1.
a. The customer satisfaction refl ects the quality of services from the perspective of the customer.
b. The term customer satisfaction relates to the customer's expectations and the fulfi llment of those expectations.
2.
Customer loyalty means repeated contacts and business relationships (inquiries, interviews, repair orders,
purchases, etc.) between the customer and the car dealership.
3.
High customer satisfaction is an important condition for high customer loyalty. Customer satisfaction does not
always and necessarily lead to customer loyalty, but a dissatisfi ed customer will never be loyal to the repair
shop!
4.
a. Performance guarantee of the business relationship
b. Growth opportunities
c. Profi tability
d. Price tolerance of the customer
5.
a. to achieve tangible (measurable) and long-term success
b. so that the service manager and his team can focus on common work tasks, in order to facilitate the work
6.
The service quality received by the customer results from the quality of work and care
7.
a. Determine the current status
b. Analyse the actual state
c. Analyse the causes
d. Derive and plan the measures
e. Implement the measures
8.
a. Determine the current status
b. Analyse the actual state
c. Derive and plan the measures
9.
CSS = Customer Satisfaction Survey. The CSS is the study of measuring customer satisfaction at the level of
the Škoda car dealerships and repair shops, which is performed separately for sales and service.
10.
Only during the last workshop visit of the customer.
11.
a. Comparison with benchmarks: Comparison of the company-specifi c values with the national average.
b. Comparison over time: Comparison of the current company values with the values of the same company
during a previous period
12.
a. Questions on satisfaction (with fi ve response categories)
b. Questions on fulfi llment (yes/no)
13.
In order to calculate a sliding mean value, all interviews of the current month and a certain number of the
previous months are summarised for the evaluation. (e.g., quarter, full calendar year)
14.
Forwarding the necessary customer information to all service contracts, complete, accurate, and at least once
a week to CDB (on-line data transfer from DMS), if necessary import data into the contact website.
15.
a. Customer loyalty index
b. Analysis of strengths and weaknesses
c. Quality characteristics
16.
Weaknesses (from the analysis of strengths and weaknesses), where other companies are signifi cantly better.
55GB
Page 56

17.
a. simply looking at the causes, yet no development of any measures
b. include all employees involved.
18.
Fishbone diagram (Ishikawa diagram)
19.
a. Defi ne a problem
b. Defi ne the category of the causes
c. Determine the main causes
d. Determine the secondary causes
e. Review and discuss the diagram
20.
Which measures should be taken? Which measures should/can be implemented?
21.
What exactly should be done? How should it be done? Who should do it and until when?
22.
a. Focus on the guidance given during the procedure by presenting the aims, the measures set out in writing
and clarifying outstanding questions with the team
b. Take concerns and opposition seriously and break them down with understanding and provide information
c. Ensure regular exchange of experience with the team.
d. Monitor the development of measures proposed and intervene in case of diffi culties
e. Regular observation of the CSS results
23.
About 3 to 6 months after the measure has been implemented.
24.
Only employees who do not oppose the proposed changes must participate actively in the implementation of
the measures, thus contributing to their success.
GB56
Page 57

Notes
57GB
Page 58

Notes
GB58
Page 59

Notes
Page 60

Overview of the previously edited self-study programmes
87
No. Designation
1 Mono-Motronic
2 Central locking
3 Vehicle alarm
4 Working with wiring plans
5 ŠKODA FELICIA
6 Safety of the ŠKODA vehicles
7 Principles of ABS - not published
8 ABS - FELICIA
9 Immobilizer with transponder
10 Air conditioning in the vehicle
11 Air conditioning FELICIA
12 1.6 engine - MPI 1AV
13 Four-cylinder diesel engine
14 Power-assisted steering
15 ŠKODA OCTAVIA
16 1.9 ltr. TDI diesel engine
17 ŠKODA OCTAVIA Convenience electronics system
18 ŠKODA OCTAVIA mech. gearbox 02K, 02J
19 1.6 ltr. and 1.8 ltr. petrol engines
20 Automatic gearbox - fundamentals
21 Automatic gearbox 01M
22 1.9 ltr./50 kW SDI, 1.9 ltr./81 kW TDI diesel engines
23 1.8 ltr./110 kW and 1.8 ltr./92 kW petrol engines
24 OCTAVIA, CAN BUS databus
25 OCTAVIA - CLIMATRONIC
26 OCTAVIA - Vehicle safety
27 OCTAVIA - 1.4 ltr./44 kW engine and gearbox 002
28 OCTAVIA - ESP - fundamentals, design, function
29 OCTAVIA 4 x 4 - all-wheel drive
30 2.0 ltr. 85 kW and 88 kW petrol engines
31 Radio navigation system - Structure and function
32 ŠKODA FABIA - technical information
33 ŠKODA FABIA - electrical systems
34 ŠKODA FABIA - electro-hydraulic power-assisted steering
35 1.4 ltr. - 16 V 55/74 kW petrol engines
36 ŠKODA FABIA - 1.9 ltr. TDI Unit injection
37 Mechanical gearbox 02T and 002
38 ŠkodaOctavia; model 2001
39 Euro-On-Board-Diagnosis
40 Automatic gearbox 001
41 Six-speed gearbox 02M
42 ŠkodaFabia - ESP
43 Exhaust emissions
44 Extended service intervals
45 Three-cylinder petrol engines 1.2 ltr.
46 ŠkodaSuperb; Vehicle presentation part l
47 ŠkodaSuperb; Vehicle presentation par t ll
48 ŠkodaSuperb; 2.8-ltr./142 kW V6 petrol engine
49 ŠkodaSuperb; 2.5-ltr./114 kW TDI V6 diesel engine
50 ŠkodaSuperb; automatic gearbox 01V
No. Designation
51 2.0 ltr./85 kW petrol engine with balancing shafts and
2-stage suction line
52 ŠkodaFabia; 1.4 ltr. TDI engine with unit injection system
53 ŠkodaOctavia; Vehicle presentation
54 ŠkodaOctavia; Electrical components
55 FSI petrol engines; 2.0 ltr./110 kW and 1.6 ltr./85 kW
56 Automatic gearbox DSG-02E
57 Diesel engine; 2.0 ltr./103 kW TDI with pump-nozzle units,
2.0 ltr./100 kW TDI with pump-nozzle units
58 ŠkodaOctavia, Chassis and electromechanical
power-assisted steering
59 ŠkodaOctavia RS, 2.0 ltr./147 kW FSI turbo engine
60 2.0 ltr./103 kW 2V TDI diesel engine; particle fi lter with
additive
61 Radio navigation systemes in Škoda vehicles
62 ŠkodaRoomster; Vehicle presentation part l
63 ŠkodaRoomster; Vehicle presentation part ll
64 ŠkodaFabia II; Vehicle presentation
65 ŠkodaSuperb II; Vehicle presentation part l
66 ŠkodaSuperb II; Vehicle presentation par t ll
67 2.0 ltr./125 kW TDI diesel engine with Common Rail
injection system
68 1.4 ltr./92 kW TSI petrol engine with turbocharger
69 3.6 ltr./191 kW FSI petrol engine
70 All-wheel drive with Haldex coupling of the lV. generation
71 ŠkodaYeti; Vehicle presentation part l
72 ŠkodaYeti; Vehicle presentation part ll
73 LPG system in Škoda vehicles
74 1.2 ltr./7 7 kW TSI petrol engine with turbocharger
75 7-speed dual-clutch automatic gearbox 0AM
76 Green-line vehicles
77 Geometry
78 Passive safety
79 Auxiliary heating
80 2.0 ltr., 1.6 ltr., 1.2 ltr. diesel engines with Common Rail
injection system
81 Bluetooth in Škoda vehicles
82 Vehicle sensor - drive mechanism
83 1.4 ltr./132 kW TSI petrol engine with dual-charging
(compressor, turbocharger)
84 ŠkodaFabia II RS; Vehicle presentation
85 KESSY system in Škoda vehicles
86 START-STOP system in Škoda vehicles
87 Immobilisers in Škoda vehicles
88 Brake and stabilisation systems
89 Sender in Škoda vehicles
90 Increase customer satisfaction with the CSS study
The paper was made out of chlorine-free bleached cellulose.
GB
All rights and technical modifi cations reserved.
S00. 2002.90. 20 Technical s tatus 06/ 2011
© ŠKODA AUTO a. s.
https://portal.skoda-auto.com
ŠKODA Service
®
90
 Loading...