

Page 1

1
SM01
Standard Definition Video
Encoder
and
Pattern Generator
User Manual
Revision 0.5
27th February 2015
Page 2

2
Contents
Contents ........................................................................................................ 2
Tables ........................................................................................................... 3
Figures .......................................................................................................... 3
1. Introduction ............................................................................................... 5
2. Connecting up the SM01 .......................................................................... 7
3. Quick Start Guide .................................................................................... 10
Switch On and Control ............................................................................ 10
Menu control ........................................................................................... 12
4. SM01 Patterns ........................................................................................ 19
75% Colour bars ..................................................................................... 19
100% Colour bars ................................................................................... 20
SMPTE Colour bars (NTSC only) ........................................................... 21
75% Bars + Red (PAL only).................................................................... 23
Ramp ...................................................................................................... 23
10-step staircase (960H only) ................................................................. 24
5-step staircase ...................................................................................... 25
CCIR330 (PAL only) ............................................................................... 25
N7CMPF (NTC-7 Composite, NTSC only) ............................................. 26
CCIR17 (PAL only) ................................................................................. 27
2T20TPB (960H only) ............................................................................. 28
Black ....................................................................................................... 28
White ....................................................................................................... 28
Pedestal (525 line), 50% F/F (625 line) .................................................. 28
Bounce .................................................................................................... 29
Sweep ..................................................................................................... 29
FCCMB (NTSC only) .............................................................................. 30
CCIR18 (PAL only) ................................................................................. 30
Multi (960H only)..................................................................................... 31
N7CMBF (NTC-7 Combination – NTSC only) ........................................ 32
CCIR331 (PAL only) ............................................................................... 32
Gamut ..................................................................................................... 33
Pathological (NTSC/PAL only) ............................................................... 34
Bowtie (960H only) ................................................................................. 34
Matrix ...................................................................................................... 35
Zone Plate .............................................................................................. 36
H sweep/V sweep/Zone Pl (NTSC1280/PAL1280 only) ........................ 39
H Freq (NTSC1280/PAL1280 only) ........................................................ 40
5. SM01 Noise generator ............................................................................ 41
Appendix A: SM01 specification ................................................................. 42
Page 3

3
Appendix B: Power supply specification ..................................................... 60
Tables
Table 1 CVBS output specification. ...............................................................8
Table 2 Analogue Component output Specifications ....................................9
Table 3 SDI Output Specifications .................................................................9
Table 4 SDI Input specification. .....................................................................9
Table 5 SM01 Patterns. .............................................................................. 15
Table 6 75% colour bars composite output levels. ..................................... 20
Table 7 100% colour bars composite levels. .............................................. 21
Table 8 NTSC/PAL timing specifications. ................................................... 43
Figures
Figure 1 SM01 rear panel. .............................................................................7
Figure 2 SM01 AC-DC converter ...................................................................8
Figure 3 SM01 Front panel. ........................................................................ 10
Figure 4 SM01 Menu structure. .................................................................. 12
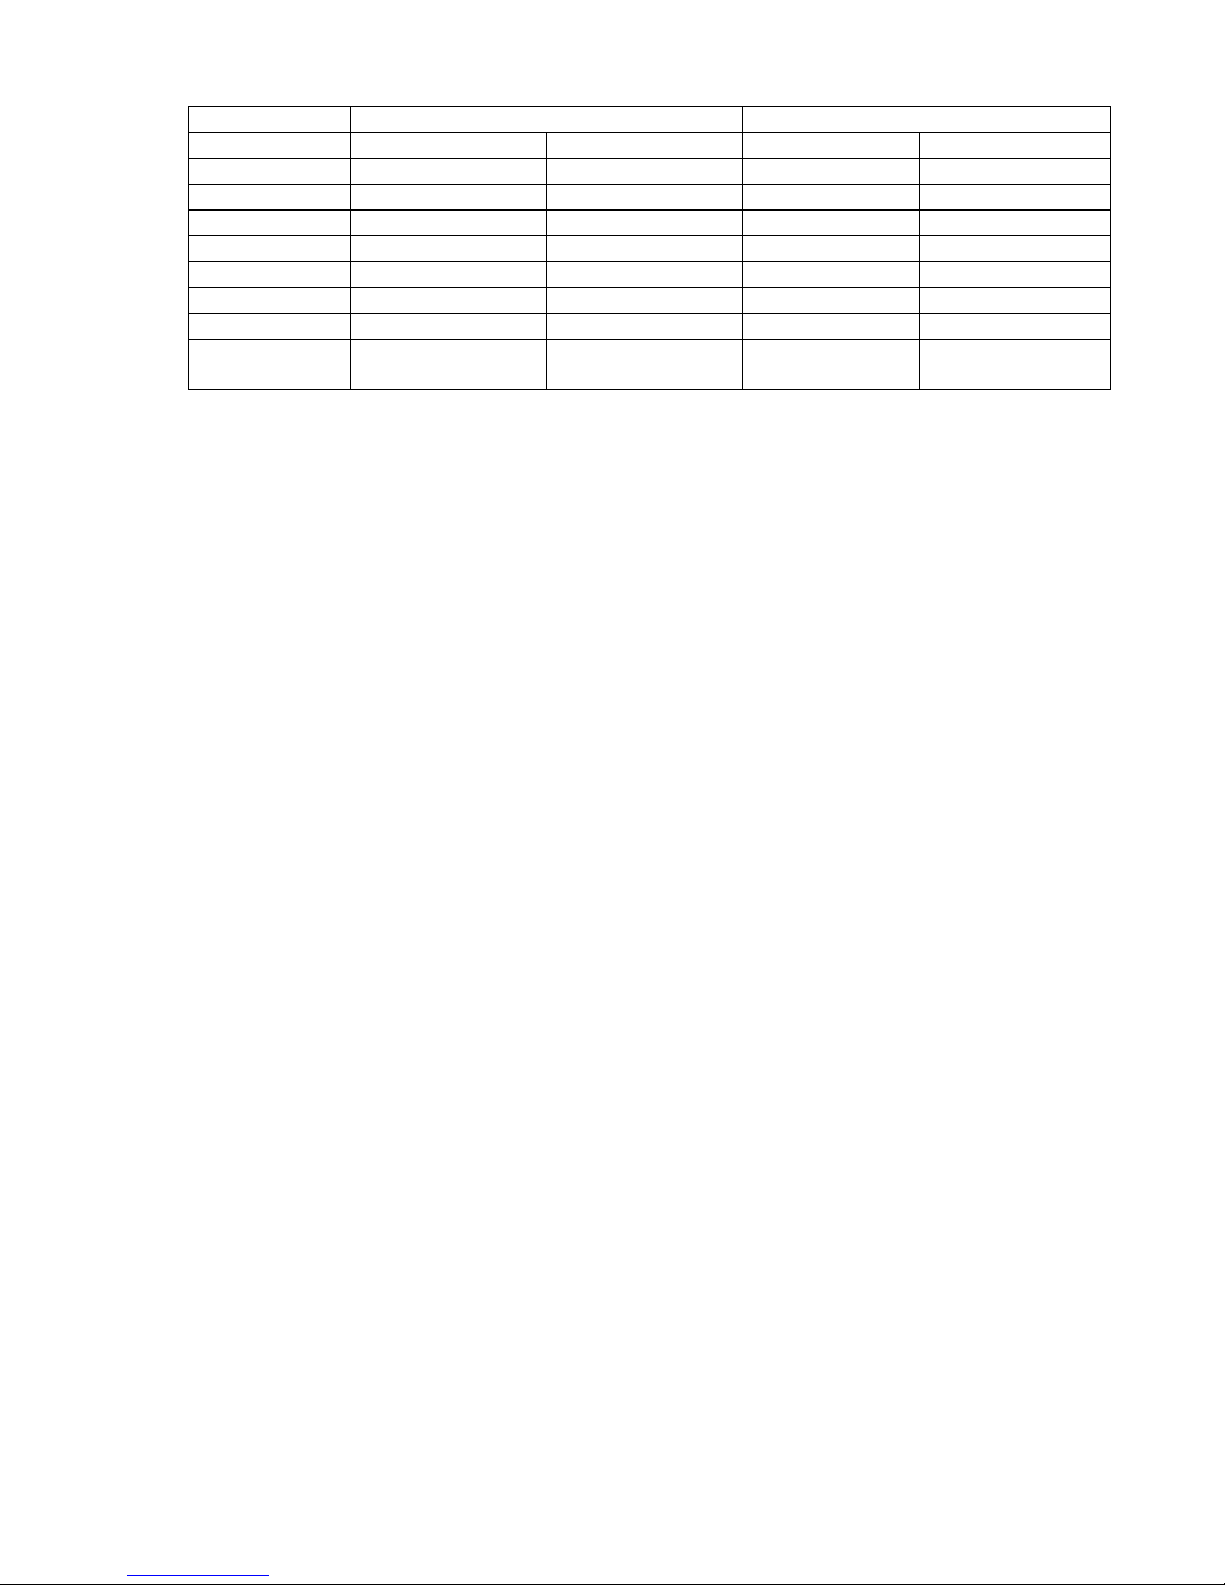
Figure 5 75% Component colour bar waveform. ........................................ 19
Figure 6 100% Colour bar waveform. ......................................................... 20
Figure 7 SMPTE Colour Bar component waveform ................................... 22
Figure 8 SMPTE Reverse colour bars waveform ....................................... 22
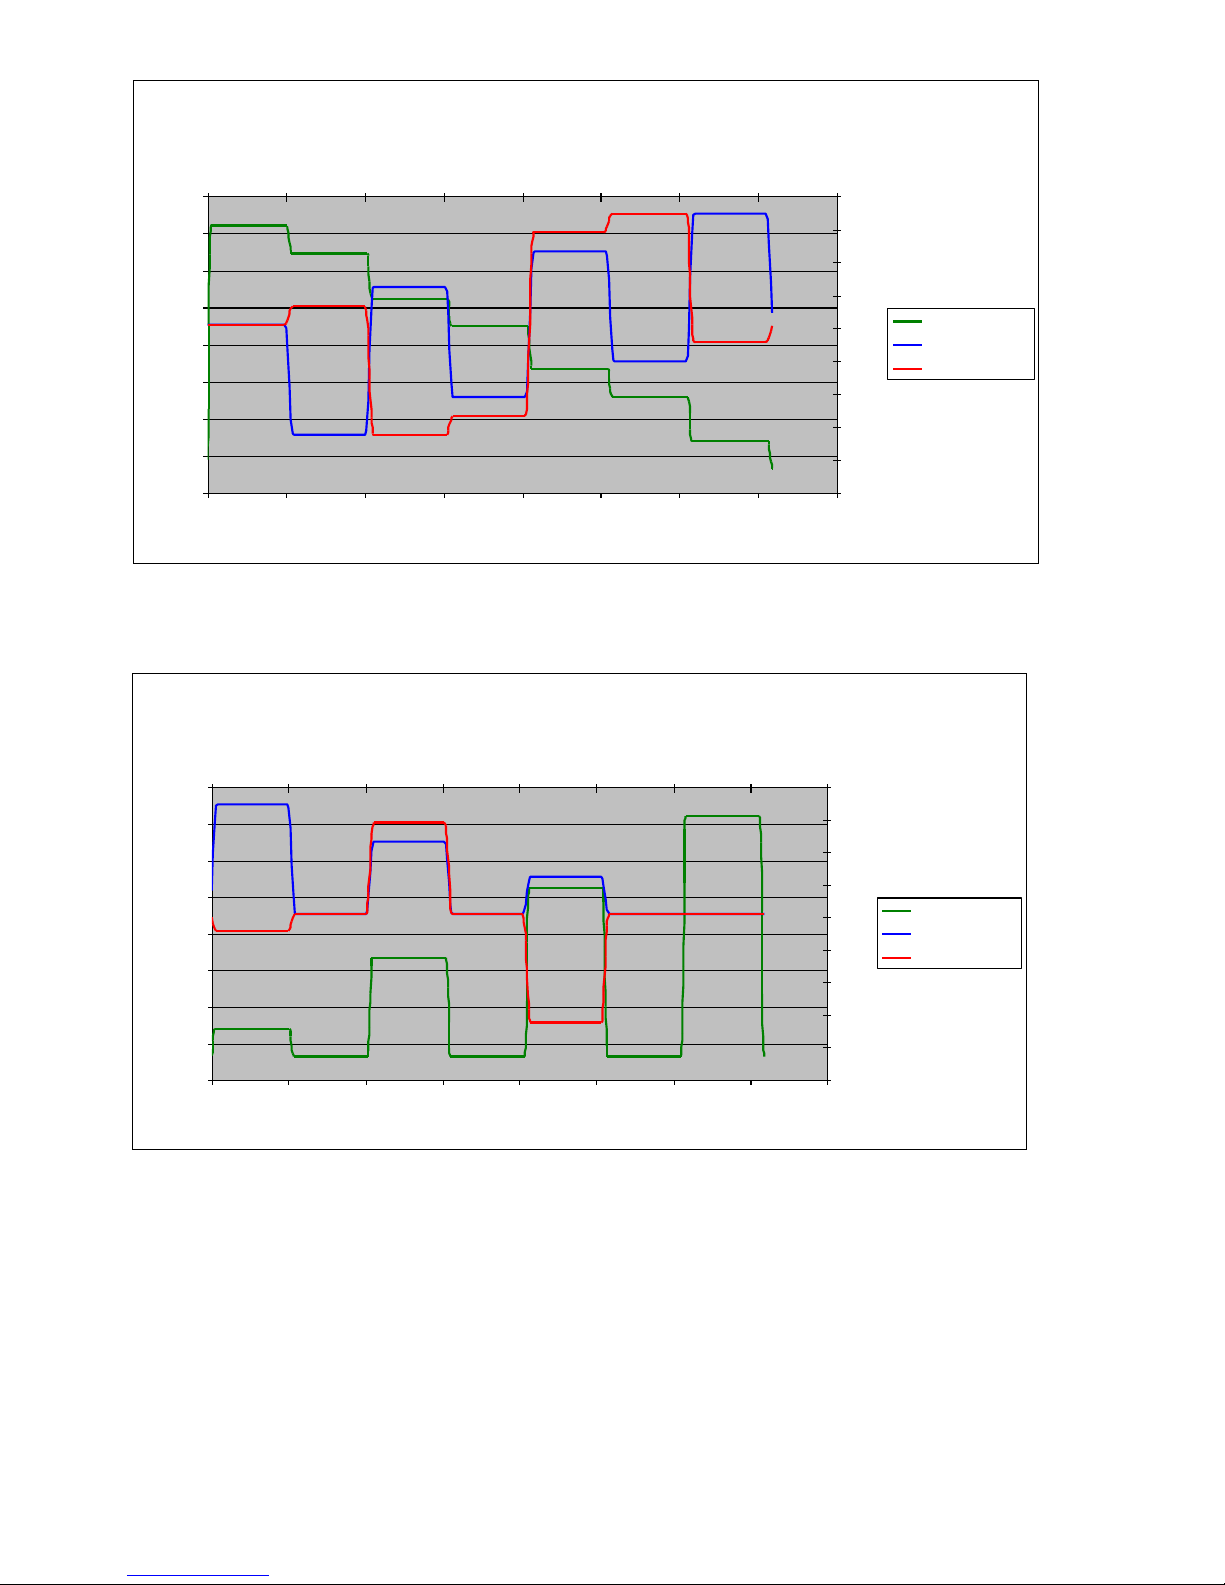
Figure 9 SMPTE Pluge waveform .............................................................. 23
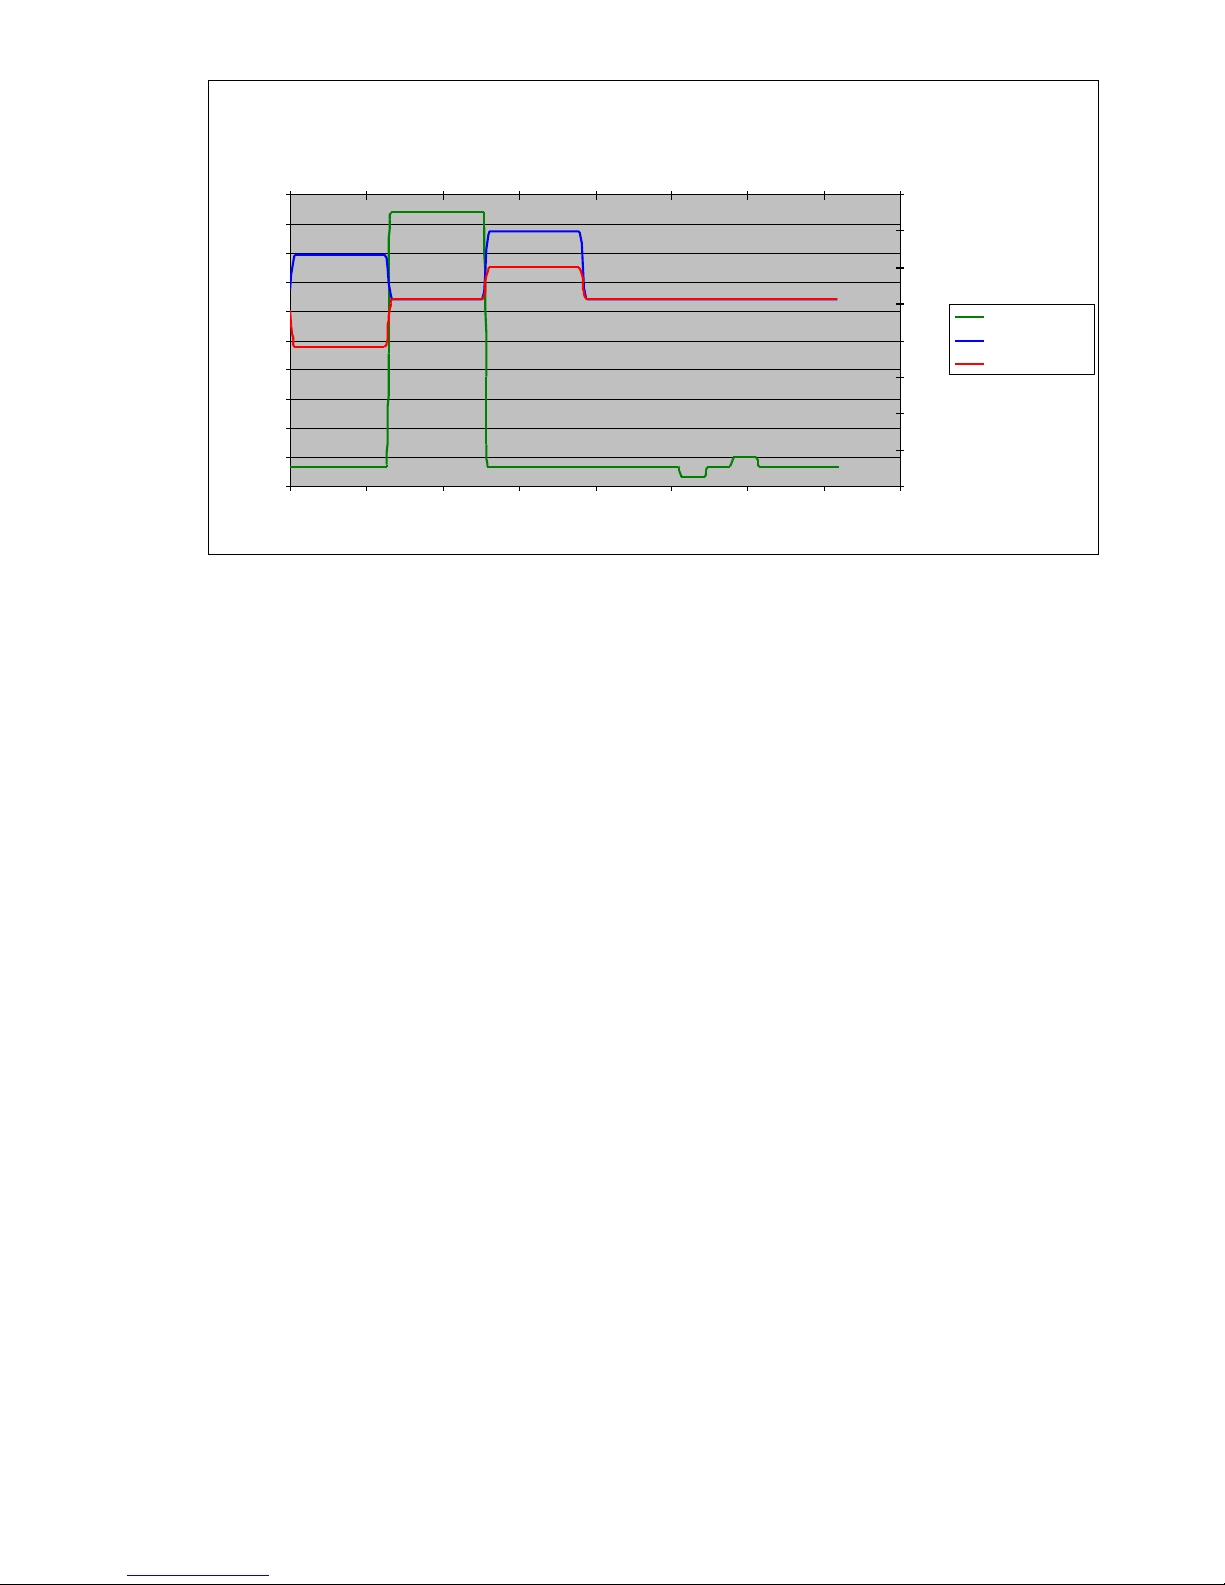
Figure 10 Limit ramp waveform. ................................................................. 24
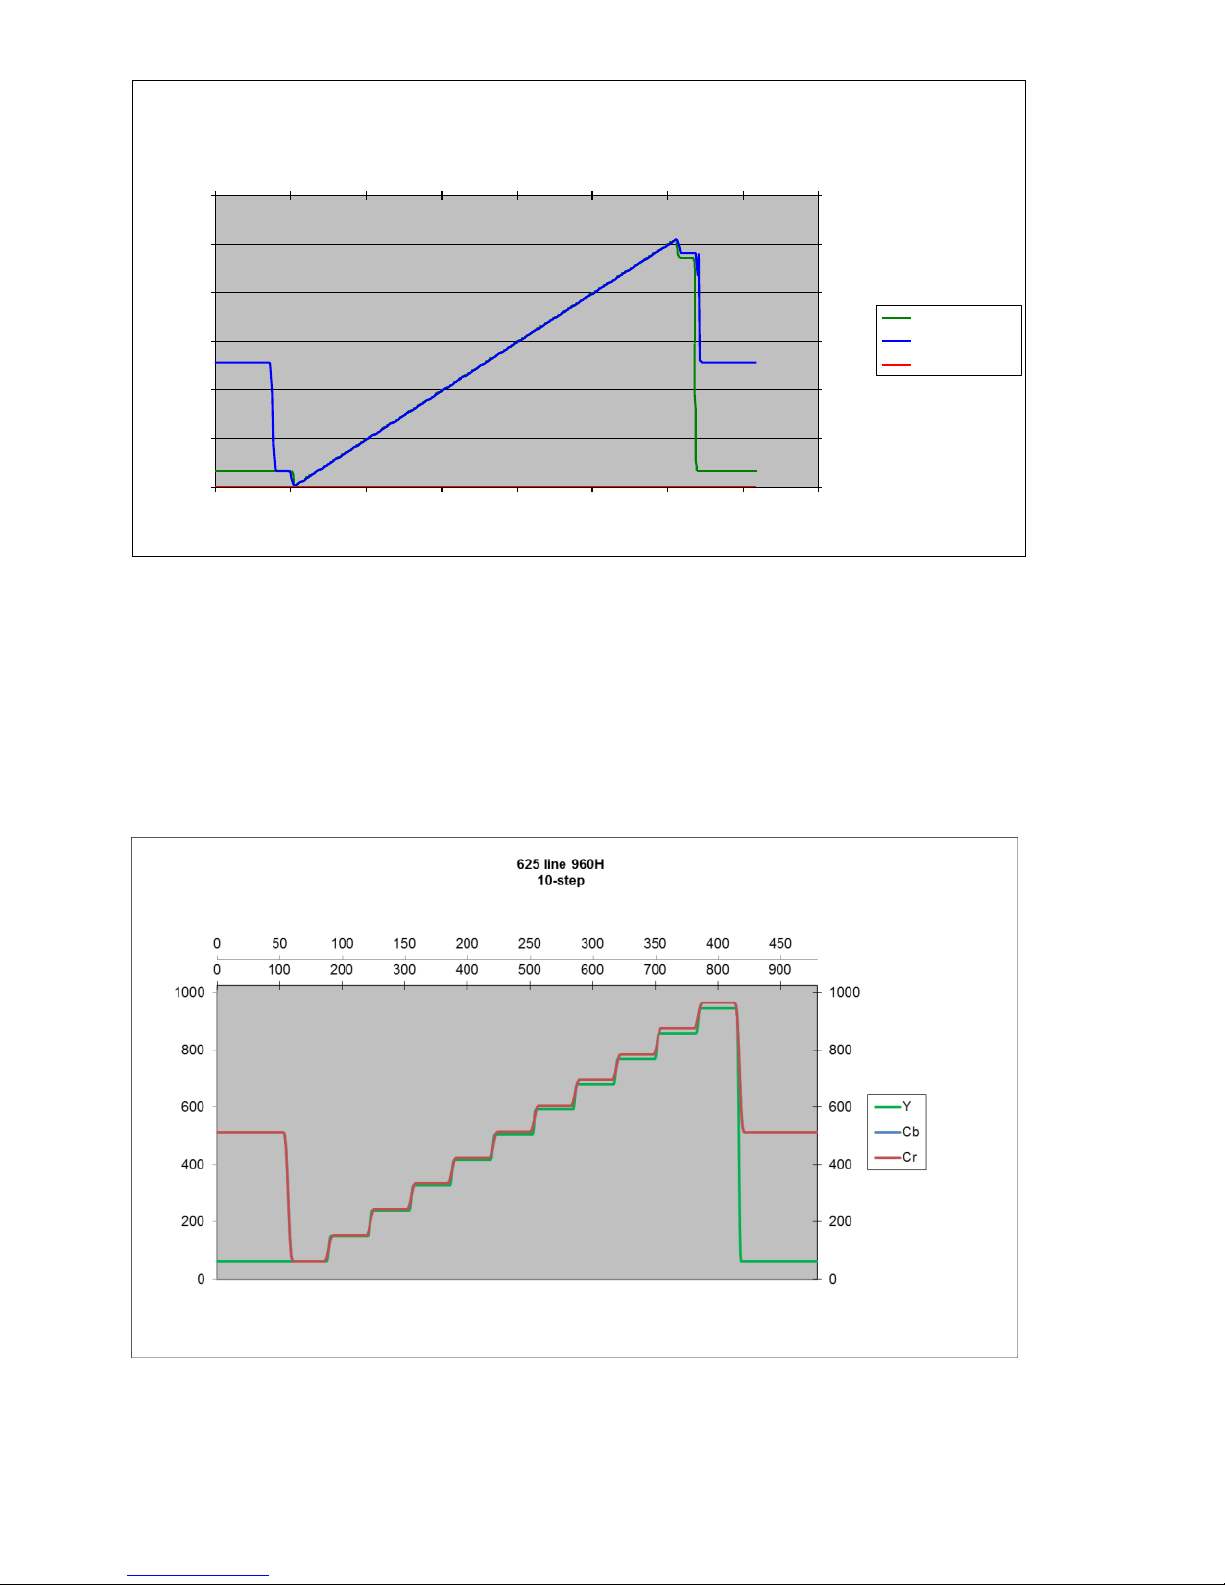
Figure 11 960H 10-step waveform. ............................................................ 24
Figure 12 5-step staircase waveform. ........................................................ 25
Figure 13 CCIR330 waveform. ................................................................... 26
Figure 14 N7CMPF (NTC-7) Component Waveform ................................. 27
Figure 15 CCIR17 Waveform ..................................................................... 28
Figure 16 Sweep Waveform ....................................................................... 29
Figure 17 FCCMB Waveform ..................................................................... 30
Figure 18 CCIR18 Waveform ..................................................................... 31
Figure 19 N7CMBF Component Waveform................................................ 32
Figure 20 CCIR331 Waveform ................................................................... 33
Figure 21 Gamut Waveform ....................................................................... 33
Figure 22 Bowtie waveform. ....................................................................... 34
Figure 23 Bowtie markers waveform. ......................................................... 35
Figure 24 Matrix test signal......................................................................... 36
Figure 25 The circular zone plate. .............................................................. 37
Figure 26 The zone plate horizontal frequency response. ......................... 38
Page 4

4
Figure 27 Left side: The zone plate shows flickering colours at the
subcarrier frequency as the line comb fails on the zone plate image. ........ 39
Figure 28 Hum generator. ........................................................................... 41
Figure 29 PAL horizontal timing (composite output). .................................. 43
Figure 30 PAL vertical timing (composite output). ...................................... 44
Figure 31 NTSC Horizontal timing (composite output). .............................. 45
Figure 32 NTSC Vertical timing (composite output). .................................. 46
Figure 33 NTSC 75% colour bar composite output. ................................... 47
Figure 34 NTSC 75% colour bars vectors .................................................. 48
Figure 35 PAL 75% colour bars (composite output) ................................... 49
Figure 36 PAL 75% colour bars vectors ..................................................... 50
Figure 37 NTSC K_Factor measurement. ................................................. 51
Figure 38 NTSC NTC-7 Luma/Chroma delay/gain measurement .............. 52
Figure 39 NTSC Differential gain/phase measurement. ............................. 53
Figure 40 NTSC noise measurement (Pedestal waveform). ...................... 54
Figure 41 Luma frequency response (CCIR18 test signal). ....................... 55
Figure 42 Chrominance non-linearity (using N7C-Combination test signal).
.................................................................................................................... 56
Figure 43 SDI output 525 line format measurement ................................... 57
Figure 44 SDI output 625 line format measurement ................................... 57
Figure 45 SDI output 625 line eye pattern .................................................. 58
Figure 46 SDI output 625 line jitter measurement ...................................... 59
Figure 47 AC-DC converter specification: Page 1 ...................................... 60
Figure 48 AC-DC converter specification: Page 2 ...................................... 61
Figure 49 AC-DC converter specification: Page 3 ...................................... 62
Page 5

5
1. Introduction
SM01 is a video encoder and pattern generator supporting standard
definition video standards.
As a video pattern generator, SM01 can generate 15 NTSC, 15 PAL and 15
960H line based patterns, a zone plate generator, and a programmable
12MHz maximum horizontal frequency sweep. These are output as
simultaneous SDI (SMPTE-259M – NTSC/PAL only), YPbPr component,
NTSC-M/J/443 or PAL-M/60 (for 525 line standards) or PAL-BG/I or PAL-N
(for 625 line standards) or 960H (NTSC or PAL) or 1280H (NTSC or PAL –
zone plate, vertical and horizontal sweep only) formats.
Patterns available include:
75%/100%/SMPTE/Bars+Red colour bars
Black/White/50% grey flat fields
2T, 20T and Pulse bar
CCIR17/18/330 and 331
FCC Comp and FCC MB
N7C MBF and N7C MPF
Ramp
Multi-burst
Horizontal (up to 12MHz) and Vertical Sweeps
5/10 step linearity
Pathological (SDI test)
Gamut
Bowtie
Circular Zone Plate
In addition programmable amplitude noise may be added to the CVBS
pattern output. Noise can be 50Hz or 60Hz hum and/or white noise.
As a video encoder SM01 accepts 525 or 625 line SMPTE-259M inputs
which it encodes to simultaneous SDI (SMPTE-259M), YPbPr component
and NTSC-M/J/443, PAL-M/PAL-60 (525 line standards) or PAL-BG/I, PALN (for 625 line standards). Again noise may be added to the CVBS output.
Page 6

6
Controls provided include:
CVBS amplitude
CVBS Luma amplitude
CVBS Chroma amplitude
CVBS Burst amplitude
CVBS Sync amplitude
CVBS Black level
NTSC Hue (Chroma phase)
CVBS subcarrier frequency
YPbPr Luma amplitude
YPbPr Chroma amplitude
YPbPr Sync amplitude
YPbPr Black level
SM01 is powered by a universal input power supply and controlled with a
simple and intuitive selection menu.
Page 7
7
2. Connecting up the SM01
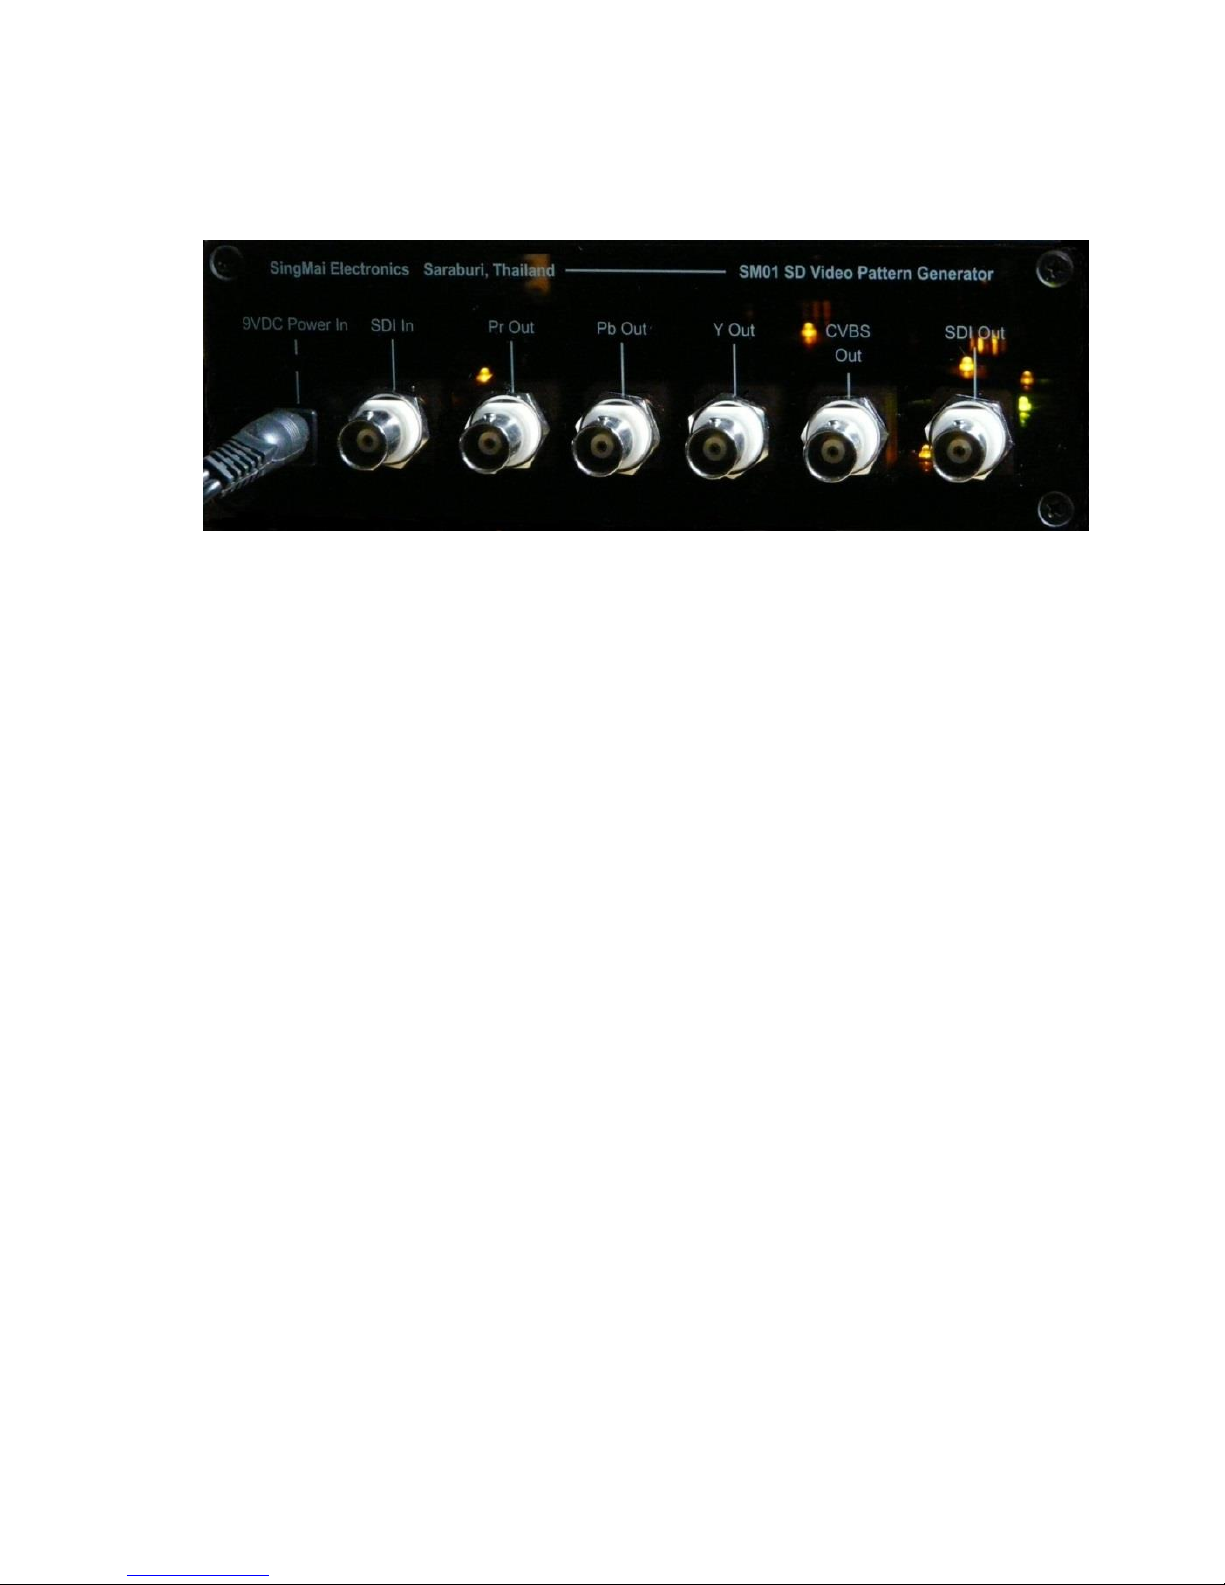
All connections to the SM01 are made via the rear panel: see Figure 1.
Figure 1 SM01 rear panel.
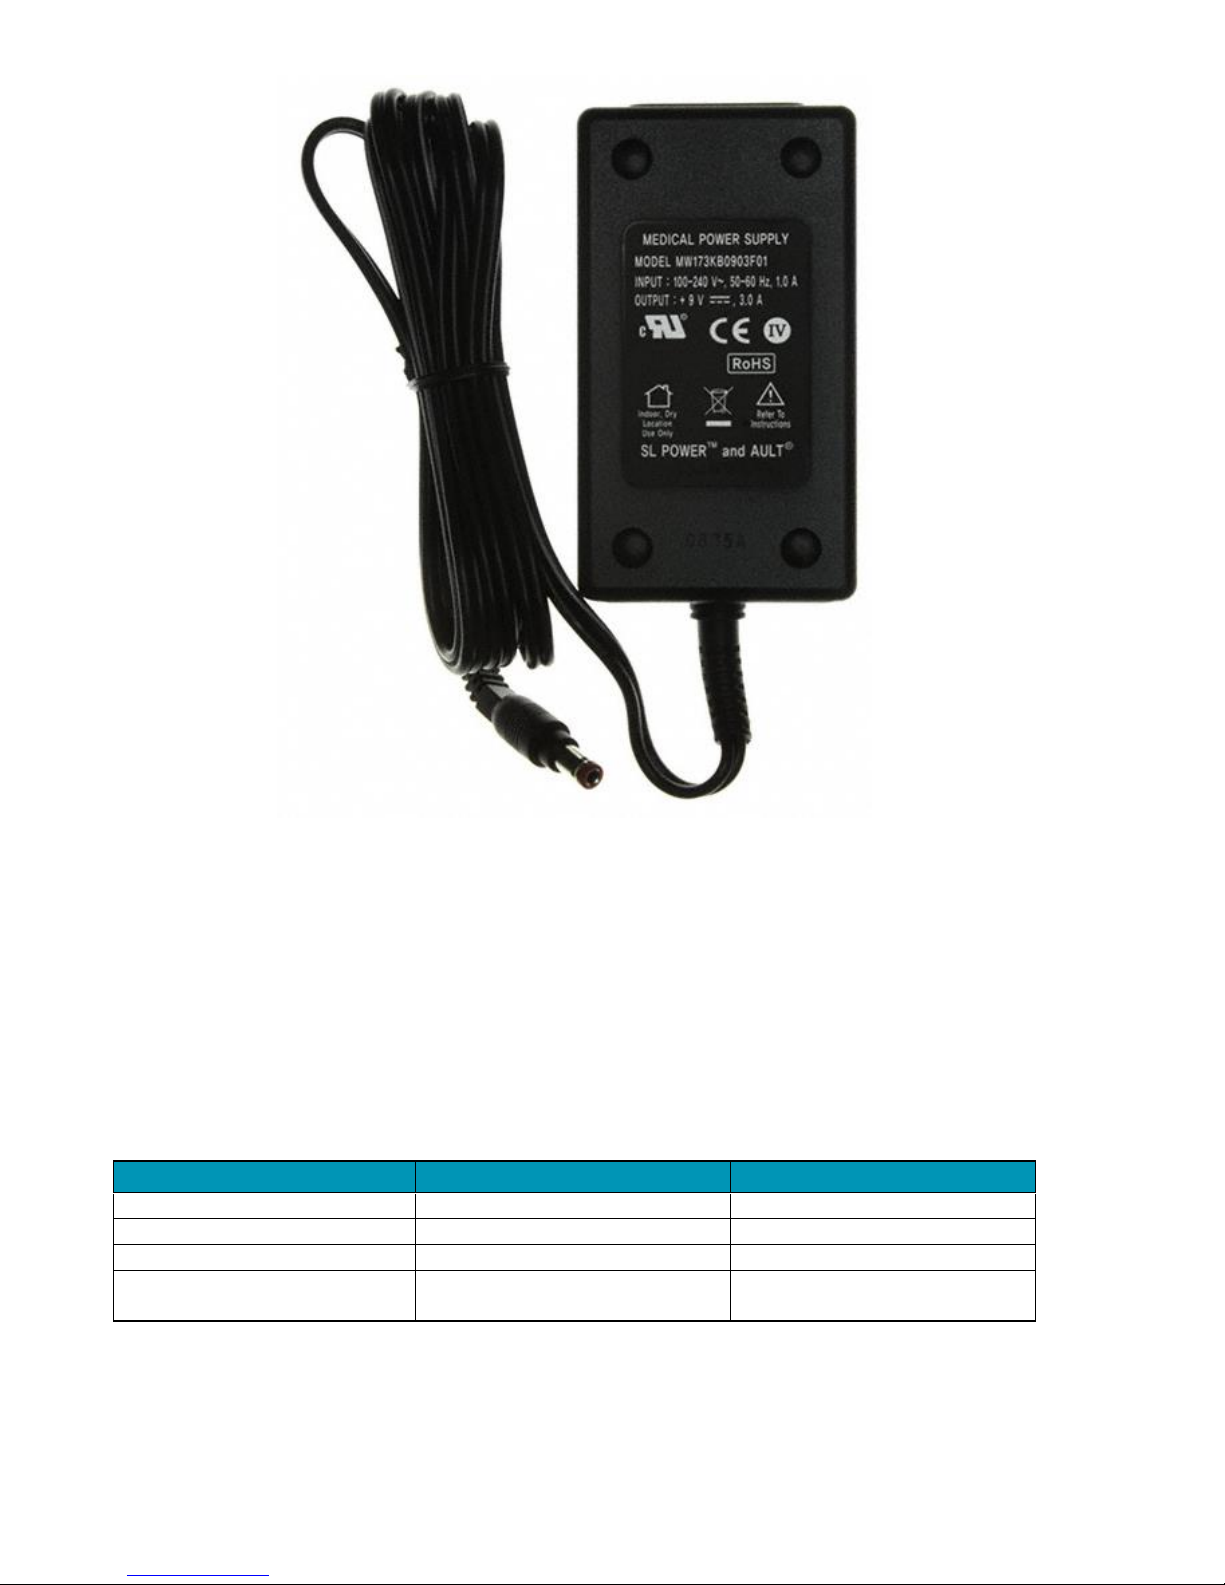
The AC-DC converter connects to the left hand jack. The SM01 input is
protected against reverse polarity. The converter supplied with the SM01 is
a model MW173KB manufactured by SL Power Electronics Corp. and
provides 9VDC at 3A and accepts AC inputs from 100-240VAC. Connect
the supplied power cord to the AC-DC converter and output DC of the
converter to the 9VDC Power In input of the SM01.
Page 8
8
Figure 2 SM01 AC-DC converter
A full specification for the supplied AC-DC converter may be found in
Appendix B.
The SM01 provides both analogue and digital component outputs for
connecting to the equipment under test.
The CVBS (NTSC/PAL) output is connected to the BNC, ‘CVBS Out’. The
specification for the output is shown in Table 1. The composite output
specification is detailed in Appendix A.
Parameter
Specification
Comments
Connector Type
BNC
Output impedance
75Ω
Output return loss
>30dB
0-5MHz
CVBS output level
1.0V pk.pk
Nominal peak Y to sync tip
for 100% colour bars input
Table 1 CVBS output specification.
Page 9
9
The analogue component outputs are connected to the BNCs, ‘Y Out’, ‘Pb
Out’ and ‘Pr Out’. The specification for the outputs is shown in Table 2. The
component output specification is detailed in Appendix A.
Parameter
Specification
Comments
Connector Type
BNC
Output impedance
75Ω
Output return loss
>30dB
0-5MHz
Y output level
1.0V pk.pk
Nominal 100% colour bars
input
Cb/Cr output levels
700mV pk-pk
Nominal 100% colour bars
input
Table 2 Analogue Component output Specifications
The serial digital interface (SDI) output is connected to the ‘SDI Out’ BNC
and its specifications are shown in Table 3.
The SDI output conforms to the SMPTE-259M specification. The SDI output
specification is detailed in Appendix A.
Parameter
Specification
Comments
Connector Type
BNC
Output impedance
75Ω
Fixed termination
Output return loss
>15dB
50Hz-270MHz
Output level
800mV pk-pk ± 10%
Jitter
<0.2UI
Table 3 SDI Output Specifications
The serial digital interface (SDI) input (only used in encoder mode) is
connected to the ‘SDI In’ BNC and its specifications are shown in Table 4.
The SDI input conforms to the SMPTE-259M specification.
Parameter
Specification
Comments
Connector Type
BNC
Input impedance
75Ω
Fixed termination
Input return loss
>15dB
50Hz-270MHz
Input level
800mV pk-pk
Nominal
Table 4 SDI Input specification.
Page 10
10
3. Quick Start Guide
Switch On and Control
Connect the AC-DC converter 9VDC cable into the rear panel power in
socket. Connect the AC supply to a local AC supply between 110-240VAC.
The Standby LED should light. Push the Adjust control and the unit will
switch on and the welcome message will be displayed (SingMai SM01).
To switch off the SM01 push the Adjust control again.
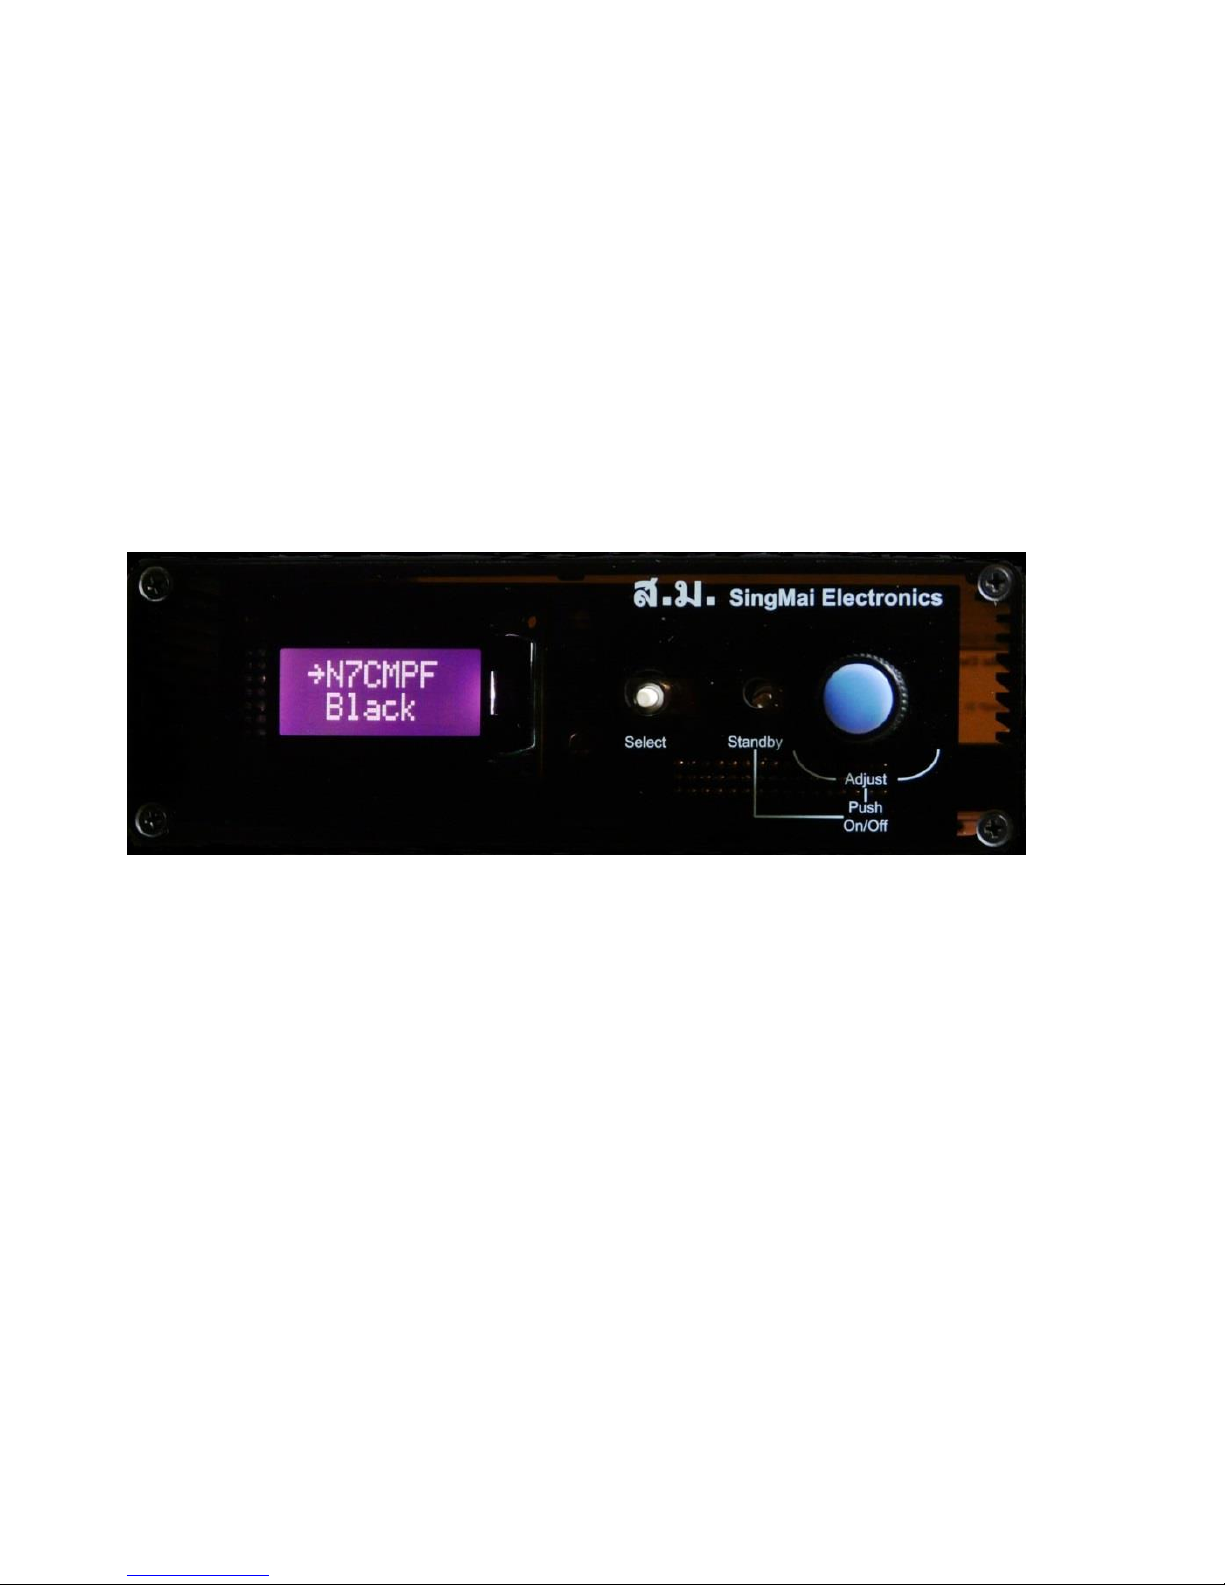
The front panel of the SM01 is shown in Figure 3.
Figure 3 SM01 Front panel.
There are just two controls for the SM01. The right hand control (Adjust)
switches the unit between On and Standby by pushing it whilst also
adjusting the value of parameters by rotating the knob left or right. The
central switch (Select) selects the chosen menu parameter and switches
preset parameters between, for example, on and off.
After the welcome message (‘SingMai, SM01’) is displayed for a few
seconds the LCD display will show the available top level menus. A left
hand arrow indicates which menu is ‘active’. Rotating the Adjust control will
show all the available menus; after the last of the menus an up arrow is
shown.
To select a menu ensure the left arrow is by the side of the required top
level menu and press the Select button. Those menu options will then be
displayed.
Page 11

11
To change a parameter within the lower menu choices choose the required
item by aligning the left arrow with it and press the Select button. The
parameter will either toggle between the available options (e.g. On or Off)
or will show a menu bar where to can select more options via the Adjust
control. Once you have chosen the setting you require press the Select
button to return to the menu choices.
The Adjust control is also used to set the parameter values. Once set the
required value, press the Select button to retain that value and return to the
menu.
To return to the top level menu scroll down the menu choices using the
Adjust control; the last one before the up arrow will show Exit. Select this
by pressing the Select button and you will return to the top level menus.
Page 12
12
Menu control
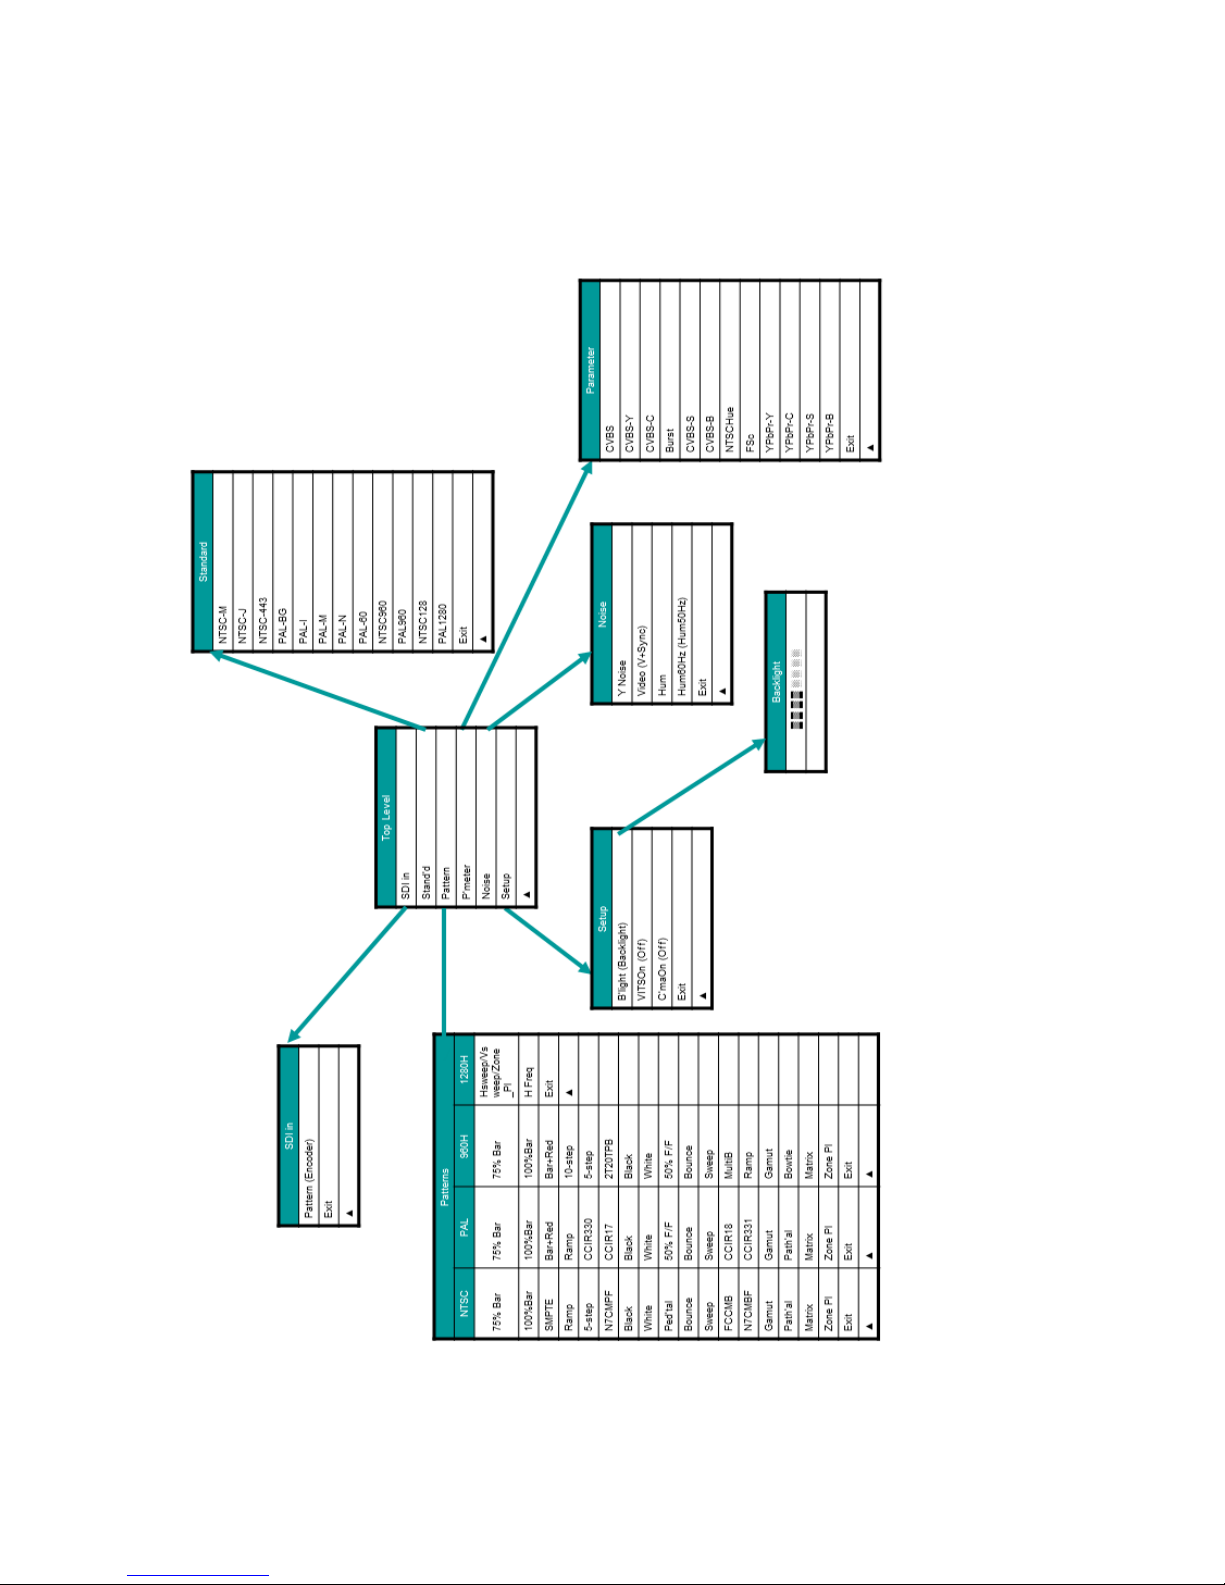
The complete menu structure is shown in Figure 4.
Figure 4 SM01 Menu structure.
Page 13

13
The following is a brief description of the menu functions.
SDI in:
Pattern (Encoder)
Each button press toggles between the internal patterns (Pattern – default
value) and the serial digital (SDI) input (Encoder).
(Note: the SDI input is not operative for the 960H or 1280H standards.)
Exit
Returns to the top level menus.
Stand’d (Standard):
In Encoder mode the SDI input standard must match the output
standard selection. (i.e. if the SDI input is 625 line standard, selecting
NTSC-M/J/443/PAL-60 or PAL-M will result in corrupted outputs).
NTSC-M
Forces NTSC-M output standard for the composite output and 525 line
standard for the YPbPr and SDI outputs. (Default value)
NTSC-J
Forces NTSC-J output standard for the composite output and 525 line
standard for the YPbPr and SDI outputs. (NTSC-J is the Japanese version
of NTSC, which has no setup and different output levels to NTSC-M).
NTSC443
Forces NTSC443 output standard for the composite output and 525 line
standard for the YPbPr and SDI outputs. (NTSC-443 is a playback
‘standard’ which has NTSC timing characteristics with a 4.433MHz PAL
subcarrier frequency).
PAL-BG
Forces PAL-BG output standard for the composite output and 625 line
standard for the YPbPr and SDI outputs.
PAL-I
Forces PAL-M output standard for the composite output and 525 line
standard for the YPbPr and SDI outputs.
Page 14

14
(Note the difference between PAL-BG and PAL-I is only the front porch
value).
PAL-N
Forces PAL-N output standard for the composite output and 625 line
standard for the YPbPr and SDI outputs.
PAL-60
Forces PAL-60 output standard for the composite output and 525 line
standard for the YPbPr and SDI outputs. (PAL-60 has NTSC timing
characteristics but with a PAL 4.43 subcarrier frequency and PAL phase
alternate line switching).
NTSC960
Forces NTSC-M output standard for the composite output and 525 line
standard for the YPbPr outputs. (Note the 960H sampling frequency is
36MHz).
PAL-960
Forces PAL-BG output standard for the composite output and 625 line
standard for the YPbPr outputs. (Note the 960H sampling frequency is
36MHz).
NTSC128
Forces NTSC-M output standard for the composite output and 525 line
standard for the YPbPr outputs. (Note the 1280H sampling frequency is
54MHz).
PAL1280
Forces PAL-BG output standard for the composite output and 625 line
standard for the YPbPr outputs. (Note the 1280H sampling frequency is
54MHz).
Exit
Returns to the top level menus.
The specifications for the standards are shown in Appendix A.
Page 15
15
Pattern:
Selects the output pattern when in ‘Pattern’ mode. (In ‘Encoder’ mode the
pattern menu cannot be selected.)
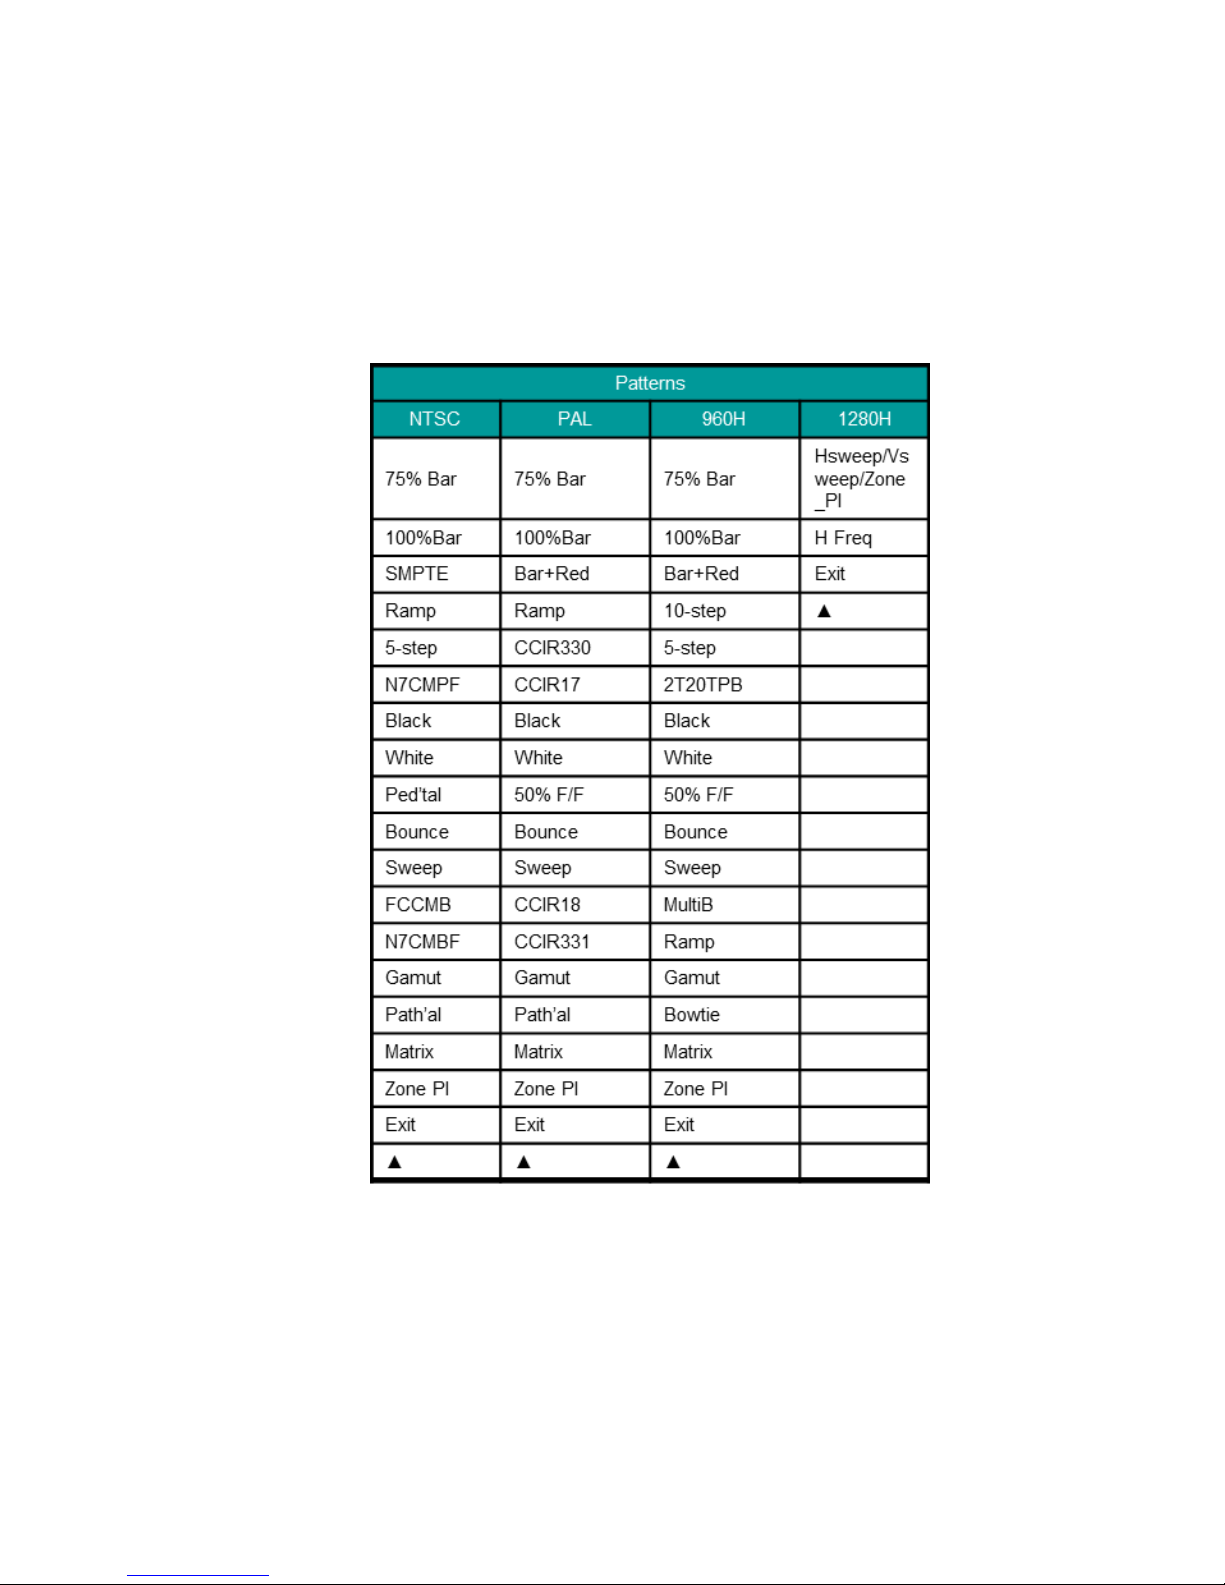
The patterns available depend on the standard selected. Table 5 lists the
patterns available for each standard. A full description of the patterns can
be found in Chapter 4.
Table 5 SM01 Patterns.
Page 16

16
P’meter (Parameter):
Note that some combinations of the parameter settings can give invalid
outputs and may result in clipping of the signal.
CVBS
Adjusts the output amplitude of the composite video output. Default value is
100% (gain of 1). Range is 0-130%.
CVBS-Y
Adjusts the output amplitude of the luma component of the composite video
output. Default value is 100% (gain of 1). Range is 0-130%.
CVBS-C
Adjusts the output amplitude of the chroma component of the composite
video output. Default value is 100% (gain of 1). Range 0-130%.
Burst
Adjusts the output amplitude of the colour burst of the composite video
output. Default value is 100% (gain of 1). Range 0-130%.
CVBS-S
Adjusts the output amplitude of the synchronizing signals of the composite
video output. Default value is 100% (gain of 1). Range is 0-130%.
CVBS-B
Adjusts the output black level of the composite video output. Default value
is pedestal value for NTSC-M or 0mV for other standards). Default value is
0 (offset of 0mV). Range is ±100.
NTSCHue
Adjusts the phase of the chroma component (hue) for composite video
output (NTSC-M/-J/-443 only). Default value is 0deg. Range is ±180deg.
FSc
Adjusts the frequency of the subcarrier for the composite video output.
Default value is 0Hz. Range is ±400Hz.
YPbPr-Y
Adjusts the output amplitude of the luma (Y channel) of the component
YPbPr analogue video output. Default value is 100% (gain of 1). Range is
0-130%.
Page 17

17
YPbPr-C
Adjusts the output amplitude of the chroma (Pb/Pr) of the component
YPbPr analogue video output. Default value is 100% (gain of 1). Range is
0-130%.
YPbPr-S
Adjusts the output amplitude of the synchronizing signals of the component
Y analogue video output. Default value is 100% (gain of 1). Range is 0130%.
YPbPr-B
Adjusts the black level value of the luma component of the component
YPbPr analogue video output. Default value is 100 (offset of 0mV). Range
is ±100.
Exit
Returns to the top level menus.
Noise:
Y Noise
Selects a sub menu which allows control of the amplitude of white noise
injected into the Y output channel of the CVBS analogue output only. The
range of the control is from 0 (off – default value) to 100 (maximum noise).
A fuller description of the noise generator may be found in Chapter 5.
Video (V+Sync)
The injected noise (white noise) is limited to the active video portion of the
analogue output waveform (Video – default value) or the entire waveform
(V+Sync).
Hum
Selects a sub menu which allows control of the amplitude of hum injected
into the CVBS analogue output. The range of the control is from 0 (off –
default value) to 100 (maximum hum). A fuller description of the noise
generator may be found in Chapter 5.
Hum60Hz (Hum50Hz)
Selects frequency of the hum (50Hz or 60Hz).
Exit
Returns to the top level menus.
Page 18

18
Setup:
B’light
Controls the brightness of the front panel LCD backlight. Default value is ‘4’.
VITSOn (VITSOff)
Inserts the CCIR17, CCIR18, CCIR330 and CCIR331 test patterns onto
lines 17, 18, 330 and 331 respectively of the PAL output standard if enabled
(VITSOn) or the N7CMBF and N7CMPF onto line 17 of fields 1 and 2
respectively of the NTSC standard. Default value is VITS on.
C’maOn (C’maOff)
Turns off the chroma component of the CVBS output and sets the Pb/Pr
outputs of the analogue component output to blanking level if set (C’maOff).
Default value is chroma on (C’maOn).
Exit
Returns to the top level menus.
Page 19
19
4. SM01 Patterns
Below is a detailed description of each of the SM01 patterns.
(Note: The NTSC/PAL 1280H standards only provide a set of
programmable frequency sweeps that allow the performance of this
standard’s extended luma bandwidth to be measured. The description of
these patterns are at the end of this chapter.)
75% Colour bars
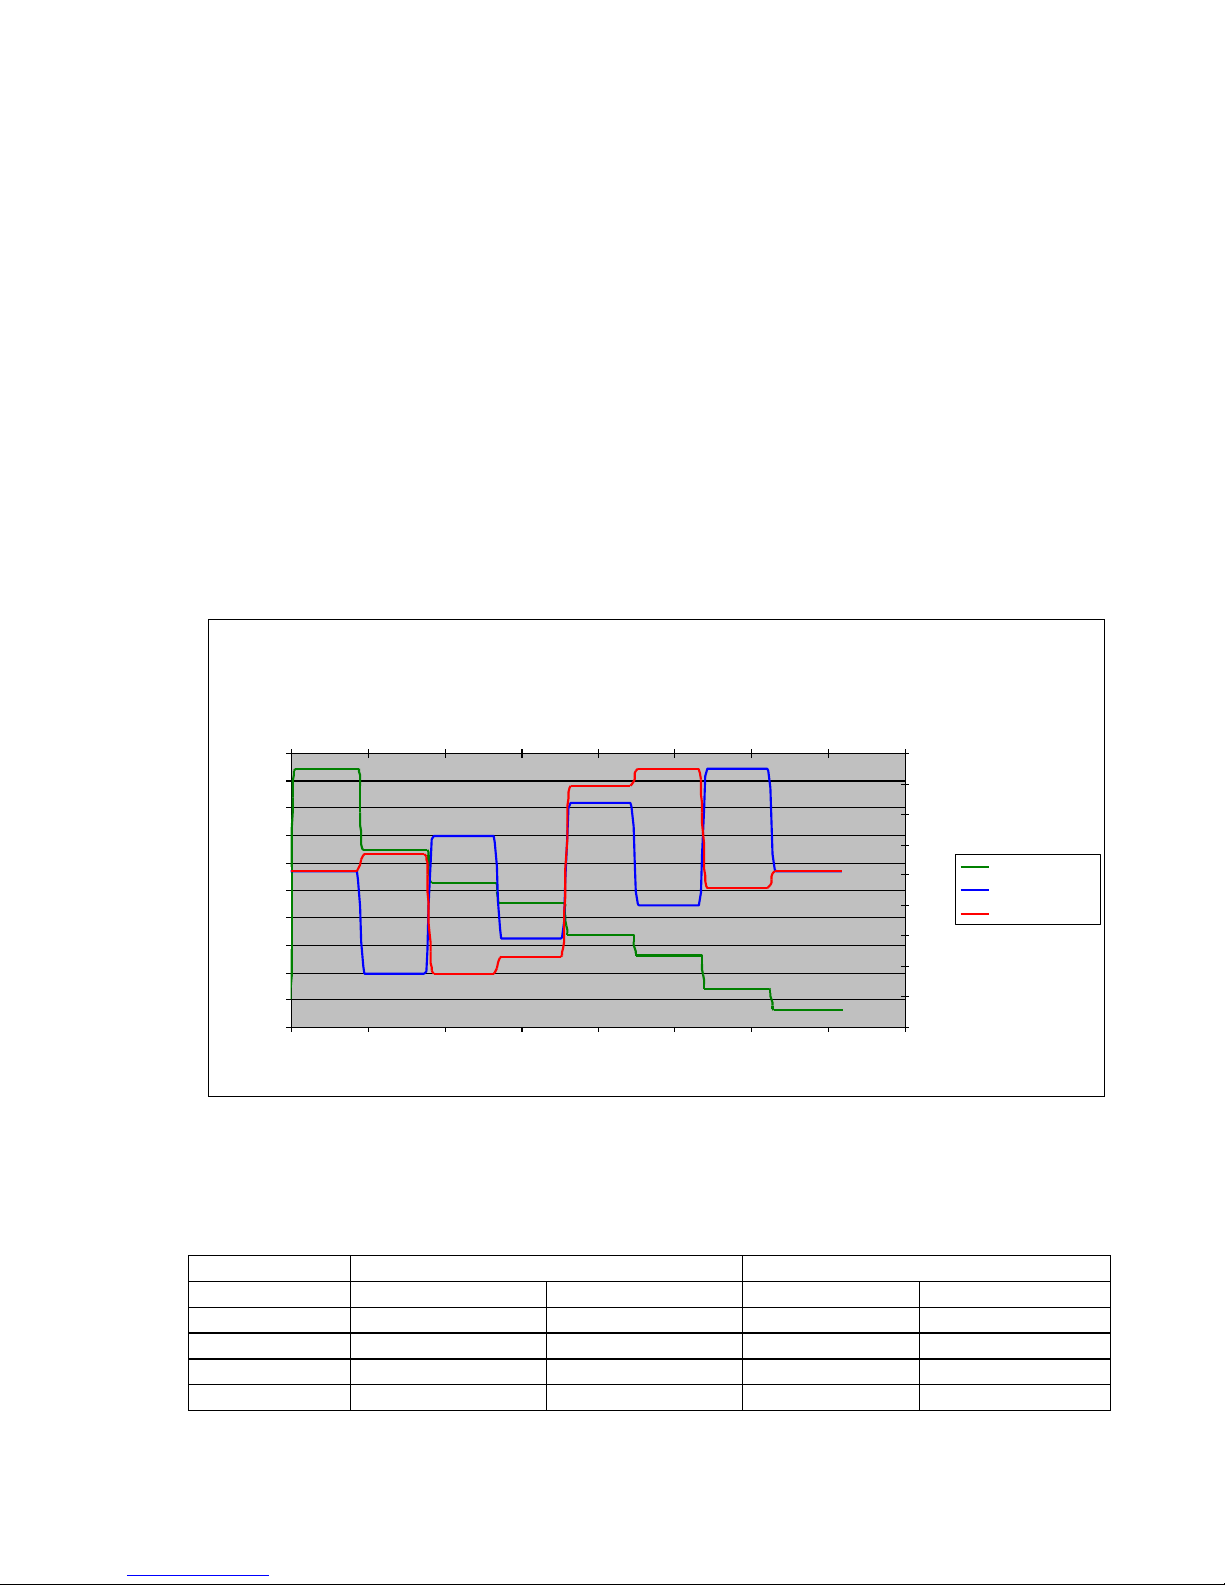
75% colour bars are used for measuring insertion gain, chroma level and
chroma gain and for monitor alignment. The SM01 generates full frame
75% saturated colour bars with a 100% white bar reference and 7.5 IRE
setup (for the NTSC-M/PAL-M composite output only). The colour bar
sequence is white, yellow, cyan, green, magenta, red, blue and black.
Figure 5 75% Component colour bar waveform.
The output levels for the composite bar waveform are shown below.
mV
NTSC-M(J) / PAL-M 100/7.5/75/7.5
PAL / PAL-N 100/0/75/0
Luminance
Chrominance
Luminance
Chrominance
White
714.29(714.29)
0.00(0.00)
700.00
0.00
Yellow
492.62(474.64)
443.34(479.29)
465.15
470.50
Cyan
400.94(375.54)
626.69(677.50)
368.03
663.81
Green
344.45(314.46)
585.18(632.63)
308.18
620.09
525 line
75% Colour Bars
0
100
200
300
400
500
600
700
800
900
1000
0 100 200 300 400 500 600 700 800
Y Pixel No.
10 bit value
0
100
200
300
400
500
600
700
800
900
0 50 100 150 200 250 300 350 400
Cb/Cr Pixel No.
Y Value (Dec)
Cb Value (Dec)
Cr Value (Dec)
Page 20
20
mV
NTSC-M(J) / PAL-M 100/7.5/75/7.5
PAL / PAL-N 100/0/75/0
Luminance
Chrominance
Luminance
Chrominance
Magenta
258.22(221.25)
585.18(632.63)
216.83
620.09
Red
201.73(160.18)
626.69(677.50)
156.98
663.81
Blue
110.06(61.07)
443.34(479.29)
59.85
470.50
Black
(Setup)
53.57(0.00)
0.00(0.00)
0.00
0.00
Table 6 75% colour bars composite output levels.
100% Colour bars
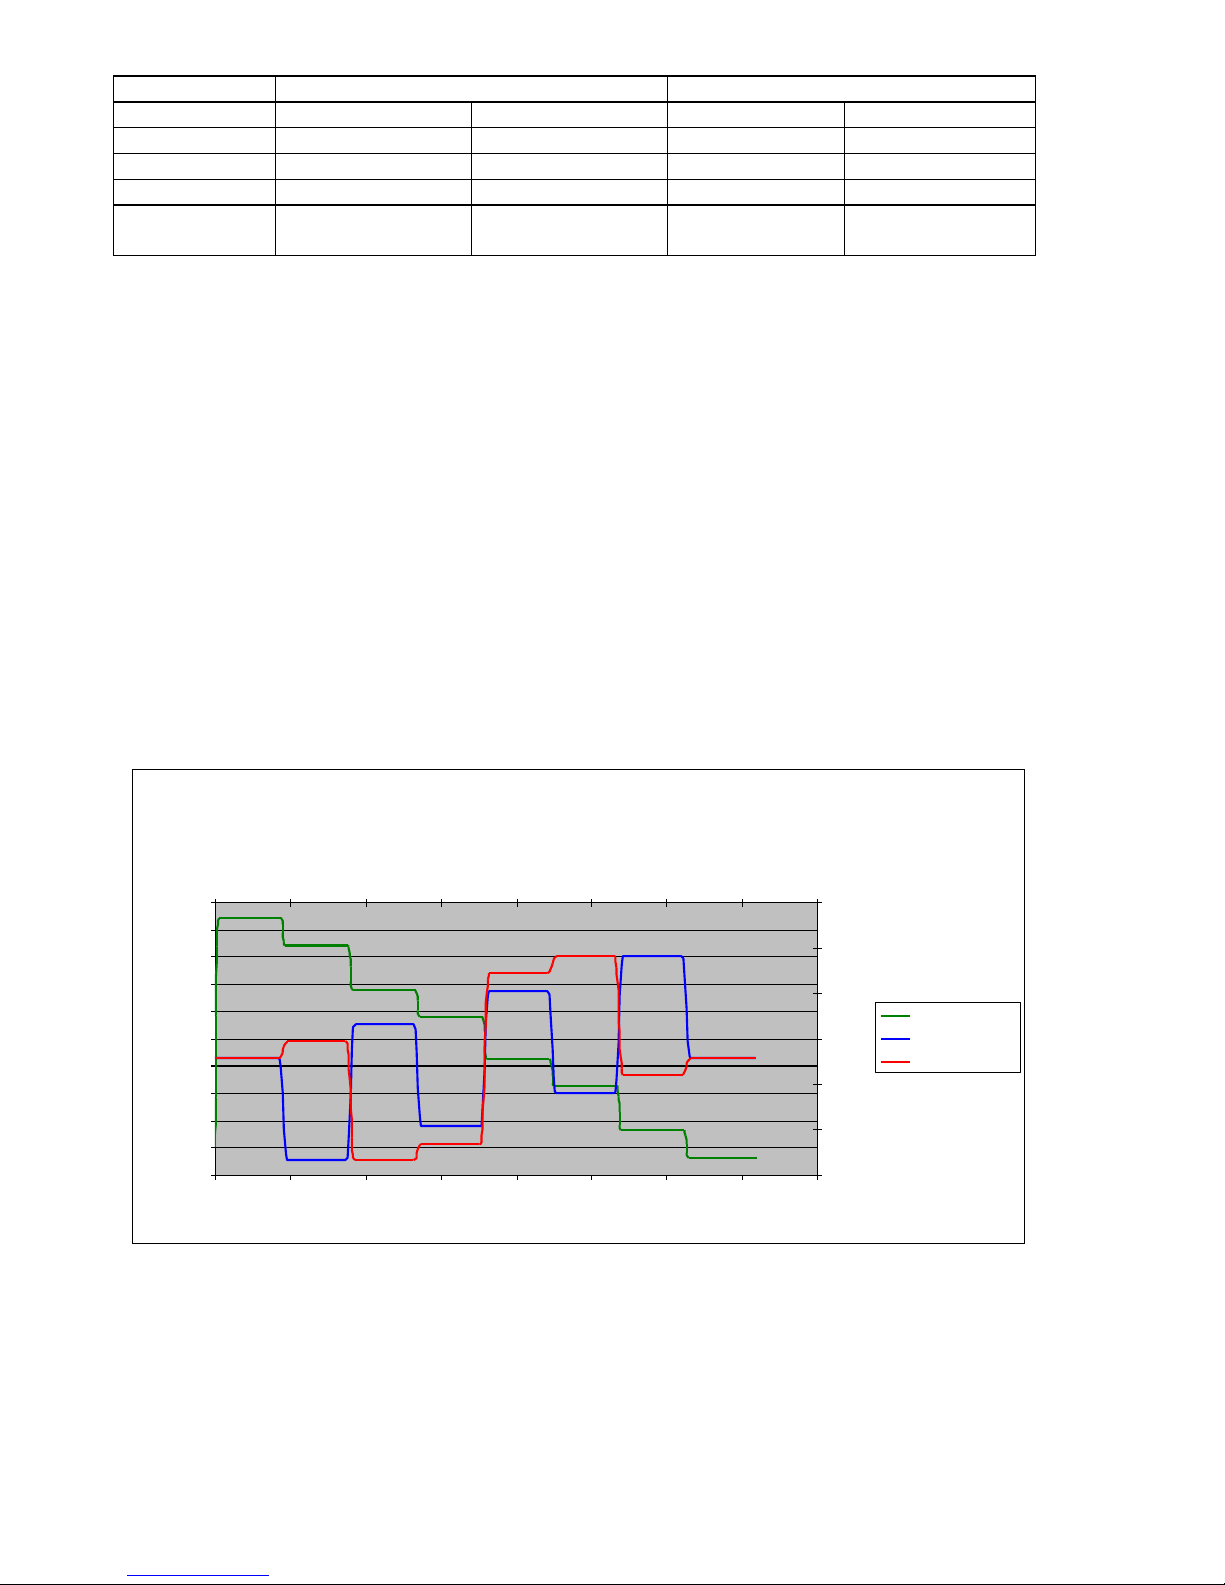
100% colour bars are used for measuring insertion gain, chroma level and
chroma gain and for monitor alignment. The SM01 generates full frame
100% saturated colour bars with a 100% white bar reference and 7.5 IRE
setup (for the composite output only). The colour bar sequence is white,
yellow, cyan, green, magenta, red, blue and black.
Note that 100% NTSC colour bars will cause clipping in the transmitter and
they are therefore only used within a studio ‘closed system’.
Figure 6 100% Colour bar waveform.
The output levels for the composite bar waveform are shown below.
525 line 100% Colour bars
0
100
200
300
400
500
600
700
800
900
1000
0 100 200 300 400 500 600 700 800
Y Pixel No.
10 bit value
0
200
400
600
800
1000
1200
0 50 100 150 200 250 300 350 400
Cb/Cr Pixel No.
Y Value (Dec)
Cb Value (Dec)
Cr Value (Dec)
Page 21
21
mV
NTSC-M(J) / PAL-M 100/7.5/100/7.5
PAL / PAL-N 100/0/100/0
Luminance
Chrominance
Luminance
Chrominance
White
714.29(714.29)
0.00(0.00)
700.00
0.00
Yellow
638.96(632.86)
591.12(639.05)
620.20
627.33
Cyan
516.73(500.71)
835.58(903.33)
490.70
885.08
Green
441.41(419.28)
780.24(843.50)
410.90
826.79
Magenta
326.44(295.00)
780.24(843.50)
289.10
826.79
Red
251.13(213.57)
835.58(903.33)
209.30
885.08
Blue
128.89(81.43)
591.12(639.05)
79.80
627.33
Black
(Setup)
53.57(0.00)
0.00(0.00)
0.00
0.00
Table 7 100% colour bars composite levels.
SMPTE Colour bars (NTSC only)
67% of the SMPTE colour bar waveform comprises 75% colour bars; white,
yellow, cyan, green, magenta, red and blue. Below this and comprising 8%
of the frame, is a sequence of blue, black, magenta, black, cyan, black,
white bars. The function of these bars is to set monitor chroma gain and
phase – the red and green monitor outputs are switched off and the monitor
hue (chroma phase) is adjusted to equalize the cyan/magneta and
magenta/cyan vertical transitions. The chroma saturation is then used to
equalize the transition between white/blue vertical transition.
The bottom 25% of the SMPTE pattern is, from left to right, -I, white, Q,
black and pluge.
The pluge (±4 IRE bars) is used to set up the monitor black level; the whiter
than black bar should be visible, the blacker than black bar should not. The
–I and Q elements of the SMPTE pattern are longer used.
Page 22
22
Figure 7 SMPTE Colour Bar component waveform
Figure 8 SMPTE Reverse colour bars waveform
525 Line SMPTE Colour Bars
0
100
200
300
400
500
600
700
800
0 100 200 300 400 500 600 700 800
Y Pixel No.
10 bit value
0
100
200
300
400
500
600
700
800
900
0 50 100 150 200 250 300 350 400
Cb/Cr Pixel No.
Y Value (Dec)
Cb Value (Dec)
Cr Value (Dec)
525 Line Reverse Colour Bars
0
100
200
300
400
500
600
700
800
0 100 200 300 400 500 600 700 800
Y Pixel No.
10 bit value
0
100
200
300
400
500
600
700
800
900
0 50 100 150 200 250 300 350 400
Cb/Cr Pixel No.
Y Value (Dec)
Cb Value (Dec)
Cr Value (Dec)
Page 23
23
Figure 9 SMPTE Pluge waveform
75% Bars + Red (PAL only)
The top half of this pattern is 75% colour bars, as described above. The
bottom half is a 75% saturation red field.
Ramp
This waveform is a linear modulated ramp and may be used to measure
linearity as well as differential gain and phase.
525 Line SMPTE Pluge
0
100
200
300
400
500
600
700
800
900
1000
0 100 200 300 400 500 600 700 800
Y Pixel No.
10 bit value
0
100
200
300
400
500
600
700
800
0 50 100 150 200 250 300 350 400
Cb/Cr Pixel No.
Y Value (Dec)
Cb Value (Dec)
Cr Value (Dec)
Page 24
24
Figure 10 Limit ramp waveform.
10-step staircase (960H only)
This waveform is ten, equal amplitude, steps of luma and chroma and may
be used to measure linearity as well as differential gain and phase.
Figure 11 960H 10-step waveform.
525 Line Limit ramp
0
200
400
600
800
1000
1200
0 100 200 300 400 500 600 700 800
Y Pixel No.
10 bit value
0
200
400
600
800
1000
1200
0 50 100 150 200 250 300 350 400
Cb/Cr Pixel No.
Y Value (Dec)
Cb Value (Dec)
Cr Value (Dec)
Page 25
25
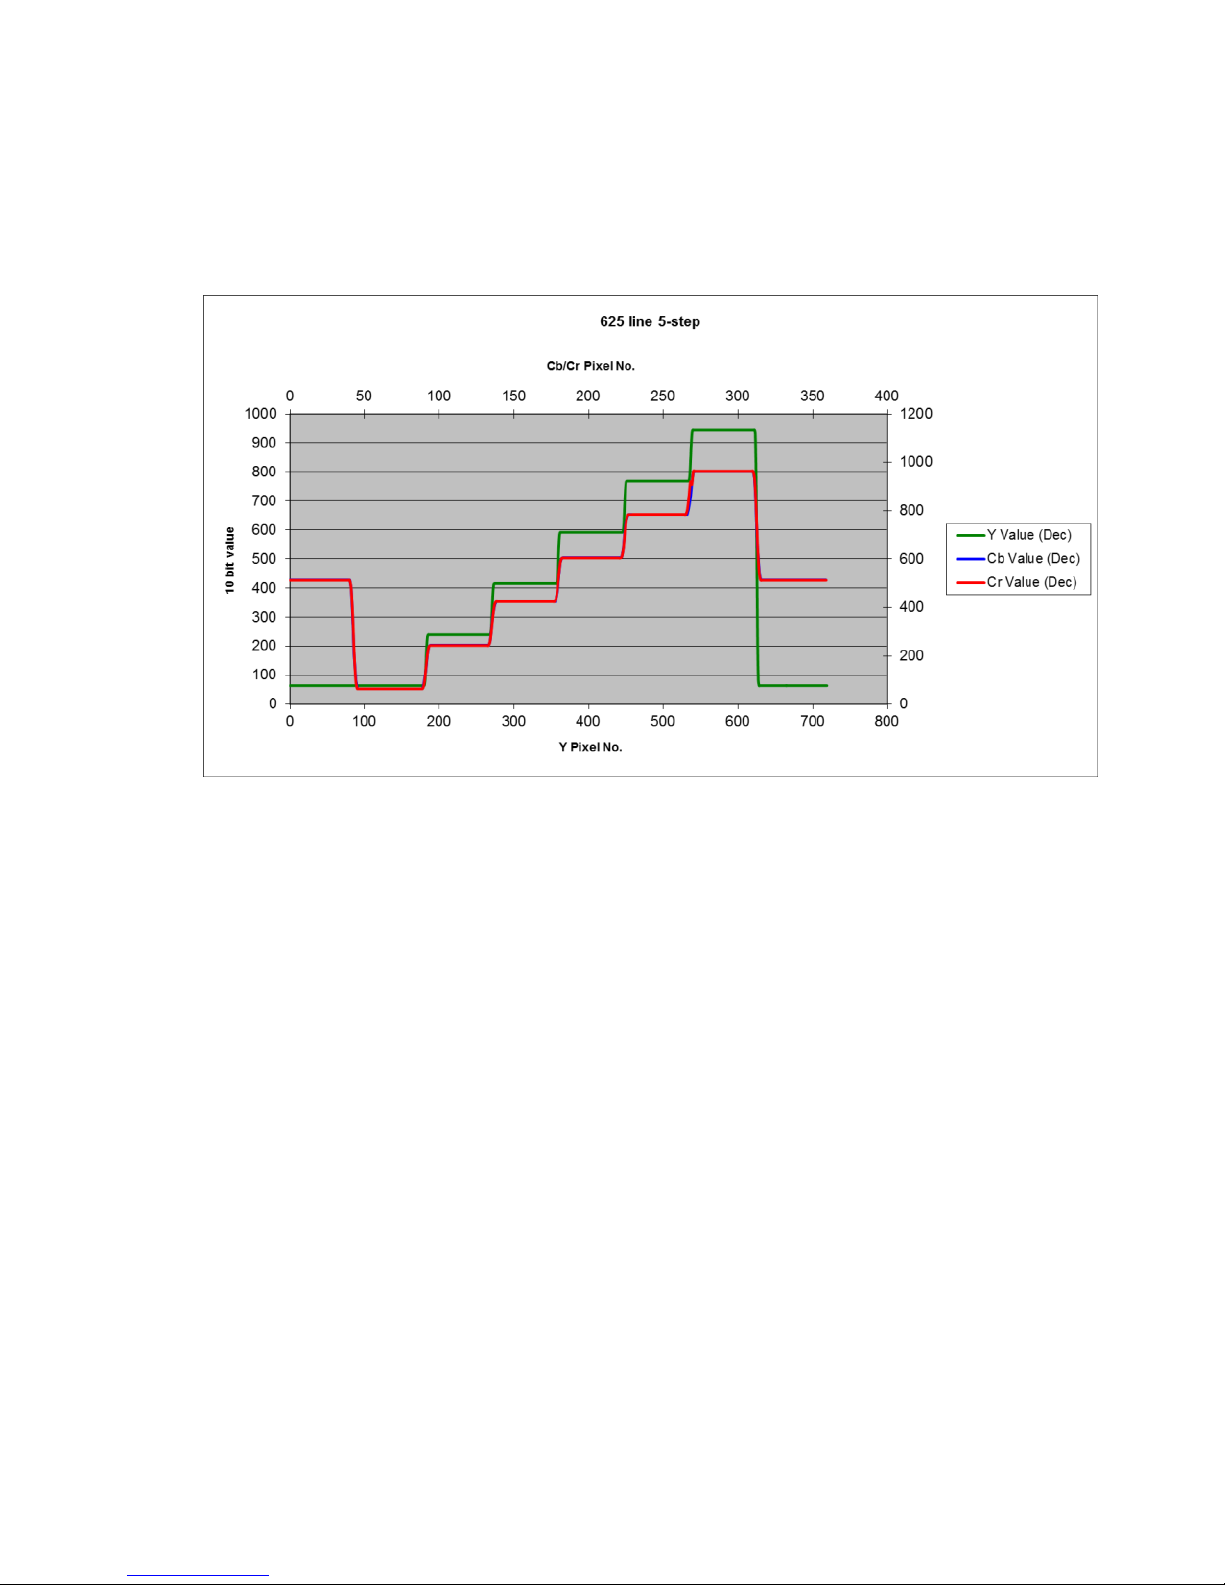
5-step staircase
This waveform is five, equal amplitude, steps of luma and chroma and may
be used to measure linearity as well as differential gain and phase.
Figure 12 5-step staircase waveform.
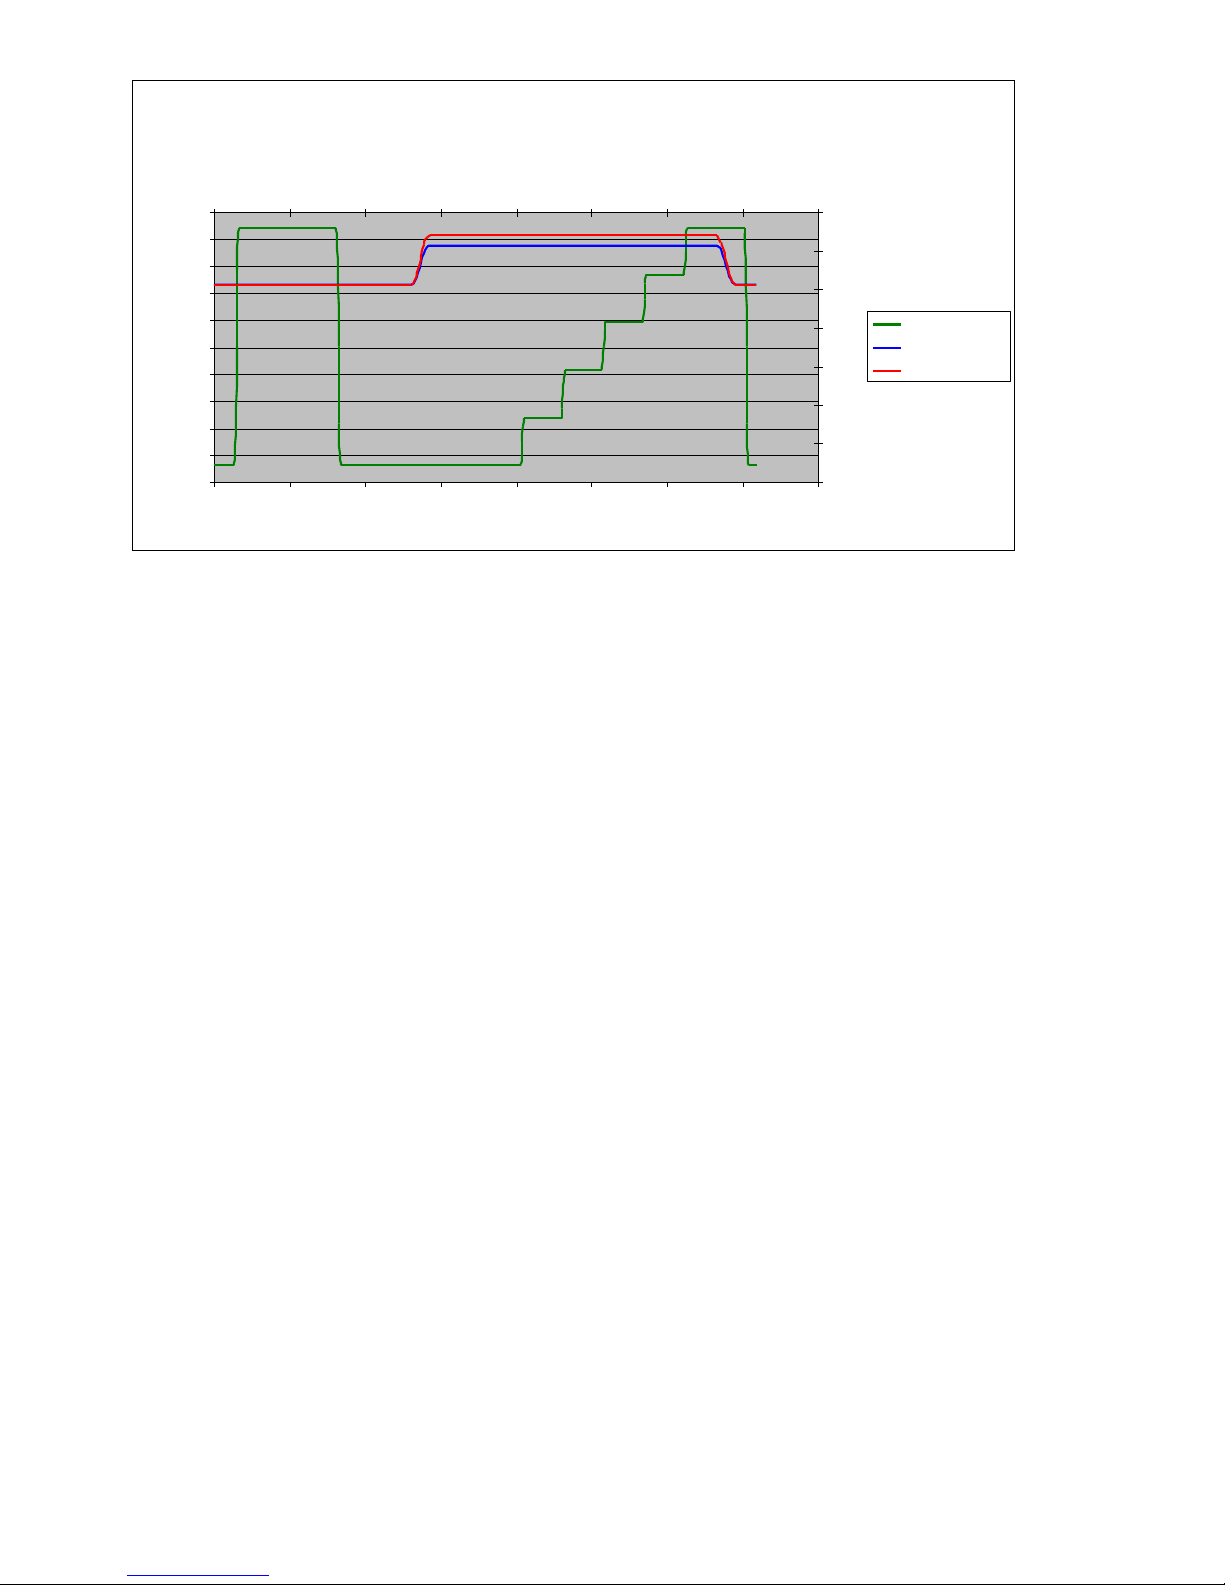
CCIR330 (PAL only)
This waveform is one of the four PAL vertical interval test signals (VITS)
and comprises a pulse and bar and modulated five-step staircase. It is used
for the measurement of differential gain and phase.
Page 26
26
Figure 13 CCIR330 waveform.
The CCIR330 signal is inserted on line 330 of the CVBS output by enabling
‘VITSOn’ in the Setup menu, (default is on).
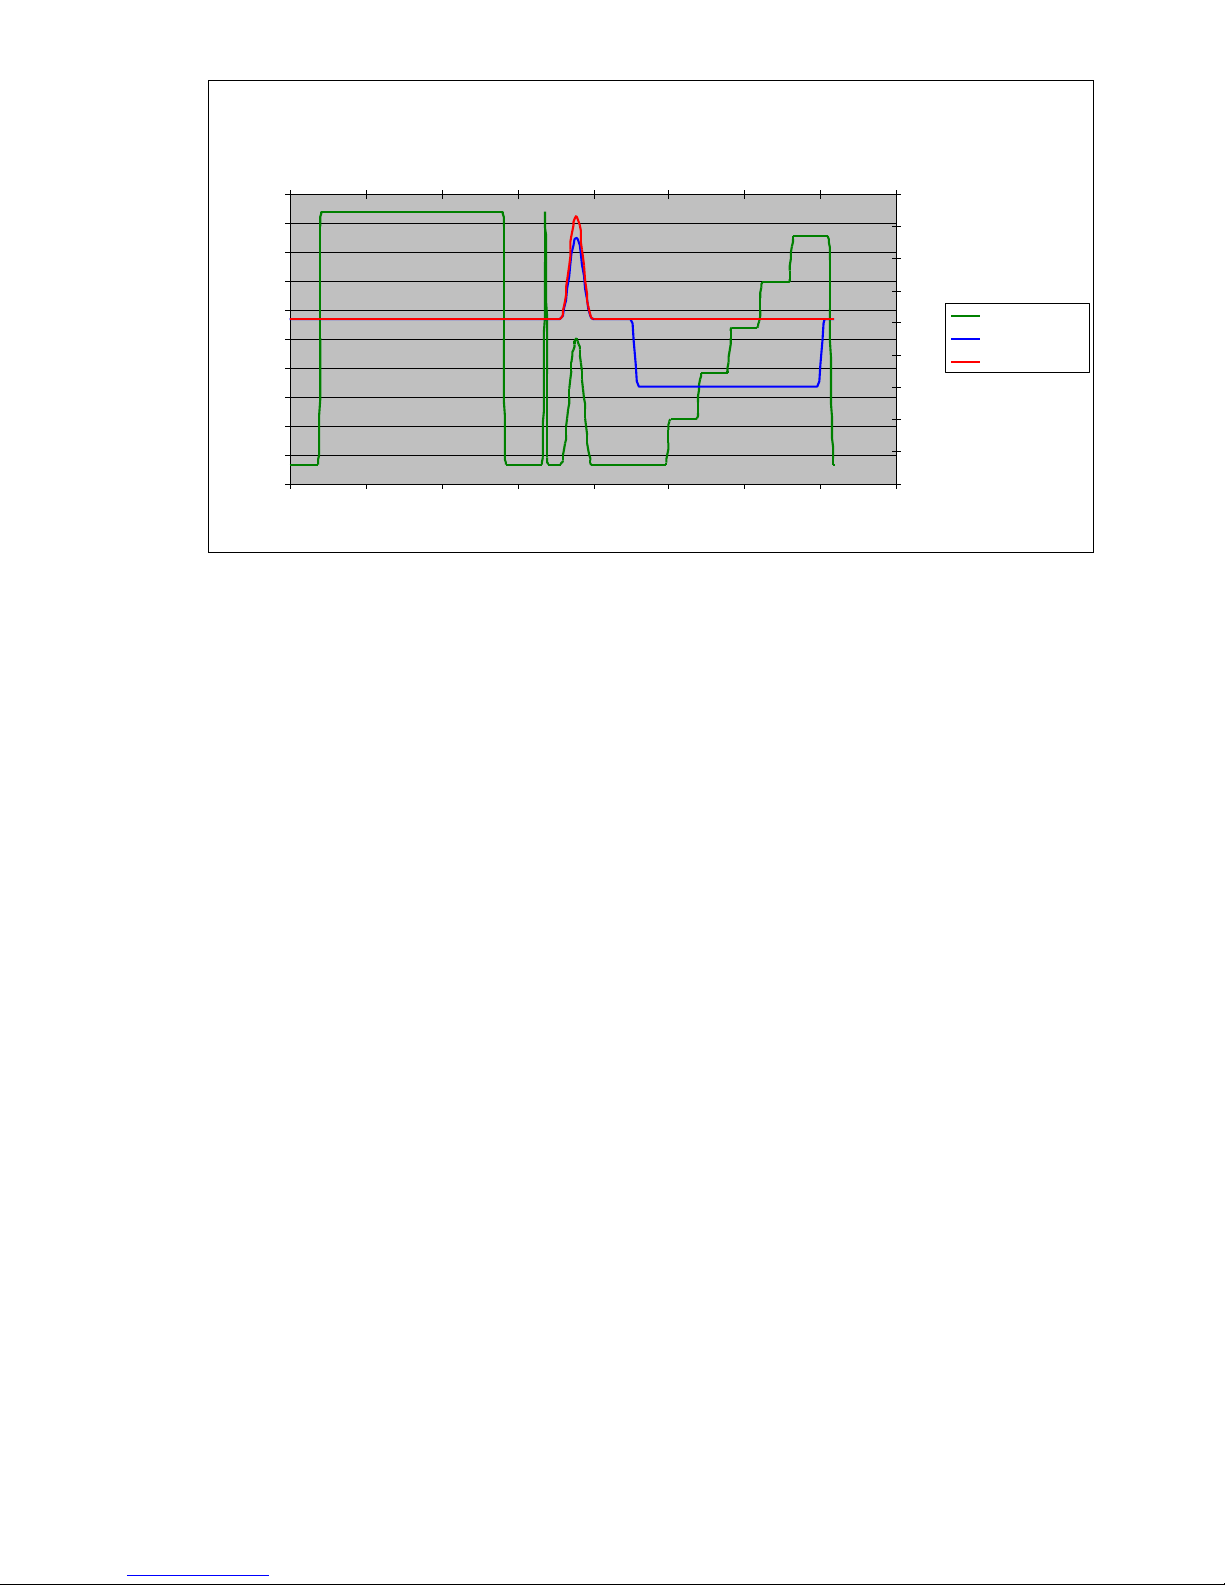
N7CMPF (NTC-7 Composite, NTSC only)
The NTC-7 pattern consists of a 100% white bar, 2T pulse, 12.5T
chrominance pulse and a 5-step modulated staircase.
The 100% white bar can be used for gain calibrations and coupling
distortion measurements (flat top to the bar). The 2T pulse is used for
measuring distortion in the system group delay (the delay vs. frequency
response of system). The 12.5T chroma pulse may be used for measuring
relative luma to chroma delay and gain and the 5-step staircase is used to
measure differential gain (the difference in amplitude between each step in
the staircase and the colour burst) and differential phase (the difference in
phase between each step in the staircase and the colour burst).
N7CMPF is one of the NTSC test signals and is inserted on line 17, field 1
of the CVBS output by enabling ‘VITSOn’ in the Setup menu, (default is on).
Measurements using the NTC-7 composite signal can be seen in Appendix
A.
625 Line CCIR330
0
100
200
300
400
500
600
700
800
900
1000
0 100 200 300 400 500 600 700 800
Y Pixel No.
10 bit value
0
100
200
300
400
500
600
700
0 50 100 150 200 250 300 350 400
Cb/Cr Pixel No.
Y Value (Dec)
Cb Value (Dec)
Cr Value (Dec)
Page 27
27
Figure 14 N7CMPF (NTC-7) Component Waveform
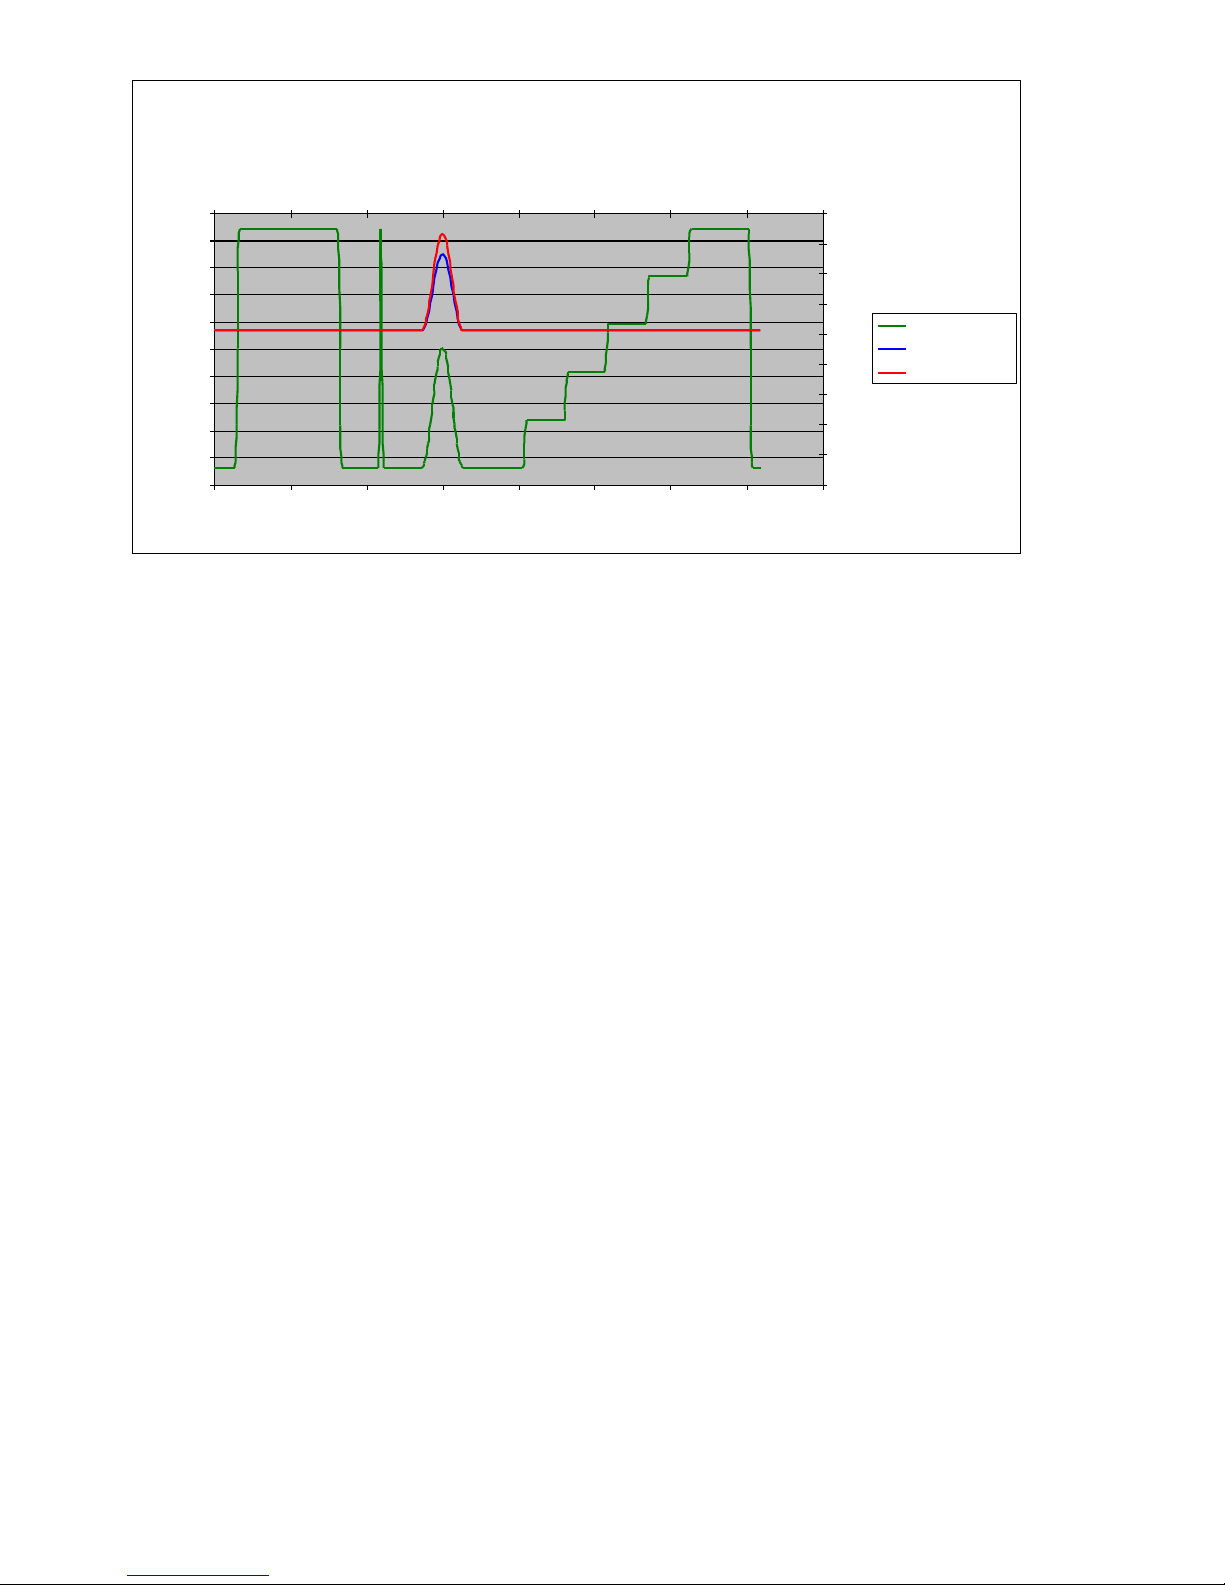
CCIR17 (PAL only)
The CCIR17 pattern consists of a 100% reference luminance bar followed
by 2T and 20T pulses and a 5 step luminance staircase. The pattern may
be used for the measurement of K-factor, luma/chroma gain/delay and
luminance linearity.
The CCIR17 signal is also inserted on line 17 of the output signal by
enabling ‘VITSOn’ in the Setup menu, (default is on).
525 Line N7CMPF
0
100
200
300
400
500
600
700
800
900
1000
0 100 200 300 400 500 600 700 800
Y Pixel No.
10 bit value
0
100
200
300
400
500
600
700
800
900
0 50 100 150 200 250 300 350 400
Cb/Cr Pixel No.
Y Value (Dec)
Cb Value (Dec)
Cr Value (Dec)
Page 28
28
Figure 15 CCIR17 Waveform
2T20TPB (960H only)
The 2T20TPB signal is a pulse, bar and two pulses, 2T and 20T wide. It
allows the measurement of K-factor and luma/chroma gain and delay. A
separate signal to the CCIR17 and NTC-7 waveforms is created because
960H has a wider bandwidth (e.g. 18MHz luma sampling, compared to
13.5MHz luma sampling for NTSC/PAL).
Black
Black is a full frame 0 IRE (NTSC-M) or 0mV (PAL) video signal that may
be used for noise measurements.
White
White is a full frame 100 IRE (NTSC-M) or 700mV (PAL) video signal that
may be used for noise measurements or for finding AC coupling or
clamping issues.
Pedestal (525 line), 50% F/F (625 line)
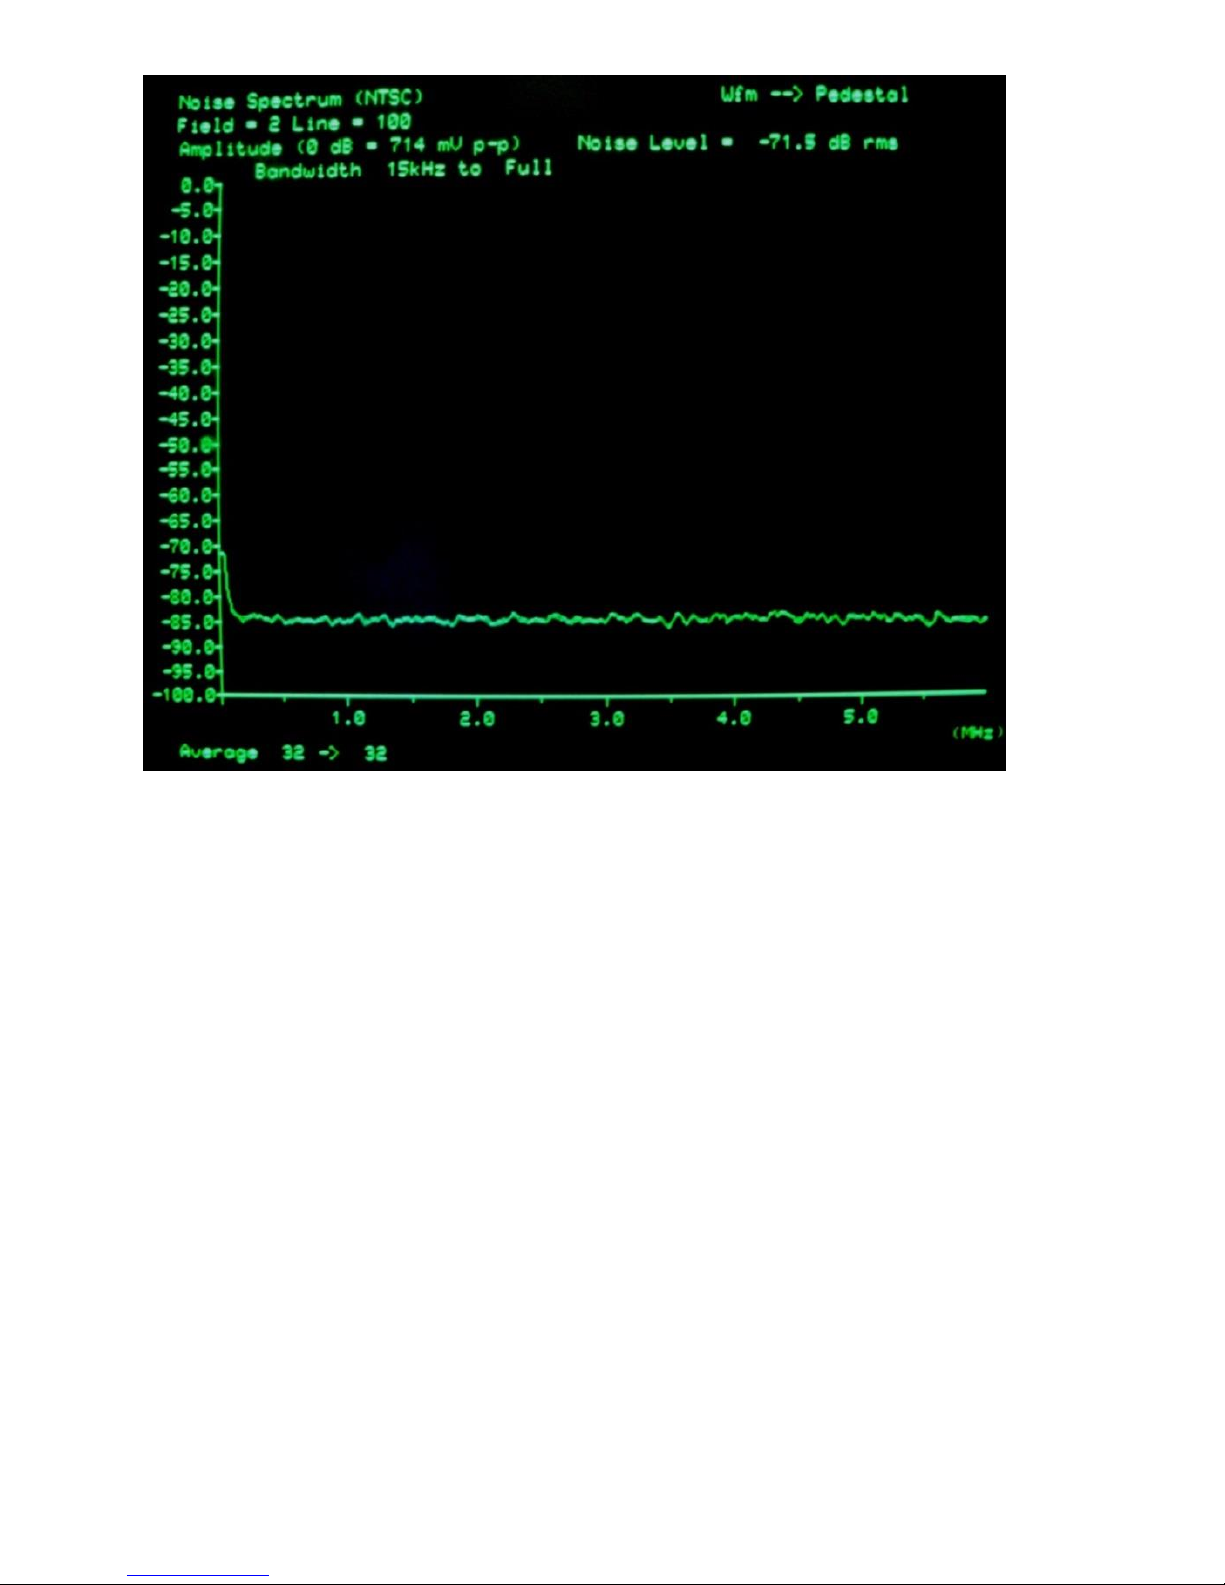
Pedestal is a full frame 50 IRE (NTSC) or 350mV (50%, PAL) video signal
that may be used for noise measurements. The noise measurement of the
625 Line CCIR17
0
100
200
300
400
500
600
700
800
900
1000
0 100 200 300 400 500 600 700 800
Y Pixel No.
10 bit value
0
100
200
300
400
500
600
700
800
900
0 50 100 150 200 250 300 350 400
Cb/Cr Pixel No.
Y Value (Dec)
Cb Value (Dec)
Cr Value (Dec)
Page 29
29
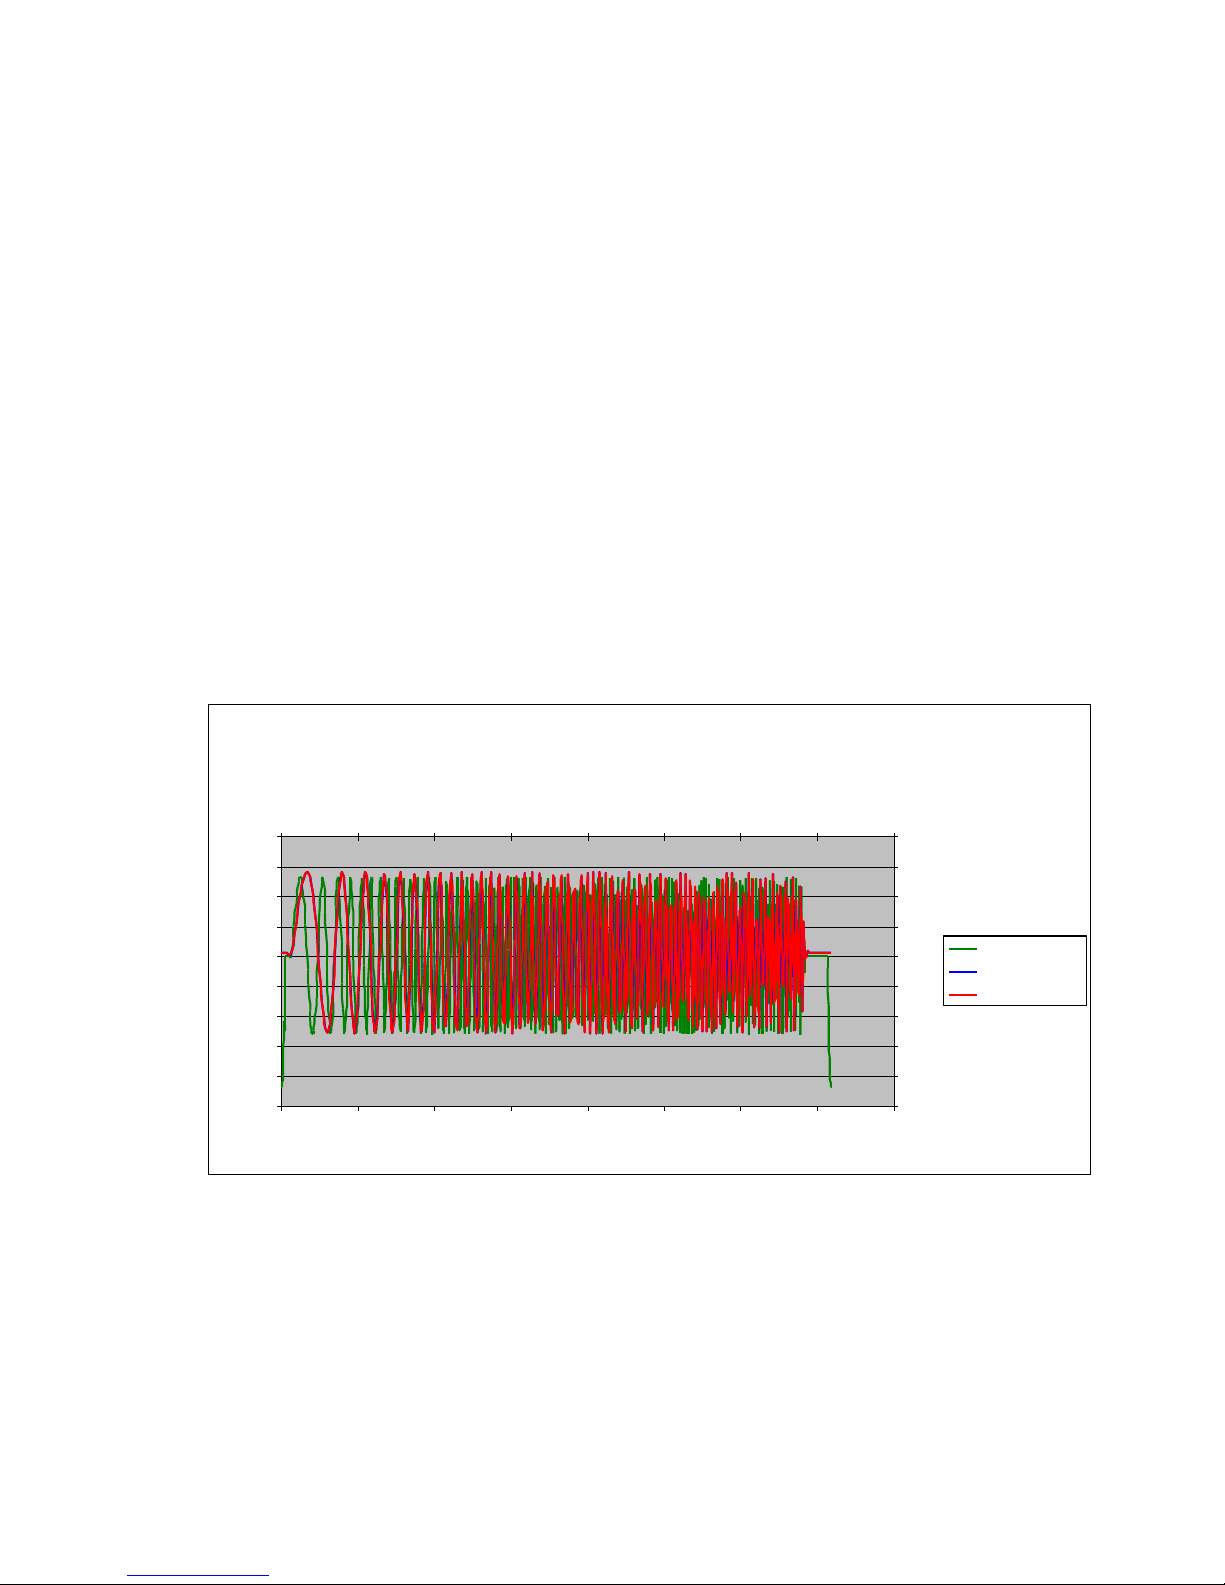
SM01 using this signal and measured with the Tektronix VM700 is shown in
Appendix A.
Bounce
The bounce test signal switches between black and white test signals at
field frequency (50 or 60Hz). It is used to measure field time distortion or
detect clamping issues.
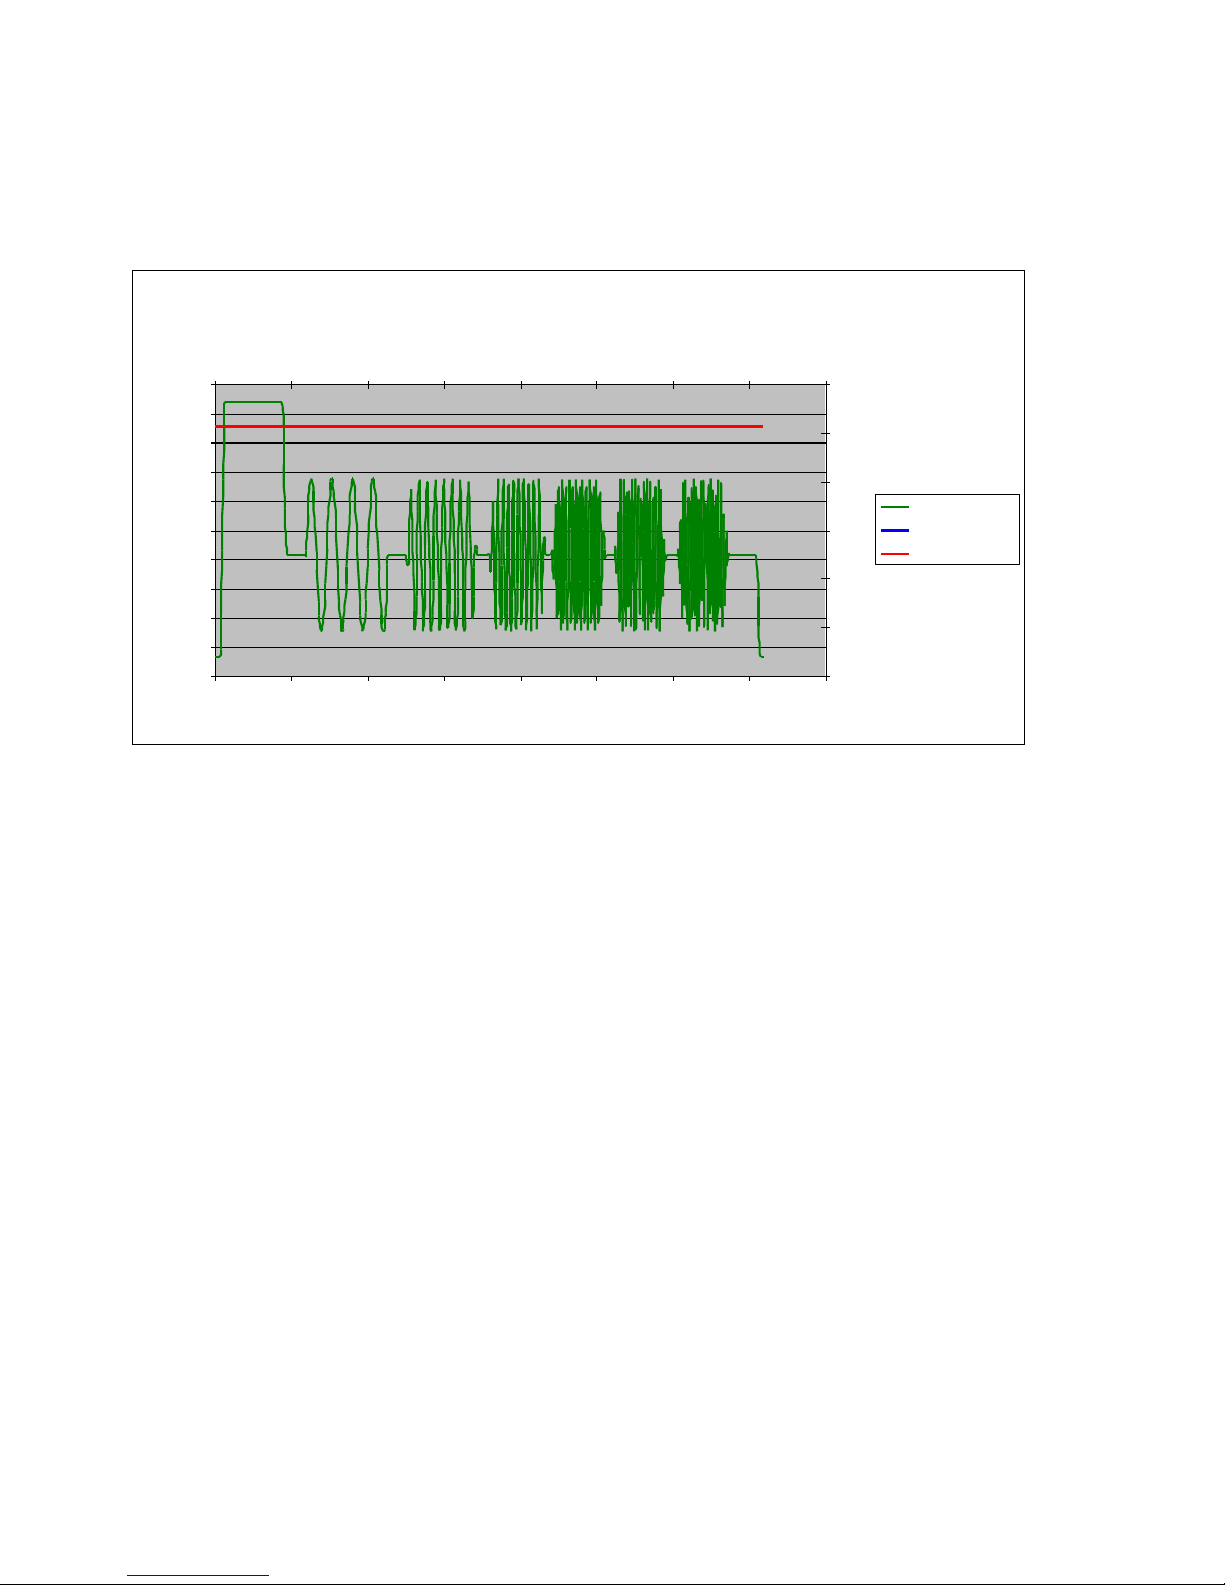
Sweep
Sweep is a swept frequency waveform used for testing the system
frequency response.
For PAL/NTSC the frequency range is 0.25MHz to 5.75MHz for luma and
0.125MHz to 2.75MHz for chroma.
For 960H the frequency range is 0.25MHz to 7.75MHz for luma and
0.125MHz to 2.75MHz for chroma.
Figure 16 Sweep Waveform
525 Line Sweep
0
100
200
300
400
500
600
700
800
900
0 100 200 300 400 500 600 700 800
Y Pixel No.
10 bit value
0
100
200
300
400
500
600
700
800
900
0 50 100 150 200 250 300 350 400
Cb/Cr Pixel No.
Y Value (Dec)
Cb Value (Dec)
Cr Value (Dec)
Page 30
30
FCCMB (NTSC only)
The FCCMB test signal is a pulse reference followed by six frequency
packets at 0.5MHz, 1.25MHz, 2.0MHz, 3.0MHz, 3.579545MHz and 4.1MHz.
Figure 17 FCCMB Waveform
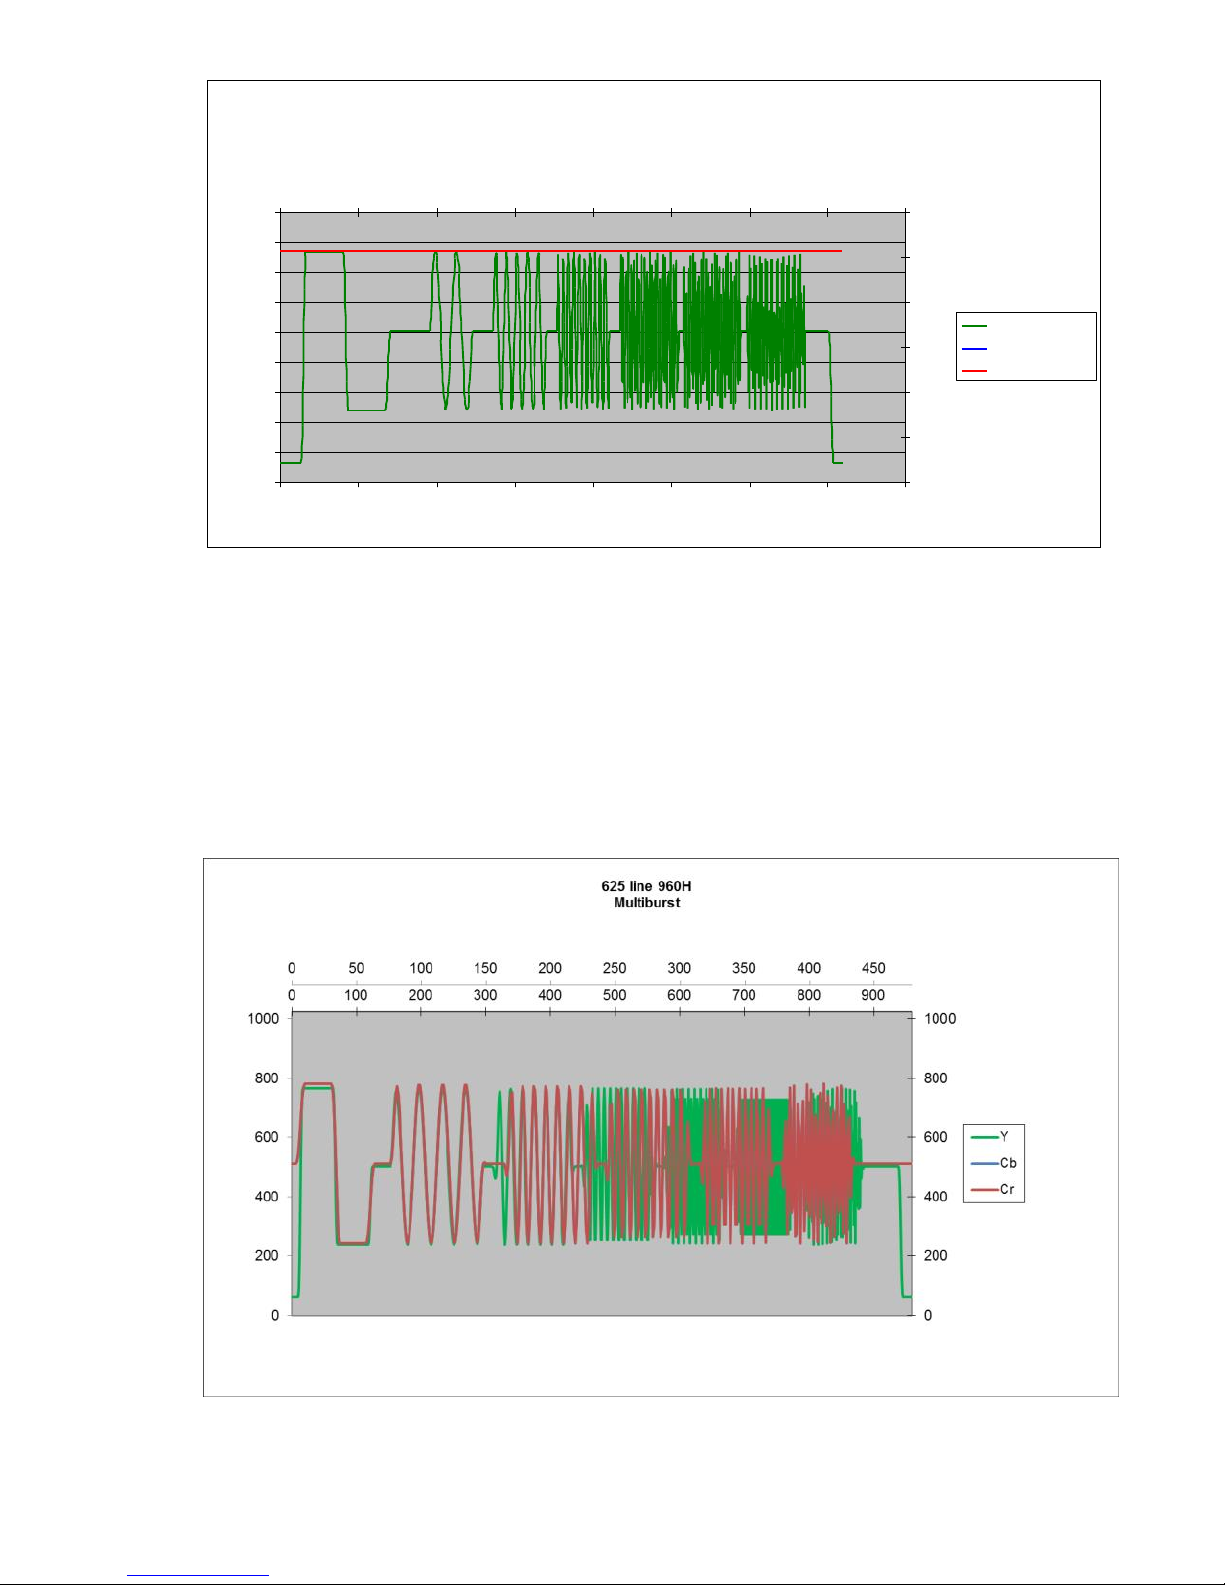
CCIR18 (PAL only)
The CCIR18 pattern is a standard VITS, (Vertical Interval Test Signal),
pattern consisting of a luminance reference bar followed by 6 multi-burst
packets at 0.5MHz, 1.0MHz, 2.0MHz, 3.0MHz, 4.8MHz and 5.8MHz of 60%
amplitude on a 50% pedestal.
The CCIR18 signal is inserted on line 18 of the output signal by enabling
‘VITSOn’ in the Setup menu, (default is on).
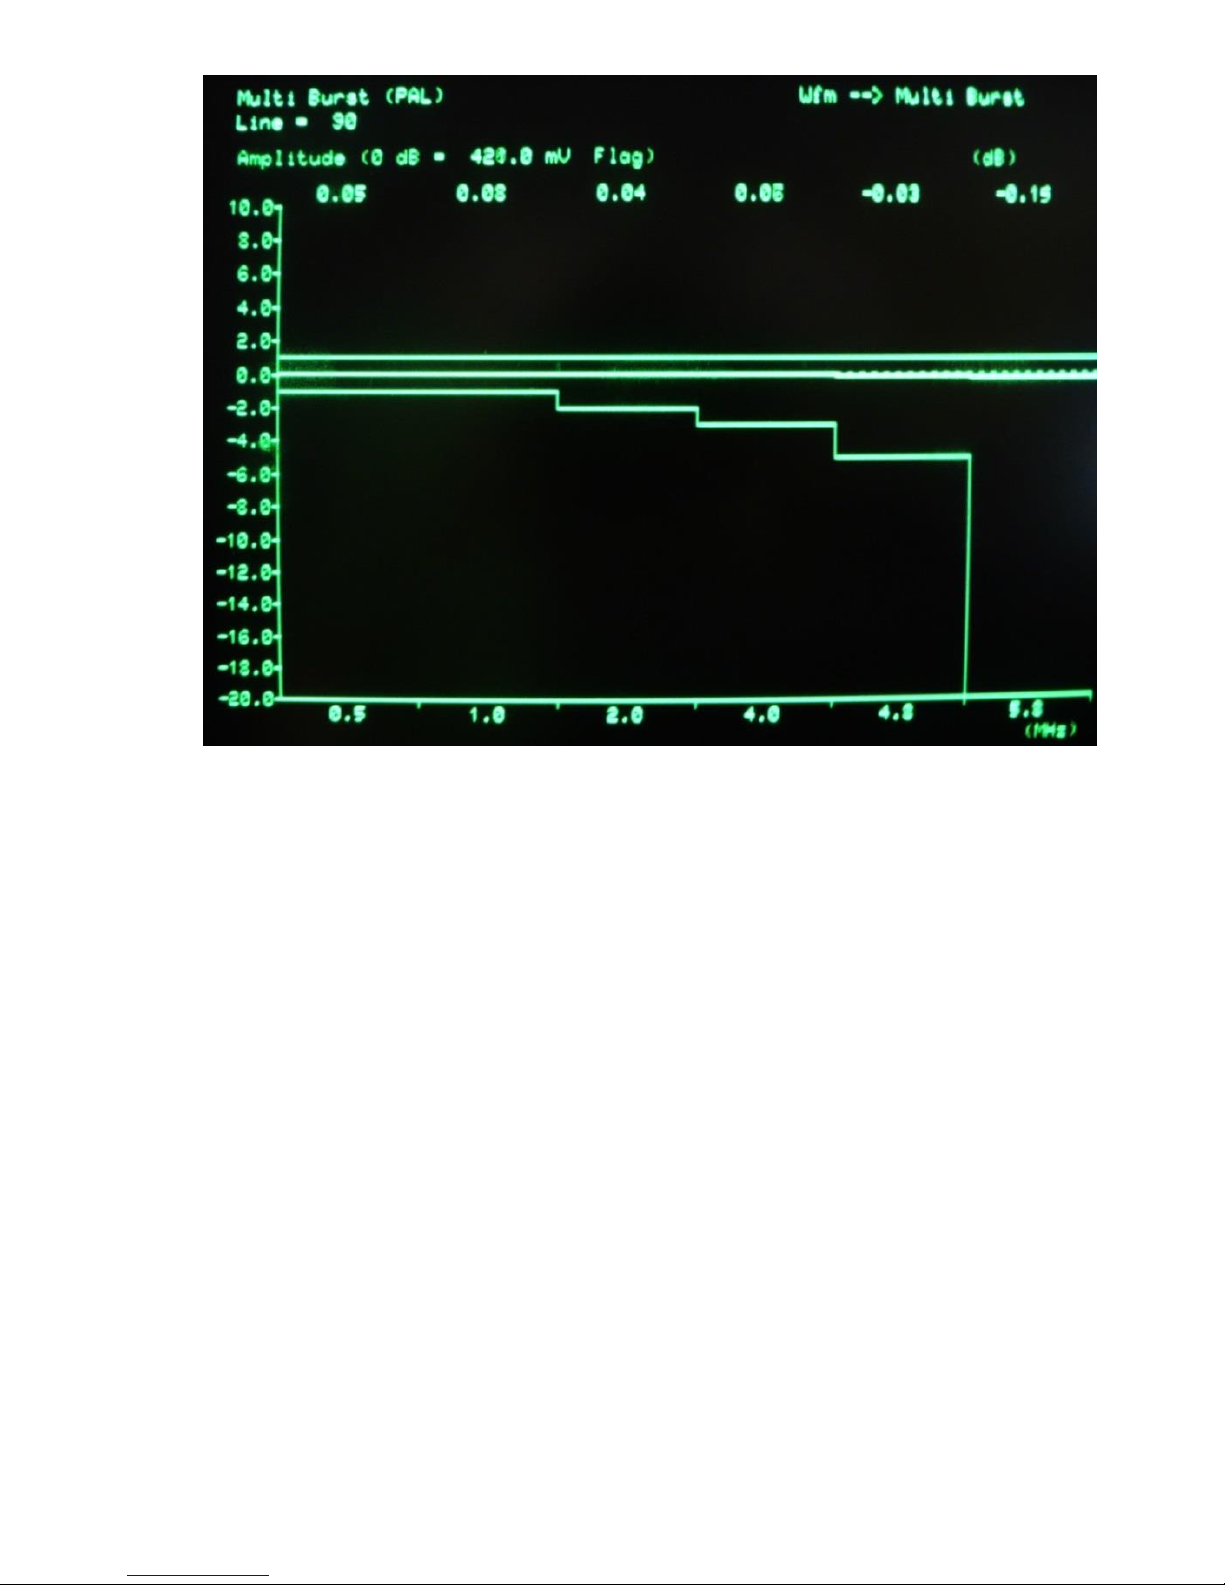
The frequency response of the SM01 measured with the CCIR18 test signal
is shown in Appendix A.
525 Line FCCMB
0
100
200
300
400
500
600
700
800
900
1000
0 100 200 300 400 500 600 700 800
Y Pixel No.
10 bit value
0
100
200
300
400
500
600
0 50 100 150 200 250 300 350 400
Cb/Cr Pixel No.
Y Value (Dec)
Cb Value (Dec)
Cr Value (Dec)
Page 31
31
Figure 18 CCIR18 Waveform
Multi (960H only)
The FCCMB test signal is a pulse reference followed by six luma frequency
packets at 0.5MHz, 1.0MHz, 2.0MHz, 4.0MHz, 6.0MHz and 7.75MHz. The
chroma signal comprises 5 packets at 0.5MHz, 1.0MHz, 1.5MHz, 2.0MHz
and 2.75MHz.
625 Line CCIR18
0
100
200
300
400
500
600
700
800
900
0 100 200 300 400 500 600 700 800
Y Pixel No.
10 bit value
0
100
200
300
400
500
600
0 50 100 150 200 250 300 350 400
Cb/Cr Pixel No.
Y Value (Dec)
Cb Value (Dec)
Cr Value (Dec)
Page 32
32
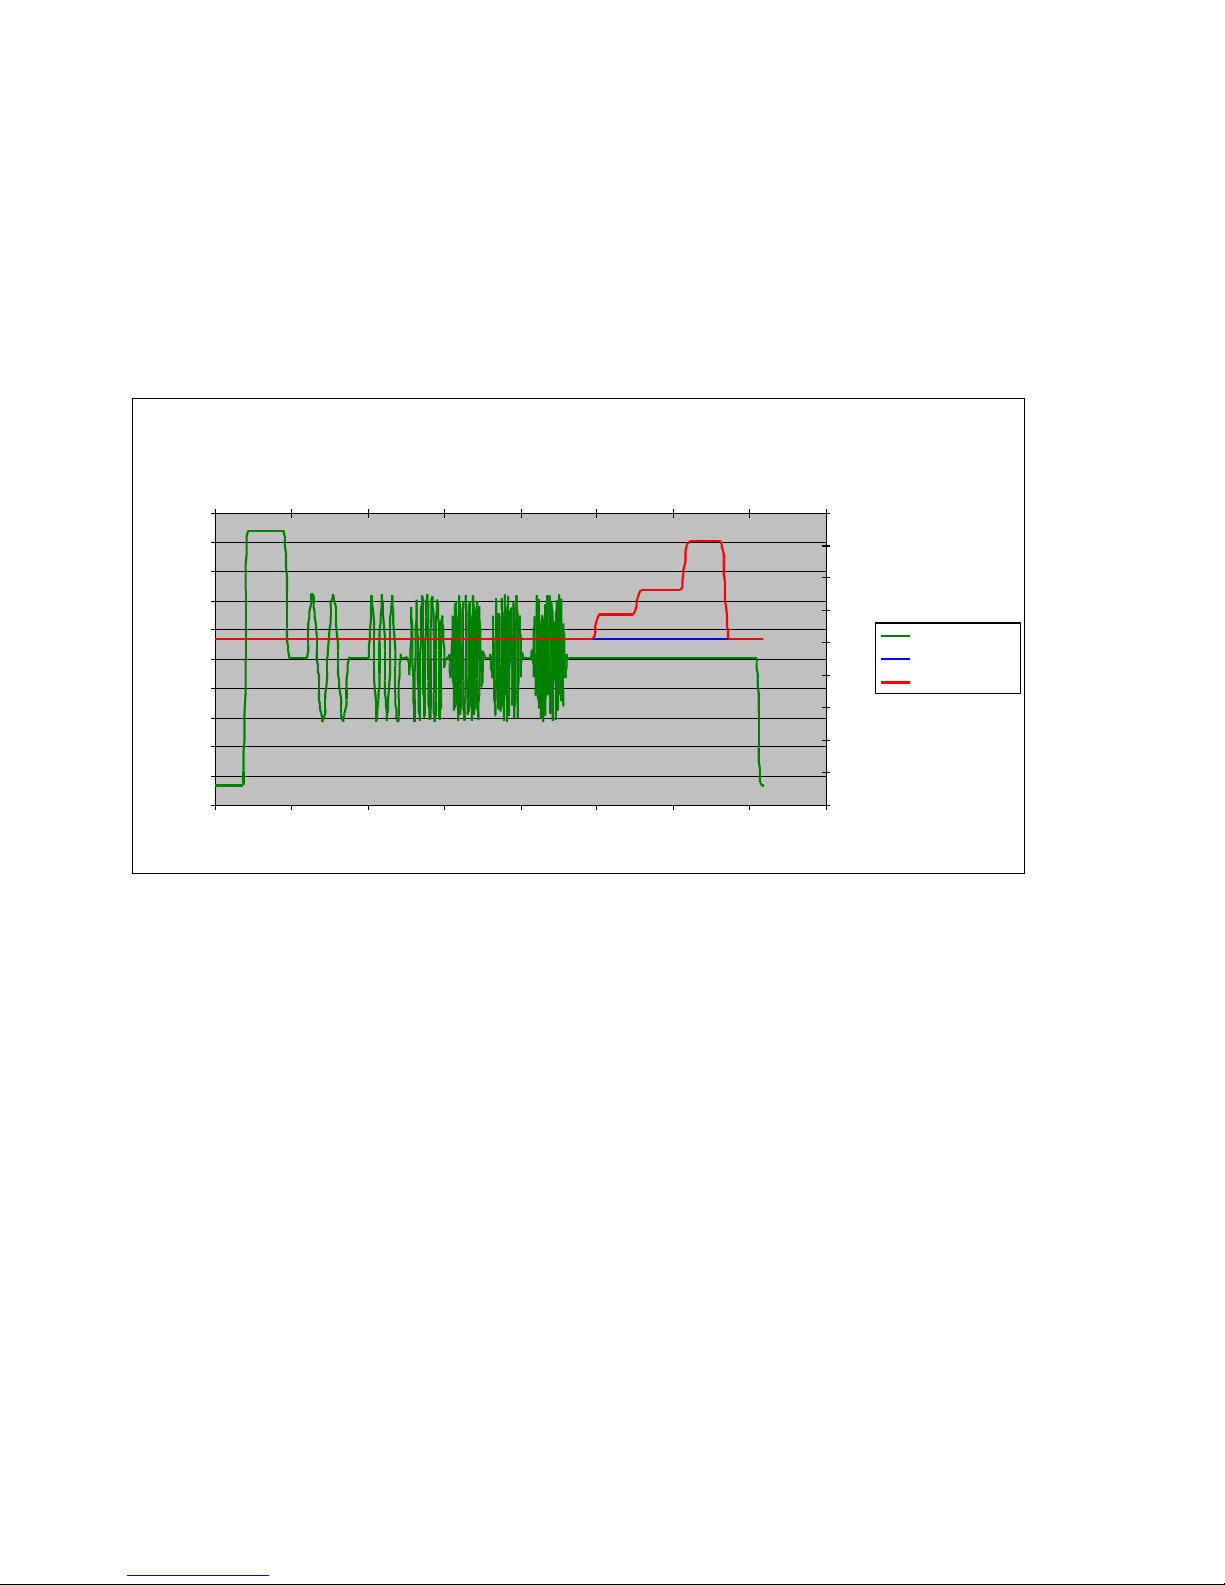
N7CMBF (NTC-7 Combination – NTSC only)
The NTC-7 Combination pattern consists of a white bar at 100 IRE, 6
multiburst packets of 50 IRE amplitude on a 50 IRE pedestal (at 0.5MHz,
1.0MHz, 2.0MHz, 3.0MHz, 3.58MHz and 4.2MHz) and a 20,40 and 80 IRE
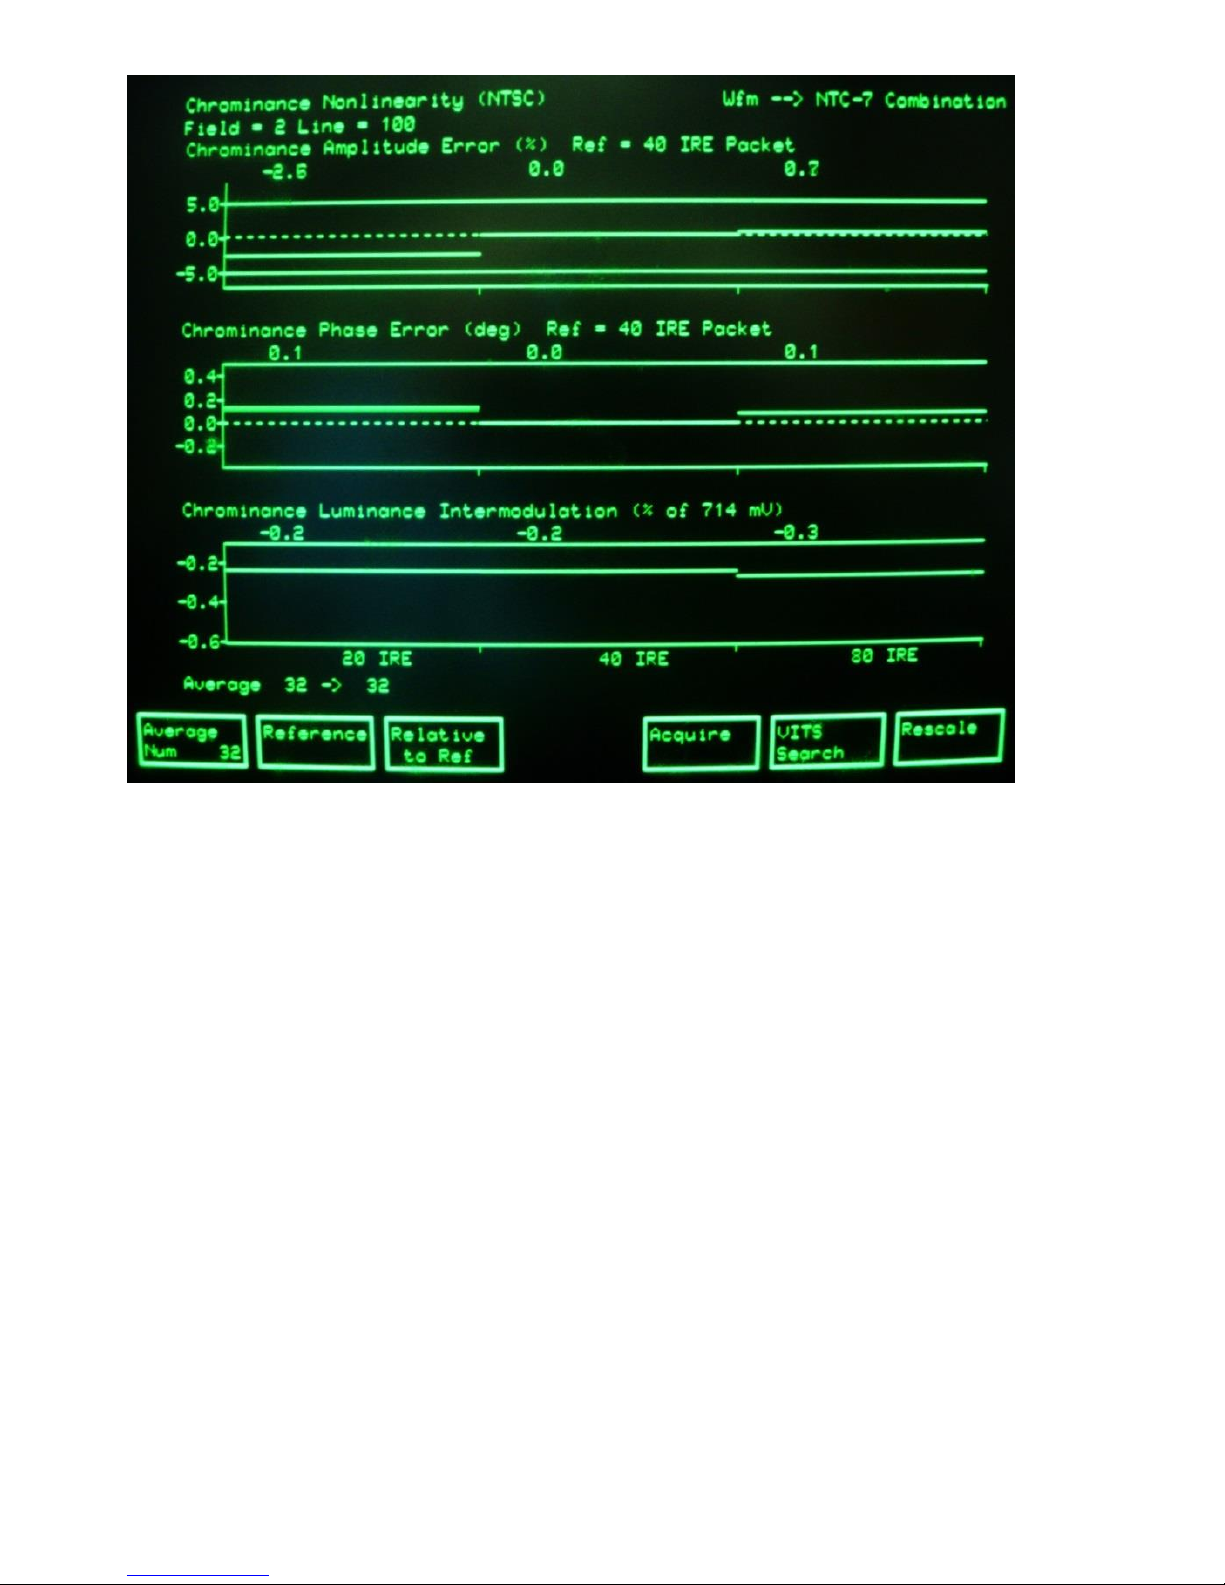
amplitude modulated chrominance on a 50 IRE pedestal. The latter can be
used to measure chrominance linearity as shown in Appendix A.
Figure 19 N7CMBF Component Waveform
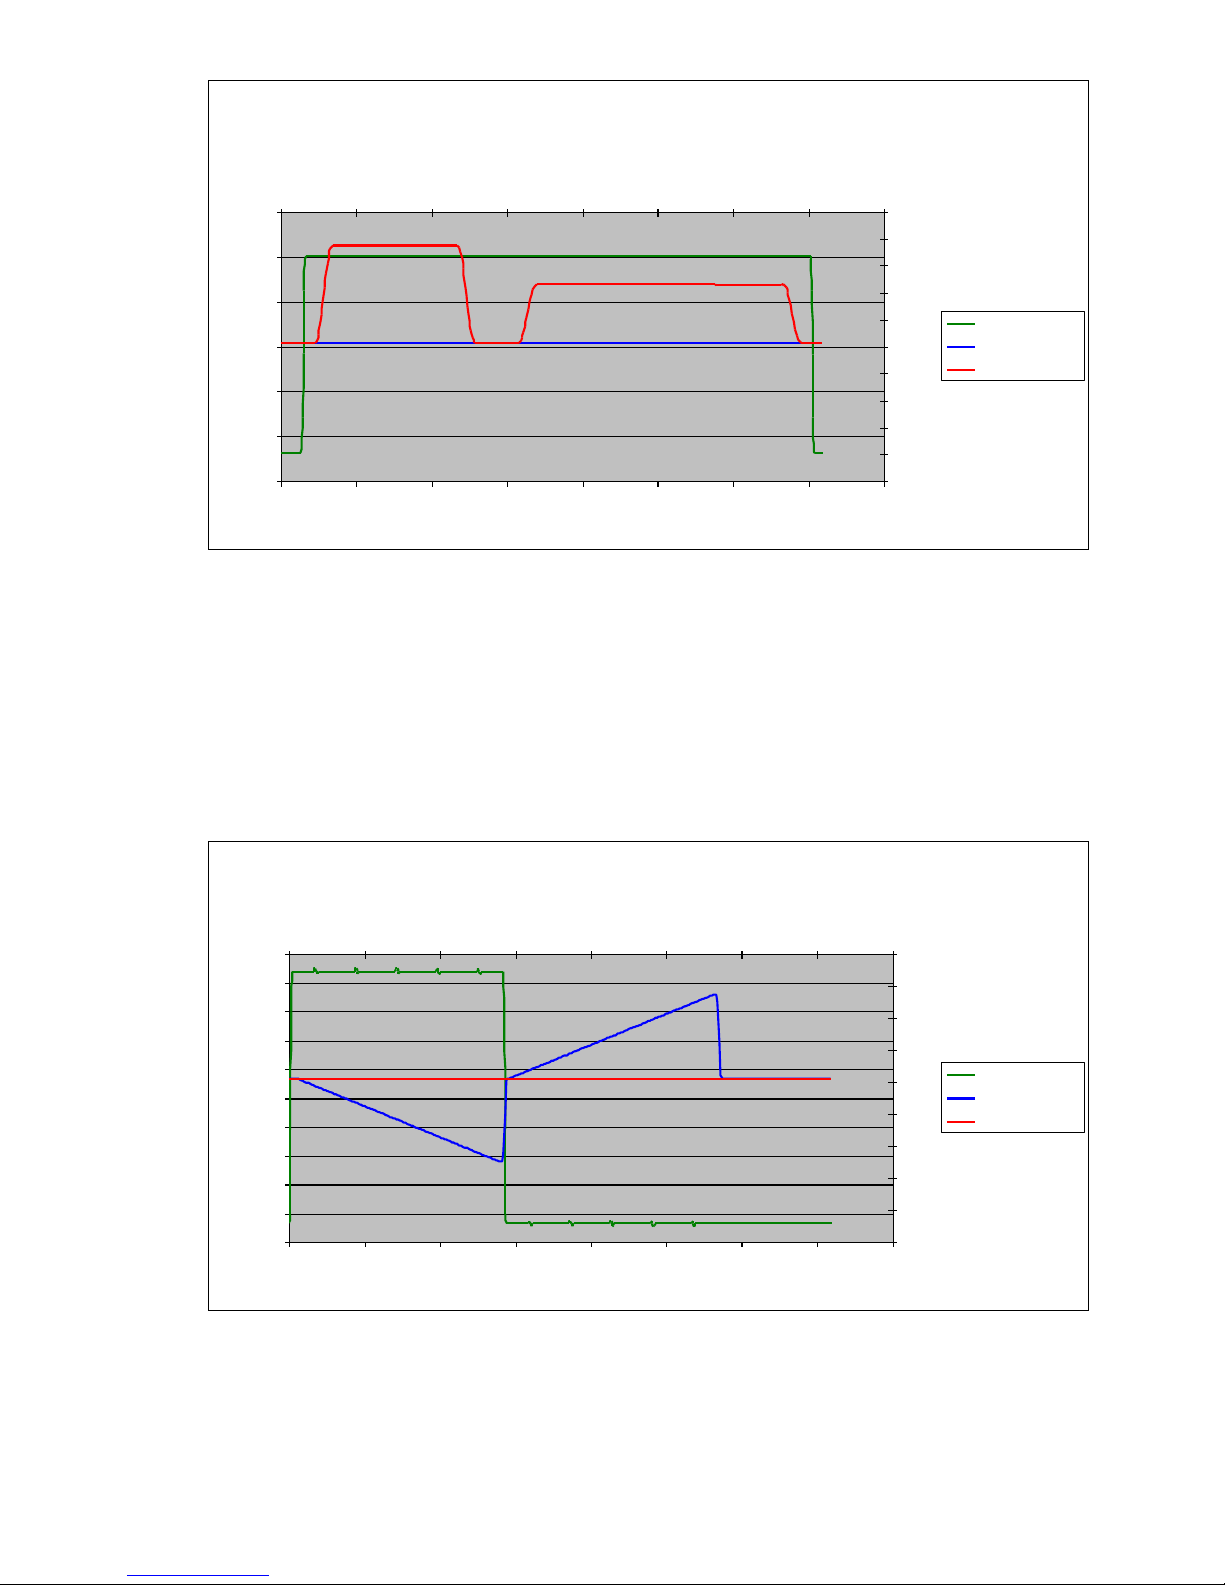
CCIR331 (PAL only)
The CCIR331 signal is used to measure chroma amplitude and phase
errors as well as luma/chroma intermodulation. It is a vertical interval test
signal (VITS) and is inserted on line 331 of the output signal by enabling
‘VITSOn’ in the Setup menu, (default is on).
525 Line N7CMBF
0
100
200
300
400
500
600
700
800
900
1000
0 100 200 300 400 500 600 700 800
Y Pixel No.
10 bit value
0
100
200
300
400
500
600
700
800
900
0 50 100 150 200 250 300 350 400
Cb/Cr Pixel No.
Y Value (Dec)
Cb Value (Dec)
Cr Value (Dec)
Page 33
33
Figure 20 CCIR331 Waveform
Gamut
The gamut test signal is designed to detect errors in converting between
different colour spaces (e.g. from Y,Cb,Cr to RGB).
Figure 21 Gamut Waveform
625 Line CCIR331
0
100
200
300
400
500
600
0 100 200 300 400 500 600 700 800
Y Pixel No.
10 bit value
0
100
200
300
400
500
600
700
800
900
1000
0 50 100 150 200 250 300 350 400
Cb/Cr Pixel No.
Y Value (Dec)
Cb Value (Dec)
Cr Value (Dec)
525 Line Gamut
0
100
200
300
400
500
600
700
800
900
1000
0 100 200 300 400 500 600 700 800
Y Pixel No.
10 bit value
0
100
200
300
400
500
600
700
800
900
0 50 100 150 200 250 300 350 400
Cb/Cr Pixel No.
Y Value (Dec)
Cb Value (Dec)
Cr Value (Dec)
Page 34
34
Pathological (NTSC/PAL only)
The pathological output is intended for stressing the equalizer of an SDI
receiver. The pattern is in accordance with SMPTE-259M. The pattern
consists of two parts, split horizontally into the top and bottom halves of a
field as shown in Figure 41.
The top half consists of a repetitive active line pattern of values Y=198h and
C=300h. After scrambling this results in either 19 ‘ones’ followed by one
‘zero’ or 19 ‘zeros’ followed by one ‘one’. This output stresses the equalizer
because of its low frequency content.
The bottom half consists of a repetitive active line pattern of values Y=110h
and C=200h. This results in an output with 20 ‘zeros’ followed by 20 ‘ones’.
This bit pattern tests the receiver PLL because of the low transition
frequency of edges in the data.
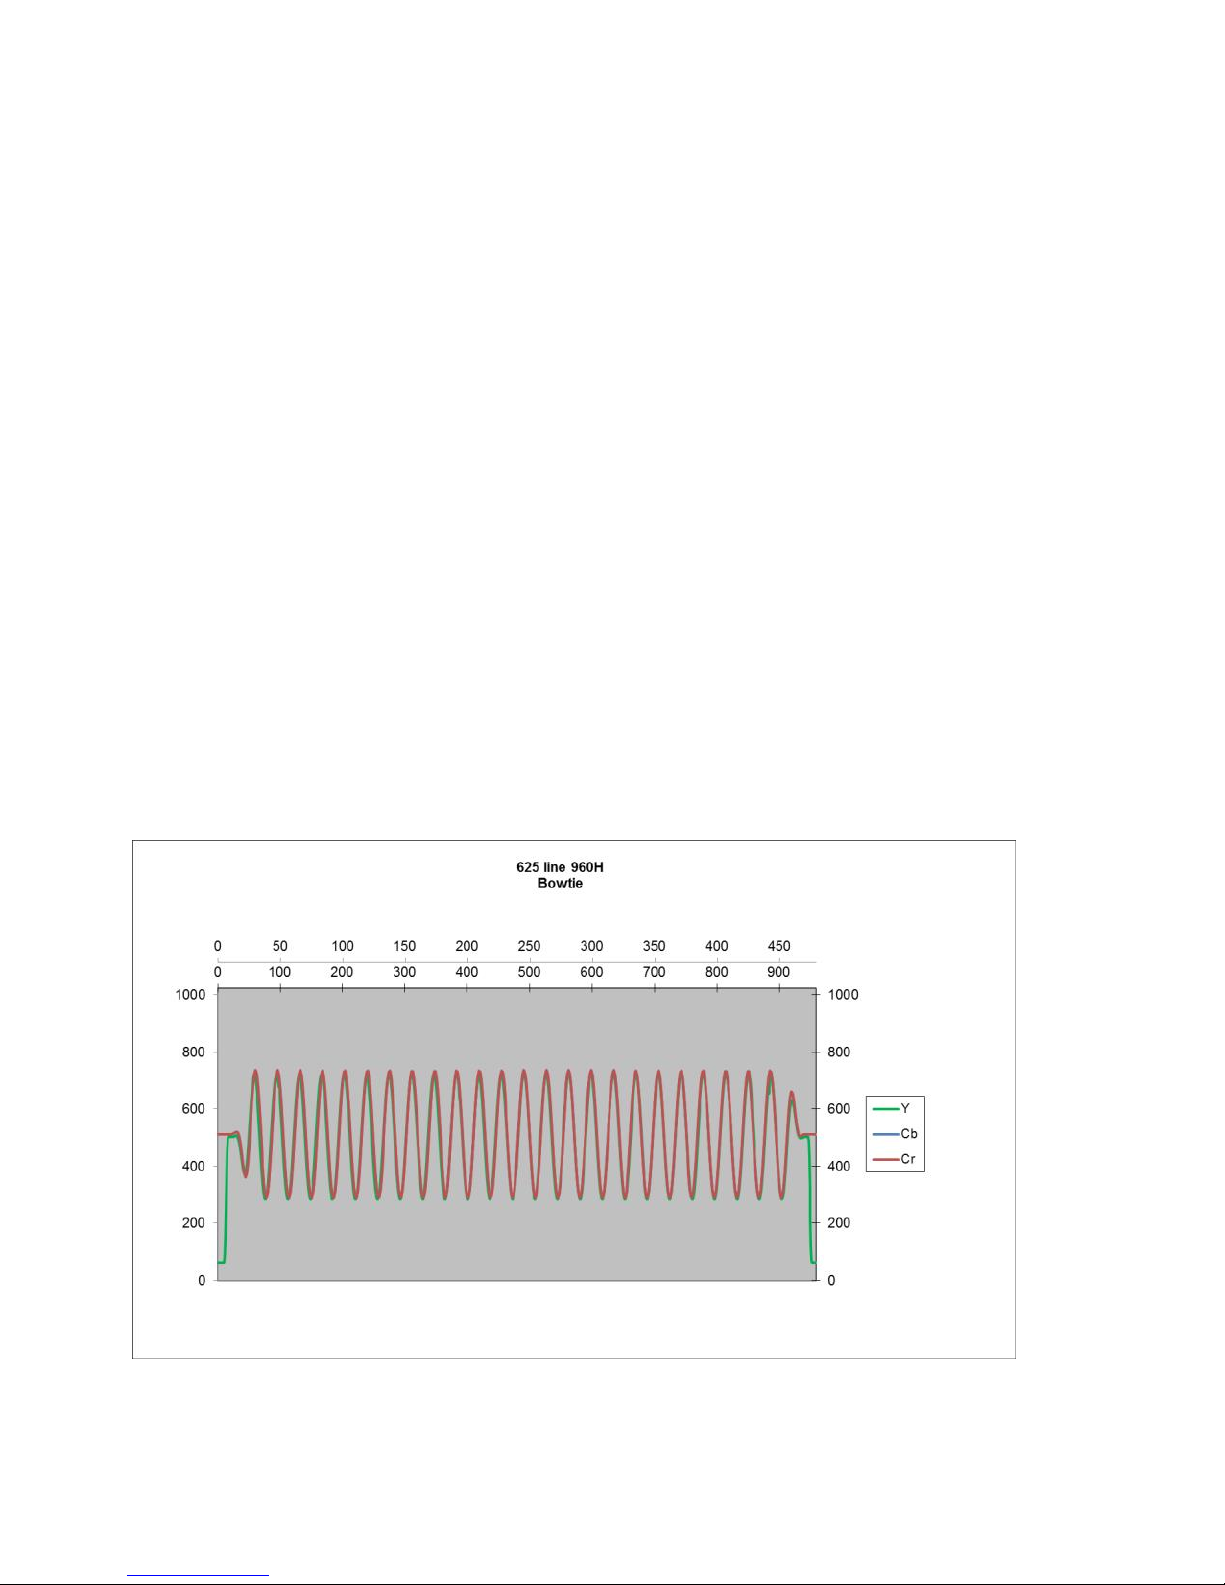
Bowtie (960H only)
The Bowtie waveform is used to measure component amplitude and timing
errors. The waveform consists of a 500kHz sine wave on the luma channel
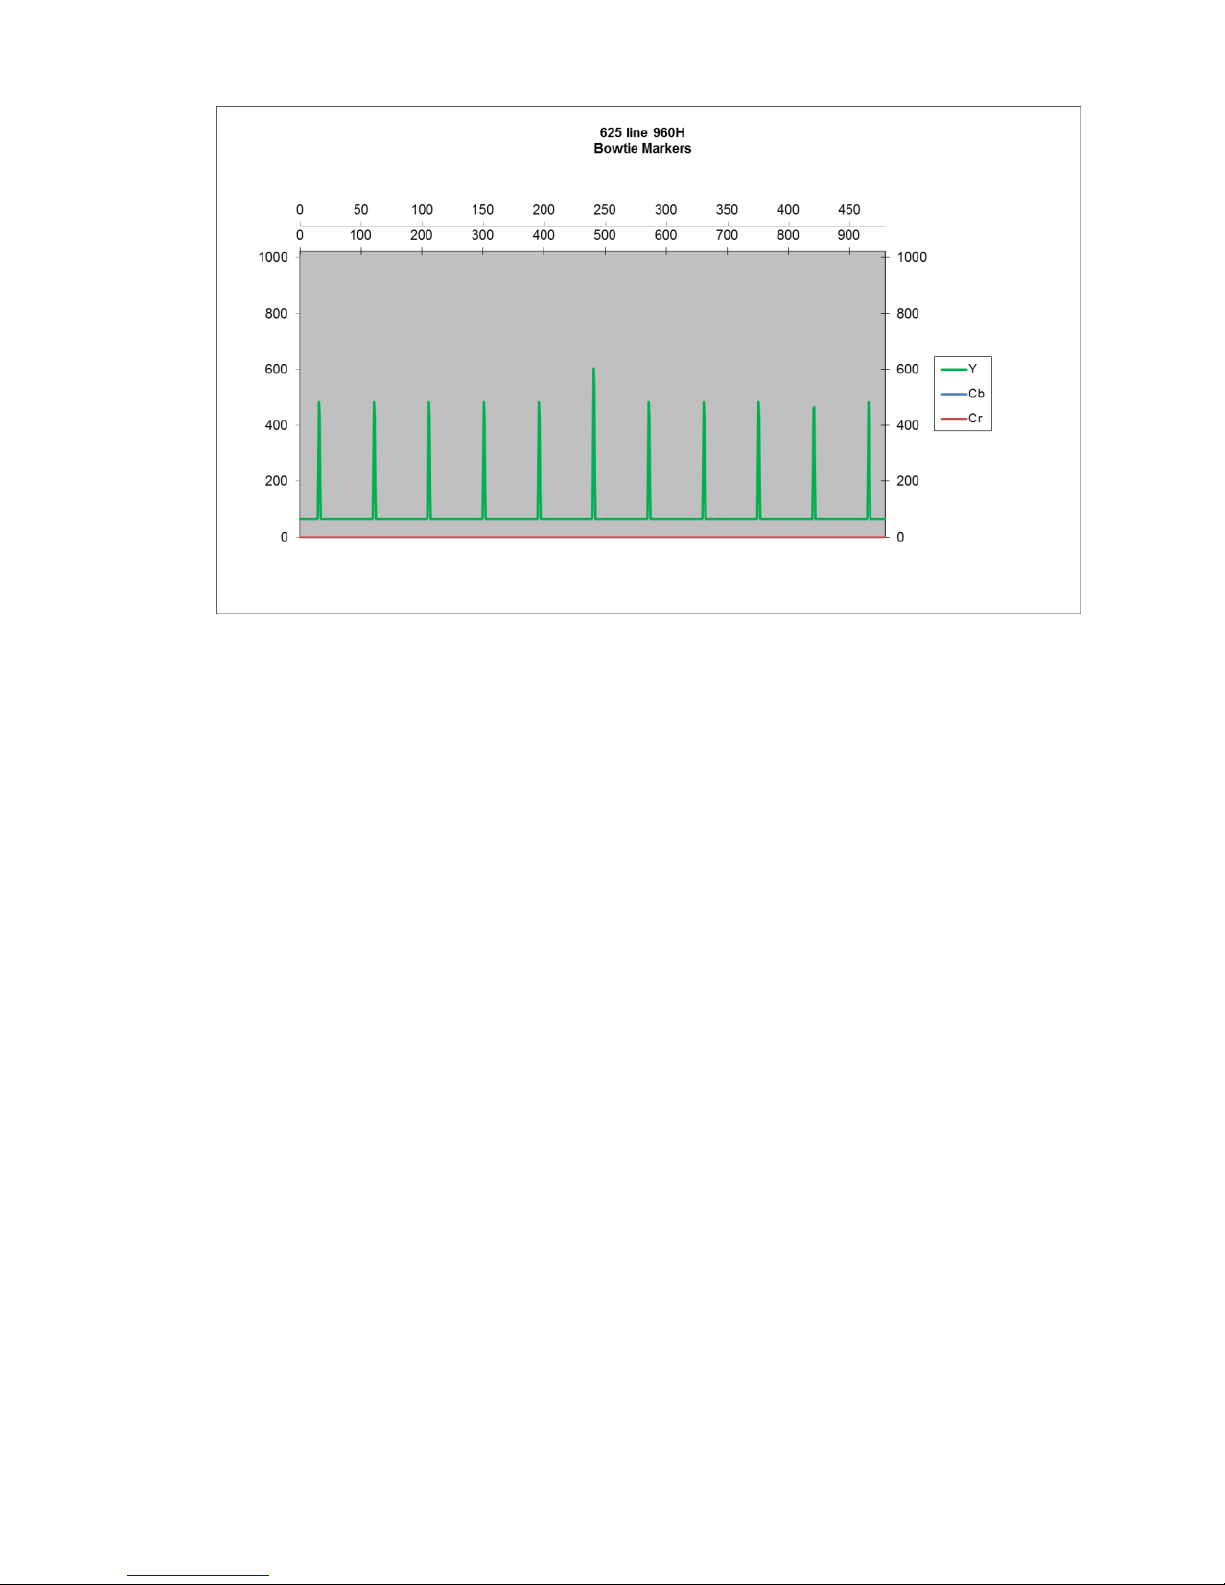
and a 502kHz sine wave on the Pb and Pr outputs. Marker signals are
provided to assist in the measurement.
Figure 22 Bowtie waveform.
Page 35
35
Figure 23 Bowtie markers waveform.
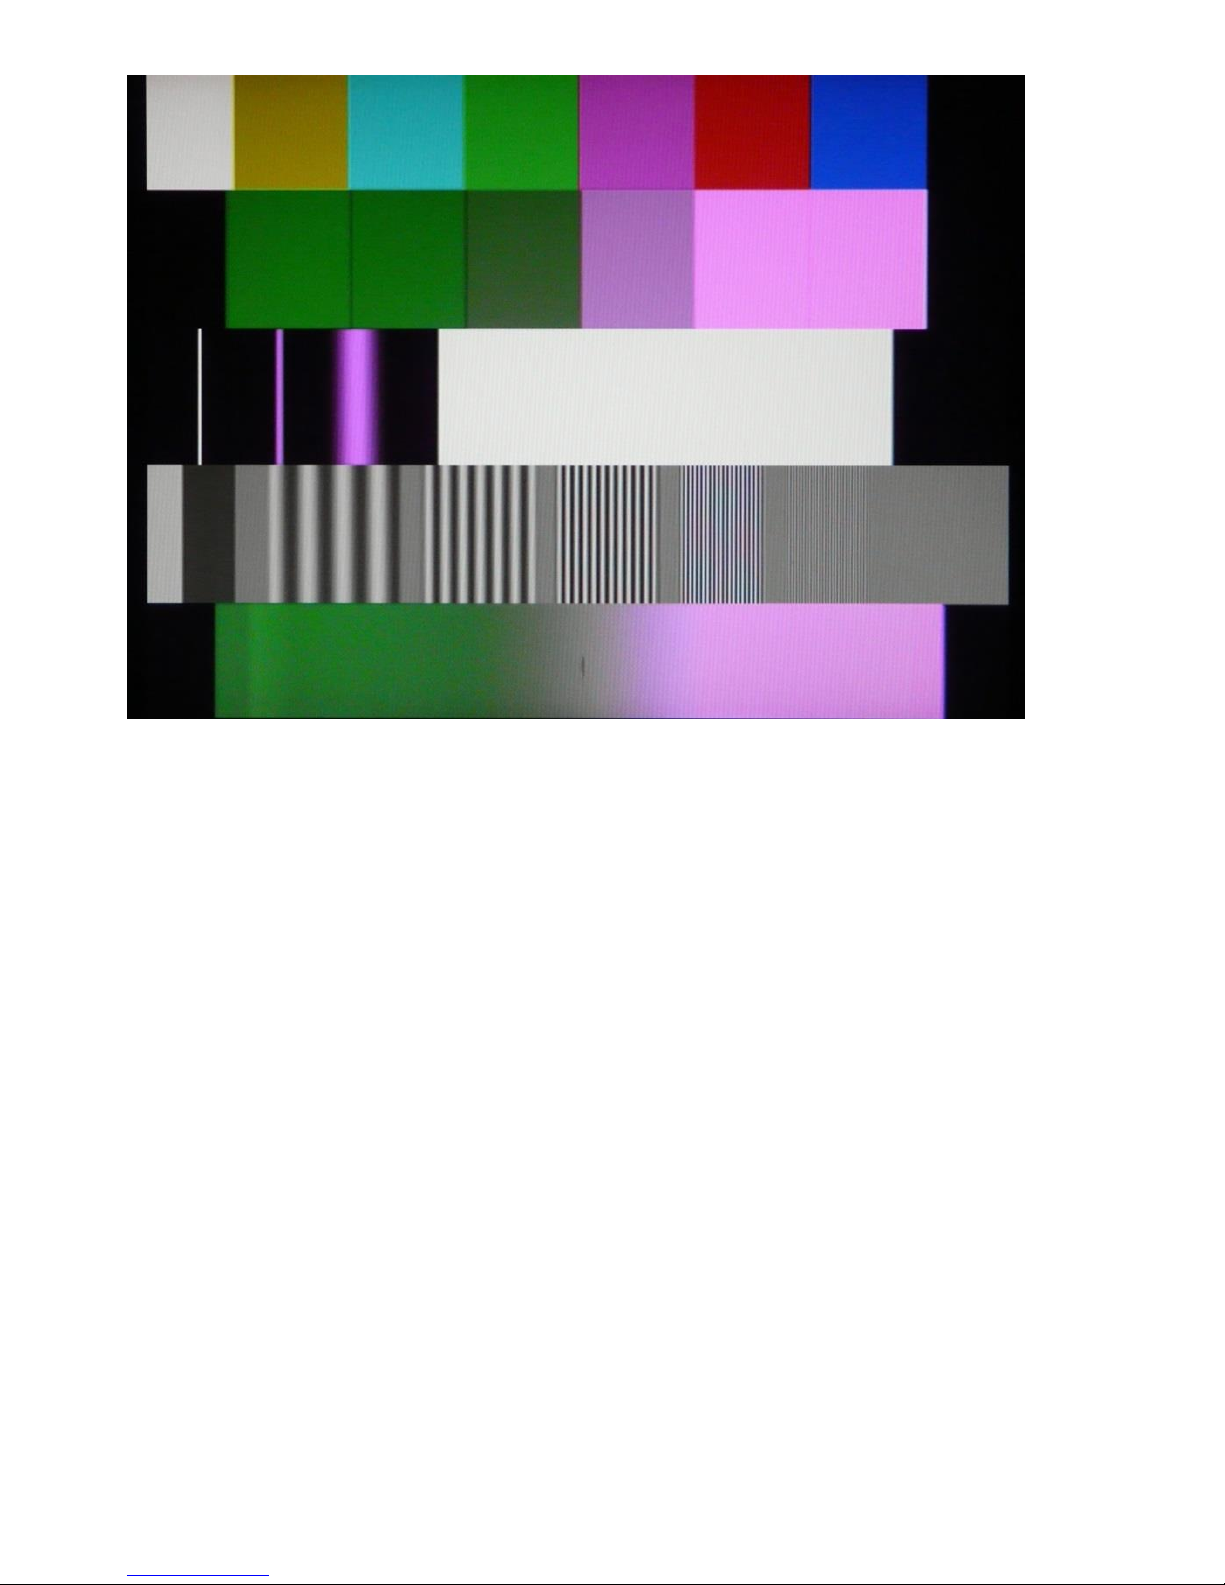
Matrix
The matrix test signal comprises five equally spaced patterns in one
combination test signal that permits a single test signal analysis of a video
component or system. The five signals are: 75% colour bars, 5 step
modulated staircase, 2T/20T pulse and bar, luma multi-burst and modulated
ramp.
Page 36
36
Figure 24 Matrix test signal.
Zone Plate
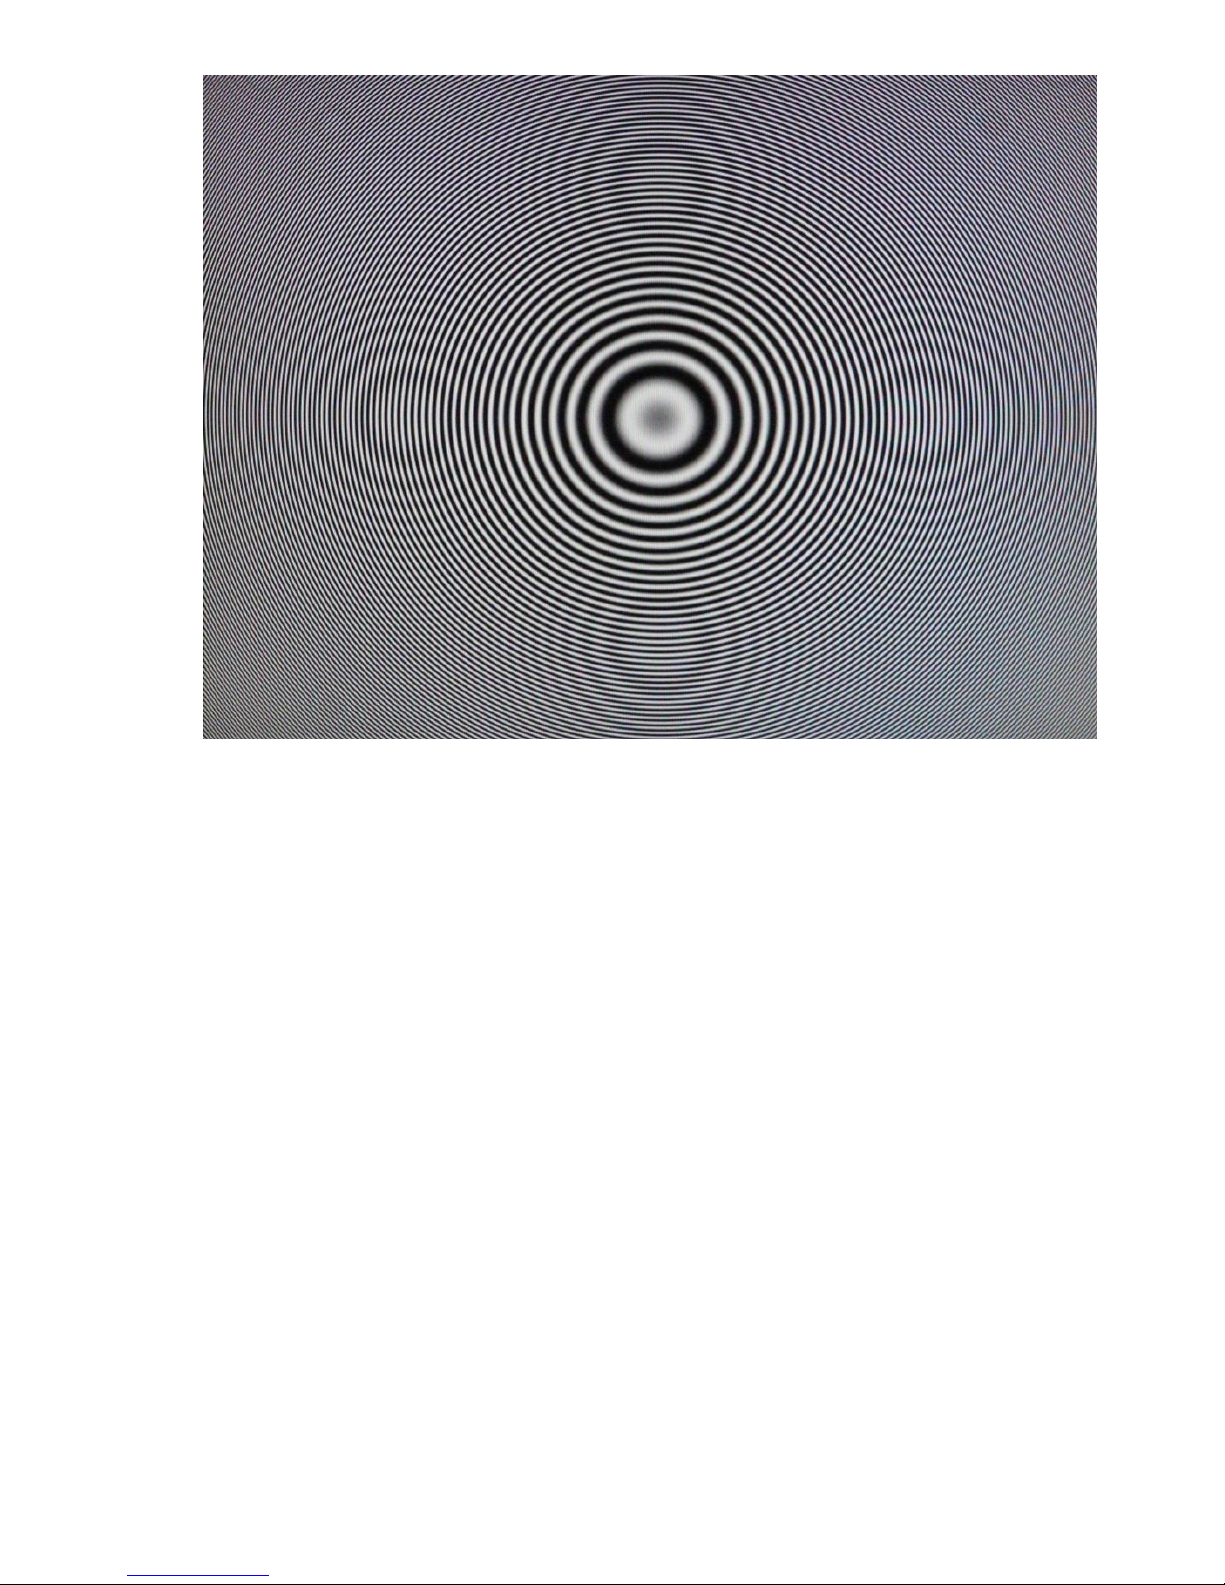
Those involved in optics are probably very familiar with the circular zone
plate. It is shown in Figure 25.
Page 37
37
Figure 25 The circular zone plate.
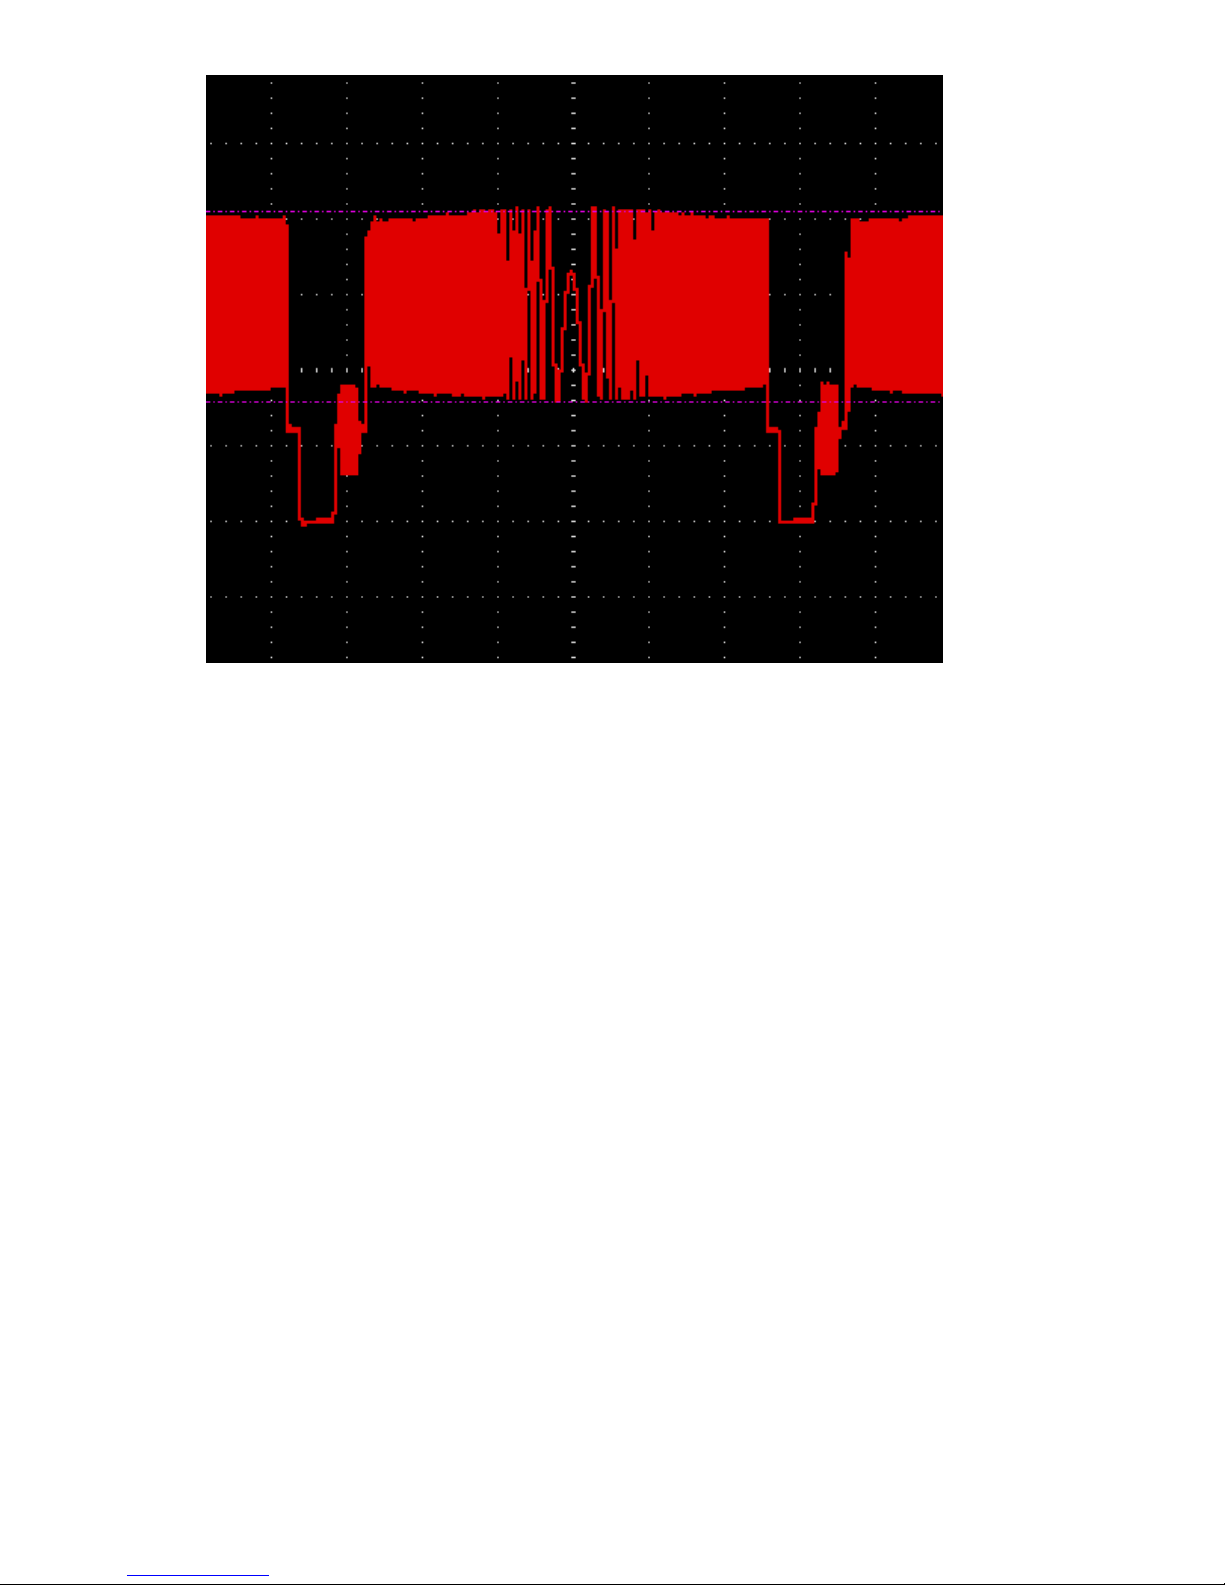
The zone plate is a two-dimensional linear frequency sweep with the
highest frequencies at the edges of the image. It can be used to measure
the horizontal and vertical frequency response of system. For example, in
figure 26, I show a horizontal line of video and you can clearly see that the
left and right edges of the waveform droop, showing some high frequency
attenuation.
Page 38
38
Figure 26 The zone plate horizontal frequency response.
Attenuation on the left and right edges of the image show low pass filtering
of the image; attenuation of the top and bottom of the image show vertical
filtering, perhaps line to line averaging or issues with a scaler or deinterlacer.
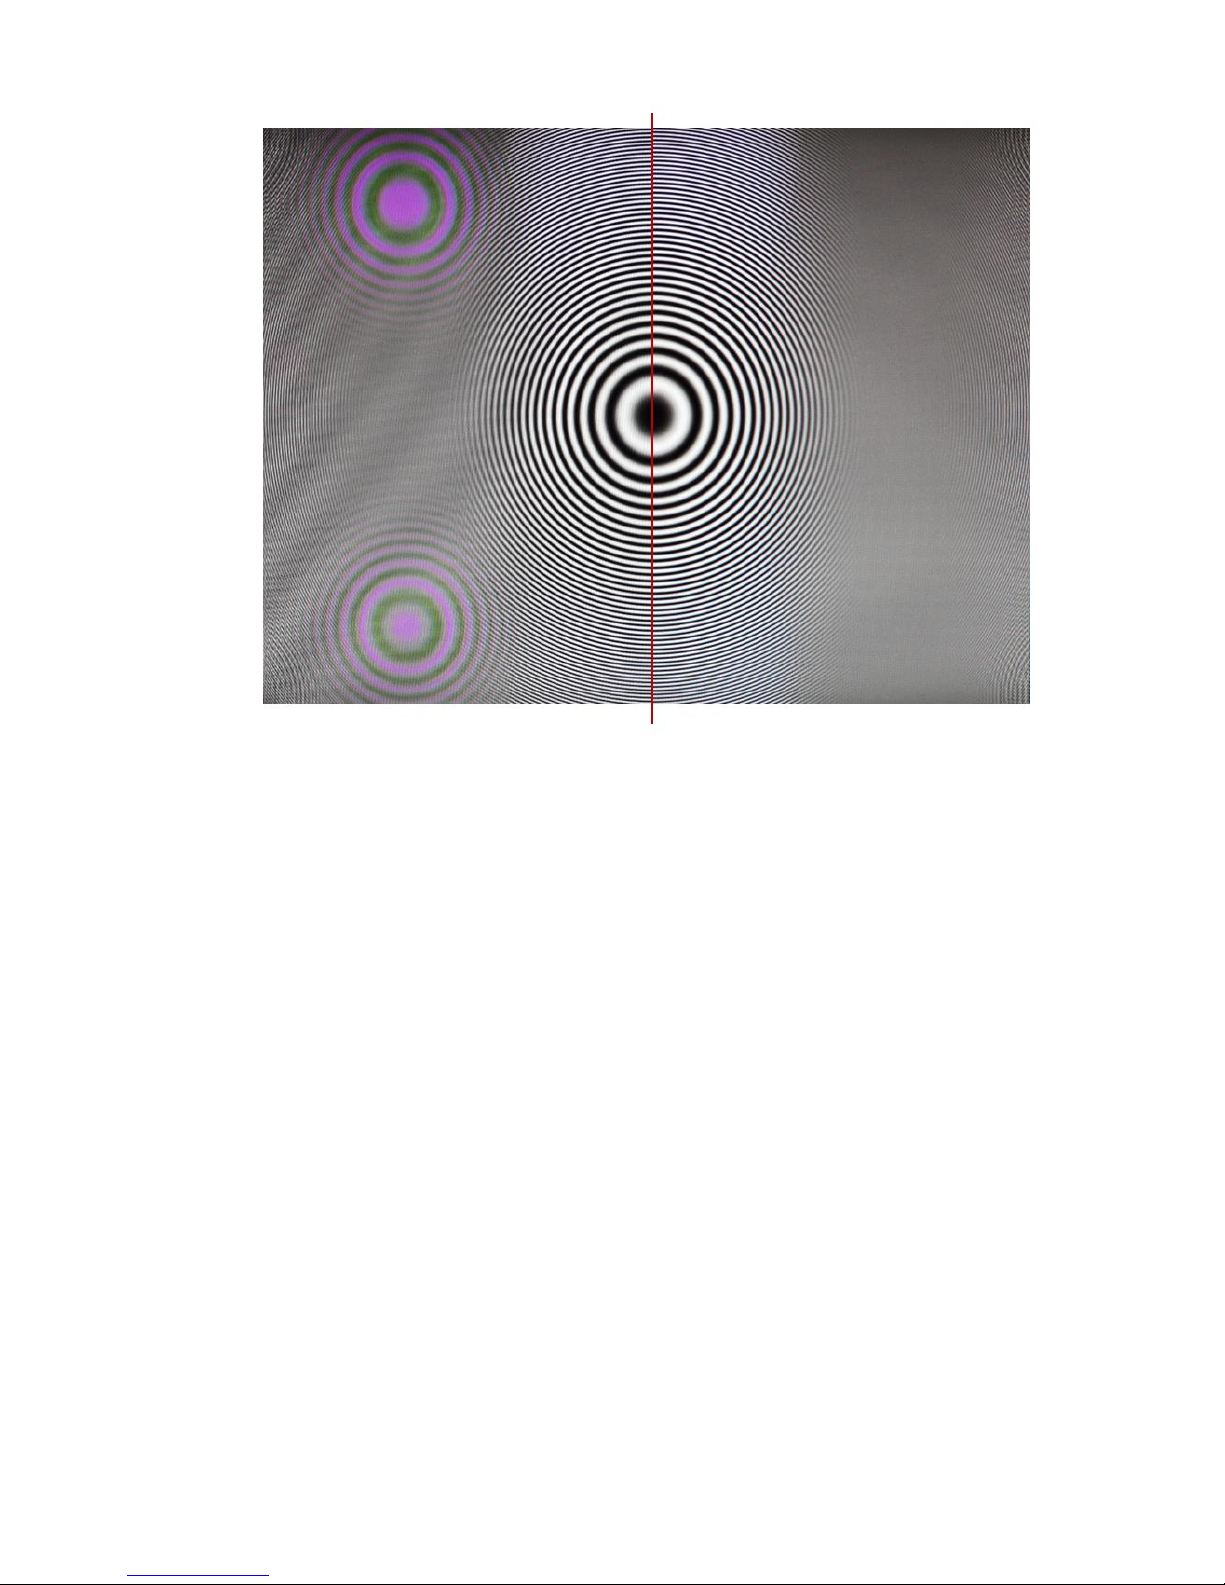
The zone plate is very useful for designing and testing composite analogue
video decoders. Even a conventional line comb decoder will not be able to
separate chominance and luminance of the same frequency because of the
non-repetitive nature of the pattern (each horizontal line is different to the
ones adjacent to it). This will result in cross-colour effects as shown in
Figure 27.
Page 39
39
Figure 27 Left side: The zone plate shows flickering colours at the
subcarrier frequency as the line comb fails on the zone plate image.
Although the frame comb decoder shows no artifacts when the zone plate is
still, if we move the zone plate in time similar corruption of the image will
occur. The moving zone plate is the test image from hell for an analogue
video decoder. The position of the defect in the zone plate can tell us what
the problem in the video processing can be, e.g. it can show us the
frequency of an aliasing component.
The zone plate’s use is not just restricted to analogue video decoding. Any
video processing which manipulates the image spatially and/or temporally
can be tested to breaking point with the zone plate: such processing
includes video standards conversion, de-interlacing and scaling.
H sweep/V sweep/Zone Pl (NTSC1280/PAL1280 only)
Pressing the select button sequentially selects either a horizontal frequency
sweep, a vertical frequency sweep or a circular zone plate pattern. The
upper frequency of the horizontal sweep can be controlled using the ‘H
Freq’ control.
Page 40

40
H Freq (NTSC1280/PAL1280 only)
Selects the upper range of the horizontal frequency sweep (this option
cannot be selected in vertical sweep or zone plate mode). The range is 0Hz
(flat field) to 12.0MHz in 0.1MHz steps. The default value is 1.0MHz.
Page 41
41
5. SM01 Noise generator
SM01 has two noise generators that can add noise to the CVBS output.
The first of these uses a pseudo-random number generator to create white
noise. A programmable amount of this noise is added to the luma
component of the composite output. The noise can be added to the entire
video signal (including the sync and blanking) or just to the active video
(using the Video/Video+S select option). The maximum noise setting adds
approximately 50dB of noise to the signal.
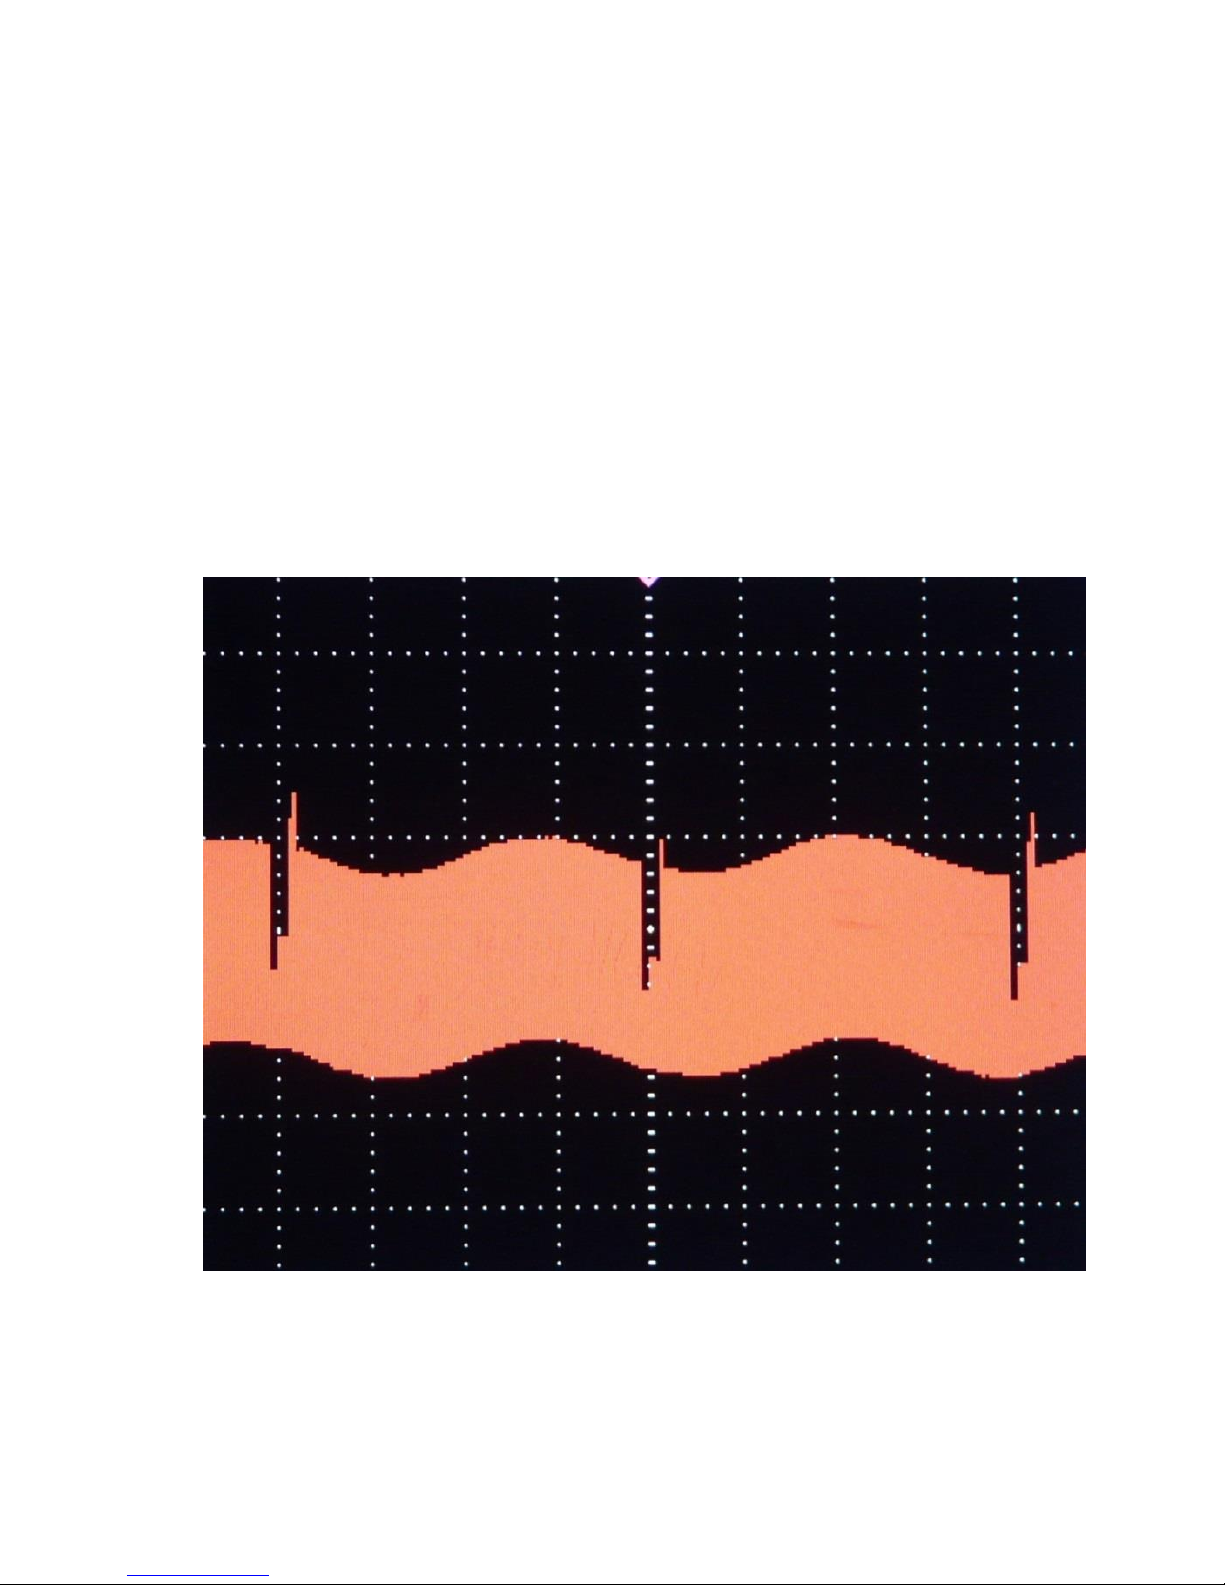
The second noise generator is a programmable frequency (50Hz or 60Hz)
hum generator. Figure 28 shows the hum generator on the CVBS output
across a frame of video.
Figure 28 Hum generator.
Page 42
42
Appendix A: SM01 specification
The SM01 CVBS specifications are shown in Table 8.
Parameter
Specification
Comments
PAL B,G,I,N
NTSC-M/J,
PAL-M
Frame Rate/Field
Rate
25Hz/50Hz
30Hz/60Hz
Line Period
64us
63.555555us
Lines/Frame
625
525
Line Blanking
Interval
12us
10.7us
Front Porch
1.5us
1.5us
1.65us for PAL-I
Line sync pulse
width
4.7us
4.7us
Back Porch
5.8us
4.5us
Equalising Pulse
width
2.35us
2.3us
Broad Pulse width
27.3us
27.0775us
Rise/Fall times of
sync edges
250ns
250ns
NTSC/PAL-M
rise time should
be 140ns.
Sync Pulse
amplitude
300mV
40IRE
Luminance white
bar amplitude
700mV
100IRE
Vertical Sync
Group
7.5 lines
9 lines
No. of equalizing
pulses
5 + 5
6 + 6
Chrominance
Phase error
<1deg
<1.5deg
Subcarrier
Frequency
4.43361875MHz
(PAL)
3.58205625MHz
(PAL-N)
3.5795455MHz
(NTSC)
3.5756118MHz
(PAL-M)
Colour Frame
duration
8 fields
4 fields
8 fields for PALM
Burst start
5.64us
5.31us
5.3us for PAL-N
Page 43
43
Burst duration
2.25us
2.51us
2.51us for PALN
Burst Amplitude
300mV
40IRE
Differential Gain
<1%
<1%
Sin x/x corrected
Differential Phase
<1deg
<1deg
Sin x/x corrected
K Factor (2T)
<1%
<1%
Chrominance
luminance delay
< +/- 5ns
< +/- 5ns
Signal to Noise
ratio
-70dB (50%
grey input)
-70dB (50%
grey).
Unweighted
Table 8 NTSC/PAL timing specifications.
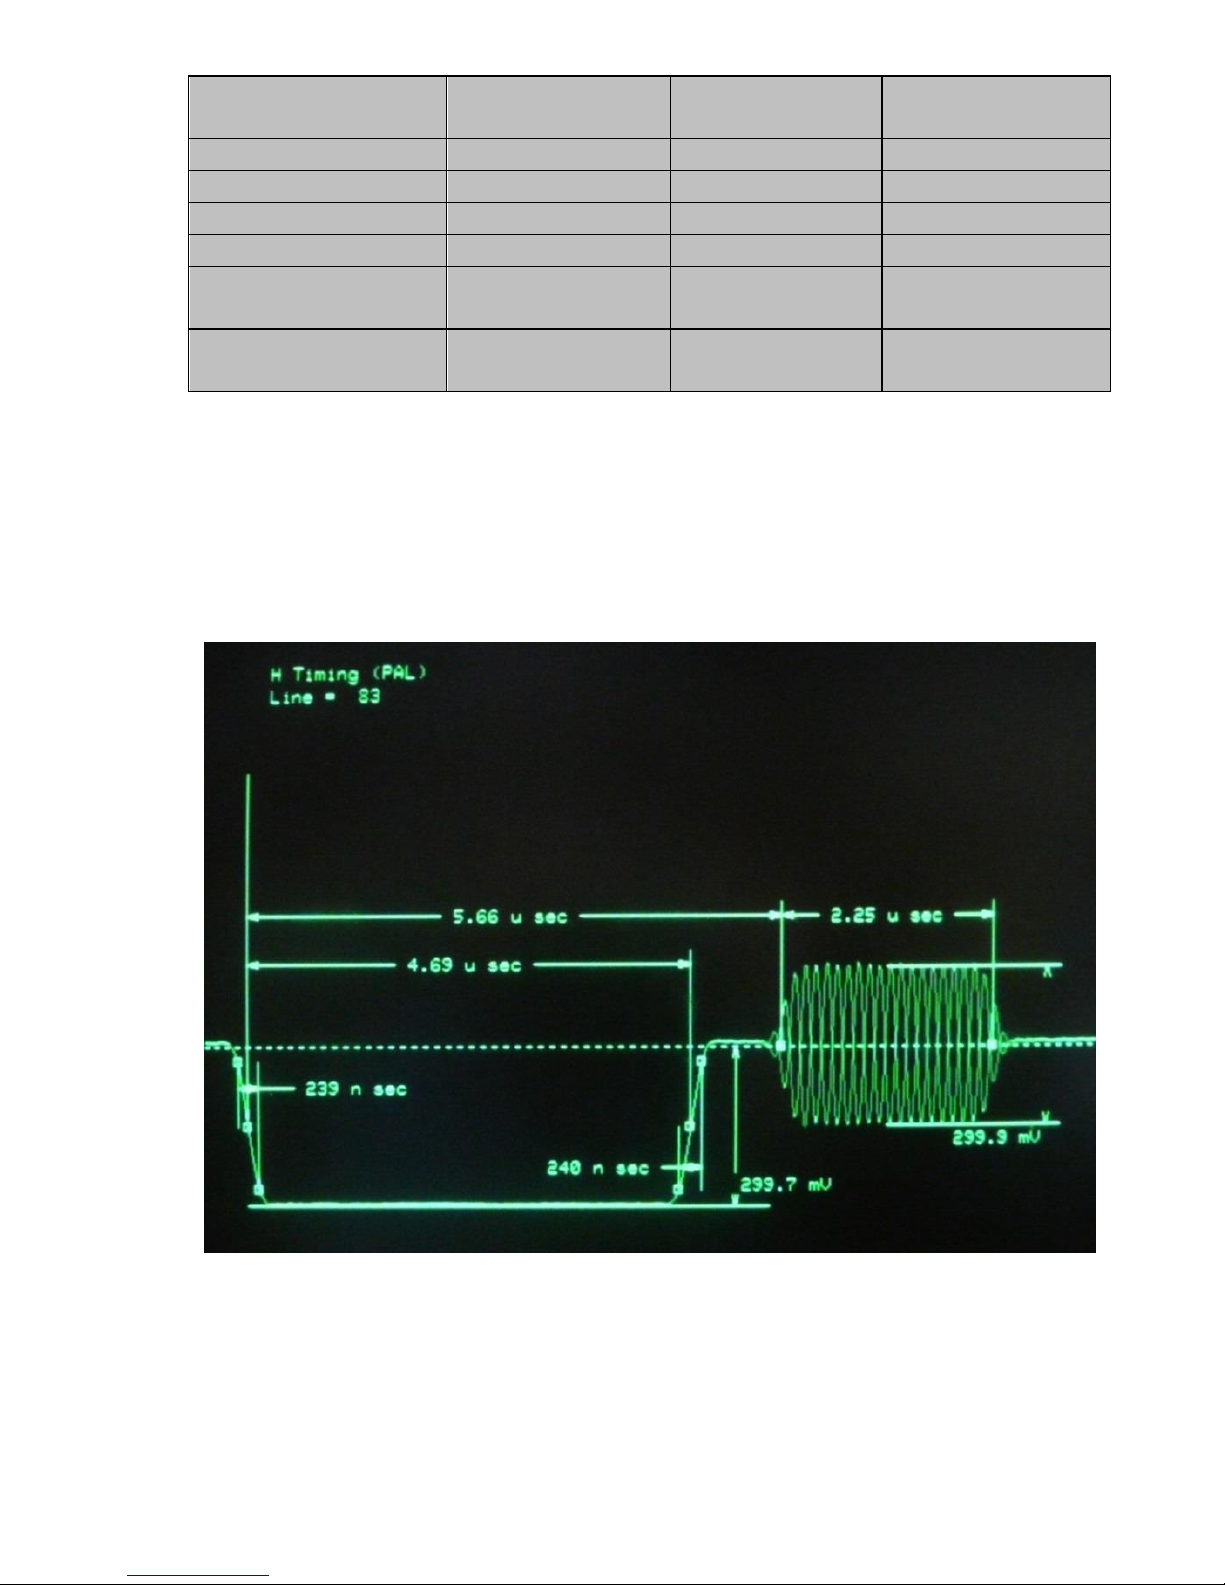
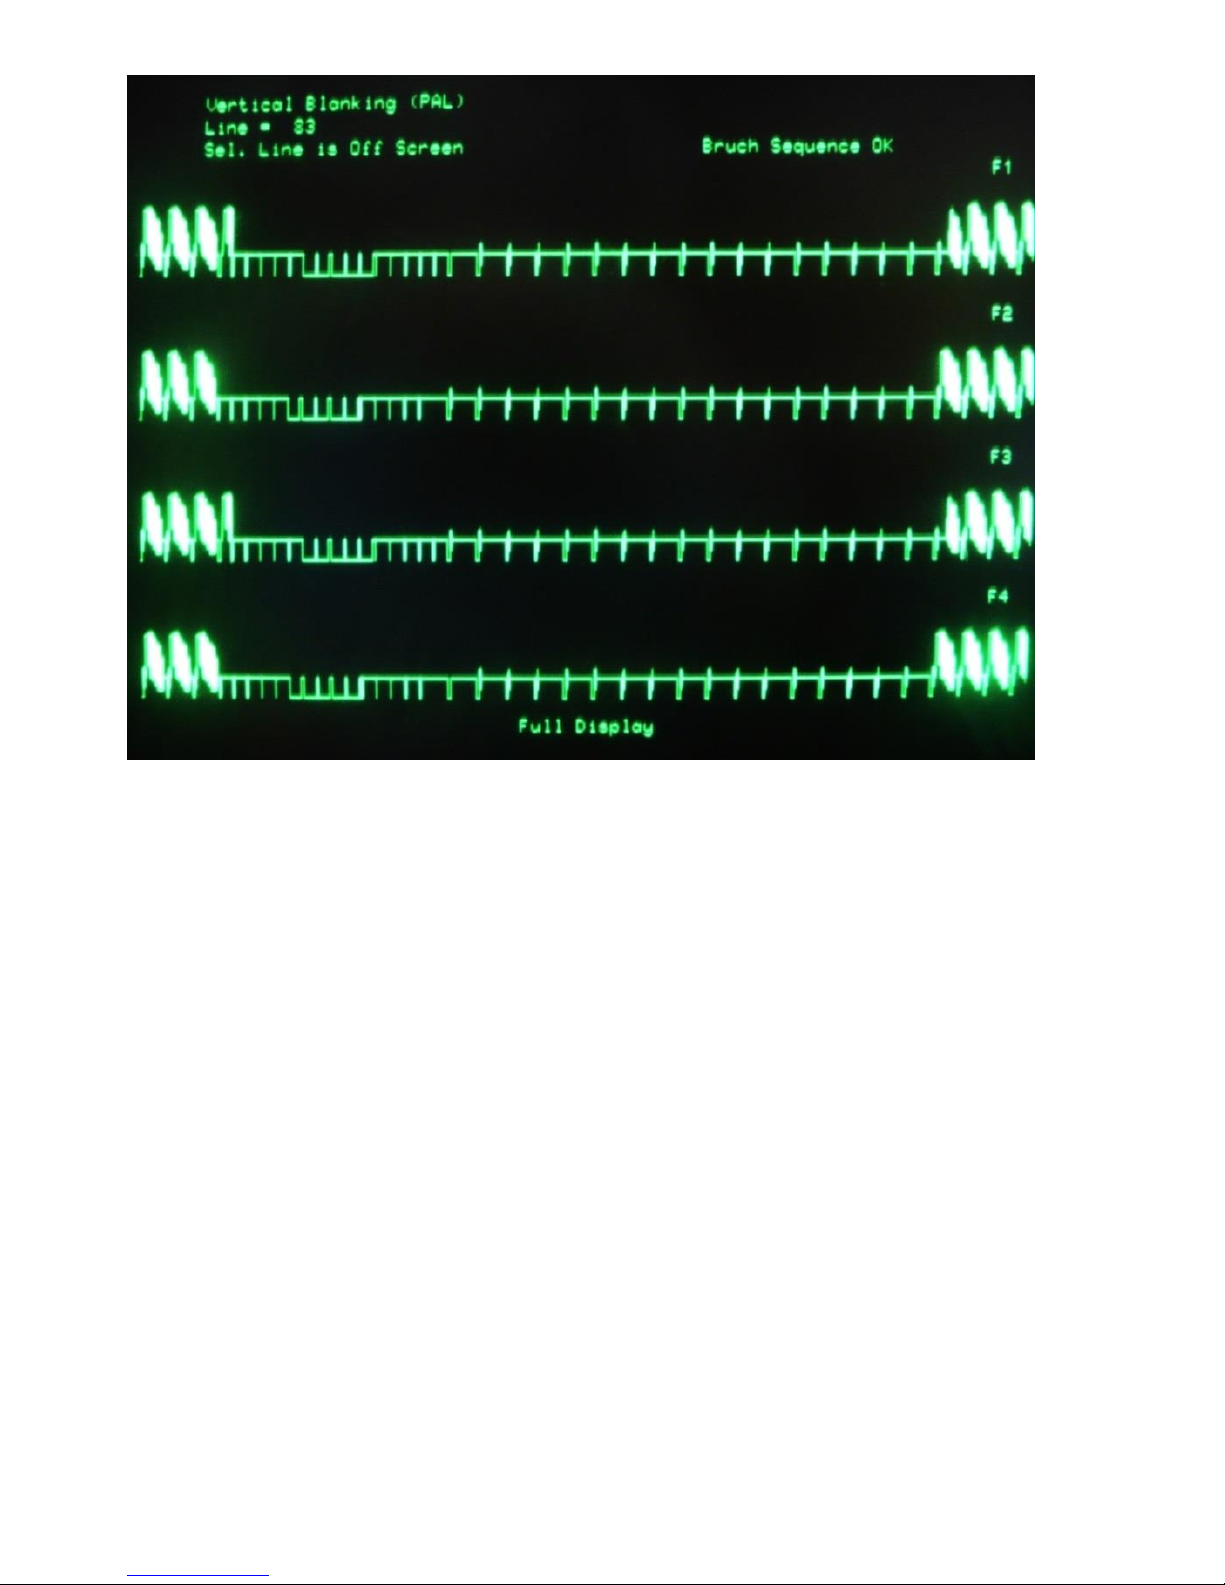
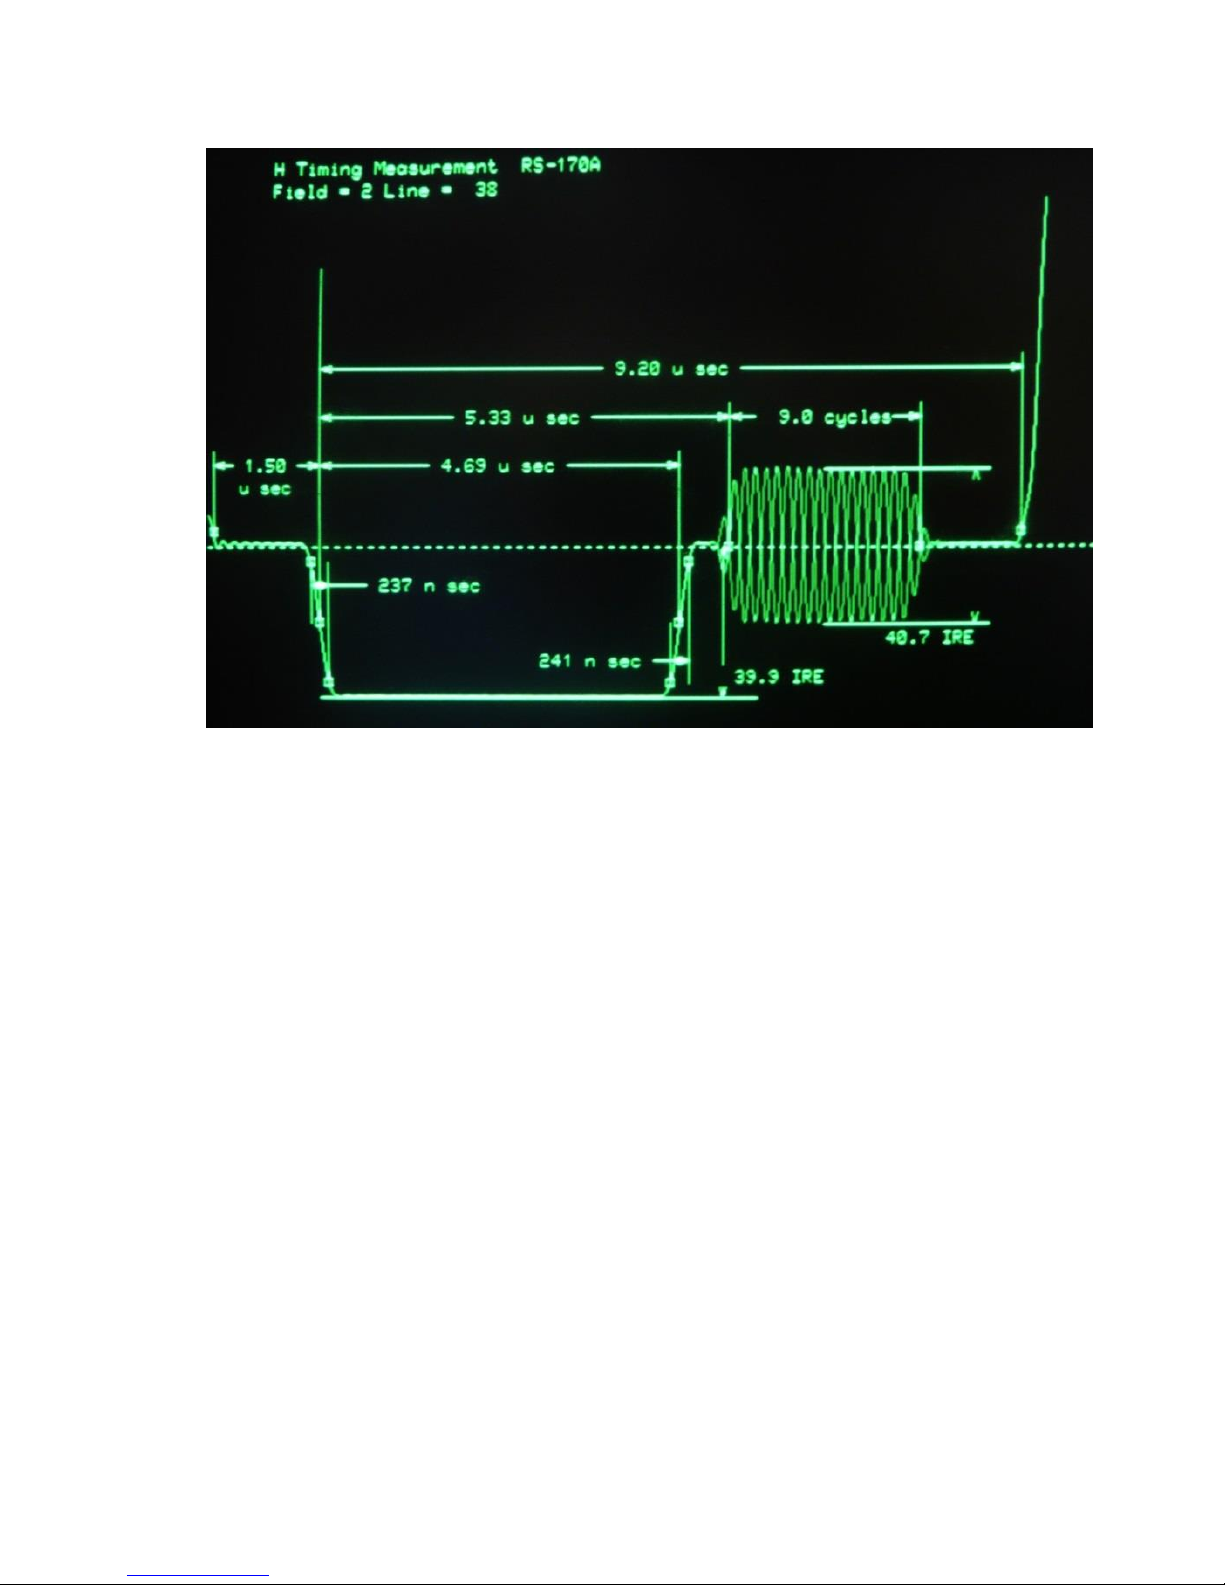
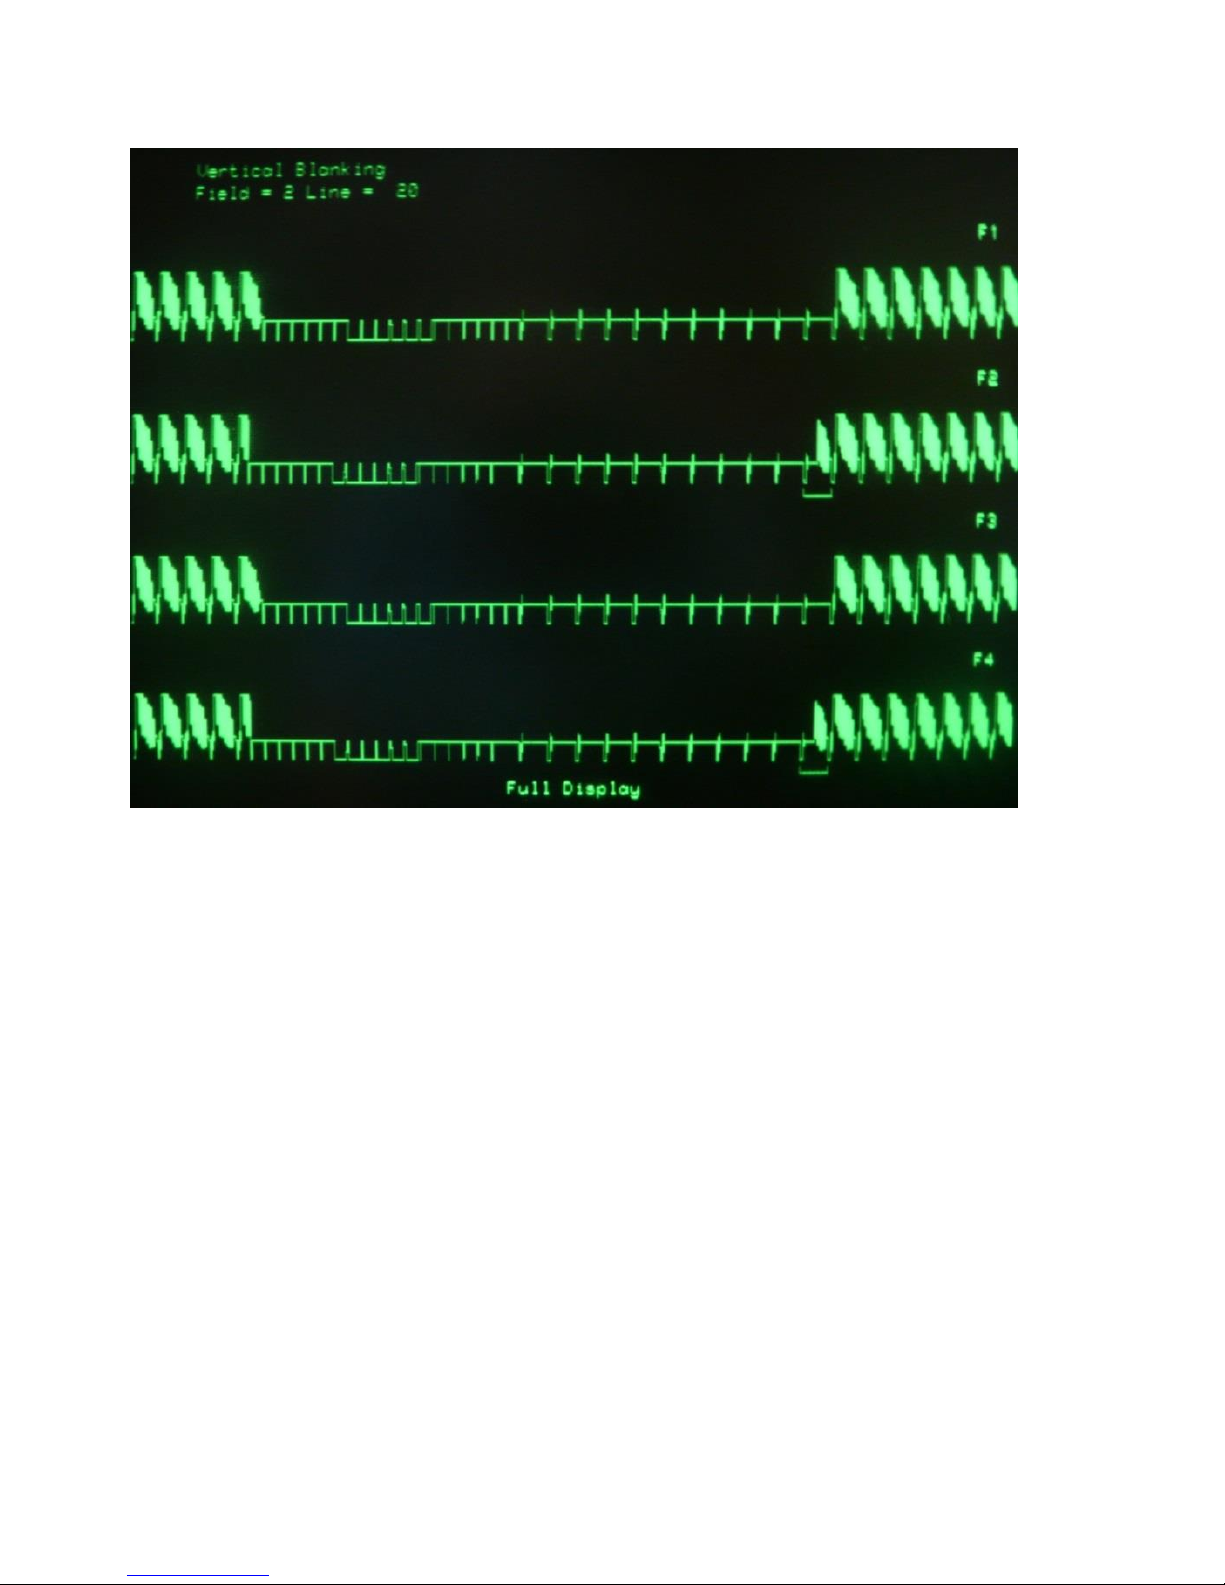
The measured horizontal and vertical output timings for PAL and NTSC
composite outputs are shown in Figures 29 to 32.
Figure 29 PAL horizontal timing (composite output).
Page 44
44
Figure 30 PAL vertical timing (composite output).
Page 45
45
Figure 31 NTSC Horizontal timing (composite output).
Page 46
46
Figure 32 NTSC Vertical timing (composite output).
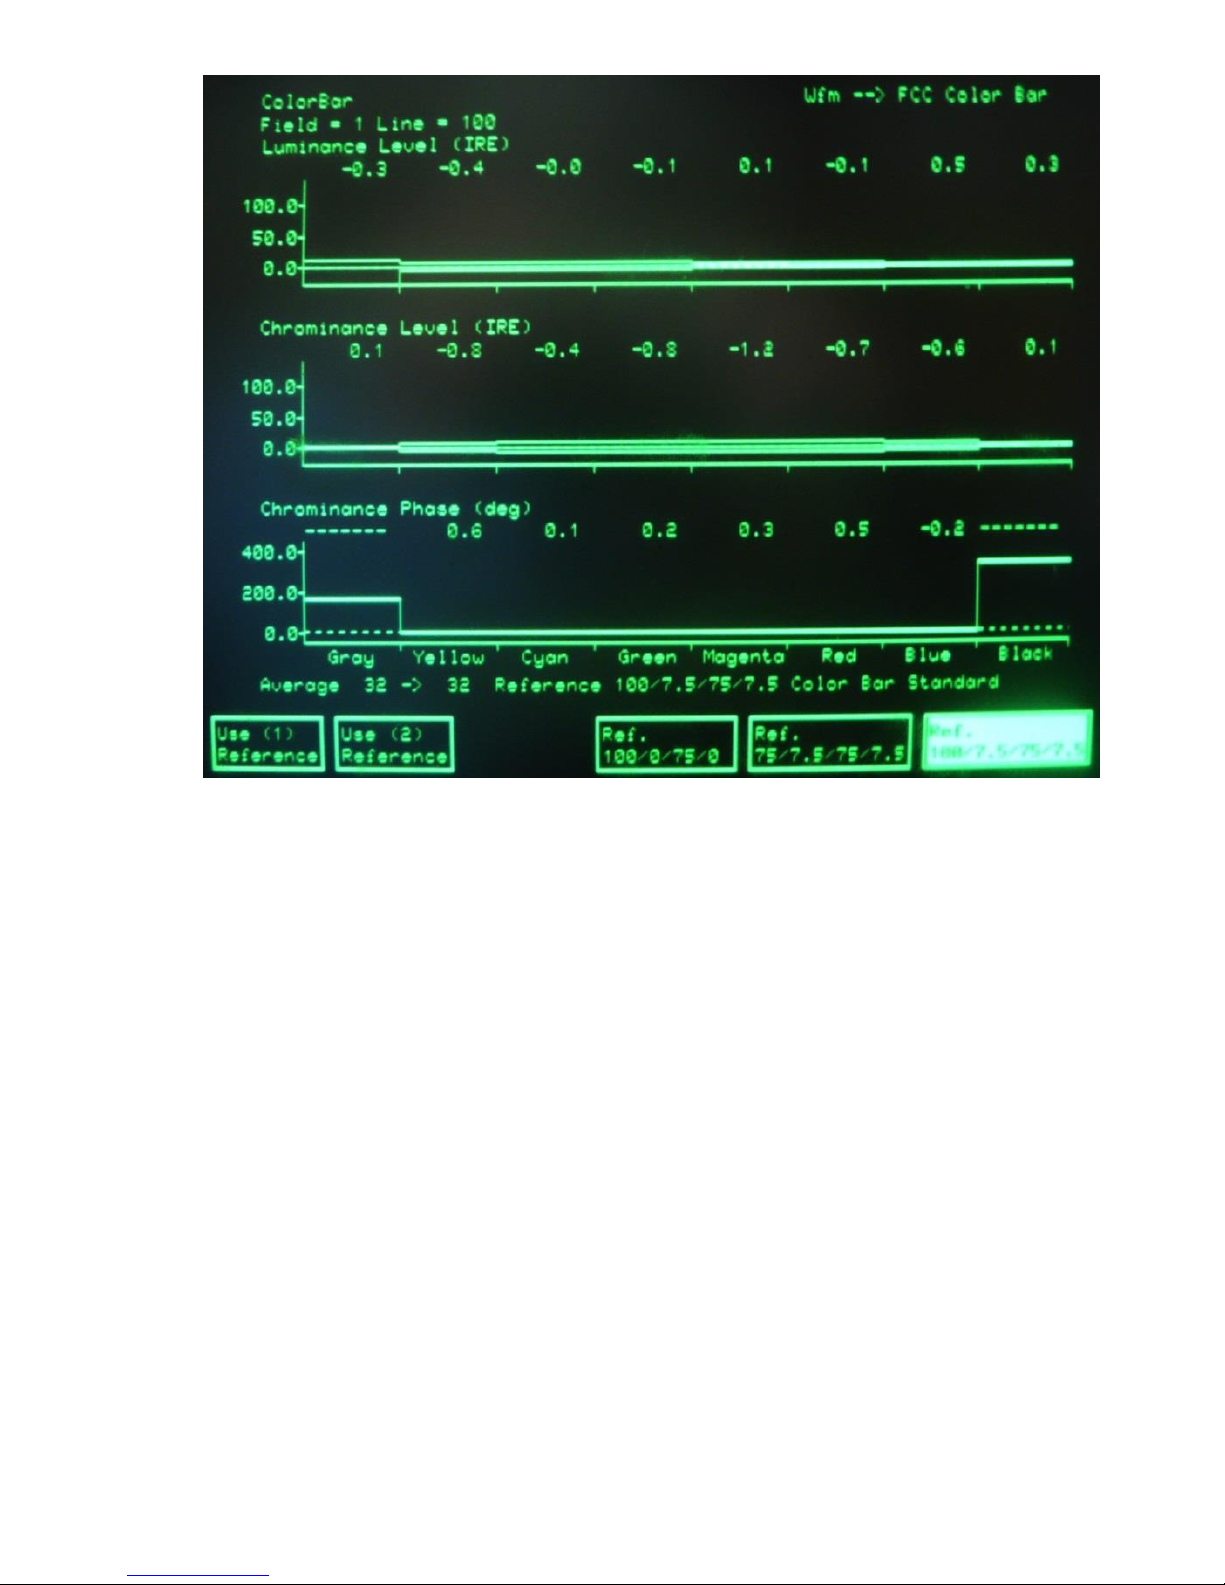
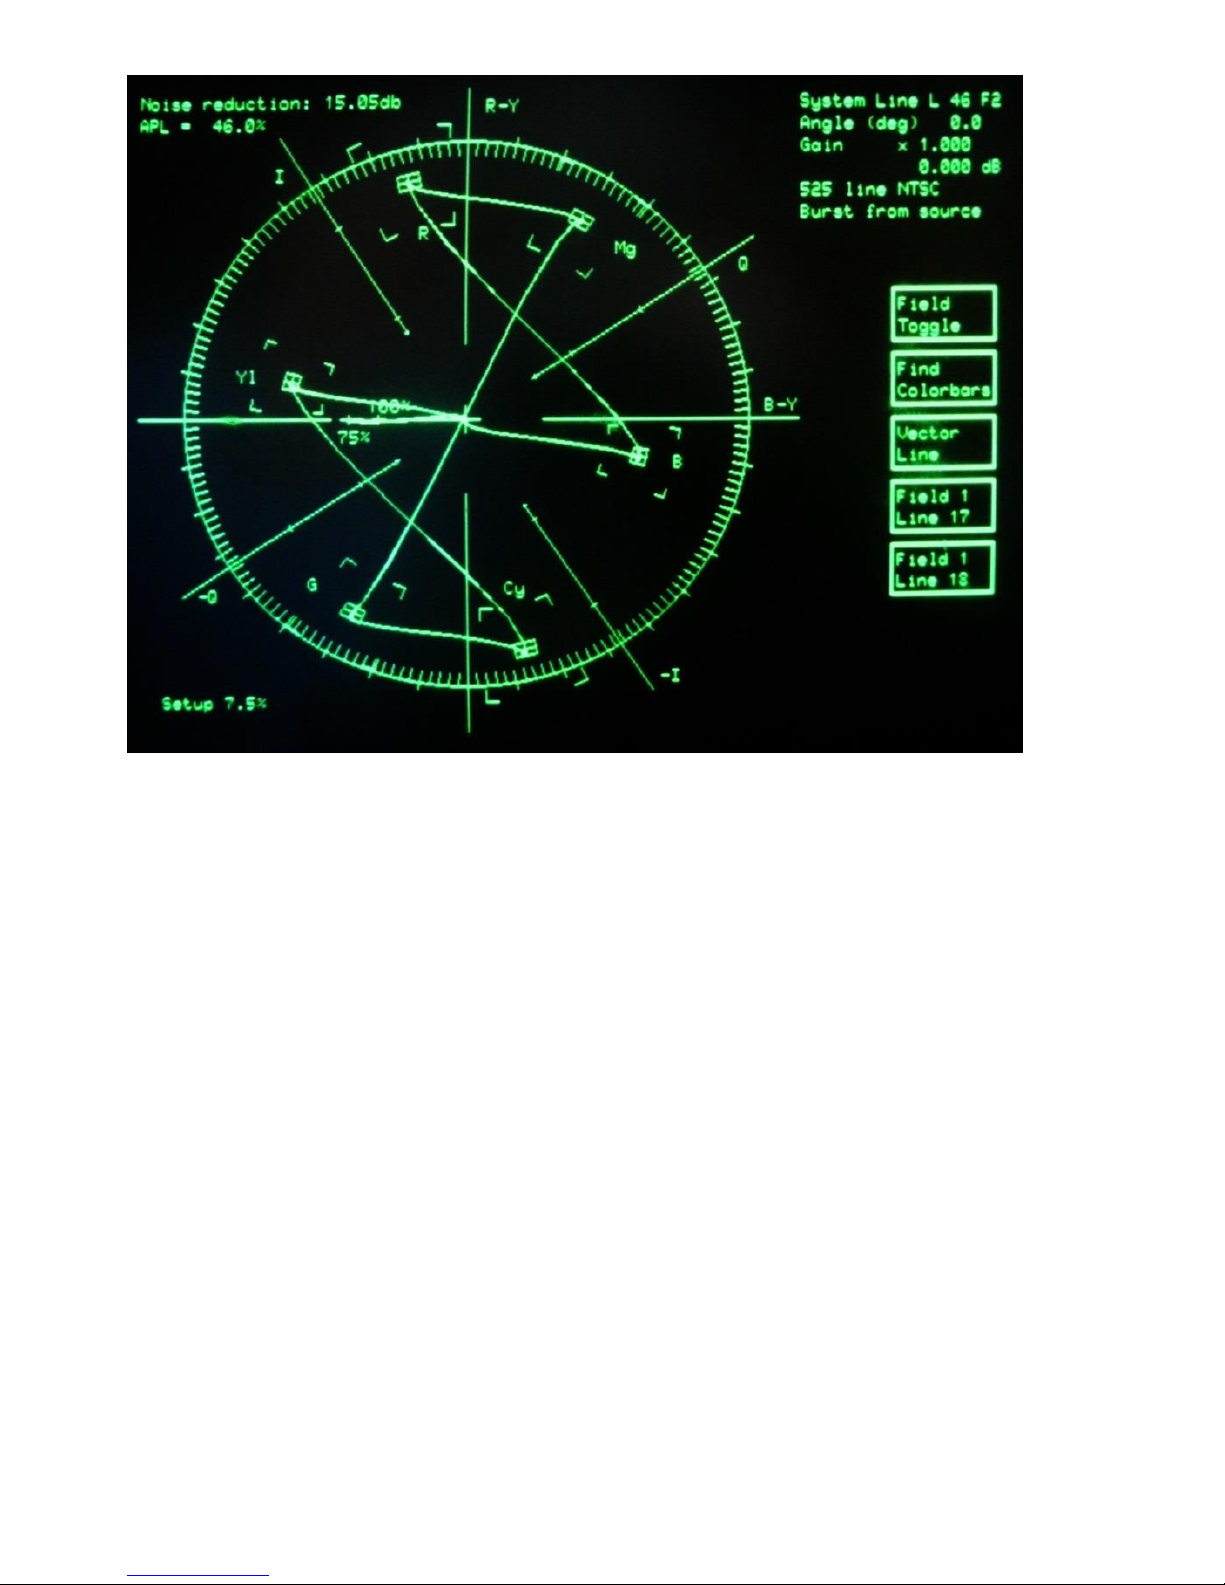
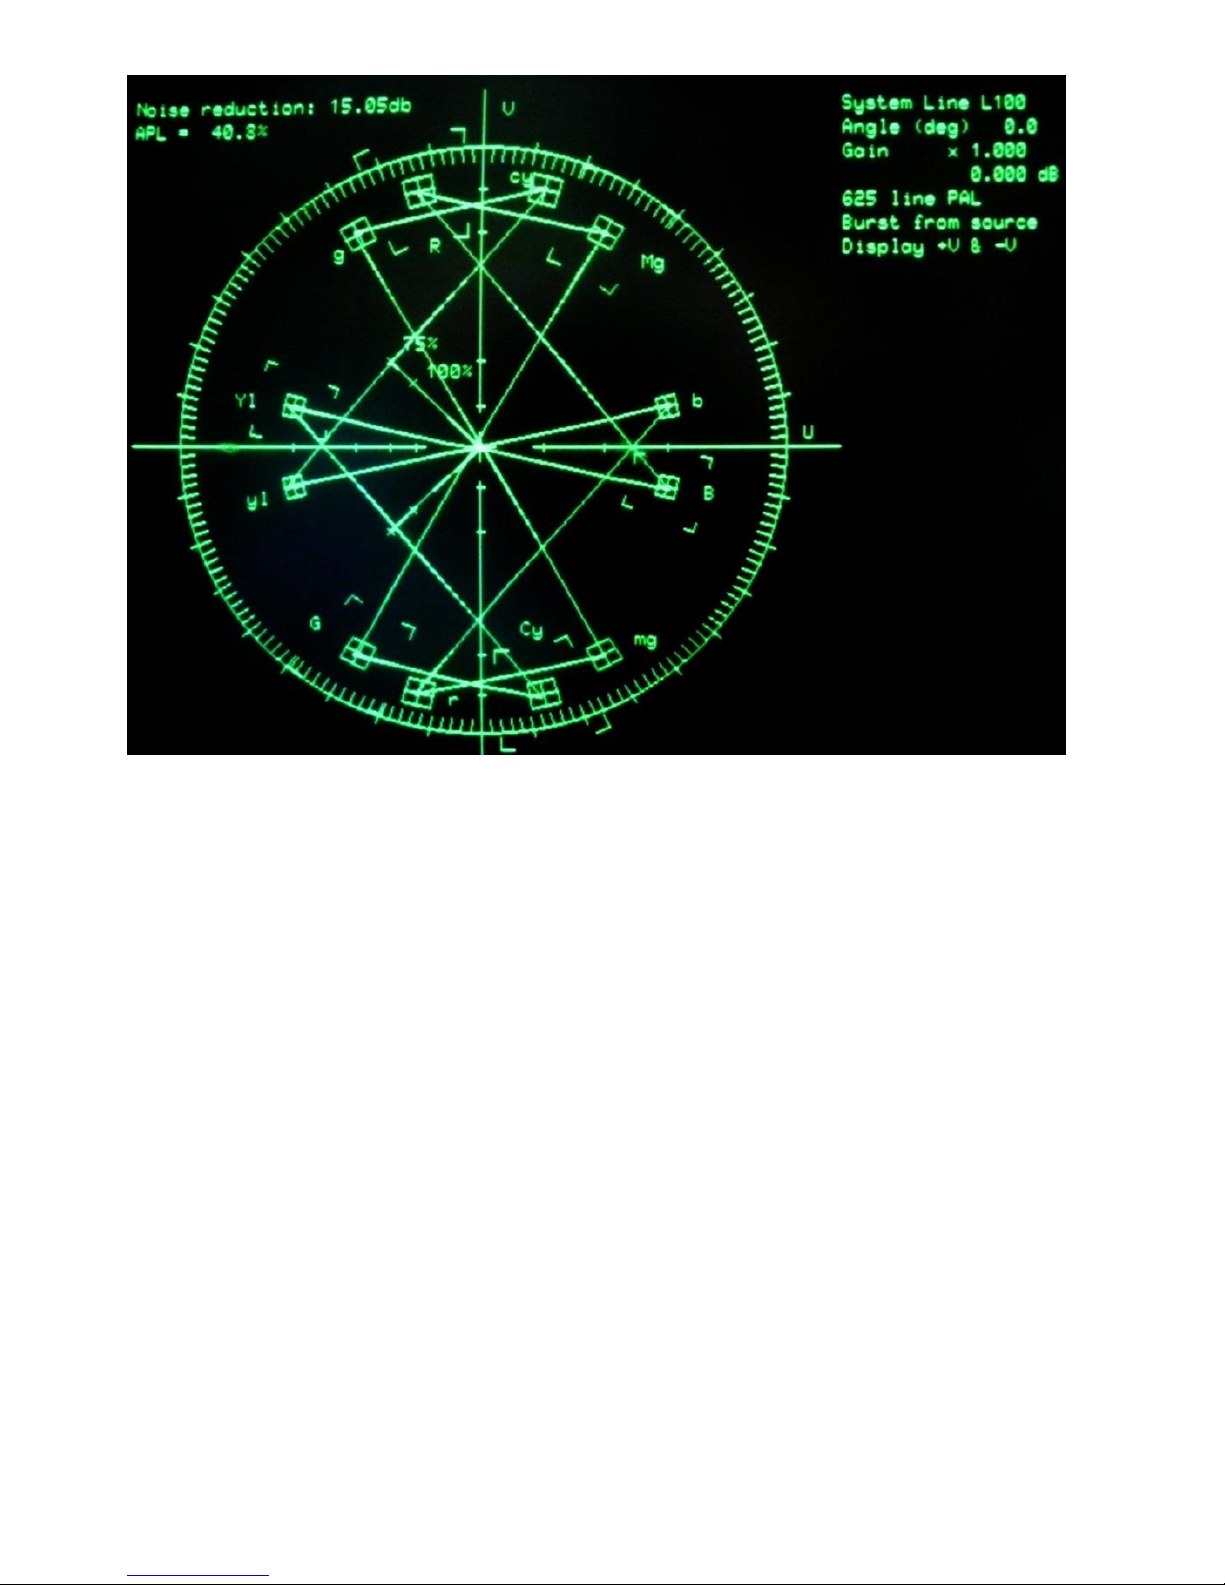
Figure 33, below, shows the 75% colour bar composite output of the SM01
compared with the reference levels of the Tektronix VM700 and the
corresponding vector diagram in Figure 34.
Page 47
47
Figure 33 NTSC 75% colour bar composite output.
Page 48
48
Figure 34 NTSC 75% colour bars vectors
Page 49
49
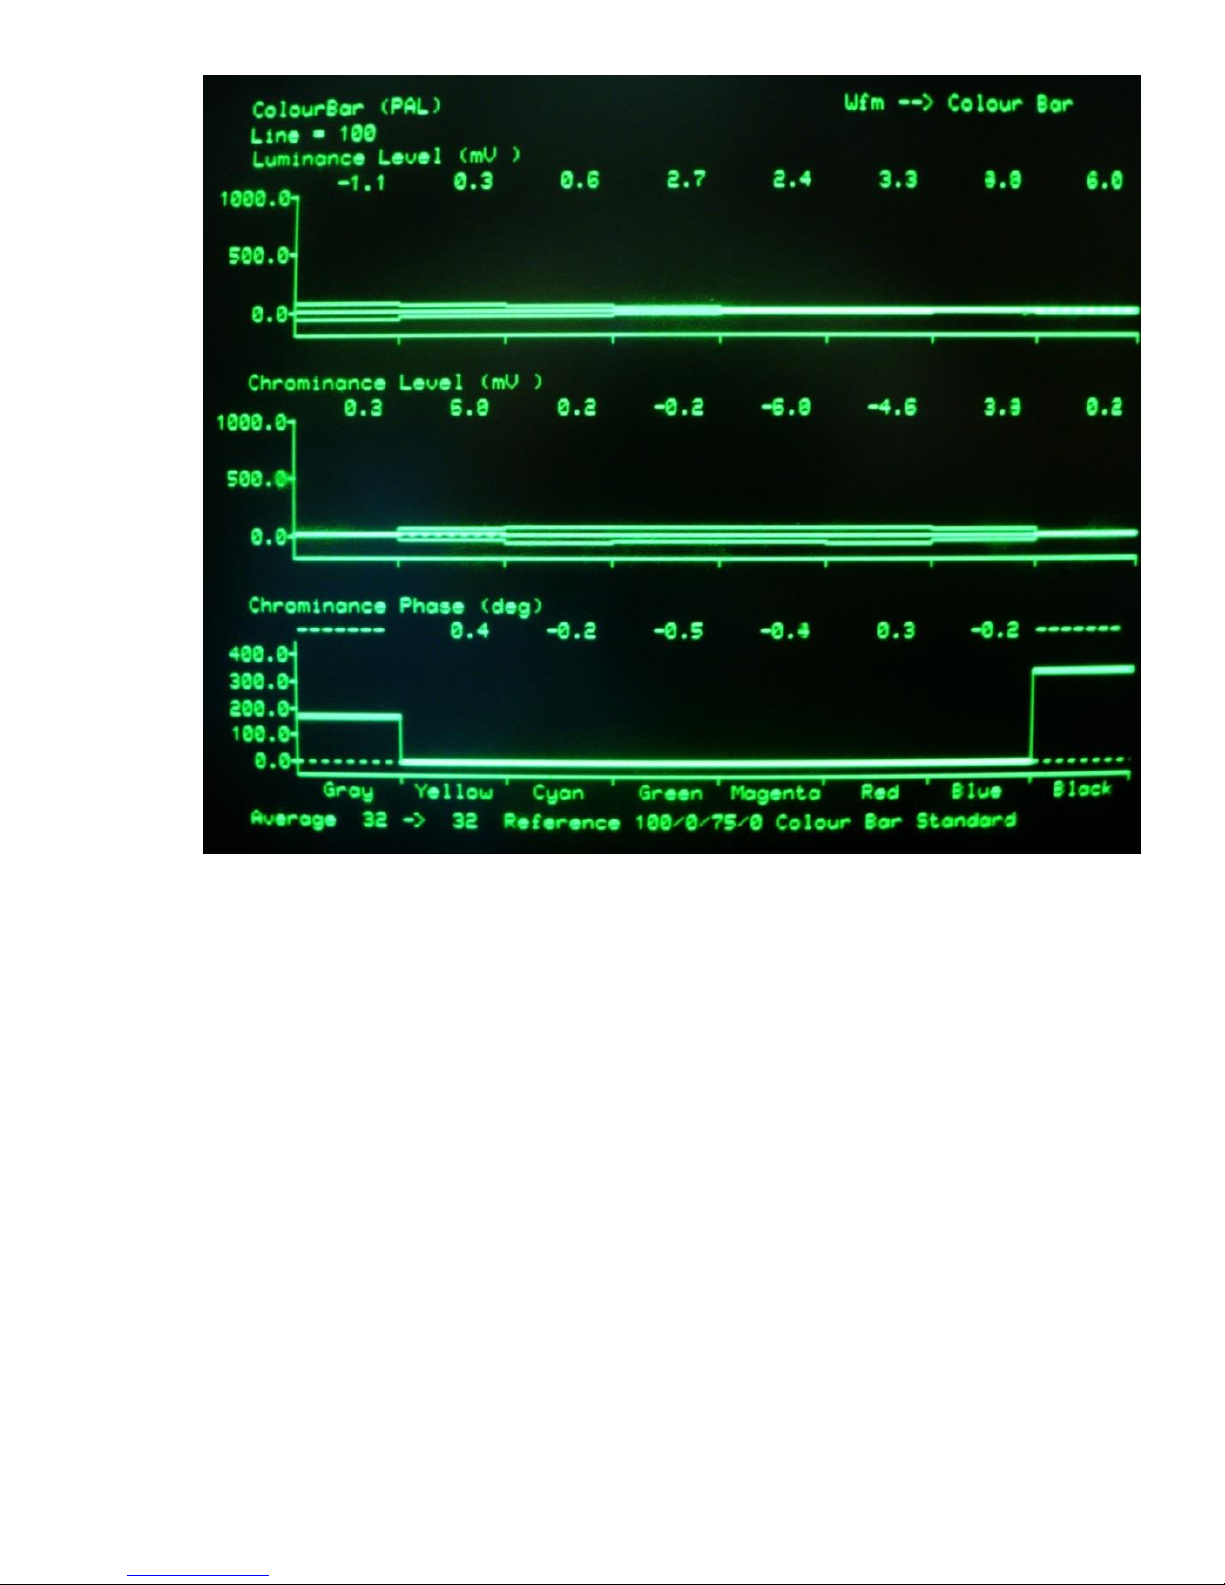
Figure 35 PAL 75% colour bars (composite output)
Page 50
50
Figure 36 PAL 75% colour bars vectors
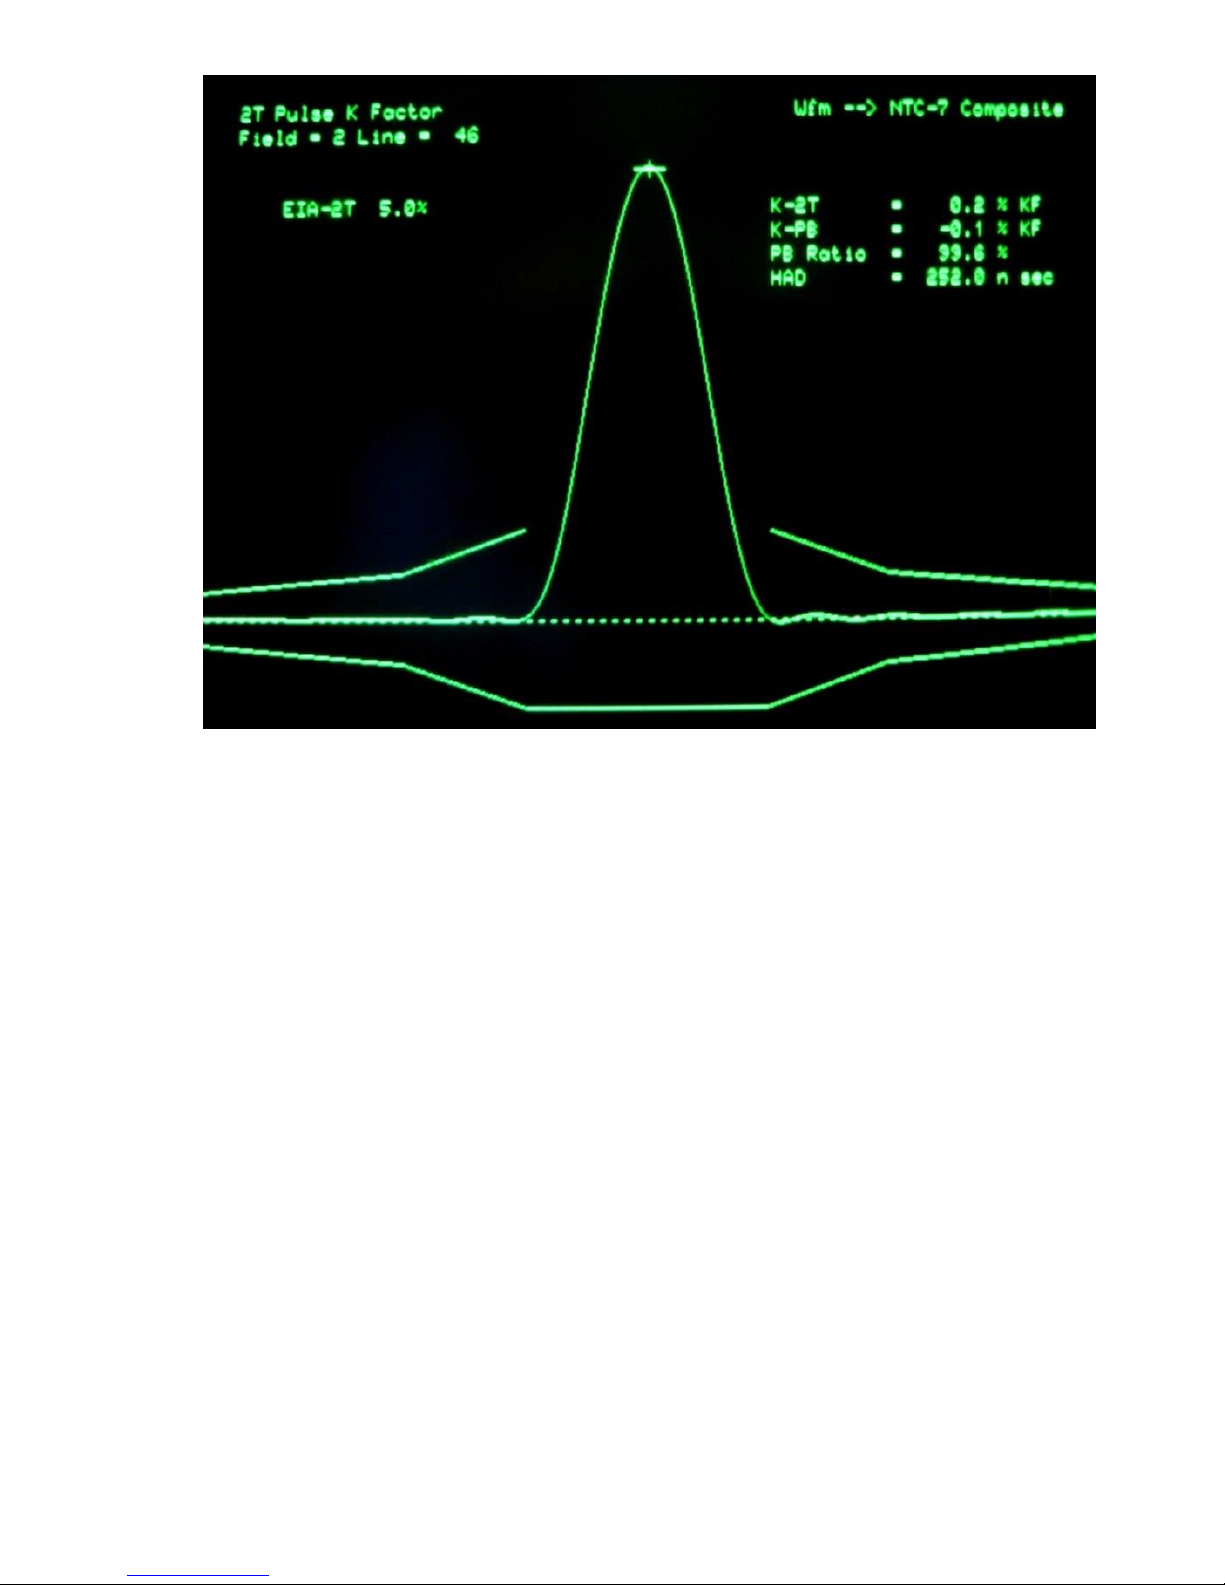
Figure 37 shows the K-factor (2T pulse) distortion measurement for the
SM01 measured on a Tektronix VM700 using the NTC-7 Composite test
signal.
Page 51
51
Figure 37 NTSC K_Factor measurement.
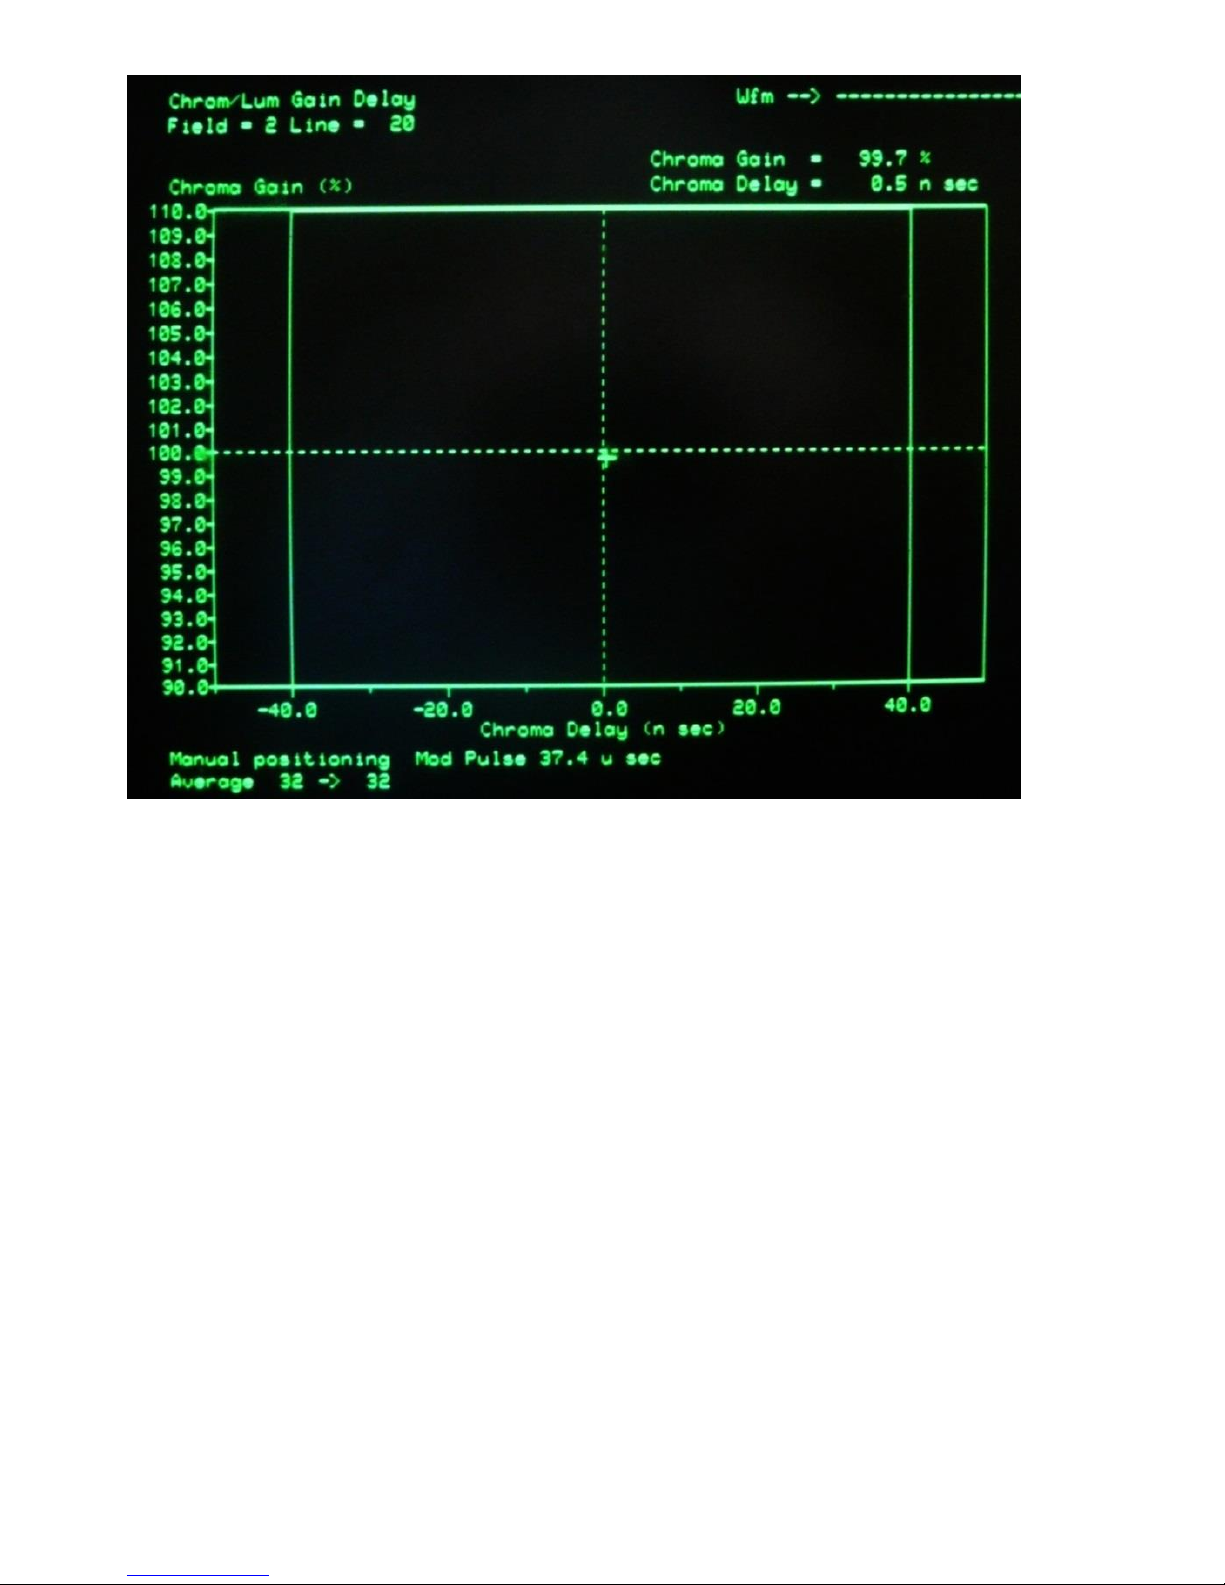
Figure 38 shows the luma/chroma delay and gain measurement for the
SM01 measured on a VM700 using the NTC-7 Composite test signal.
Page 52
52
Figure 38 NTSC NTC-7 Luma/Chroma delay/gain measurement
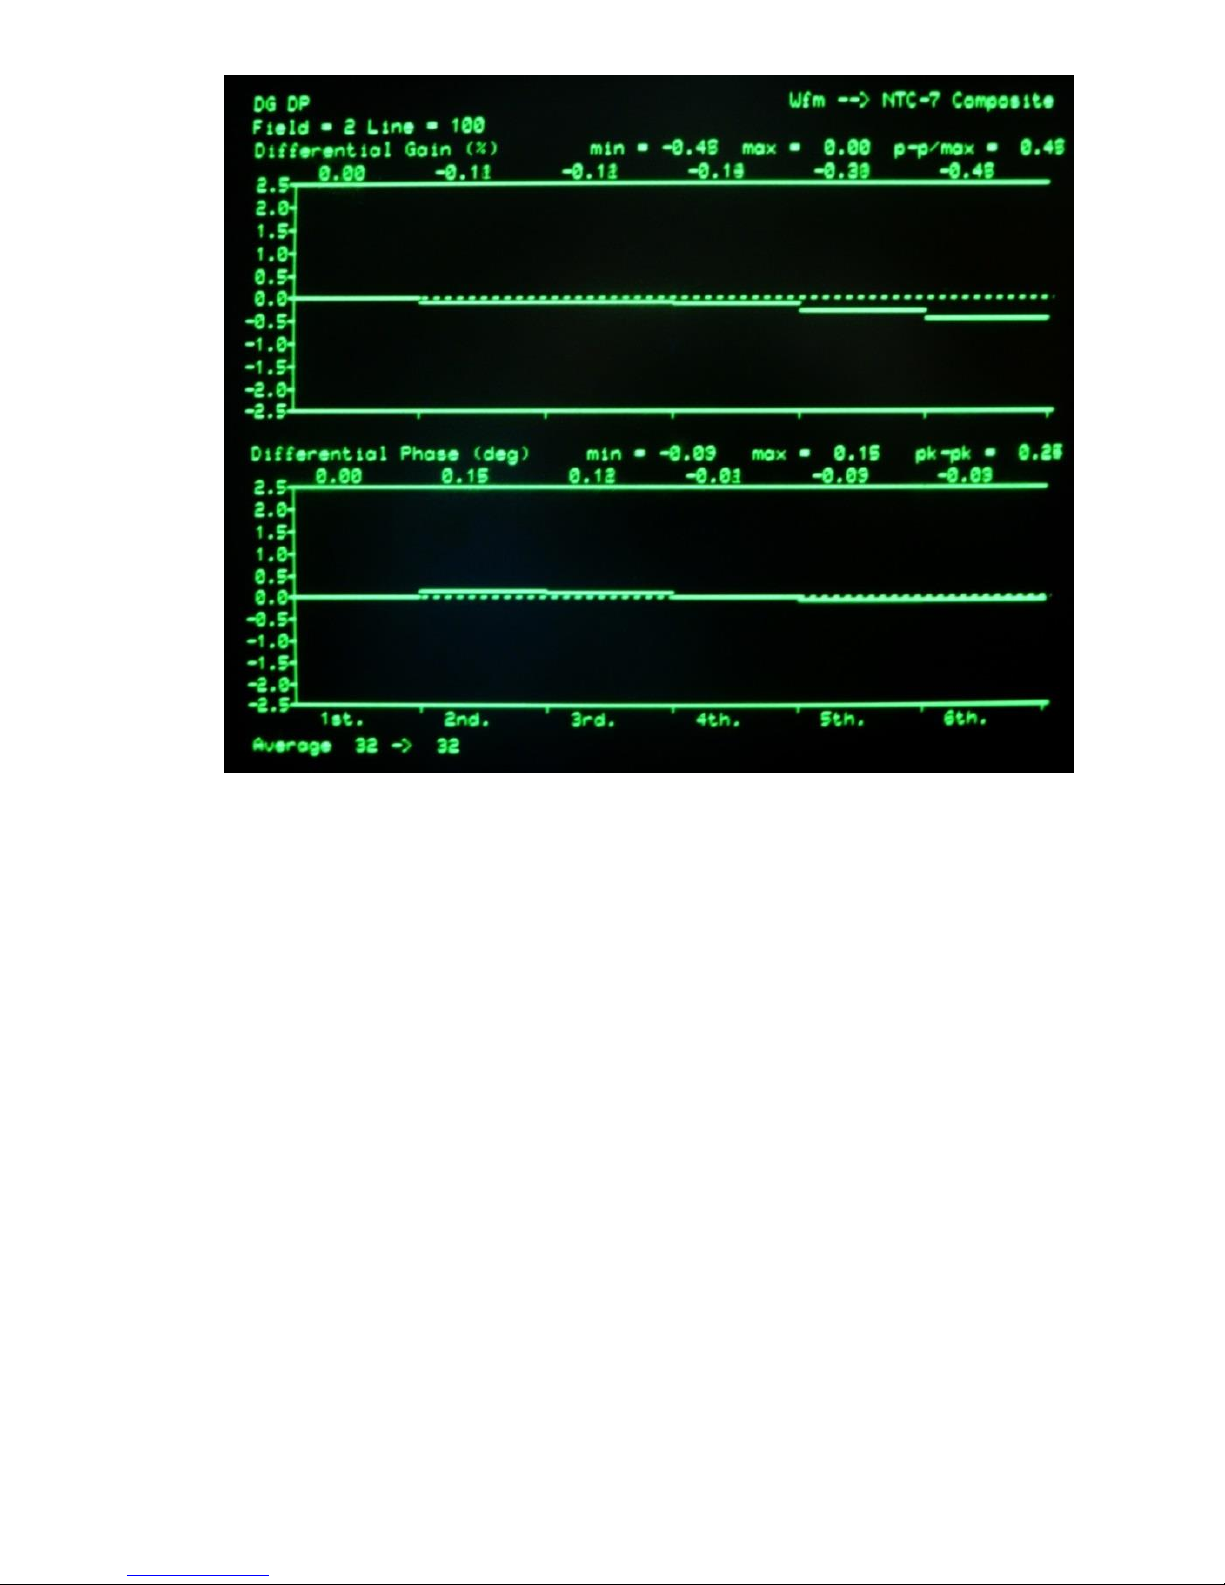
Figure 39 shows the differential gain and phase measurements for the
SM01, measured using the Tektronix VM700 on the NTC-7 waveform.
Page 53
53
Figure 39 NTSC Differential gain/phase measurement.
Page 54
54
Figure 40 NTSC noise measurement (Pedestal waveform).
Page 55
55
Figure 41 Luma frequency response (CCIR18 test signal).
Page 56
56
Figure 42 Chrominance non-linearity (using N7C-Combination test
signal).
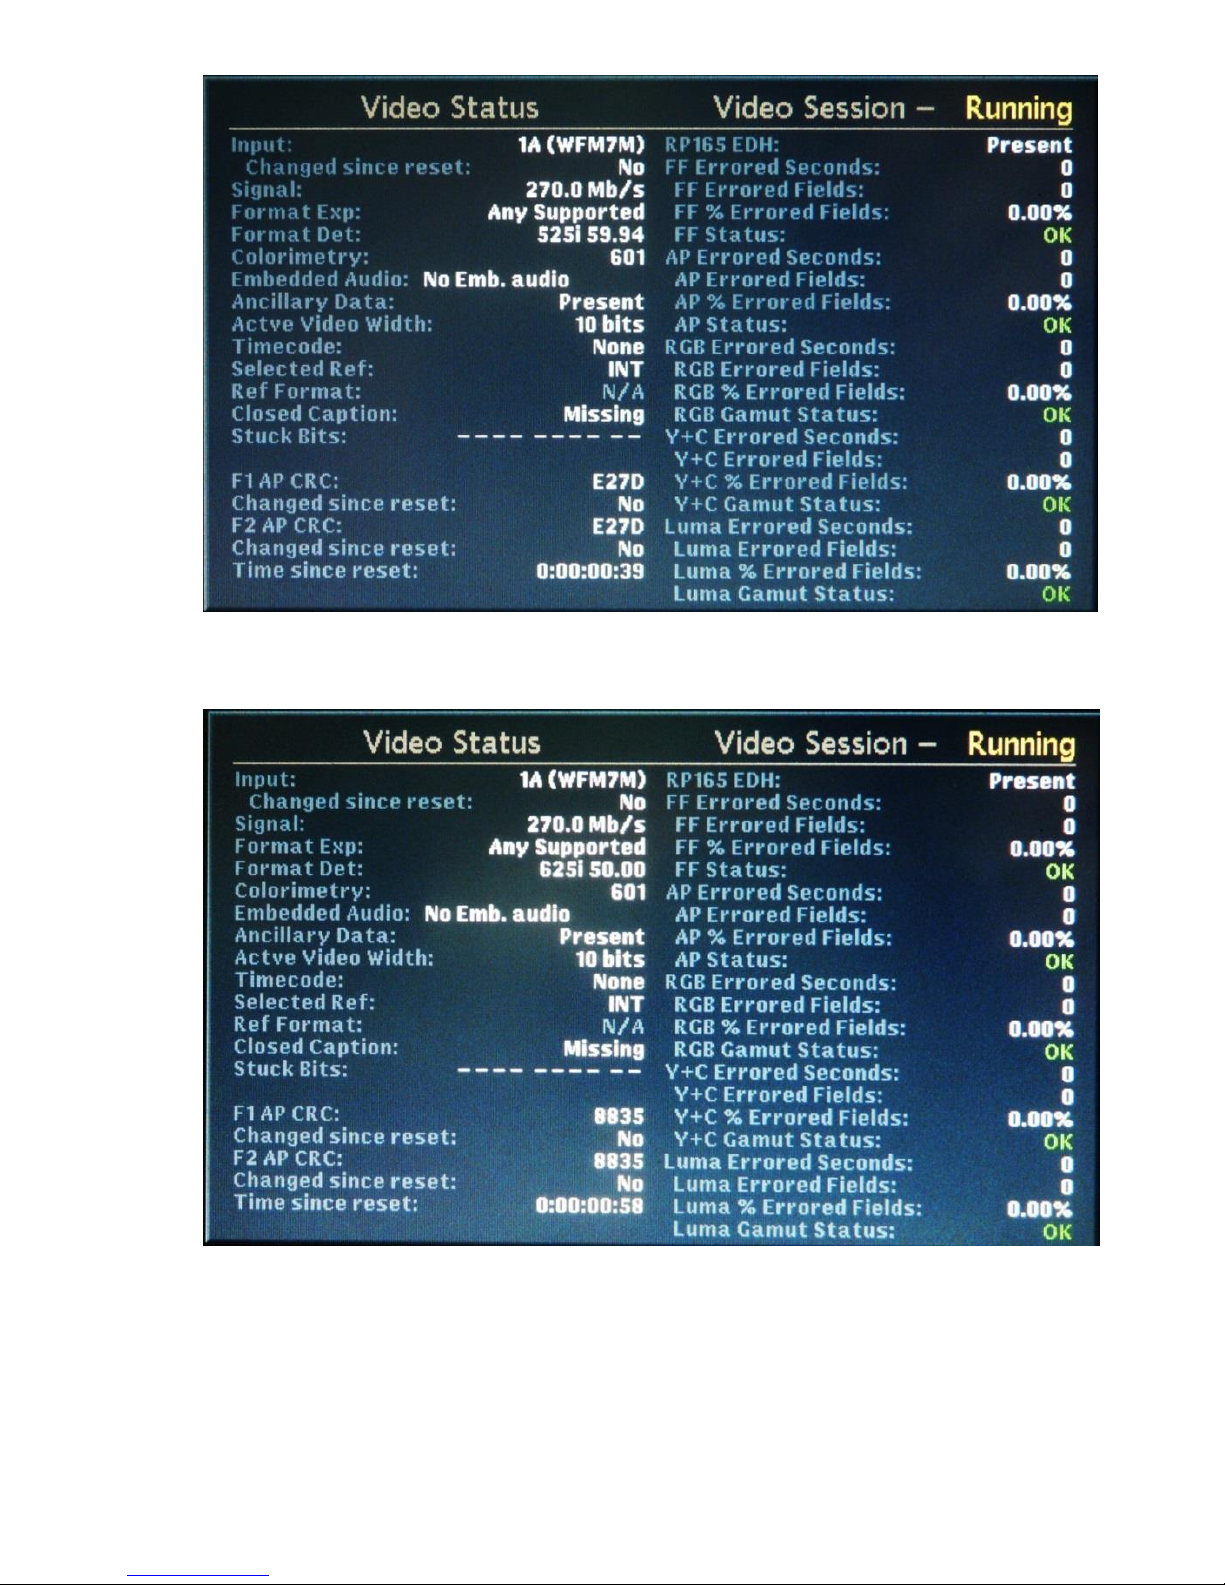
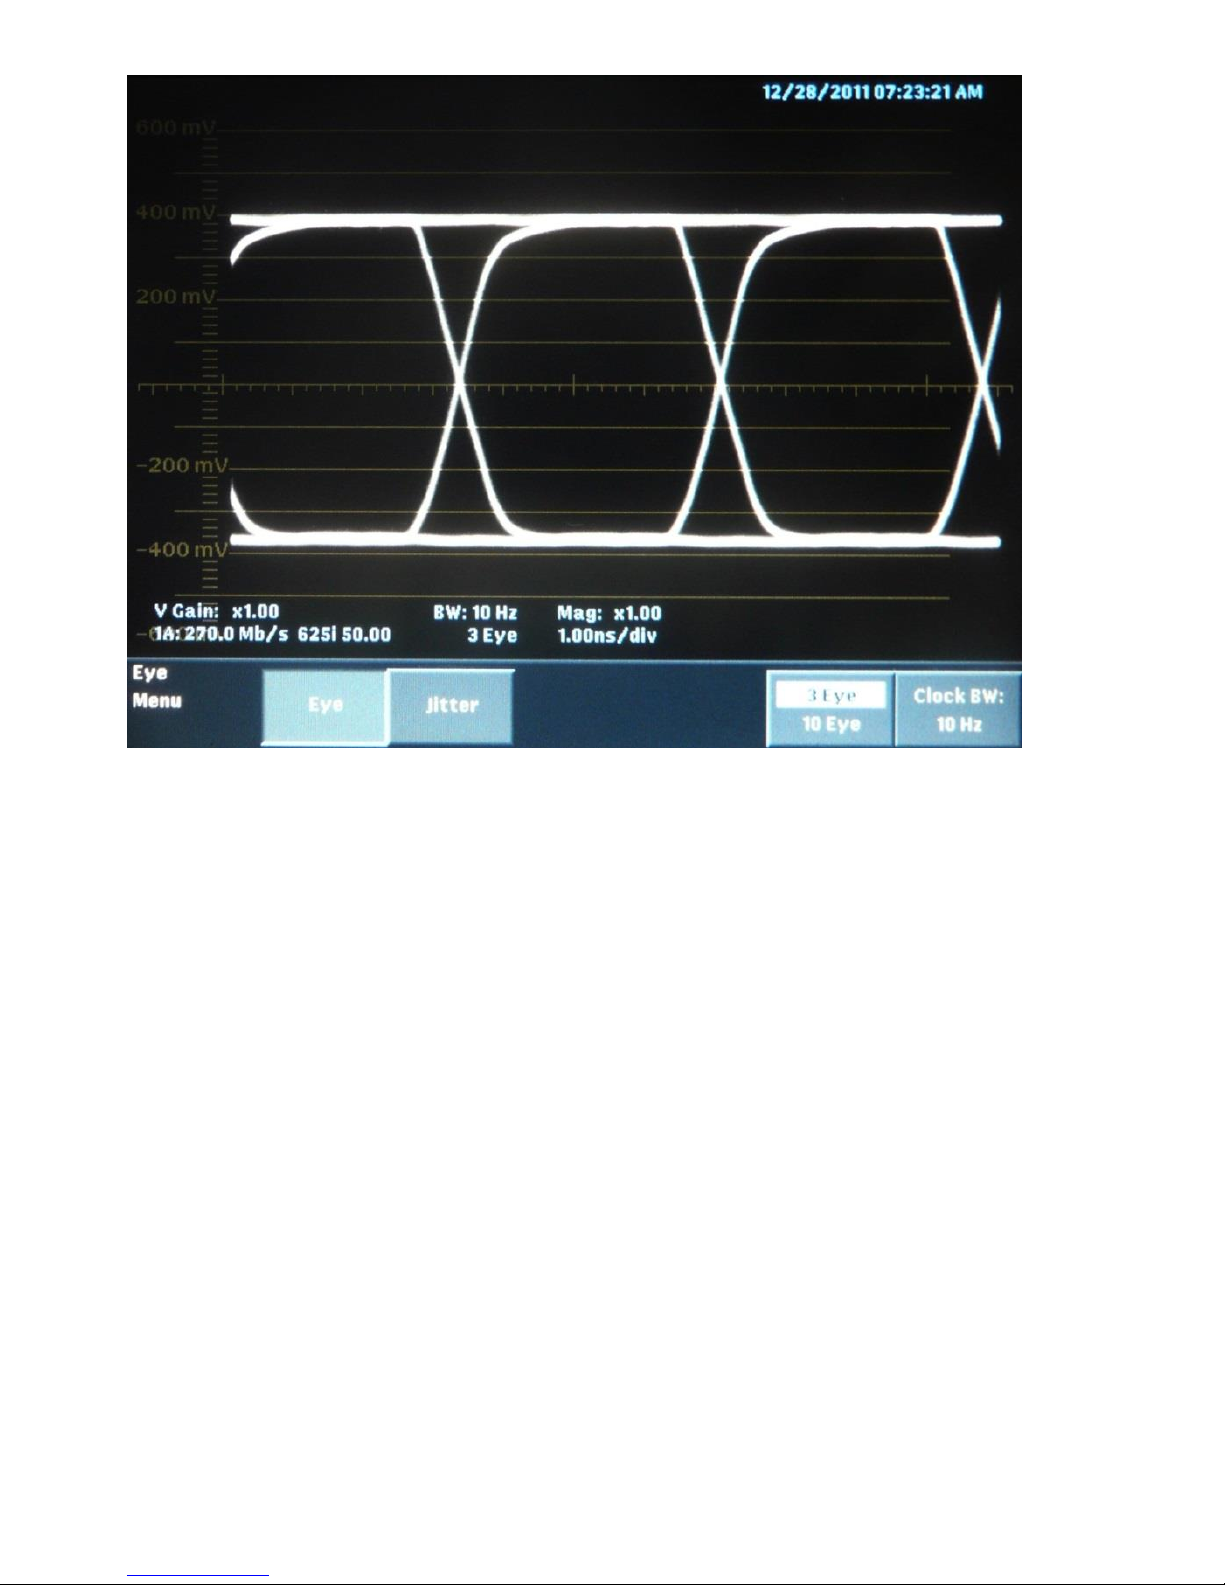
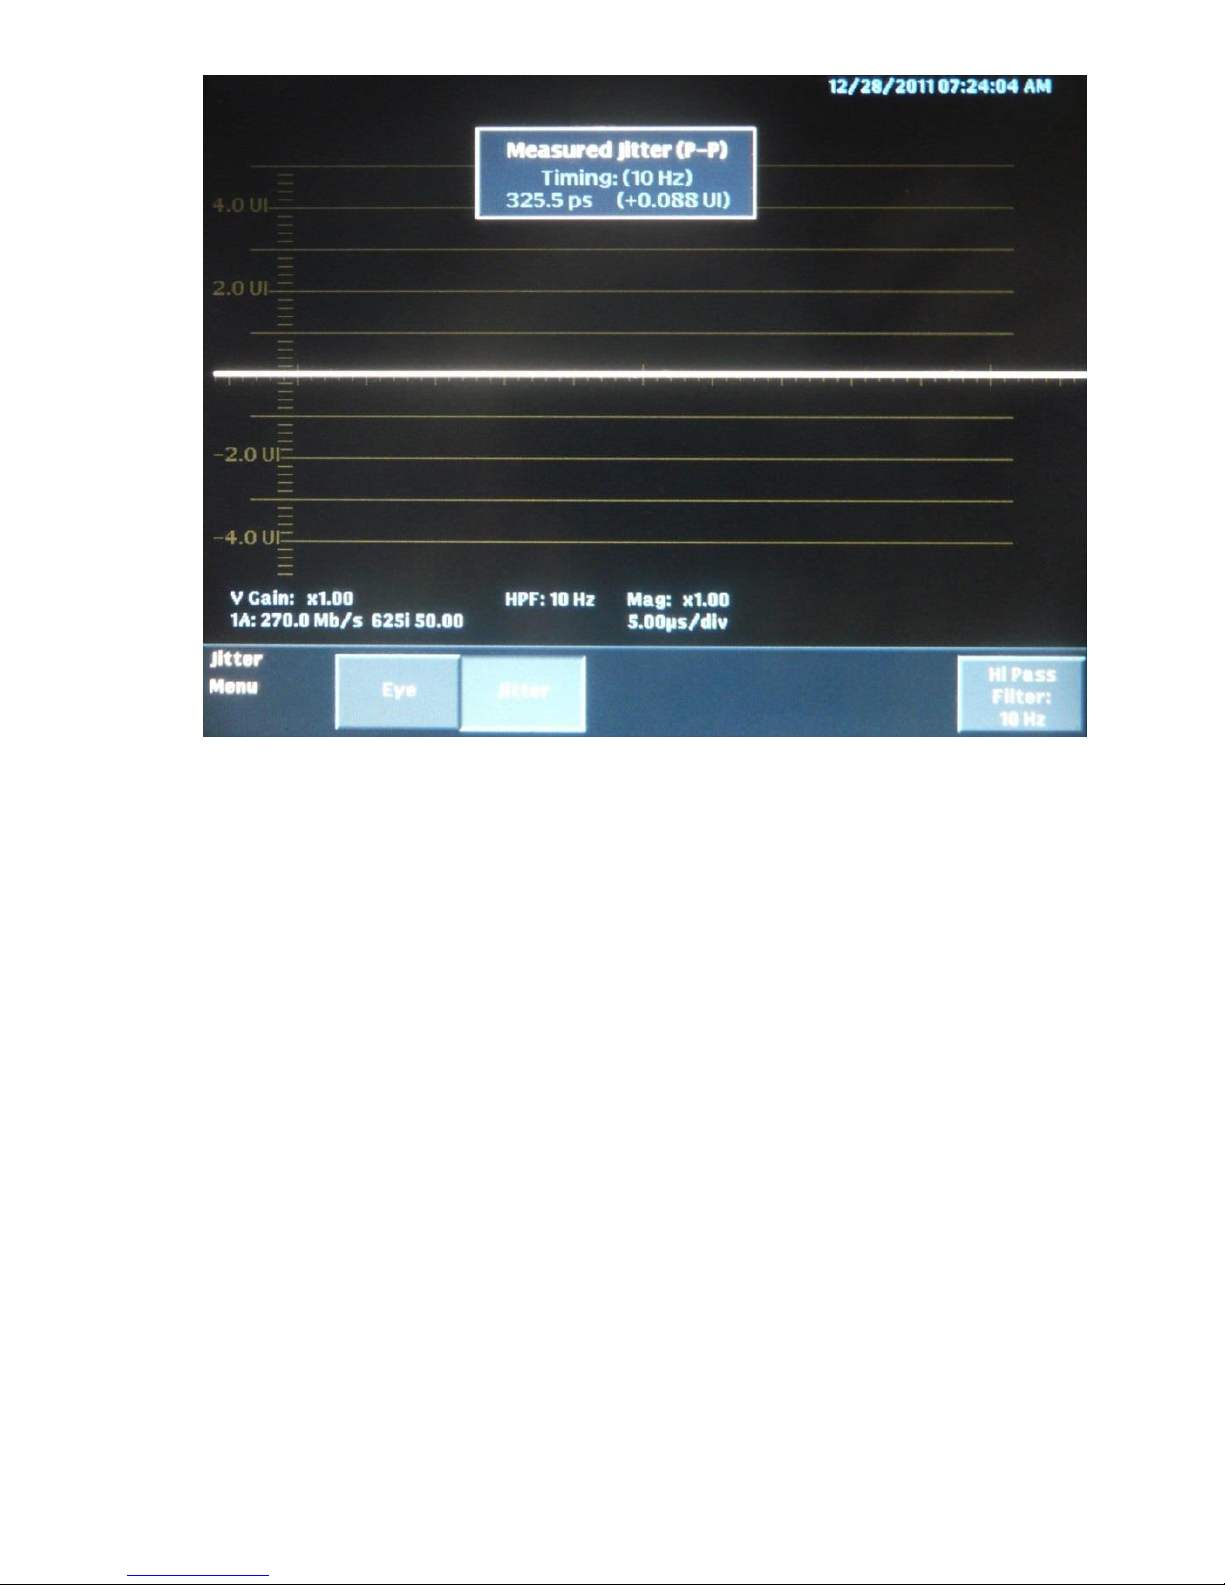
The SDI output measurements, (measured using a Tektronix WFM700M),
are shown in Figures 43 to 46.
Page 57
57
Figure 43 SDI output 525 line format measurement
Figure 44 SDI output 625 line format measurement
Page 58
58
Figure 45 SDI output 625 line eye pattern
Page 59
59
Figure 46 SDI output 625 line jitter measurement
Page 60
60
Appendix B: Power supply specification
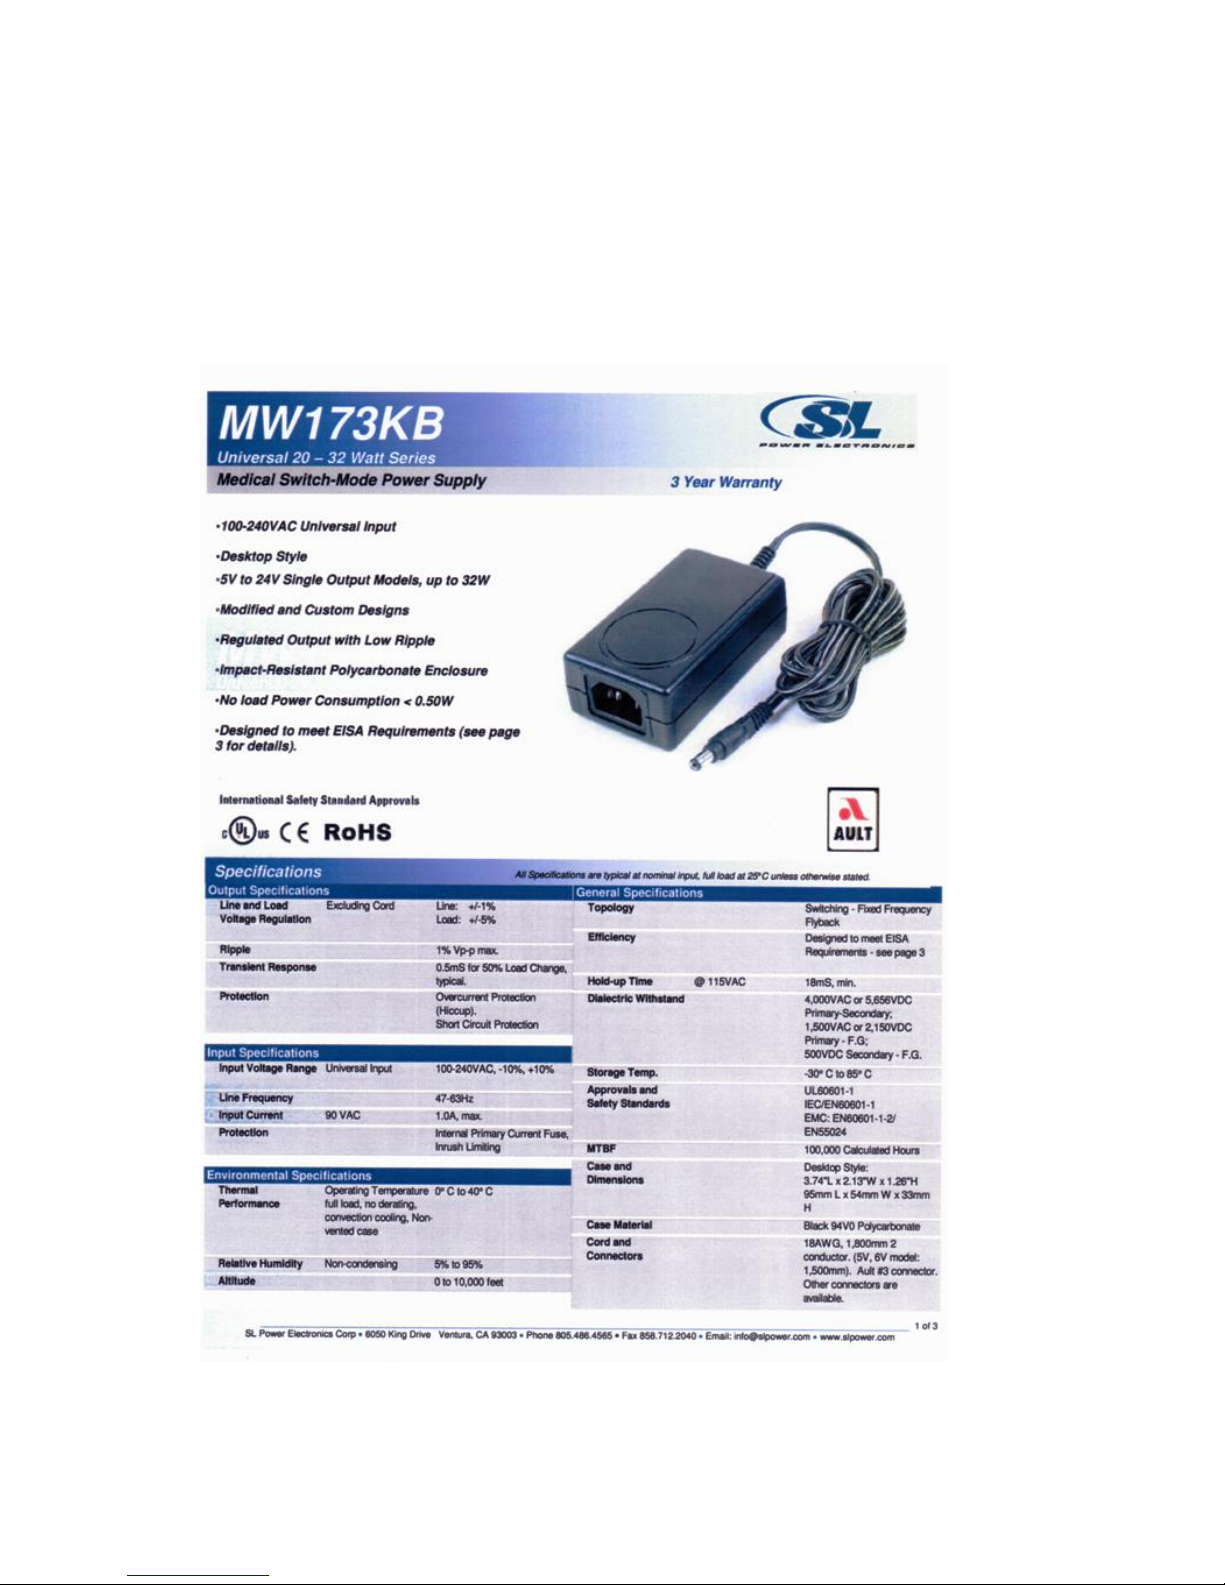
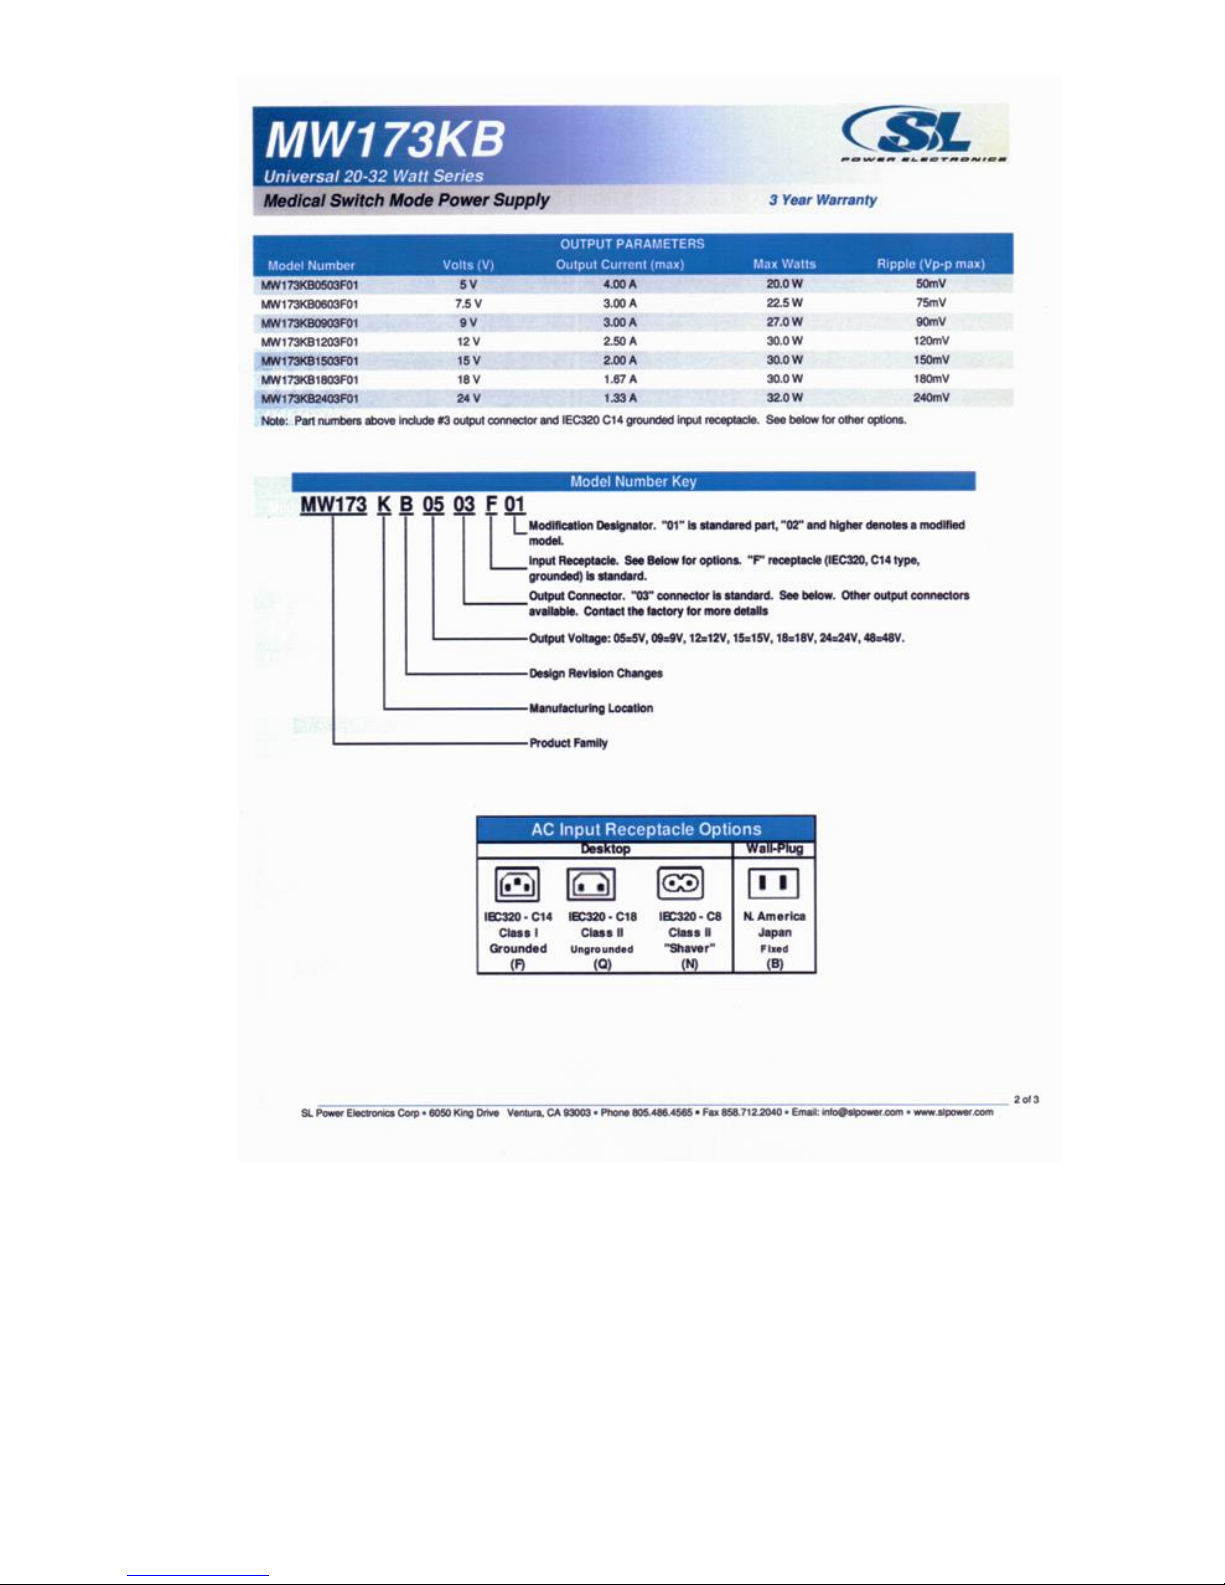
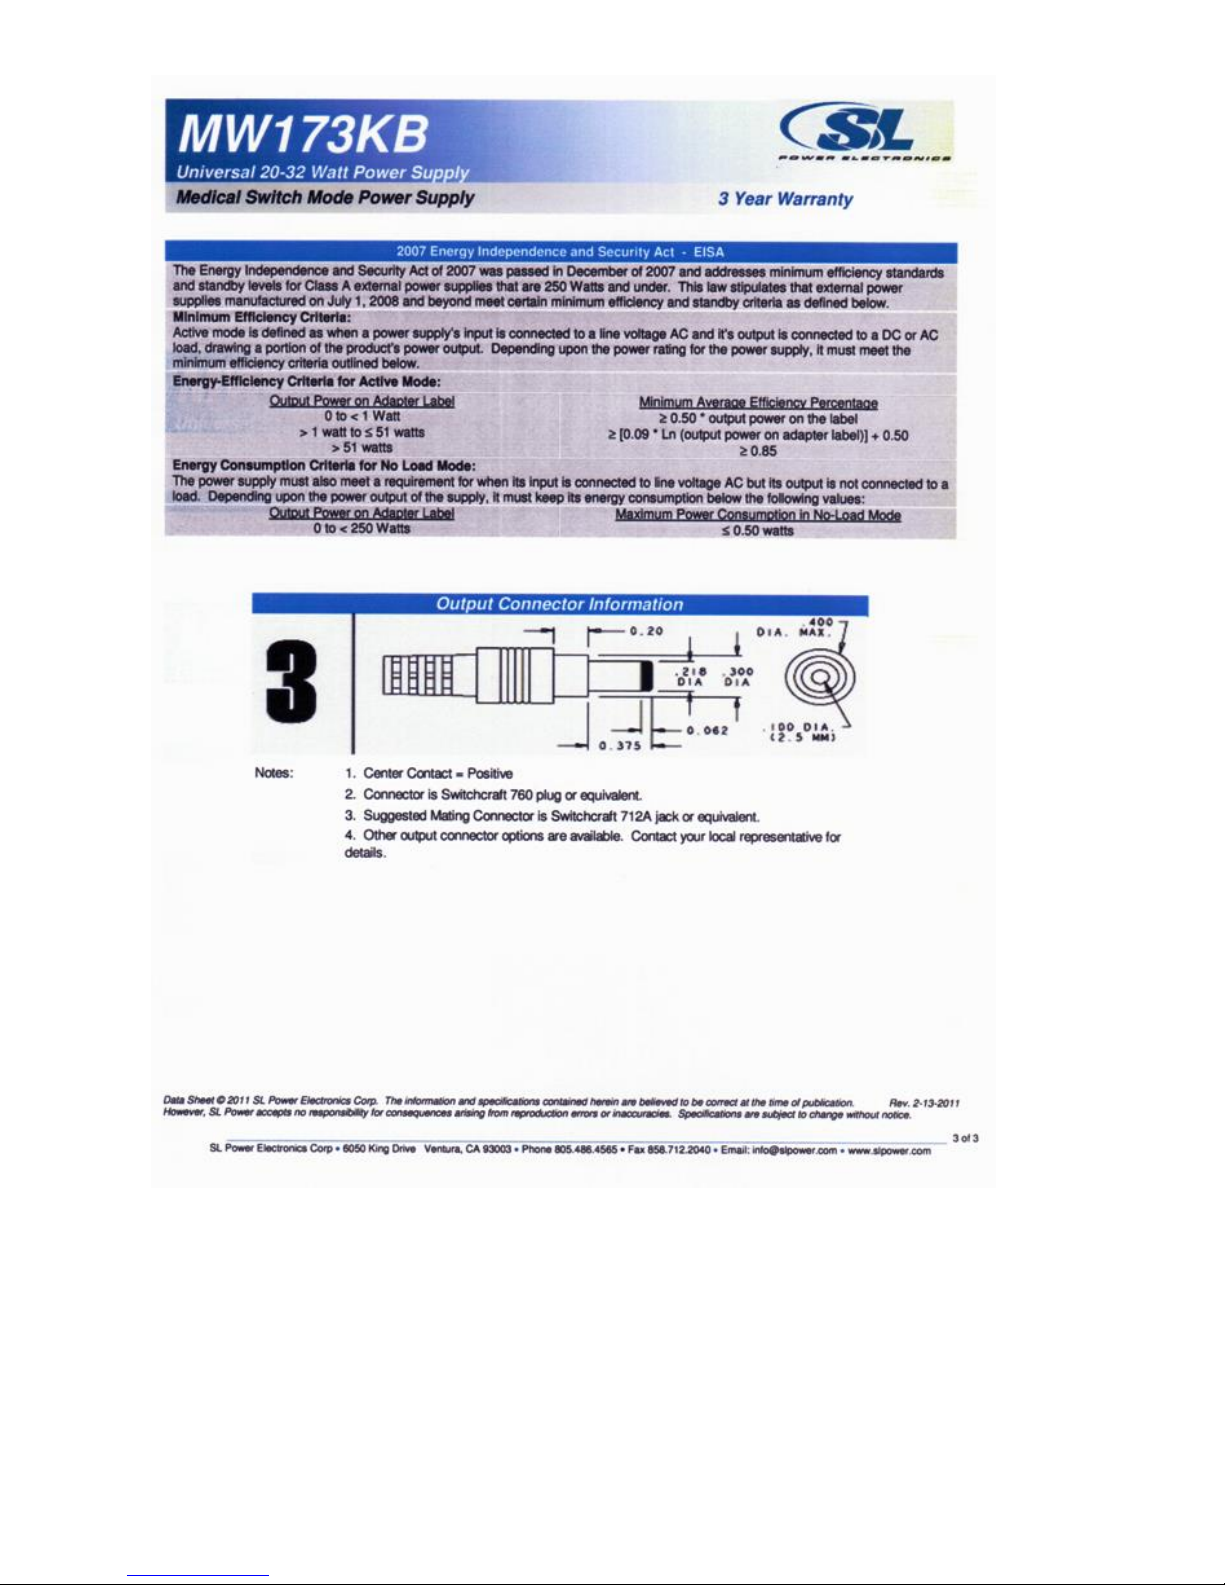
The AC-DC converter supplied with the SM01 is a model MW173KB from
SL Power Electronics Corporation. It accepts all AC inputs from 100240VAC and provides a 9V, 3A DC output for the SM01. The detailed
specification is shown below.
Figure 47 AC-DC converter specification: Page 1
Page 61
61
Figure 48 AC-DC converter specification: Page 2
Page 62
62
Figure 49 AC-DC converter specification: Page 3
 Loading...