

Page 1
Operator manual
Simrad ER60
Scientific echo sounder application
www.simrad.com
M A X I M I Z I N G Y O U R P E R F O R M A N C E A T S E A
Page 2

Page 3

850-164692
ER60
Scientific echo sounder
Operator manual
Page 4

About this document
Rev Date Written by Checked by Approved by
Rev.B
28.09.04 RBr LNA LNA
Revised for new software version 2.1.0.
© 2004 Simrad AS. All rights reserved.
ISBN 82-8066-011-9
The information contained in this document is subject to change without prior notice.
Simrad AS shall not be liable for errors contained herein, or for incidental or
consequential damages in connection with the furnishing, performance, or use of this
document.
No part of this work covered by the copyright hereon may be reproduced or otherwise
copied without prior permission from Simrad AS.
Simrad AS
Strandpromenaden 50
Box 111
N-3191 Horten
Telephone: +47 33 03 40 00
Facsim il e: +47 33 04 29 87
M A X I M I Z I N G Y O U R P E R F O R M A N C E A T S E A
Page 5

Sections
1 Application d escription
This chapter provides a very short description of the ER60 Scientific echo
sounder. Refer to page 1.
2Displayviews
ThevariousviewspresentedbytheER60Scientificechosounderareexplained.
Refer to page 2.
3 Operational procedures
This chapter holds a selection of common procedures covering the key
functions of the ER60. Refer t o page 15.
4 Menus
The ER60 is operated using a set of menus, short-cut menus and dialogue
boxes. This chapter lists the menus with page references to the applicable
dialogue boxes and/or functions. Refer to page 41.
Operator manual
5 Dialogue boxes and functions
This chapter holds reference information describing the dialogue boxes and
functionsindetail.Thetopicsarelistedin alphabetical order. Refertopage46.
6Datainterfaces
Thischapterdetailsthe variousdataformatsandinterfaces. Refertopage132.
850-164692 / Rev.B
III
Page 6

Simrad ER60 Operator manual
APPLICATION DESCRIPTION 1................................
General 1................................................
DISPLAY VIEWS 2..............................................
Introduction 2.............................................
Display organisation 3......................................
Main menu 4.............................................
Toolbar 5................................................
Status bar 6...............................................
Channel windows overview 7................................
Depth 8..................................................
Single Target Position 9.....................................
Single Target Histogram 10...................................
Echogram 11..............................................
Scope 12..................................................
Colour scale 13.............................................
Numerical 14..............................................
OPERATIONAL PROCEDURES 15................................
Introduction 15.............................................
Power on/off 16............................................
Basic operations 18.........................................
Transceiver installation 20....................................
Data recording and playback 21................................
Calibration 24..............................................
Noise measurements at sea 36.................................
MENUS 41........................................................
Introduction 41.............................................
Drop-down menus 42........................................
Short-cut menus 44.........................................
DIALOGUE BOXES AND FUNCTIONS 46........................
General 46................................................
Alphabetical list 47.........................................
About 48..................................................
Add User 49...............................................
Annotation 50..............................................
Bottom Detection 52........................................
Bottom Range 53...........................................
Calculation Interval 54.......................................
Cascade 55................................................
Close All 56...............................................
IV
850-164692 / Rev.B
Page 7

Operator manual
Colour Scale 57............................................
Colours 59................................................
Configure Statusbar 60.......................................
Configure Window 61.......................................
Contents 62...............................................
Data Source 63.............................................
Delete Layer 65............................................
Depth Output 66............................................
Echogram 67..............................................
EK500 Datagram 73.........................................
Environment 77............................................
Ethernet Output 78..........................................
Exit 79...................................................
File Output 80.............................................
HAC Datagram 85..........................................
Hide View 86..............................................
Histogram 87..............................................
Horizontal Axis 88..........................................
LAN Port setup 89..........................................
Layer Properties 90.........................................
Load Setting 92............................................
Log In 93.................................................
Log Out 94................................................
Motion 95.................................................
Navigation 96..............................................
New channel 100............................................
New Layer 101..............................................
Normal Operation 102........................................
Numerical View 104..........................................
Ping Control 105............................................
Port Management 107........................................
Print 109...................................................
Print Preview 110............................................
Remoting 111...............................................
Replay 114.................................................
Save Settings 115............................................
Serial Port Setup 116.........................................
Single Target Detection 117....................................
Surface Range 119...........................................
Tile 120...................................................
850-164692 / Rev.B
V
Page 8

Simrad ER60 Operator manual
Toolbar 121................................................
Tooltip 122.................................................
Transceiver Installation 123....................................
Transducer Parameters 126....................................
Trawl 127..................................................
User Properties 128..........................................
Users and passwords 129......................................
Warnings 131...............................................
DATA INTERFACES 132...........................................
Overview 132....................................................
Numeric type definition 133.........................................
Raw data 134.....................................................
Overview 134...............................................
Data encapsulation 135.......................................
Configuration datagram 136...................................
NMEA datagram 138.........................................
Annotation datagram 139......................................
Sample datagram 140.........................................
Data subscriptions and remote control 141..............................
Introduction 141.............................................
Overview 141...............................................
Requesting server information 143..............................
Connecting to server 144......................................
Keep connection alive 146.....................................
Issue commands on server 147.................................
Subscription of data 150......................................
Parameter management 155....................................
Disconnecting from server 158.................................
Data subscription types 159..........................................
Introduction 159.............................................
Bottom detection 160.........................................
Target strength detection 161...................................
Sample data 163.............................................
Echogram 165..............................................
Targets echogram 166........................................
Integration 167..............................................
Targets integration 168........................................
Parameter description 170...........................................
Introduction 170.............................................
Descriptions 170.............................................
VI
850-164692 / Rev.B
Page 9

APPLICATION DESCRIPTION
General
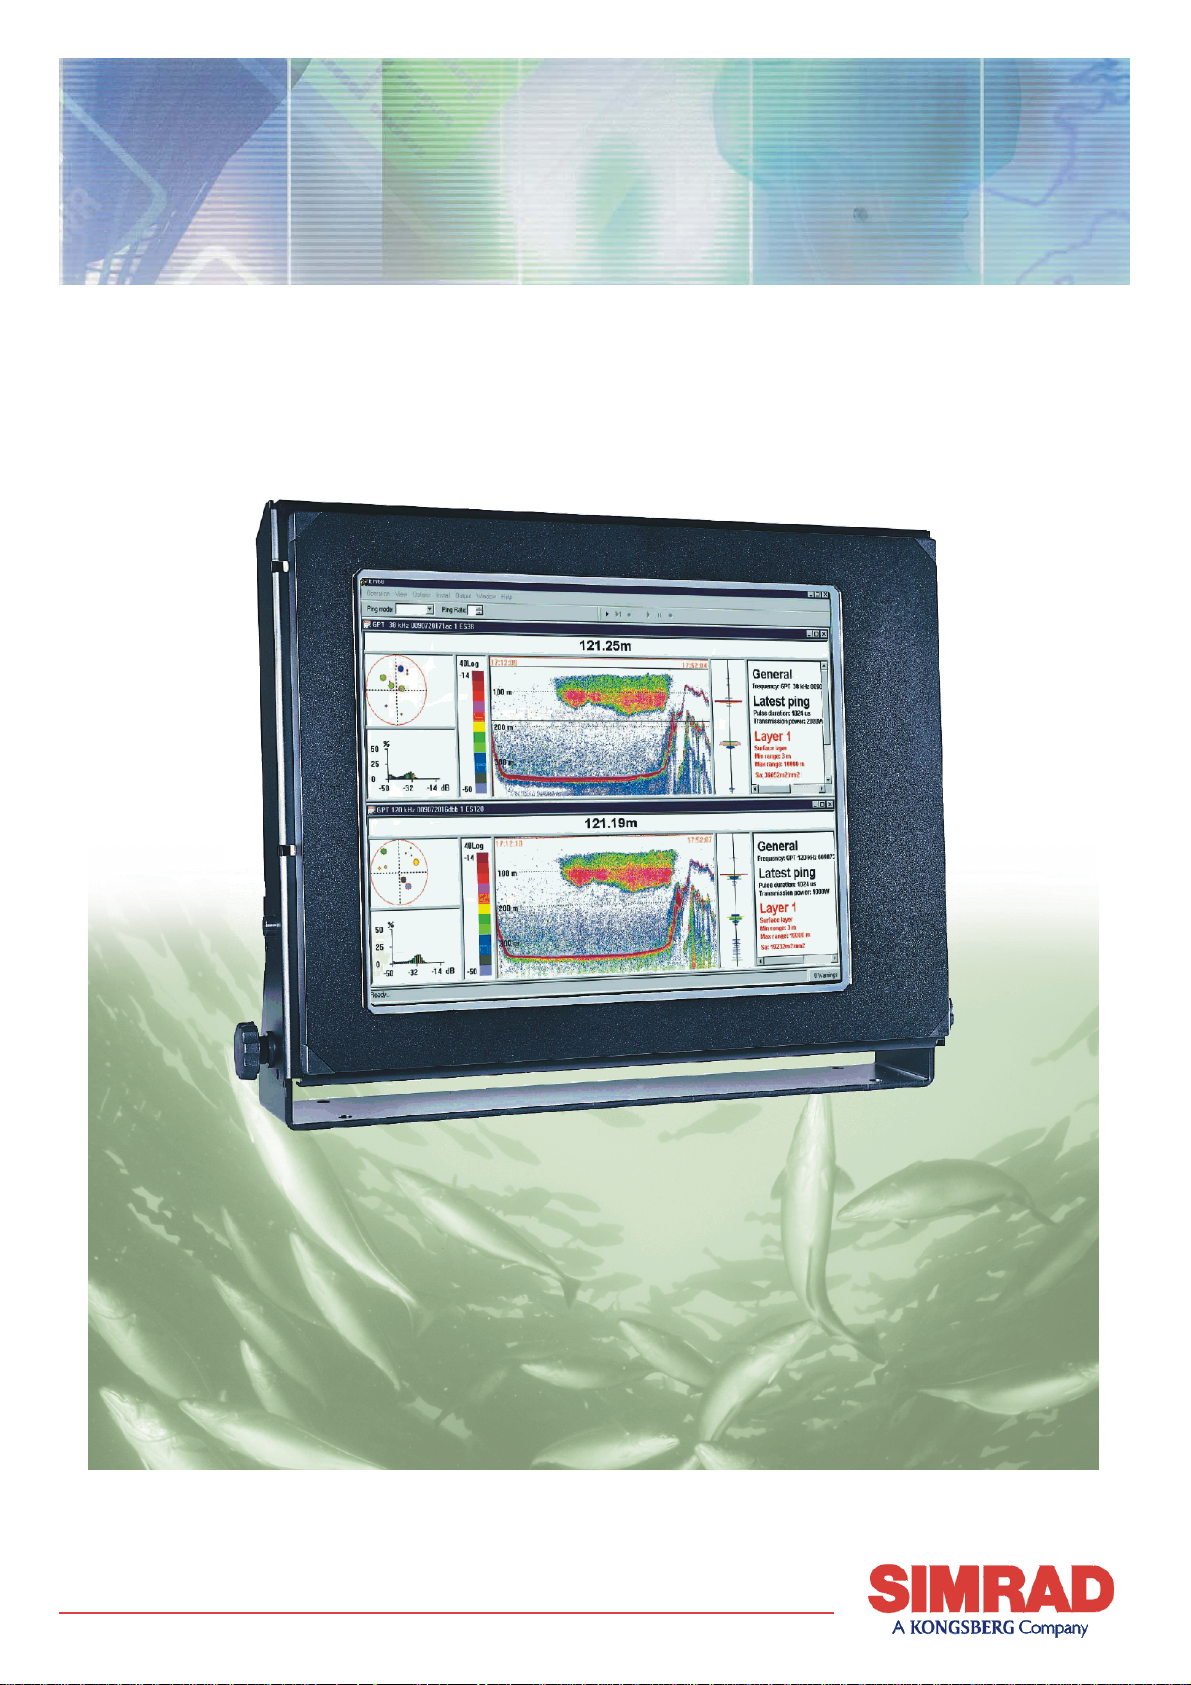
The Simrad ER60 scientific echo sounder application is
designed for fishery research and incorporates the following
primary features:
• Transceiver operation control
• Sensor input control
• Information display (echograms and numerical data)
• Data output and record control
• Replay of previously recorded data
Important notice
Windows 2000, XP and Windows are either registered
trademarks or trademarks of Microsoft Corporation in the
United States and/or other countries.
Application description
Echo sounder software version
This manual complies to echo sounder software version 2.1.0.
850-164692 / Rev.B
1
Page 10

Simrad ER60 Operator manual
DISPLAY VIEWS
Introduction
This chapter provides a brief overview of the information
displayed by the ER60, and how it is organised.
Topics
→ Display organisation, page 3
→ Main menu, page 4
→ Toolbar, page 5
→ Status bar, page 6
→ Channel windows overview, page 7
Channel windows
→ Depth, page 8
→ Single Target Position, page 9
→ Single Target Histogram, page 10
→ Echogram, page 11
→ Scope, page 12
→ Colour scale, page 13
→ Numerical, page 14
2
850-164692 / Rev.B
Page 11
Display views
Display organisation
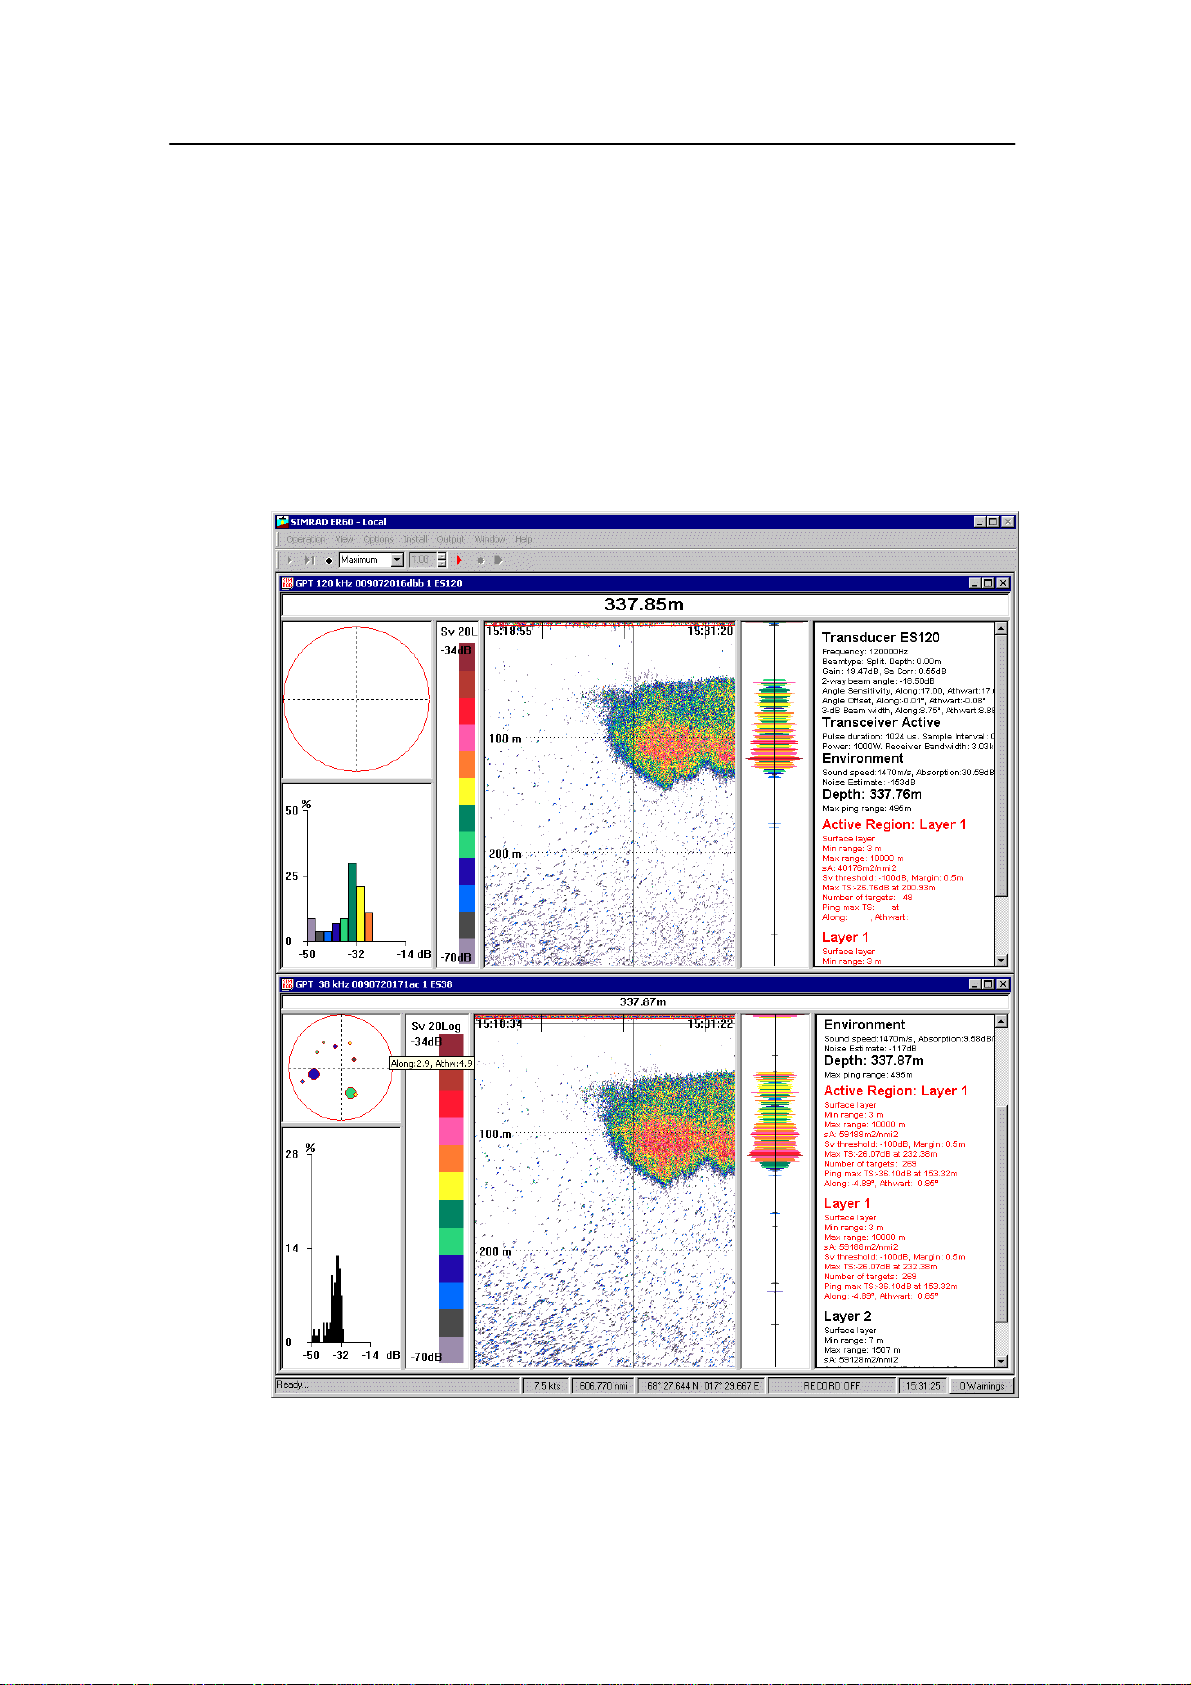
The ER60 display is organised as follows (from top):
• Main menu
• Tool bar
• A number of Channel windows
• Status bar
A display with two channels windows is shown as an example.
850-164692 / Rev.B
3
Page 12

Simrad ER60 Operator manual
Main menu
The ER60 Main menu is located at the top of the echo sounder
window.
To operate, click on the menu name and observe the drop-down
menu. Select a new item on the drop-down menu by clicking on
the command.
Commands shown with light grey colour are unavailable in the
present configuration or operational mode.
A detailed description of the commands available from the main
menu is given in the Reference guide.
Related topics
→ Main menu commands, page 41
4
850-164692 / Rev.B
Page 13

Display views
Toolbar
The Toolbar is located directly underneath, or next to the main
menu. A number of dedicated buttons allow for easy access to
the most frequently used functions.
Two toolbars may be applied, Normal operation and Easy
operation. The toolbar selection is made by the Toolbar
command on the View menu. Note that Normal operation is
not available during replay.
The functions (from left) and their equivalent dialogue buttons
and controls are listed in the table below.
Easy operation Equivalent Dialogue
Start pinging Start Ping control
Perform single ping Single step Ping control
Stop pinging Stop Ping control
Set ping rate Ping rate Ping control
Start raw data recording Save raw data File output
Stop raw data recording Save raw data File output
Initiate annotation Annotation text input Annotation
Generate event Annotation
XX
Normal operation Equivalent Dialogue
Select channel XX XX
Select mode Mode Normal Operation
Related topics
→ File Output, page 80
→ Normal Operation, page 102
850-164692 / Rev.B
→ Ping Control, page 105
→ Toolbar, page 121
5
Page 14

Simrad ER60 Operator manual
Status bar
The Status bar is located at the bottom of the display. It
presents messages from the echo sounder system as well as a
warning field at the right hand side.
Enable
The Status bar can be enabled or disabled with the Status bar
choice on the View menu, and configured by clicking the right
mouse button while the cursor is located within the Status bar
borders.
Information
(CD6974G)
When all information has been enabled, the Status bar will
display (from left):
• Current messages
• Current Pitch in degrees (P: 0.0°)
• Current Roll in degrees (R: 0.0°)
• Current Heave in meters (0.00 m)
• Event number
• Current Speed in knots (7.0 kts)
• Distance in nautical miles (1325.439 nmi)
• Geographical position (68°26’515 N...)
• Recording status (RECORD OFF)
• Current time (16:06:36)
Warnings and errors
The Warnings field on the far right side of the Status bar is a
button. When a warning has been issued, the button will be lit
with a colour and a text indicating the nature of the message. To
investigate further, click the button.
Related topics
→ Configure Statusbar, page 60
→ Warnings, page 131
6
850-164692 / Rev.B
Page 15

Display views
Channel windows overview
The ER60 Channel window is the main information bearer on
the echo sounder display.
Topics
Each Channel window contains the following views:
→ Depth, page 8
→ Single Target Position, page 9
→ Single Target Histogram, page 10
→ Echogram, page 11
→ Scope, page 12
→ Colour scale, page 13
→ Numerical, page 14
850-164692 / Rev.B
7
Page 16

Simrad ER60 Operator manual
Depth
The Depth view comprises the horizontal view directly below
the Toolbar. The view displays the current depth.
If you click the right mouse button with the cursor position
within this view, a dedicated shortcut menu will appear. If you
press the middle mouse button, the Bottom Detection dialogue
box will open.
Related topics
(CD6974A)
→ Channel windows overview, page 7
→ Shortcut menu, page 44
→ Bottom Detection dialogue, page 52
8
850-164692 / Rev.B
Page 17
Display views
Single Target Position
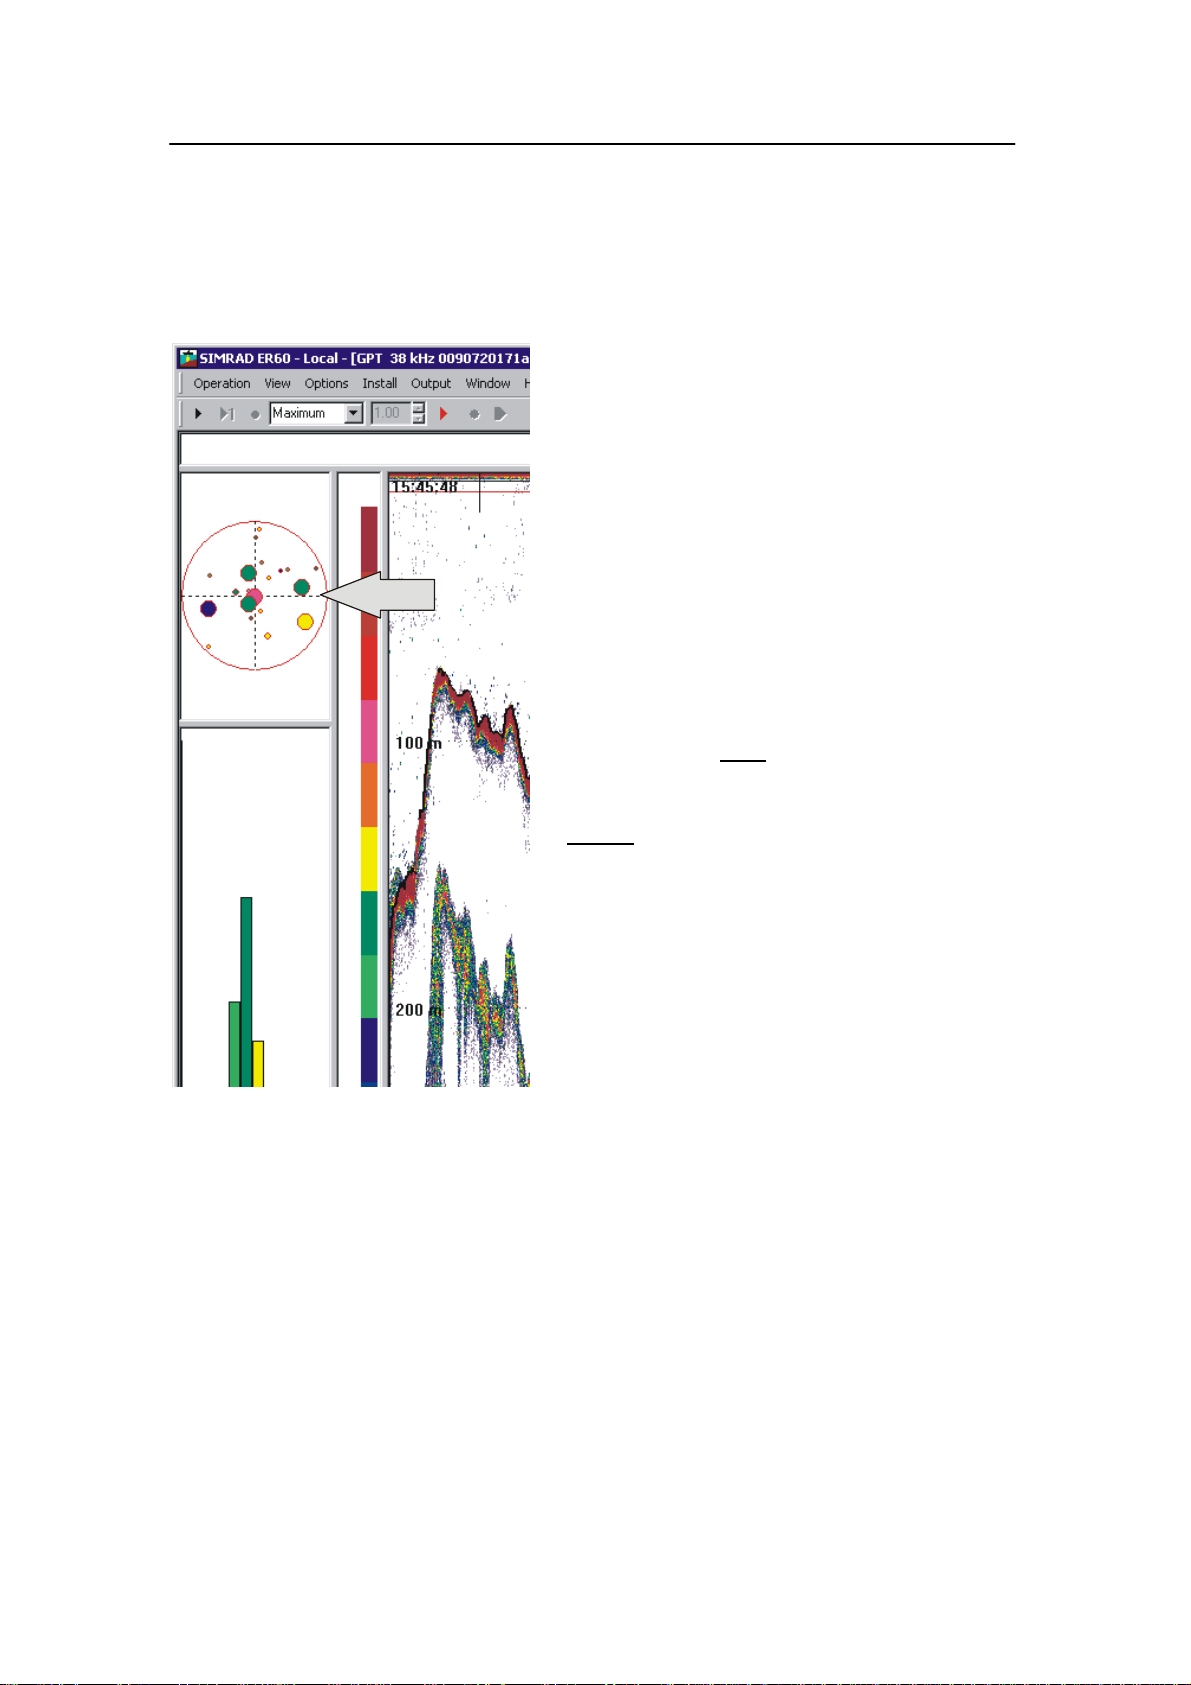
The Single Target Position view is normally located in the top
left corner.
This view shows the position within the beam
of the detected single echoes for the current
ping (largest circles) and the three previous
pings (smaller circles), all in the active layer.
The colours used to display this information
are determined from current target strength
(TS) value and the settings in the Colour
scale.
If you place the cursor inside the view, a small
yellow label will appear to give you a detailed
readout of certain information. The Tooltip
dialogue defines which information that will
be shown.
(CD6974B)
If you click the right mouse button with the
cursor position within this view, a dedicated
shortcut menu will appear. If you press the
middle mouse button, the Single Target
Detection dialogue box will open.
Related topics
→ Channel windows, page 7
→ Colour Scale, page 13
→ Shortcut menu, page 44
→ Layer properties, page 90
→ Single Target Detection, page 117
→ Tooltip, page 122
850-164692 / Rev.B
9
Page 18

Simrad ER60 Operator manual
Single Target Histogram
The Single Target Histogram view is normally located in the
bottom left corner of the display presentation.
The histogram plot shows a visualisation of the
target strength (TS) distribution for the single
echoes detected in the Echogram view The colours
used to display this information are determined from
the current target strength (TS) value and the
settings in the Colour scale. The statistics are based
on the active layer and the current calculation
interval.
If you place the cursor inside the view, a small
yellow label will appear to give you a detailed
readout of certain information. The Tooltip dialogue
defines which information that will be shown.
(CD6974C)
If you click the right mouse button with the cursor
position within this view, a dedicated shortcut menu
will appear. If you press the middle mouse button,
the Single Target Detection dialogue box will open.
Related topics
→ Channel windows, page 7
→ Colour Scale, page 13
→ Shortcut menu, page 44
→ Calculation interval, page 54
→ Layer Properties, page 90
→ Single Target Detection, page 117
→ Tooltip, page 122
10
850-164692 / Rev.B
Page 19
Display views
Echogram
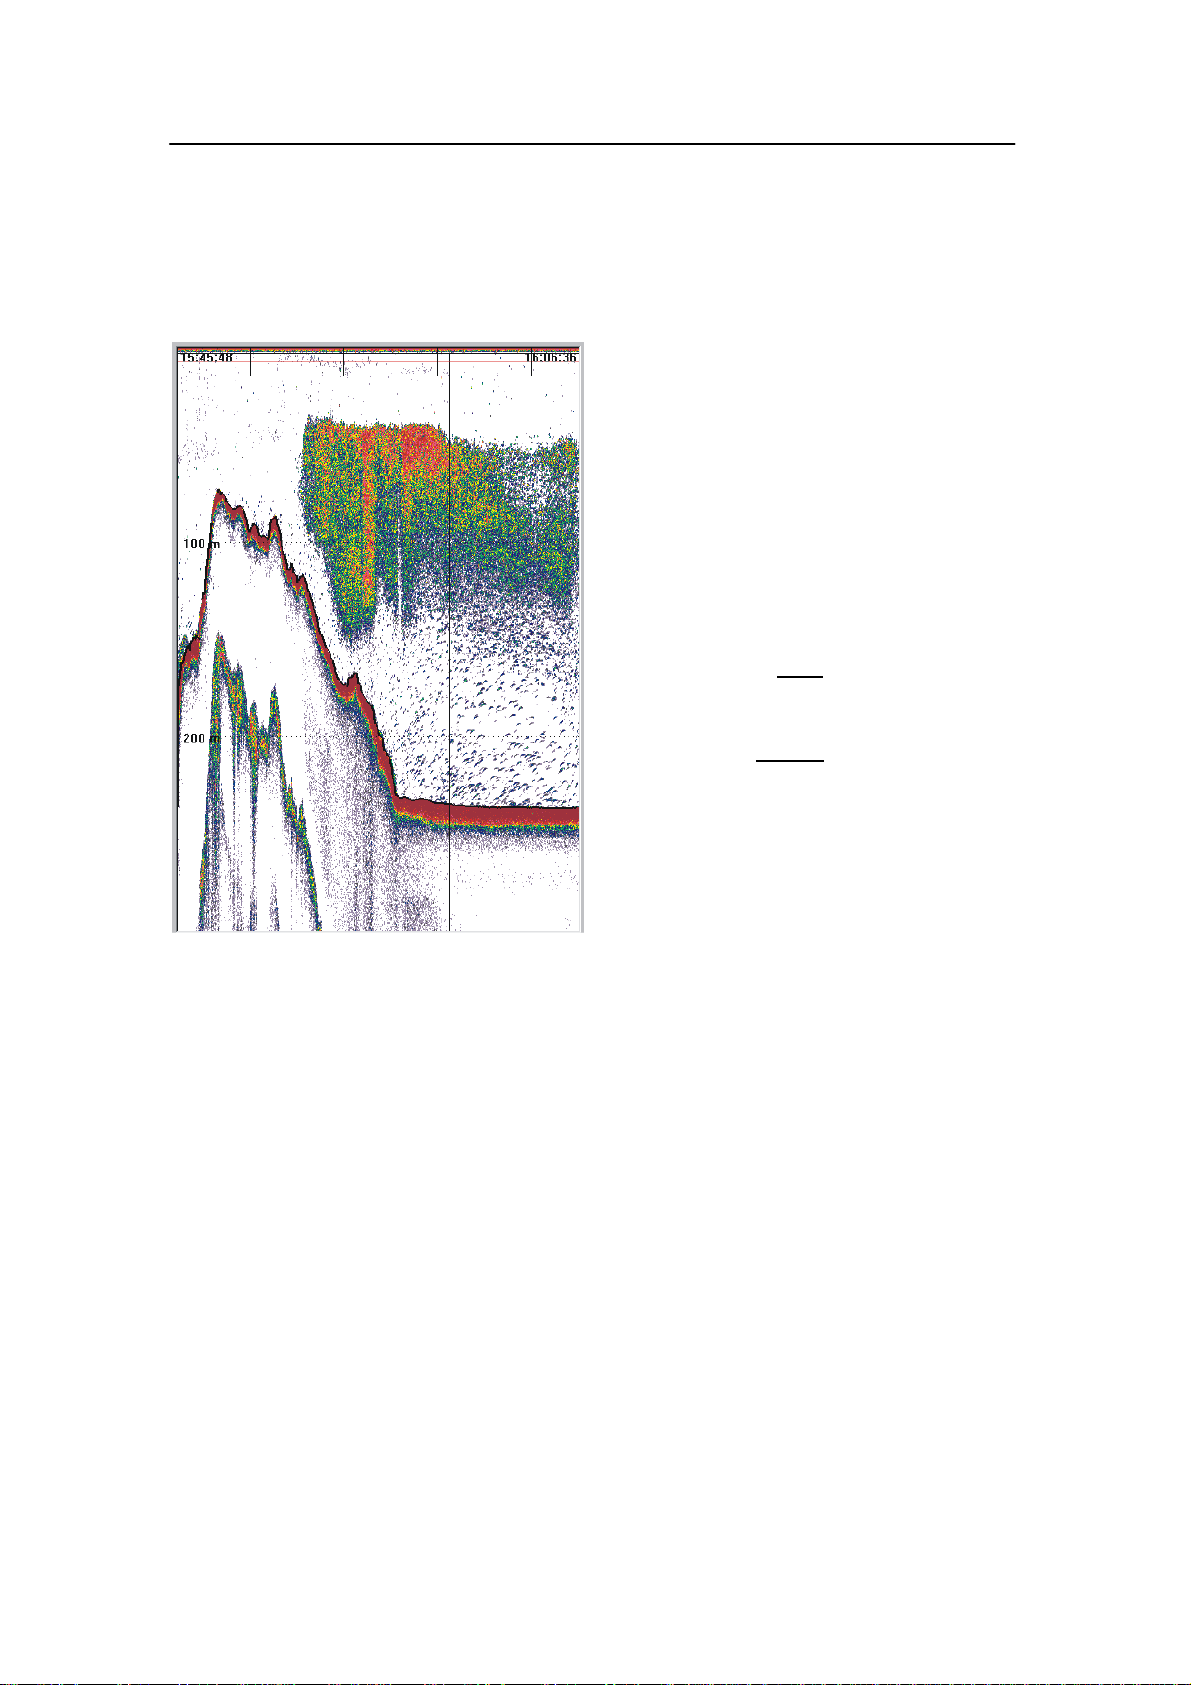
The Echogram view will normally dominate the echo sounder
display.
The Echogram contains information
about the acoustical values. The settings
in the Colour Scale is used to present
the information.
If you place the cursor inside the view, a
small yellow label will appear to give
you a detailed readout of certain
information. The Tooltip dialogue
defines which information that will be
shown.
If you click the right mouse button with
the cursor position within this view, a
dedicated shortcut menu will appear. If
you press the middle mouse button, the
Echogram dialogue box will open.
(CD6974D)
Related topics
→ Channel window, page 7
→ Colour Scale, page 13
→ Shortcut menu, page 44
→ Echogram, page 67
→ Tooltip, page 122
850-164692 / Rev.B
11
Page 20

Simrad ER60 Operator manual
Scope
The Scope view is normally located on the right side of the
Echogram view.
The Scope view provides a logarithmic oscilloscope
visualization of the last ping. The presentation
corresponds to the current settings in the Echogram view.
The Scope view draws a range of horizontal symmetrical
colour lines. The distance from the vertical center axis and
the line colour reflects the received echo scatter.
If you place the cursor inside the view, a small yellow
label will appear to give you a detailed readout of certain
information. The Tooltip dialogue defines which
information that will be shown.
If you click the right mouse button with the cursor
position within this view, a dedicated shortcut menu will
appear.
(CD6974E)
Related topics
→ Channel windows overview, page 7
→ Echogram view, page 11
→ Shortcut menu, page 45
→ Tooltip dialogue, page 122
12
850-164692 / Rev.B
Page 21

Display views
Colour scale
The Colour scale view is normally located on the left side of
the Echogram view.
The Colour scale view visualizes the mapping of echo
strength into one out of 12 colours, light blue for weak
signals and dark brown for strong signals. Basically, each
discrete colour represents a 3 dB range of echo signal
strength implying that the next colour is selected every
time the echo strength doubles. However, as the number of
colours can differ, and dedicated colour schemes can be
used, this is not necessarily correct
A high numeric TVG value displays weak echo signals
properly while the stronger signals saturate into dark
brown colour. A low numeric value displays strong echo
signals properly. Weak signals below the lower limit of the
colour scale are not displayed (the display background
colour is used).
(CD6974F)
If you place the cursor inside the view, a small yellow
label will appear to give you a detailed readout of certain
information. The Tooltip dialogue defines which
information that will be shown.
If you click the right mouse button with the cursor
position within this view, a dedicated shortcut menu will
appear. If you click the middle button, the Colour Scale
dialogue box opens.
Related topics
→ Channel window, page 7
→ Colour Scale, page 57
→ Shortcut menu, page 45
→ Tooltip, page 122
850-164692 / Rev.B
13
Page 22
Simrad ER60 Operator manual
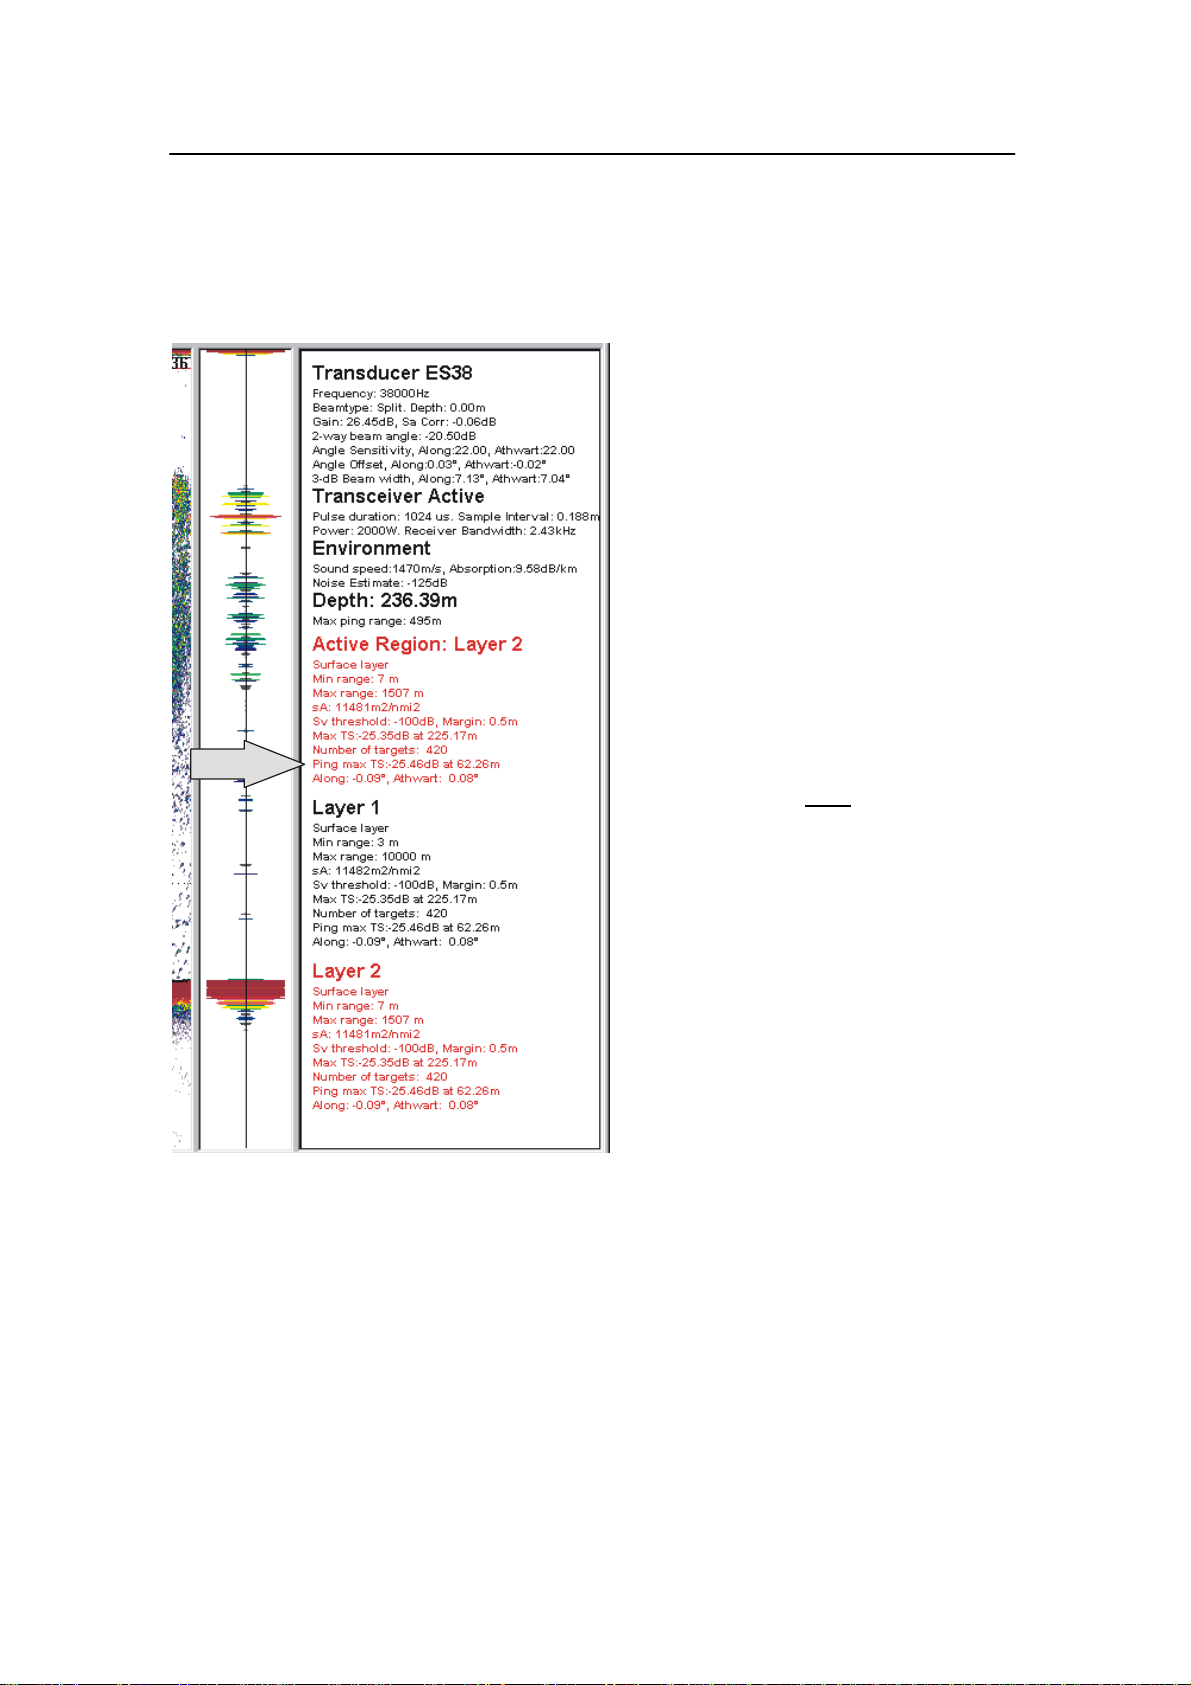
Numerical
The Numerical view is normally located on the far right side of
the display.
The Numerical view provides listing
with all the various parameters
applicable for the current mode and
operation.
The following lists are available:
Transducer - T ypical specifications
for the active transducer
Transceiver - Typical specifications
for the transceiver
Environment - displays the current
readout from the active sensors
(CD6974G)
Layers - Current parameters from the
active layers.
If you click the right mouse button
with the cursor position within this
view, a dedicated shortcut menu will
appear.
Related topics
→ Channel windows, page 7
→ Shortcut menu, page 45
→ Numerical View, page 104
14
850-164692 / Rev.B
Page 23

OPERATIONAL PROCEDURES
Introduction
This chapter contains a number of specific procedures to be
used with your ER60 echo sounder.
Topics
→ Power on/off, page 16
→ Basic operations, page 18
→ Transceiver installation, page 20
→ Data recording and playback, page 21
→ Noise measurements at sea, page 36
Operational procedures
850-164692 / Rev.B
15
Page 24

Simrad ER60 Operator manual
Power on/off
Use the following procedures to switch the ER60 echo sounder
on and off.
Power on
It is assumed that the echo sounder’s hardware and software are
properly installed and configured.
1 Switch power on.
- The location of the power switches are individually
2 Observe the hardware test messages and operating system
3 Start the ER60 program.
4 If the Login dialogue box appears, enter username and
assigned. The computer has its own power switch. The
transceiver(s) must be connected to separate power
supplies, and should have a remote power switch.
start-up messages.
password.
5 On the Operation menu, select Normal.
6 Once the echo sounder is running, start pinging by
pressing the “arrow” (") symbol on the toolbar.
Set-up
If no channels appear in the Normal Operation dialogue,
observe the following procedure:
1 Open the Transceiver Installation dialogue box from the
Install menu
2 Check that all frequency channels are properly installed.
3 Open the Normal Operation dialogue box from the
Operation menu.
4 Check the operational mode for each of the installed
channels. Adjust as required.
5 Open the Window menu, and select New channel to open
a new channel window.
Power off
To switch off the ER60 echo sounder, observe the following
procedure.
16
1 Select Exit on the File menu.
2 Allow the computer to close all the ER60 software
applications.
- If desired, ER60 can be restarted using the desktop
icon.
850-164692 / Rev.B
Page 25

Operational procedures
3 Switch off the power on the General Purpose Transceiver
(GPT) and other peripherals (if any).
When the ER60 software has closed down, you need to close
down the computer as well.
1 ClickontheStart button in the lower left corner of the
display.
2 Exit the operating system in the normal matter.
3 When notified, switch off the power.
Related topics
→ Toolbar, page 5
→ Normal Operation, page 102
→ Transceiver Installation, page 123
850-164692 / Rev.B
17
Page 26

Simrad ER60 Operator manual
Basic operations
This chapter presents a number of common procedures
frequently carried out on the ER60 echo sounder.
Changing the echogram settings
To change the echogram settings:
1 Position the cursor in the Echogram view.
2 Click the right mouse button.
3 Select Echogram from the shortcut menu, and observe the
4 Make the desired changes.
5 Click Ok.
Changing the range
To change the range:
Echogram dialogue box.
1 Position the cursor in the Echogram view.
2 Click the right mouse button.
3 Select Range on the shortcut menu.
4 Observe either the Bottom Detection or Surface Range
dialogue box depending on the current setting.
5 Make the required changes
6 Click Ok.
Changing the vertical resolutio n
The vertical resolution of the echogram increases with a shorter
pulse duration.
Example: A pulse duration of 1.024 millisecond gives a vertical
resolution of 19.2 cm, whereas a pulse duration of 0.256
millisecond gives a vertical resolution of 4.8 cm. If the vertical
distance between two echoes is less than this, the two echoes
will be shown as one
Observe the following procedure to change the pulse duration:
1 Click Operation on the main menu, and select Normal.
- Observe that the Normal Operation dialogue opens.
18
2 Set the desired pulse duration for each of the frequency
channels.
3 Click Ok.
A small value gives the best resolution, while larger values
provides you with a longer detection range.
850-164692 / Rev.B
Page 27

Operational procedures
Setting minimum and maximum depth
Setting the minimum and maximum depth enables the echo
sounder to search for bottom lock.
Note Setting both Minimum Depth and Maximum Depth to 0 m will
turn off bottom detection.
1 Position the cursor over the depth information in the
Depth view.
2 Click the right
mouse button.
3 Select Bottom Detector from the shortcut menu.
4 Set minimum and maximum depth to the desired values.
5 Click Ok.
Related topics
→ Bottom Detection, page 52.
→ Echogram, page 67.
→ Normal Operation, page 102.
→ Surface Range, page 119.
850-164692 / Rev.B
19
Page 28

Simrad ER60 Operator manual
Transceiver installation
Use the following procedures to install, modify or delete
frequency channels from the echo sounder set-up.
Background
General Purpose Transceivers (GPT) physically connected to the
echo sounder’s ethernet interface are identified automatically by
the system. When you open the Transceiver Installation
dialogue box from the Install menu, a list will be provided.
A single frequency transceiver occupies one entry in the list.
This entry is identified as a Frequency Channel, and the line
displays the parameters for the channel. Entries in the frequency
channel list are shown in black, green, blue or red colour
identifying its current status.
To install a channel
1 Select Transceiver on the Install menu.
-TheTransceiver Installation dialogue box opens, and
you are allowed to make changes.
2 Click the desired entry (one of the black colour line
alternatives) in the Frequency Channel Selection list.
3 Assign a transducer by selecting a transducer name in the
Transducer Selection list.
4 Click OK.
To uninstall a channel
1 Select Transceiver on the Install menu.
-TheTransceiver Installation dialogue box opens, and
you are allowed to make changes.
2 Click the desired entry in the Frequency Channel
Selection list.
3 Select the alternative NONE in the Transducer Selection
list.
4 Click OK.
20
Related topics
→ Transceiver Installation, page 123
850-164692 / Rev.B
Page 29

Operational procedures
Data recording and playback
Background
You can set up the echo sounder to record unprocessed
transducer signals (sample data) and external sensor information
onto files. These files contain the necessary information to
reconstruct the situation during the real survey. The echo
sounder program reads these files during replay.
Recording
Prepar
ations
The recording is prepared as follows.
1 Open the Output menu, and select File.
2 Observe the Output File dialogue open.
3 Select the tab Directory and push the Browse button if
you wish to change the direcory to which the files are
stored.
4 Press the Raw Data tab to define how the raw data is to
be recorded:
- Save raw data: Start/stop recording of raw data.
- Range: Select the depth range to be recorded. This
range, referring to the transducer face, is independent
of any other range settings in the echo sounder.
- Echogram data: This is user defined excerpts of the
processed sample data (pixel data), ie the backscatter
value of the targets. The echograms are stored as time
tagged datagrams in separate files.
5 If necessary, limit the maximum size of a single file.
- The current file will be closed and a new file will be
automatically generated when either the Max vessel
distance or the Max. file size limit is reached.
6 Click OK to exit the dialogue.
850-164692 / Rev.B
Start and stop recording
Use either the Toolbar buttons or the Save raw data check box
in the File Output dialogue to start or stop recording of data.
Note on size of stored raw data
The size of the raw data files stored depends on several user
selections. From these selections you may estimate
approximately the total amount of raw data stored in a given
time period for each installed channel using the following
equation:
X = B bytes per sample * (8*R)/(c*tau) samples per ping * M
ping per sec * 24 * 3600 sec per day
21
Page 30

Simrad ER60 Operator manual
where:
X = Total amount of stored raw data in bytes for one channel
B = 4 (Given by the resolution of the sample data)
R = Selected range in meters (User defined)
c = Sound speed in water in meters per sec (User defined)
tau = Pulse duration in seconds (User defined)
M = Ping rate in ping per seconds (User defined)
Thus, you can affect the amount of stored raw data by changing
e.g. the range, pulse duration, and ping rate settings.
Playback of a single file
The playback is started as follows:
1 Open the Operation menu, and select Replay.
- Observe the Replay dialogue.
2 Select the single file to be played.
- If no file is listed, click the Add button to select. Note
that only one replay file can be listed if this single file
shall be replayed.
3 Click Loop if you wish to loop through the selected file
endlessly.
4 Click OK.
5 Click the Play buttonintheToolbar.
During playback, the ping rate is not limited by the speed of
sound in water. Hence, it is possible to select a higher ping rate
than during normal operation.
Playback of multiple files
The playback is started as follows:
1 Open the Operation menu, and select Replay.
- Observe the Replay dialogue.
2 Click the Add button to select playback files
- You can place any number of files in the list in the
Replay dialogue.
22
3 Click the first file you wish to play back.
4 Click Loop if you wish to loop through the the files
endlessly.
5 Click OK.
6 Click the Play buttonintheToolbar.
850-164692 / Rev.B
Page 31

Operational procedures
Even though you only select one file in the Replay dialogue, the
ER60 will play through all of them in the same order as they are
listed. If Loop is enabled, the playback will return to the first
file, and play through all of them one more time. This will be
repeated until the playback is stopped.
During playback, the ping rate is not limited by the speed of
sound in water. Hence, it is possible to select a higher ping rate
than during normal operation.
Related topics
→ Toolbar, page 5
→ File Output, page 80
→ Replay, page 114
850-164692 / Rev.B
23
Page 32

Simrad ER60 Operator manual
Calibration
Introduction
Purpose
For acoustic surveys where accurate quantitative measurements
are required it is essential that the echo sounder is correctly
calibrated. It is a safe practice to perform the calibration before
and after the survey. If experiences over time show that no
adjustments are necessary, it may be appropriate to reconsider
the need for frequent calibrations. Simrad recommends that
calibration is performed at least once a year, and in areas with
different summer and winter condition at least twice a year.
Calibration principles
During calibration a reference target with known target strength
is lowered into the sound beam, and the measured target
strength is compared with the known target strength. If it is
necessary to adjust the echo sounder, this is performed
automatically by the ER60 calibration software. Since the echo
sounder is digital right from the receiver front end, no analogue
gain adjustment is required.
The reference target is normally a metal sphere. Simrad supplies
a variety of copper spheres, one for each frequency. The sphere
diameter is selected for minimum temperature dependence.
Preparations and transducer maintenance
The transducer is heavily exposed to fouling. Make sure that the
transducer face is painted after installation, and t hat the paint is
maintained whenever the vessel is in dry dock. Always use an
approved anti-fouling paint.
Depending on the environmental conditions where the vessel
operates, fouling must be removed from time to time. Failing to
do so will degrade the echo sounder performance. Use a soft
piece of wood and remove the fouling carefully. Afterwards, use
a very fine grade emery paper.
Note Do not remove fouling with a metal tool or wire brush.
24
850-164692 / Rev.B
Page 33
Procedures
Operational procedures
Check
installation
1 Check that the ER60 and all the transceivers and
transducers are installed correctly, and that they are all
fully functional.
2 Measure water salinity and temperature and enter these
data in the Environment dialogue box.
- The sound velocity is automatically calculated by the
echo sounder.
- The corresponding absorption coefficient is calculated
by the echo sounder according to Francois & Garrison,
JASA December 1982.
3 Use the ER60 to check that operation in Normal mode
functions properly for all transducers.
Sound speed (in m/s) (at depth 0 m)
1550
Salinity 40
1500
Figure 1 Sound
speed in water
1450
1400
0510
(CD467 / GIF / WMF)
Water temperature (i n C)
Salinity 0
15 20 25 30
o
Mackenzie (1981) J.acoust.Soc.Am., 70,807-12.
Anchoring
The following rigging description is to a great extent reproduced
from ICES report 144.
1 Find a location with calm and sheltered water.
- Avoid areas with large differences in tidal height, as
this gives strong tidal current. Also, avoid areas near
river mouths and harbours with heavy traffic. An area
with little or no fish present is favourable.
2 Ensure that the depth is sufficient for separation of sphere
and bottom echoes.
Del Grosso (1972) J.acoust.Soc.Am., 52,1442-6.
850-164692 / Rev.B
25
Page 34

Simrad ER60 Operator manual
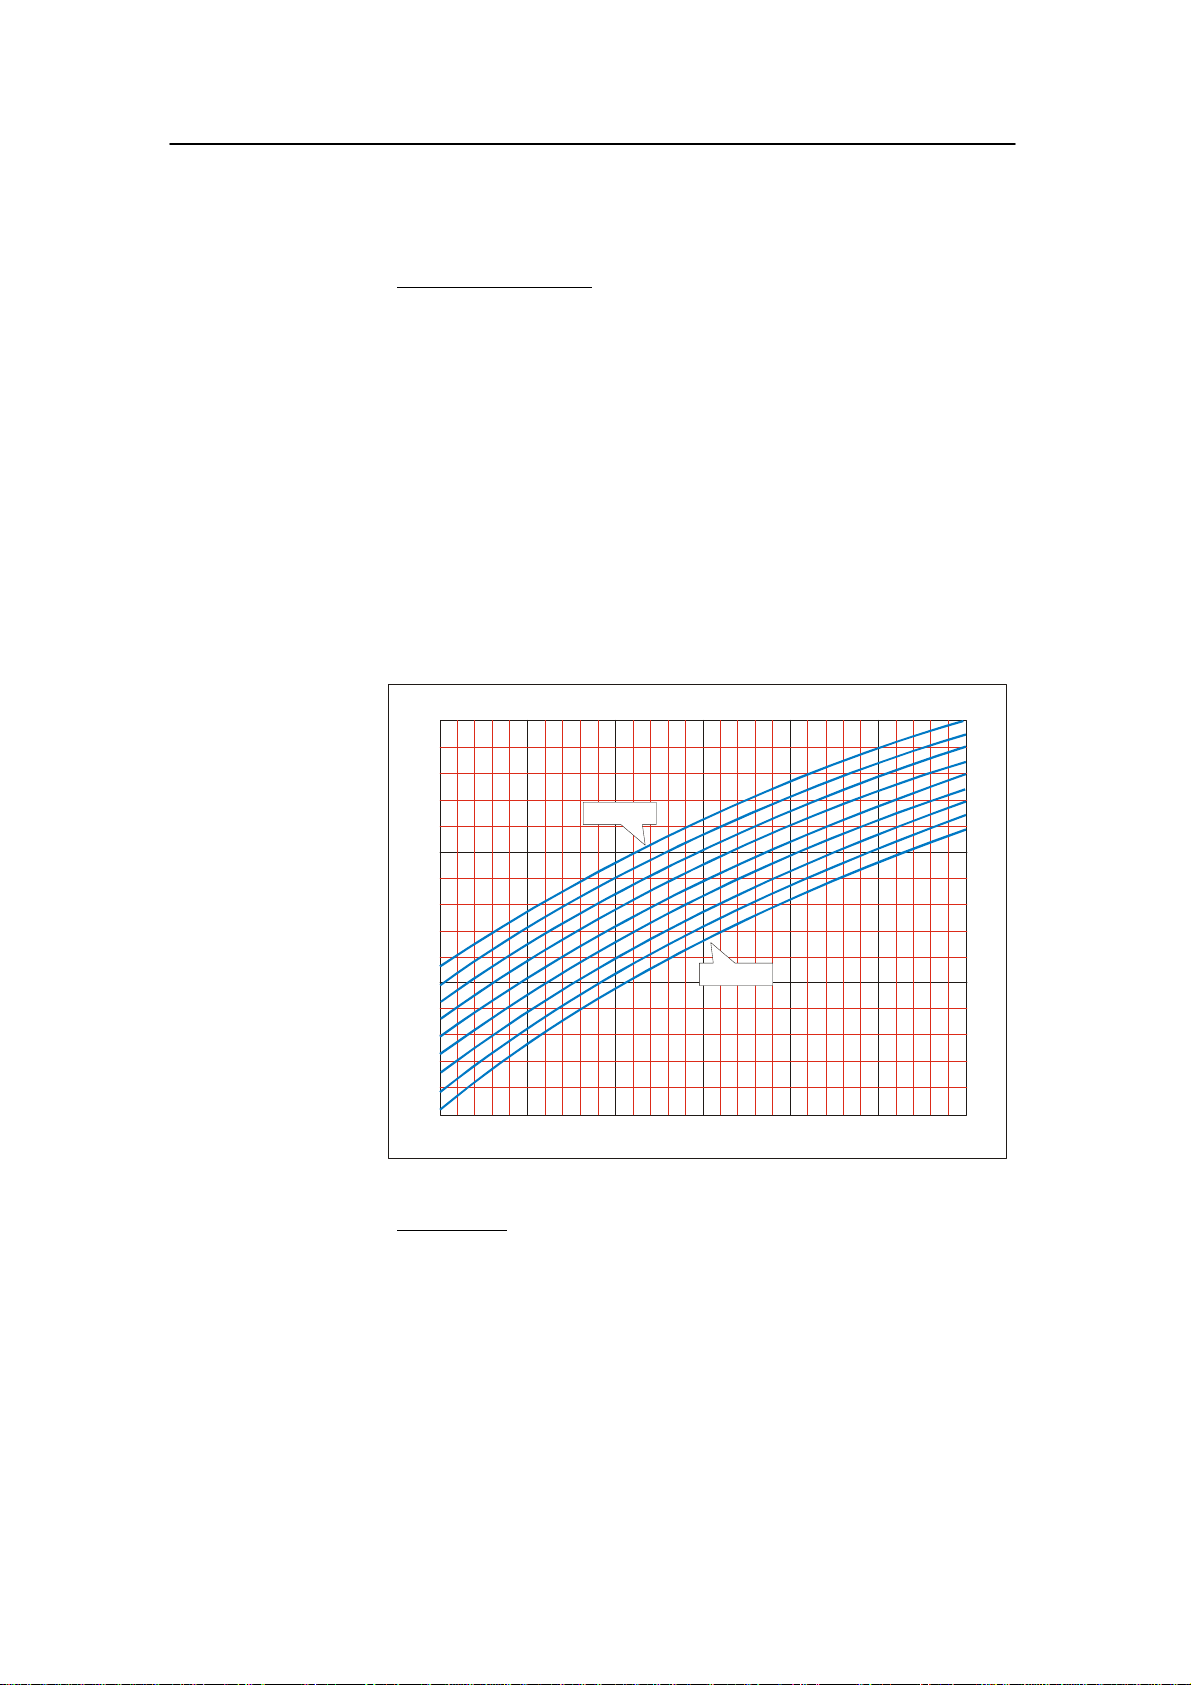
Sound absorption (dB/km)
60
from: Francois & Garrison, JASA, December 1982
10 C
200 m depth
50
pH = 8
40
30
20
o
%
5
3
0
3
5
2
0
2
5
1
0
1
5
Y
T
I
N
I
L
A
S
Figure 2 Sound
absorption
10
0
0
(CD468 / GIF / WMF)
25 50 75 100 125 150 175 200
Frequenc y (k H z )
0
3 Pull a rope beneath the hull from one side of the vessel to
the other.
4 Anchor the vessel.
It is desirable to work in water as deep as possible, consistent
with maintaining a stable platform. Both bow and stern
anchoring or mooring is recommended.
If the vessel is anchored or moored only fore or aft, the wind
will cause it to drift sideways. If the current then attacks with a
different angle, it will make a bad situation even worse. If the
vessel is allowed to move sideways, or if the current runs
abeam, this will normally give larger variations in the echo
sounder performance. This results in poor and not reliable
calibration accuracy.
26
Winches
We recommend the use of winches to guide and steer the lines to
the sphere for its centering in the echo sounder beam. These
winches must be mounted to the deck railing in accordance with
detailed ship drawings.
1 Place the first winch in the transverse plane of the vessel
running through the transducer.
- If the transducer is mounted on one side of the keel,
place the first winch on the opposite side of the vessel.
850-164692 / Rev.B
Page 35

Operational procedures
2 Place the second and third winches on the same vessel
side as the transducer and at equal distances from the
transverse section containing the transducer and first
winch.
WINCH 1
WINCH 2WINCH 3
(CD481 / GIF)
Figure 3
Rigging a vessel
for sphere
calibration
Each winch must be provided with a long spool of 0.60 mm
diameter monofilament nylon line, which is marked with small
swivels at 5 m intervals, beginning 10 m from the loose end.
The purpose of the swivels is threefold:
• to unravel rotation of the nylon line
• to mark distances on the line
• to add weight so that the line sinks in water
Attaching the sphere
1 Locate the rope pulled beneath the hull before anchoring.
2 Use this rope to pull the line from the first winch beneath
the hull to the side with the second and third winches.
3 Attach the appropriate sphere, with affixed loop, to the
three suspension lines.
850-164692 / Rev.B
27
Page 36

Simrad ER60 Operator manual
For the smaller spheres it may be necessary to add a weight to
keep the sphere stable. This is done via a second line attached to
the three suspension lines. The length of t he line must be at least
two pulse lengths, so that the echo from the additional weight
does not interfere with the sphere echo. Immerse the sphere in a
solution of dishwashing detergent and freshwater and lift it
overboard by the fastened lines without touching it. The soap
helps to eliminate air bubbles attached to the sphere.
Lowering the sphere
Lower the sphere beneath the vessel to the desired depth, for
example 25 m, which is determined roughly by counting the
swivels on each line.
The required depth is mainly determined by the transducer beam
width and the vessel geometry. The physical width of the beam,
which increases linearly with range, should be sufficiently great
so that the sphere echo is unaffected by the small movements to
which it is inevitably subjected.
In most cases calibration will be performed at depths larger than
10 m. However, the chosen depth should be limited to ensure
that it is possible to cover the entire beam. The minimal depth
must also be convenient with respect to the vessel geometry. In
particular, if the suspension lines do not hang freely, then
control of the sphere may be hindered by friction or possible
obstructions on the hull. Despite the number and variety of these
considerations, it is seldom difficult in practice to find a suitable
depth, which satisfies all of the above criteria.
Reference target
Simrad supplies copper spheres designed as reference targets for
the calibration of scientific sounders. Copper is selected because
it is a metal which can be made electrolytically with high purity.
The spheres are machined to the perfect spherical form with
great accuracy, and a nylon loop is attached. Except for 12 kHz,
49 kHz and 50 kHz, the sphere diameter is different for each
frequency in order to obtain a target strength with minimum
dependence of temperature (K. Foote 1983). A curve showing
the variation of the target strength follows each sphere.
28
850-164692 / Rev.B
Page 37

Operational procedures
Copper spheres
Frequency
(kHz)
12*
18
27
38
49*
50*
70
120
200
710
Diameter
(mm)
45.0
63.0
42.0
60.0
45.0
45.0
32.1
23.0
13.7
10.3
TS
(sound speed = 1490 m/s) (dB)
--40.4
--34.4
--37.9
--33.6
--36.4
--36.2
--39.1
--40.4
--45.0
--50.5
(*) = same sphere
The curve for the 38 kHz sphere is given as an illustration.
Figure 4 Target
strength of a 60 mm
copper sphere
Pulse duration (ms)
3.0
0.3
TARGET STRE NG TH (dB)
-34.5 -34.0 -33.5 -33.0
1400 1420 1440 1460 1480 1500 1520 1540 1560
SOUND SPEED (m/s)
60 mm copper sphere, 38 kHz
(CD3146)
Calibration using ER60
Only one frequency may be calibrated at a time. Thus, you must
uninstall all transceivers in ER60 except for the one you intend
to calibrate. When you have calibrated this frequency you must
uninstall the transceiver, install the next transceiver, and
calibrate this frequency, and so on until all frequencies are
calibrated.
850-164692 / Rev.B
All the different combinations of pulse duration and transmitter
power that will be used during normal operation of the echo
sounder must be calibrated.
First, create a well organised file directory for the calibration
results. Example:
c:\er60\calibration\2003\38kHz\0.256msec\
29
Page 38

Simrad ER60 Operator manual
The same structure can be repeated for the different pulse
durations for each frequency. When you save the calibration file,
create a file name that includes the current date and the current
output power. Save the information as a TXT file. Example:
....\0.256msec\cal010603-2000w.txt
While the calibration takes place, we recommend that you also
collect a raw data file. Browse the file directory in the Store
dialogue box to locate the correct directory. The raw data file
name will be generated automatically, but you may specify a
prefix. The raw data file is used for replay.
The same procedure can be repeated for each of the installed
frequencies.
Observe the following calibration procedure.
1 Ensure that only one transceiver is installed in the ER60
2 From the Operation menu, select Ping control.
echo sounder software.
3 In the Ping Control dialogue, set Ping rate to Interval
and 1 second.
- This can also be done from the Toolbar.
4 From the Operation menu, select Normal.
5 In the Normal Operation dialogue, select transceiver, and
switch to Active mode.
6 In the Normal Operation dialogue, set the Transmit
Power to the level you wish to calibrate.
7 In the Normal Operation dialogue, choose the Pulse
Duration you wish to calibrate.
8 Right-click in an echogram, select Range on the shortcut
menu, and set the range for one of the echogram views to
cover the range you wish to see.
- This range should include the depth range where you
expect to find the reference target.
9 Check that you see the reference target in the Single Echo
view.
10 Click the right mouse button in the Single Echo view
corresponding to the echogram to open the Single Target
Detection dialogue box.
30
11 In the Single Target Detection dialogue, click the
Calibration button to start the calibration program, and to
create a new Calibration window.
- The calibration program allows you to record new
calibration data, or read previously recorded calibration
data.
850-164692 / Rev.B
Page 39

Operational procedures
12 In the Calibration window, open the File menu, choose
New to open the Record dialogue and to start a new
calibration.
13 Enter the following data in the Record dialogue box:
a Transducer’s serial number.
b Correct theoretical TS for the reference target.
c Allowed deviation from the TS for the reference target.
(This is a window giving the limits for the system’s
acceptance of single target echoes coming from fish.
The closer to the correct reference target TS the limits
have been set, the more of the unwanted fish echoes
will be rejected. On the other hand, if the echo from the
reference target is too close to one of the limits, the
deviation has to be increased before starting collecting
data. This is because it will always be a certain
variation in TS values when the reference target i s
being moved to cover the complete beam.)
d Upper and lower depth limits for the target window. (A
narrow window will have same effect as above,
reducing the possibility of detecting unwanted echoes
from fish.)
e Any comments you may wish to add to the calibration
file
14 Click OK when you have finished entering data.
The calibration program will now begin recording data.
Views
YouwillseetwoviewsintheCalibration window; a Plot view
and an Information view.
A vertical bar is shown on the left side of each view. A blue
colour indicates that the view is active, while gray colour
indicates a passive view. If you wish to print a view, or perform
other operations connected to it, you must make sure that the
desired view is active.
In the Plot view you will see recorded data plotted as blue and
red circles. Blue circles indicate TS values below the current
beam model, while red circles indicate values above the current
beam model.
850-164692 / Rev.B
In the upper part of the Information view you will see various
information associated with recording of the calibration data.
Lines containing this information all begin with a #. Below this
information, recorded values for each new TS detection are
updated continuously during data recording.
31
Page 40

Simrad ER60 Operator manual
1 Move the reference target slowly around to record a
2 While moving the target you should keep the reference
3 While moving the target and recording of data points
4 Stop and restart recording as required by using the
sufficient number of data points (>100) evenly distributed
inside the beam. Make sure that a reasonable number of
hits are made close to the center of the beam. This is
important in order to ensure a correct estimate for the Sa
correction parameter.
target within the depth limits you entered in t he Record
dialogue.
stops, the measured TS value may be outside the limits
enteredintheRecord dialogue.
Stop/Start command found in the Main menu. It is
recommended to stop collecting data if unwanted fish
echoes are entering into the depth window, and restart
again when disappeared
5 When you have finished data recording open the File
menu, choose Save As to open the Save As dialogue.
6 Choose the directory where you want the calibration file to
be saved, and enter a file name for your calibration file.
7 Click Save to finish.
The calibration program will now use two different models to fit
recorded data, a polynomial model and a beam model.
The Plot view will plot the model along with the recorded data
points. Blue circles indicate values below the model; red circles
indicate values above the model.
The green circles close to the centre axis indicate the points that
have been used when estimating the Sa Correction value.
In the View menu located on the menu bar you can control what
is shown in the Plot view. You can choose between results from
the polynomial model or the beam model. In the View menu you
can also choose the plot type for each of the two models. If you
choose the Polar command you will see a polar plot from
“above”. The other plot types are cartesian showing a slice
through the model. You may toggle between the plot types using
the space bar on your keyboard.
32
850-164692 / Rev.B
Page 41

Operational procedures
The polynomial model is a flexible function capable of
modelling complex function shapes. The polynomial model is
onlyusedtocheckinthePlot view that the estimated
polynomial model has the same shape as the shape of the beam
model. If the shape of the polynomial model is very different
from the shape of the beam model, this indicates that either
insufficient data have been collected, or some data points may
be associated with errors (broken cables or channel wires
mixed).
The beam model is the model actually used by the echo sounder.
The calibration program will adjust the parameters in the beam
model to minimise the RMS-error calculated on t he recorded
data points. The adjusted parameters, the RMS-error, and the
data points having maximum and minimum deviation from the
model are shown in the Information view. The adjusted
parameters resulting from the beam model are the parameters,
which can be transferred to the echo sounder and used for the
transducer during operation. Information on data deviation from
the beam model will indicate how well the beam model fit the
recorded data. This can be used to evaluate the validity of the
recorded data points.
The data evaluation should start using the Plot view and the
polynomial model to check the shape of the polar plot. A
circular transducer should have a circular beam and an elliptic
transducer an ellipse, both with only insignificant offset angles.
If a circular transducer in the Plot view shows an ellipse with
approximately 45 or 135 degrees axis, the reason may be one
missing quadrant in the transducer or one missing quadrant i n
the receiver. This symptom should also give approximately 2 dB
lower TS, i.e. 1dB lower transducer gain to compensate.
If a circular transducer in the Plot view shows an non circular
shape, and in addition substantial offset angles both athwart and
alongship, this indicates there may be something wrong in the
way the transducer is connected. In this case, you must select
the View menu and check the calibrated beamwidth, offset and
gain values. If one quadrant of the transducer is inversely
connected, the beamwidth will be approximately one degree too
wide, the offset angles will be approximately one degree off
centre in both directions and the calibrated gain can be in the
order of 6 dB lower than the default gain.
If two of the quadrants have been mixed up, the reference
sphere’s movements inside the beam will be incorrect. This can
be confirmed when the reference sphere is suspended in such a
way that you can move it in a specific direction. This direction
is either transversal or longitudinal in the transducer beam.
850-164692 / Rev.B
33
Page 42

Simrad ER60 Operator manual
However, this is only possible if the split beam transducer has
been correctly installed.
Data editing
In both the Information and Plot views, you may perform data
editing in the sense of excluding or including an accepted single
echo detection. A left or right mouse click will act as a toggle
function for this editing. The model is completely recalculated
for each change.
In the Information view, a suspended single echo will be
identified with an asterisk (*) on the left side of the view.
The Plot view will draw an “empty” circle to indicate
suspension of the single echo entry.
The data deviation from the beam model should for a good
calibration give a RMS value less than 0.2 dB. If unwanted
echoes have been observed during data collection, these should
preferably be removed from the file. If, when collecting data,
fish swim into the layer that includes the reference target, then
note where in the file this happens, and delete these echoes
before the beam data are updated. Data with large deviation
from the calculated curve are may be caused by poor acoustic
conditions or by back scattering objects other than the reference
target. Isolated echoes with large deviation from the calculated
beam pattern can be removed, but when a large amount of the
collected data diverge from the average, this indicates that the
acoustic conditions has been unfavourable. When the RMS
value is in between 0.2 and 0.4dB, this indicates conditions is
not perfect but still acceptable. When the RMS value is higher
than 0.4 dB the calibration is poor, and should preferably be
rejected and not used for updating of t he transducer parameters.
Updating transducer parameters
When you are satisfied with the calibration results you can use
the results to update your transducer parameters in the echo
sounder.
1 In the Calibration window, open the File menu and
choose Update Beam Data to perform this task.
Note This is a serious operation, which will affect the transducer
installation parameters and will thus affect all future results to
be obtained using the current transducer and pulse duration.
Thus, to prevent accidentally use of this operation, you are
asked to confirm this operation.
The changes take effect automatically the next time you start
normal operations on the echo sounder.
34
850-164692 / Rev.B
Page 43

Operational procedures
Previously recorded data
The Calibration program also allows you to work with
previously recorded calibration data.
If you have used the ER60 to record raw data from a previous
calibration session you may operate the ER60 in replay mode
and perform the described calibration procedure as if the ER60
was operating in Normal mode. When operating i n Replay
mode you can set the ping rate to maximum since this will not
affect the data quality.
Offline calibration
The calibration program may be run offline without an
operational ER60. To start it, locate the file calibration.exe. If
you have performed a standard installation, this file is normally
found in the following path:
c:\program files\simrad\scientific\ek60\bin\calibration.exe
If you have a calibration file previously generated by the ER60
calibration program, you can import the file in the calibration
program.
1 Open the File menu in the calibration window, choose
Open.
2 Select the file you would like to import, and click OK.
3 Examine and edit the previously recorded calibration data.
Edited data may be saved and you can update the transducer
parameters using the imported or edited calibration data. This
also enables you to use different calibration files from different
environmental conditions.
Related topics
→ Environment, page 77
→ Normal Operation, page 102
→ Ping Control, page 105
→ Single Target Detection, page 117
850-164692 / Rev.B
35
Page 44

Simrad ER60 Operator manual
Noise measurements at sea
Purpose
The final result of the noise measurements should be a plot of
the acoustic noise in front of the transducer versus vessel speed.
This plot may be compared with similar plots for other
transducers on the same vessel, or plots from other vessels. It
may thus serve as an evaluation of the transducer location and
the vessel noise radiation. In addition, the noise plot may be a
guide in choosing the vessel speed during acoustic surveys.
Since the propeller pitch and revolutions per minute influence
the noise level, it is important to determine the most favourable
combination of these factors. Normally a slow rotation and a
high pitch give the loer6t noise.
Basic guidelines
The noise measurements should take place at least one nautical
mile off shore, away from other ship traffic and with calm sea.
The water depth should be 200 m or more to avoid propeller
noise reflections from the seabed. The important parameter to
evaluate is the noise directly radiated from t he propeller into the
transducer. This noise should be measured at different vessel
speeds, from 0 to maximum speed in steps of 1 or 2 knots. The
vessel’s course must be kept steady during these measurements.
The noise level for 38 kHz with the vessel in deep water and
without sailing should be approximately -145 dBW or lower.
Minor increase can be expected for higher and lower
frequencies. When the speed increases the noise level will
normally increase as well, but a properly designed vessel should
only show a modest increase and mainly when approaching the
maximum speed.
With the settings specified below, the printer may be used to
produce an echogram as documentation for all the installed
transceivers. With some experience it should be possible to
reveal the acoustic noise source from looking at the echogram.
Typical sources may be propeller cavitation, small damages on
the propeller blade, the machinery, or flow-noise. It is a good
routine to save the echogram for comparison with later
recordings. The propeller noise will often be r evealed by the
pattern shown on the echogram. The distance between
succeeding high intensity fields in the pattern should correspond
with the number of propeller blades and the rotation speed.
Electrical noise from the ship’s mains supply and electrical
motors will give a pattern with distinct lines on the echogram
determined by the frequency of the mains supply. By choosing a
36
850-164692 / Rev.B
Page 45

Operational procedures
convenient range for the echogram, the distance between the
lines will give a good indication of the frequency causing the
noise.
Noise speed tests should be performed after all the frequencies
have been calibrated. All the frequencies can be measured
simultaneously. Thus, you should install all transceivers in
ER60.
Procedure
Observe the following procedure.
Initial set-up
1 On the Install menu, open the Transceiver Installation
dialogue. Ensure that all the transceivers are installed.
2 On the Operation menu, select Normal to open the
Normal Operation dialogue. Set the following
parameters:
a Passive mode
b Maximum transmit power
c Same pulse duration as used during the calibration
d 0.0 m transducer depth
3 From the Operation menu, open the Ping Control
dialogue. Set the following parameters:
a Maximum ping rate
b Switch off all external triggering
4 Right-click in the Echogram view, and select Echogram
on the shortcut menu to open the Echogram dialogue. Set
the following parameters:
a Surface reference
b Sv backscatter
5 Right-click in the Colour Scale view, and select Colour
Scale on the shortcut menu to open the Colour Scale
dialogue. Set the following parameters:
a Minimum level -100 dB (chosen to give a reasonable
ping rate)
850-164692 / Rev.B
b Maximum level -64 dB
6 Right-click in the Echogram view, and select Range on
the shortcut menu to open the Surface Range dialogue.
Set the following parameters:
a Start relative surface: 0 m
37
Page 46

Simrad ER60 Operator manual
7 On the Output menu, select File to open the File Output
8 Start the echo sounder.
Test loop: Increasing speed
Start the test loop with vessel speed 0 knots.
1 Make a short echogram recording, find the background
2 Increase the vessel speed with 1 or 2 knots, and wait until
3 Repeat the loop until the vessel has reached maximum
b Select a range that will provide a noise recording with
at least two or three colours on the echogram.
dialogue. Set the following parameters:
a Same range as in the echogram
b 0 Mb maximum file size
noise in the Numerical view, and note down the value.
the speed is stable.
speed.
Decreasing speed
Start with maximum vessel speed.
1 Start echogram recording.
2 Disengage the propeller as quickly as possible to allow the
vessel to slow down by itself.
3 Write down the time to tag each 1 or 2 knots speed
decrease.
4 Stop the echogram recording once the vessel has stopped.
If the noise decreases quickly towards the same level as at 0
knots when the propeller has been disengaged, this means that
the propeller mainly generates the noise. If the noise at
decreasing vessel speed is more or less equal to the noise level
at increasing speed, the noise is probable flow-noise. Usually
the noise is a combination of both.
Evaluation
If the noise is substantial and mainly caused by the propeller, the
procedure should be repeated with different combinations of
pitch and propeller speed if possible, to determine the most
favourable settings.
38
The echogram recording will give you immediate information
regarding the maximum possible detection range for the chosen
settings. The light grey colour on the echogram relates the depth
where the noise will mask the useful echo from biomass.
850-164692 / Rev.B
Page 47

Operational procedures
In order to allow the echogram to indicate the depth where the
selected back-scattering is reached, make the following settings:
• In the Echogram dialogue box, set Backscatter = Sv
(20 Log TVG).
• In the Colour Scale dialogue box, set the desired lower Sv
limit.
Example: If the desired lower Sv limit is -70 dB, and at the
same time a signal-to-noise ration of 10 dB is required, the
setting in the Colour Scale dialogue box for 20 log TVG
must be -80 dB. The depth where the light grey colour
appears on the echogram then indicates the maximum depth
where the desired Sv limit is obtained with a signal-to-noise
ratio of 10 dB.
When you select Backscatter = Sp (40 log TVG) in the
Echogram dialogue to record single object target strength, the
desired lower TS limit has to be set in the same way as above.
Example: If the desired lower TS limit is -50 dB, and at the
same time a signal-to-noise ratio of 10 dB is required, the
setting in the Colour Scale dialogue box for 40 log TVG
must be -60 dB. The depth where the light grey colour
appears on the echogram then indicates the maximum depth
where the desired lower TS limit is obtained with a
signal-to-noise ratio of 10 dB.
When the trial has been completed, the corresponding noise
level in dB re 1 µPa can be calculated for the described
procedure.
The instantaneous background noise is based upon one single
echo sample out of a fixed number of equidistant echo samples.
λ Wavelength = c/f
c Speed of sound (m per sec)
f Frequency (Hz)
G Transducer gain (dB)
SaCorr Sa correction value (dB)
850-164692 / Rev.B
The current transducer gain is found in the Transducer
Parameters dialogue box.
Print the next table, and use it to fill in the measured values.
39
Page 48

Simrad ER60 Operator manual
Ref 1 2 3 4 5 6 7 8
Engine revolutions
(rpm)
Propeller revolutions
(rpm)
Propeller
pitch
Vessel speed
(knots)
Background noise
(dBre1W)
NL from background
noise (dB re 1 µPa)
_____
Ref 9 10 11 12 13 14 15 16
Engine revolutions
(rpm)
Propeller revolutions
(rpm)
Propeller
pitch
Vessel speed
(knots)
Background noise
(dBre1W)
NL from background
noise (dB re 1 µPa)
_____ _____ _____ _____ _____ _____ _____ _____
_____ _____ _____ _____ _____ _____ _____ _____
_____ _____ _____ _____ _____ _____ _____ _____
_____ _____ _____ _____ _____ _____ _____ _____
_____ _____ _____ _____ _____ _____ _____ _____
_____ _____ _____ _____ _____ _____ _____ _____
_____ _____ _____ _____ _____ _____ _____ _____
_____ _____ _____ _____ _____ _____ _____ _____
_____ _____ _____ _____ _____ _____ _____ _____
_____ _____ _____ _____ _____ _____ _____ _____
_____ _____ _____ _____ _____ _____ _____ _____
_____ _____ _____ _____ _____ _____ _____ _____
Noise versus speed
40
850-164692 / Rev.B
Page 49

MENUS
Menus
Introduction
Menu navigation employed by ER60 Scientific echo sounder is
similar to other Windows-based software. Main menu topics
located in the menu bar at the top of the window provide access
to drop-down menus. Menu choices that are shown in grey are
not available for the current operation or operational mode.
Several parameters are also available using short-cut menus
accessed by clicking the right mouse button. For more specific
menu information refer to the menu descriptions listed below.
The ER60’s Main menu provides the following choices:
• Operation
• View
• Options
• Install
• Output
• Window
• Help
Each item on the main menu provides a drop-down menu with
additional choices.
850-164692 / Rev.B
41
Page 50

Simrad ER60 Operator manual
Drop-down menus
The following drop-down menus are available from the main
menu.
Operation
The Operation drop-down menu allows you to control the main
operational mode (Normal or Replay). The following choices
are available:
→ Normal, page 102
→ Replay, page 114
→ Ping control, page 105
→ Data source, page 63
→ Log in, page 93
→ Log out, page 94
→ Exit, page 79
View
The View drop-down menu allows you to toggle the presence of
the Toolbar and Status bar. The following choices are available:
→ Toolbar, page 121
→ Status bar, page 60
Options
The Option drop-down menu allows you defined certain
general parameters, such as tooltip contents and presentation
colours. You are also allowed to save your current settings. The
following choices are available.
→ Colours, page 59
→ Tooltip, page 122
→ Load settings, page 92
→ Save settings, page 115
Install
The Install drop-down menu allows you define the set-up
conditions for your echo sounder. The following choices are
available:
42
→ Transceiver, page 123
→ Navigation, page 96
→ Motion, page 95
→ Trawl, page 127
→ Environment, page 77
850-164692 / Rev.B
Page 51

Menus
→ Annotation, page 50
→ Remoting, page 111
→ Users and passwords, page 129
→ Port Management, page 107
Output
The Output drop-down menu allows you define the
configuration of the output data from the echo sounder. The
following choices are available:
→ File, page 80
→ Ethernet, page 78
→ Depth, page 66
Window
The Window drop-down menu allows you to open new channel
windows and control the arrangement of the windows. The
following choices are available:
→ New channel, page 100
→ Cascade, page 55
→ Tile, page 120
→ Close all, page 56
Help
The Help drop-down menu provides access to the online help
system. The following choices are available:
→ Contents, page 62
→ About, page 48
850-164692 / Rev.B
43
Page 52

Simrad ER60 Operator manual
Short-cut menus
The short-cut menus are accessed with the right mouse button
when the cursor is located in any of the views. Various menus
are provided depending on the current view.
Depth
The following choices are available from the short-cut menu in
the Depth view.
→ Bottom Detection, page 52
→ Print, page 109
→ Print Prieview, page 110
→ Configure Window, page 61
→ Hide View, page 86
Single Target Position
The following choices are available from the short-cut menu in
the Single Target Position view.
→ Single Target Detection, page 117
→ Colour Scale 40 log, page 59
→ Print, page 109
→ Print preview, page 110
→ Configure Window, page 61
→ Hide View, page 86
Single Target H istogram
The following choices are available from the short-cut menu in
the Single Target Histogram view.
→ Histogram, page 87
→ Single Target Detection, page 117
→ Colour Scale 40 log, page 59
→ Print, page 109
→ Print Preview, page 110
→ Configure Window, page 61
→ Hide view, page 86
44
Echogram
The following choices are available from the short-cut menu in
the Echogram view.
→ Echogram, page 67
→ Horizontal Axis, page 88
850-164692 / Rev.B
Page 53

Menus
→ Range, page 119
→ New Layer, page 101
→ Layer Properties, page 90
→ Delete Layer, page 65
→ Print, page 109
→ Print Preview, page 110
→ Configure Window, page 61
→ Hide View, page 86
Scope
The following choices are available from the short-cut menu in
the Scope view.
→ Print, page 109
→ Print Prieview, page 110
→ Configure Window, page 61
→ Hide View, page 86
Colour Scale
The following choices are available from the short-cut menu in
the Colour Scale view.
→ Colour Scale 40 log, page 57
→ Print, page 109
→ Print Preview, page 110
→ Configure Window, page 61
→ Hide View, page 86
Numerical
The following choices are available from the short-cut menu in
the Numerical view.
→ Numerical View, page 104
→ New Layer, page 101
850-164692 / Rev.B
→ Layer Properties, page 90
→ Delete Layer, page 65
→ Print, page 109
→ Print Preview, page 110
→ Configure Window, page 61
→ Hide View, page 86
45
Page 54

Simrad ER60 Operator manual
DIALOGUE BOXES AND FUNCTIONS
General
This chapter provides reference information about the dialogue
boxes and major functions used througout the Simrad ER60
Scientific echo sounder. The information is provided in
alphabetical order.
Topics
→ Alphabetical list of dialogues and functions, page 47
Related topics
→ Toolbar, page 5
→ Status bar, page 6
46
850-164692 / Rev.B
Page 55

Dialogue boxes and functions
Alphabetical list
The following is an overview of available dialogue boxes and
functions incorporated in the ER60 Scientific echo sounder.
→ About, 48
→ Add User, 49
→ Annotation, 50
→ Bottom Detection, 52
→ Bottom Range, page 53
→ Calculation Interval, 54
→ Cascade, 55
→ Close All, 56
→ Colour Scale, 57
→ Colours, 59
→ Configure Statusbar, 60
→ Configure Window, 61
→ Contents, 62
→ Data Source, 63
→ Delete Layer, 65
→ Depth Output, 66
→ Echogram, 67
→ EK500 Datagram, 73
→ Environment, 77
→ Errors, page 131
→ Ethernet Output, 78
→ Exit, 79
→ File Output, 80.
→ HAC Datagram, 85
→ Hide View, 86
→ Histogram, 87
→ Horizontal Axis, 88
→ LAN Port Setup, 89
→ Layer Properties, 90
→ Load Settings, 92
→ Log In, 93
→ Log Out, 94
→ Motion, 95
→ Navigation, 96
→ New Channel, 100
→ New Layer, 101
→ Normal Operation, 102
→ Numerical View, 104
→ Ping Control, 105
→ Port Management, 107
→ Print, 109
→ Print Preview, 110
→ Remoting, 111
→ Replay, 114
→ Save Settings, 115
→ Serial Port Setup, 116
→ Single Target Detection, 117
→ Surface Range, 119
→ Tile, 120
→ Toolbar, 121
Tooltip, 122
→
→ Transceiver Installation, 123
→ Transducer Parameters, 126
→ Trawl, 127
→ User Properties, 128
→ Users and Passwords, 129
→ Warnings, page 131
850-164692 / Rev.B
47
Page 56
Simrad ER60 Operator manual
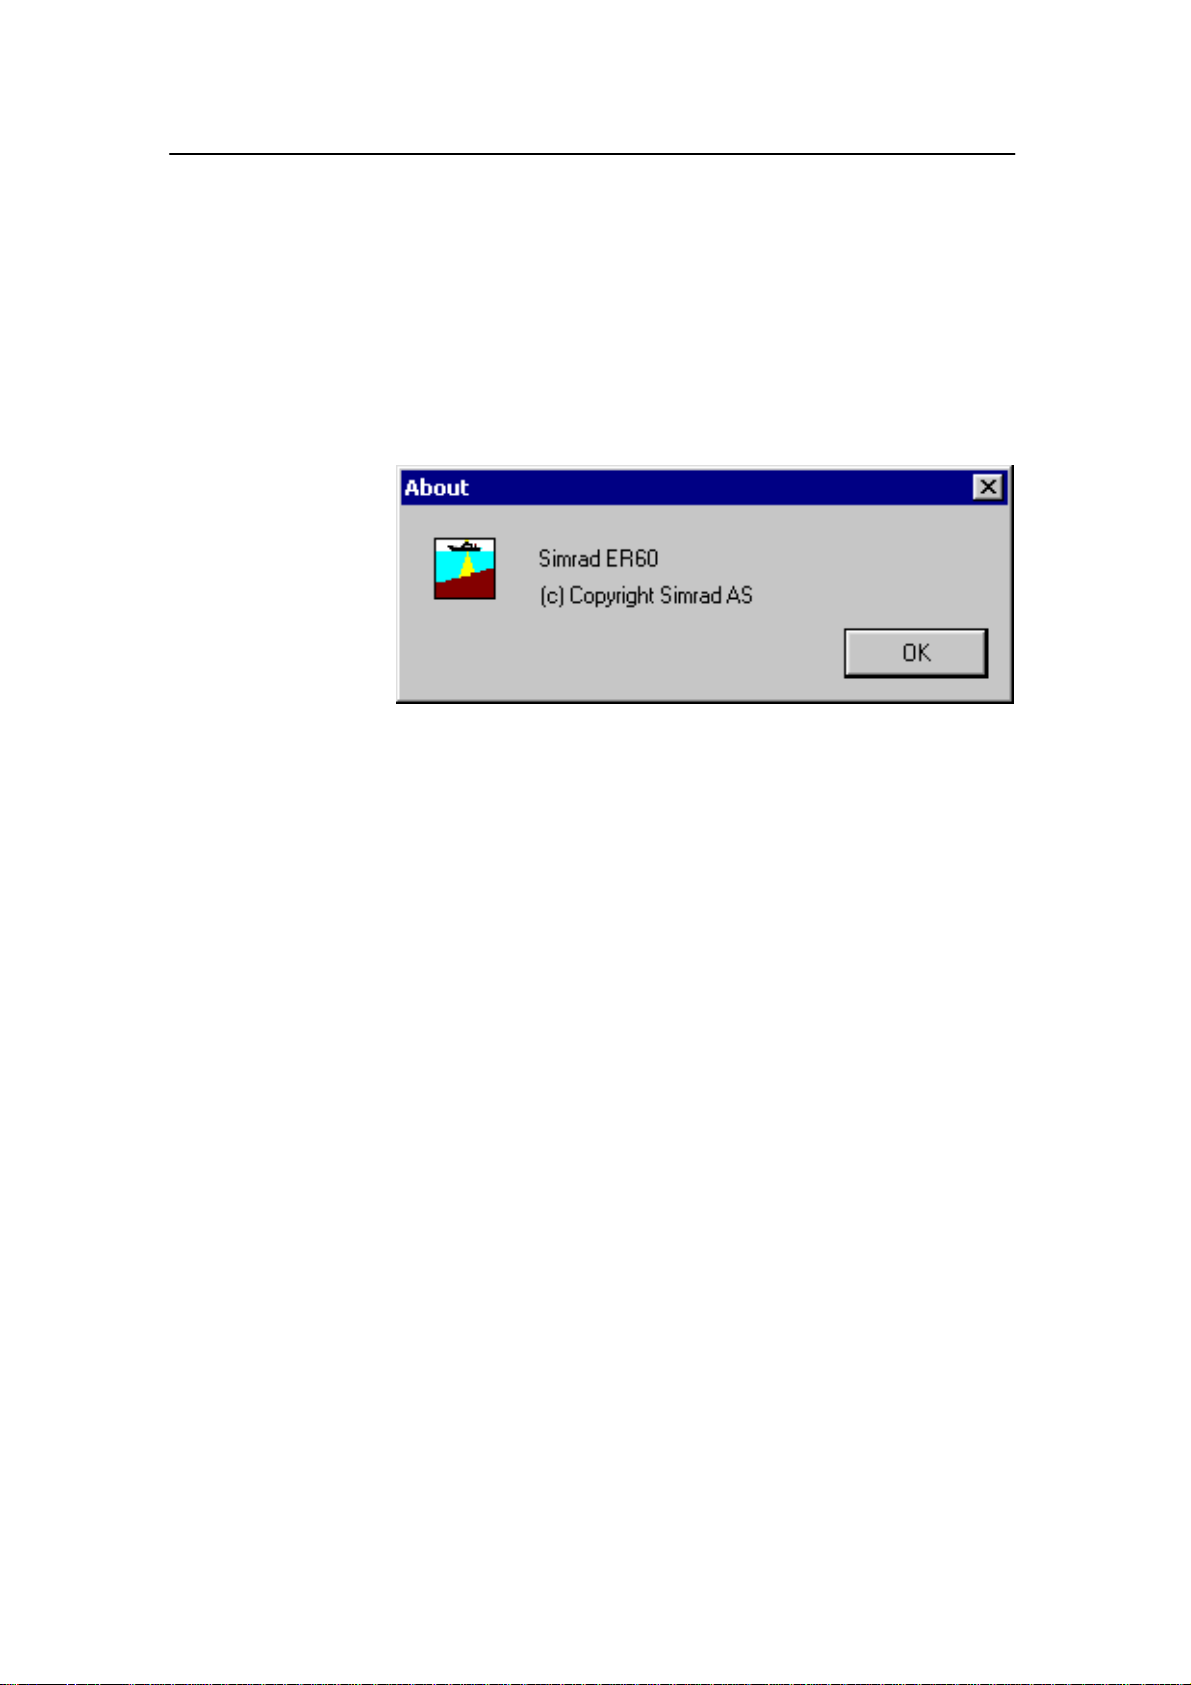
About
The About dialogue box is accessed from the Help menu. The
current ER60 software version and other related information is
provided here. Press OK to close the dialogue box.
Note that the software version displayed in this dialogue box
should match the software version described in this publication.
The current software version described here is 2.1.0.
48
850-164692 / Rev.B
Page 57

Dialogue boxes and functions
Add User
The Add User dialogue is accessed by pressing Add in the
Users and Passwords dialogue box.
This dialogue is used to enter user
information when a new user is added to
the program. The user must be assigned
an access level. These are described in
the User and Passwords dialogue box
description.
Related topics
→ Users and Passwords, page 129
→ User Properties, page 128
850-164692 / Rev.B
49
Page 58

Simrad ER60 Operator manual
Annotation
This dialogue box is accessed from the Install menu.
50
Purpose
This dialogue allows you to add annotations to the data. The
annotations defined are stored with the raw data as Annotation
datagrams. Annotations are displayed on the echogram if this
feature is enabled in the Echogram dialogue, and also included
on the Statusbar. Annotations can only be added during normal
operation.
850-164692 / Rev.B
Page 59

Dialogue boxes and functions
Manual
Click Text input to enter a free text string. The text is written to
the echogram once you click Ok in the Annotation Text Input
dialogue.
NMEA
This function enables NMEA Annotation datagrams to be
imported on the chosen port.
Event
This function initiates Annotation datagrams whenever an
event occur. Events may be triggered by external devices, set by
a timer, or initiated by clicking the Event icon on the toolbar.
Number - All events are identified with a number. This number
can be included in the annotation string. Using this feature, you
can manually select the next number to be used, and you can
choose to have the number series increase or decrease.
Text - Use this feature to select which items to be included in
the event generated annotation string.
Timer - Set a time period for automatic generation of events.
Triggering from external devices are made using pins 10 and 19
on the Auxiliary connector on the General Purpose Transceiver
(GPT). Refer to the EK60 Instruction Manual.
Last annotation
This text box automatically displays the latest annotation text
provided.
850-164692 / Rev.B
51
Page 60
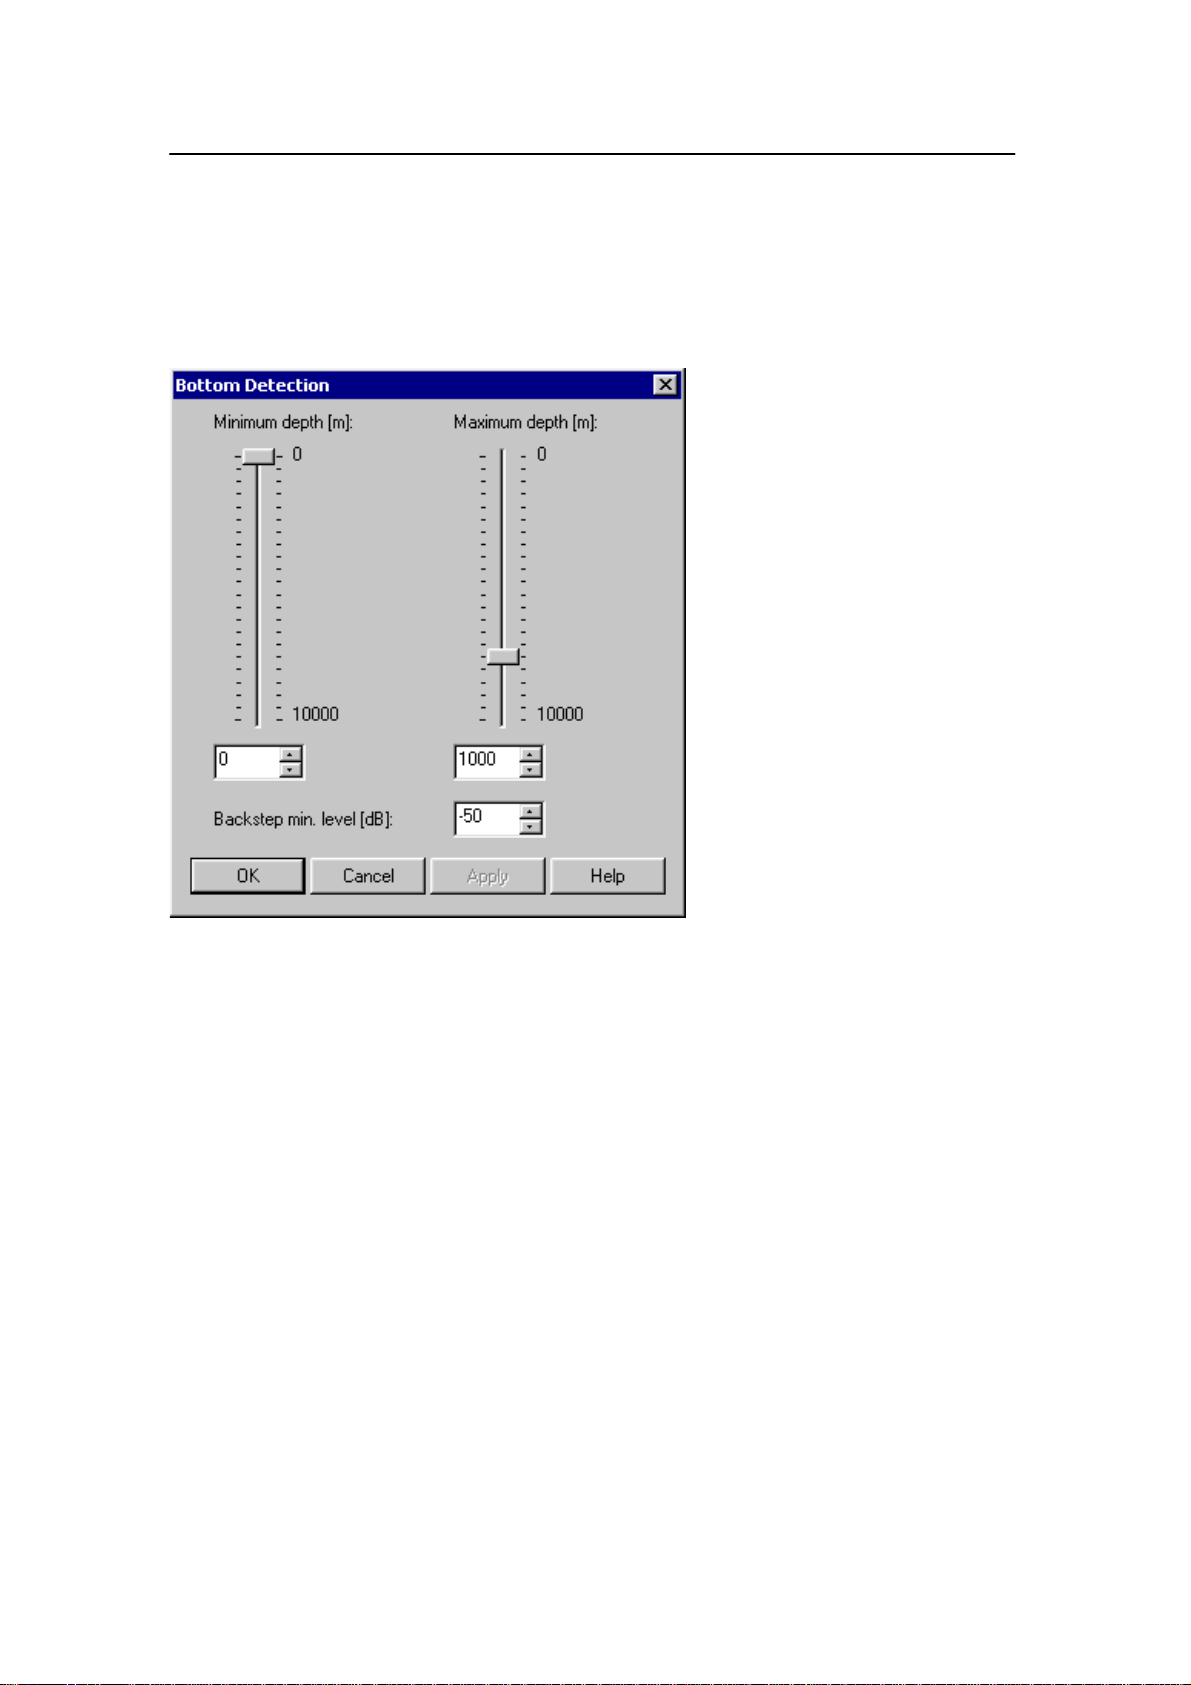
Simrad ER60 Operator manual
Bottom Detection
The Bottom Detection dialogue is accessed from the Depth
view shortcut menu.
Purpose
This dialogue is used to set
the parameters for the
bottom detection algorithm.
Note that only one set of
bottom detector parameters
are valid for a frequency
channel. This means that
changes made in this
dialogue will have effect on
the bottom detector settings
for all depth views for the
same frequency channel!
Parameters
Minimum Depth -The
bottom detector starts the
search for the bottom echo at
this depth. The detector will
fail in shallow water if you
select a too large depth
value, and the tail of the
transmitting pulse or a large
school of fish may cause
problems if a too small value
is set.
Maximum Depth - The search for the bottom echo extends
down to this depth whenever bottom track is lost. Enter a
slightly larger depth value than the deepest spot you expect to
visit in order to avoid annoyingly long ping intervals every time
bottom track is lost. A depth value of 0 disables the bottom
detector.
Backstep Min. Level - After the estimated depth of the bottom
detector, the detected depth is automatically adjusted by
stepping back according to the value of the setting you have
chosen. This allows the echo sounder to verify that the correct
bottom depth has been located. If the value you enter is too
large (close to 0 dB) the adjustments will be very small. The
default value is -50 dB.
52
850-164692 / Rev.B
Page 61

Dialogue boxes and functions
Bottom Range
The Bottom Range dialogue box is accessed from the short-cut
menu in the Echogram view .
Purpose
This dialogue is used to specify the vertical depth range for the
Echogram view.
Surface or Bottom?
The dialogue title and the range settings will be surface related
if the dialogue is opened while the echogram displays a surface
referenced echogram.
The dialogue title and the range settings will be bottom related
if the dialogue is opened while the echogram displays a bottom
referenced echogram.
Parameters
Refer to the descriptions for the Surface Range dialogue.
Related topics
→ Surface Range, page 119
→ Echogram, page 67
→ Echogram view, page 11
850-164692 / Rev.B
53
Page 62

Simrad ER60 Operator manual
Calculation Interval
The Calculation Interval dialogue box is accessed from the
Options menu.
This interval can be any value for distance, time or ping. Use
the settings in this dialogue to define each of these three interval
factors.
Purpose
This dialogue box is used to
define how often the echo
sounder program will
perform certain calculations.
Several parameters in the
echo sounder are only
calculated once for a set
interval.
A vertical line is displayed in the echogram views whenever a
new calculation interval is started.
Use
Choose if the calculation interval shall be based on distance,
time or number of pings. Choose the interval and the unit
accordingly using the appropriate spin boxes.
Related topics
→ Numerical view, page 14
54
850-164692 / Rev.B
Page 63

Dialogue boxes and functions
Cascade
The Cascade function is accessed from the Window menu.
This function is identical to the common function available in
the operating system. The active windows are presented in
cascade; ie partly on top of each other with the top bar shown.
Related topics
→ Tile, page 120.
850-164692 / Rev.B
55
Page 64

Simrad ER60 Operator manual
Close All
The Close all function is accessed from the Window menu.
Once activated, it will close all open windows.
To open new windows, select New channel from the same
menu.
Related topics
→ New channel, page 100
56
850-164692 / Rev.B
Page 65

Dialogue boxes and functions
Colour Scale
The Colour Scale dialogue is accessed from any of the
following views: Single Target Position, Single Target
Histogram and Colour Scale.
Purpose
The purpose of this dialogue box is to change the dynamic range
of the colour scale. The total number of colours used in the
presentation will be distributed between the minimum and
maximum levels identified in this dialogue. Values above
maximum level are shown using the “max level” colour, while
values below are shown with the background colour.
20 or 40 log
When the dialogue is launched from the Single Target Position
and the Single Target Histogram views, the colour scale
represents colour mapping for the 40Log TVG function. This
TVG function is always used for target strength estimation for
single targets.
When the dialogue is launched from the Colour Scale view, the
TVG function depends on which acoustic variable is chosen for
display on the corresponding Echogram view. This is because
the colour scale view represents the colour mapping for the
Echogram view.
The TVG functions can be either: No, 20Log,or40Log.
850-164692 / Rev.B
Parameters
Min.level / Max.level - Use the spin boxes or sliders to set the
levels. Altering the maximum or minimum levels will
automatically adjust the colour step.
57
Page 66

Simrad ER60 Operator manual
Colour step - Use this setting to define the range in dB each
colour will cover. Altering the colour step will automatically
adjust the maximum level.
Applytoall- Check this box to make the chosen settings apply
to all views.
Related topics
→ Single Target Position, page 9
→ Single Target Histogram, page 10
→ Colour scale view, page 13
→ Colours, page 59
58
850-164692 / Rev.B
Page 67

Dialogue boxes and functions
Colours
The Colours dialogue box is accessed from the Options menu.
Purpose
This dialogue is used to set colour parameters for the echo
sounder program.
Parameters
No. of Colours - Set the number of colours to use, 12 or 64.
Echogram Colour Scale - Select the desired colour scale from
the drop-down list. Note that all colour scales except Smooth
Echosounder require that the number of colours is set to 64.
Palette - Select the colour palette for the echo sounder. This is a
personal choice based on the ambient light conditions. Note that
all the colours on the ER60 computer -. even other programs
running on the computer - are affected!
Note Do not confuse this dialogue with the Colour Scale dialogue!
Related topics
→ Colour Scale, page 57
850-164692 / Rev.B
59
Page 68
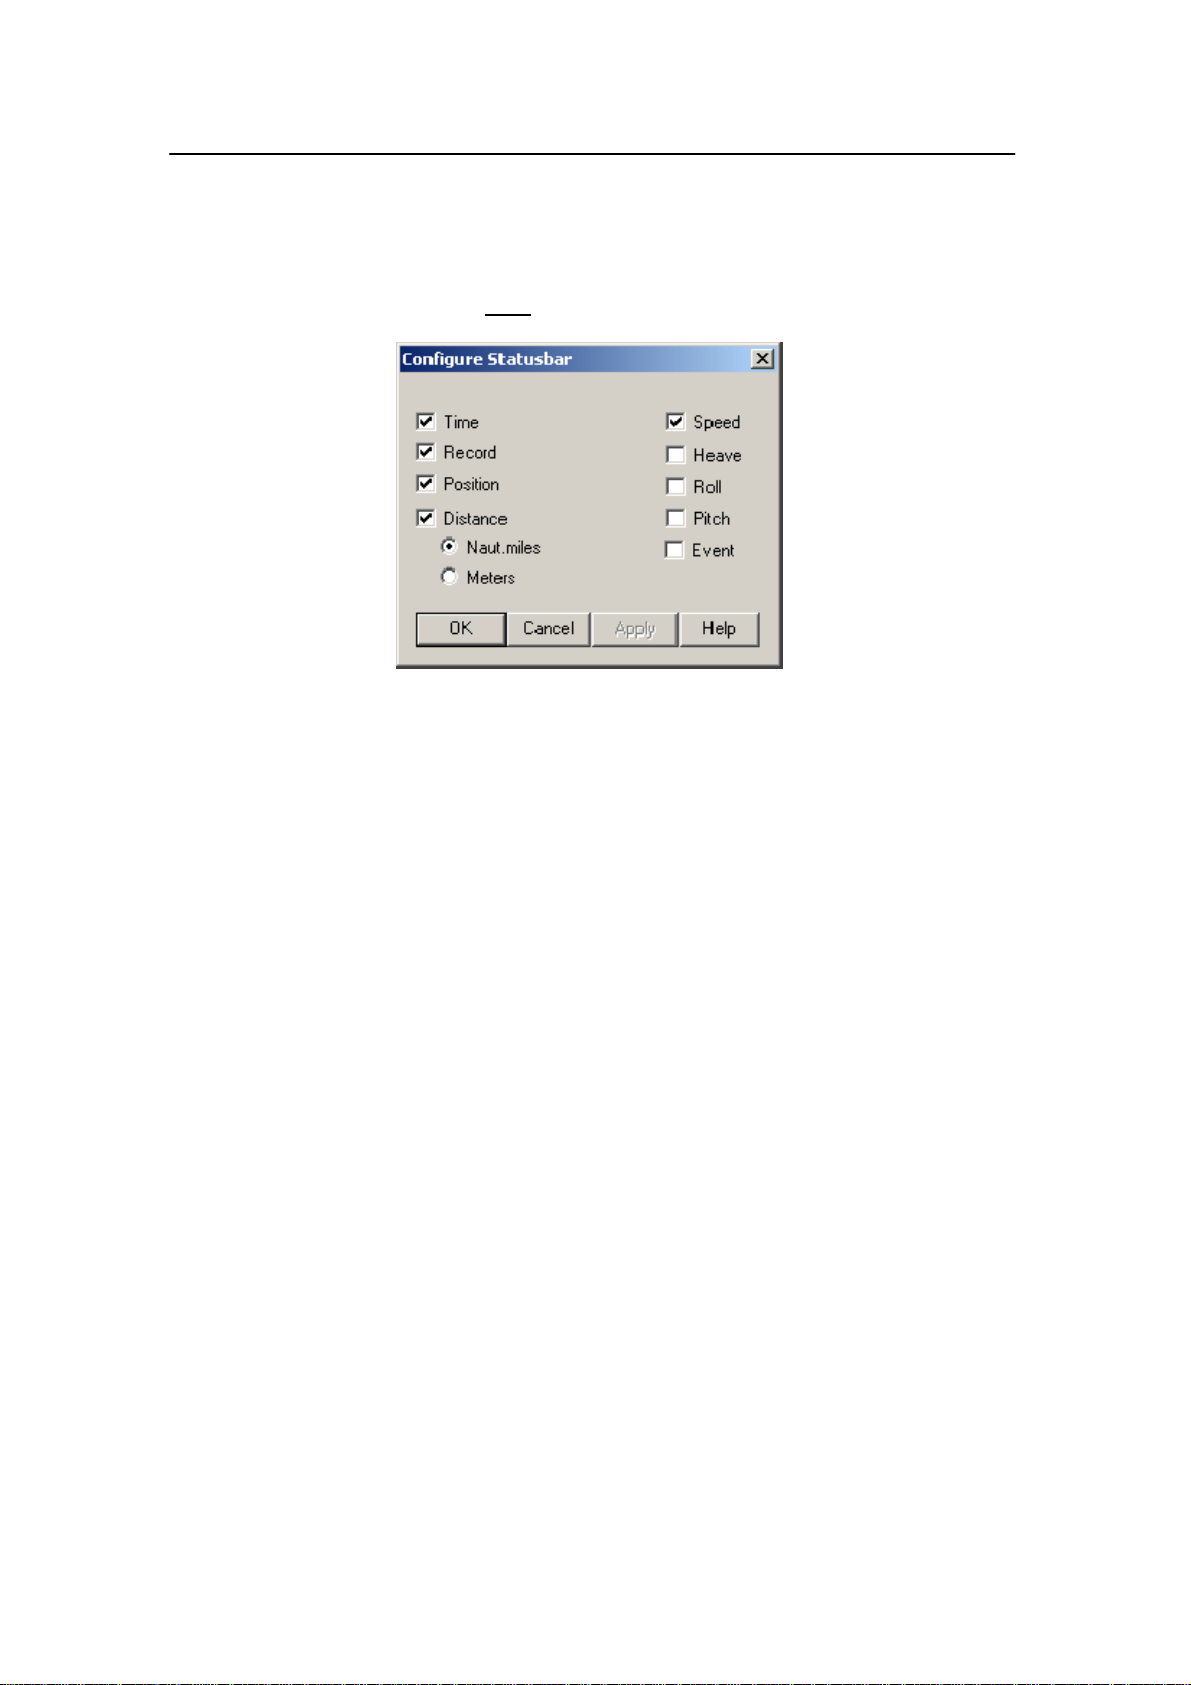
Simrad ER60 Operator manual
Configure Statusbar
The Configure Statusbar dialogue box is accessed when you
click the right mouse button on the Statusbar.
Purpose
This dialogue is used to select which sensor information to
display on the Statusbar.
Related topics
→ Statusbar, page 6
60
850-164692 / Rev.B
Page 69

Dialogue boxes and functions
Configure Window
The Configure Window dialogue is accessed from the shortcut
menu in all the views.
Purpose
This dialogue is used to set
which views to show in the
active window.
Use
Use the check boxes to show
or hide views in the window.
Hiding a view does not
disable it. This means that all
data for this view are still
collected while the view is
hidden.
Related topics
→ Depth, page 8
→ Single Target Position, page 9
→ Single Target Histogram, page 10
→ Echogram, page 11
→ Scope, page 12
→ Colour scale, page 13
→ Numerical, page 14
850-164692 / Rev.B
61
Page 70

Simrad ER60 Operator manual
Contents
The Contents dialogue box is accessed from the Help menu. It
opens the first page of the context sensitive on-line help system.
62
850-164692 / Rev.B
Page 71
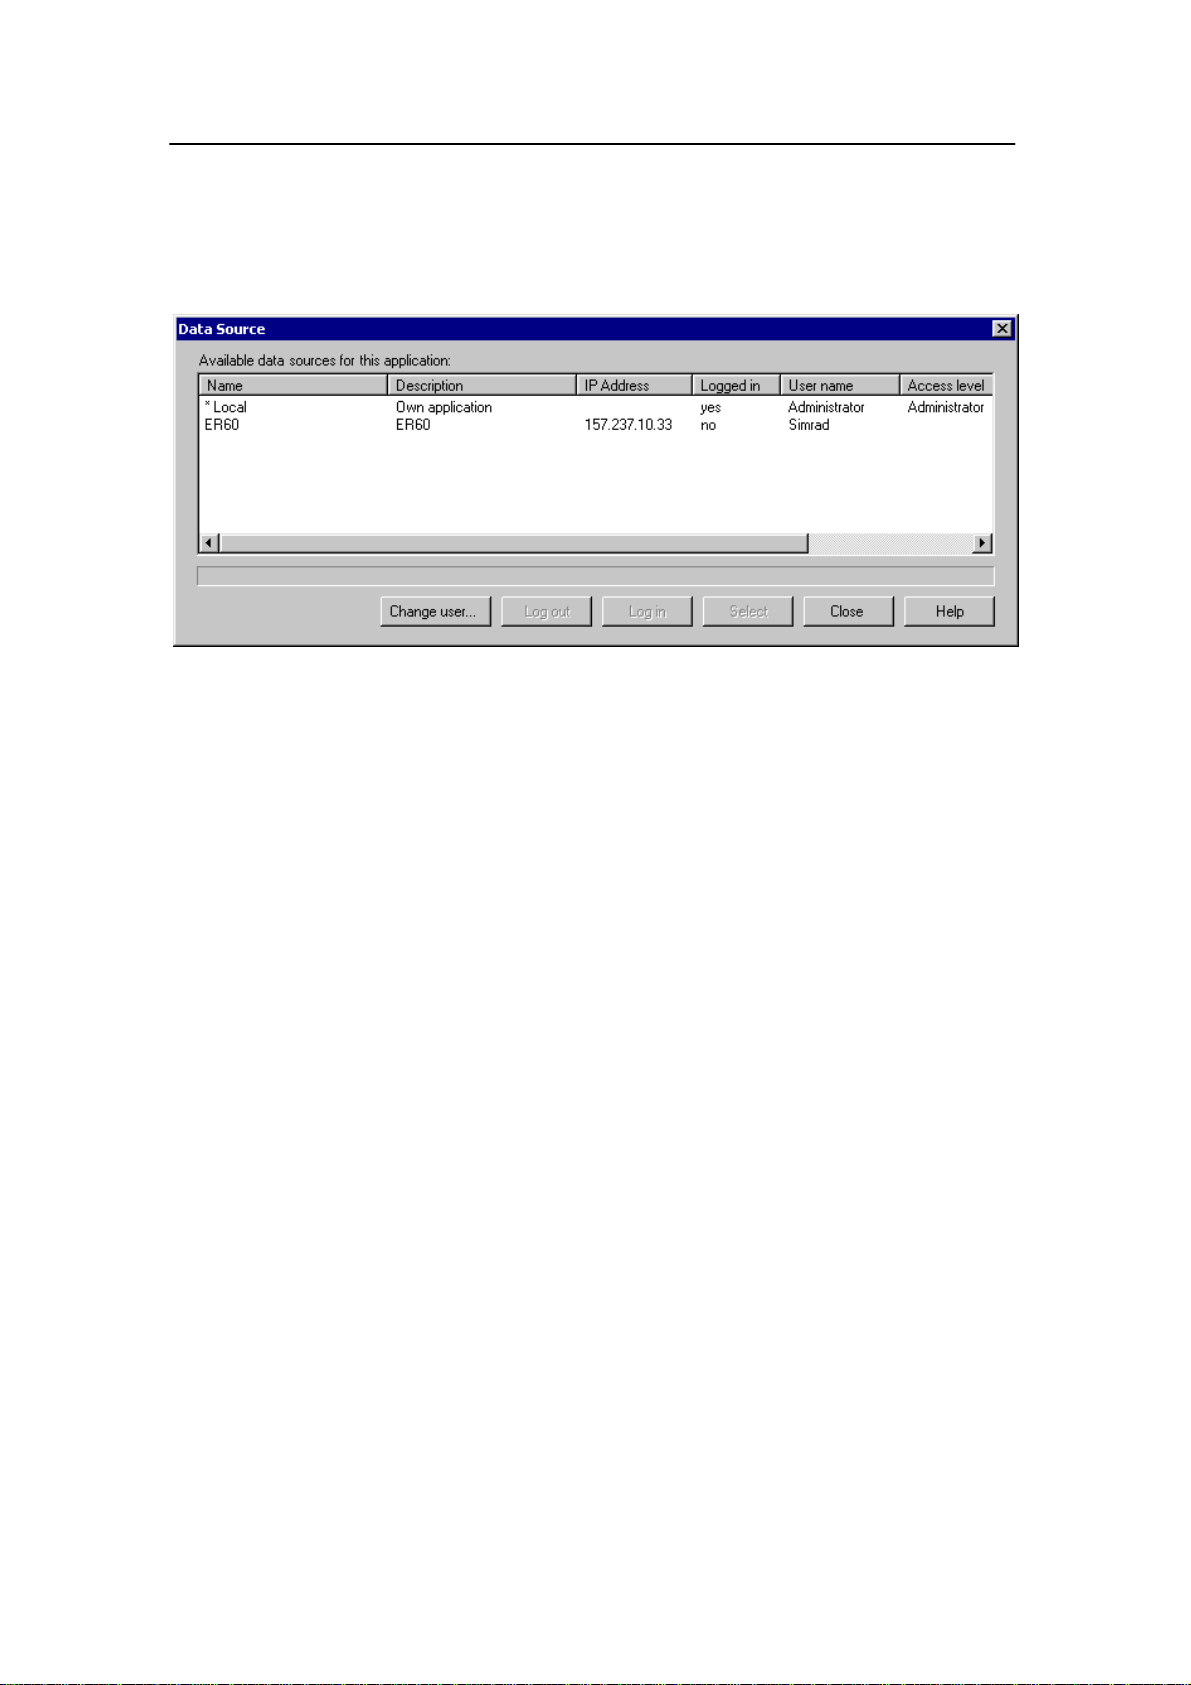
Dialogue boxes and functions
Data Source
The Data Source is accessed from the Operation menu.
Purpose
This dialogue box is used to select where the echo sounder
program shall obtain its data from. It can be used to connect to
an echo sounder program running on a remote computer. This
means that any computer on the network running the ER60
software can connect to the echo sounder computer and run the
sounder independently.
Use
The dialogue displays a list of echo sounder programs running
on the network to which the ER60 Processor Unit is connected.
If the Processor Unit is not connected to other echo sounder
programs, the list will only contain one entry. T his single entry
is the echo sounder program running on the local processor unit.
You will not be able to perform installation operations (e.g.
transceiver and sensor installation) on other entries than the
local echo sounder program.
To perform operations on an entry in the list, the entry must be
highlighted (selected). To do this, click once the entry.
Parameters
850-164692 / Rev.B
Name - This column displays the installation name of the echo
sounder program entry. An asterisk (*) in front of an entry
means that this entry is currently selected data source. Only one
entry can be selected at a time. The installation name is defined
in the Remoting dialogue.
Description - This column displays a short description of this
program. The description is defined in the Remoting dialogue.
63
Page 72

Simrad ER60 Operator manual
IP address - This column displays the IP address of the
computer running the echo sounder program.
Logged in - This column displays if the you are logged in to
this echo sounder program entry.
User name - This column displays the user name to be used
when logging in to the program. The user name must exist on
the remote application for the log in to succeed. For more
information on adding users refer to the Remoting dialogue.
Access level - This column displays the access level for the user
name.
Change user - Click this button to change the user name used
when logging in to the selected entry. Once pressed, the Users
and Passwords dialogue box opens.
Log in - Click this button to log in to the selected entry.
Log out - Click this button to log out from the selected entry.
Select - Click this button to define the selected (highlighted)
entry as the current data source.
Related topics
→ Login, page 93
→ Remoting, page 111
→ User and Passwords dialogue, page 129
64
850-164692 / Rev.B
Page 73

Dialogue boxes and functions
Delete Layer
The Delete Layer function is available from the shortcut menus
in the Echogram and Numercial views.
Purpose and use
This command is used to delete the active (selected) layer in the
view. The layer is identified with red text in the Numerical
view.
To create a new layer, select New Layer from the shortcut
menu.
To change the layer properties, select Layer Properties from
the shortcut menu.
Related topics
→ Echogram view, page 11
→ Numerical view, page 14
→ Layer Properties, page 90
→ New Layer, page 101
850-164692 / Rev.B
65
Page 74
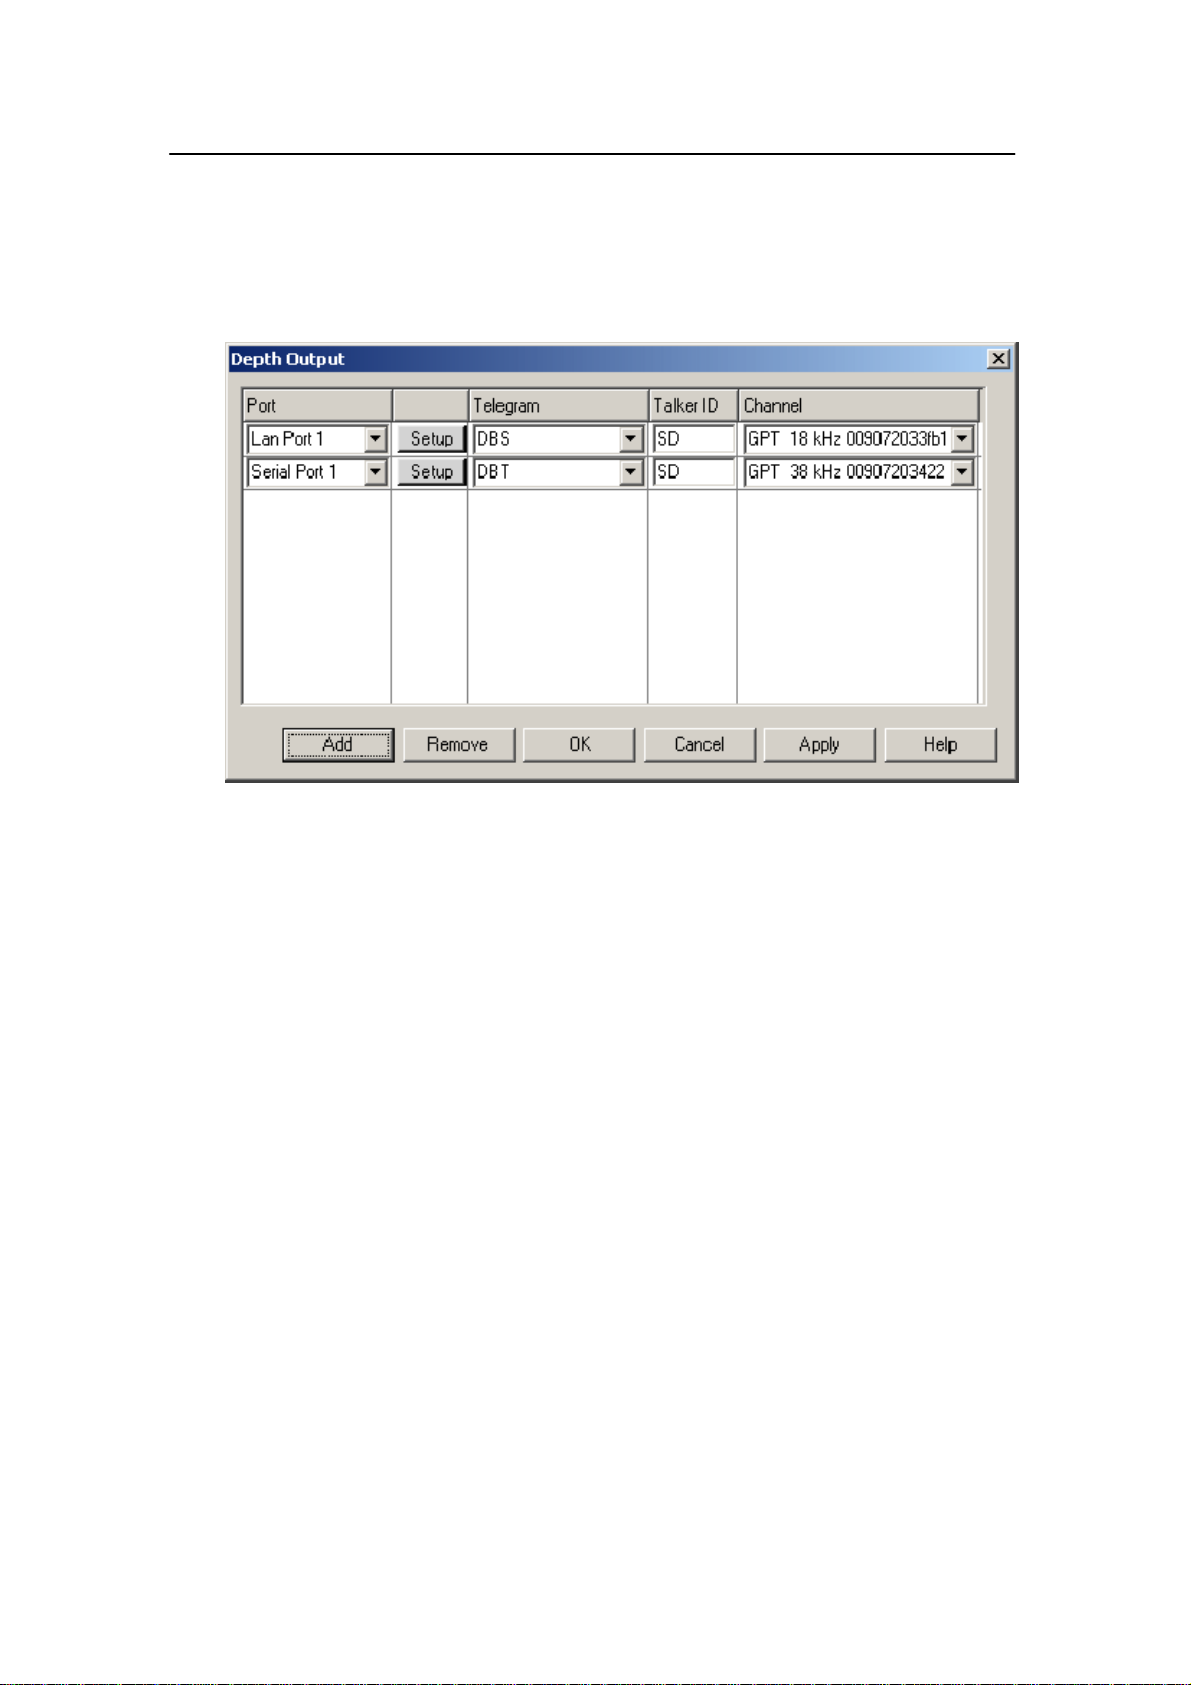
Simrad ER60 Operator manual
Depth Output
The Depth Output dialogue box is accessed from the Output
menu.
Purpose
This dialogue box is used to output depth data to a dedicated
communication port on a specified format.
Parameters
Port - Select which serial or LAN port to be used for the data
communication.
Setup - If required, you can set up the necessary communication
parameters for the selected port. Note that the changes made for
the applicable port are global.
Telegram - Choose telegram format on the output stream. A list
of permitted types is available.
Talker ID - Select NMEA Talker ID.
Channel - Select from which transceiver channel and frequency
you wish to export the depth data.
Related topics
→ Port Management, page 107
66
850-164692 / Rev.B
Page 75

Dialogue boxes and functions
Echogram
The Echogram dialogue box is accessed from the shortcut
menu in the Echogram view .
Purpose
This dialogue box is used to specify what should be displayed in
the Echogram view, and how sample data shall be converted to
pixel data. You have these tabs:
• Lines
• Pixels
• Type
Related topics
→ Echogram view, page 11
→ Surface Range, page 119
→ Bottom Range, page 53
850-164692 / Rev.B
67
Page 76
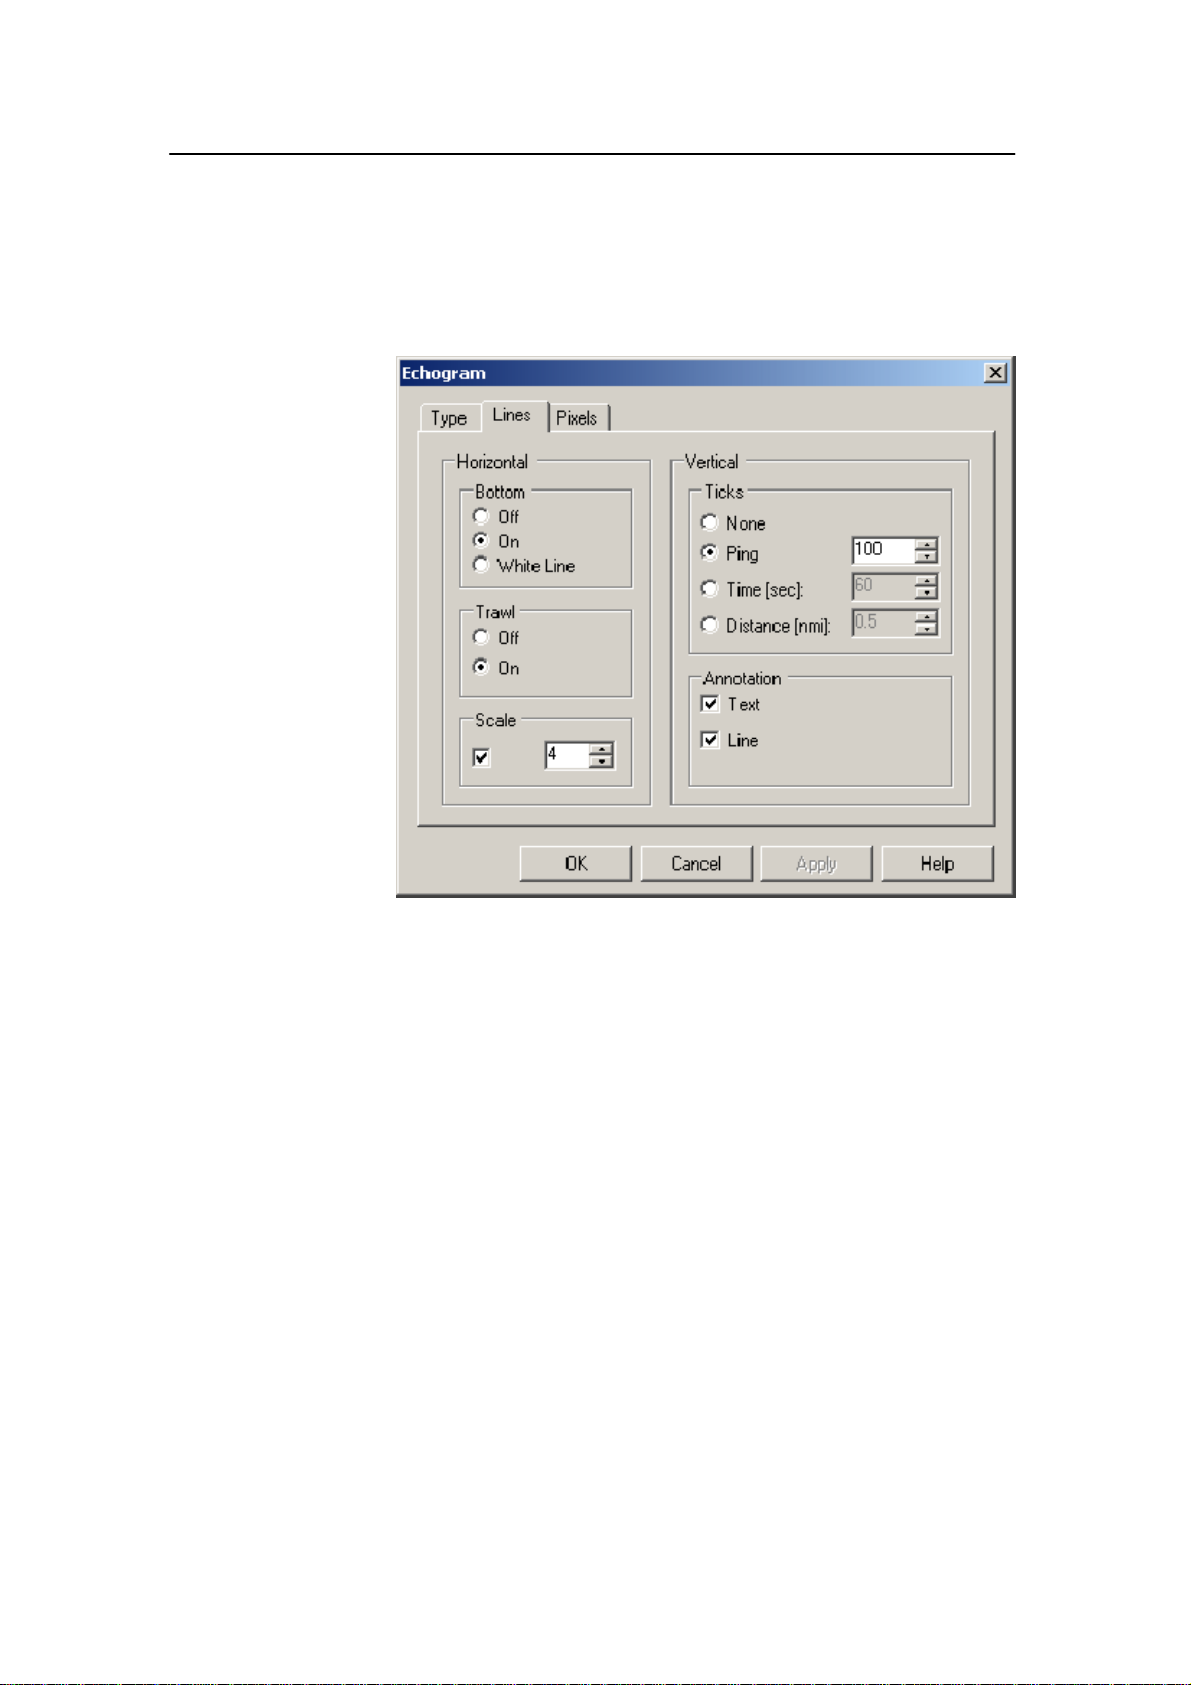
Simrad ER60 Operator manual
Echogram: Lines
This page is used to specify which lines to be displayed in the
Echogram view.
Horizontal Bottom:
• On - The detected bottom depth is shown as a thin line in the
echogram. The line is drawn in the current foreground
colour; black during day and white during night.
• Off - The bottom line is switched off.
• White Line - A band in the current background colour is
drawn below the detected bottom depth.
Horizontal Trawl:
• On - Headrope and footrope depth are indicated by two lines
in the echogram.
• Off - The trawl lines are switched off.
Horizontal Scale - Equidistant horizontal scale lines are drawn
inside the echogram in the current foreground colour; black
during day and white during night. A maximum of 50 scale
lines can be drawn. No scale lines are drawn when the scale line
count is set to zero.
Vertical ticks:
• None - Tick marks are switched off.
68
850-164692 / Rev.B
Page 77

Dialogue boxes and functions
• Ping - A short vertical line is drawn in the upper part of the
echogram once every specified number of pings.
• Time - A short vertical line is drawn in the upper part of the
echogram once every specified number of seconds.
• Distance - A short vertical line is drawn in the upper part of
the echogram once every specified number of nautical miles.
Annotation - Click Text to allow text annotations to be visible
in the echogram. If you click Line, the text annotation will be
followed by a vertical line for improved visibility.
Related topics
→ Echogram view, page 11
→ Annotation, page 50
→ Echogram overview, page 67
850-164692 / Rev.B
69
Page 78
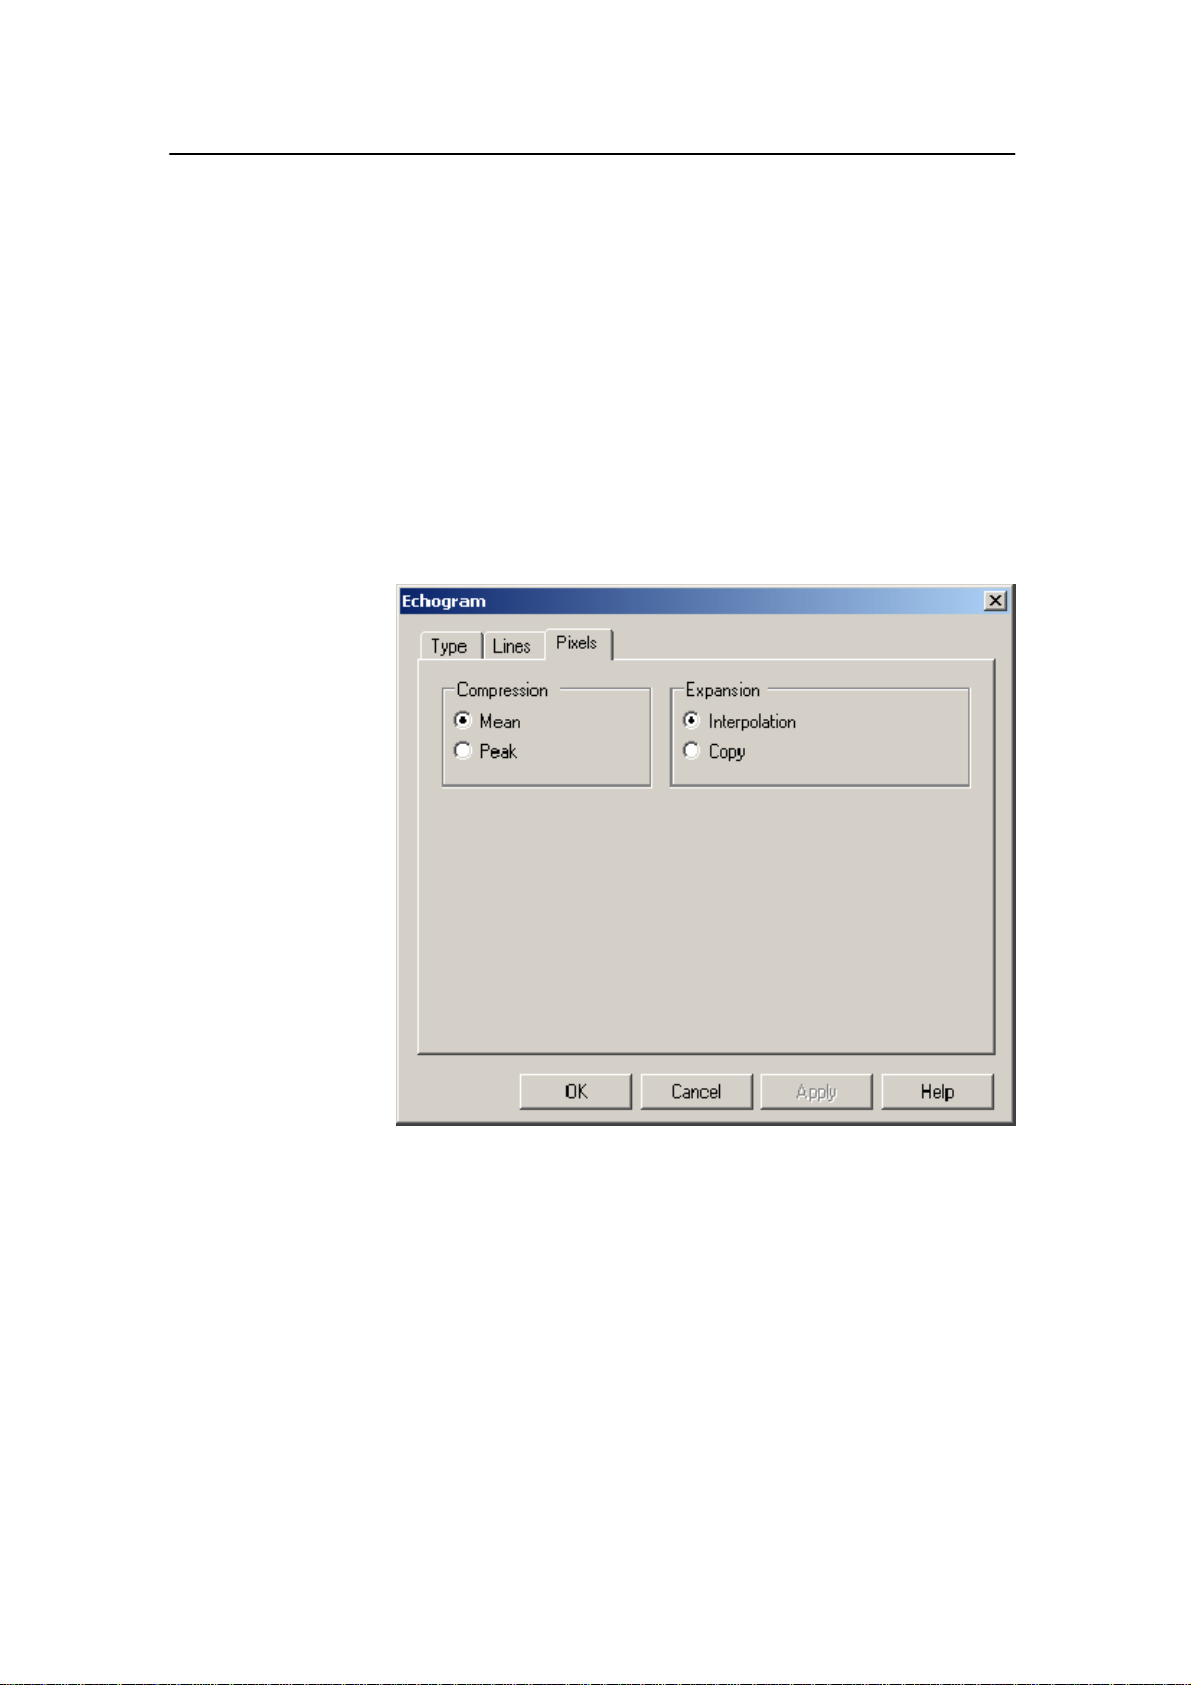
Simrad ER60 Operator manual
Echogram: Pixels
This tab page is used to specify how sample data are converted
to pixel data.
Each ping consists a given number of data samples, where the
number of samples is set by the current depth range. This
number of samples does not necessarily match the number of
vertical pixels in the Echogram view. The data samples must
therefore be compressed or expanded to fit the number of
available pixels.
In other echo sounders, this function is handled automatically
without allowing the user to control the process.
70
Compression
These options describe the situation when the number of
samples is higher than the number of pixels, and multiple
samples are compressed into one pixel.
Mean - The mean of the samples is used as pixel value.
Peak - The peak value of the samples is used as pixel value.
850-164692 / Rev.B
Page 79

Dialogue boxes and functions
Expansion
This section describes the situation when the number of samples
is lower than the number of pixels, and the sample values are
expanded to pixel values.
Interpolation - Pixel values are interpolated between two
sample values.
Copy - A sample value is copied into multiple pixel values.
850-164692 / Rev.B
71
Page 80
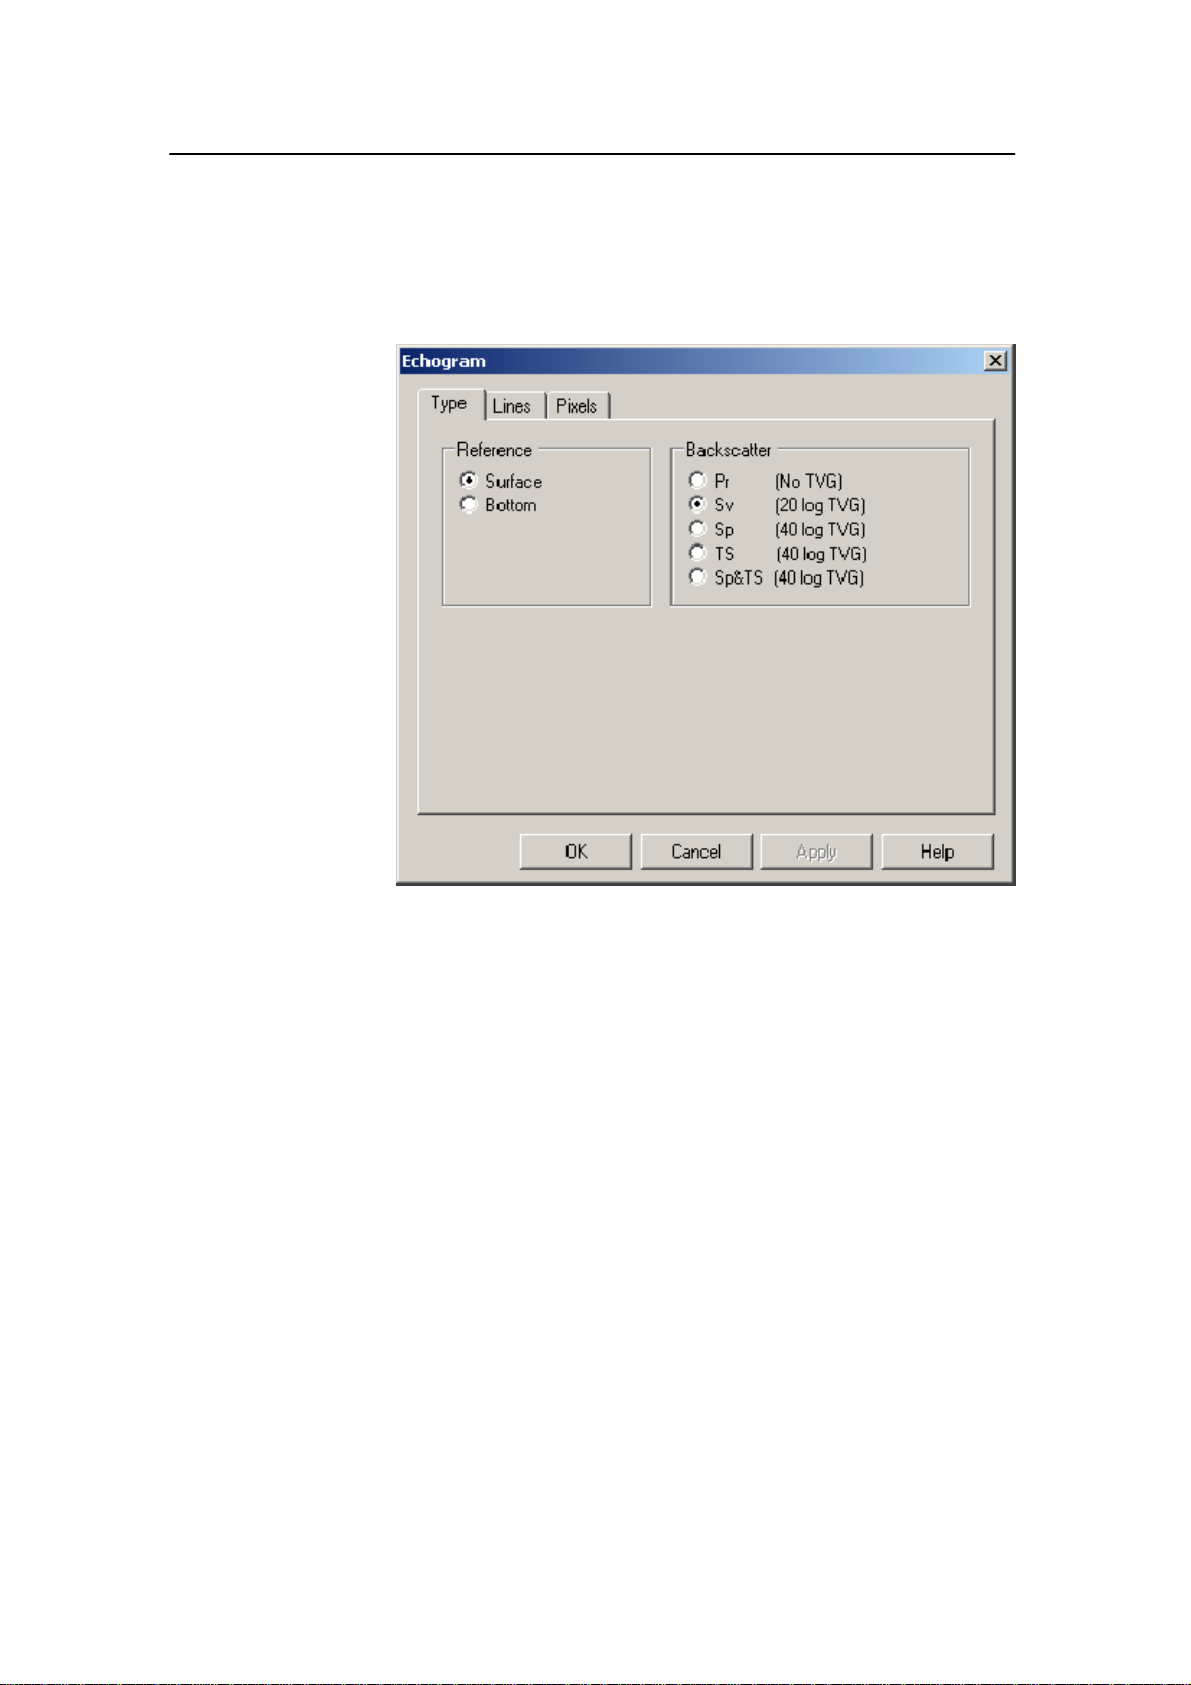
Simrad ER60 Operator manual
Echogram: Type
This page is used to specify which types of information to be
displayed in the Echogram view.
Reference
These selections define the range reference. All ranges in the
Echogram view can be referenced to either the surface or the
bottom depth detected by the echo sounder. The current depth
range is specified in the Surface Range and Bott om Range
dialogues.
Backscatter
These selections define the type of acoustic backscatter data to
be displayed in the Echogram view.
Pr (No TVG) -Power
Sv (20 log TVG) - Volume backscattering strength
Sp (40 log TVG) - Point backscattering strength
TS (40 log TVG) - Target strength. Only signals accepted as
single targets are displayed. These values are beam
compensated.
Sp & TS (40 log TVG) - Point backscattering strength overlaid
with Target strength data
72
850-164692 / Rev.B
Page 81

Dialogue boxes and functions
EK500 Datagram
The EK500 Datagram dialogue box is accessed from both the
Processed Data Output tabintheFile Output dialogue, and
from the Ethernet Output dialogue box.
Purpose
This dialogue is used to specify which EK500 datagrams to
output. Note that changes made in this dialogue will have effects
on both Ethernet and file output of EK500 data. The dialogue
box contains three tabs:
• Datagram
• Echogram
• Range
850-164692 / Rev.B
73
Page 82
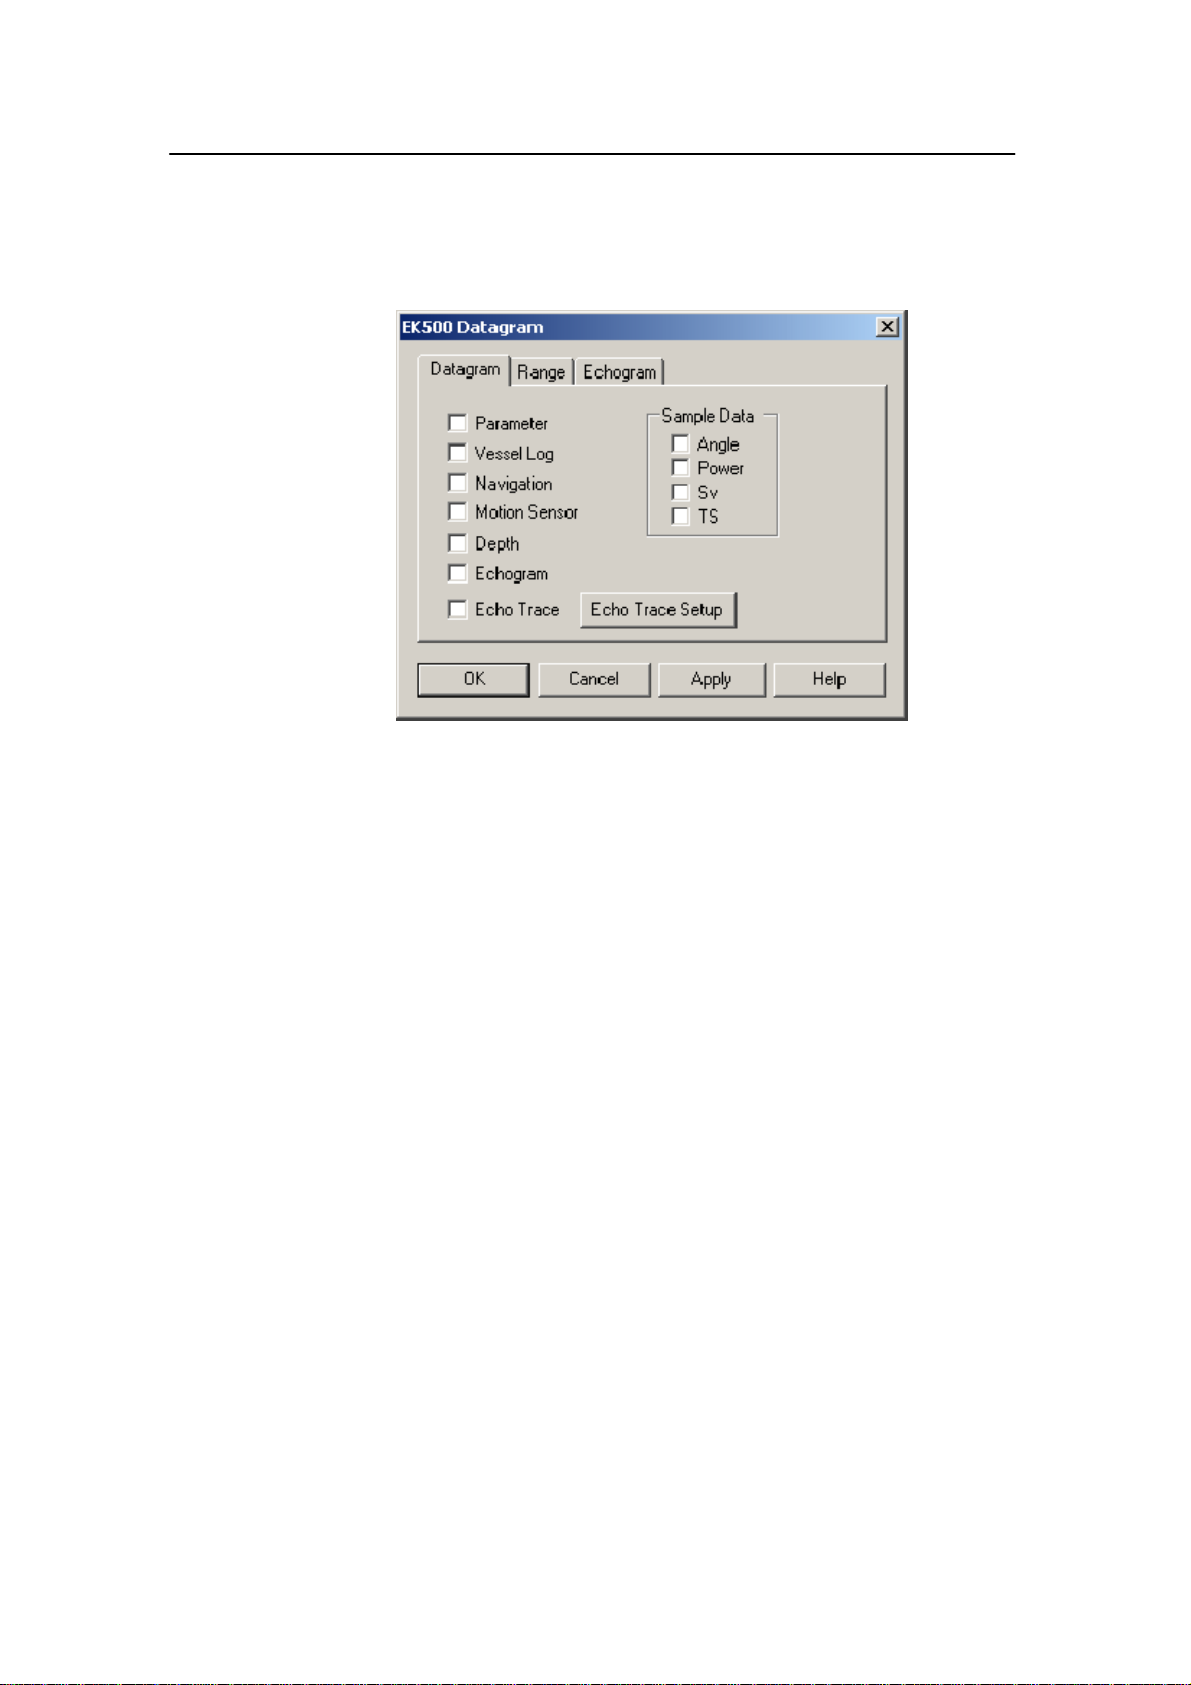
Simrad ER60 Operator manual
EK500 Datagram: Datagram
Check the boxes for to select which datagrams to output.
For a detailed specification of the datagrams, refer to the Simrad
EK 500 Operator manual.
Echo Trace Setup - Click this button to specify parameters for
the Echo Trace datagram. The button opens the Single Target
Detection dialogue.
Related topics
→ Single Target Detection, page 117
74
850-164692 / Rev.B
Page 83
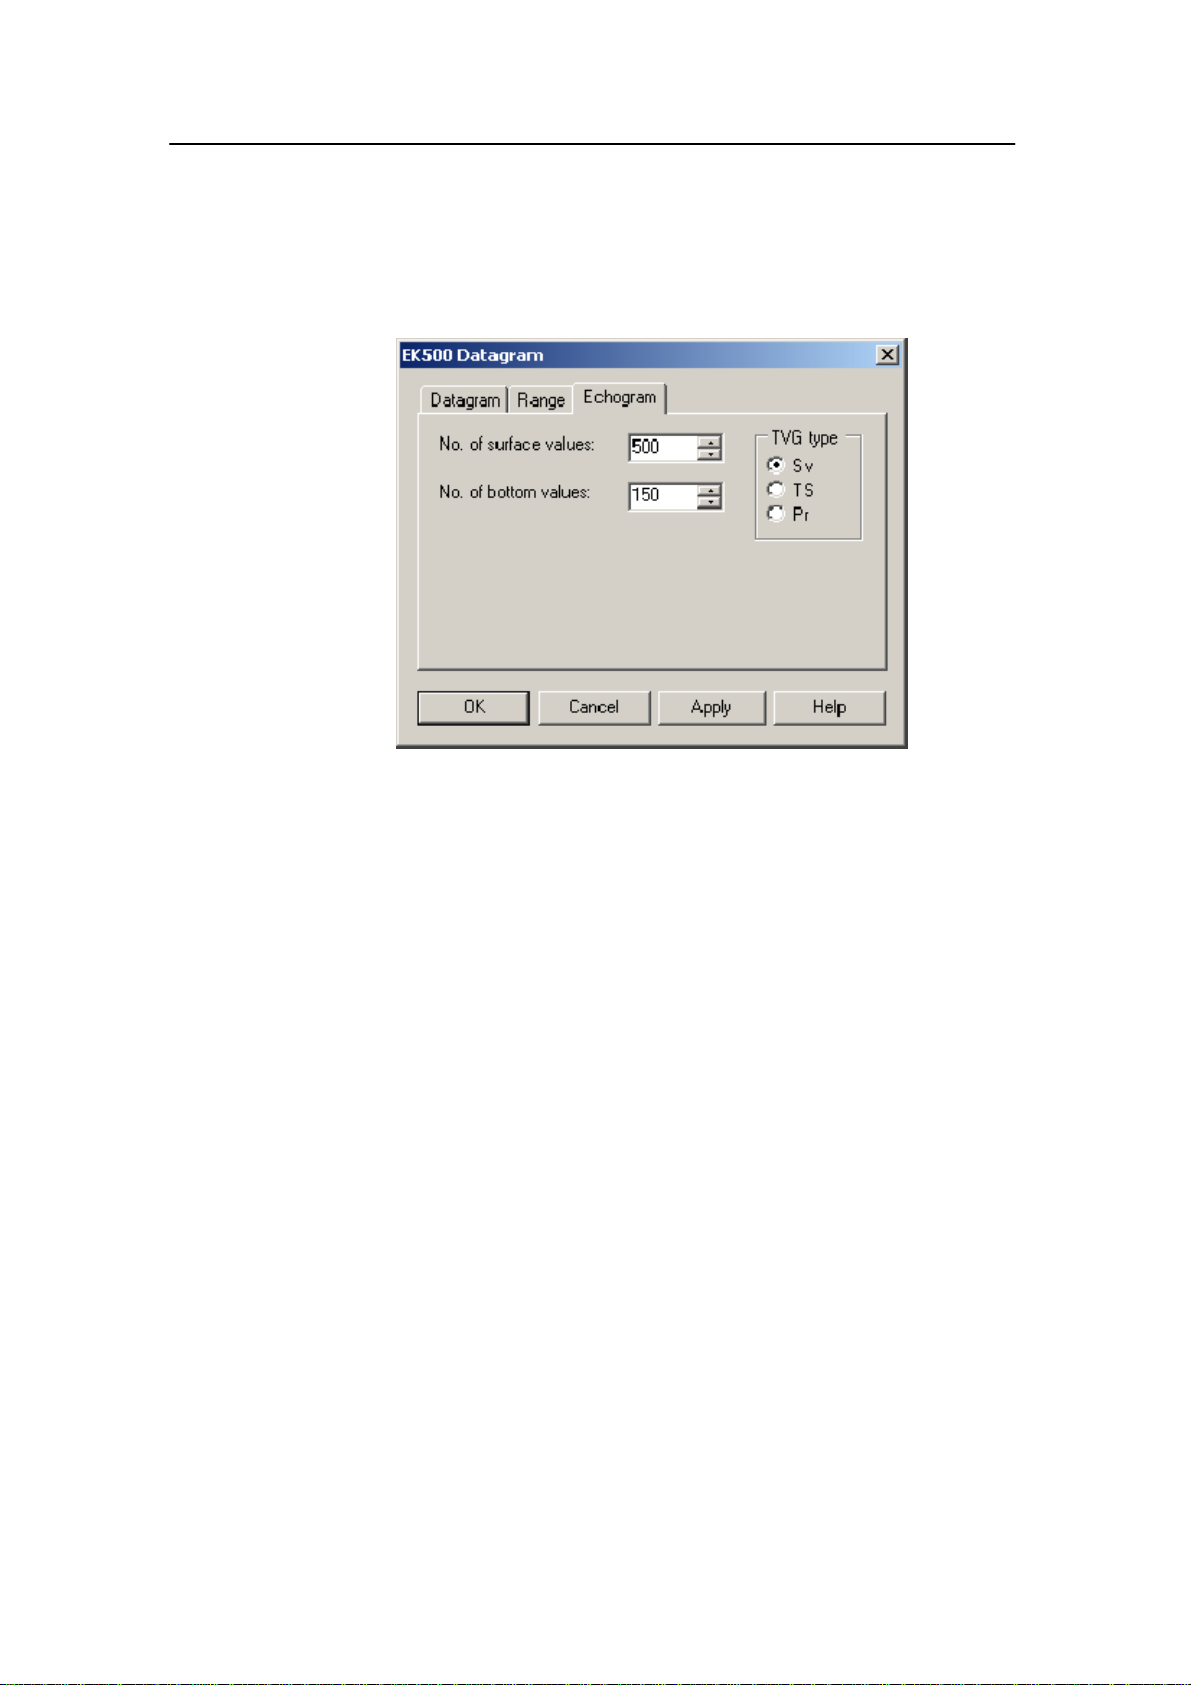
Dialogue boxes and functions
EK500 Datagram: Echogram
This dialogue box allows you to define the number of surface
and bottom values for the Echogram datagrams.
No. of Surface Values - Select the number of echogram
samples to export in the pelagic part of the datagram.
No.ofBottomValues- Select the number of echogram samples
to export in the bottom part of the echogram.
TVG Type - Specify the TVG type for the data in the
Echogram datagram.
850-164692 / Rev.B
75
Page 84
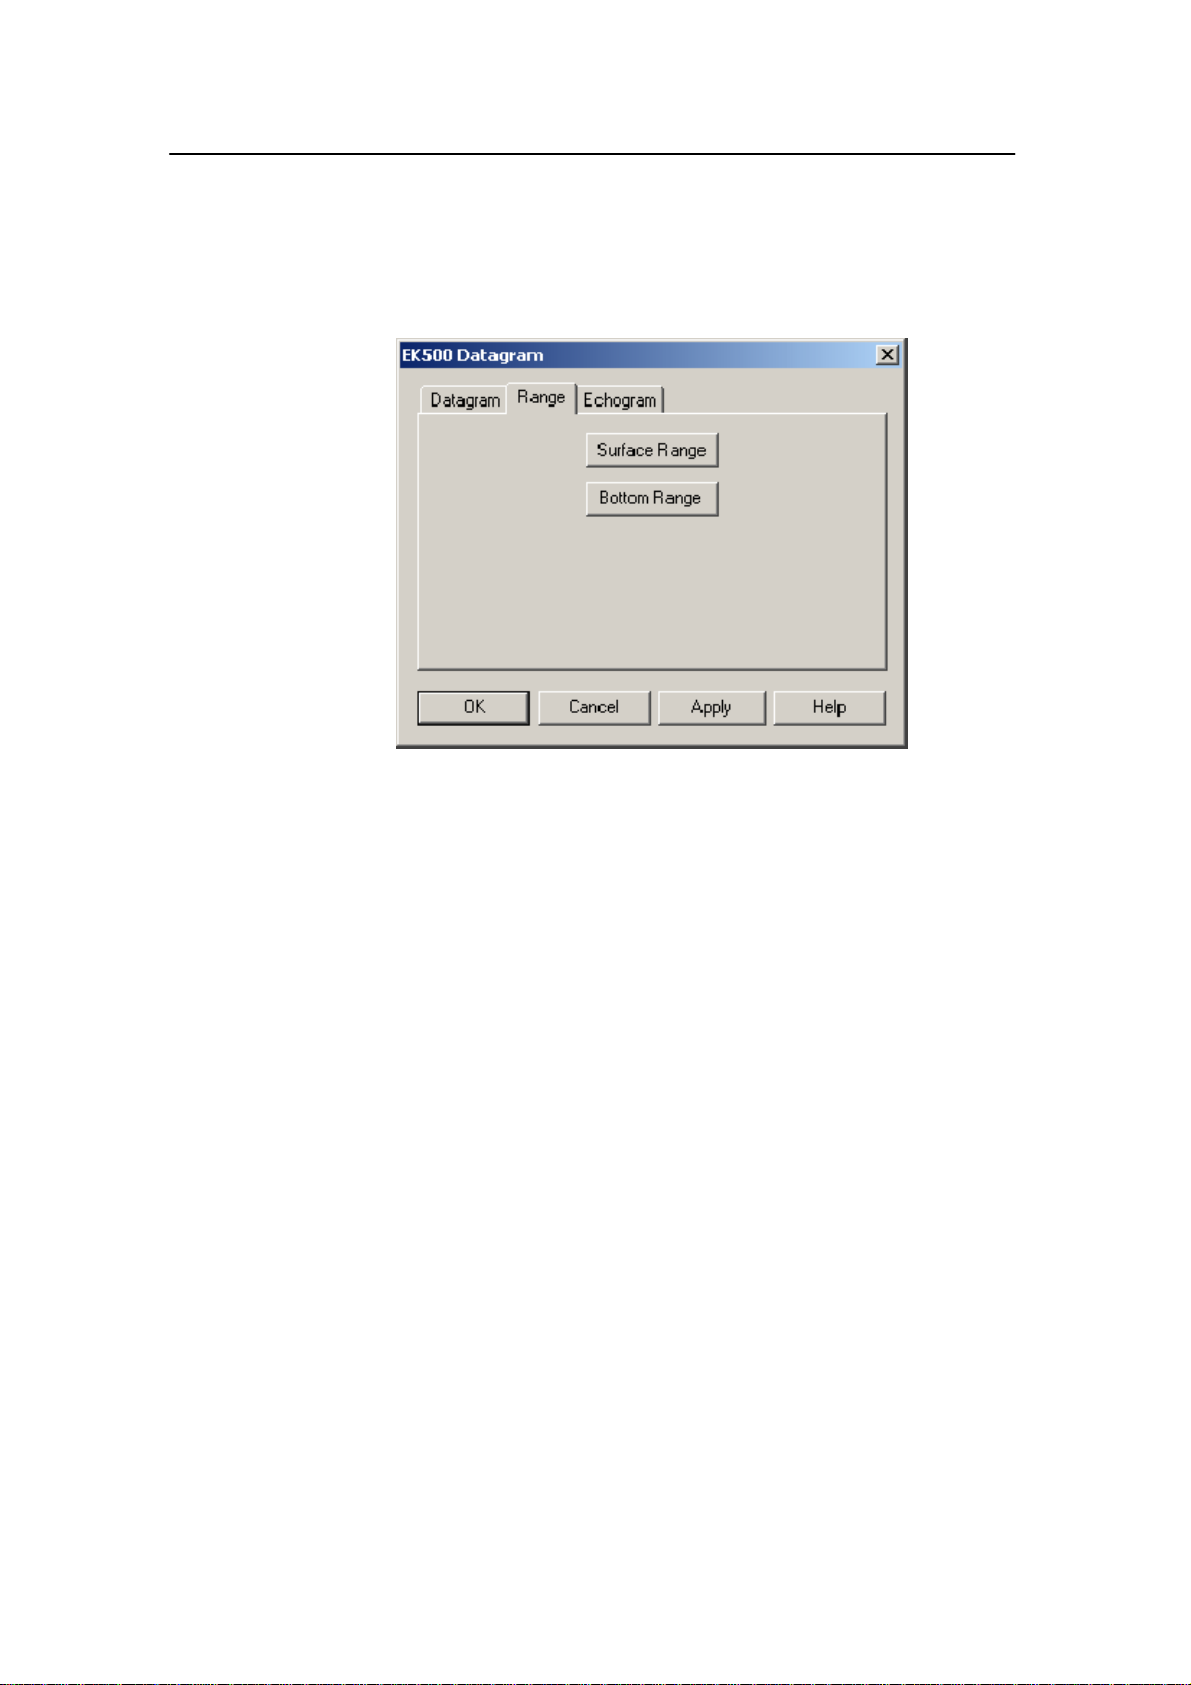
Simrad ER60 Operator manual
EK500 Datagram: Range
This tab allows you to specify the range for the Echogram,
Echo Trace and Sample Data datagrams.
Surface Range - Click this button to choose the surface range
for the datagrams.
Bottom Range - Click this button to choose the bottom range
for the Echogram datagrams.
Related topics
→ Surface / Bottom Range, page 119
76
850-164692 / Rev.B
Page 85

Dialogue boxes and functions
Environment
The Environment dialogue box is accessed from the Install
menu.
Purpose
This dialogue box
controls the setting of
environmental
parameters. These
parameters are used for
estimating range,
propagation loss, and
spreading loss, all of
which are essential
concepts in the echo
sounder.
The absorption coefficient can be recalculated and displayed for
various frequencies to examine the effect of temperature,
salinity, and sound speed parameters on this parameter.
Conditions
Use these spin boxes to provide manual values for temperature
and salinity. If you operate in fresh water, set salinity to 0
(zero).
Sound speed
Tick Calculate if you wish the echo sounder to calculate the
sound speed value based on the specified temperature. If you
select Manual, you can use the spin box to enter a value.
Absorption
Select the frequency in the top spin box, and read the
corresponding absorption value. This input has no effect on the
echo sounder, it is simply a calculator!
850-164692 / Rev.B
77
Page 86
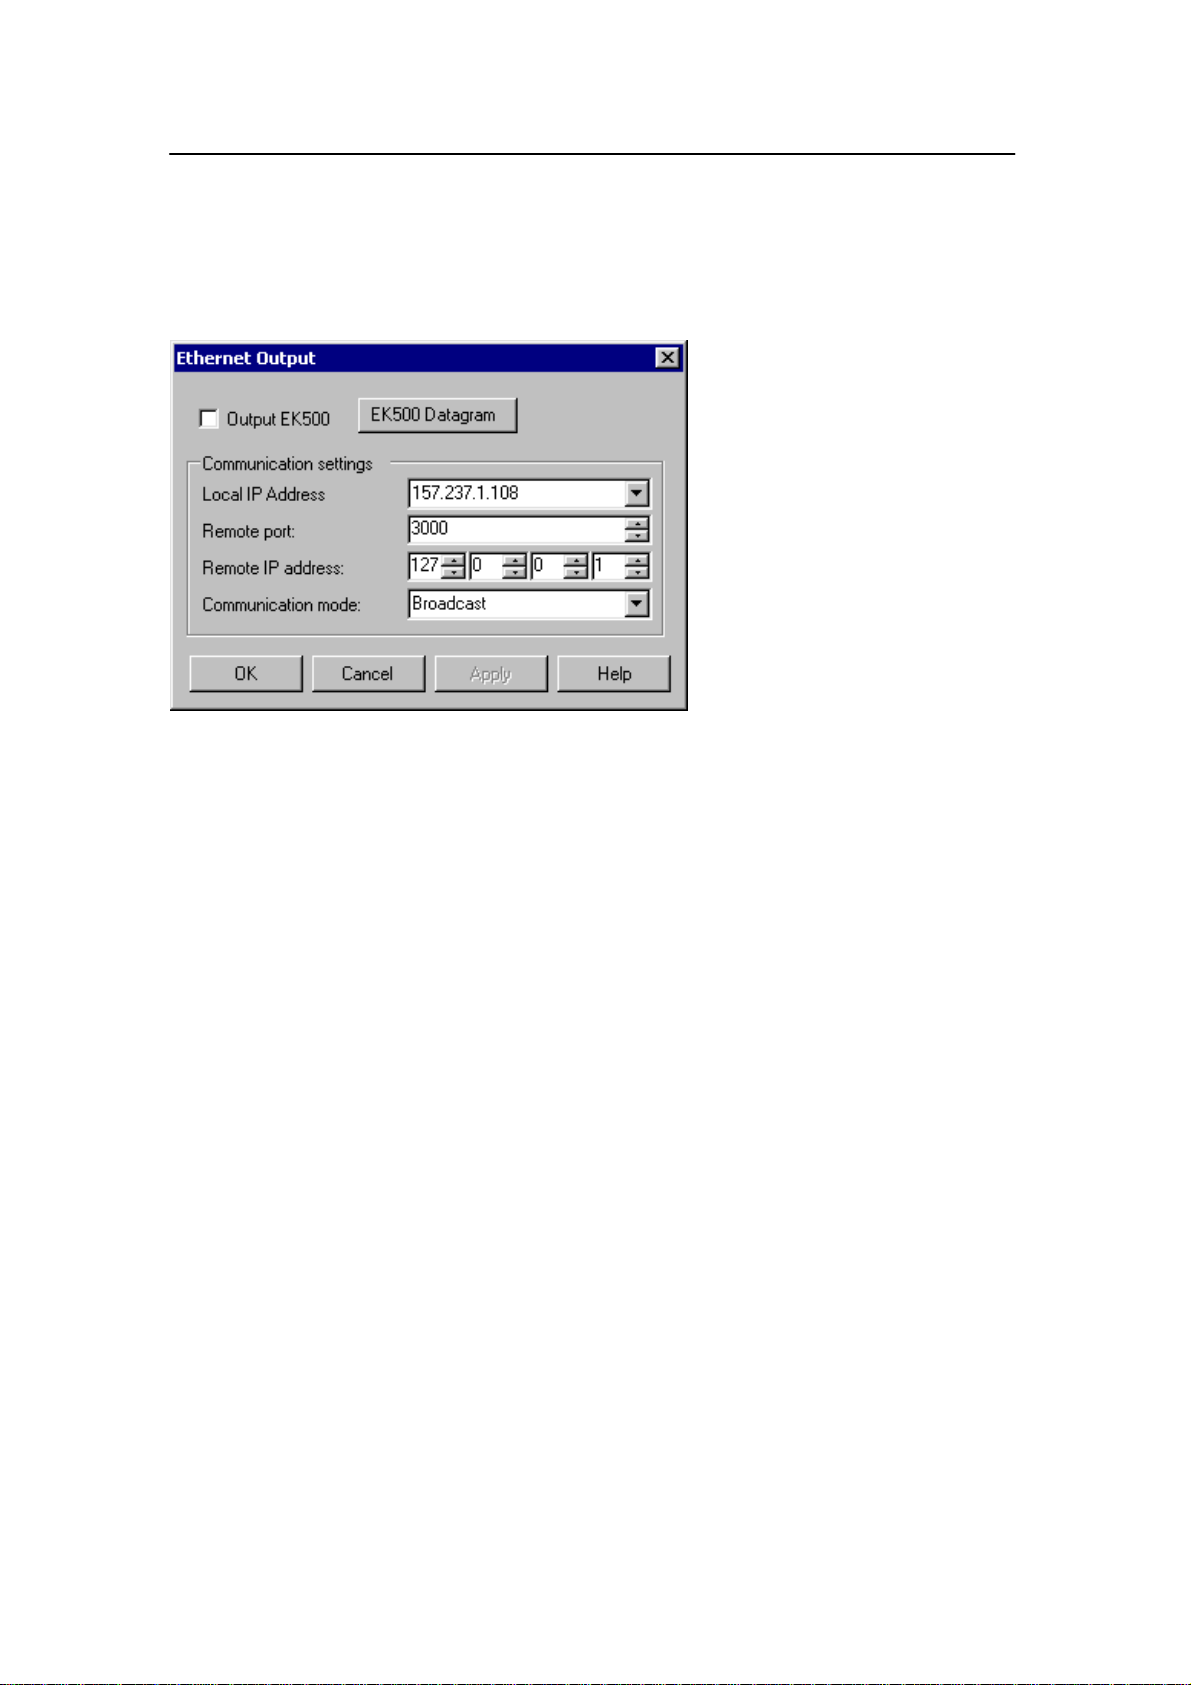
Simrad ER60 Operator manual
Ethernet Output
The Ethernet Output dialogue box is accessed from the
Output menu.
Purpose
This dialogue box is used to
specify the communication
settings for the EK500
Ethernet interface.
Note that additional data can
be output to Ethernet using
the data subscription
mechanisms in the Data
Source dialogue box.
To support programs which use data from the Simrad EK500
echo sounder, the ER60 can output a subset of the EK500
defined datagrams. This dialogue allows you to enable or
disable the EK500 datagram output to the Ethernet.
EK500 Datagram
Use this box to enable or disable the EK500 datagram output.
Click the button to open the EK 500 Datagram dialogue to set
up the individual datagrams.
Communication settings
Remote port - Use the spin box to define the UDP port number
to which the data shall be transmitted. Note that parameter
request (PR) is only accepted on port 2000.
Remote IP address - Use the spin boxes to define the IP
Address of the remote computer.
Local IP Address - If you have more than one network cards in
your ER60 Processing Unit, use this box to select which
network card to use for output data.
78
Communication mode - Choose Broadcast or Point-to-Point.
Related topics
→ Data Source, page 63
→ EK500 Datagram dialogue, page 73
→ Subscriptions and remote control, page 141
850-164692 / Rev.B
Page 87

Dialogue boxes and functions
Exit
Exit is accessed from the Operation menu. Use this option to
close the ER60 application. Note that when you exit the ER60,
the echo sounder closes down just like any other standard
application. You can restart the ER60 by double-clicking on the
icon.
850-164692 / Rev.B
79
Page 88

Simrad ER60 Operator manual
File Output
The File Output dialogue box is accessed from the Output
menu.
Purpose
This dialogue box is used to specify which output you wish to
save to a data file, and in which disk directory the data file(s)
shall be placed.
The dialogue box has three tabs:
• Directory
• Processed Data
• Raw Data
80
850-164692 / Rev.B
Page 89

Dialogue boxes and functions
File Output: Directory
This dialogue allows you to define where the data files are
stored.
Browse - Click this button to select where to store the files.
850-164692 / Rev.B
81
Page 90

Simrad ER60 Operator manual
File Output: P rocessed Data
Data processed by the echo sounder data can also be stored to
file.
To support programs using data from the Simrad EK500 echo
sounder, the ER60 can output EK500 defined datagrams on
Ethernet. These datagrams can also be recorded onto a file.
Save EK500 - Check this box to choose to save EK500
datagrams to file. Click the button to open the EK500
Datagram dialogue box to set up the individual datagrams.
Save HAC - Check this box to choose to save HAC datagrams
to file. Click the button to open the HAC Datagram dialogue
box to set up the individual datagrams.
Related topics
→ EK500 Datagram, page 73
→ HAC Datagram, page 85
82
850-164692 / Rev.B
Page 91

Dialogue boxes and functions
File output: Raw Data
Raw data files can be recorded by the echo sounder and stored
to file. These raw data files can later be replayed by the echo
sounder for further analysis.
For more information on replaying raw data files refer to the
Replay dialogue box. For more information on the data format
for the raw data f iles refer to the Data formats chapter. Each raw
data file name has the format:
PREFIXDYYYYMMDDTHHMMSS
General
Save Raw Data - Check this box to save raw data to file.
File Name Prefix - Type any name into the text box. The
chosen name will be used as prefix in all the raw data file
names.
Range - Use this spin box box to define which range to collect
echo sounder data from.
File size
New files will be automatically generated by the echo sounder
program when the specified limit is reached.
850-164692 / Rev.B
83
Page 92

Simrad ER60 Operator manual
Max. Vessel Distance - use this spin box to define a limit (in
nautical miles) for the maximum distance to be contained in one
file. A value of 0 means no limit.
Max. File Size - Use this spin box to define a limit for the
maximum amount of bytes to be contained in one raw data file.
A value of 0 means no limit.
Current File Size - When recording raw data is in progress the
current file size is displayed.
Automatic start
Raw data output can be set to start automatically after a
predefined sailing distance.
Related topics
→ Replay dialogue, page 114
→ Raw data format, page 134
84
850-164692 / Rev.B
Page 93

Dialogue boxes and functions
HAC Datagram
This dialogue box is accessed from the Install menu.
Purpose
Use this dialogue to set up which HAC datagrams to be
exported. The following HAC tuples are currently supported by
the ER60.
• HAC signature (65535)
• End of file (65534)
• Standard position (20)
• Simrad EK60 echo sounder (210)
• Simrad EK60 channel (2100)
• Ping U-16 (10030)
• Ping U-16-angles (10031)
• Single targets (10090)
Parameters
Range -ClicktoopentheSurface Range dialogue. The range
specified is the valid range for all ping and single targets HAC
data.
Sample data - Click to select which sampla data types to
export.
Single Target Data -Clicktoenable,andpresstheSingle
Target Detection button to define the single target detection
criterias.
850-164692 / Rev.B
Navigation - Click to enable export of position data.
Related topics
→ Single Target Detection, page 117
→ Surface Range, page 119
85
Page 94

Simrad ER60 Operator manual
Hide View
The Hide View function is accessed from the shortcut menu in
all the views.
Purpose
This function hides the view from which the command was
chosen.
The view can be re-established by selecting Configure Window
from the shortcut menu in another view in the same window,
and check the box for the view which was initially hidden.
Related topics
→ Configure Window, page 61
86
850-164692 / Rev.B
Page 95
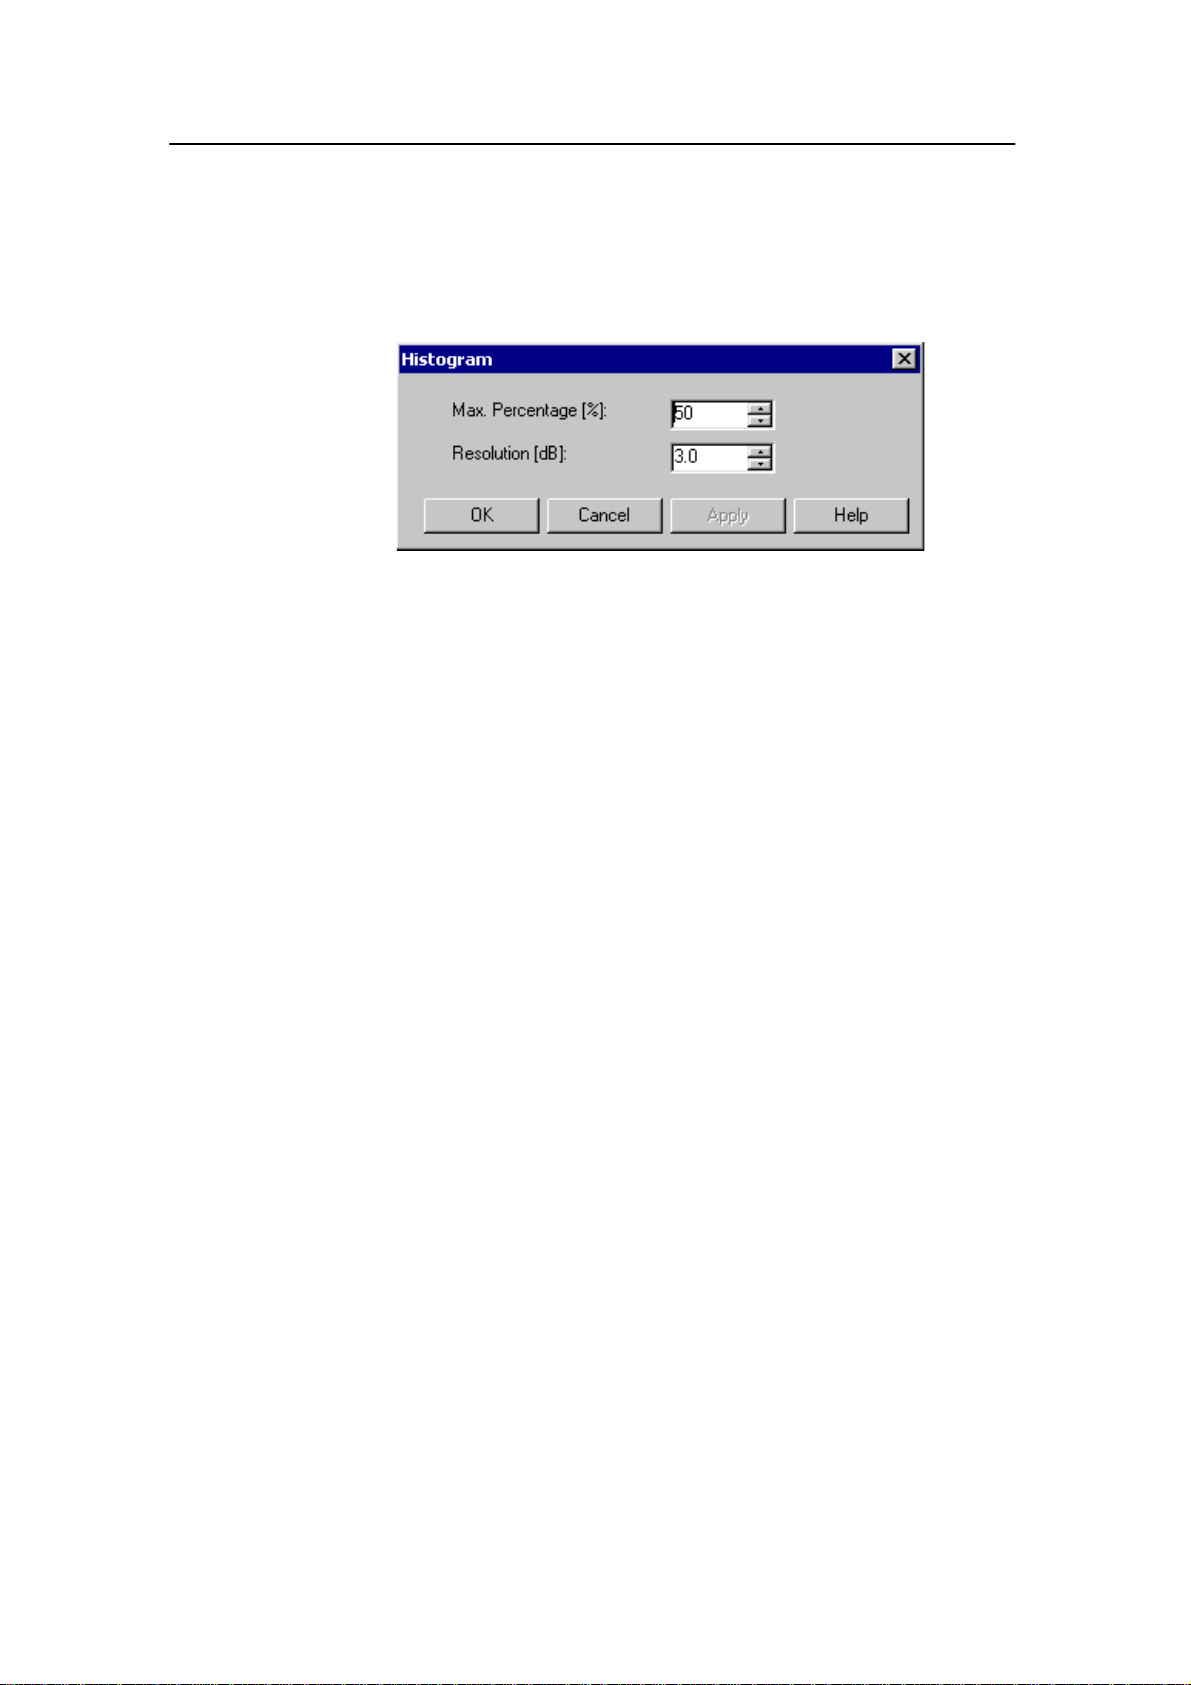
Dialogue boxes and functions
Histogram
The Histogram dialogue box is accessed from the shortcut
menu in the Single Target Histogram view.
Purpose
This dialogue is used to set parameters for the histogram
displayed in the Single Target Histogram view.
Max. Percentage - Use the spin box to define maximum value
for the percentage axis in the histogram display.
Resolution - Defines the width of each bin in the histogram.
Related topics
→ Single Target Histogram, page 10
850-164692 / Rev.B
87
Page 96
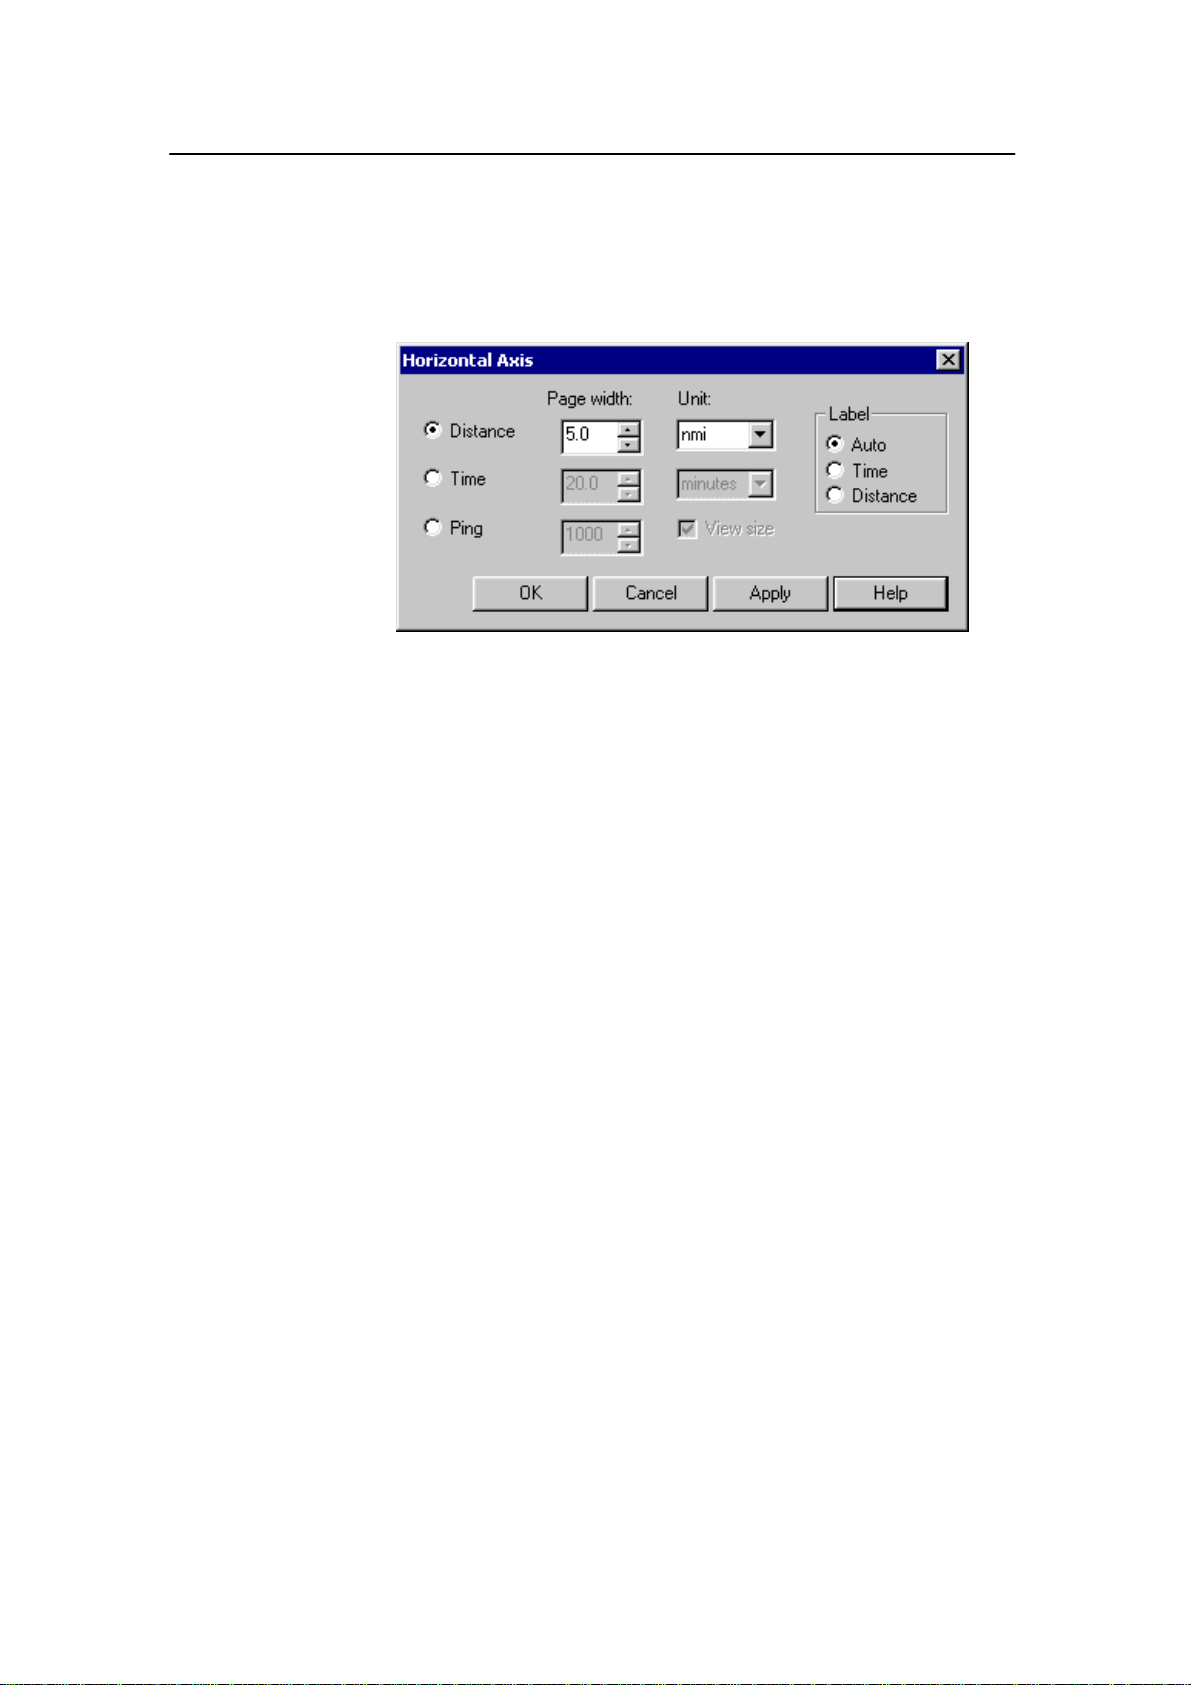
Simrad ER60 Operator manual
Horizontal Axis
The Horizontal axis dialogue box is accessed from the shortcut
menu in the Echogram view .
Purpose
This dialogue is used to set the horizontal display span of the
Echogram view.
Parameters
Distance - The echogram view displays the specified distance
span.
Time - The echogram view displays the specified time span.
Ping - The echogram view displays the specified ping span.
Check the View size box to specify that the number of
horizontal pixels shall define the number of displayed horizontal
pings (One ping per pixel).
Label - Check the label type used to display the horizontal span.
Related topics
→ Echogram view, page 11
88
850-164692 / Rev.B
Page 97
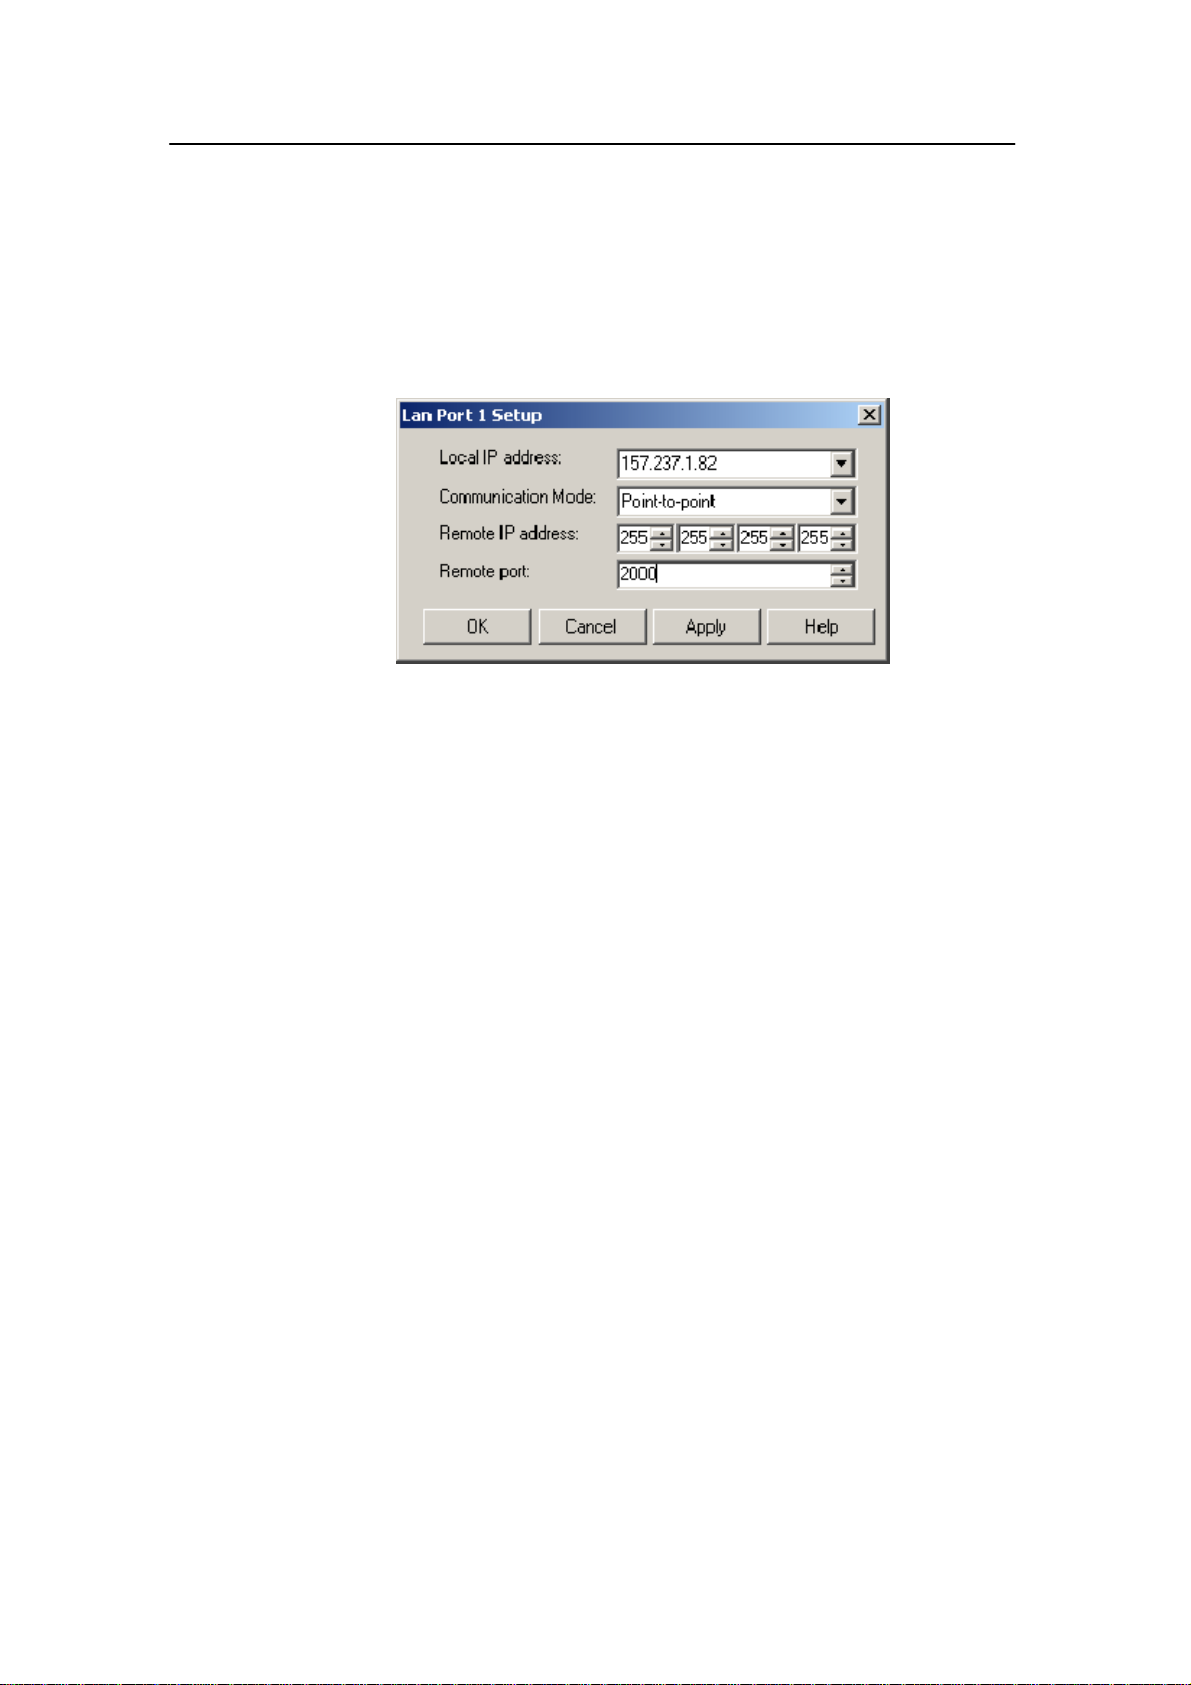
Dialogue boxes and functions
LAN Port setup
The LAN Port setup dialogue is accessed from the following
dialogue boxes on the Installation menu: Navigation, Motion
and Trawl. It is also accessed from the Depth Output dialogue
on the Output menu.
Purpose
The purpose of this dialogue box is to set up the parameters for
LAN (Local Area Network) communication with external
sensors.
Parameters
Local IP Address - Select local network card if more than one
is available.
Local port - Specify local port.
Remote IP Address - Select remote computer. If the data
communication is set up to receive data only, this parameter is
not required. If you wish to set up an output for broadcast,
define IP address 255.255.255.255. This is the default setting.
Remote port - Specify remote port. If the data communication
is set up to receive data only, this parameter is not required.
Related topics
→ Navigation, page 96
→ Motion, page 95
→ Trawl, page 127
850-164692 / Rev.B
89
Page 98

Simrad ER60 Operator manual
Layer P roperties
The Layer Properties dialogue box is accessed from the
shortcut menu in the Echogram and Numerical views.
Purpose
This dialogue is used to edit the properties for the active layer.
Layers are used to calculate various values for a specific range
in the water column. The calculated values can be displayed in
the Numerical view. All single targets detections which are
displayed in the Single Target P osition view and the Single
Target Histogram view are detected within a layer.
Limits
Start Relative Surface / Start Relative Bottom - This
parameter controls the depth at the upper boundary of the layer,
relative the surface or detected bottom depth depending on the
selected layer type.
Range - This parameter controls the vertical depth range for the
layer. Please note, positive is always downwards. This means
e.g. that a start range relative bottom of -10 m means 10 m
above bottom.
Type
Surface - The range settings for the layer are referenced to the
surface. The layer is downwards limited by the detected bottom
depth if this value is shallower than the specified lower range
limit for the layer. Pings without bottom detections are ignored
in the calculations.
90
850-164692 / Rev.B
Page 99

Dialogue boxes and functions
Pelagic - The range settings for the layer are referenced to the
surface. The layer is not downwards limited by the detected
bottom depth.
Bottom - The range settings for the layer are referenced to the
bottom. The layer is downwards limited by the detected bottom
depth.
Integration
Targets Integration - Check the Targets Integration box to
calculate integration values based on single target detections.
Compared with the normal integration (sA) this value can be
used to get an idea of how much of the biomass has been
detected as single targets.
Margin - This is the margin to the surface and the bottom used
when calculating integration values for Surface and Bottom
types.
Sv threshold - This is the lower threshold used when
calculating integration values for the layer.
Related topics
→ Echogram view, page 11
→ Numerical view, page 14
→ New Layer, page 101
850-164692 / Rev.B
91
Page 100

Simrad ER60 Operator manual
Load Setting
The Load Settings dialogue box is accessed from the Options menu.
Purpose
This dialogue is used to load previously
saved settings.
Program settings can be saved to files.
This dialogue displays a list of previously
saved setting files. These files are located
in the directory displayed in the File Path
box.
Select a setting file by clicking on the
setting file and choose OK.
Note that installation settings (e.g.
Transceiver and sensor installation
settings) are not saved in the settings files.
Use
Click the file name, and then Ok to
retrieve the file. To delete a settings file,
click the file name and then Delete File.
To retrieve a generic set of standard
settings, select Simrad Factory Defaults.
Related topics
→ Save Settings, page 115
92
850-164692 / Rev.B
 Loading...