

Page 1
GIMA
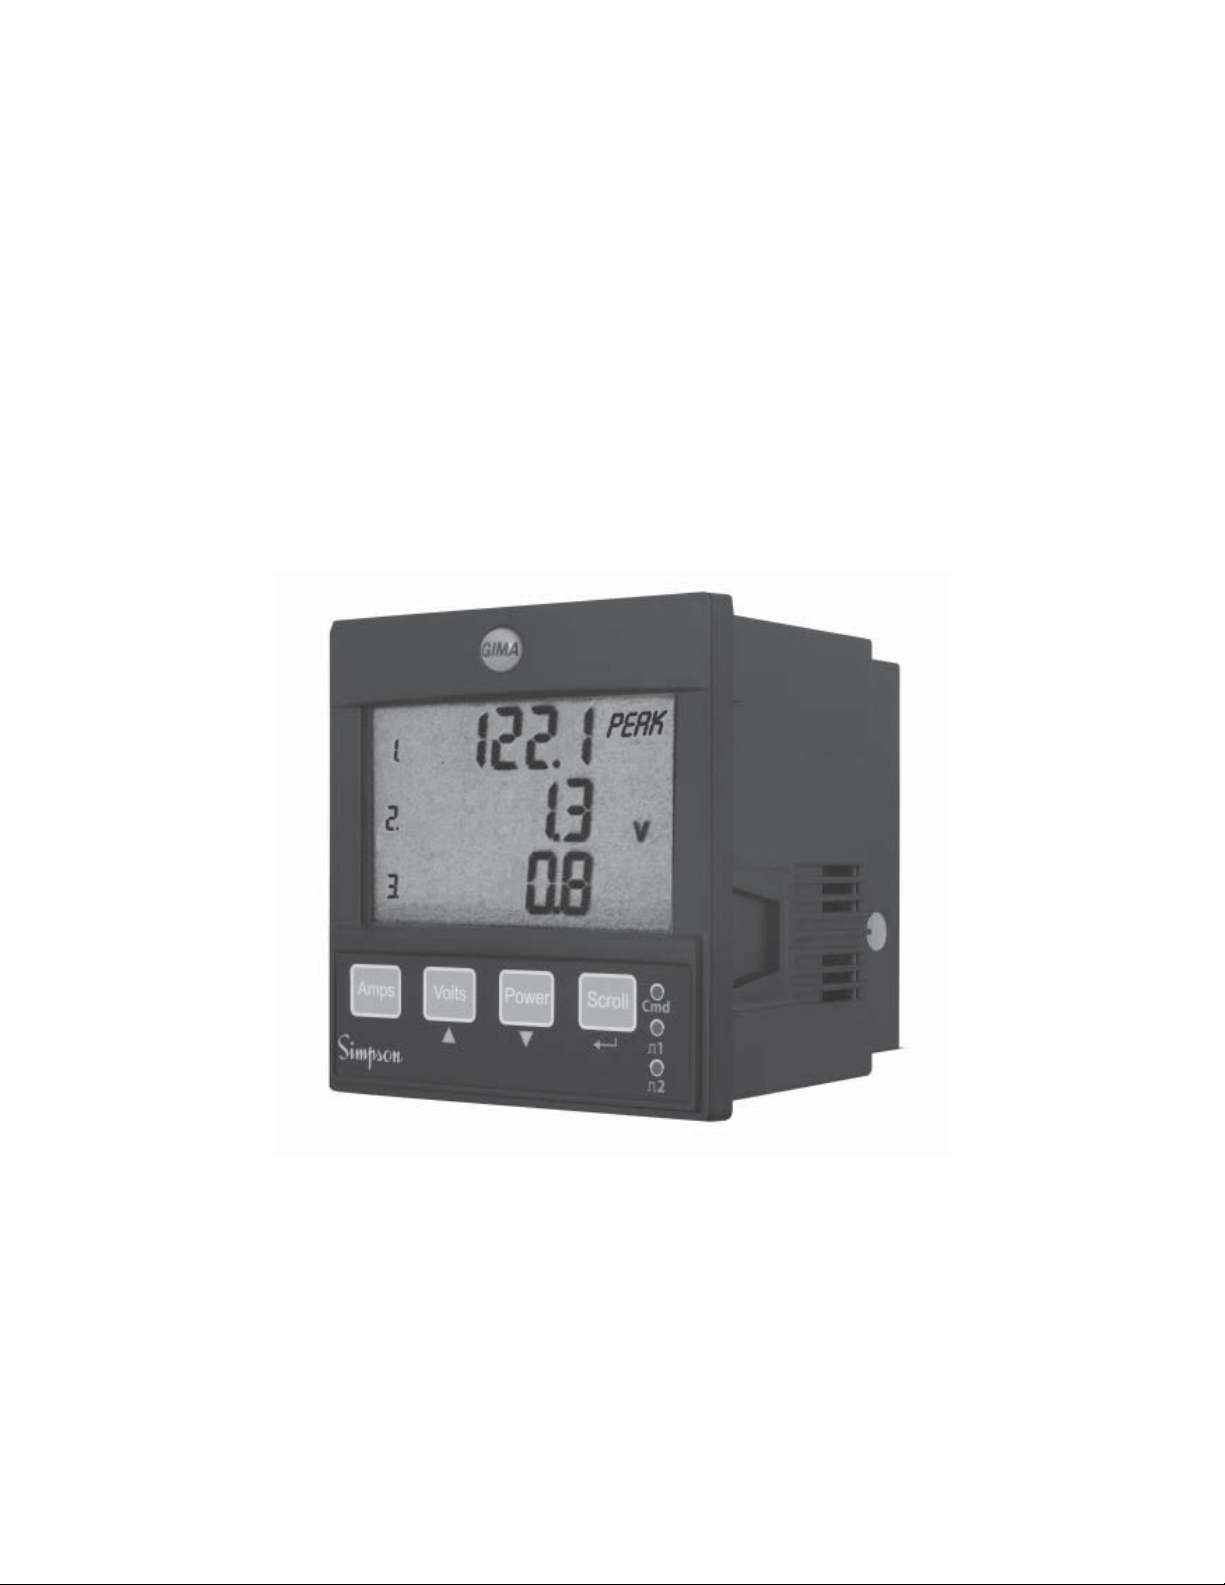
Multi-Function
Electricity Meter
OPERATOR’S MANUAL
Page 2

Technical Assistance
Simpson Electric Company offers assistance Monday through Friday,
8:00am to 4:30pm Central Time. To receive assistance contact Technical
Support at (715) 588-3311 or contact us through our web site at www.
simpsonelectric.com.
Warranty and Returns
Simpson Electric Company warrants each instrument and other articles
manufactured by it to be free from defects in material and workmanship
under normal use and service, it’s obligation under this warranty being
limited to making good at its factory said instrument or other article of
equipment which shall within one (1) year after delivery of such instrument
or other article of equipment to the original purchaser be returned intact to
it, or to one of its authorized service centers, with transportation charges
prepaid, and which its examination shall disclose to its satisfaction to
have been thus defective; this warranty being expressly in lieu of all other
warranties expressed or implied and of all other obligations or liability on its
part, and Simpson Electric Company neither assumes nor authorizes any
other persons to assume for it any other liability in connection with the sales
of its products.
This warranty shall not apply to any instrument or other article of equipment
which shall have been repaired or altered outside the Simpson Electric
Company factory or authorized service centers, nor which has been subject
to misuse, negligence or accident, incorrect wiring by others, or installation
or use no in accord with instructions furnished by the manufacturer.
This instrument is designed to prevent accidental shock to
the operator when properly used. However, no engineering
design can render safe an instrument which is used
carelessly. Therefore, this manual must be read carefully
and completely before making any measurements. Failure
to follow directions can result in a serious or fatal accident.
2
Page 3

Table Of Contents
1. SAFETY ........................................................................................ 4
1.1 W
1.2 M
2. METER OPERATION...................................................................... 5
2.1 M
2.2 P
2.3 D
3. DISPLAY PAGES ............................................................................ 8
3.1 P
3.2 C
3.3 V
3.4 P
3.5 R
3.6 S
3.7 M
3.8 D
3.9 I
ARNING SYMBOLS ............................................................................. 4
AINTENANCE ..................................................................................... 4
EASUREMENTS .................................................................................. 5
2.1.1 Balance Current Measurements ........................................... 5
2.1.2 Time Averaged Amps/Volts (T-Avg) ..................................... 6
2.1.3 Maximum Demand Power (MD)............................................ 6
OWER UP ........................................................................................ 7
ISPLAY PAGES ................................................................................... 7
OWER UP ........................................................................................ 8
URRENT MENU ...............................................................................8-9
OLTAGE MENU .............................................................................10-11
OWER MENU (METER TYPES 1-4) ..................................................11-14
ESET OF ENERGY REGISTERS ............................................................ 16
CROLLING MENU (METER TYPES 1-4) ................................................. 16
ETER TYPE DISPLAY MENUS .........................................................17-18
ISPLAY SCALING .............................................................................. 19
3.8.1 Voltage Scaling ................................................................... 19
3.8.2 Current Scaling ................................................................... 19
3.8.3 Power Scaling (W, VA, var)................................................. 19
3.8.4 Energy Registers (Wh, VAh, varh) ...................................... 19
3.8.5 Miscellaneous ..................................................................... 19
SOLATED PULSE OUTPUTS .................................................................. 20
4. INSTALLATION ............................................................................ 21
4.1 P
4.2 CT C
4.3 V
4.4 A
4.5 C
ANEL MOUNTING .............................................................................. 21
ONNECTIONS ............................................................................. 22
OLTAGE CONNECTIONS ...................................................................... 22
UXILIARY MAINS SUPPLY (L & N) ....................................................... 22
ONNECTION SCHEMATICS.............................................................. 23-25
5. METER SETUP ........................................................................ 26-28
5.1 P
ROGRAMMING MENU ......................................................................... 28
6. OPTIONS ...................................................................................... 28
6.1 I
NTERNAL MODBUS COMMUNICATIONS ................................................... 28
7. SPECIFICATION ......................................................................29-30
3
Page 4
1. Safety
1.1 Warning Symbols
This manual provides details of safe installation and operation
of the meter. Safety may be impaired if the instructions are not
followed. Labels on individual meters give details of equipment
ratings for safe operation. Take time to examine all labels on the
meter and to read this manual before commencing installation.
CAUTION WARNING
Refer to Operating Manual Danger Risk of Electric Shock
Figure 1-1 Safety Symbols
WARNING
The meter contains no user serviceable parts. Installation and
commissioning should be carried out by qualifi ed personnel
1.2 Maintenance
The equipment should be maintained in good working order.
Damage to the product should be repaired by the manufacturer.
The meter may be cleaned by wiping lightly with a soft cloth. No
solvents or cleaning agents should be used. All inputs and supplies
must be isolated before cleaning any part of the equipment.
4
Page 5

2. Meter Operation
2.1 Measurements
The GIMA makes use of a high speed micro-processor and an
Analogue to Digital converter to monitor input signals from three
independent phases. Each phase voltage, current and power (kW)
are measured directly and a number of other parameters derived
from these in software. The measurement process is continuous
with all six signals scanned simultaneously at high speed. Unlike
many other sampling systems, which sample one phase after
another, this ensures that all input cycles are detected. Distorted
input waveforms, with harmonics to the 30th are therefore detected
accurately.
Derived parameters are calculated and displayed once a second,
scaled by user programmed constants for current and voltage
transformers.
Instantaneous power parameters are integrated over long time
periods providing a number of energy registers. System frequency
is detected by digital processing of the phase 1 voltage signal.
2.1.1 Balance Current Measurements
The rms. value of the instantaneous sum of the three phase
currents is available on some GIMA meter types. The total current
in a three phase system may be represented as :
I
I
LEAK
I
n
Note: In 3 phase 3 wire systems the GIMA must be wired using
3 current transformers as shown in fi g. 4-3 for balance current
measurement to be made.
represents any current leaving the system (e.g. Leakage to earth)
represents current in the neutral (4 wire systems only)
= I1 + I2 + I3= I
bal
LEAK
+ I
n
5
Page 6

2.1.2 Time Averaged Amps/Volts (T-Avg)
Average values of volts and Amps are calculated over a user
programmable time period (10 - 2500 seconds). The displays show
the averages for the most recent time period ending at the time
the display was last updated. The average period is continuously
updated as time progresses.
The largest value of each T-Avg parameter is recorded, saved to
non-volatile memory and displayed as Pk hold T-Avg. These peak
values may be reset by the user.
Each Average-Period is split into 10 sub-periods. The average
values of volts and amps are measured during each sub-period and
stored in an array. The latest sub-period values replace the oldest
in the array as time progresses. The T-Avg values are calculated
as the mean of each corresponding array. The display is updated
with the latest T-Avg parameters at the end of each sub-period
(ever y Average-Period/10 seconds).
2.1.3 Maximum Demand Power (MD)
Average values of kW, kVA and kvar (if fi tted) are calculated over
a user programmable time period (1 - 60 minutes). The displays
show the averages for the most recent time period ending at
the time the display was last updated. The demand period is
continuously updated as time progresses. These parameters are
referred to as Maximum Demand Powers.
The largest value of each MD parameter is recorded, saved to nonvolatile memory and displayed as Pk hold MD. These peak values
may be reset by the user.
Each MD-Period is split into 30 sub-periods. The average power
values are measured during each sub-period and stored in an
array. The latest sub-period values replace the oldest in the array
as time progresses. The MD powers are calculated as the mean
of each corresponding array. The display is updated with the latest
MD values at the end of each sub-period (every MD-Period/30
seconds).
6
Page 7

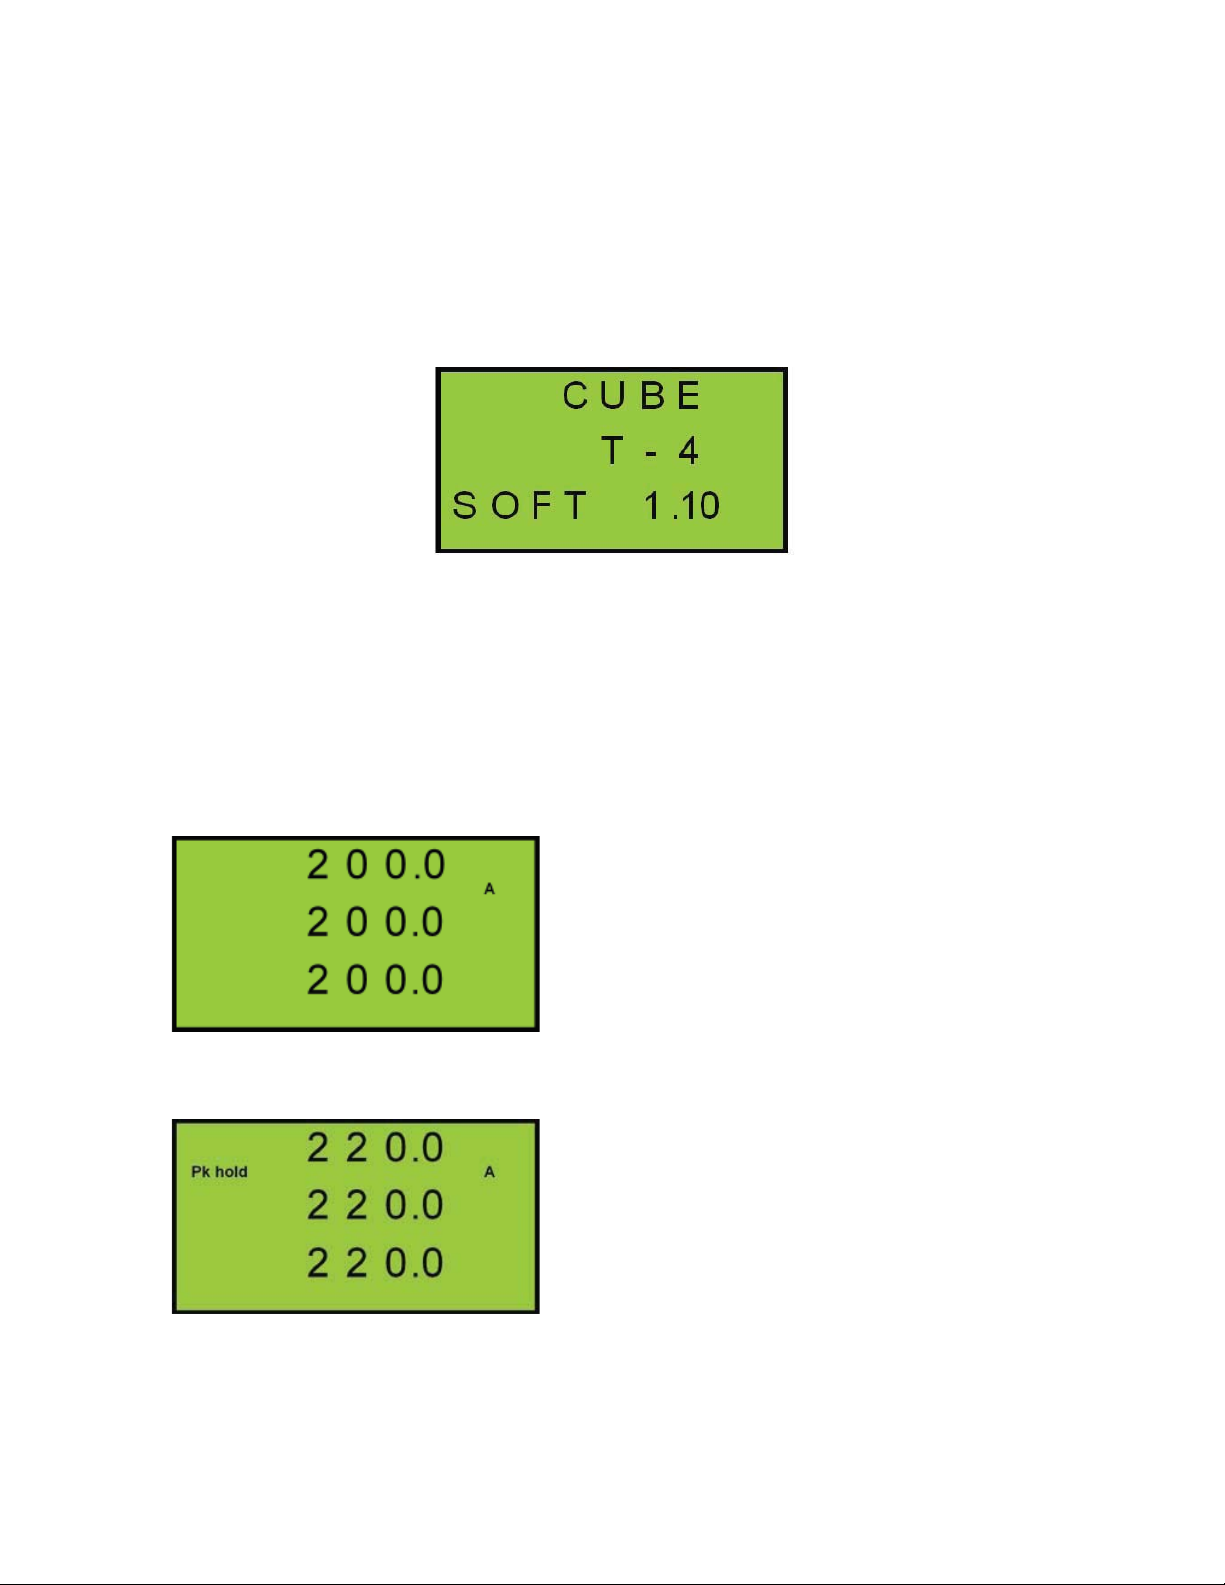
2.2 Power Up
On power up the GIMA shows the meter type and software issue. The
example below shows a GIMA 300 with software issue 1.10.
CUBE
T - 4
SOFT 1.10
2.3 Display Pages
To select current measurements press the AMP key repeatedly
until the desired page is displayed. The number of pages available
is dependant on meter type.
To select voltage measurements press the
until the desired page is displayed. The number of pages available
is dependant on meter type.
To select power/energy measurements press the
repeatedly until the desired page is displayed. The number of
pages available is dependant on meter type.
Automatically scrolling pages showing PF, Volts & Amps on each
phase are obtained by pressing SCROLL
Display pages available on the full range of GIMA meters are
shown below followed by tables showing those available on each
standard meter type.
VOLT key repeatedly
POWER key
7
Page 8
3. Display Pages
Measured data is displayed on the LCD updated every second
unless otherwise stated. Display Pages are organized in four
Standard Menus as follows:
3.1 Power Up
The following screen is shown when auxiliary power is fi rst
supplied.
3.2 Current Menu
Press the AMP key to select from the available Current Menu
pages.
Phase Amps
All Meter Types
Phase 1 true rms amps
Phase 2 true rms amps.
Phase 3 true rms amps.
This display is updated every second.
Peak Hold Phase Amps
G300 & G400 Only
The maximum value of displayed phase
amps. These are stored in non-volatile
memory when the meter loses auxiliary
power
Press AMPS and VOLTS to reset all
three peaks to zero.
8
Page 9
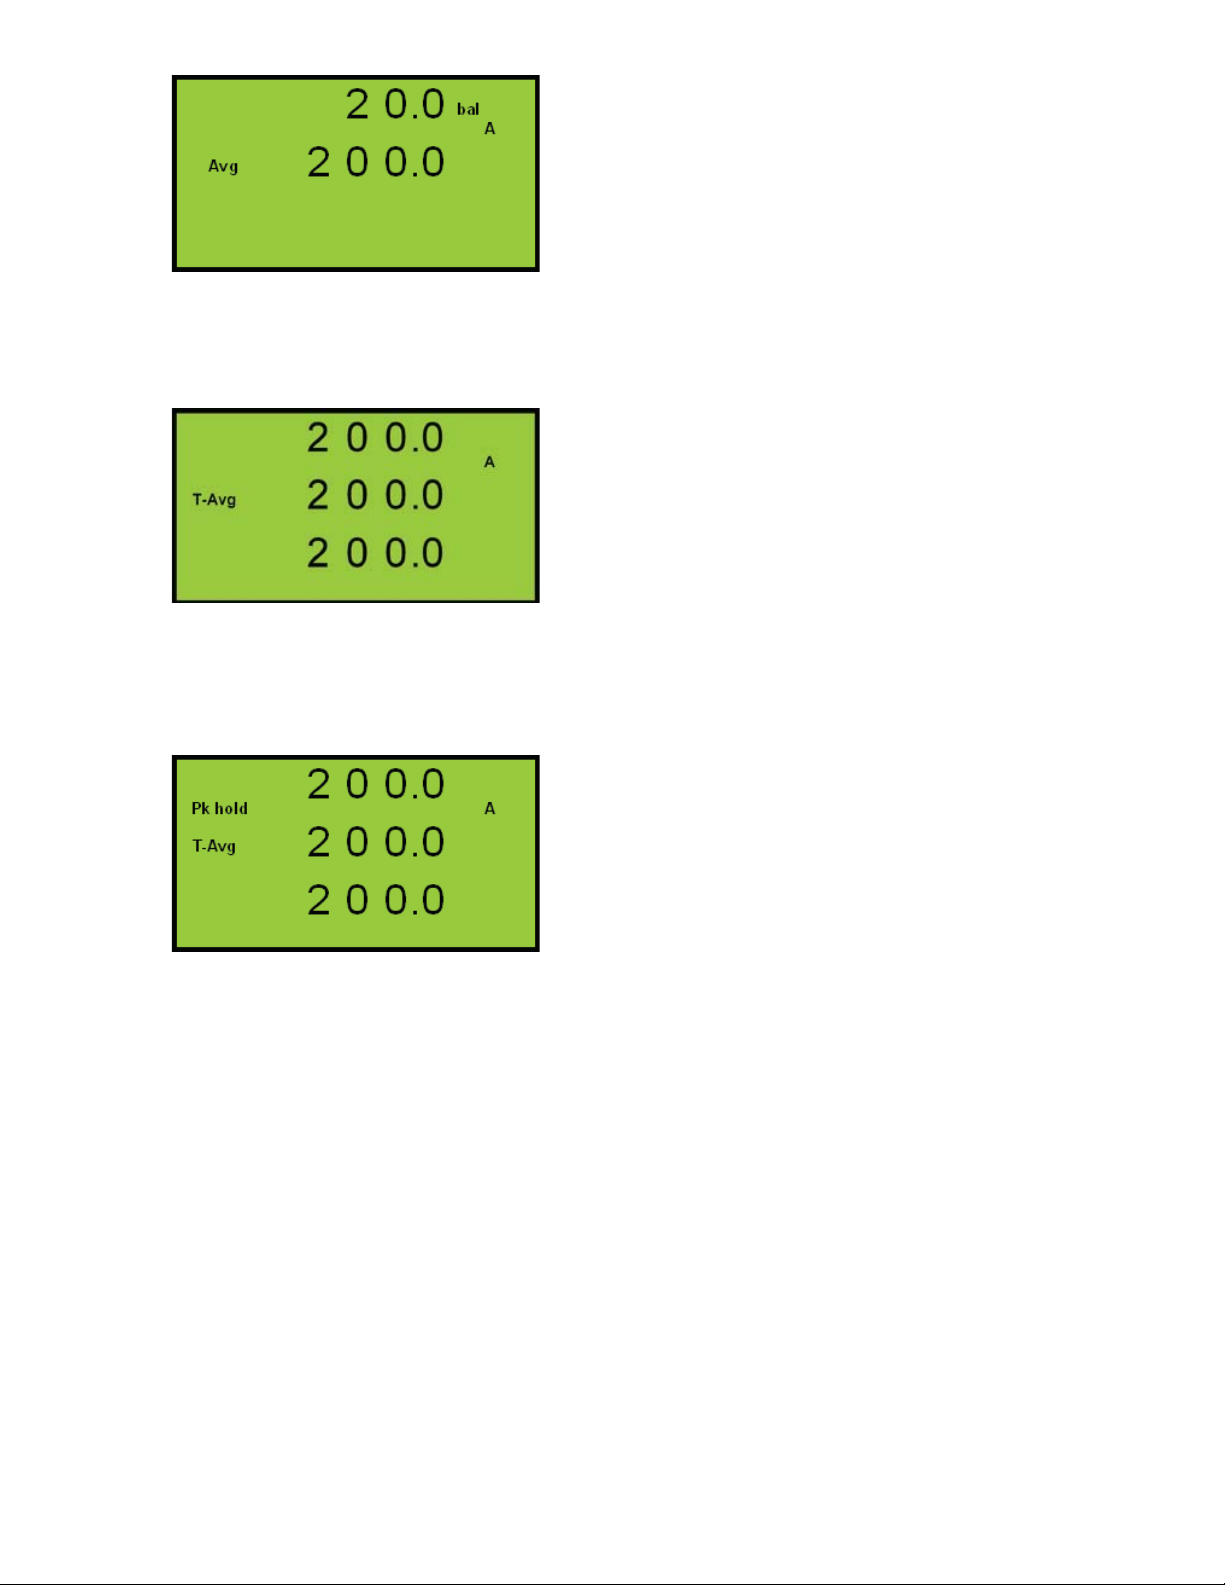
System and Balance Amps
G300 & G400 Only
Balance Amps - Instantaneous sum of
the phase current waveforms. This is a
measure of the neutral current + earth
leakage.
System Average Amps =
(Irms1 + Irms2 + Irms3)/3.
Time-Averaged Amps
G100 through G400
The calculated average of phase amps
taken over a user defi nable time period
(10s to 2500s).
T
VI
A rolling time window is used and the
display updated every T
/10 with the
VI
average of the most recent period
displayed.
Peak Time-Averaged Amps
G100 through G400
The maximum value of Time- Averaged
amps. These are stored in non-volatile
memory when the meter loses auxiliary
power
Press AMP and VOLTS to reset all
three peaks to zero.
9
Page 10
3.3 Voltage Menu
Press the VOLTS key to select from the available Voltage Menu
pages.
Phase Volts
All Meter Types
Phase 1 True rms volts
Phase 2 True rms volts.
Phase 3 True rms volts.
This display is updated every second.
Line Volts
All Meter Types
Line 1 Volts (Phases 1-2)
Line 2 Volts (Phases 2-3)
Line 3 Volts (Phases 3-1)
This display is updated every second.
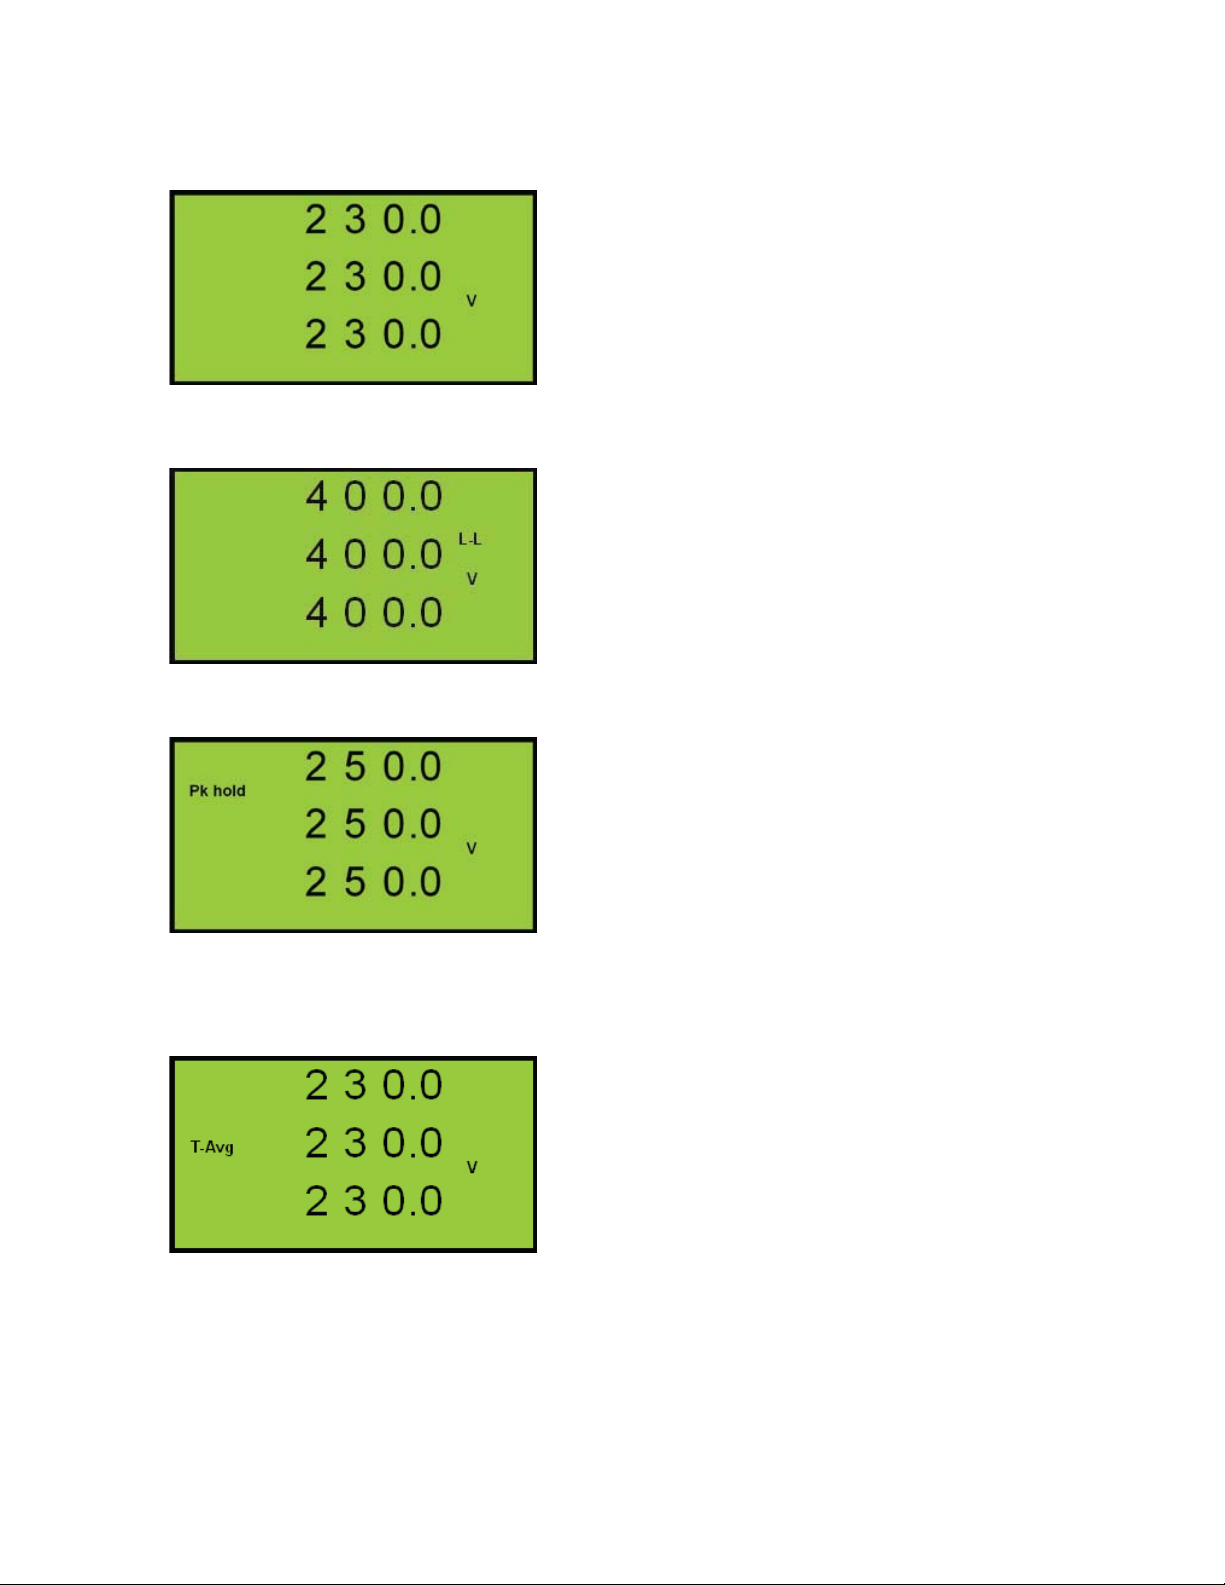
Peak Hold Phase Volts
Meter Type G300 & G400
The maximum value of displayed phase
volts. These are stored in non-volatile
memory when the meter loses auxiliary
power
Press AMP and VOLTS to reset all
three maximums to zero.
Time-Averaged Volts
All Meter Types
The calculated average of phase volts
taken over a user defi nable time period
T
(10s to 2500s).
VI
A rolling time window is used and the
display updated every T
/10 with the
VI
average of the most recent period
displayed.
10
Page 11
Peak Time-Averaged Volts
All Meter Types
The maximum value of Time- Averaged
volts. These are stored in non-volatile
memory when the meter loses auxiliary
power
Press AMP and VOLTS to reset all
three maximums to zero.
3.4 Power Menu (Meter Types G100-G400)
Press the POWER key to select from the available Power Menu
pages.
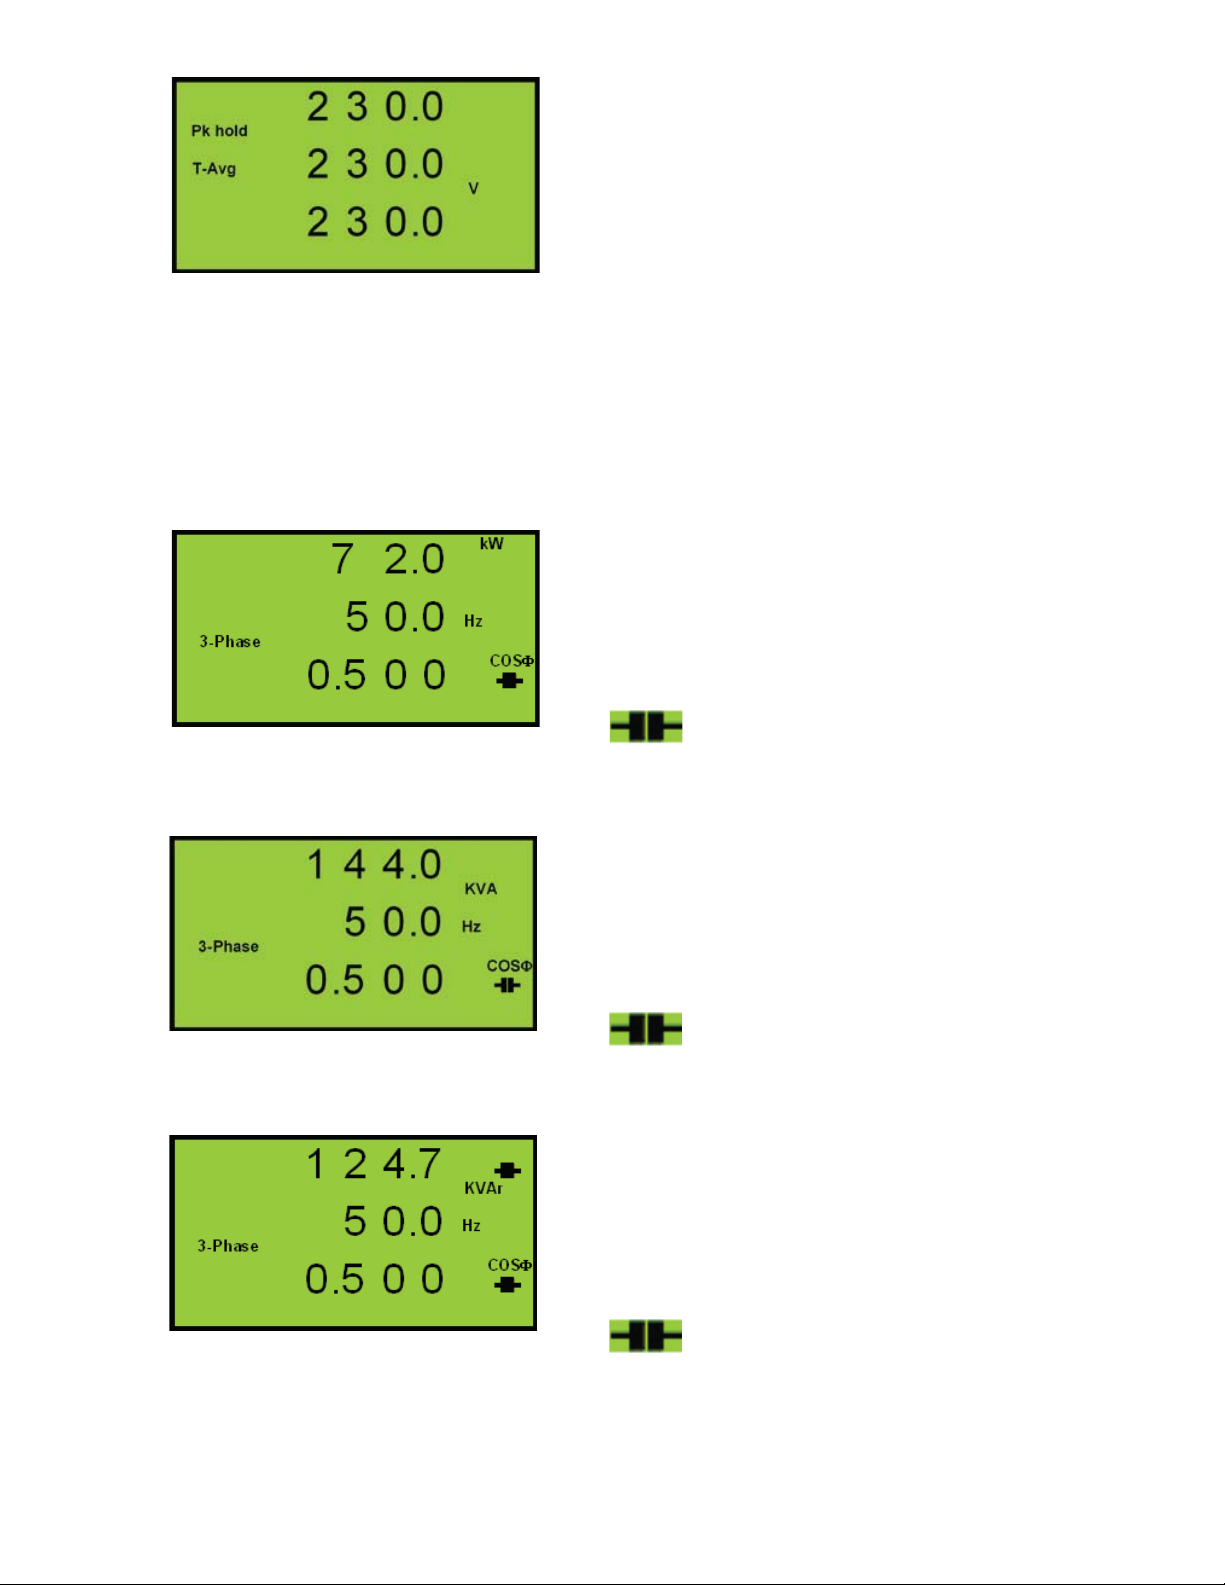
System Power (kW)
Meter Types G100 through G400
System Real Power (Watts)
Frequency (Measured on V1)
System, PF
A symbol after the PF value
indicates a capacitive load.
System Power (kVA)
Meter Type G400 Only
System Apparent Power (VA)
Frequency (Measured on V1)
System, PF
A symbol after the PF value
indicates a capacitive load.
System Power (kvar)
Meter Types G300 & G400 Only
System Reactive Power (VAr)
Frequency (Measured on V1)
System, PF
A symbol after the PF and kvar
values indicate a capacitive load.
11
Page 12
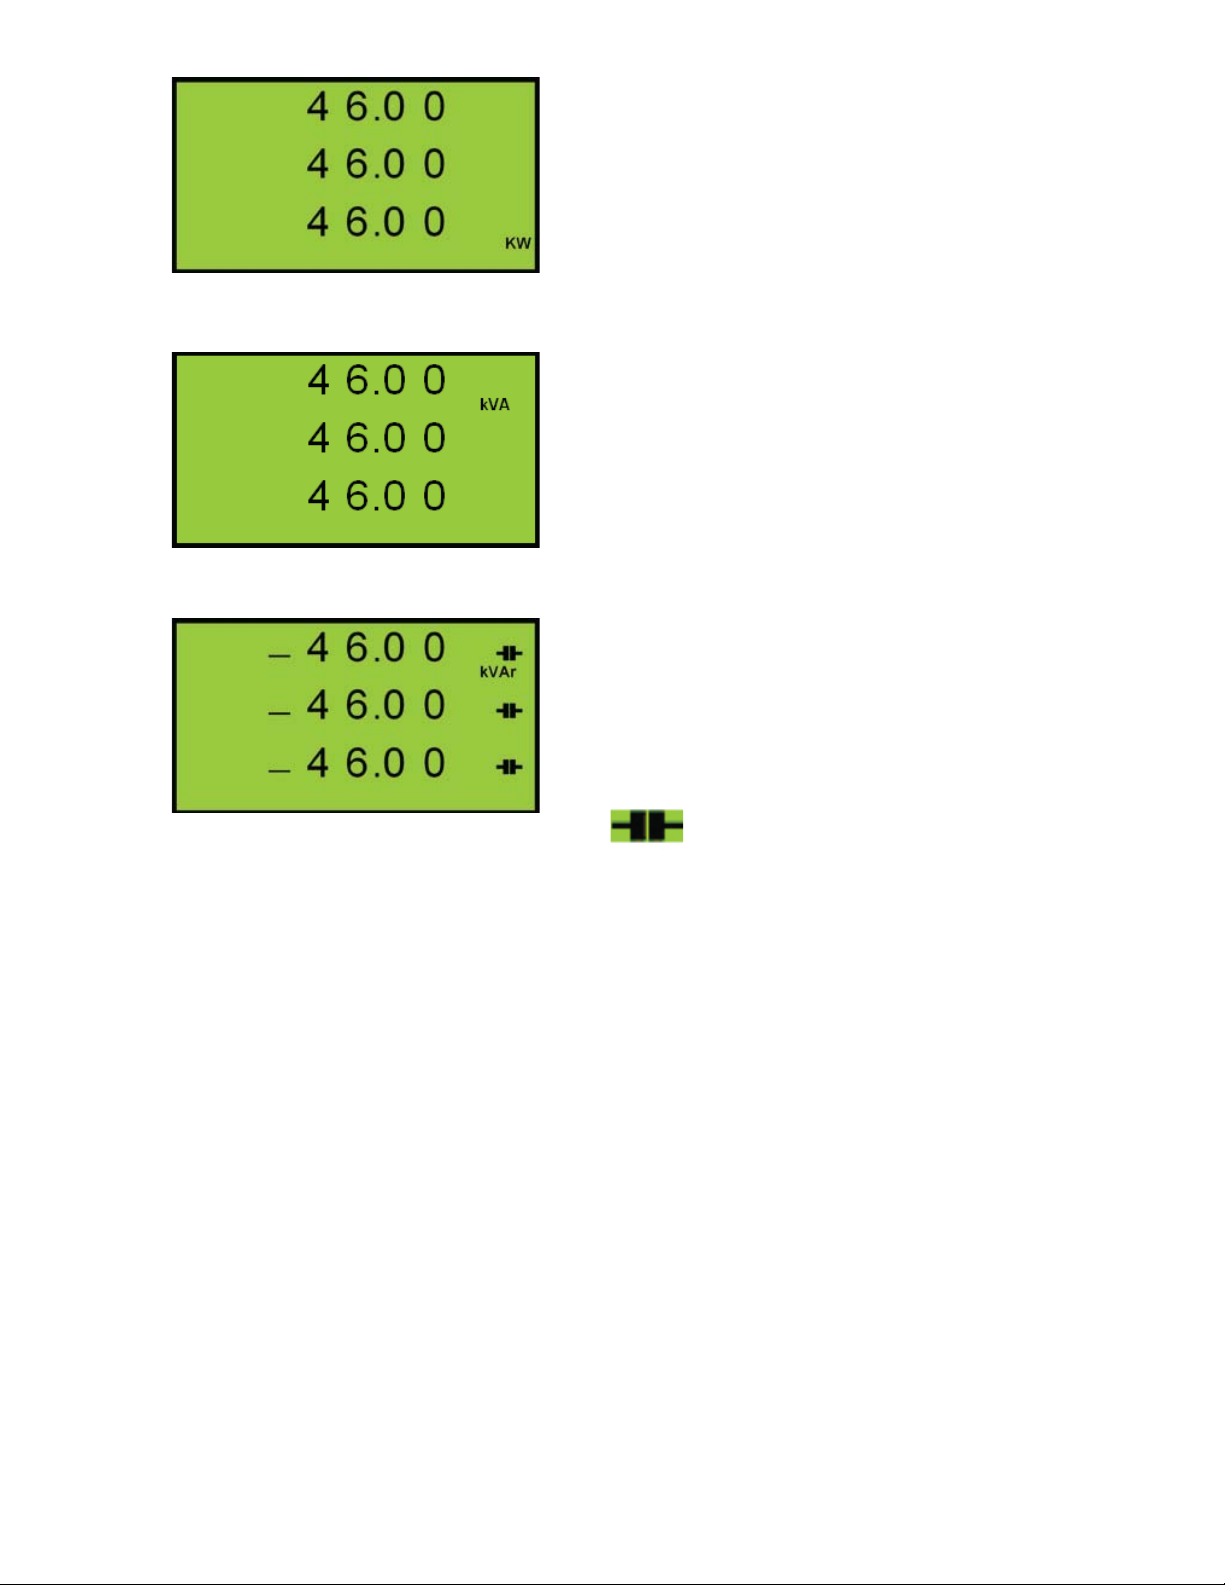
Phase Watts
Meter Types G100 through G400
Phase 1 watts
Phase 2 watts.
Phase 3 watts
Phase VA
Meter Type G400 Only
Phase 1 VA
Phase 2 VA.
Phase 3 VA
Phase var
Meter Types G300 & G400 Only
Phase 1 var
Phase 2 var.
Phase 3 var
A symbol after a var value
indicates a capacitive load.
A negative sign before a var reading
indicates export reactive power.
12
Page 13
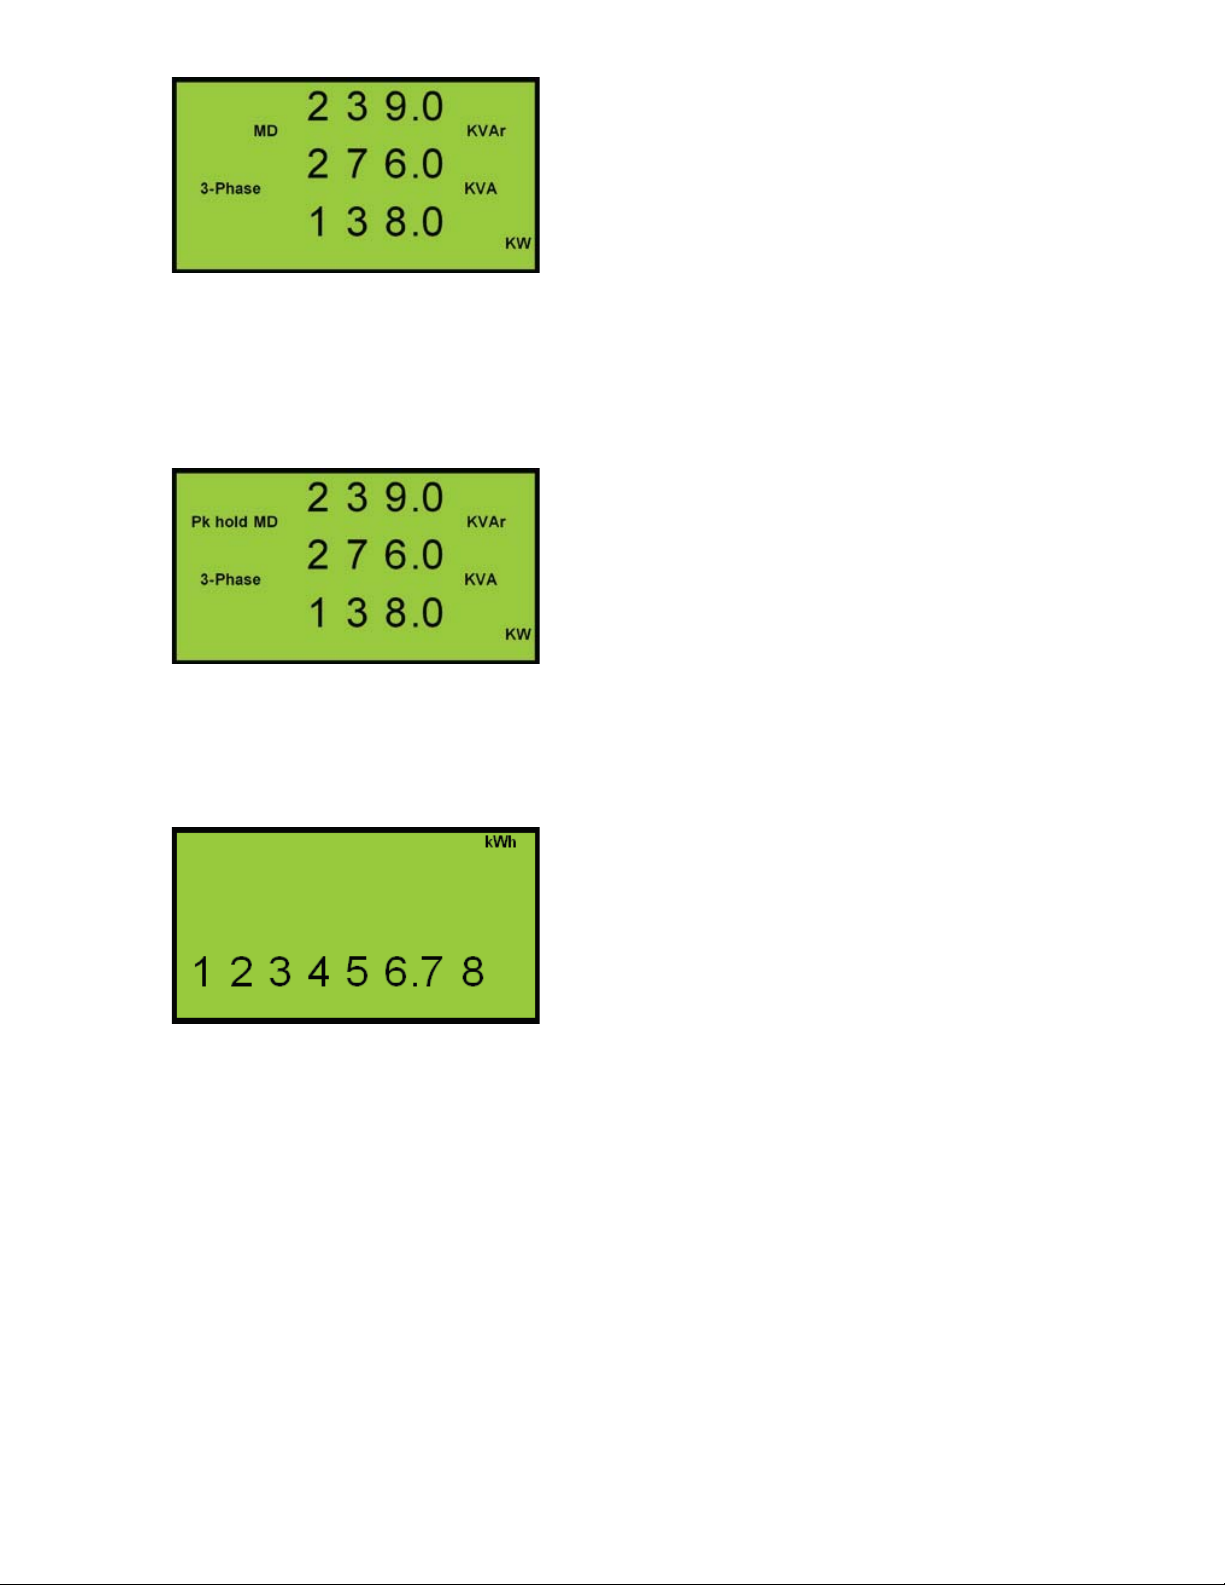
Mean Demand (MD)
Meter Types G300 & G400 Only
The calculated average of the system
power values taken over a user
defi nable time period T
(1min to 60min).
p
A rolling time window is used and the
display updated every T
/30 with the
p
averages of the most recent period
displayed.
Peak Hold MD
Meter Types G300 & G400 Only
The maximum value of each power MD
value. These are stored in non-volatile
memory.
Press AMP and VOLTS to reset all
three maximums to zero. See attached
link option on page.
Real Energy (Wh)
Meter Types G200 through G400 Only
This register accumulates when kW is
positive (import).
This value returns to 0 when the value
exceeds 99999999.
This register is stored in non-volatile
memory when auxiliary power is not
supplied to the meter.
*Press AMP & VOLTS and hold for 5
seconds to reset Kwh to zero if this
option is installed.
13
Page 14

Apparent Energy (VAh)
Meter Type G400 Only
VAh Accumulating register.
This value returns to 0 when the value
exceeds 99999999.
This register is stored in non-volatile
memory when auxiliary power is not
supplied to the meter.
Reactive Energy (varh)
Meter Type G300 & G400 Only
Import varh Accumulating register.
This value returns to 0 when the value
exceeds 99999999.
This register is stored in non-volatile
memory when auxiliary power is not
supplied to the meter.
Reactive Energy Inductive
Meter Types G300 & G400 Only
This register is separate from the main
import varh register and accumulates
only when the measured load is
inductive.
This register resets at 99999999 and is
saved in non volatile memory.
Reactive Energy Capacitive
Meter Types G300 & G400 Only
This register is separate from the main
import varh register and accumulates
only when the load is capacitive.
This register resets at 99999999 and is
saved in non volatile memory.
NOTE 1: Meters may be supplied with all Peak Reset keypad
functions disabled.
NOTE 2: Meters may be supplied with an Energy Reset Option
(ref section 5)
14
Page 15

GIMA Option Links
1. Option Links
WARNING
Risk of Electric Shock!
Isolate the instrument supply and all inputs before accessing the option links
Four option links may be accessed on the rear of the GIMA display
PCB. Meters are normally shipped with all these links fi tted.
*Not customer programmable. Contact Simpson before changing.*
1.1 Option Link Detection
For safe operation the instrument supply and all inputs must be isolated before
accessing option links. The link settings are only detected during power-up of the
auxiliary supply to the meter
2. Enable Programming Menu (Link1)
If this link is removed the user may not gain access to the programming menu
using the front panel keys. For further details of programming the GIMA refer to the
meter operating instructions.
3. Disable Reset Energy (LINK2)
If this link if fi tted the Energy Registers may be reset by:
Press P to display any energy register
Press AMP and VOLTS together and hold until energy resister resets to zero
(approx 5S).
If this link is removed the Energy Registers may not be reset
NOTE: Once reset to zero the accumulated energy readings may not be recovered.
4. Disable Reset Peaks (LINK3)
If this link is removed the peak hold and peak demand values may be reset by:
Select any display page showing a Peak Hold or Peak Demand value.
Press AMP or VOLTS together and hold until the peak value resets to zero (approx
2S).
If this link is fi tted the peak and peak demand values may not be reset
NOTE: Once reset the zero and peak and peak demand values will be replaced by
values measured in the following second.
5. Pulse Output #2 (LINK4)
If this link is fi tted the second pulse output will be triggered by changes in the
import kvarh register.
If this link is omitted the second pulse output will be triggered by changes in the
kVah register.
15
Page 16
3.5 Reset of Energy Registers
Meters may be supplied with an option to reset energy registers
to zero using the front keys. If the option is fi tted, press AMP and
VOLTS together while displaying any energy register and hold for
approximately 3 seconds. All energy registers are simultaneously
reset to zero. Once reset the registers may not be recovered.
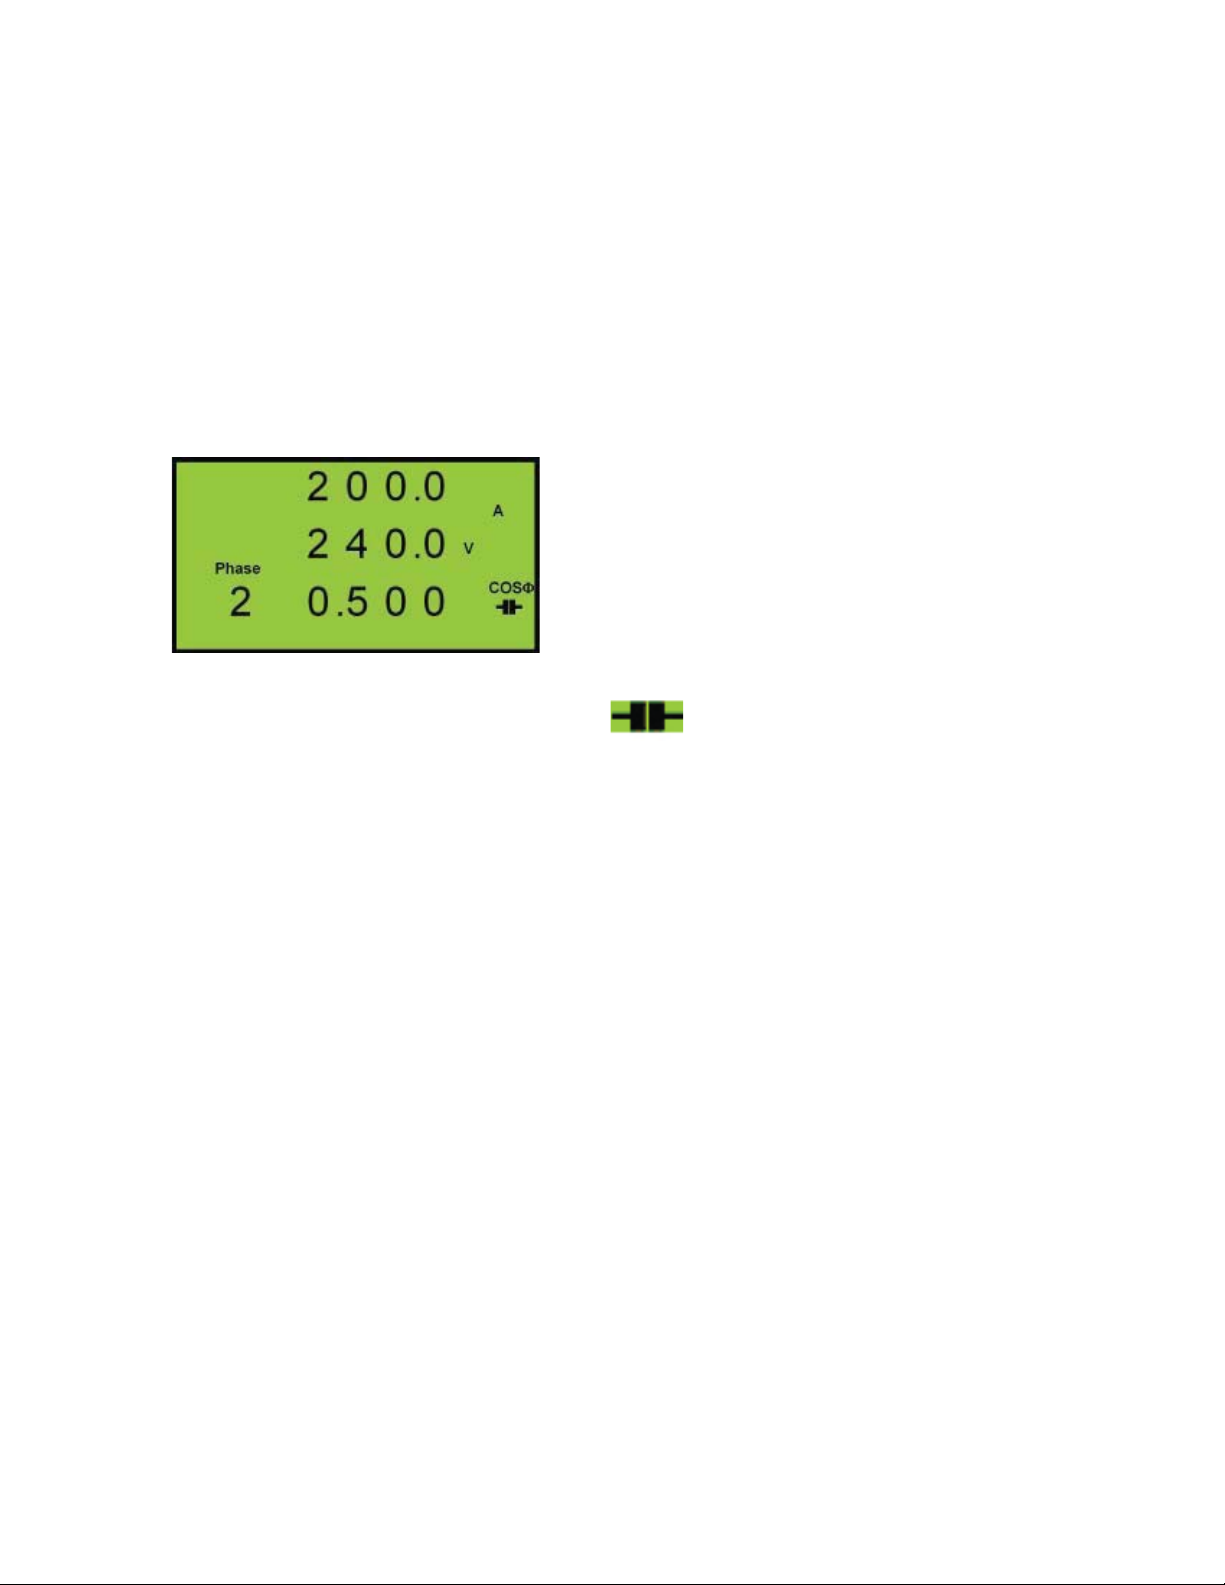
3.6 Scrolling Menu (Meter Types G100 through G400)
Press the SCROLL key to select the Auto Scrolling Per-Phase
Menu.
Per-Phase Display Pages
Meter Types G100 through G400
Three pages show the Amps Volts
and Power Factor of phases 1-3
consecutively.
The Phase automatically advances after
approximately 5 seconds.
A symbol indicates a capacitive
load.
Press the SCROLL key to advance the scrolling pages more
quickly.
16
Page 17
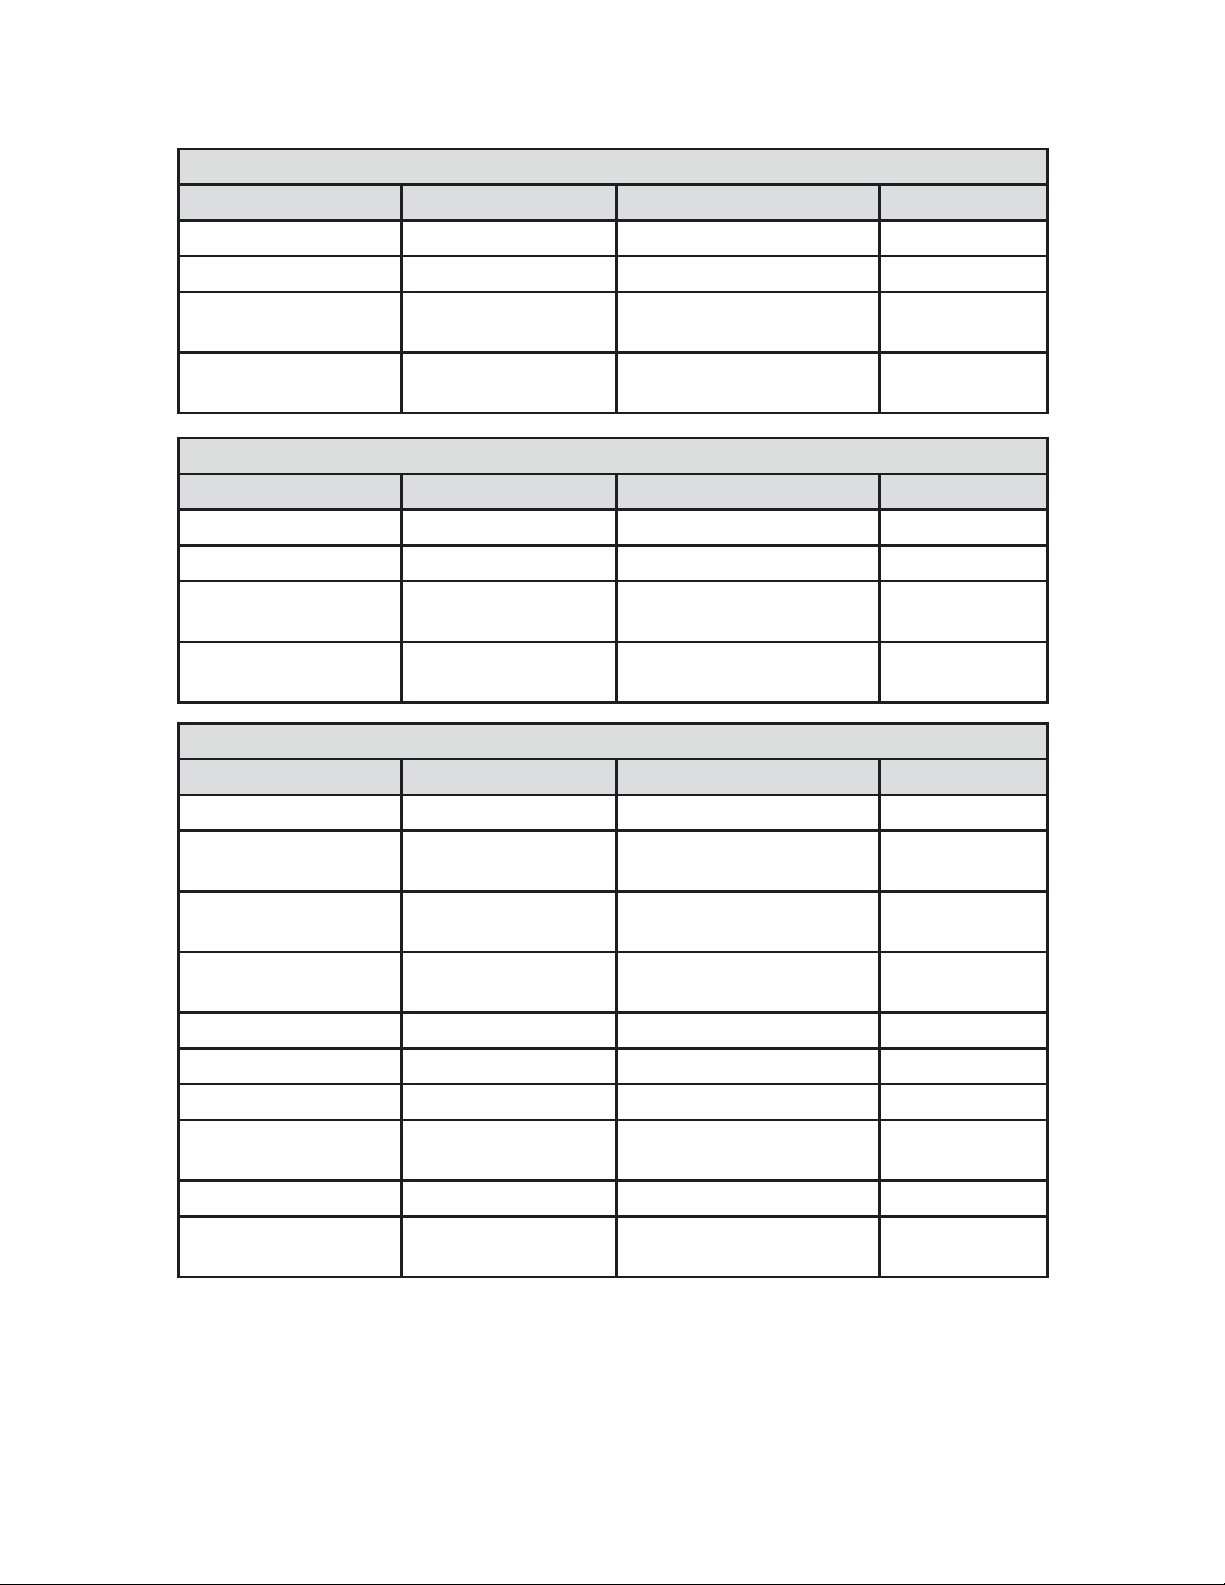
3.7 Meter Type Display Menus
G100 Menus
AMPS VOLTS POWER SCROLL
Phase Amps Phase Volts System Power (kw),Hz,PF Phase 1 PF, V, I
Time Averaged Amps Line Volts Phase Watts Phase 2 PF, V, I
Peak Time Averaged
Amps
AMPS VOLTS POWER SCROLL
Phase Amps Phase Volts System Power (kw),Hz,PF Phase 1 PF, V, I
Time Averaged Amps Line Volts Phase Watts Phase 2 PF, V, I
Peak Time Averaged
Amps
AMPS VOLTS POWER SCROLL
Phase Amps Phase Volts System Power (kw),Hz,PF Phase 1 PF, V, I
Time Averaged Amps Line Volts System Power
Time Averaged Volts Phase 3 PF, V, I
Peak Time Averaged
Volts
G200 Menus
Time Averaged Volts Import Real Energy (Wh) Phase 3 PF, V, I
Peak Time Averaged
Volts
G300 Menus
Phase 2 PF, V, I
(kvar),Hz,PF
Peak Time Averaged
Amps
Time Averaged Volts Phase Watts Phase 3 PF, V, I
Peak Time Averaged
Volts
Phase var
Maximum Demands (MD)
Peak Hold MDs
Import Real Energy (Wh)
Import Reactive Energy
(varh)
Reactive Energy Inductive
Reactive Energy
Capacitive
17
Page 18
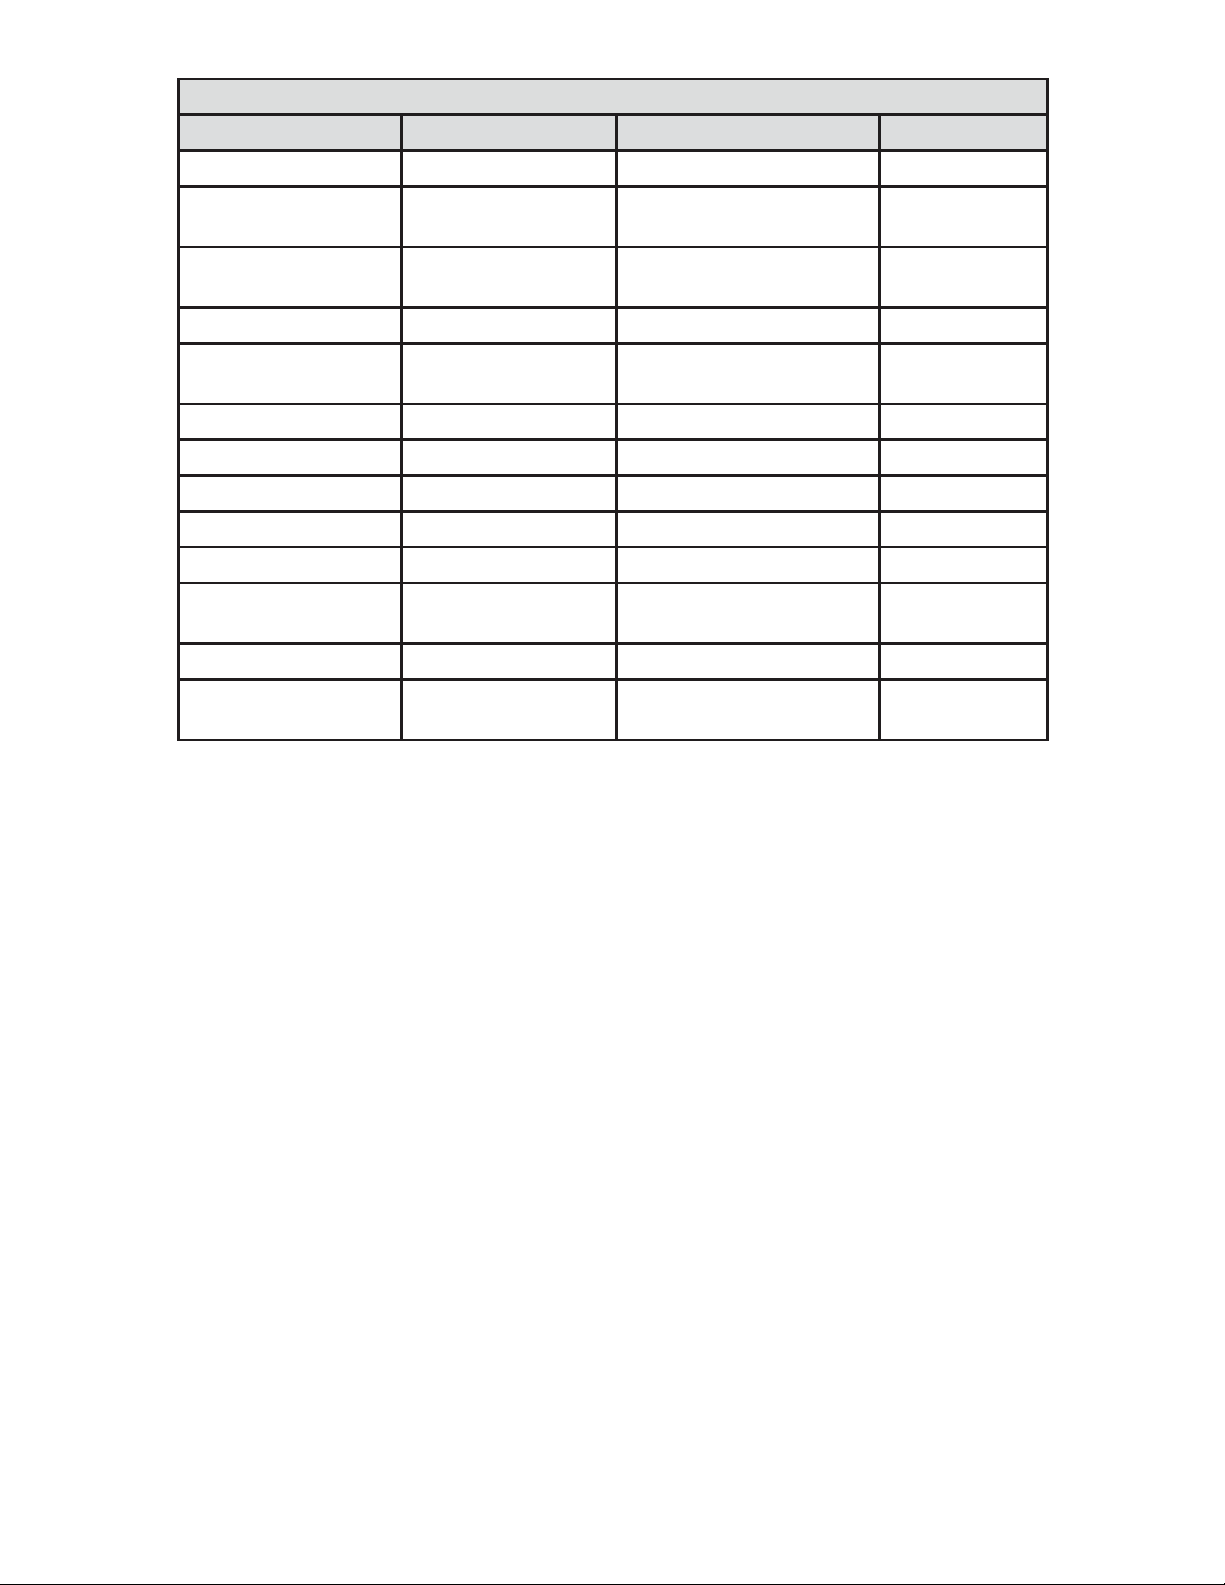
G400 Menus
AMPS VOLTS POWER SCROLL
Phase Amps Phase Volts System Power (kw),Hz,PF Phase 1 PF, V, I
Peak Hold Phase
Amps
System and Balance
Amps
Time Averaged Amps Time Averaged Volts Phase Watts
Peak Time Averaged
Amps
Line Volts System Power
(kVA),Hz,PF
Peak Hold Phase
Volts
Peak Time Averaged
Volts
System Power
(kvar),Hz,PF
Phase VA
Phase var
Maximum Demands (MD)
Peak Hold MDs
Import Real Energy (Wh)
Apparent Energy (VAh)
Import Reactive Energy
(varh)
Reactive Energy Inductive
Reactive Energy
Capacitive
Phase 2 PF, V, I
Phase 3 PF, V, I
18
Page 19

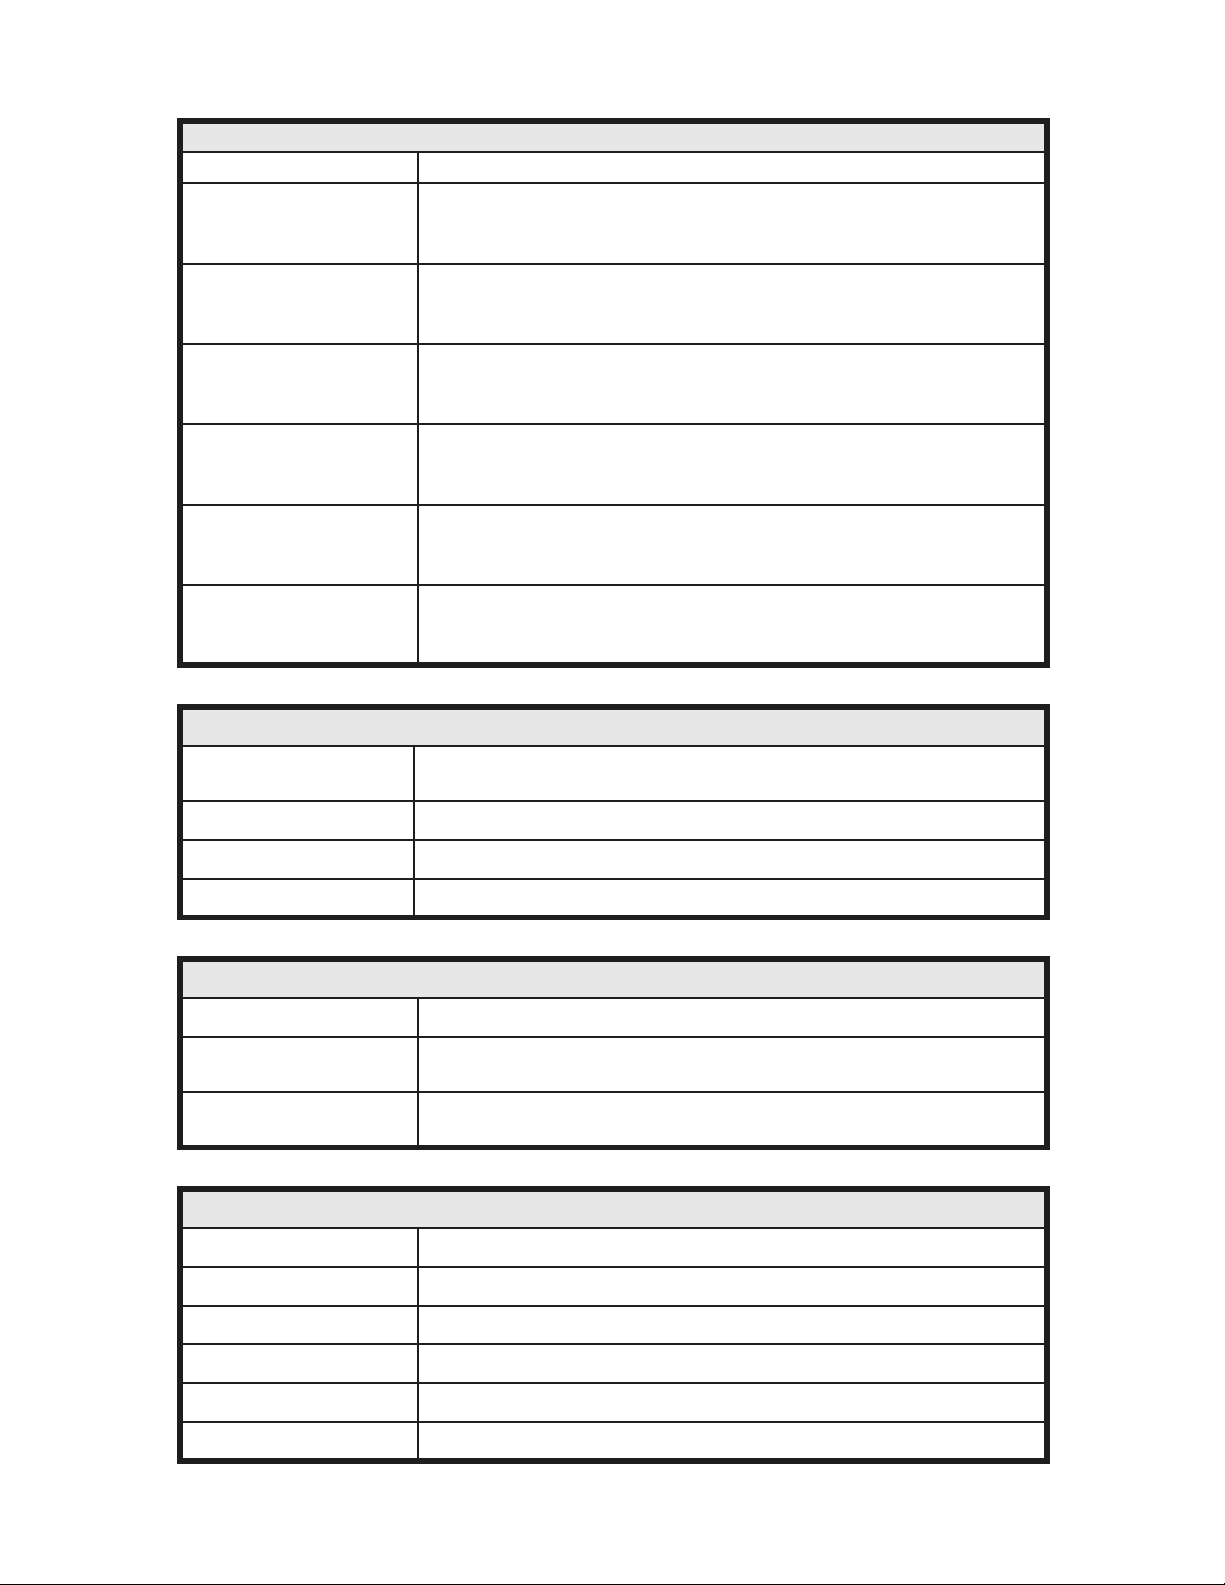
3.8 Display Scaling
Measured values displayed on the LCD are scaled by the user
settings of CT and/or PT primaries to provide optimum resolution.
3.8.1 Voltage Scaling
PT Setting Resolution
10V
- 80V
L-L
81V
L-L
801V
L-L
8,001V
>80,000V
L-L
- 800V 0.1 V
– 8,000V
- 80,000V
L-L
L-L
L-L
L-L
0.01 V
1 V
0.01 kV
0.1kV
3.8.2 Current Scaling
CT Setting Resolution
5A - 8A 0.001 A
9A - 80A 0.01 A
81A - 800A 0.1 A
801A – 8,000A 1 A
>8,000A 0.01 kA
3.8.3 Power Scaling (W, VA, var)
PT Setting x CT Setting Phase Parameters System Parameters
100VA - 1,400VA 0.1 W 0.001 kW
1,401VA - 14,000VA 0.001 kW 0.01 kW
14,001VA - 140,000VA 0.01 kW 0.1 kW
140,001VA - 1,400,000VA 0.1 kW 1 kW
1,400,001VA - 14,000,000VA 1 kW 0.01 MW
14,000,001VA - 140,000,000VA 0.01 MW 0.1 MW
140,000,001VA – 1,000,000,000VA 0.1 MW 1 MW
3.8.4 Energy Registers (Wh, VAh, varh)
PT Setting x CT Setting Resolution
100VA - 1,400VA .001 kWh
1,401VA - 14,000VA 0.01 kWh
14,001VA - 140,000VA 0.1 kWh
140,001VA - 1,400,000VA 1 kWh
1,400,001VA - 14,000,000VA 0.01 MWh
14,000,001VA - 140,000,000VA 0.1 MWh
140,000,001VA – 1,000,000,000VA 1 MWh
3.8.5 Miscellaneous
All Settings Resolution
System and Phase PF 0.001
THD 0.1%
Harmonics 0.1%
Frequency 0.1 hz
19
Page 20
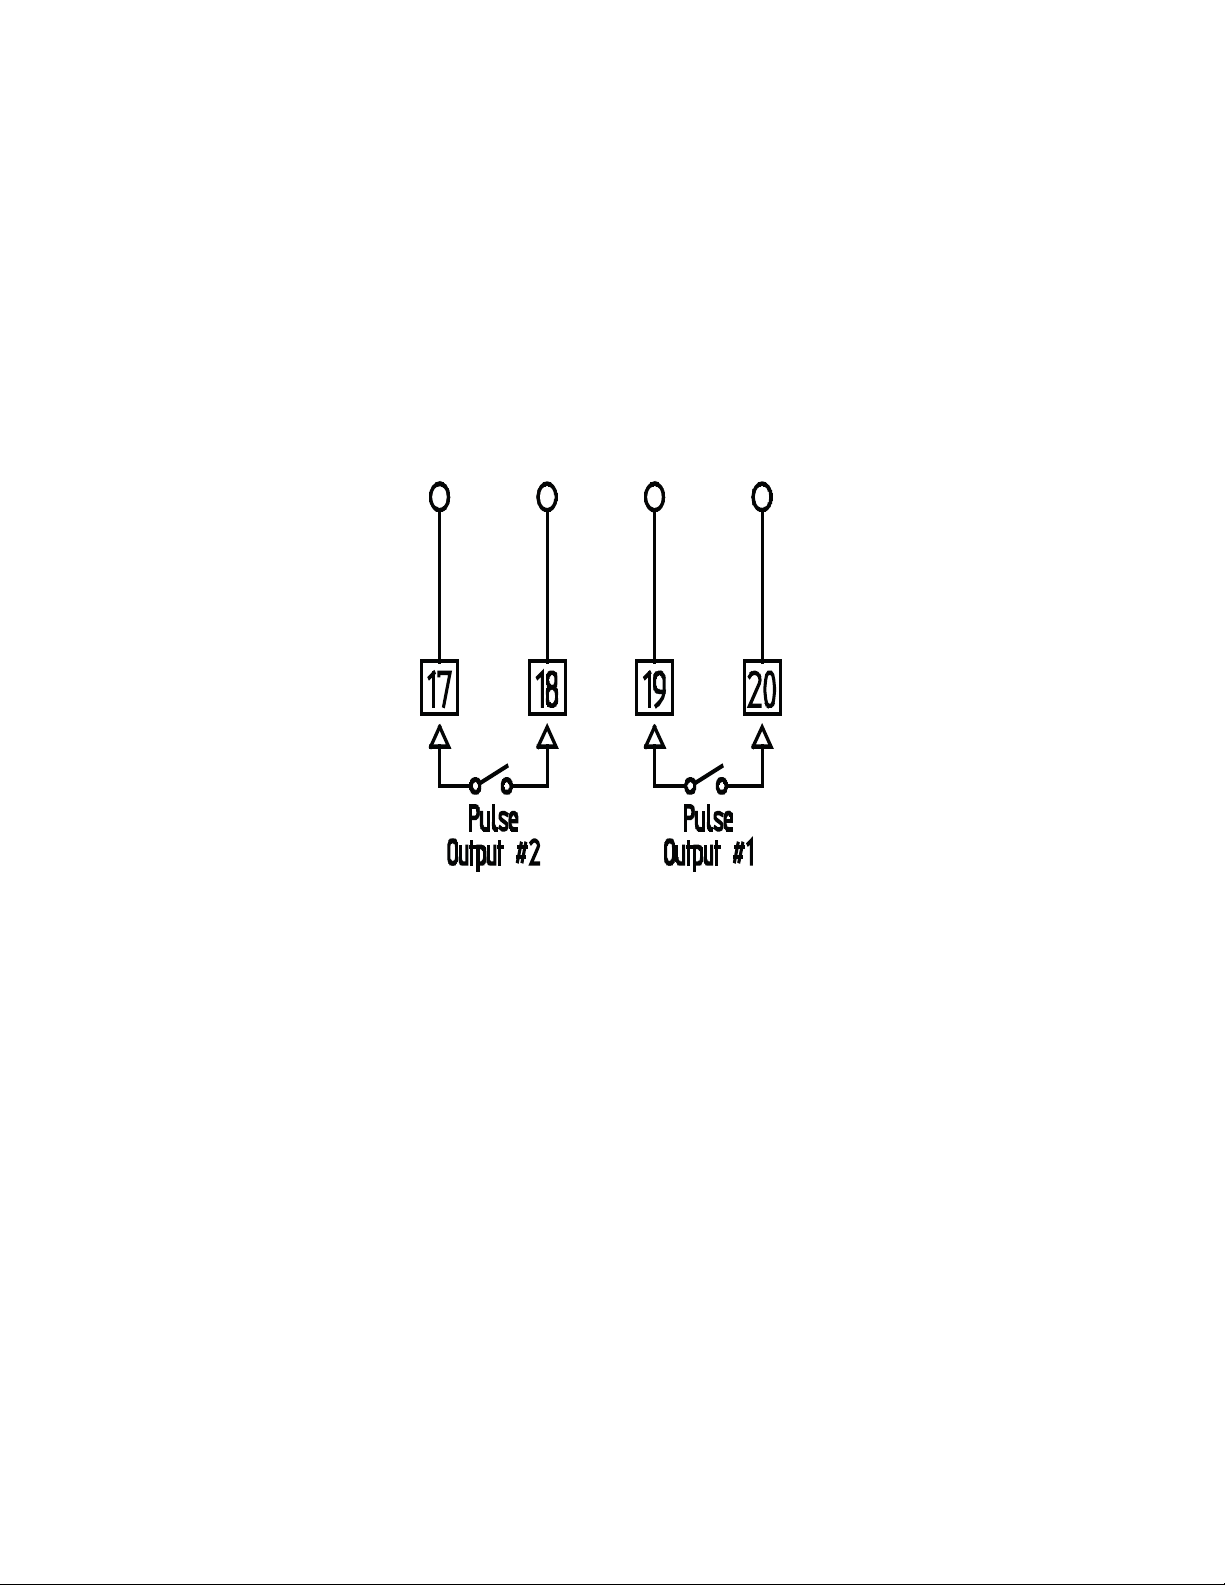
3.9 Isolated Pulse Outputs
GIMA meters which display kWh and/or kvarh incorporate isolated
pulse output(s). These outputs provide a simple interface to
external systems such as building management centres etc.
Each output takes the form of a normally open, volt free contact
pair which provides a low resistance, for 100mS, at the end of a
pre-set number of increments of the associated energy register
(‘pulse rate’). The pulse rate of each output may be programmed
by the user to match the requirements of the external system. For
further details on programming the GIMA refer to Section 5.
Figure 2.1 Pulse Output Connection
20
Page 21
4. Installation
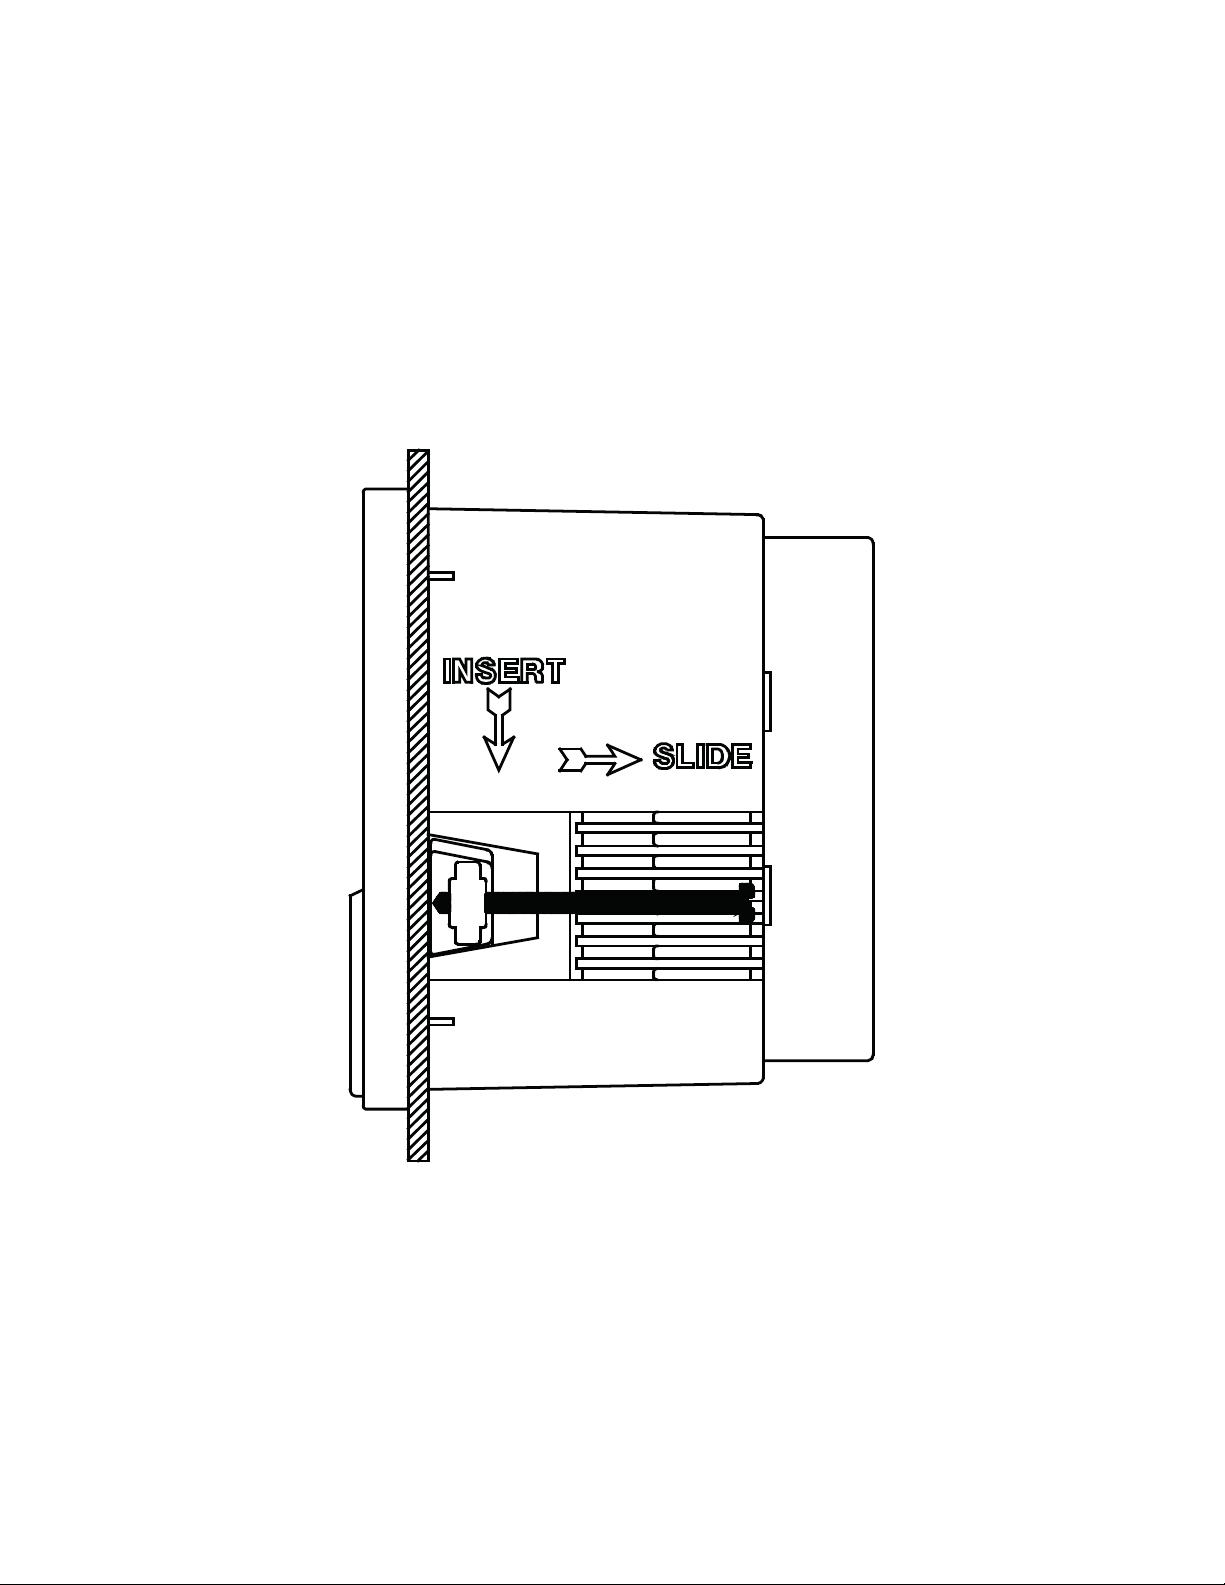
4.1 Panel Mounting
Panels should be of thickness 1mm to 4mm with a square cut-out
of 92mm (+0.8 - 0.0). A minimum depth of 72mm should be allowed
behind the panel for the meter. Remove the panel mounting clips
and insert the meter into the cut-out from the front of the panel.
Push the meter home. Ensure the screws in each panel mount
clip are fully retracted and insert the clips as shown in the diagram
below. Tighten the screws to secure the meter fi rmly in the panel.
DO NOT OVERTIGHTEN.
Figure 4-1 Fitting The Meter in a Panel
21
Page 22

4.2 CT Connections
The GIMA is designed for use with external current transformers
(CTs). Recommended types should conform to Class 1 per
IEC 60044-1. The secondary of the CT should be specifi ed to suit
the input rating defi ned on the meter label. Cables used for the
current circuit should have a maximum conductor size of 4.0mm
and should be kept as short as possible to reduce cable losses
loading the CT secondary.
CT Inputs to the meter are isolated from each other and all other
parts of the circuit. This allows use on a wide variety of systems
including those requiring common and/or earthed CT secondaries.
WARNING :
NEVER leave the secondary of a current transformer open circuit while
a primary current fl ows. In this condition dangerous voltages may be
produced at the secondary terminals.
4.3 Voltage Connections
2
Cables used for the voltage measurement circuit should be
insulated to a minimum of 600V AC and have a minimum current
rating of 250mA. The maximum conductor size is 4.0mm
External protection fuses are recommended for the voltage
measurement inputs. These should be rated at 160mA maximum,
Type F, and should be able to withstand voltages greater than the
maximum input to the meter.
4.4 Auxiliary Mains Supply (L & N)
The GIMA uses an isolated auxiliary mains supply separate
from the voltage measurement inputs. This may be connected
separately or in parallel with the measurement inputs provided the
ratings detailed on the instrument label are not exceeded.
Separate connection of the auxiliary mains is required, for example,
when :
x A suitable supply voltage is not available locally.
x Measurement voltages are expected to vary over a wide range
x A backup supply is required to maintain meter display
2
.
The auxiliary mains supply is not internally fused. External fusing
is required to protect the meter. External fuses should be rated
at 250mA 250V Type T. The meter ratings are detailed on the
instrument label.
WARNING :
CHECK the instrument LABELS for correct input ratings. Incorrectly rated
inputs may permanently damage the device.
22
Page 23
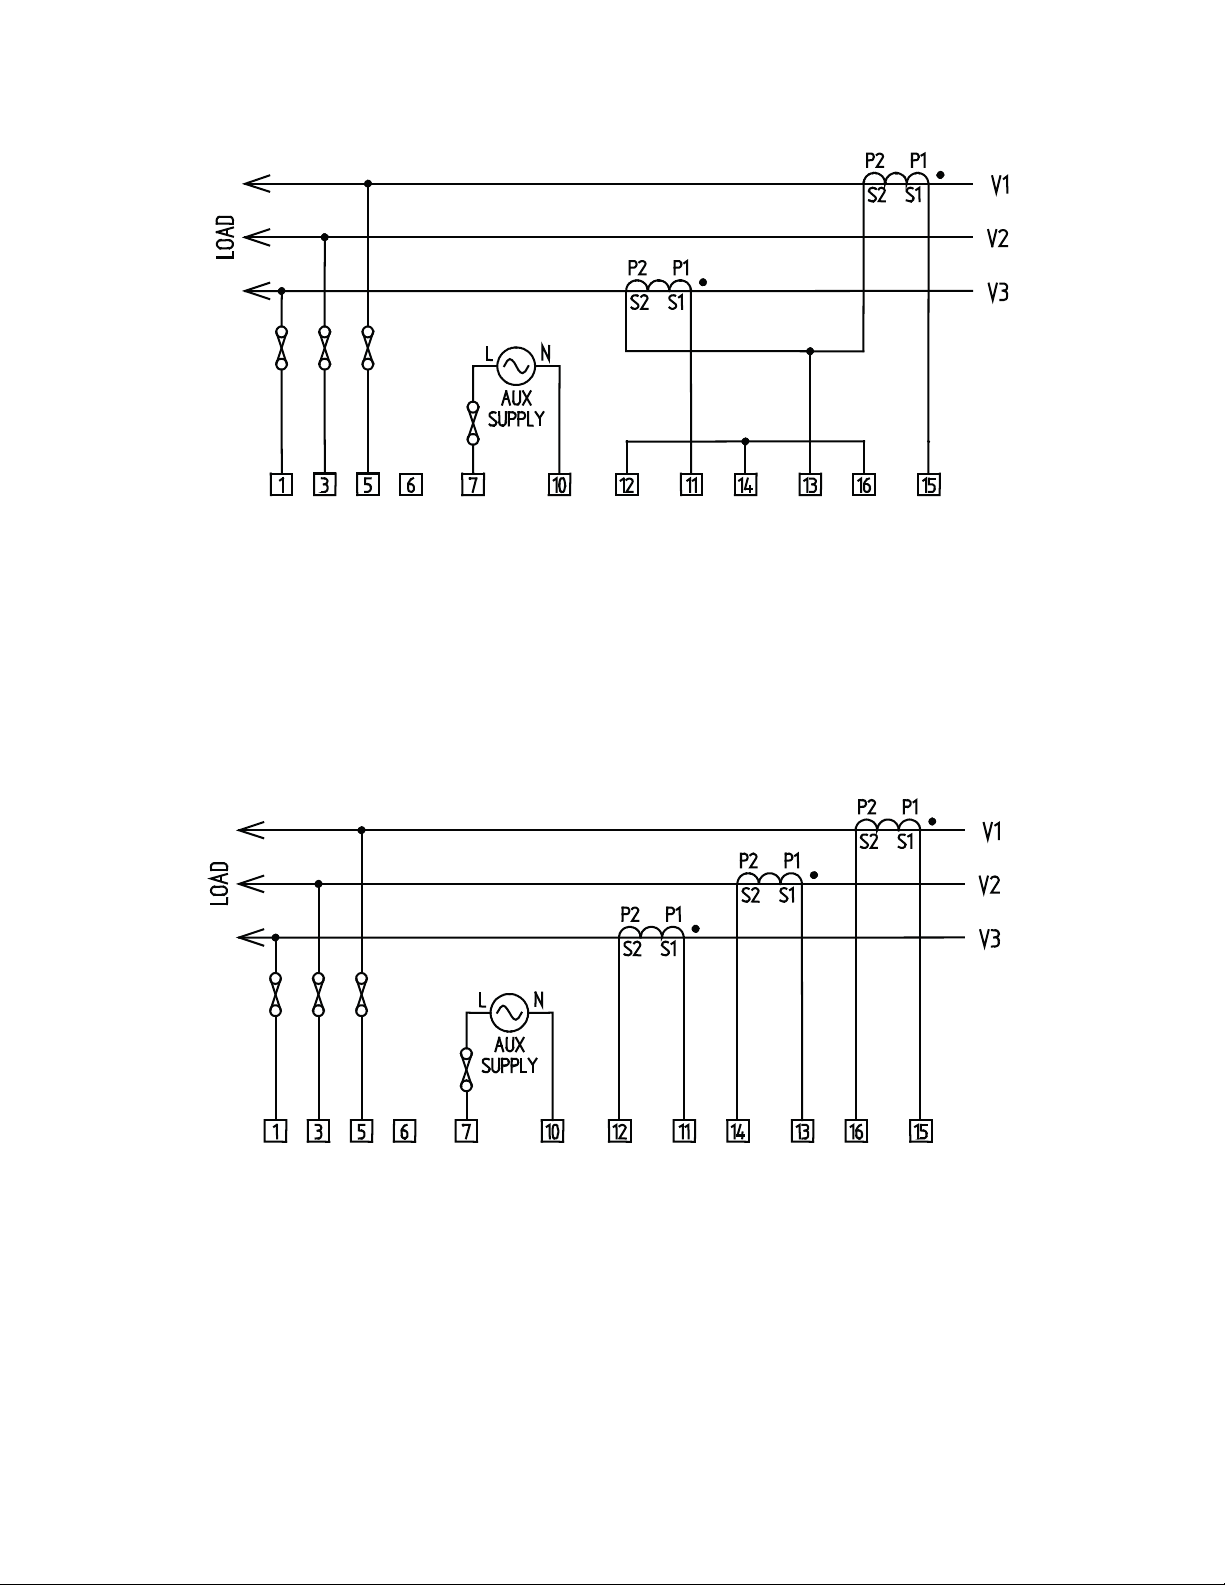
4.5 Connection Schematics
Figure 4-2 3-Phase 3-Wire 2CTs
Figure 4-3 3-Phase 3-Wire 3CTs (See Note 2)
23
Page 24
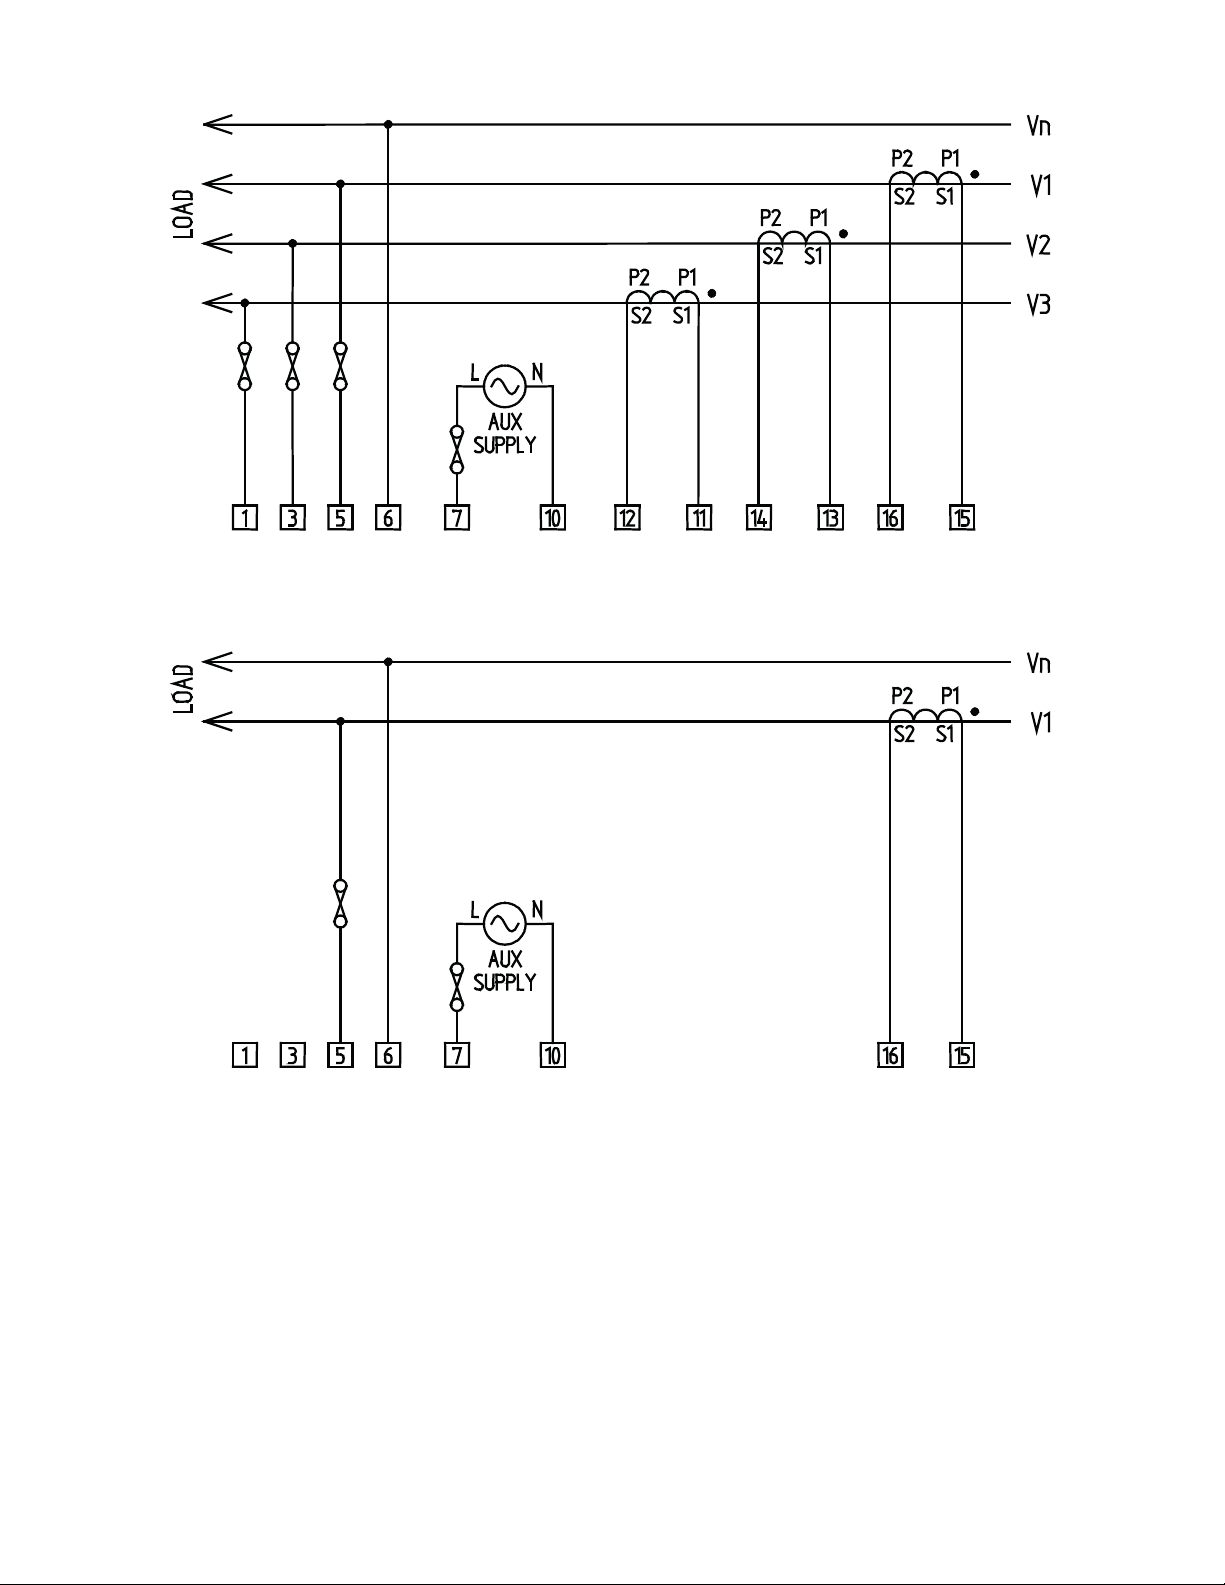
Figure 4-4 3-Phase 4-Wire (See Note 2)
Figure 4-5 Single Phase
24
Page 25
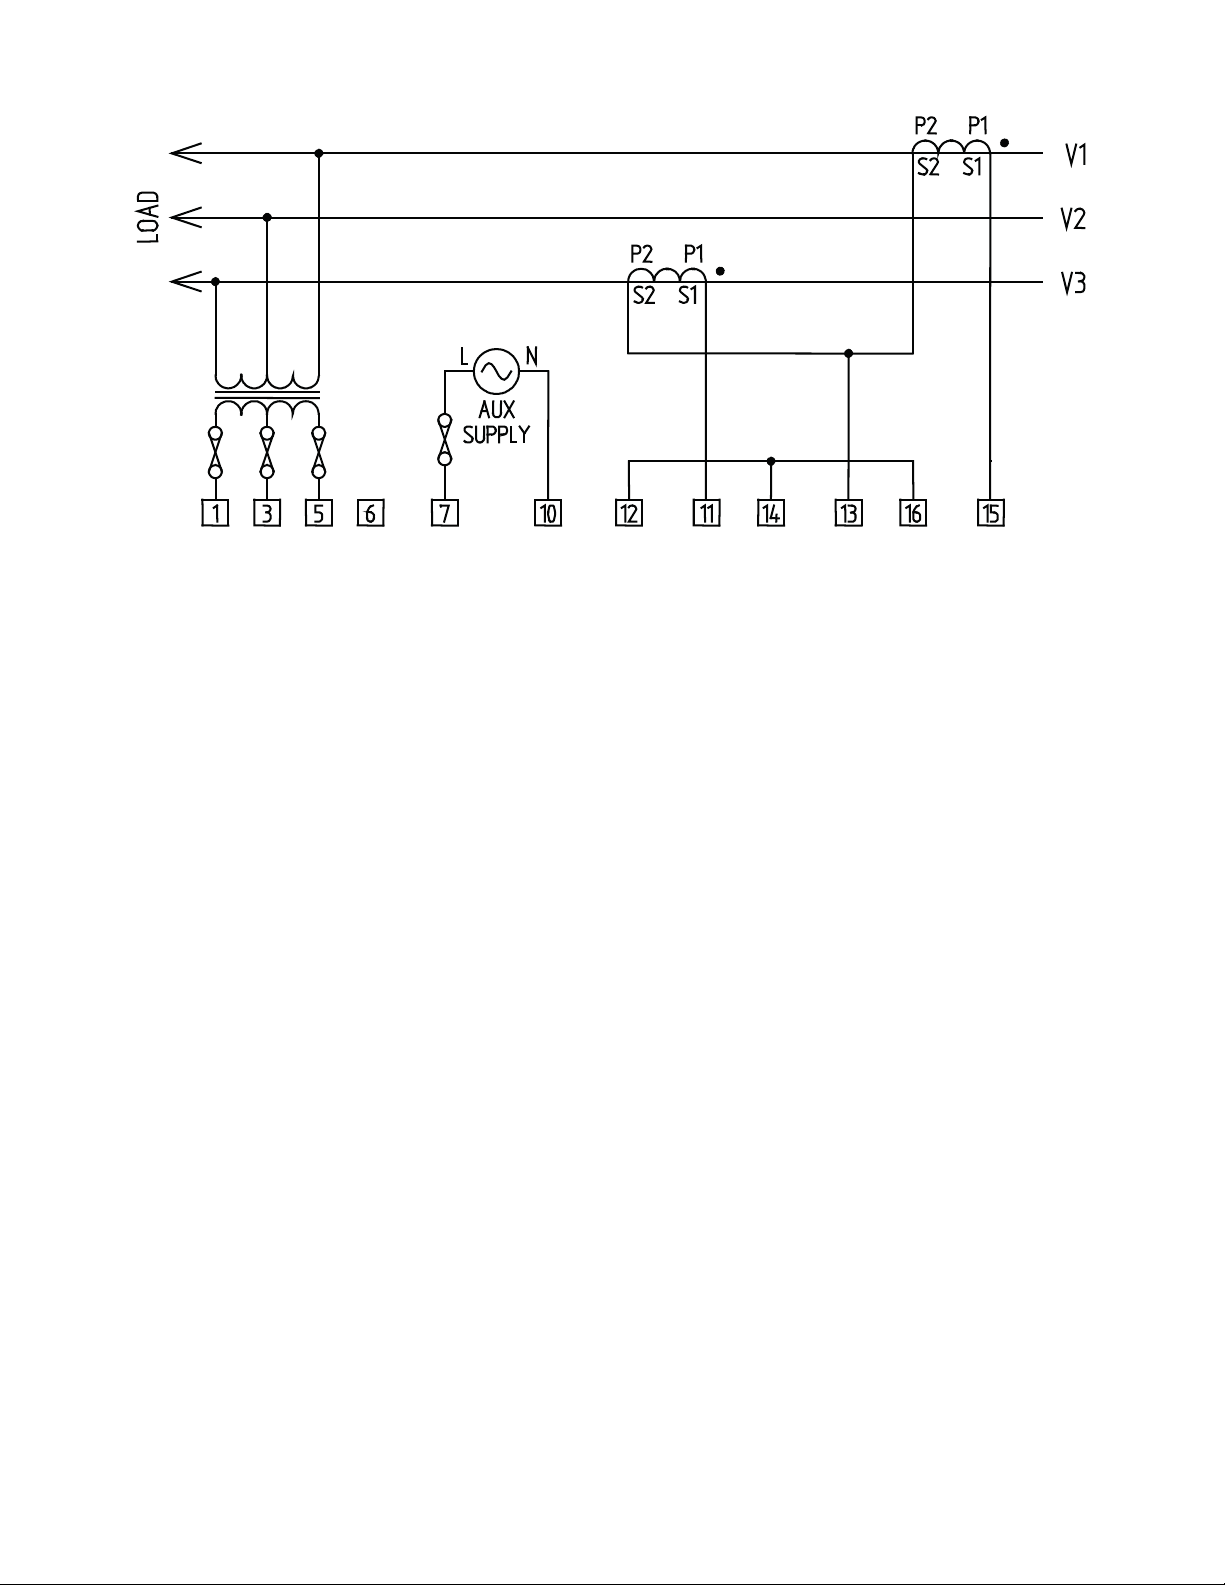
Figure 4-6 3 Phase 3 Wire Using Potential Transformers (2CTs)
Note 1: It is possible to use 3 current transformers in conjunction with
potential transformers. Refer to Figure 4-3 for details of CT connection.
Note 2: Some systems require the S2 terminals of each CT to be
connected to common point. This common point may be earthed. The
GIMA has isolated CT inputs facilitating this type of connection.
25
Page 26
5. Meter Setup
5.1 Programming Menu
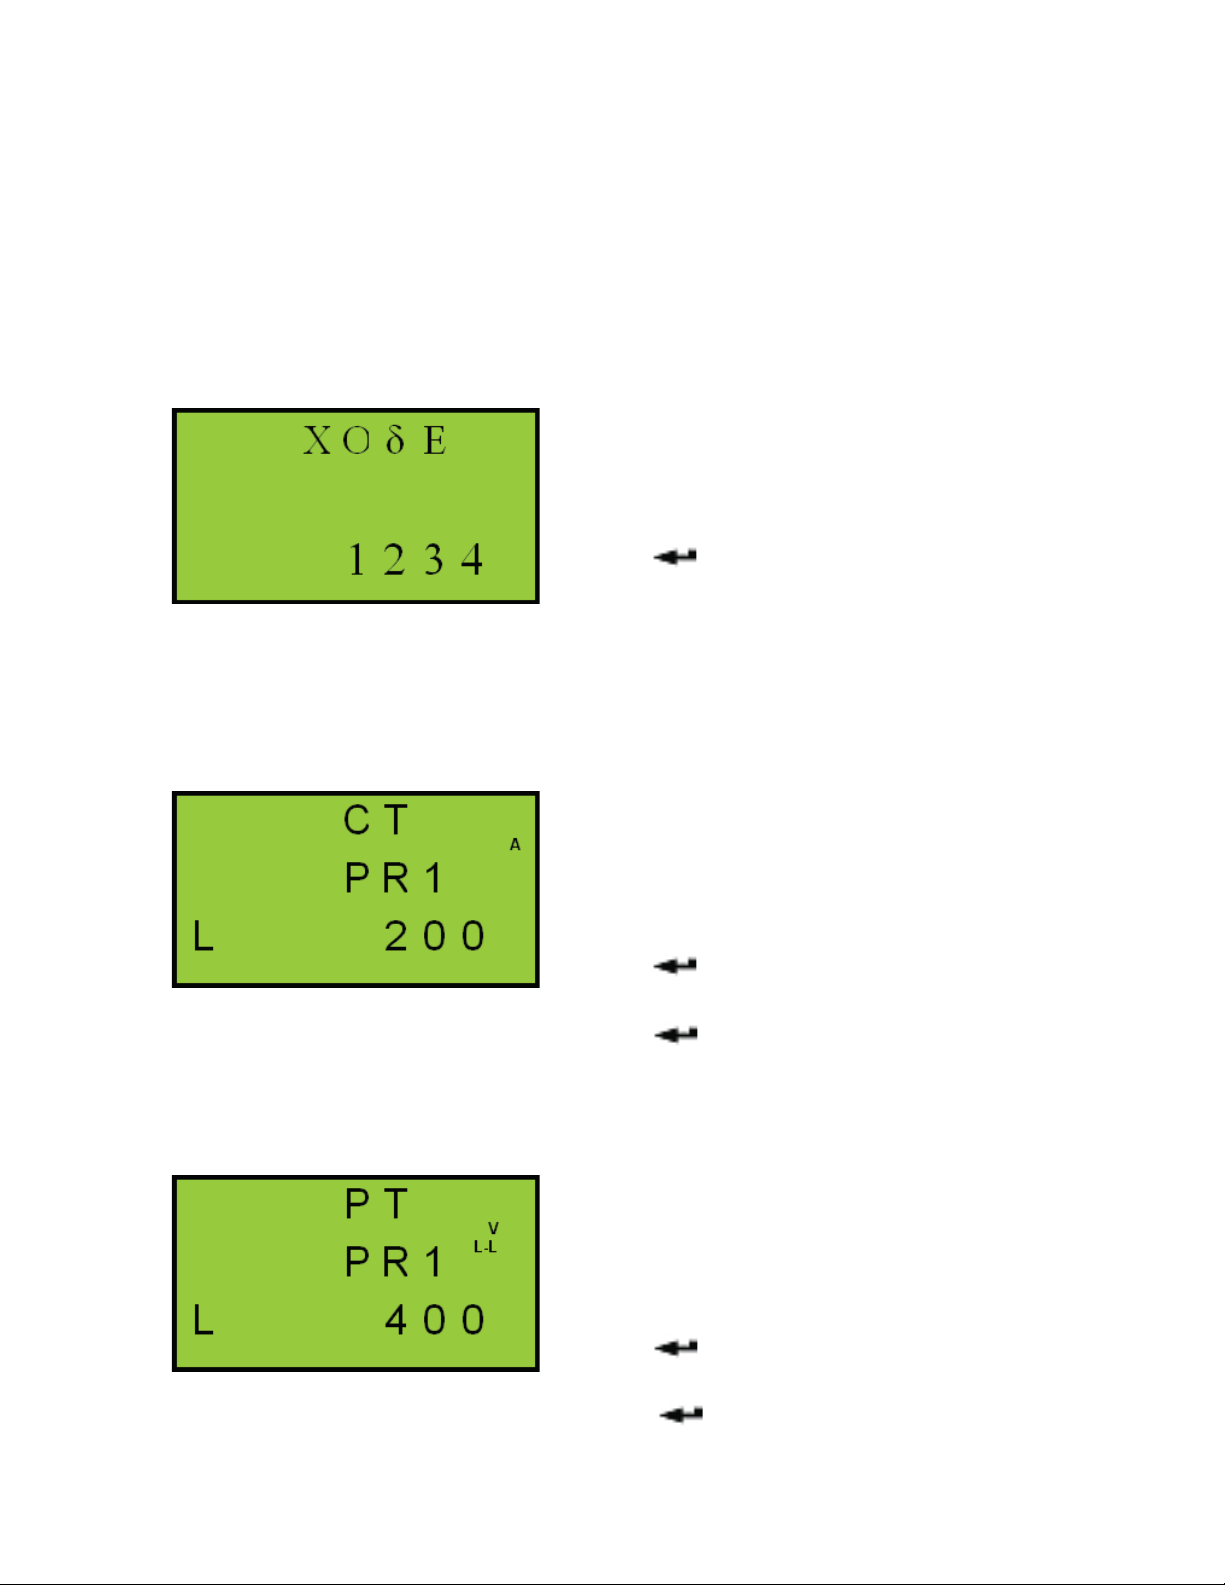
To enter programming mode:
Hold
Press SCROLL button twice to go to the next menu.
4-Digit Security Code
Current Transformer Primary
AMPS and SCROLL together for 5 Seconds.
This page is only shown if a security
code greater than 0 is set via serial
communication.
Press S or T to select each digit
(least signifi cant fi rst)
Press to move to the next most
signifi cant digit.
A correct 4 digit security code is
required to access other programming
menu pages.
Press S or T to select from the
standard list of CT primaries while / is
displayed. (List Mode)
Potential Transformer Primary
Press S or T to increase or decrease
the value by 10 while F is displayed.
(Fine adjust)
Press and S together to toggle
between L and F.
Press to accept the set value. CT
values range from 5A 25000A
Press S or T to select from the
standard list of PT primaries while F is
displayed. (List Mode)
Press S or T to increase or decrease
the value by 10 while F is displayed.
(Fine adjust)
Press and S together to toggle
between L and F.
Press to accept the set value. PT
values range from 10V to 440kV.
26
Page 27
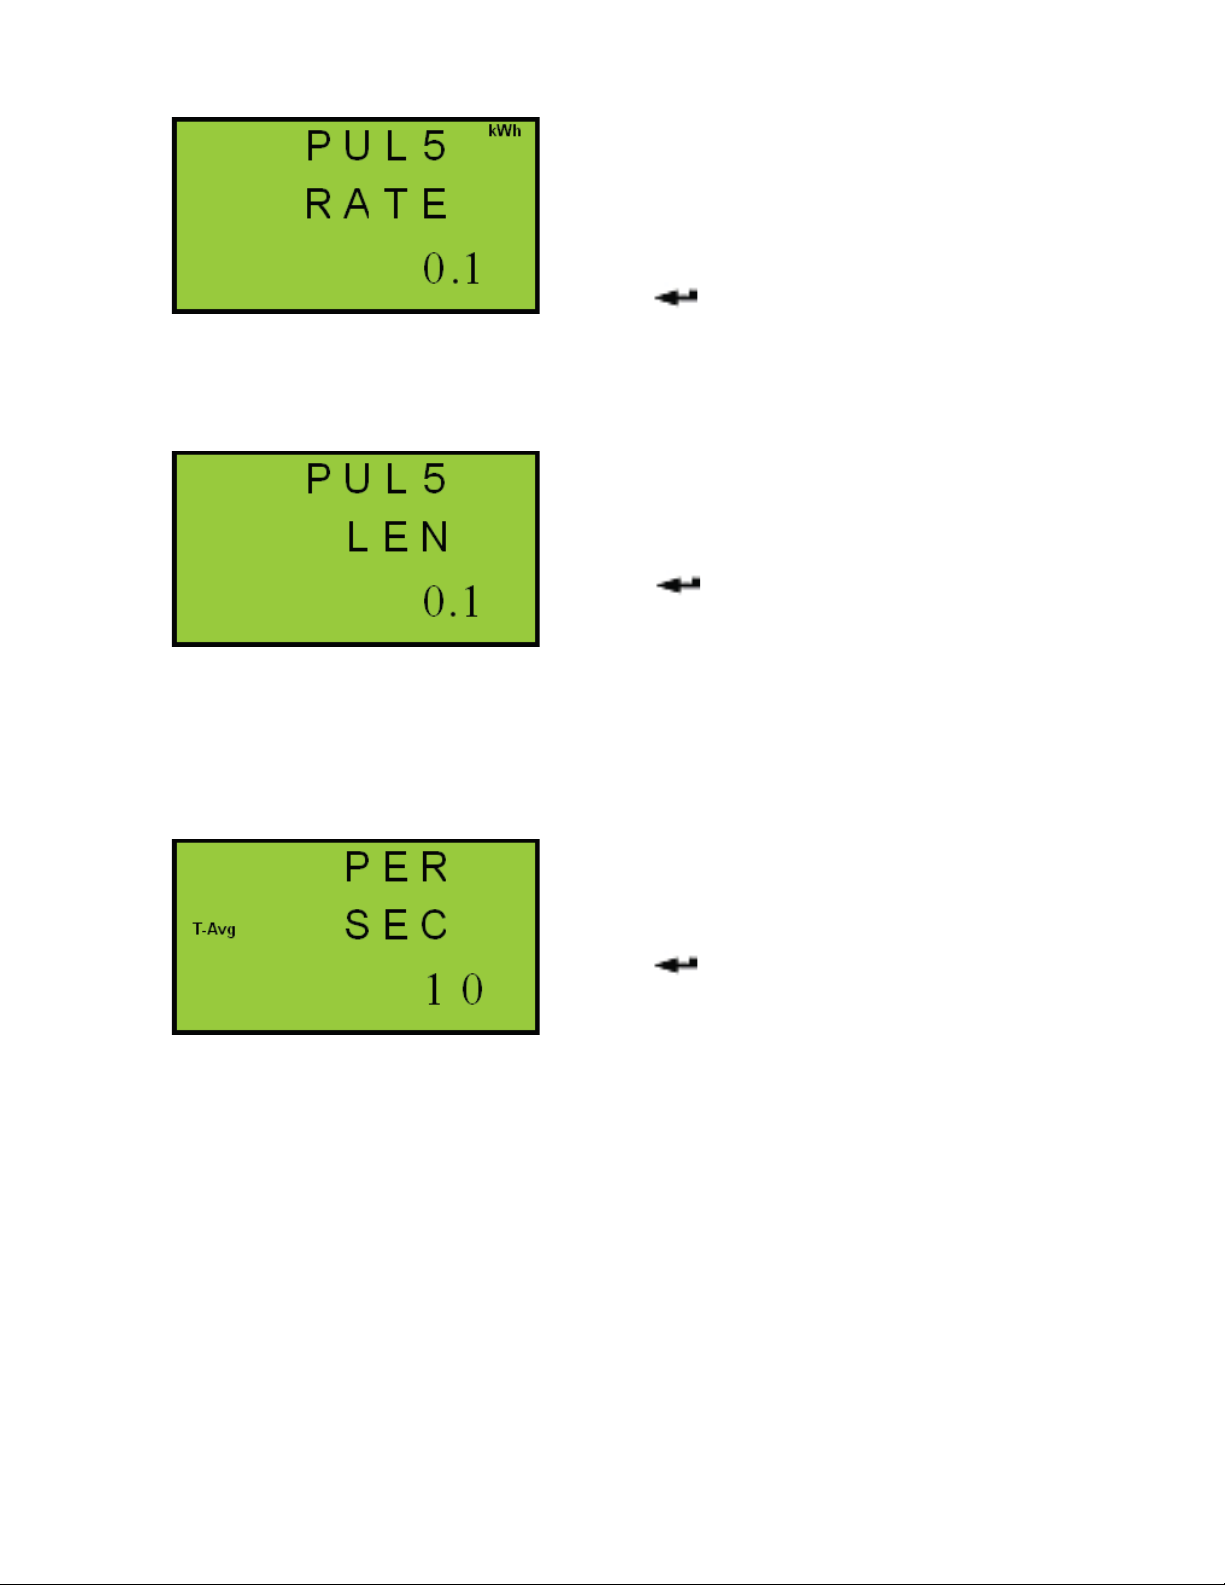
Pulse Rate
This sets the amount of energy (kWh)
required to trigger each Pulse 1 output.
Pulse 2 is set at the same rate but linked
to a different register (eg kvarh).
Press S or T to select the next/
previous Pulse Rate from a standard list.
Press to accept the set value.
Pulse Length
Current/Voltage Time Ave
Period
(Note 1)
This sets the contact closure time in
seconds for both pulse outputs.
Press S or T to select the next/
previous Pulse Length from a standard
list between 0.1 and 20 seconds.
Press to accept the set value. Pulse
lengths range from 0.1S to 20.0S.
Note: Ensure pulse length <
maximum pulse rate in seconds
This sets the integration period in
seconds used for the sliding time
window average calculation for current
and voltage.
Press S or T to increment or
decrement the value.
Press to accept the set value.
The Time Average period may be set
in the range 10 – 2500S In steps of 10
Seconds.
27
Page 28
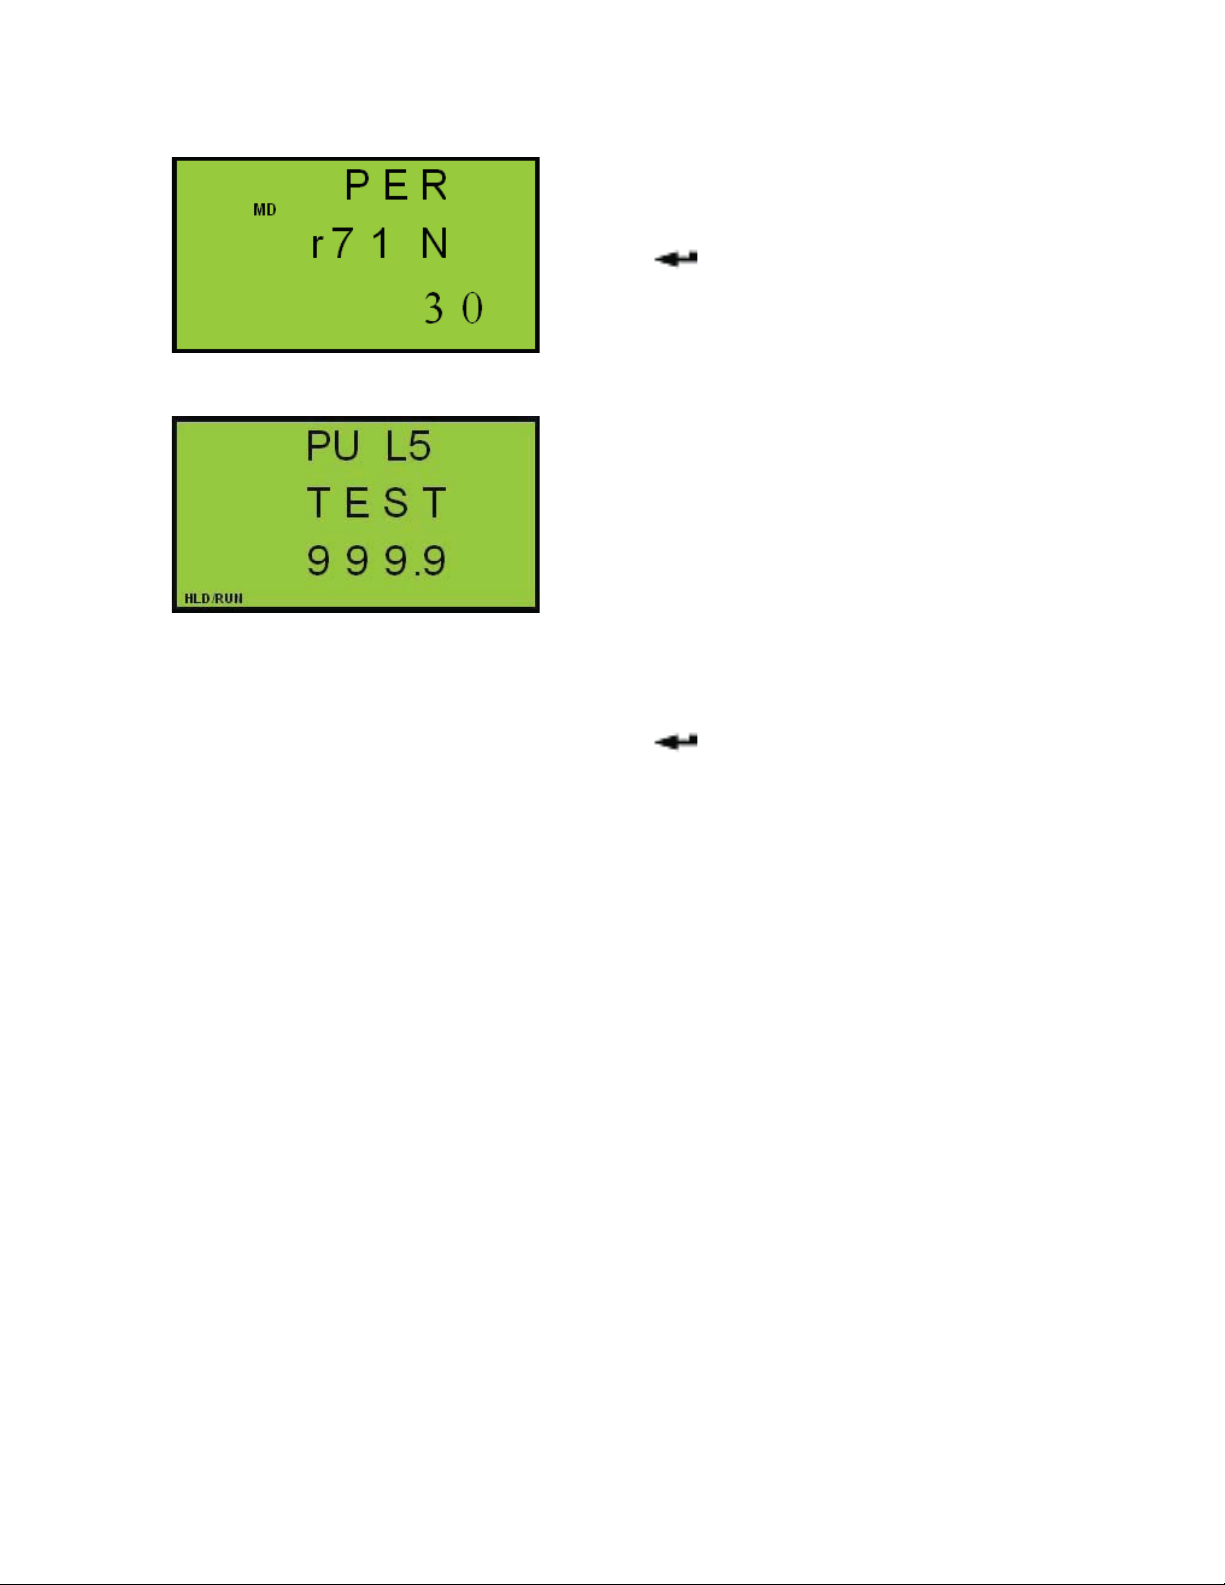
Power MD Integration Period
(Note 1)
This sets the integration period in
minutes used for the sliding time window
MD calculation for power.
Press S or T to increment or
decrement the value.
Press to accept the set value.
The MD Integration period may be set
in the range 1 – 60 minutes in steps of 1
minute.
This sets the instantaneous system kW
level above which the Hours Run timer
will accumulate.
Below this level Hours Run will remain
unchanged.
Press S or T to increment or
decrement the value. The speed of
change will increase as the button is
held.
Press to accept the set value.
Note 1. Some setup screens are only available on meters with
corresponding measurement options.
6. Options
6.1 Internal Modbus Communications
The GIMA may be supplied with RS485 Modbus communications.
This is available as a factory fi tted internal option.
28
Page 29
7. Specifi cation
Inputs
System 3-Phase 3 or 4 Wire Unbalanced Load
Voltage Vb. 230 / 400 Volt. 3-Phase 3 or 4 Wire
Current Ib 5 Amp from external current transformers (CTs)
Measurement Range
Voltage
Current
Frequency Range
Fundamental
Harmonics
Input Loading
Voltage
Current
Overloads
Voltage
Current
Vb. 63 / 110 Volt optional
Vb. 120 / 208 Volt optional
Ib 1 Amp optional
Fully Isolated (2.2kV each phase)
20% to 120%
0.5% to 120%
45 to 65Hz
Up to 30th harmonic
Less than 0.1 VA per phase
Less than 0.1 VA per phase
x2 for 2 seconds maximum (CAT III)
x40 for 0.5 seconds maximum
Auxiliary Supply
Standard 230 Volt 50/60Hz ±15%
Overload CAT III
Options 110 Volt 50/60Hz ±15%
Load 3 VA Maximum
Isolation 2.2kV (1 minute)
Display
Display Type Custom, supertwist, LCD with LED backlight
Data Retention 10 years minimum
Stores energy registers, user settings, peaks and Hours Run
Display Format
Display Update
Digital (Pulse) Outputs
Function 1 pulse / energy unit (Output #1=N Wh, Output #2=N varh)
Scaling Programmable
2 Rows x 4 Digits, 1 Row x 8 Digits + Legends
1 second
Pulse Period Programmable 100ms minimum. (2ms Rise, 2ms Fall)
Type N/O Volt free contact. Optically isolated BiFET
Contacts 100mA AC/DC max, 100V AC/DC max
Isolation 2.2kV (50V #1 to #2)
29
Page 30
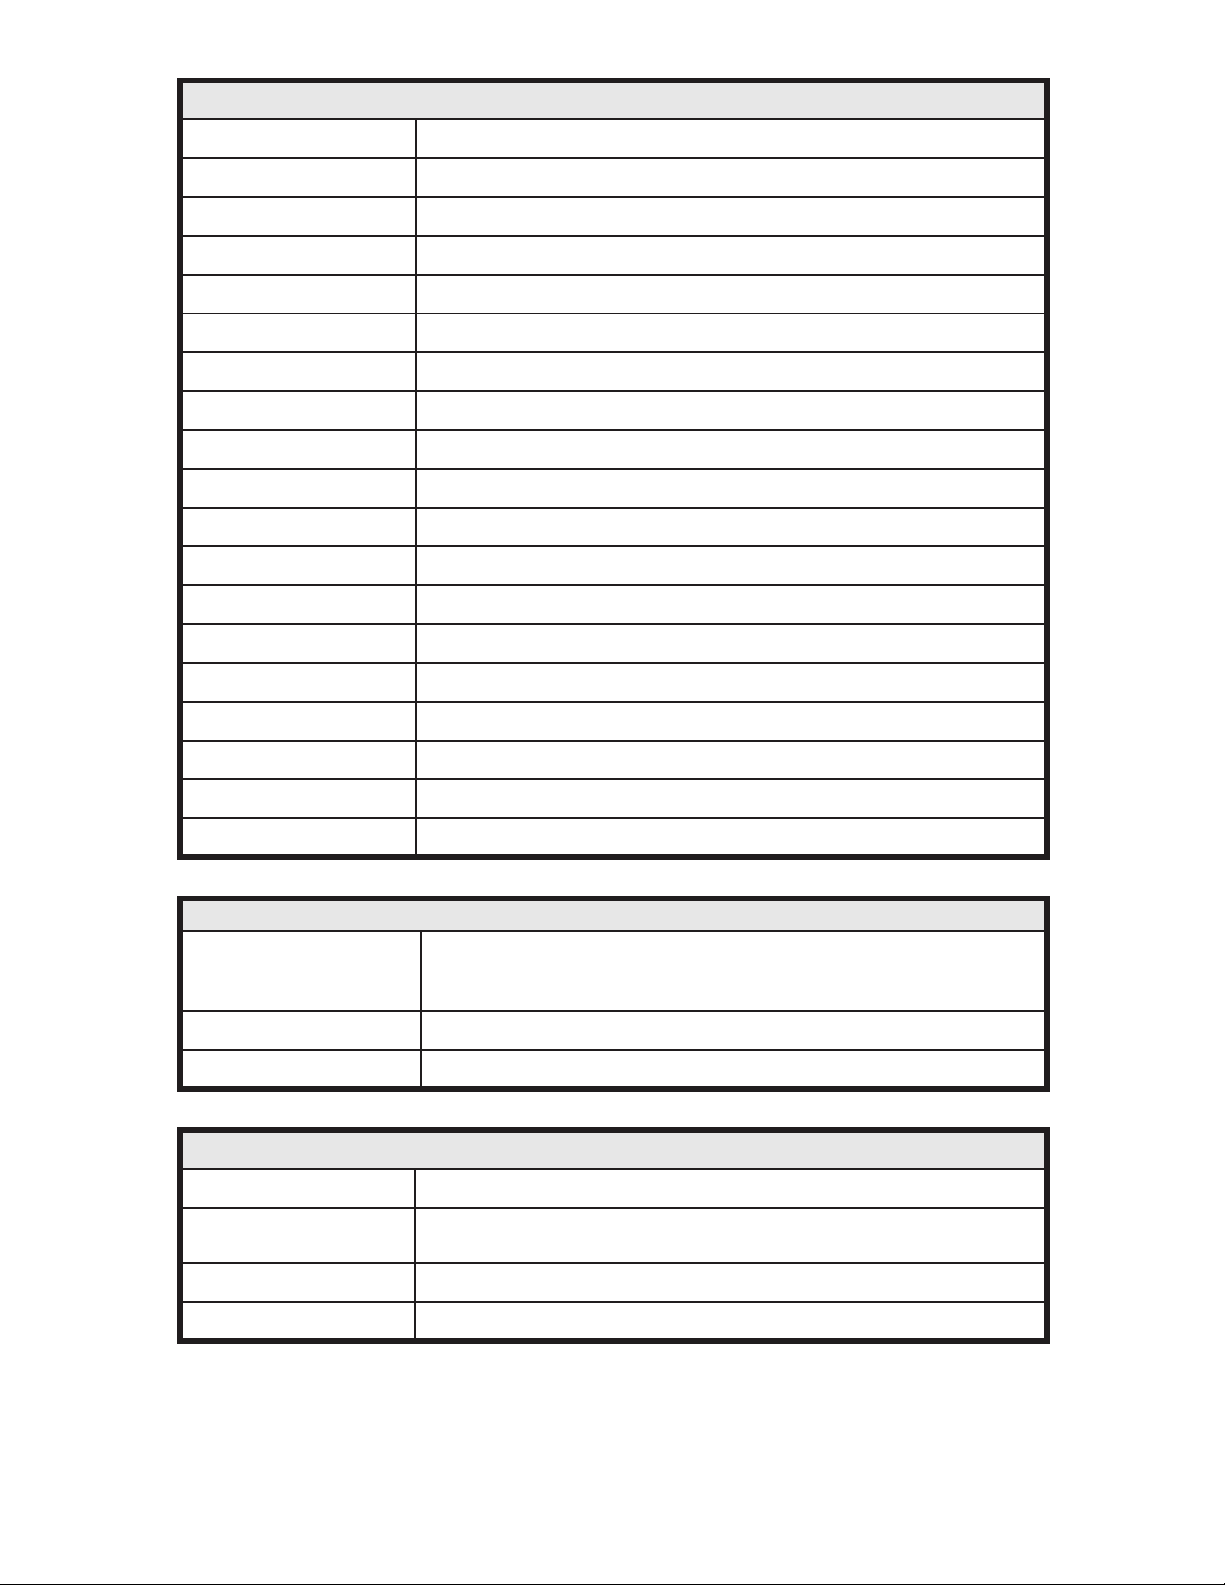
Accuracy
Phase Current 0.2% Ib (1.0% Rdg. 0.05 Ib d Iph d 1.2 Ib) ±1 digit.
Neutral Current 0.6% Ib (2.0% Rdg. 0.05 Ib d In d 1.2 Ib) ±1 digit.
Phase Voltage 0.2% Vb (1.0% Rdg. 0.2 Vb d Vph d 1.2 Vb) ±1 digit.
Line-Line Voltage 0.3% Vb (1.0% Rdg. 0.2 Vb d VLL d 1.2 Vb) ±1 digit.
Phase Watts 0.4% FS (1.0% Rdg. 0.05FS d P d 1.2FS) ±1 digit.
Phase VA 0.6% FS (1.5% Rdg. 0.05FS d Q d 1.2FS) ±1 digit.
Phase var 0.8% FS (2.0% Rdg. 0.05FS d S d 1.2FS) ±1 digit.
Phase PF ± 0.2 Degrees
System Watts 0.6% FS (1.0% Rdg. 0.05FS d P d 1.2FS) ±1 digit.
System VA 1.0% FS (1.5% Rdg. 0.05FS d Q d 1.2FS) ±1 digit.
System var 1.5% FS (2.0% Rdg. 0.05FS d S d 1.2FS) ±1 digit.
System PF ± 0.2 Degrees
Frequency ±0.05Hz. 45Hz d F d 65Hz
Wh Register Class 1.0 EN 61036, EN 62053-21, BS 8431
VAh Register Class 2.0
varh Registers Class 2.0 IEC 1268, EN 60253-23, BS 8431
% THD Amps ± 0.5% THD 0.05 Ib d Iph d 1.2 Ib
% THD Volts ± 0.5% THD 0.2 Vb d Vph d 1.2 Vb
General
Environment IP54
Mechanical
Timebase Better than 100ppm
Temperature
Operating
Storage
-10 deg C to +65 deg C
-25 deg C to +70 deg C
Humidity <75% non-condensing
Enclosure DIN 96mm x 96mm Mablex ULV94-V-O
Dimensions 96mm x 96mm x 80mm (72mm behind panel)
130mm behind panel with options unit fi tted
Weight Approx. 400g
Terminals Rising Cage. 4.0mm
2
cable max
30
 Loading...