

Silicon Control VME850 User Manual
VME850 Bus Analyzer
U s e r ’s M a n u a l
Silicon Control
1020 Milwaukee Ave. Suite 305
Deerfield, IL 60015
January 2008
Revision 3.6

VME850 Users Manual Copyrights
Silicon Control does not warrant the operation of the program will be uninterrupted or error free. In no
event, will Silicon Control be liable for any damages including loss of data, lost profits, or cost of other
incidental, consequential, or indirect damages arising from the use of this program or the accompanying
documentation.
This Manual
C SILICON CONTROL INC.
ALL RIGHTS RESERVED.
No portion of this document may be copied without the written consent of Silicon Control, Inc. This
program and documentation are subject to the copyright protection laws. The information in this
document is subject to change without notice.
2

VME850 Users Manual License Agreement
Silicon Control Inc.
Software License Agreement
AnalyzeIt! Windows Graphical User Interfac e Program
for Silicon Control VME850 System Analyzer
Please read and be aware of the items listed in the following agreement. If you do not approve of the agreement, please return the
complete package to the point of purchase for a complete refund.
1. USAGE RIGHTS
a. Your rights with respect to the Program are non-exclusive.
b. The Program can only be used by one user, on one computer at a time.
c. The Program can be transferred to another computer as long as the requirements of item (b.) are satisfied.
d. The Program and its documentation must not be distributed to others.
e. Do not alter or modify the Program without prior consent of Silicon Control Inc.
2. BACKUP COPIES
a. You may make as many backup copies of the Program as you like.
b. The Silicon Control Inc. Software copyright notice must be included on each backup copy.
3. COPYRIGHTS
a. The Program is copyrighted.
b. The Program documentation is copyrighted.
c. You may only copy the Program and program documentation for backup or to load the Program into your computer as part of
program execution.
4. TERM OF LICENSE
a. The Software License Agreement is effective until terminated.
b. Terminate the Software License Agreement by destroying the Program, the documentation, and all backup copies.
5. LIMITED WARRANTY
a. This Program is provided without any warran ty of any kind.
b. You bear the risk as to performance and suitability of the Program.
c. Silicon Control Inc. does not warrant or guarantee the correctness, accuracy, completeness, or reliability of the Program.
d. Silicon Control Inc. warrants the diskettes on which the Program is provided and any lock device provided to be free from
manufacturers defects under normal use for a period of 90 days from the date of purchase.
e. If the diskettes or lock device fail due to neglect, accident, or abuse, Silicon Control Inc. shall not be liable to replace the
diskettes or lock device under this limit e d warrant y .
f. This limited warranty gives you specific legal rights. You may have additional rights depending on the state and/or country
in which you live.
g. Neither Silicon Control Inc. nor anyone involved in the development, manufacturing, or distribution of the Program or lock
device shall be liable for any damages from the use, results of use, or inability to use the Program or lock device, even if
Silicon Control Inc. has been notified of the probability of such damages or claims. Some states (countries) do not allow
liability limitations for consequential or incidental damages or claims. This item may not be applicable.
6. LAWS
a. This Software License Agreement shall be governed by the laws of the State of Illinois, United States of America.
7. ACCEPTANCE OF AGREEMENT
a. You acknowledge that you have read, understand, and agree to abide by this Software License Agreement.
b. You agree that this Software License Agreement is the complete agreement between Silicon Control Inc. and you.
c. You agree that this Software License Agreement supersedes any and all prior agreements, written or verbal, between Silicon
Control Inc. and you.
3

VME850 Users Manual Table of Contents
TABLE OF CONTENTS
CHAPTER 1. INTRODUCTION
1.1 OVERVIEW
1.2 QUICK START
CHAPTER 2. INSTALLATION
2.1. HARDWARE
2.2. SOFTWARE
CHAPTER 3. CAPTURING BUS ACTIVITY
3.1 STATE DISPLAY
3.2 WAVEFORM DISPLAY
3.3 SIGNAL NAMES
3.4 SIGNAL PROPERTIES
3.5 STATUS BAR
3.6 SETUPS
3.7 TIME MARKERS
3.8 SEARCHING AND JUMPING
3.9 POWER ZOOM
3.10 SAVING AND LOADING CAPTURED DATA
3.11 PRINTING
3.12 CAPTURING 2eVME AND 2eSST
CHAPTER 4. PERFORMANCE ANALYSIS
4.1 PERFORMANCE DISPLAY
4.2 SETUP
4.3 UTILIZATION
4.4 TRANSFER RATE
4.5 LATENCY
4.6 BURST DISTRIBUTION
4.7 STATISTICS
4.8 SAVING AND LOADING DATA
CHAPTER 5. MASTER
5.1 DATA DISPLAY
5.2 ADDRESS
5.3 DATA
5.4 COMMANDS
5.5 SAVING AND LOADING DATA
5.6 OPTIONS
4

VME850 Users Manual Table of Contents
CHAPTER 6. STIMULUS
6.1 STIMULUS CONDITIONS
6.2 STIMULUS CONTROL
6.3 SAVING AND LOADING STIMULUS
6.4 OPTIONS
CHAPTER 7. CONFIGURATION SCANNING
7.1 CONFIGURATION HEADER
7.2 CONFIGURATION ANALYSIS
7.3 FINDING DEVICES
7.4 SAVING AND LOADING CONFIGURATION INFORMATION
7.5 READING AND WRITING CONFIGURATION
7.6 OPTIONS
CHAPTER 8. TARGET
8.1 DATA DISPLAY
8.2 ADDRESS
8.3 DATA
8.4 COMMAND
8.5 SAVING AND LOADING DATA
8.6 OPTIONS
CHAPTER 9. PROTOCOL CHECKING
9.1 ANOMALY CHECKLIST
9.2 TEST RESULTS
9.3 SAVING AND LOADING RESULTS
9.4 TRACE CONTROL
9.5 OPTIONS
CHAPTER 10. BACKPLANE TEST
10.1 SHORT TEST
10.2 DRIVE TEST
CHAPTER 11. UTILITIES
11.1 SETUP
11.2 DOWNLOAD FIRMWARE
11.3 BOARD INFORMATION
11.4 BUS CONFIGURATION
CHAPTER 12. MISCELLANEOUS
12.1 ONLINE HELP
12.2 EXPANSION CONNECTOR
APPENDIX A – ANALYZER SPECIFICATIONS
APPENDIX B – API INTERFACE DOCUMENT
5
VME850 Users Manual Introduction
r
CHAPTER 1
INTRODUCTION
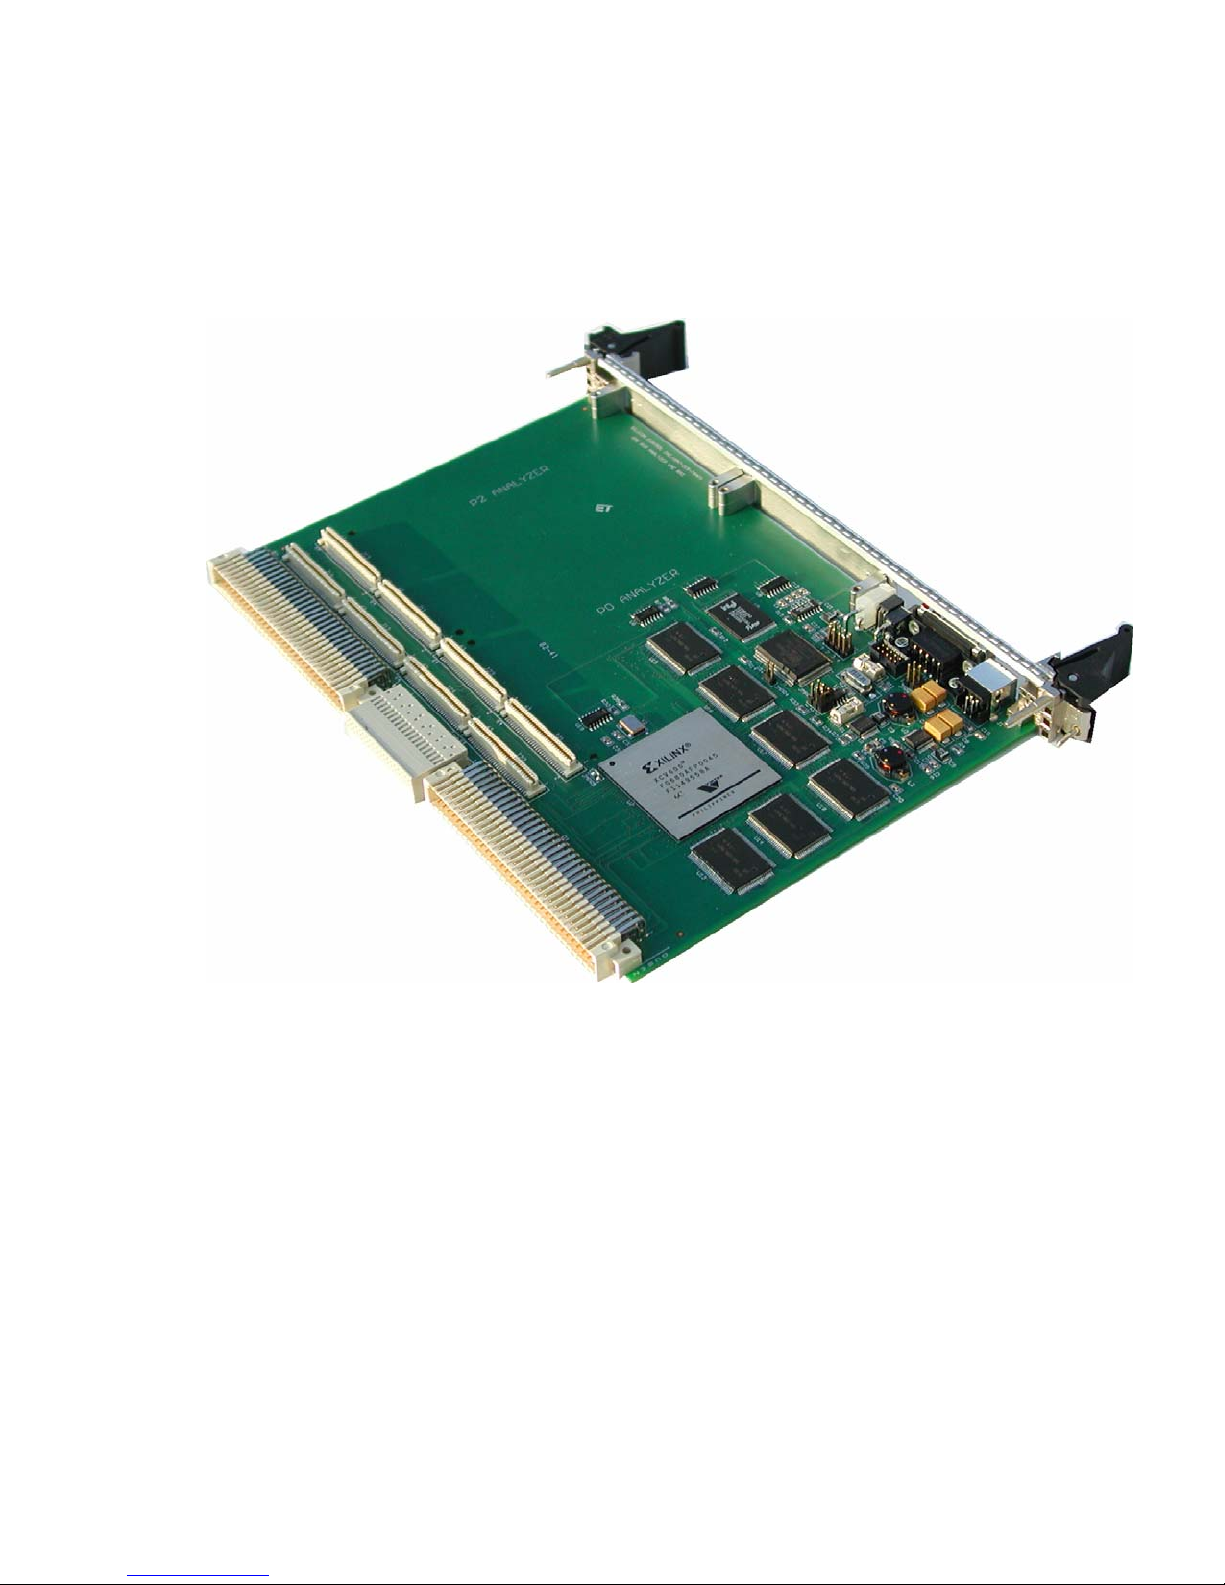
Silicon Control Inc. introduces the ultimate analyzer and exerciser for VME systems. The 850 family
of analyzers represent our 4th generation VME analyzer combining high performance hardware with
a sophisticated and intuitive software interface. The result is a powerful diagnostic tool for bus
analysis - all on a single plug-in card!
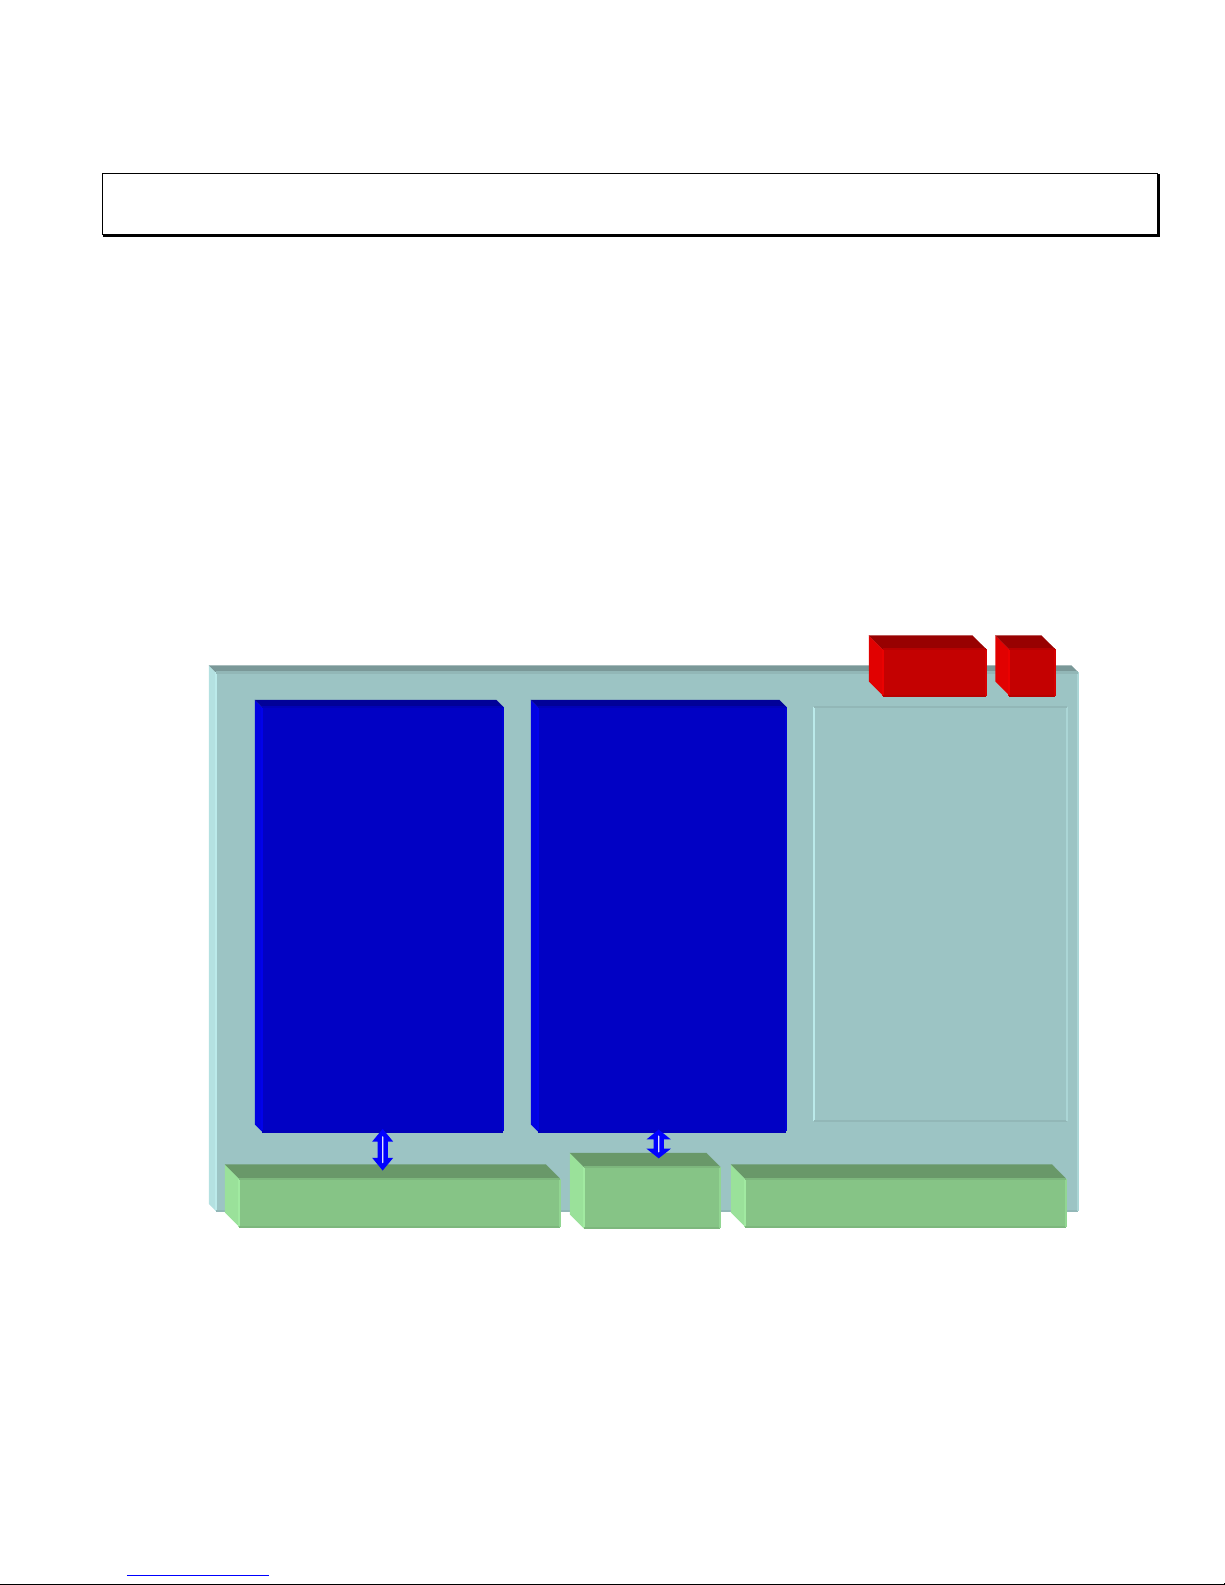
1.1. OVERVIEW
The VME850 analyzes and exercises the VME64x bus. It also has the ability to analyze and exercise
the P2 and P0 user defined signals through optional plug on modules. Communication to the analyzer
is provided by both USB and RS232 connections.
USBRS232
P2 Analyzer
(optional)
P2 Connector P1 Connector
P0 Analyzer
(optional)
P0
Connecto
VME850
VME64x
Bus Analyzer
6

VME850 Users Manual Introduction
1.1.1 Features
The VME850 analyzer provides a multitude of functions to help you analyze your system.
VME64 / VME64x Analyzer/Exerciser
• Single 6U VME board
• Supports SCT, BLT, MBLT, 2eVME, 2eSST
protocols
• Optional Analysis/Stimulus of User Defined
P2 and P0 signals
• Choice of 96 or 160 pin P1/P2 connectors
Analyze Bus Activity
• State Analysis up to 100 Mhz
• Timing Analysis up to 400 Mhz
• Complex Triggering and Filtering
• Time Stamping
• Performance Analysis of Bus Utilization,
Transfer Rates, Statistics
Exercise Bus Activity
• Master Transfers
• Stimulus Generation
• Fault Injection and Timing Modification
• CR/CSR Scan and Decode
• Backplane Short Test
Slave Memory
• Windowed VME bus memory
Protocol and Timing Violation Checker
• Detects over 100 timing and protocol violations
• Displayed and Used as Trigger in State/Timing
Analysis
P2 Analysis of User Defined Signals
• 160 pin connector - row a,c,d
• Optional plug-in module
P0 Analysis of User Defined Signals
• 95 pin connector – row a,b,c,d,e
• Optional plug-in module
Communication
• USB
• RS232
Other Features
• External Power Connection
• External Trigger Inputs and Output
• Extensive Self Test
• Front Panel Reset and LED Indicators
Software User Interface Packages
• AnalyzeIt! PC GUI Software
• API Library provides User Program Control
7

VME850 Users Manual Introduction
1.3 QUICK START
This chapter provides a quick guide to installing and operating the analyzer with the AnalyzeIt!
Windows software.
1.2.1. Hardware Installation
Insert the analyzer into an empty bus slot. Connect either the included RS232 or USB cable between the
analyzer and a PC. If you are using the USB interface, the message “New Hardware Found” may appear
after you connect the USB cable and apply power to the analyzer. If this message does not appear go to
the Control Panel and Add New Hardware to install the drivers. The drivers are included on the CD
ROM.
1.2.2. Software Installation
Install the AnalyzeIt! Software using the included CD or download the software from the Silicon
Control web site at www.silicon-control.com.
1.2.3 Main Menu
Run the AnalyzeIt! Software.When using the RS232 port select Utilities then Setup to enter the COM
port and baud rate. If the software cannot communicate with the analyzer it will enter a Demo mode.
To start a new function, select File then New or click the function icons on the tool bar.
1.2.4. Capturing Bus Activity
To start capturing and viewing bus activity, select File in the main menu then New, Capture, and State
or click the state display icon. A blank state display appears. To start capturing activity, click the
GO icon
. A control bar indicates the buffer and trigger status and the samples before and after the
trigger. Captured data fills the screen when the trace buffer fills or the STOP icon
is clicked.
8
VME850 Users Manual Introduction
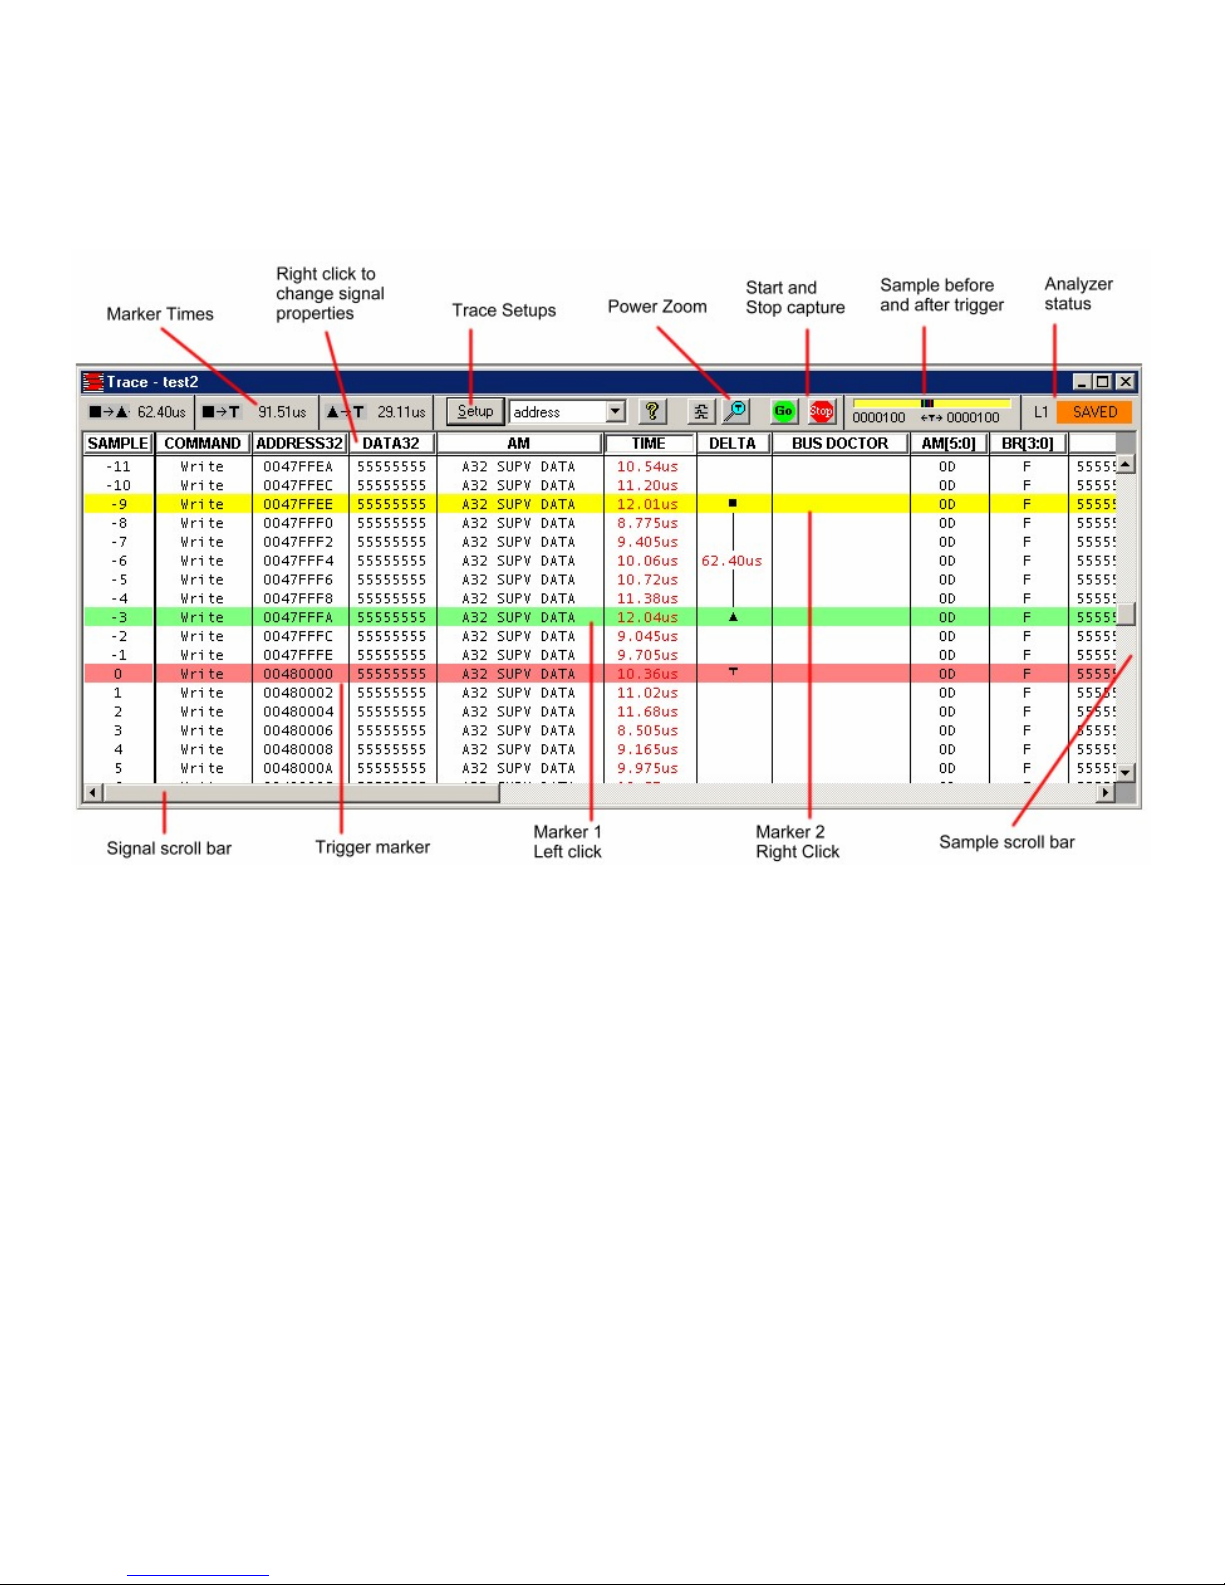
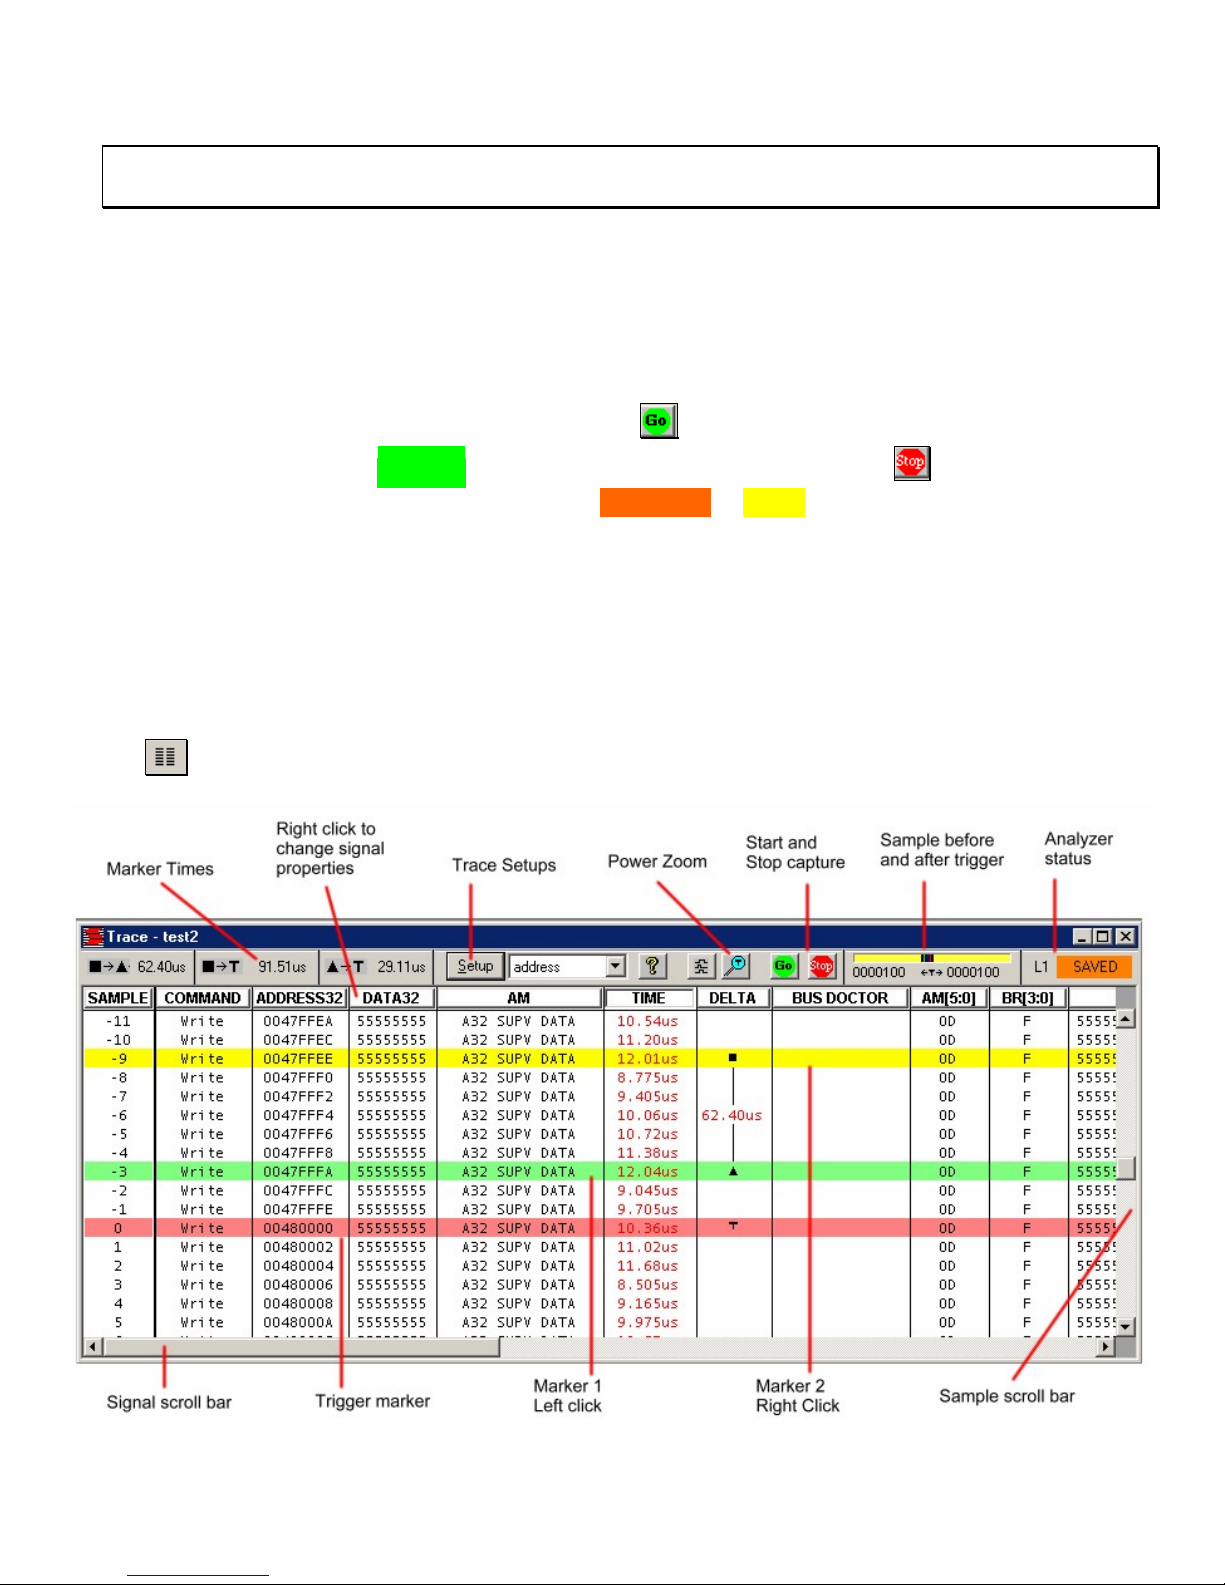
1.2.5 State Display
1.2.6. Viewing Bus Activity
Use the sample scroll bar to view more data and the signal scroll bar to view more signals. The window may
be resized to view more information. Add time markers by clicking directly in the data window. Left click
for one marker, right click for another.
1.2.7. Changing the Display
Signals in the state display can be moved and resized. Click on the signal name and drag it to another
position. Move the cursor over the edge of the signal box and drag the edge to resize it.
Right clicking on a signal name changes its properties. You can change the color and base, insert and delete
signals, expand and collapse grouped signals and change the range of signals in a group.
9
VME850 Users Manual Introduction
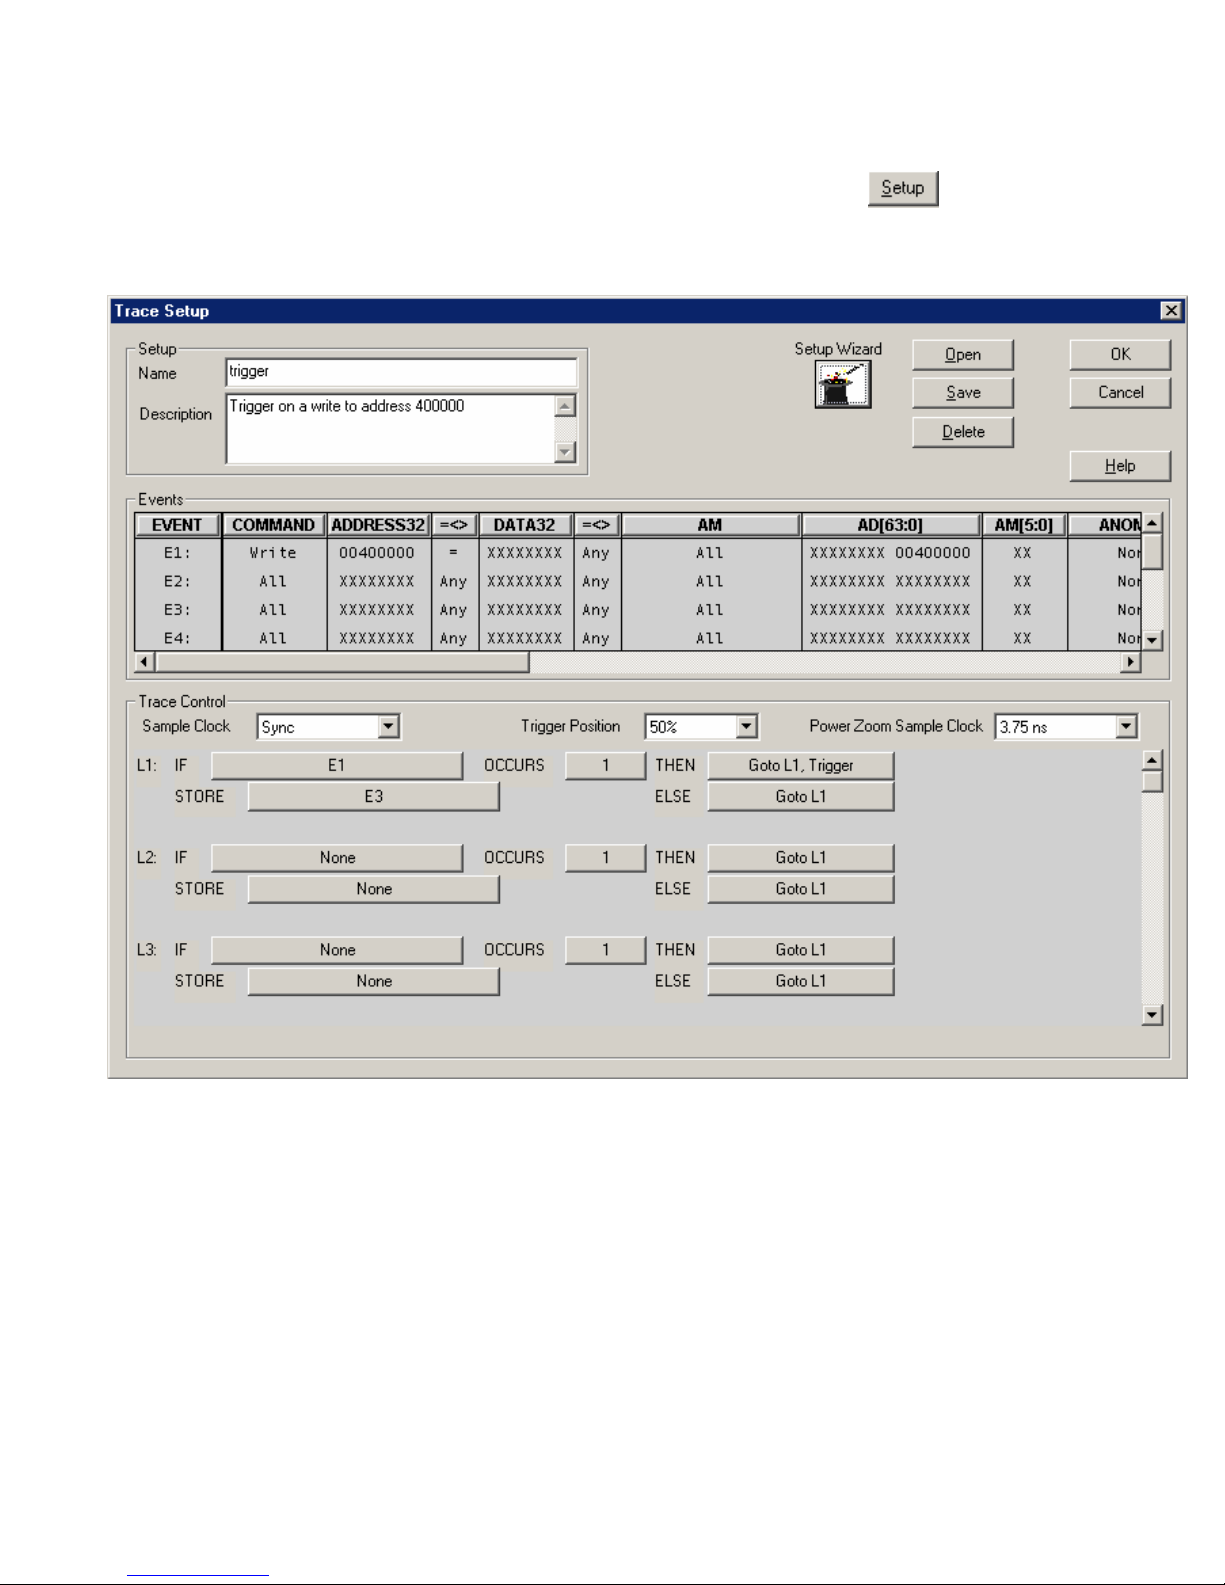
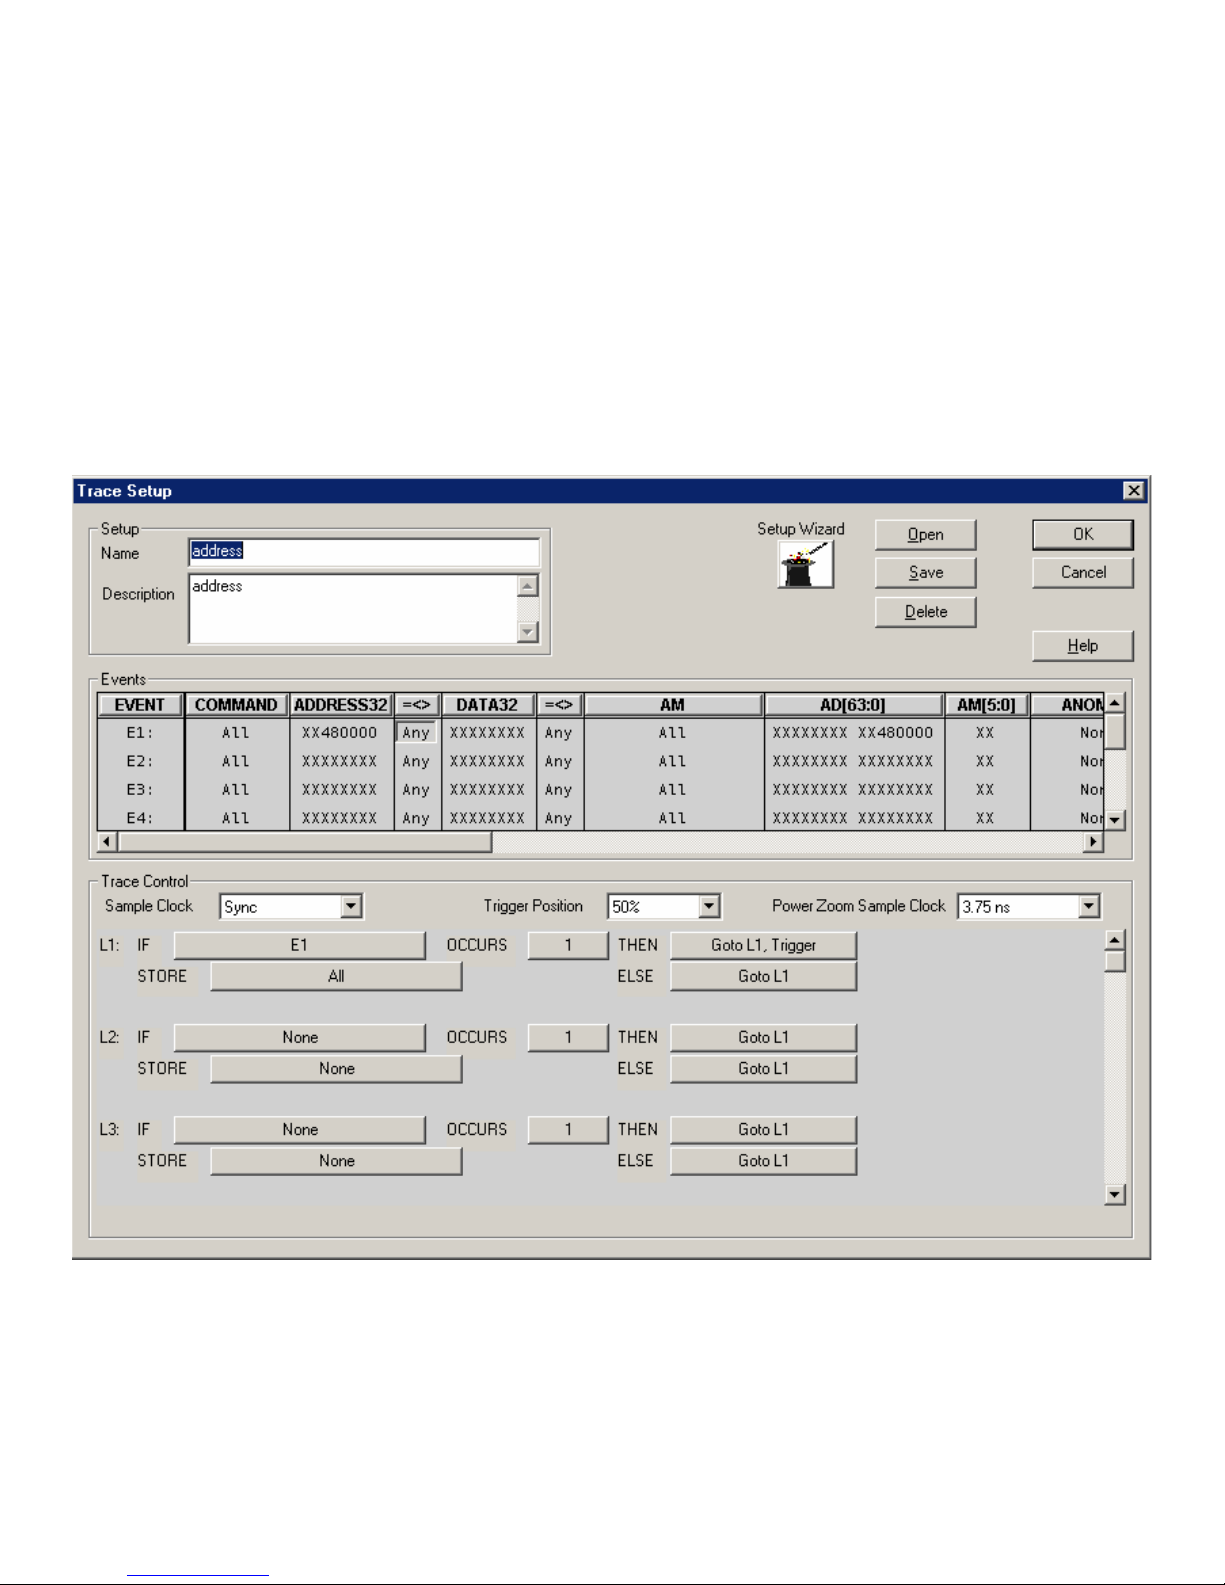
1.2.8. Trace Setup
To control when and what bus activity to capture, click on the setup button . The setup window
is divided into Event and Trace Control sections. Events specify what to look for on the bus and are used
in the trace controls.
Events
To specify an event condition, click on the signal fields in the event section. An “X” (Don’t Care) means
that the signal will not be used. Some fields such as COMMAND open a dialog box while others toggle
through predefined states each time the field is clicked.
Trace Control
Trace controls specify how the analyzer captures bus activity. This multi-level structure provides a
flexible way to setup simple or complex trace control.
Setups can be named, given a description, saved and used again. The Setup Wizard helps perform
typical setups by asking a series of questions. Setup fields are filled in based on the answers to these
questions.
10
VME850 Users Manual Introduction
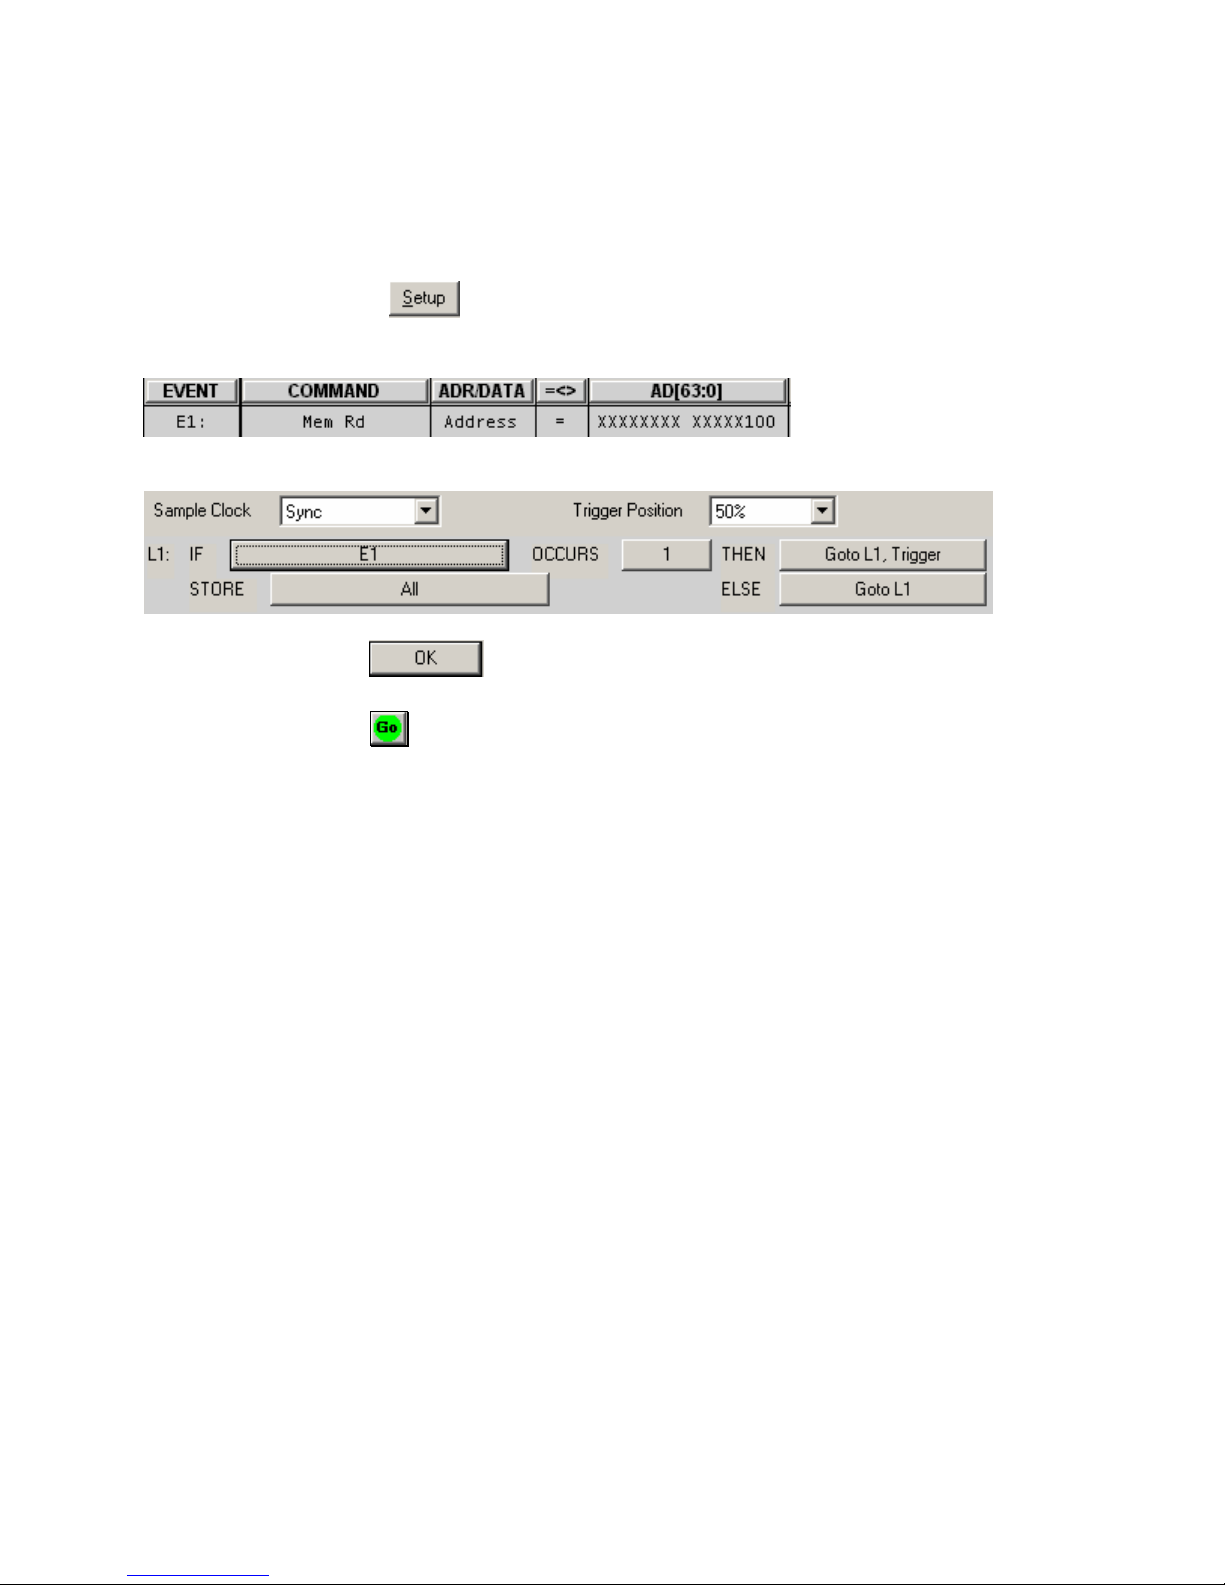
1.2.9 Examples
Example – Trigger on a Memory Read at address 100 hex.
1. Click the Setup button in a state or waveform window.
2. On the event labeled E1 set the fields as shown below:
3. On the trace control labeled L1 set the fields as shown below:
4. Click the OK button to send the setup to the analyzer.
5. Click the GO button in the state or waveform window to start capturing data. Captured data will
be displayed around the trigger sample.
11
VME850 Users Manual Introduction
1.2.7. Other Functions
To create other windows go to File and then New on the main menu or click on the function’s icon on
the main tool bar.
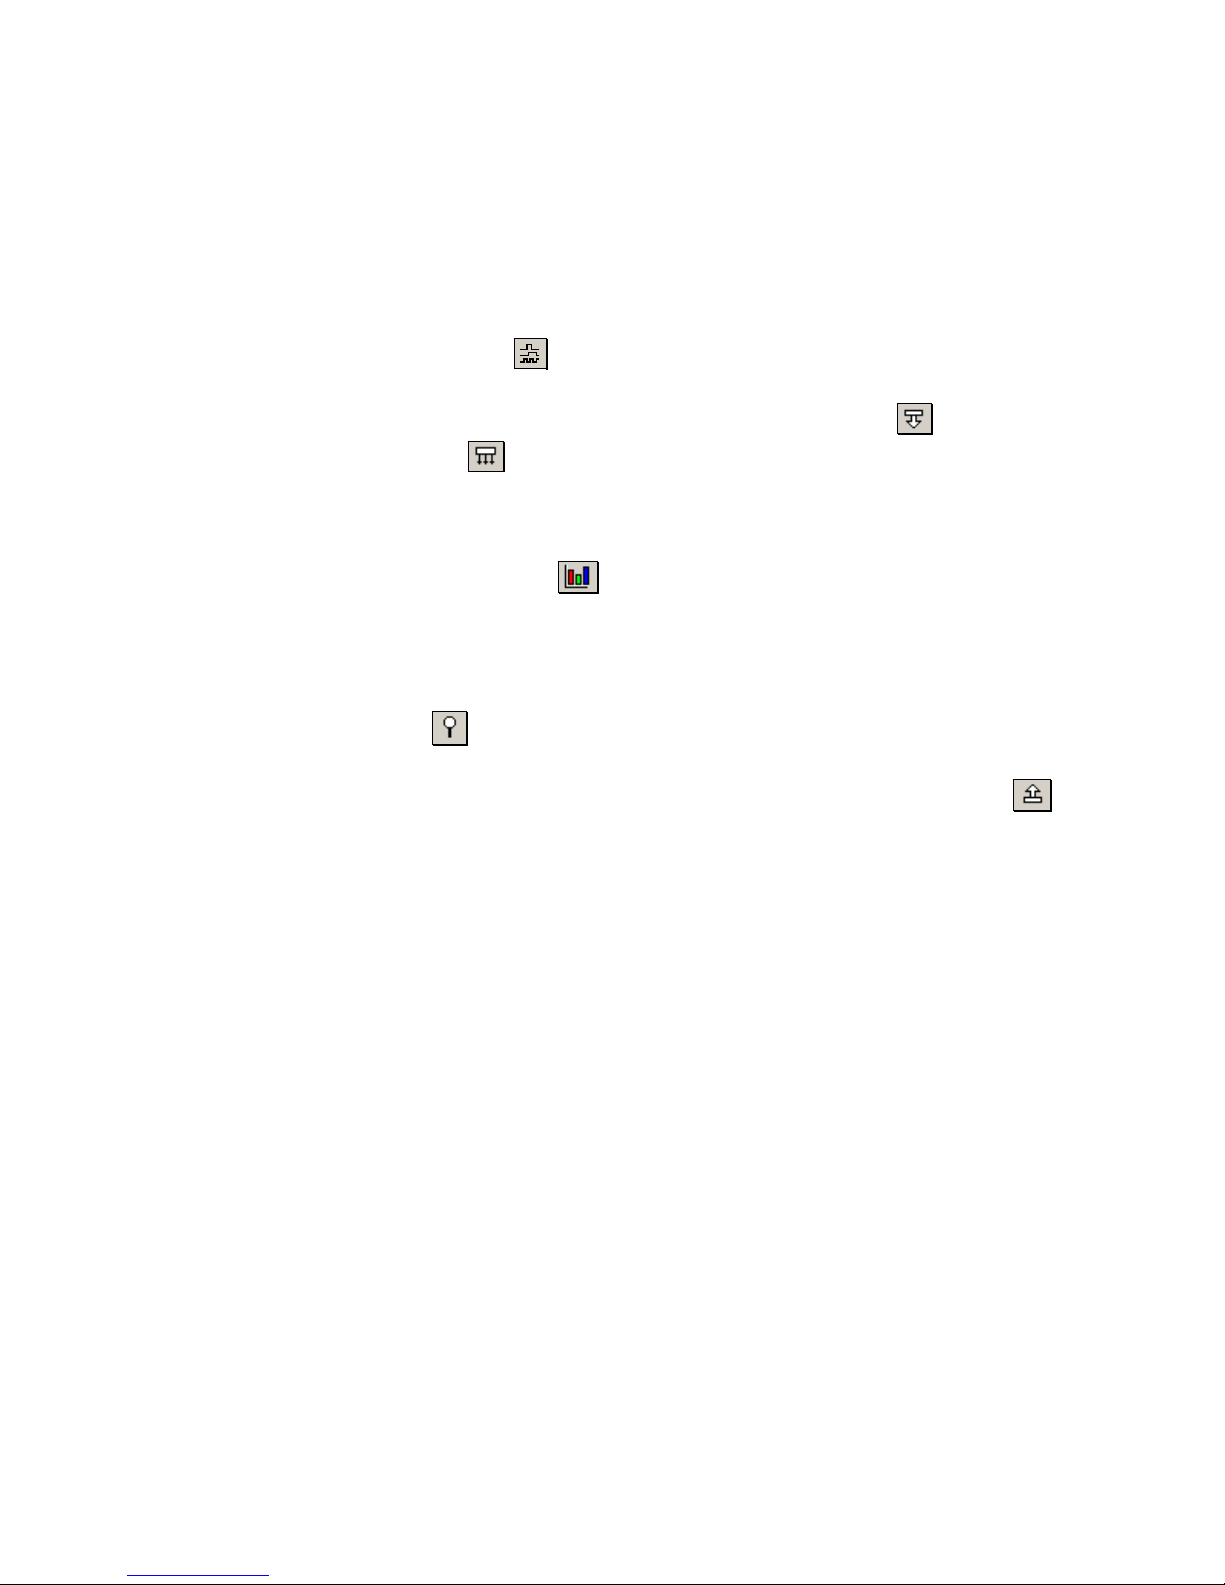
The waveform display represents captured data in a graphical display and has many of the same
features as the state display. Click on the tool bar to open a waveform window.
Use the Master and Stimulus functions to transfer data onto the bus. Click on the tool bar to
open a master window. Click on the tool bar to open a stimulus window.
Performance analysis includes 5 functions for measuring Bus Utilization, Transfer Rate, Latency,
Burst Distribution and Statistics. Click
on the tool bar to open a Bus Utilization window. To
open the other performance windows click File – New – Performance and then the measurement
type.
Anomaly detection checks for protocol and timing violations and can be used to trigger and qualify
captured trace data. Click on the tool bar to open an Anomaly window.
Target memory provides a windowed bus memory with programmed responses. Click on the
tool bar to open a target window.
Configuration scanning identifies and analyzes devices in a system. To open a configuration
scanning window click File – New – Exerciser - Configuration.
Each of these functions is described in detail in the following chapters.
12

VME850 Users Manual Installation
CHAPTER 2
INSTALLATION
2.1 HARDWARE INSTALLATION
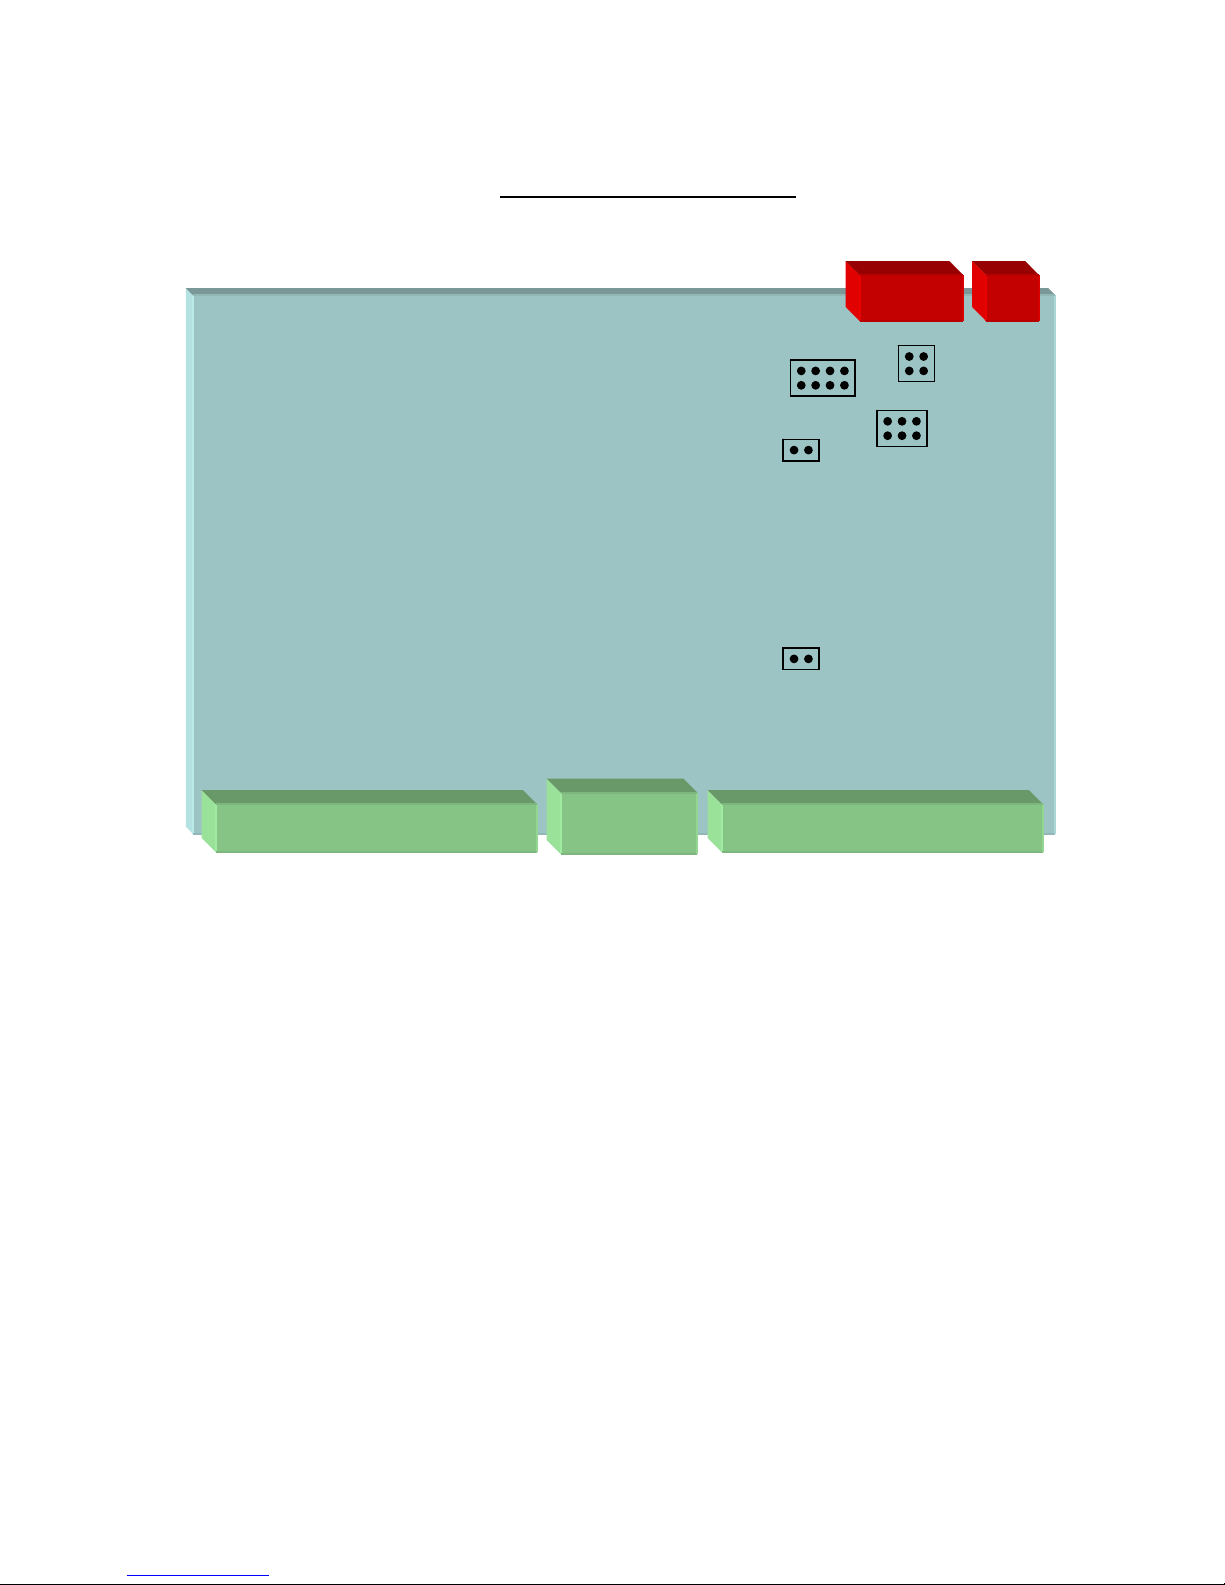
2.1.1 Jumpers
Jumpers on the analyzer provide configuration options for setting interfaces, hardware handshaking, reset
control, controller functions and driving the system clock. These jumpers are described below. Figure 2.1
shows the jumper locations.
Jumper 1 – Reset Jumper
Position Description
1 User Controlled Backplane Reset –Generates a system reset through the AnalyzeIt!
Software.
2 Power Up and Pushbutton System Reset – Generates a system reset at power up or
when the pushbutton is pressed.
3 (default) Power Up and Pushbutton Analyzer Reset – Generates an analyzer reset at power up
or when the pushbutton is pressed.
Jumper 2 – Controller
Position
Description
1 Controller – Insert this jumper when the analyzer is a controller providing the arbitration
functions.
2 Drive System Clock – Insert this jumper to drive the SYSCLOCK signal at 16 Mhz.
3 Master Lock – Insert this jumper to inhibit any feature that would drive a signal on the
VME bus. Master Lock is displayed on the bottom right corner of the main AnalyzeIt
window.
Jumper 3 – RS232 Hardware Handshaking
Position
Description
1 RTS control
2 CTS control
Jumper 4 – Download Firmware
Position Description
1 Insert before downloading firmware. Remove for normal operation.
Jumper 5 – Internal Clock
Installing this jumper enables the on board analyzer clock generator to drive the internal analyzer logic.
This jumper should always be installed.
If the P2 or P0 analyzer optional module is installed this clock also drives and synchronizes these
modules.
13
VME850 Users Manual Installation
r
Figure 2.1 - Jumper Locations
USBRS232
2
JMPR3
JMPR2
1 2 3 4
JMPR4
1
JMPR1
JMPR5
P2 Connector P1 Connector
P0
Connecto
14

VME850 Users Manual Installation
2.1.2. Front Panel
USB A standard Type B connector operating at 12Mb/sec.
RS232 A female DB9 connector operating at up to 57.6K baud with RTS and CTS
hardware handshaking.
Trigger IN/OUT A 10 pin shrouded male IDC connector on 2mm centers with a keyed slot. The
signals include 1 ground, 1 trigger output and 8 trigger inputs.
Pushbutton Reset Resets the analyzer / system based on Jumper 1 settings.
LEDs The green LED illuminates after a successful power up and self-test diagnostics.
The red LED illuminates for approximately 1 second at power up and indicates
that hardware is being configured. If the red LED stays on an error occurred
during configuration.
External Power A 2-pin power connector provides external power to the analyzer. The power
supply voltage range must be between 4.5V and 5.5V and capable of supplying a
minimum current of 2.8 Amps.
Important: When supplying external power the F1 fuse must be removed and the
F2 fuse installed. Carefully remove a fuse from the fuse holder with a pliers or
similar device.
15

VME850 Users Manual Installation
2.1.3. Cables
USB – An 10 foot USB cable is included with a Type A connector on the PC side and a Type B
connector on the analyzer side.
RS232 – An 10 foot RS232 cable is included with a DB9 female connector on the PC side and a DB9
male connector on the analyzer side.
Trigger – A 10 pin trigger input/output ribbon cable is included with a 10-pin IDC connector on the
analyzer side and individual test clips on the other side. The test clips are color coded as follows:
Signal Color
Ground Black
Trigger Out Yellow
Trigger In
Red
(8)
Power – This cable provides external power to the analyzer and consists of a 2 wire molded power
connector with un-terminated red and black heavy gauge wires. The red wire must be connected to a
voltage source between 4.5V and 5.5V with a minimum current capability of 2.8A. The black wire
connects to ground.
Important: When supplying external power the F1 fuse must be removed and the F2 fuse installed.
Carefully remove a fuse from the fuse holder with a pliers or similar device.
16

VME850 Users Manual Installation
2.2 SOFTWARE INSTALLATION
2.2.1. PC Requirements
The system requirements for a PC running the AnalyzeIt! Software is as follows:
Minimum Recommended
Pentium 3 Processor Pentium 3 Processor at 600Mhz
2GB Hard Drive 5GB Hard Drive
64MB RAM 128K RAM
CD ROM Drive CD ROM Drive
USB or Serial port USB or Serial port
15” Monitor 17” Monitor
Mouse Mouse
2.2.2 Software Installation
2.2.2.1 AnalyzeIt! Software
Install the AnalyzeIt! Software using the included CD or download the software from the Silicon
Control web site at www.silicon-control.com.
After inserting the CD into the drive, browse for the file AnalyzeIt! The file is a self-extracting
executable file. To install the software double click the file. Follow the installation instructions on the
screen. You will have to restart your computer after installation.
2.2.2.2 USB Drivers
If you are using the USB interface, the message “New Hardware Found” may appear after you connect
the USB cable and apply power to the analyzer. If this message does not appear go to the Control Panel
and Add New Hardware to install the drivers. The drivers are included on the CD ROM.
2.2.2.3 Software Updates
The latest up to date software is available on Silicon Control’s web site at www.silicon-control.com
Download the AnalyzeIt! Software into a folder on your computer. The downloaded file is a selfextracting executable file. To install the software double click the file.
.
17
VME850 Users Manual Installation
2.2.3. Initial Setup
Run the software by double clicking the AnalyzeIt! Icon on the desktop or go to Start – Programs –
AnalyzeIt! The analyzer has both RS232 and USB interfaces. You must select which interface before
using the analyzer. The AnalyzeIt software will come up in a demo mode if it cannot communicate with
the analyzer. You can then set the interface you are using and restart the software. The new interface
setting will be used the next time you start the software.
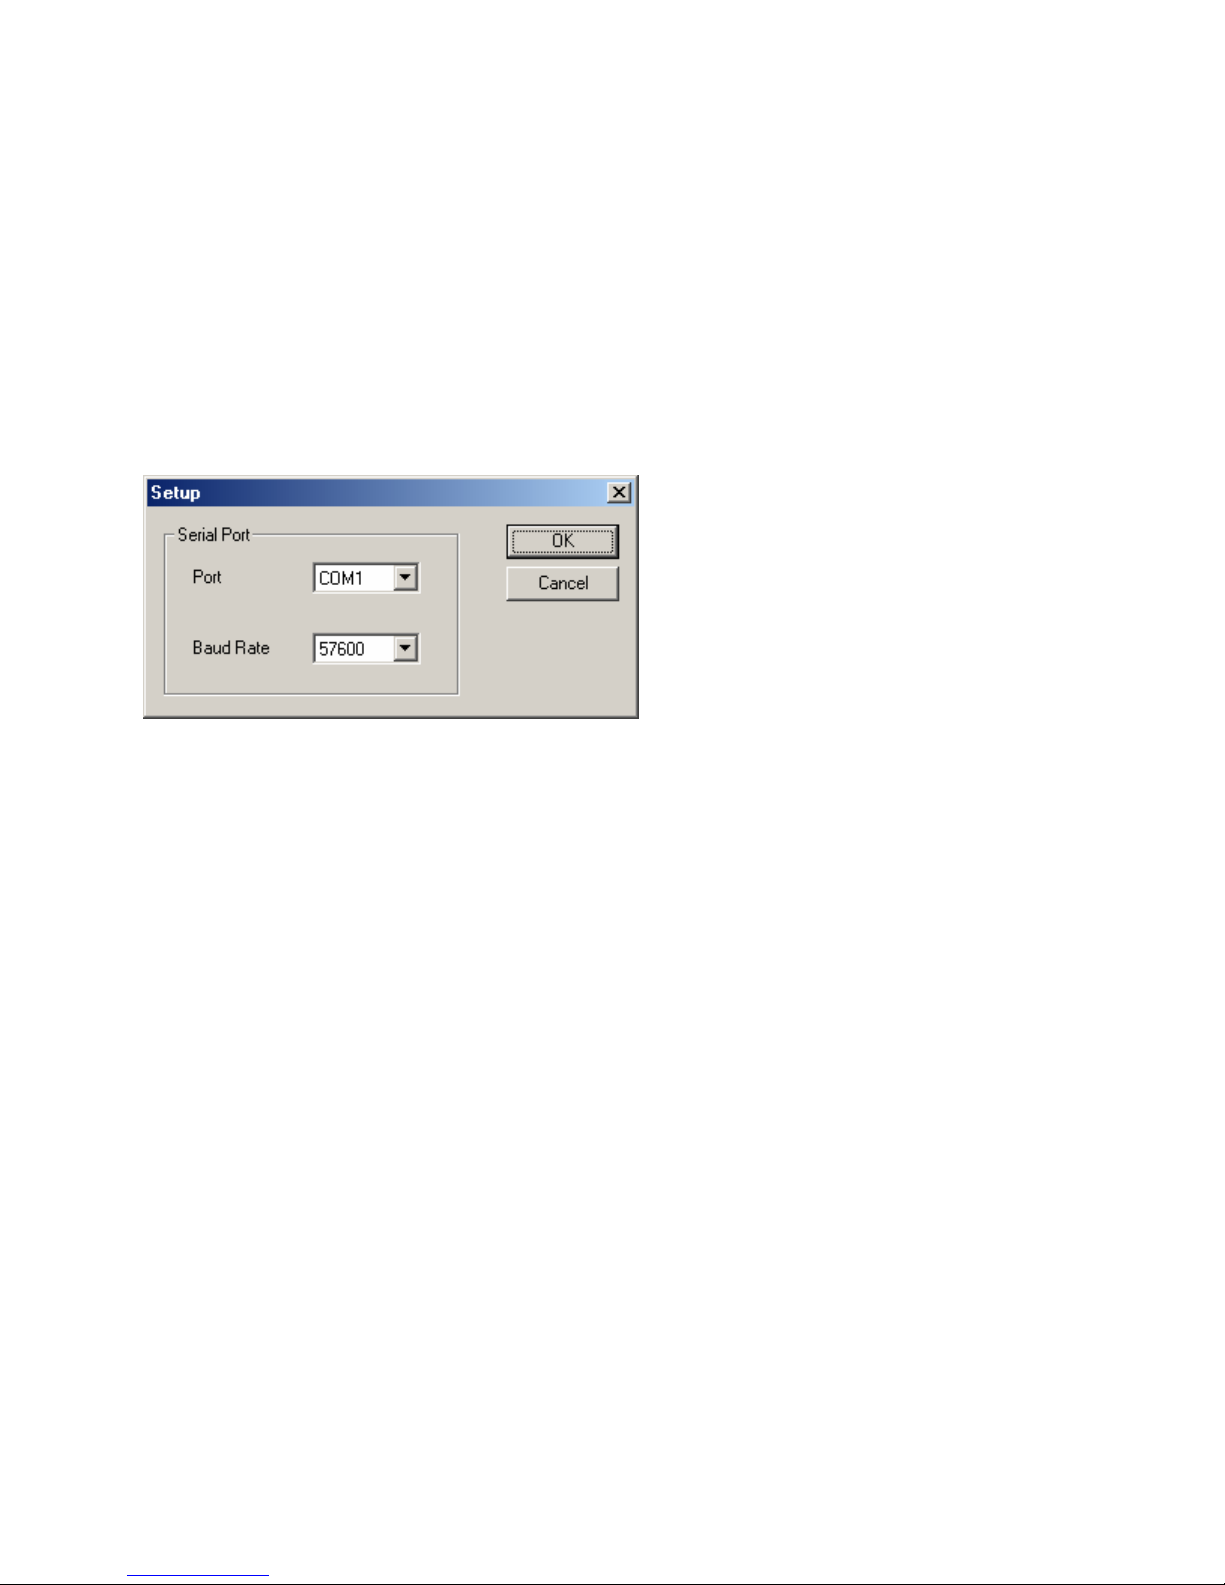
To configure the RS232 or USB port, click on Utilities in the Main Menu and select Setup.
For the RS232 interface, enter the COM port number and the baud rate you are using. The board rate of
the analyzer will be automatically adjusted to match the software setting. Select USB if using the USB
port.
Note: If you are having communication problems using the RS232 interface try lowering the baud rate.
The speed of this interface may be influenced by the PC speed and cable type and length.
18
VME850 Users Manual Capturing Bus Activity
CHAPTER 3
CAPTURING BUS ACTIVITY
This chapter describes in detail the setup, control and display of the state and waveform analysis
features.
3.0 Operation Overview
Before capturing bus activity click the Setup button to specify any triggers or filters you want use during
capture. To start capturing bus activity click on the icon. The capture will begin and the status
indicator will change to ACTIVE. When the trace buffer fills or you click the icon the sampled data
is displayed and the status indicator changes to READING or IDLE.
3.1 State Display Overview
The state display presents captured bus activity in a column form and is best used when viewing data
transfers. Signals can be moved, inserted, deleted and color and radix defined. Grouped signals such as
address can be collapsed and expanded and their range specified.
To open a state display, select File - New or Open - Capture - State. You can also click on the State
display icon in the main toolbar.
19
VME850 Users Manual Capturing Bus Activity
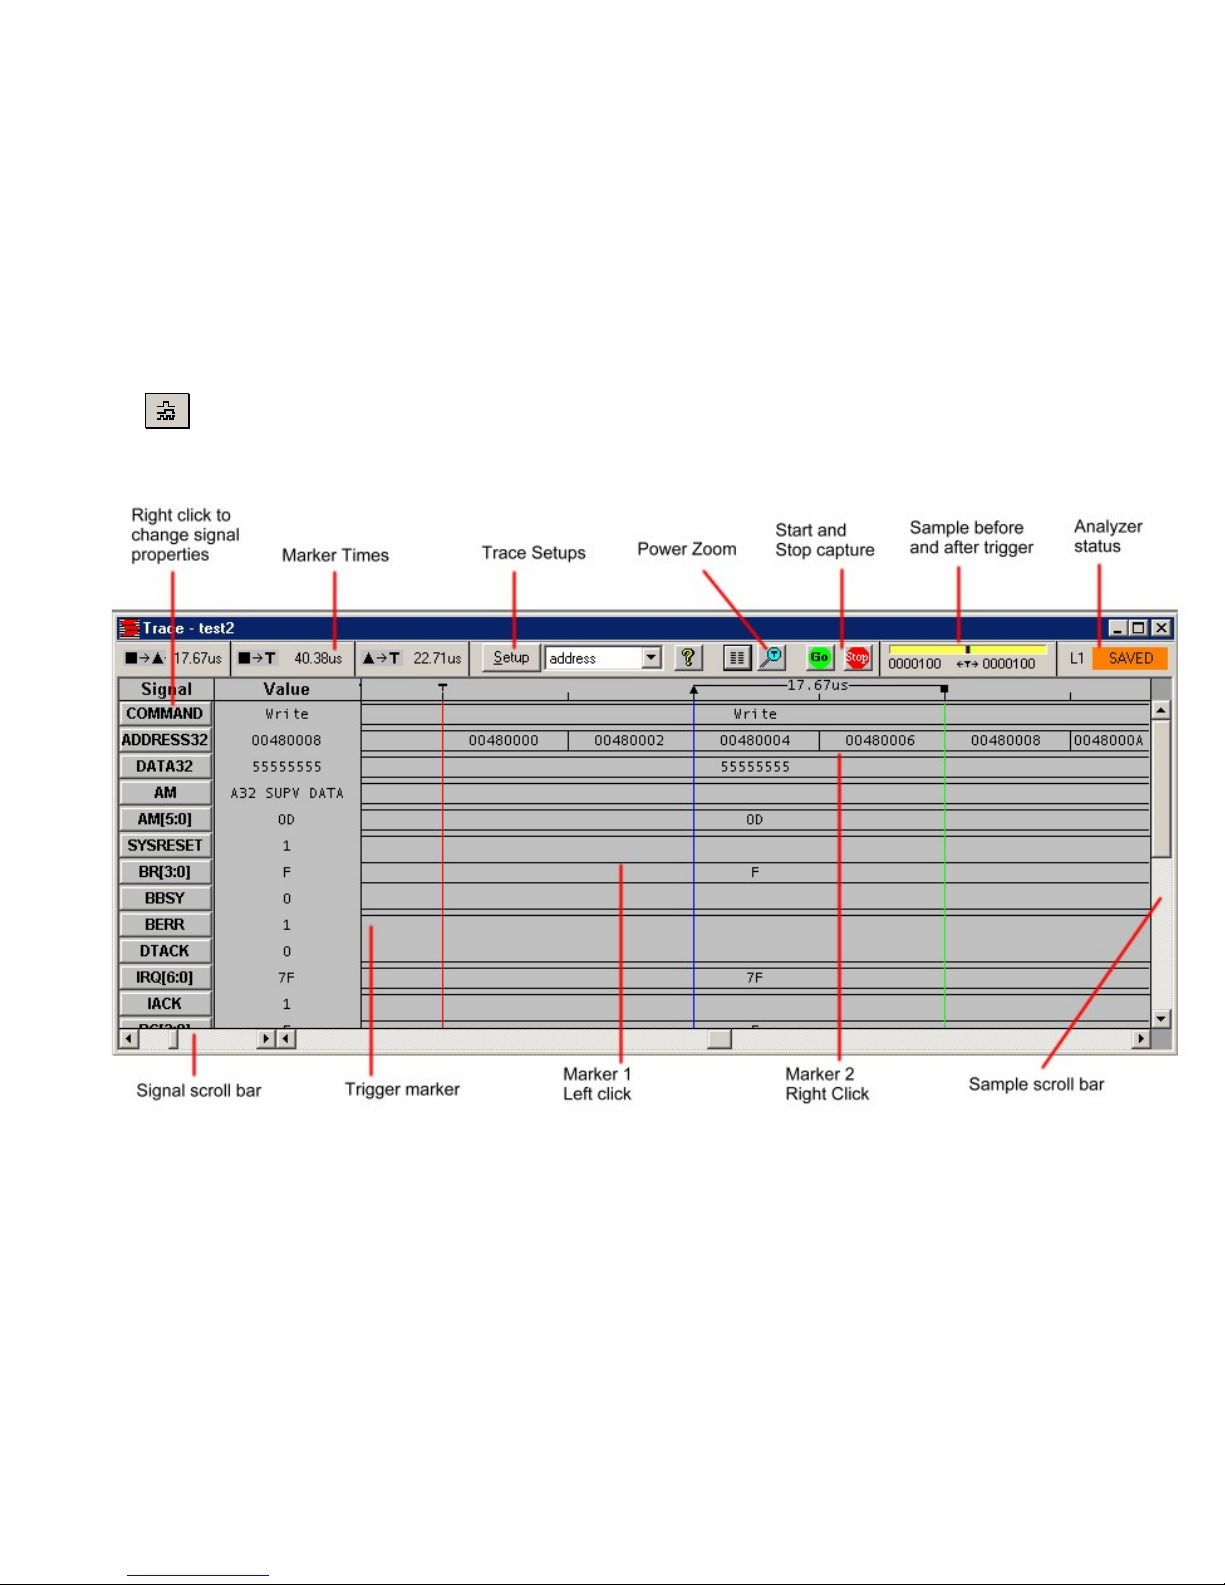
3.2 Waveform Display Overview
The timing display represents trace data as waveforms for timing analysis. A numeric value is provided
on top of each waveform. As in the state display, signals can be moved, inserted, deleted and color and
radix defined. Grouped signals such as address can be collapsed and expanded and their range specified.
A zoom is provided to get a better look at waveform relationships.
To open a waveform display, select File - New or Open - Capture - Waveform. You can also click on the
Waveform display icon in the main toolbar.
20

VME850 Users Manual Capturing Bus Activity
3.3 VME Bus Signal Names
The name of each bus signal is displayed on the top of each column in the state display and on the left of
each row in the waveform display. The signal names are defined as follows:
Signal Name Default
Description
Value
Sample Decimal Every time the analyzer captures bus activity a sample number is
assigned to the captured data. Sample number zero is the trigger sample.
Positive sample numbers occur after the trigger. Negative sample
numbers occur before the trigger.
(Note: Although this is not displayed in the waveform display it can be
inserted)
Command Mnemonic Indicates if the transfer is a Read, Write or Interrupt. Based on the
WRITE* and IACK* signals. Displays “Interrupt” if the IACK* signal is
low, otherwise displays “Write” if the WRITE* signal is low or “Read”
if this signal is high.
Address32 Hex Decoded 32 bit address. Displays only the valid address bits on A[31:1]
used during a transfer based on the address modifier. Decoded addresses
include A16, A24 and A32.
Data32 Hex Decoded 32 bit data. Displays only the valid data bits on D[31:0] used
during a transfer based on the LW, DS and A1 signals. Decoded data
transfers include single odd and even, double, quad, read/write/modified
(RWM), unaligned, multiplexed and block.
Address64 Hex Decoded 64 bit address. Displays only the valid address bits on AD[63:1]
used during a transfer based on the address modifier. Decoded addresses
include A16, A24, A32, A40 and A64.
Data64 Hex Decoded 64 bit data. Displays only the valid data bits on AD[63:0] used
during a transfer based on the LW, DS and A1 signals. Decoded data
transfers include single odd and even, double, quad, read/write/modified
(RWM) ), unaligned, multiplexed and block.
AM Mnemonic Decoded address modifier. Displays the type of transfer based on the
address modifier signals. These include A16, A24, A32, A40, A64, BLT,
MBLT, 2eVME, 2eSST, supervisory, program and non-privileged access.
TIME Decimal The time from the previous sample to the current sample. This time is
stored in the trace buffer for every sample and has a range from
nanoseconds to minutes.
DELTA Decimal The time from one selected sample to another selected sample. You select
a sample by applying a time marker. To select one time marker left click
directly on a sample in the state or waveform display. To select another
time marker right click on another sample. A line is drawn between the
two samples and the time difference is displayed in the DELTA column
in the state display or at the top of the waveform display.
21

VME850 Users Manual Capturing Bus Activity
ACCUM Decimal The accumulated time from the trigger sample. This time is calculated by
adding the individual sample times in the TIME field. Times are positive
after the trigger and negative before the trigger.
Bus Doctor Mnemonic When an anomaly is detected a description of the anomaly is displayed.
The anomaly messages are described in the anomaly section of this Users
Manual.
AM[5:0] Hex The bus state of the six AM signals. The default value is in hexadecimal.
AD[63:0] Hex The bus state of the address and data bus. AD[31:0] are the address
signals and AD[63:32] are the data signals. It is sometimes useful to use
this instead of the decoded address and data to examine all the signals
involved in a transfer.
SYSRESET Binary The state of the system reset signal; SYSRESET*.
BR[3:0] Hex The state of the bus request signals; BR0*, BR1*, BR2*, BR3*.
BG[3:0] Hex The state of the bus grant signals; BG0*, BG1*, BG2*, BG3*.
BUSY Binary The state of the bus busy signal; BUSY*.
BCLR Binary The state of the bus clear signal; BCLR*.
BERR Binary The state of the bus error signal; BERR*.
DTACK Binary The state of the bus acknowledge signal; DTACK*.
IRQ[6:0] Hex The state of the interrupt signals; IRQ7*, IRQ6*, IRQ5*, IRQ4*, IRQ3*,
IRQ2*, IRQ1*. Note that the analyzer names the interrupt signals from 6
to 0 and the VME bus specification names them from 7 to 1.
IACK Binary The state of the interrupt acknowledge signal; IACK*.
IACKI Binary The state of the interrupt acknowledge daisy chain signal; IACKIN*.
Note that IACKIN* is connected to IACKOUT* on the analyzer.
AS Binary The state of the address strobe signal; AS*.
WRITE Binary The state of the write signal; WRITE*.
DS[1:0] Hex The state of the data strobe signals; DS1*, DS0*.
LWORD Binary The state of the long word signal; LWORD*.
RETRY Binary The state of the retry signal; RETRY*.
RESP Binary The state of the response signal; RESP*.
FAIL Binary The state of the fail signal; FAIL*.
ACFAIL Binary The state of the ac fail signal; ACFAIL*.
CLK Binary The state of the clock signal; SYSCLK.
EXT[7:0] Hex The state of the 8 external input signals; EXT[7:0]. These signals are
input through a connector on the analyzer’s front panel and have weak
pull up resistors of approximately 100K ohm.. The input voltage range is
0 to 5 volts.
22
VME850 Users Manual Capturing Bus Activity
3.4 Signal Properties
Signals in the state and waveform display have many properties and functions.
Moving – Click on a signal and drag it to another position
Sizing – Drag the edge of a signal box to size the signal field
Color – Right click on the signal name and select color to change the color of the data displayed
Base - Right click on the signal name and select base (Hex, Octal, Binary) to change the radix
Change - Right click on the signal name and select Change Signal to change to another signal
Expand - Right click on the signal name and select Expand to expand a bussed signal into individual
signals.
Collapse – Select a number of signals with the same bus name (i.e. AD[0], AD[1], AD[2] ). Two
methods to select multiple signals are:
1. Hold the Ctrl key with the mouse to select more then one signal
2. To select a range of signals, click on one signal then hold the Shift key and select another
signal
Right click on one of the selected signal names and select Collapse to collapse them into a single
bussed signal.
Insert - Right click on the signal name and select Insert to insert a new signal
Delete - Right click on the signal name and select Delete to remove the signal
Insert Blank - Right click on the signal name and select Insert Blank to insert a blank field. This is
useful for separating groups of signals for better clarity.
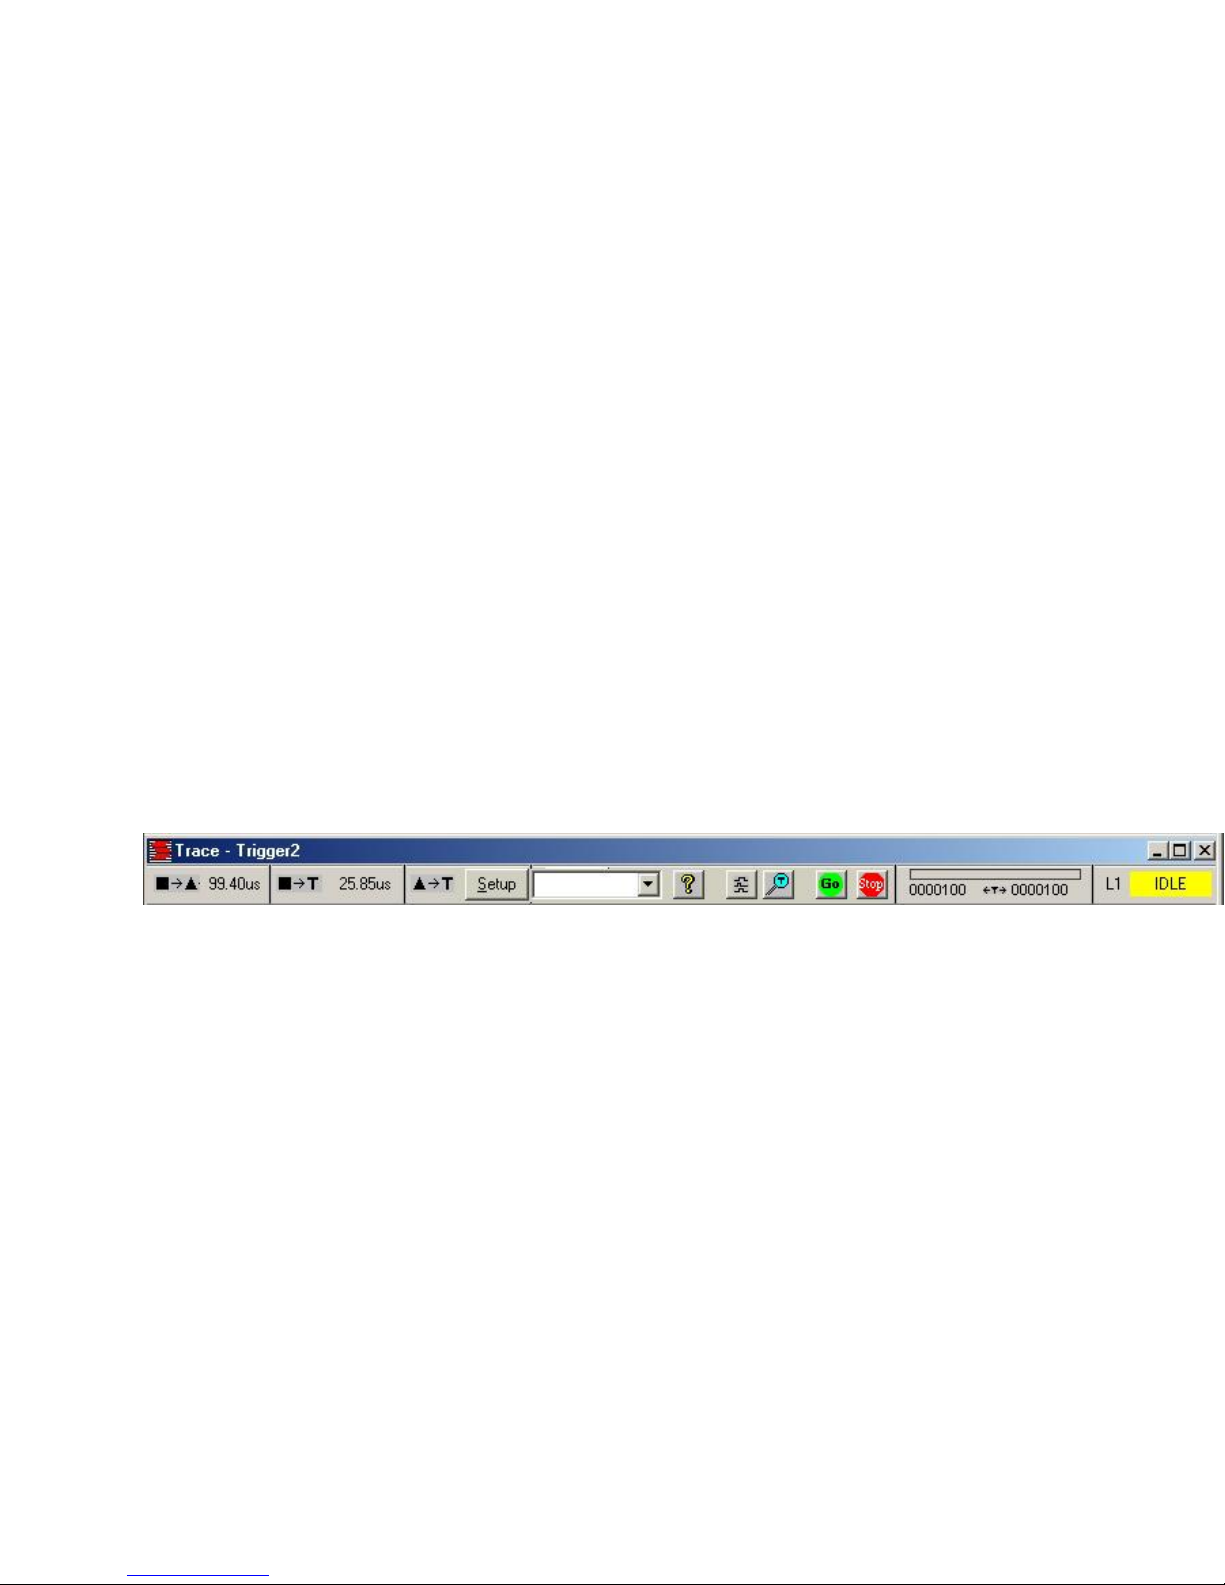
3.5 Control Bar
The control bar provides information and control while capturing and displaying trace data.
Go Button – Starts the capture of bus activity.
Stop Button – Stops the capture of bus activity and displays captured trace data. A Stop occurs
automatically if the trace buffer fills.
Number of Samples Before and After the Trigger – When capturing bus activity these values are
constantly updated to reflect the amount of data stored in the trace buffer. When reading trace data this
display indicates your position within the trace buffer.
Analyzer Status – Indicates the current state of the analyzer.
IDLE– not capturing or reading trace data
ACTIVE – capturing trace data
READING – reading trace data
Power Zoom Button – Opens a high speed timing window that displays trace data around the trigger
event.
Setup Button and Drop Down List – Click the Setup button to modify a new or saved setup. The drop
down list is a quick way to select previously saved setups.
23
VME850 Users Manual Capturing Bus Activity
State/Waveform Button – This button changes the window between state and waveform displays. It also
allows you to open another state or waveform display, which contains the same data as the first display
and whose position is linked together.
Marker Time Display – The time from the Trigger to Marker1, Trigger to Marker 2 and Marker1 to
Marker 2 is displayed.
3.6 Setups
The type of information captured in the trace buffer is controlled by setup information. Clicking the
Setup button in the control bar allows you to specify this information.
24
VME850 Users Manual Capturing Bus Activity
The setup window is divided into 3 main sections: Setup Utilities, Events, and Trace Control.
Setup Utilities – These are general setup functions:
1. Specify a setup Name
2. Give a setup Description
3. Open, Save and Delete setups
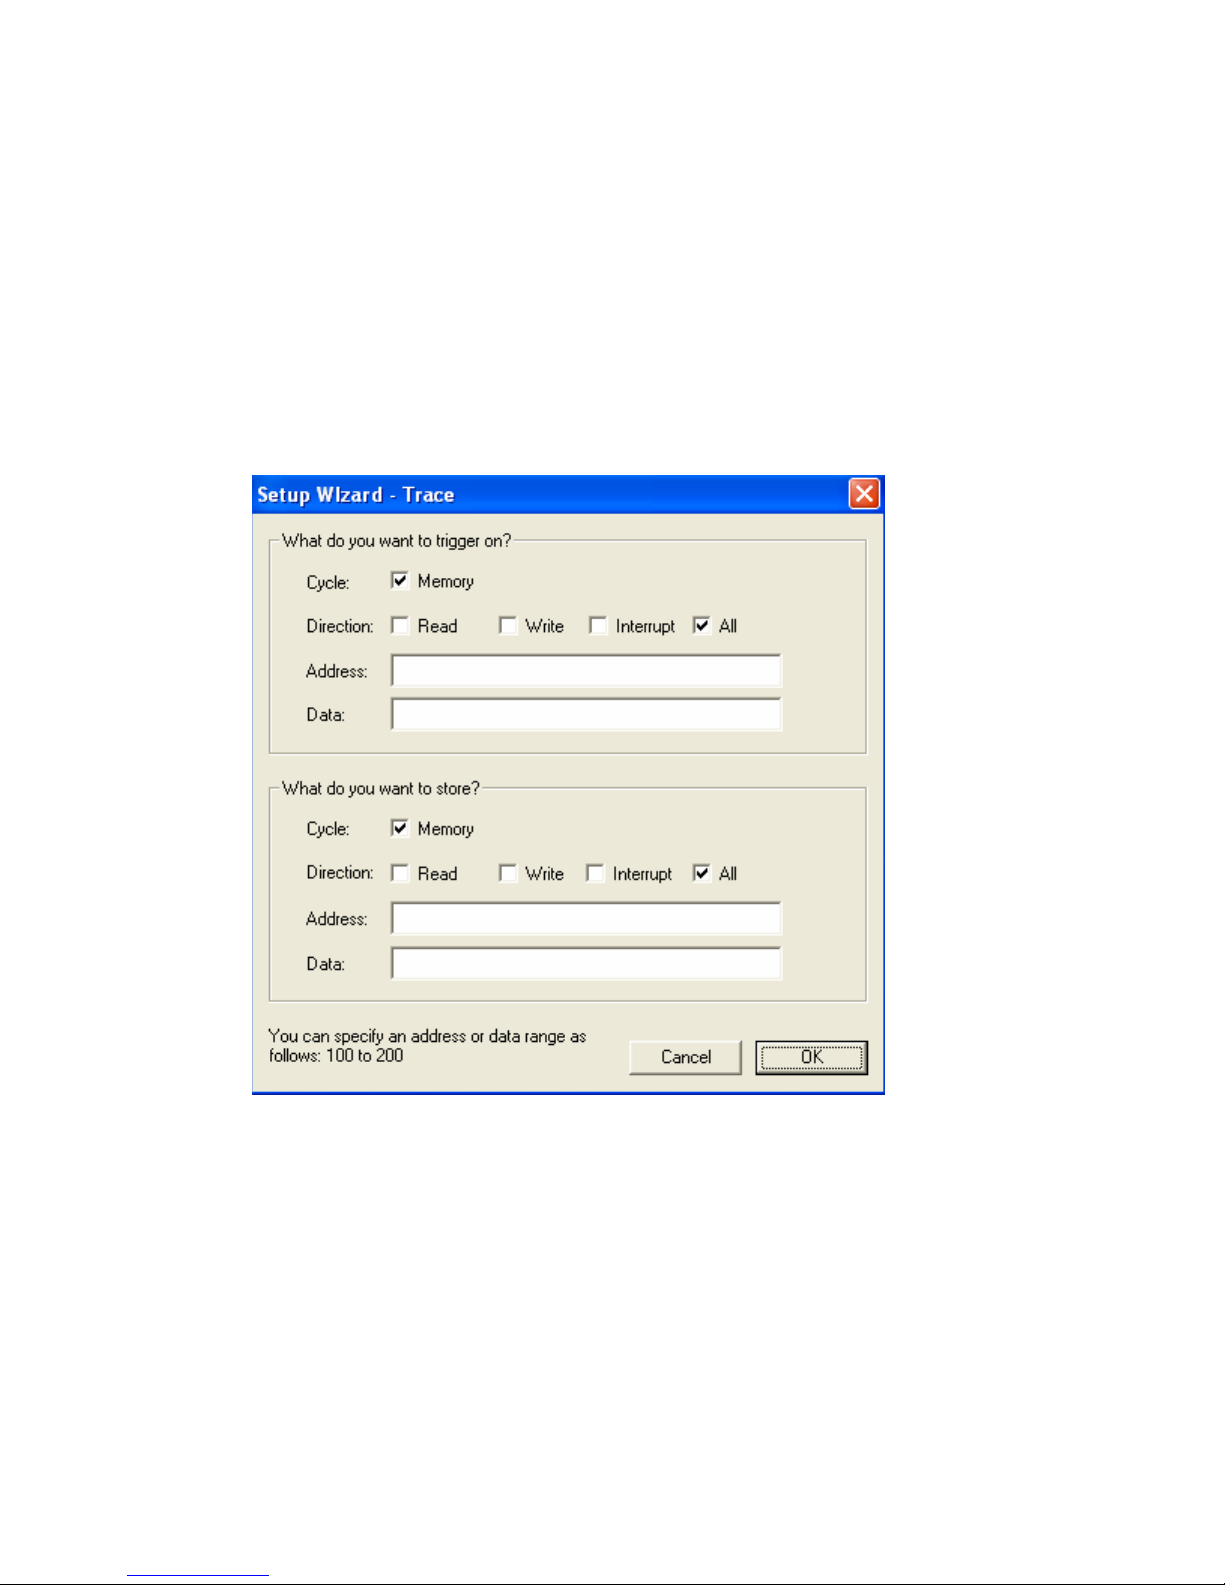
4. Use the Setup Wizard to assist in defining setups. The setup wizard automatically fills in
the trace setup event and control sections for simple trigger and store conditions. Simply
check the type of cycle. You can also include address and data values.
Events – Events are bus conditions that are of interest to you. They are used in the trace controls for
triggering, trace qualification and decision-making. Each event specifies a complete set of bus signals
and their state. Click on a field in the event section to change a signal. Grouped signals such as
AD[63:0] open a dialog box while individual signals rotate through preset selections when clicked. The
signal fields can be moved, sized and changed to customize the event display. See Signal Properties in
section 3.4 for a complete list of signal properties.
25

VME850 Users Manual Capturing Bus Activity
Trace Control – Trace controls specify how the analyzer captures bus activity. This multi-level structure
provides a flexible way to setup simple or complex trace control.
Each level has the following fields:
IF: This field defines an event or logical combination of events that you want to look for.
When you select the IF field an expression generator helps you construct an event condition.
OCCURS: The number of times the event occurs.
THEN: If the event in the IF field occurs the number of times in the OCCURS field you can jump
to a level and trigger.
ELSE: If the event in the IF field DOES NOT occur you can jump to a level and trigger.
STORE: An event or logical combination of events specifies what to store in the trace buffer.
26
VME850 Users Manual Capturing Bus Activity
The trace control section also sets the sample clocks and trigger position.
.
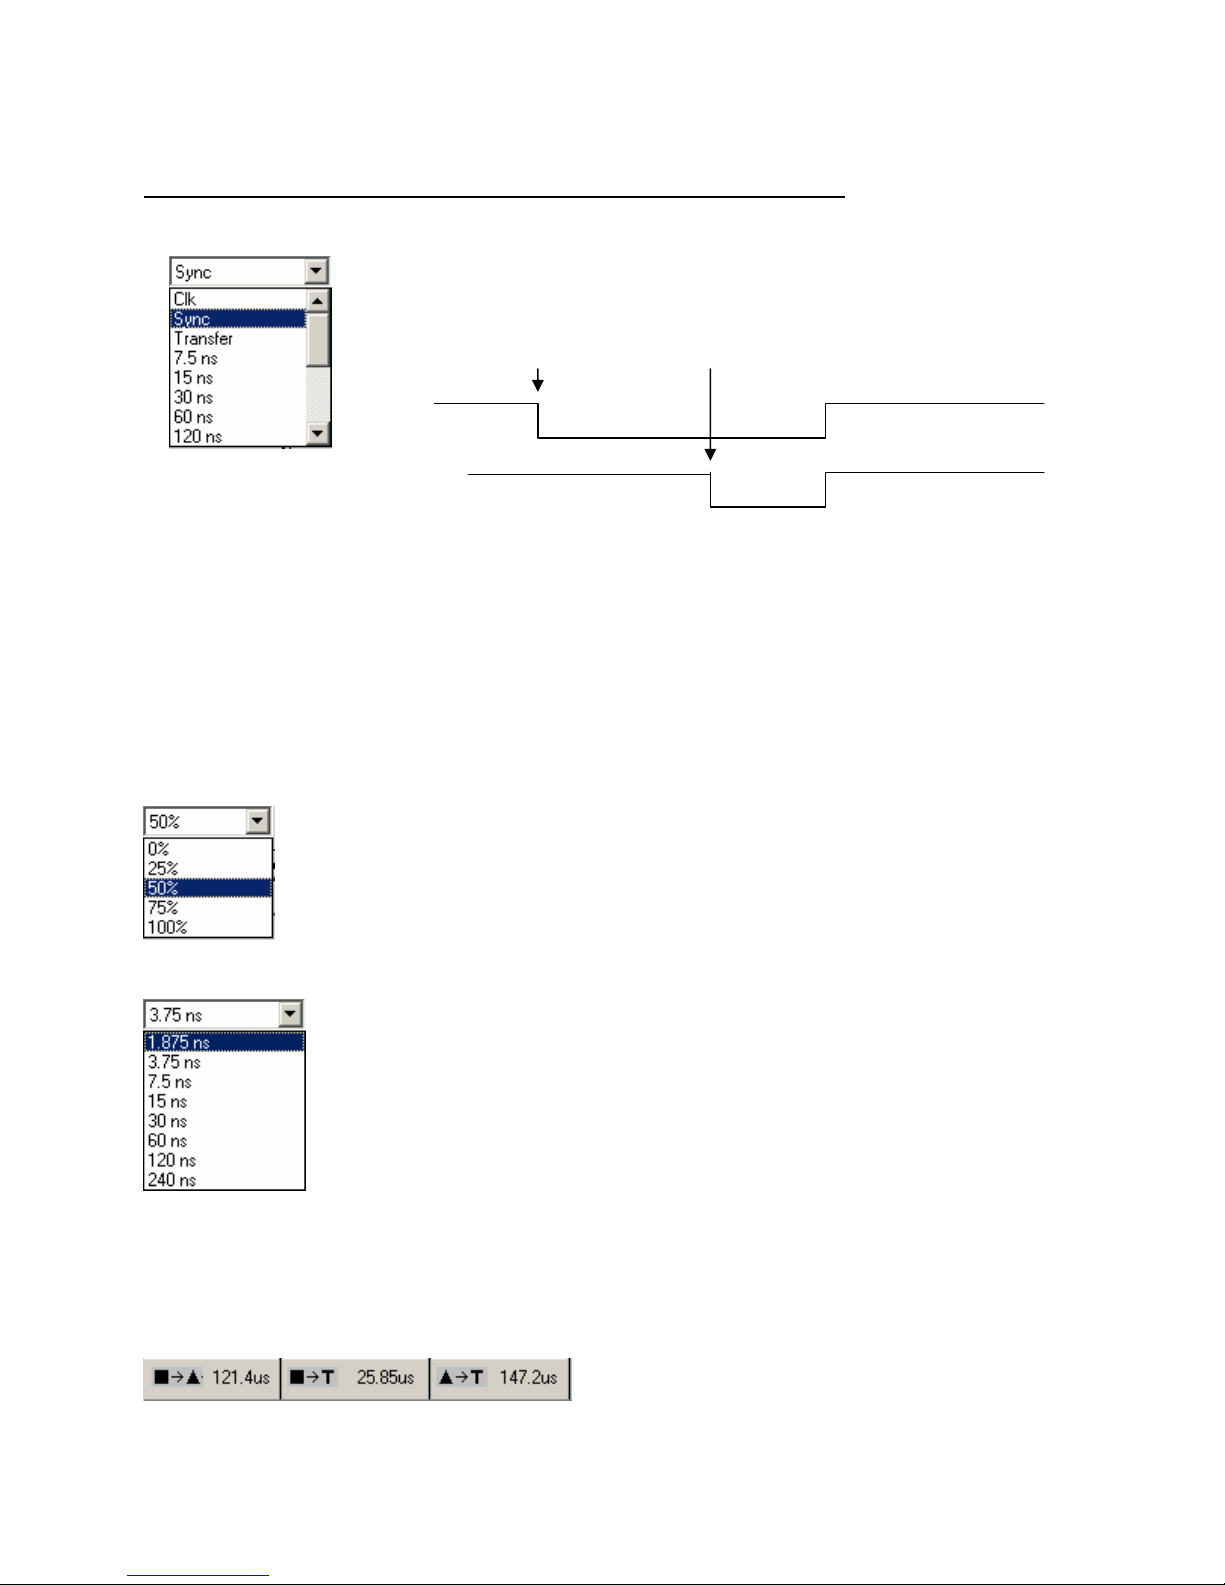
Sample Clock
The analyzer samples the bus using bus control signals or a high precision
analyzer clock.
address sampled data and other signals sampled
AS
DTACK
or BERR
Synchronous Sampling
Clk samples on the internal analyzer clock. The default is 33 Mhz.
Sync samples addresses on the negative edge of the AS signal and data and all other signals on the
negative edge of the DTACK or the BERR signal
Transfer samples on the system clock during a data transfer
The remaining selections are periodic intervals based on an analyzer clock.
Trigger Position
The trigger position defines the amount of information stored in the trace buffer before
and after a defined event called the trigger. Once a trigger is encountered a trigger
position of 0% stores all events starting at the beginning of the trace buffer.
Power Zoom Sample Clock
The power zoom sample clock specifies the sample rate of the high speed trace
buffer. This buffer samples bus signals around the trigger point and is displayed by
clicking on the power zoom button in the state or waveform display.
3.7 Time Markers
Time measurements on the state and waveform displays are performed using markers. Left click on data
in the display window to place one marker. Right click to place another marker. The time between the
markers is displayed on the data display. The control bar in the state and waveform window also shows
the time from the trigger to each marker and from marker to marker.
27
VME850 Users Manual Capturing Bus Activity
3.8 Searching and Jumping
Searching – To find information in the trace buffer use the search features on the main tool bar. After
defining search criteria you can search forward or backward through the trace buffer. The search starts at
st
marker position.
the 1
Jumping – Use the jump features on the main tool bar to quickly move to specific samples in the trace
buffer. Jump to the start, end, trigger, marker 1 and marker 2.
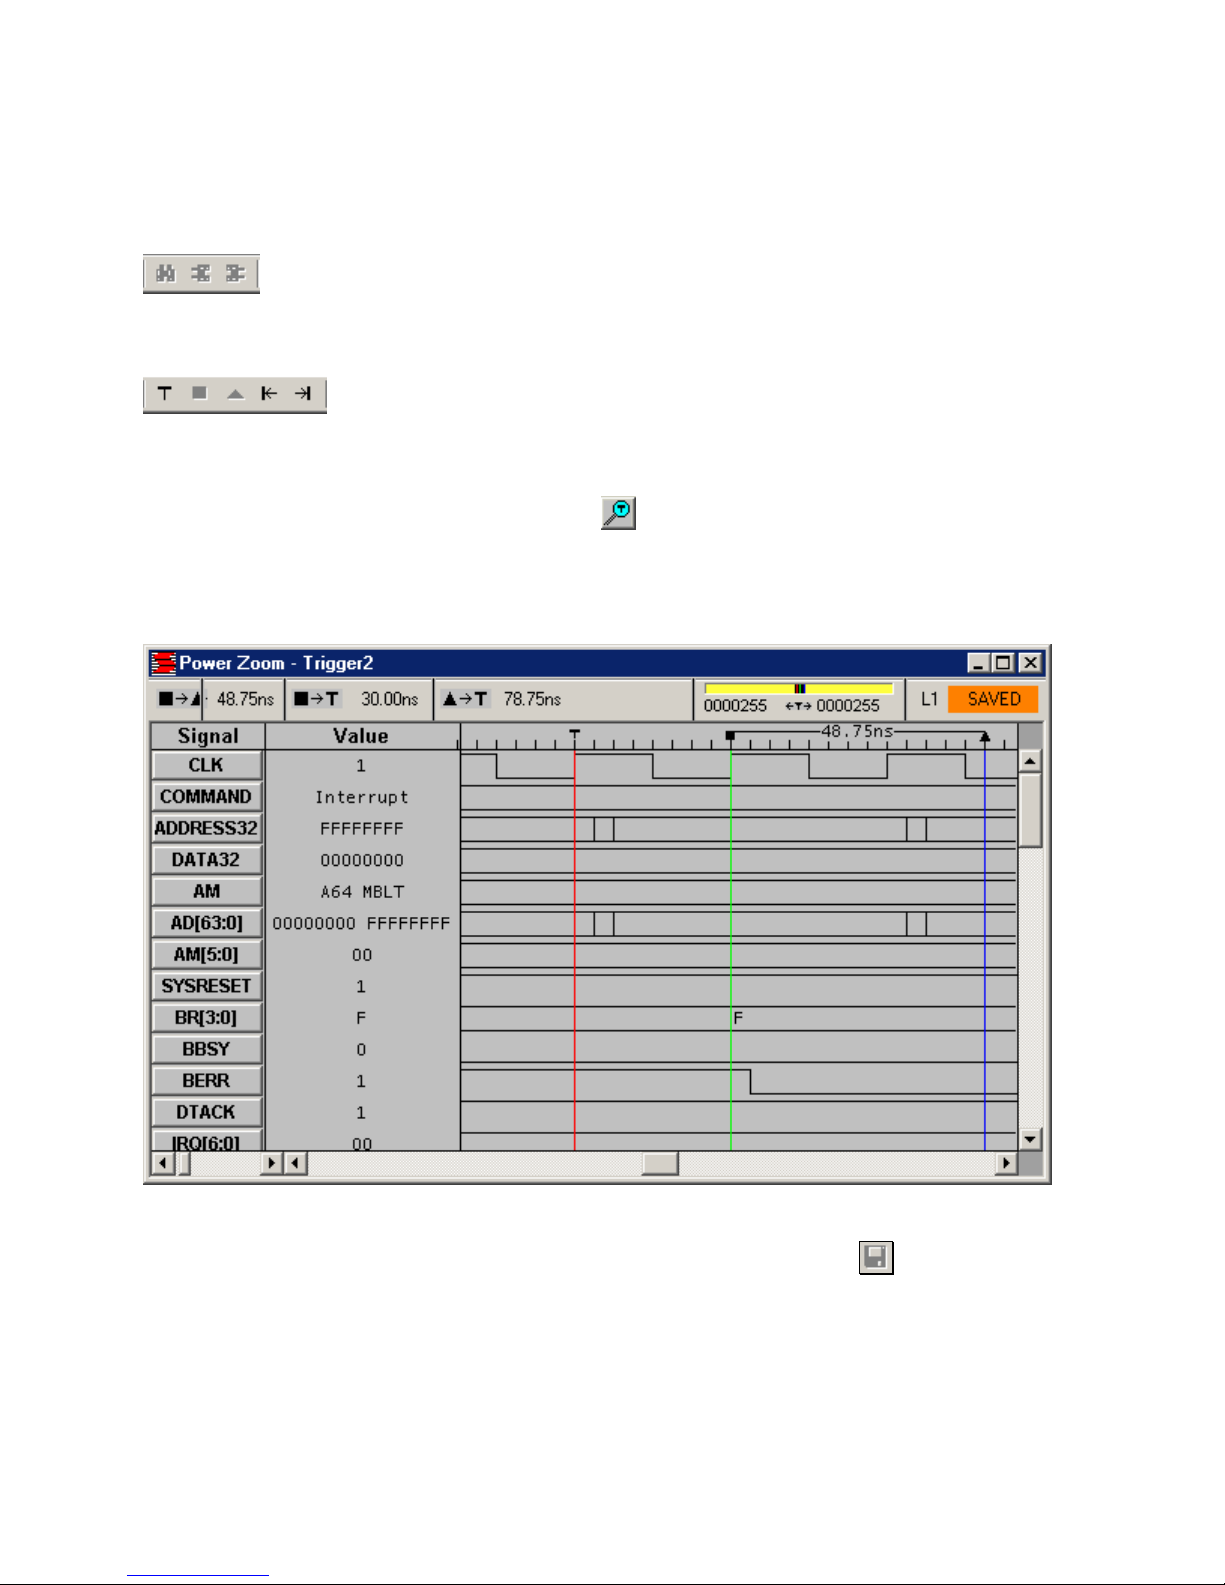
3.9 Power Zoom
The power zoom is a small high speed trace buffer that captures bus signals around the trigger event. To
open this window click the power zoom button
in the state or waveform display. The power zoom
window has the same features as the waveform display such as moving, inserting, deleting and changing
the signals in the display. Timing measurements can be made using markers by right and left clicking
directly on the display.
3.10 Saving Captured Data
To save trace data, select File and Save or Save As or click the Save icon
Trace data is saved in a text format that can be opened later or read in a word processor, database or
spread sheet. The file name is given a .tra file extension.
in the main tool bar.
28
VME850 Users Manual Capturing Bus Activity
3.11 Printing
To print state and waveform data select File and Print or click the print icon in the main tool bar.
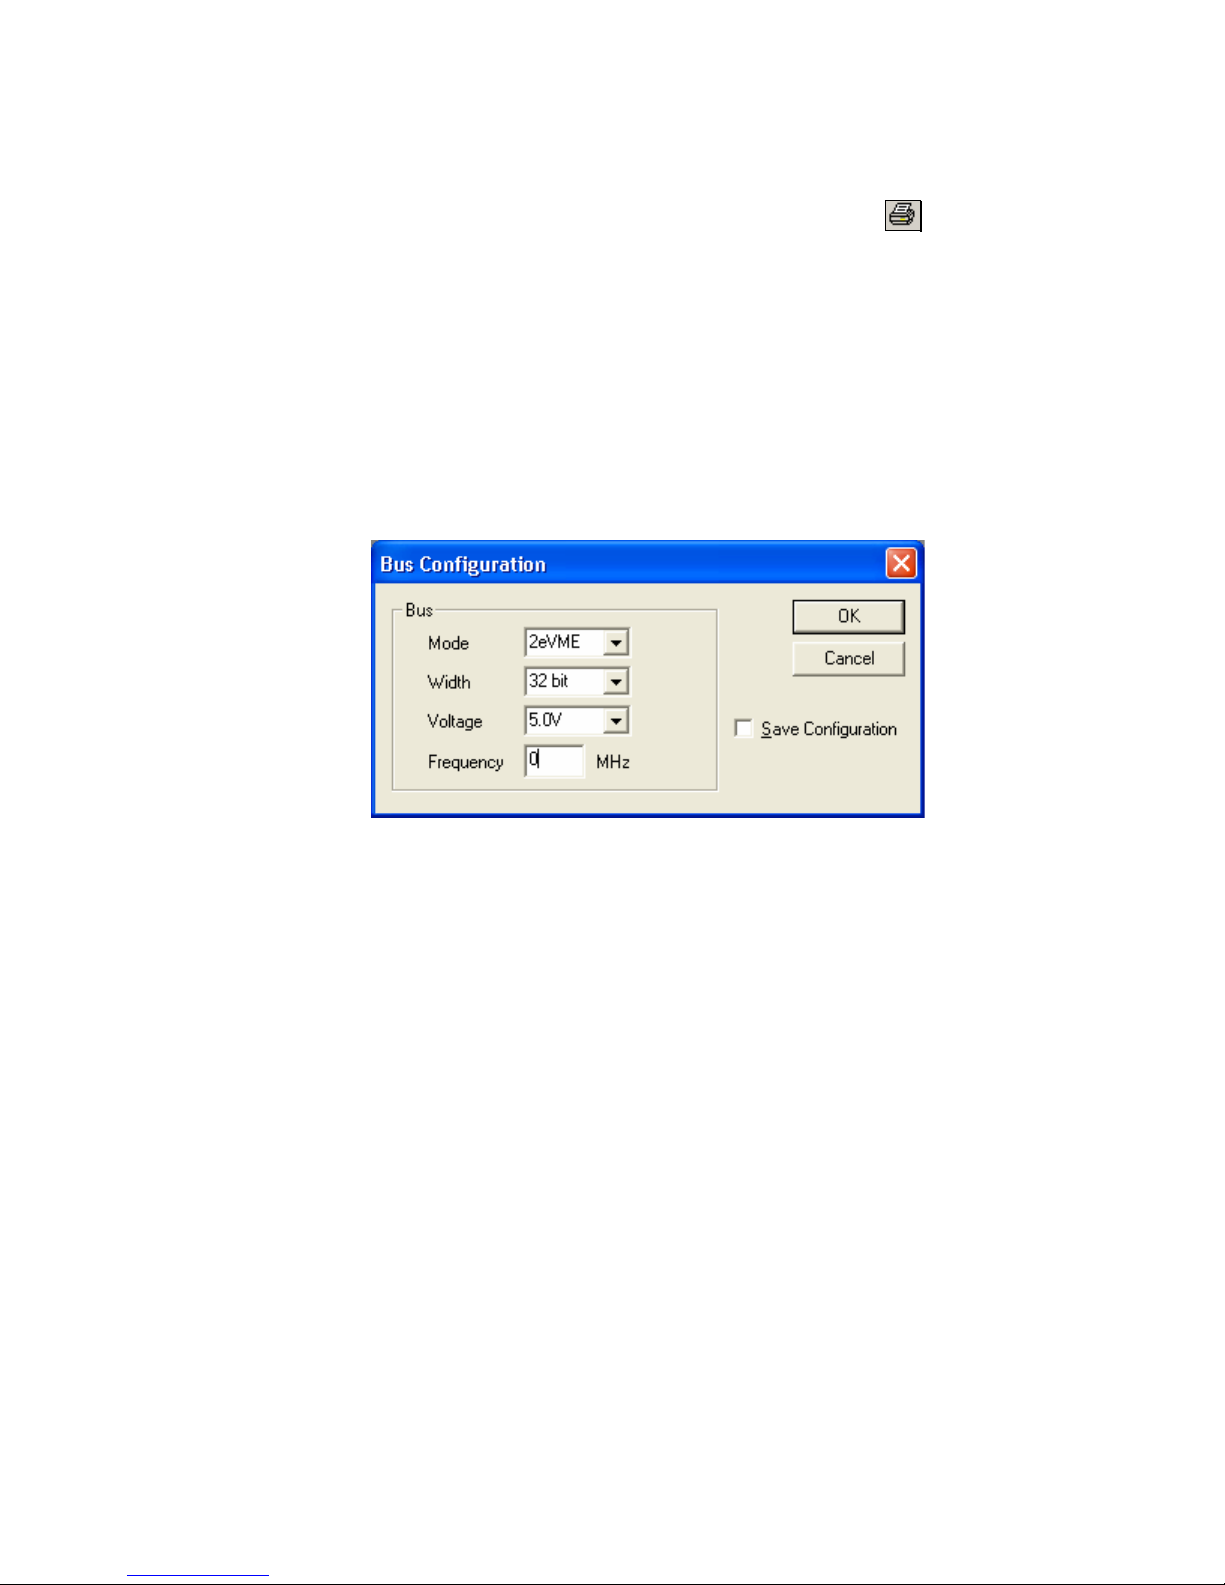
3.12 Capturing 2eVME and 2eSST
In VME64x systems that implement 2eVME or 2eSST protocols the analyzer must be set to capture
these protocols. The VME850 does not automatically determine which protocol is used. To set the
protocol type select Utilities from the main menu, then select Bus Configuration. Select the protocol
from the Mode field drop down list that is used in the VME system.
29
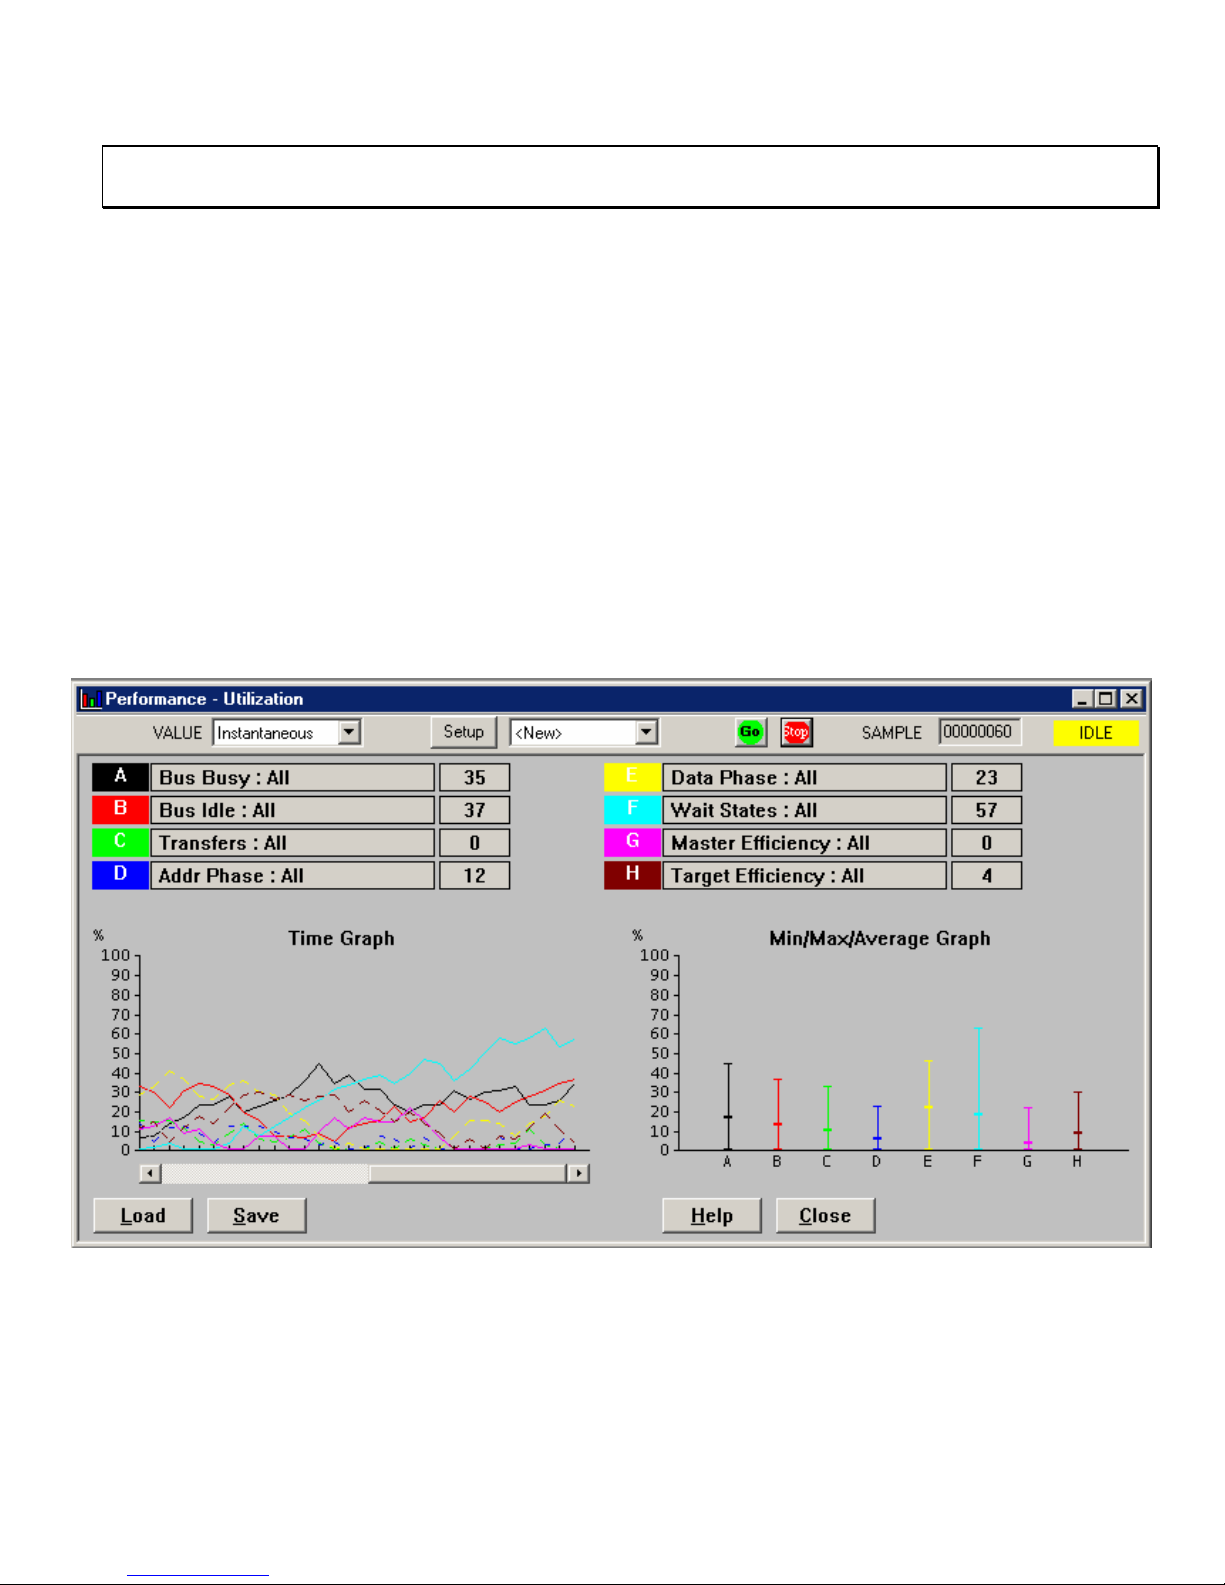
VME850 Users Manual Performance Analysis
CHAPTER 4
PERFORMANCE ANALYSIS
Time graphs and histograms give an overview of system performance, bottlenecks and problem areas.
There are 5 performance analysis measurements:
1. Utilization - Computes the percentage of time a signal is active.
2. Transfer Rate - Computes the speed of signals in MB/sec.
3. Latency - Computes the delay of signals in microseconds.
4. Burst Distribution - Computes the amount of data transferred in a burst transfer.
5. Statistics - Counts the number of occurrences of selected signals.
Dedicated hardware counters accumulate occurrences of selected items. The counter data is plotted on a
real time graph. The minimum, maximum and average values are computed from this data and displayed
on a separate bar chart. To open a performance window click File – New – Performance and the
measurement.
30
 Loading...