

Page 1

Rapidlab® 1200 Systems
Operator’s Guide
02087462 Rev. V, 2010–01
Page 2

© 2010 Siemens Healthcare Diagnostics Inc. All rights reserved.
No part of this manual or the products it describes may be reproduced by any means or in any form without
prior consent in writing from Siemens Healthcare Diagnostics.
The Rapidlab 1200 systems are for in vitro
AutomaticQC, Rapidlab, Rapidlink, Rapidcomm, RapidQC, Quick, CompleNet, RapidSystems, and
Multicap are trademarks of Siemens Healthcare Diagnostics.
Windows is a trademark of Microsoft Corporation.
IBM is a trademark of International B
Origin: UK
The information in this operator’s guide was correct at the time of printing. However, Siemens continues to
improve products and reserves the right to change specifications, equipment, and maintenance procedures at
any time without notice.
If the system is used in a manner differently than sp
equipment may be impaired. See warning and hazard statements.
diagnostic use.
usiness Machines Corporation.
ecified by Siemens, the
protection provided by the
Page 3

Using This Guide
The Rapidlab® 1200 Systems Operator’s Guide provides information for the
following clinical laboratory professionals who use the Rapidlab1200 system:
• Routine operators
These are medical or laboratory personnel who use the Rapidlab 1200
systems to analyze patient and QC samples, to view and print results, and to
perform routine maintenance.
• System supervisors
These are laboratory supervisors or designated key operators who perform
Setup functions, monitor the use of the Rapidlab 1200 systems, and assist
with troubleshooting and maintenance when necessary.
Organization
The following table describes how this operator’s guide is organized.
If you want to... Then refer to...
learn about system features,
learn about the hardware,
learn about user interface components,
learn about principles of potentiometry,
process samples, monitor status, or manage sample
results,
calibrate the system, Section 3:
learn about QC options,
analyze QC samples,
perform scheduled maintenance activities,
record maintenance activities,
investigate and correct system problems, Section 6: Troubleshooting.
manage data files, Section 7:
modify test definition parameters,
modify system parameters,
set up LIS parameters,
learn about biohazard precautions,
learn about laser precautions,
Section 1:
System Features
Hardware Overview,
Software Overview,
Technology.
Section 2:
Operating the System.
Calibration.
Section 4:
Quality Control.
Section 5:
Maintenance.
Data Management.
Section 8:
System Configuration.
Appendix A:
Safety.
02087462 Rev. V
Page 4
ii Rapidlab 1200 Operator’s Guide: Using This Guide
If you want to... Then refer to...
find warranty, legal, and support information,
find contact information,
learn about fill volume and stability information about
system fluids,
find information about ordering supplies, Appendix D:
learn about system specifications, Appendix E:
learn about system symbols, Appendix F:
learn about system terms, Appendix G:
Conventions
The Rapidlab® 1200 Operator’s Guide uses the following text and symbol conventions:
Convention Description
BIOHAZARD:
Appendix B:
Warranty and Support
Information.
Appendix C:
System Fluids.
Ordering Supplies.
System Specifications.
Symbols.
Glossary.
Biohazard statements alert you to potentially
biohazardous conditions.
Laser Warning statements alert you to the risk of
LASER WARNING:
WARNING:
CAUTION:
NOTE: Note statements alert you to important information
Bold Bold type indicates commands on the user
exposure to lasers.
Warning statements alert you to conditions that
may cause personal injury.
Caution statements alert you to conditions that may
cause product damage or loss of data.
On the system, this symbol indicates that you
should refer to the operator’s guide for more
information.
that requires your attention.
interface, keys, or the exact text that an operator
needs to type.
For example, if the word save is displayed as
it refers to the selecting the Save button on the user
interface.
Another example is typing a specific entry into a
text box. If the word welcome is displayed as
welcome, it means that you should type that word
into the specified field.
Save,
02087462 Rev. V
Page 5

Rapidlab 1200 Operator’s Guide: Using This Guide iii
Convention Description
Italic Italic type refers to the title of a document or a
section title in this operator’s guide. For example,
Operating the System‚ page 2-1 refers to Section 2
of this operator’s guide.
Terminology
The following table explains some of the special terminology used in this
operator’s guide and the specific actions that you need to take when you see the
terminology:
Term Description
Select To select an item, use your finger to select the item on the touchscreen
monitor.
Enter Use the numeric or alphanumeric sections of the touchscreen to enter the
specified information.
Scan Move the hand-held barcode scanner over the specified barcode to enter
the information.
02087462 Rev. V
Page 6

iv Rapidlab 1200 Operator’s Guide: Using This Guide
02087462 Rev. V
Page 7

Contents
Using This Guide
1 System Overview and Intended Use
Organization . . . . . . . . . . . . . . . . . . . . . . . . . . . . . . . . . . . . . 1-i
Conventions . . . . . . . . . . . . . . . . . . . . . . . . . . . . . . . . . . . . 1-ii
Terminology . . . . . . . . . . . . . . . . . . . . . . . . . . . . . . . . . . . . 1-iii
Intended Use . . . . . . . . . . . . . . . . . . . . . . . . . . . . . . . . . . . 1-1
Features . . . . . . . . . . . . . . . . . . . . . . . . . . . . . . . . . . . . . . . 1-1
Hardware Overview . . . . . . . . . . . . . . . . . . . . . . . . . . . . . . 1-2
User Interface Module . . . . . . . . . . . . . . . . . . . . . . . . . . . . . . . . 1-3
AutomaticQC Module . . . . . . . . . . . . . . . . . . . . . . . . . . . . . . . . . 1-4
AutomaticQC Cartridge . . . . . . . . . . . . . . . . . . . . . . . . . . . . . . . . . . .1-4
Waste Module. . . . . . . . . . . . . . . . . . . . . . . . . . . . . . . . . . . . . . .1-7
Reagent Module . . . . . . . . . . . . . . . . . . . . . . . . . . . . . . . . . . . . . 1-9
Reagent Cartridge . . . . . . . . . . . . . . . . . . . . . . . . . . . . . . . . . . . . . . .1-9
Wash Module . . . . . . . . . . . . . . . . . . . . . . . . . . . . . . . . . . . . . .1-13
Wash Cartridge . . . . . . . . . . . . . . . . . . . . . . . . . . . . . . . . . . . . . . . .1-13
Measurement Module. . . . . . . . . . . . . . . . . . . . . . . . . . . . . . . . 1-15
CO-ox Module . . . . . . . . . . . . . . . . . . . . . . . . . . . . . . . . . . . . . 1-18
Software Overview. . . . . . . . . . . . . . . . . . . . . . . . . . . . . . 1-19
Rapidlab® User Interface . . . . . . . . . . . . . . . . . . . . . . . . . . . . . 1-19
Viewing the Banner Information. . . . . . . . . . . . . . . . . . . . . . . . . . . .1-20
Viewing the Display Area. . . . . . . . . . . . . . . . . . . . . . . . . . . . . . . . .1-21
Rapidlab Main System Screens . . . . . . . . . . . . . . . . . . . . . . . . 1-21
Analysis Screen . . . . . . . . . . . . . . . . . . . . . . . . . . . . . . . . . . . . . . . .1-21
Recall Screen . . . . . . . . . . . . . . . . . . . . . . . . . . . . . . . . . . . . . . . . .1-24
Status Screen . . . . . . . . . . . . . . . . . . . . . . . . . . . . . . . . . . . . . . . . .1-24
Rapidlab 1200 Systems Sample Path . . . . . . . . . . . . . . 1-25
System Sample Path . . . . . . . . . . . . . . . . . . . . . . . . . . . . . . . . 1-25
CO-ox Sample Path . . . . . . . . . . . . . . . . . . . . . . . . . . . . . . . . .1-26
Rapidlab 1200 Systems Technology . . . . . . . . . . . . . . . 1-27
Potentiometry . . . . . . . . . . . . . . . . . . . . . . . . . . . . . . . . . . . . . . 1-27
Reference Sensor . . . . . . . . . . . . . . . . . . . . . . . . . . . . . . . . . . . . . .1-31
Amperometry . . . . . . . . . . . . . . . . . . . . . . . . . . . . . . . . . . . . . . 1-33
pH and Blood Gases. . . . . . . . . . . . . . . . . . . . . . . . . . . . . . . . . 1-33
Hydrogen Ion Activity or pH . . . . . . . . . . . . . . . . . . . . . . . . . . . . . . .1-33
02087462 Rev. V
Page 8

vi Rapidlab 1200 Operator’s Guide: Contents
Carbon Dioxide Tension (pCO2). . . . . . . . . . . . . . . . . . . . . . . . . . . 1-35
Oxygen Tension (pO
) . . . . . . . . . . . . . . . . . . . . . . . . . . . . . . . . . . 1-38
2
Electrolytes. . . . . . . . . . . . . . . . . . . . . . . . . . . . . . . . . . . . . . . . 1-40
Concentration of Sodium . . . . . . . . . . . . . . . . . . . . . . . . . . . . . . . . 1-42
Concentration of Potassium . . . . . . . . . . . . . . . . . . . . . . . . . . . . . . 1-42
Concentration of Chloride . . . . . . . . . . . . . . . . . . . . . . . . . . . . . . . . 1-43
Concentration of Ionized Calcium . . . . . . . . . . . . . . . . . . . . . . . . . . 1-44
Metabolites . . . . . . . . . . . . . . . . . . . . . . . . . . . . . . . . . . . . . . . . 1-45
Concentration of Glucose . . . . . . . . . . . . . . . . . . . . . . . . . . . . . . . . 1-45
Concentration of Lactate. . . . . . . . . . . . . . . . . . . . . . . . . . . . . . . . . 1-46
Glucose and Lactate Biosensors . . . . . . . . . . . . . . . . . . . . . . . . . . 1-46
Hemoglobin and its Derivatives . . . . . . . . . . . . . . . . . . . . . . . . 1-48
Total Hemoglobin . . . . . . . . . . . . . . . . . . . . . . . . . . . . . . . . . . . . . . 1-49
Oxyhemoglobin. . . . . . . . . . . . . . . . . . . . . . . . . . . . . . . . . . . . . . . . 1-49
Deoxyhemoglobin . . . . . . . . . . . . . . . . . . . . . . . . . . . . . . . . . . . . . . 1-49
Methemoglobin . . . . . . . . . . . . . . . . . . . . . . . . . . . . . . . . . . . . . . . . 1-50
Carboxyhemoglobin . . . . . . . . . . . . . . . . . . . . . . . . . . . . . . . . . . . . 1-50
Sulfhemoglobin . . . . . . . . . . . . . . . . . . . . . . . . . . . . . . . . . . . . . . . . 1-50
Determination of Hemoglobin Derivatives . . . . . . . . . . . . . . . . . . . 1-51
CO-oximeter Measurement Technology . . . . . . . . . . . . . . . . . . 1-51
Parameters . . . . . . . . . . . . . . . . . . . . . . . . . . . . . . . . . . . . 1-52
Bicarbonate Ion . . . . . . . . . . . . . . . . . . . . . . . . . . . . . . . . . . . . 1-54
Base Excess. . . . . . . . . . . . . . . . . . . . . . . . . . . . . . . . . . . . . . . 1-54
Total Carbon Dioxide . . . . . . . . . . . . . . . . . . . . . . . . . . . . . . . . 1-55
Hematocrit . . . . . . . . . . . . . . . . . . . . . . . . . . . . . . . . . . . . . . . . 1-55
Patient Temperature Correction . . . . . . . . . . . . . . . . . . . . . . . . 1-56
Hemoglobin Oxygen Saturation . . . . . . . . . . . . . . . . . . . . . . . . 1-56
Oxygen Content . . . . . . . . . . . . . . . . . . . . . . . . . . . . . . . . . . . . . . . 1-56
Oxygen Content of Hemoglobin . . . . . . . . . . . . . . . . . . . . . . . . . . . 1-57
Oxygen Capacity of Hemoglobin . . . . . . . . . . . . . . . . . . . . . . . . . . 1-57
p50 . . . . . . . . . . . . . . . . . . . . . . . . . . . . . . . . . . . . . . . . . . . . . . . . . 1-58
Oxygen Saturation (Estimated). . . . . . . . . . . . . . . . . . . . . . . . . . . . 1-58
pO
Calcium Adjustment for pH. . . . . . . . . . . . . . . . . . . . . . . . . . . . 1-59
Anion Gap. . . . . . . . . . . . . . . . . . . . . . . . . . . . . . . . . . . . . . . . . 1-59
Gas Exchange Indices . . . . . . . . . . . . . . . . . . . . . . . . . . . . . . . 1-60
Alveolar-Arterial Oxygen Tension Difference . . . . . . . . . . . . . . 1-60
Arterial-Alveolar Oxygen Tension Ratio . . . . . . . . . . . . . . . . . . 1-60
Respiratory Index . . . . . . . . . . . . . . . . . . . . . . . . . . . . . . . . . . . 1-61
Arterial-Venous (a-v) Study . . . . . . . . . . . . . . . . . . . . . . . . . . . 1-61
Arterial Oxygen Content . . . . . . . . . . . . . . . . . . . . . . . . . . . . . . . . . 1-61
Mixed Venous Oxygen Content . . . . . . . . . . . . . . . . . . . . . . . . . . . 1-61
Arterial-Venous Oxygen Content Difference. . . . . . . . . . . . . . . . . . 1-62
a-v Extraction Index . . . . . . . . . . . . . . . . . . . . . . . . . . . . . . . . . . . . 1-62
. . . . . . . . . . . . . . . . . . . . . . . . . . . . . . . . . . . . . . . . . . . . . 1-59
2/FIO2
02087462 Rev. V
Page 9

Rapidlab 1200 Operator’s Guide: Contents vii
Oxygen Consumption Rate . . . . . . . . . . . . . . . . . . . . . . . . . . . . . . .1-62
Oxygen Delivery . . . . . . . . . . . . . . . . . . . . . . . . . . . . . . . . . . . . . . .1-62
Physiologic Shunt . . . . . . . . . . . . . . . . . . . . . . . . . . . . . . . . . . . . . .1-63
Estimated Shunt . . . . . . . . . . . . . . . . . . . . . . . . . . . . . . . . . . . . . . .1-63
References . . . . . . . . . . . . . . . . . . . . . . . . . . . . . . . . . . . . . . . . 1-65
2 Operating the System
Using Basic System Functions . . . . . . . . . . . . . . . . . . . . 2-1
Starting up the Rapidlab 1200 System . . . . . . . . . . . . . . . . . . . . 2-1
Entering Your Password . . . . . . . . . . . . . . . . . . . . . . . . . . . . . . . 2-1
Replacing Supplies. . . . . . . . . . . . . . . . . . . . . . . . . . . . . . . . . . . 2-2
Emptying the Waste Bottle . . . . . . . . . . . . . . . . . . . . . . . . . . . . . . . .2-2
Replacing the Wash Cartridge . . . . . . . . . . . . . . . . . . . . . . . . . . . . .2-2
Replacing the Reagent Cartridge . . . . . . . . . . . . . . . . . . . . . . . . . . .2-3
Replacing the AutomaticQC Cartridge. . . . . . . . . . . . . . . . . . . . . . . .2-3
Reinstalling the AutomaticQC Cartridge . . . . . . . . . . . . . . . . . . . . . .2-4
Accessing System Information . . . . . . . . . . . . . . . . . . . . . . . . . . 2-5
Accessing Online Help . . . . . . . . . . . . . . . . . . . . . . . . . . . . . . . . 2-5
Shutting Down the System . . . . . . . . . . . . . . . . . . . . . . . . . . . . 2-6
Collecting Patient Samples. . . . . . . . . . . . . . . . . . . . . . . . 2-7
Collecting Samples. . . . . . . . . . . . . . . . . . . . . . . . . . . . . . . . . . . 2-7
Using Anticoagulants . . . . . . . . . . . . . . . . . . . . . . . . . . . . . . . . . 2-7
Using Different Sample Sources. . . . . . . . . . . . . . . . . . . . . . . . . 2-8
Handling and Storing Samples . . . . . . . . . . . . . . . . . . . . . . . . . . 2-9
Understanding System Limitations . . . . . . . . . . . . . . . . . . . . . . 2-10
Analyzing Samples . . . . . . . . . . . . . . . . . . . . . . . . . . . . . 2-11
Analyzing Syringe Samples . . . . . . . . . . . . . . . . . . . . . . . . . . . 2-11
Analyzing Capillary Samples . . . . . . . . . . . . . . . . . . . . . . . . . . 2-12
Analyzing Microsamples . . . . . . . . . . . . . . . . . . . . . . . . . . . . . . 2-14
Analyzing pH and pH, Glu, and Lac Samples. . . . . . . . . . . . . . 2-17
Analyzing tHb Samples. . . . . . . . . . . . . . . . . . . . . . . . . . . . . . . 2-18
Using Custom Panels . . . . . . . . . . . . . . . . . . . . . . . . . . . . . . . 2-20
Understanding System Behavior with Custom Panels. . . . . . . . . . .2-21
Entering Patient Sample Data. . . . . . . . . . . . . . . . . . . . . 2-22
Scanning Barcodes at the Analysis Screen . . . . . . . . . . . . . . . 2-22
Scanning Technique . . . . . . . . . . . . . . . . . . . . . . . . . . . . . . . . .2-22
Entering Patient Demographics . . . . . . . . . . . . . . . . . . . . . . . . 2-23
Early Demographics Data Entry . . . . . . . . . . . . . . . . . . . . . . . . . . .2-24
Using the Save Demographics Option. . . . . . . . . . . . . . . . . . . . . . .2-25
Editing Demographics. . . . . . . . . . . . . . . . . . . . . . . . . . . . . . . . 2-25
Using Patient Results . . . . . . . . . . . . . . . . . . . . . . . . . . . 2-27
02087462 Rev. V
Page 10

viii Rapidlab 1200 Operator’s Guide: Contents
Viewing Patient Results . . . . . . . . . . . . . . . . . . . . . . . . . . . . . . 2-27
Performing a Patient Search . . . . . . . . . . . . . . . . . . . . . . . . . . 2-28
Patient Search Guidelines . . . . . . . . . . . . . . . . . . . . . . . . . . . . . . . 2-28
Performing a Patient Search. . . . . . . . . . . . . . . . . . . . . . . . . . . . . . 2-29
Recalling Patient Sample Results . . . . . . . . . . . . . . . . . . . . . . 2-30
Interpreting the Patient Recall Screen Symbols . . . . . . . . . . . . . . . 2-30
Printing Reports . . . . . . . . . . . . . . . . . . . . . . . . . . . . . . . . 2-31
Procedural Notes for Printing Reports . . . . . . . . . . . . . . . . . . . 2-31
Printing Reports on the Internal Printer . . . . . . . . . . . . . . . . . . . . . 2-31
Printing Reports on the External Printer . . . . . . . . . . . . . . . . . . . . . 2-32
Using Available Reports . . . . . . . . . . . . . . . . . . . . . . . . . . . . . . 2-32
Performing a Correlation Study . . . . . . . . . . . . . . . . . . . 2-34
Combining Results for an a-v Study Report . . . . . . . . . 2-35
Before You Begin . . . . . . . . . . . . . . . . . . . . . . . . . . . . . . . . . . . 2-36
Setting up the Data. . . . . . . . . . . . . . . . . . . . . . . . . . . . . . . . . . 2-36
Printing the Arterial-Venous Study Report . . . . . . . . . . . . . . . . . . . 2-37
3 Calibration
Understanding Automatic Calibrations . . . . . . . . . . . . . . 3-1
Troubleshooting Failed Calibrations . . . . . . . . . . . . . . . . . . . . . . 3-3
Generating Calibration Reports . . . . . . . . . . . . . . . . . . . . . . . . . 3-3
Performing Manual Calibrations . . . . . . . . . . . . . . . . . . . . 3-4
Recalling Calibration Results . . . . . . . . . . . . . . . . . . . . . . . . . . . 3-4
4 Quality Control
Performing QC Sample Analysis. . . . . . . . . . . . . . . . . . . . 4-1
Using the Required QC Analysis Option . . . . . . . . . . . . . . . . . . 4-1
Performing Required QC Sample Analysis. . . . . . . . . . . . . . . . . . . . 4-1
Procedural Notes for Required QC. . . . . . . . . . . . . . . . . . . . . . . . . . 4-2
Using the AutomaticQC Analysis Option . . . . . . . . . . . . . . . . . . 4-3
Performing AutomaticQC Sample Analysis . . . . . . . . . . . . . . . . . . . 4-3
Manually Performing AutomaticQC Analysis . . . . . . . . . . . . . . . . . . 4-3
Procedural Notes for AutomaticQC Sample Analysis. . . . . . . . . . . . 4-4
Performing STAT Samples during AutomaticQC Analysis . . . . . . . . 4-4
Using the Unscheduled QC Option . . . . . . . . . . . . . . . . . . . . . . 4-4
Performing Unscheduled QC Sample Analysis . . . . . . . . . . . . . . . . 4-4
02087462 Rev. V
Accessing QC Results . . . . . . . . . . . . . . . . . . . . . . . . . . . . 4-5
Printing or Sending Results . . . . . . . . . . . . . . . . . . . . . . . . . . . . 4-6
Result Flags . . . . . . . . . . . . . . . . . . . . . . . . . . . . . . . . . . . . . . . . . . . 4-6
Recalling QC Results . . . . . . . . . . . . . . . . . . . . . . . . . . . . . . . . . 4-7
Page 11

Rapidlab 1200 Operator’s Guide: Contents ix
Using the QC List Screen . . . . . . . . . . . . . . . . . . . . . . . . . . . . . . . . .4-7
Using the Recall QC Data Search Screen. . . . . . . . . . . . . . . . . . . . .4-8
Using the Recall–QC Statistics Screens. . . . . . . . . . . . . . . . . . . 4-9
Viewing the Recall–QC Statistics Screen . . . . . . . . . . . . . . . . . . . . .4-9
Using the Recall–Levey-Jennings Screens . . . . . . . . . . . . . . . 4-11
Viewing the Recall–Levey-Jennings Graph Screen. . . . . . . . . . . . .4-11
Restoring Parameters . . . . . . . . . . . . . . . . . . . . . . . . . . . 4-12
5 Maintenance
Preparing for Maintenance Procedures. . . . . . . . . . . . . . 5-1
Performing Daily Maintenance . . . . . . . . . . . . . . . . . . . . . 5-2
Checking System Status. . . . . . . . . . . . . . . . . . . . . . . . . . . . . . . 5-2
Cleaning and Disinfecting the Exterior Surfaces . . . . . . . . . . . .5-2
Calibrating the Barometric Sensor . . . . . . . . . . . . . . . . . . . . . . .5-3
Performing Twice Weekly Maintenance. . . . . . . . . . . . . . 5-3
Analyzing High G/L . . . . . . . . . . . . . . . . . . . . . . . . . . . . . . . . . . . 5-3
Performing Weekly Maintenance . . . . . . . . . . . . . . . . . . . 5-4
Deproteinizing the Sample Path . . . . . . . . . . . . . . . . . . . . . . . . . 5-4
Conditioning the Sensors . . . . . . . . . . . . . . . . . . . . . . . . . . . . . . 5-6
Checking the Level of Fill Solution . . . . . . . . . . . . . . . . . . . . . . . 5-7
Performing Every 60 Days Maintenance . . . . . . . . . . . . . 5-9
Replacing the CO-ox Sample Chamber . . . . . . . . . . . . . . . . . . .5-9
Checking the Air Filters. . . . . . . . . . . . . . . . . . . . . . . . . . . . . . . . 5-9
Performing Quarterly Maintenance . . . . . . . . . . . . . . . . 5-10
Replacing the Pinch Valve Tubing . . . . . . . . . . . . . . . . . . . . . . 5-10
Testing for Leaks . . . . . . . . . . . . . . . . . . . . . . . . . . . . . . . . . . . . . . .5-11
Yearly Maintenance . . . . . . . . . . . . . . . . . . . . . . . . . . . . . 5-11
Replacing the Measurement Module Tubing . . . . . . . . . . . . . . 5-12
Replacing the CO-ox Module Tubing . . . . . . . . . . . . . . . . . . . . 5-13
Replacing the CO-ox Sample Tubing . . . . . . . . . . . . . . . . . . . . . . .5-14
Replacing the CO-ox Waste Tubing . . . . . . . . . . . . . . . . . . . . . . . .5-15
Replacing the CO-ox Pump Tubing . . . . . . . . . . . . . . . . . . . . . . . . .5-16
Completing CO-ox Maintenance . . . . . . . . . . . . . . . . . . . . . . . . . . .5-16
Replacing the Reagent Manifold. . . . . . . . . . . . . . . . . . . . . . . . 5-17
Completing Reagent Manifold Maintenance . . . . . . . . . . . . . . . . . .5-18
Replacing the AutomaticQC Manifold. . . . . . . . . . . . . . . . . . . . 5-19
Completing AutomaticQC Manifold Maintenance . . . . . . . . . . . . . .5-20
Replacing the Air Filters . . . . . . . . . . . . . . . . . . . . . . . . . . . . . . 5-20
Cleaning Procedures . . . . . . . . . . . . . . . . . . . . . . . . . . . . 5-21
Cleaning and Disinfecting the Screen. . . . . . . . . . . . . . . . . . . . 5-21
02087462 Rev. V
Page 12

x Rapidlab 1200 Operator’s Guide: Contents
Cleaning the Sample Path . . . . . . . . . . . . . . . . . . . . . . . . . . . . 5-22
Reinstalling the Reference Sensor and Biosensors . . . . . . . . . . . . 5-24
Completing the Sample Path Maintenance . . . . . . . . . . . . . . . . . . 5-24
Cleaning the CO-ox Roller Cage . . . . . . . . . . . . . . . . . . . . . . . 5-25
Cleaning the Roller Cage . . . . . . . . . . . . . . . . . . . . . . . . . . . . . . . . 5-26
Reinstalling the Roller Cage . . . . . . . . . . . . . . . . . . . . . . . . . . . . . . 5-26
Reconnecting the CO-ox Tubing . . . . . . . . . . . . . . . . . . . . . . . . . . 5-27
Cleaning the Waste Assembly . . . . . . . . . . . . . . . . . . . . . . . . . 5-27
Maintaining the Sensors . . . . . . . . . . . . . . . . . . . . . . . . . 5-29
Replacing the Sensors . . . . . . . . . . . . . . . . . . . . . . . . . . . . . . . 5-29
Preparing the Sensors . . . . . . . . . . . . . . . . . . . . . . . . . . . . . . . . . . 5-29
Removing the Sensors . . . . . . . . . . . . . . . . . . . . . . . . . . . . . . . . . . 5-30
Installing the Sensor . . . . . . . . . . . . . . . . . . . . . . . . . . . . . . . . . . . . 5-31
Verifying Sensor Performance . . . . . . . . . . . . . . . . . . . . . . . . . . . . 5-31
Filling the Sensor . . . . . . . . . . . . . . . . . . . . . . . . . . . . . . . . . . . . . . 5-32
Performing Reference Sensor Maintenance . . . . . . . . . . . . . . 5-34
Cleaning and Inspecting the Reference Sensor . . . . . . . . . . . . . . . 5-34
Filling the Reference Sensor Cassette . . . . . . . . . . . . . . . . . . . . . . 5-36
Maintaining the Internal Reference Electrode. . . . . . . . . . . . . . . . . 5-39
Performing Measurement Sensor Maintenance. . . . . . . . . . . . 5-40
Replacing System Components . . . . . . . . . . . . . . . . . . . 5-42
Replacing the Printer Paper . . . . . . . . . . . . . . . . . . . . . . . . . . . 5-42
Replacing the Sample Port . . . . . . . . . . . . . . . . . . . . . . . . . . . 5-42
Replacing the CO-ox Lamp . . . . . . . . . . . . . . . . . . . . . . . . . . . 5-43
Replacing the CO-ox Roller Cage . . . . . . . . . . . . . . . . . . . . . . 5-45
Removing the Roller Cage . . . . . . . . . . . . . . . . . . . . . . . . . . . . . . . 5-45
Cleaning the Roller Cage Shaft . . . . . . . . . . . . . . . . . . . . . . . . . . . 5-46
Installing the New Roller Cage . . . . . . . . . . . . . . . . . . . . . . . . . . . . 5-46
Replacing the System Fuses . . . . . . . . . . . . . . . . . . . . . . . . . . 5-47
Relocating the System . . . . . . . . . . . . . . . . . . . . . . . . . . . 5-49
Shipping or Storing the System . . . . . . . . . . . . . . . . . . . 5-50
Cleaning the Sample Path . . . . . . . . . . . . . . . . . . . . . . . . . . . . 5-50
Removing the Cartridges . . . . . . . . . . . . . . . . . . . . . . . . . . . . . 5-50
Cleaning and Drying the Tubing . . . . . . . . . . . . . . . . . . . . . . . . 5-51
Flushing the Tubing for the RCx Reagent . . . . . . . . . . . . . . . . . . . 5-51
Flushing the Upper Connector . . . . . . . . . . . . . . . . . . . . . . . . . . . . 5-52
Flushing the Lower Connector . . . . . . . . . . . . . . . . . . . . . . . . . . . . 5-53
Flushing the Tubing for the Samples . . . . . . . . . . . . . . . . . . . . . . . 5-54
Flushing the Tubing for the Measurement Module . . . . . . . . . . . . . 5-55
Flushing the Tubing for the Measurement Module Waste . . . . . . . 5-56
Flushing the Tubing for the AutomaticQC Module . . . . . . . . . . . . . 5-57
Flushing the Reagent Manifold Tubing . . . . . . . . . . . . . . . . . . . . . 5-58
02087462 Rev. V
Page 13

Rapidlab 1200 Operator’s Guide: Contents xi
Flushing the CO-ox Pump Tubing . . . . . . . . . . . . . . . . . . . . . . . . .5-59
Removing and Storing the Sensors . . . . . . . . . . . . . . . . . . . . . 5-60
Removing Peripherals and Disinfecting the Exterior Surfaces . 5-60
Shutting Down and Packing the System. . . . . . . . . . . . . . . . . . 5-60
Scheduling Maintenance Activities . . . . . . . . . . . . . . . . 5-61
Performing Scheduled Maintenance Tasks . . . . . . . . . . . . . . . 5-61
Maintenance Task Grace Period . . . . . . . . . . . . . . . . . . . . . . . . . . .5-62
Marking Maintenance Tasks Complete . . . . . . . . . . . . . . . . . . . . . .5-62
Undoing the Completed Marker. . . . . . . . . . . . . . . . . . . . . . . . . . . .5-62
Viewing Maintenance Task Details . . . . . . . . . . . . . . . . . . . . . . 5-63
Change System Time for Daylight Saving Time. . . . . . . . . . . . 5-63
6 Troubleshooting
Troubleshooting Failed or Missed QC Analysis . . . . . . . 6-1
Troubleshooting the Yellow Parameter Error . . . . . . . . . . . . . . . 6-1
Troubleshooting the Purple Parameter Error . . . . . . . . . . . . . . . 6-3
Troubleshooting the Ampule QC. . . . . . . . . . . . . . . . . . . . . . . . . 6-3
Troubleshooting Failed Calibrations . . . . . . . . . . . . . . . . 6-4
Troubleshooting Checklist for Failed Calibration . . . . . . . . . . . .6-4
Using the Calibration Report to Identify Problems . . . . . . . . . . . 6-5
Troubleshooting Patient Results . . . . . . . . . . . . . . . . . . . 6-6
Troubleshooting Unavailable Buttons . . . . . . . . . . . . . . . 6-7
Troubleshooting Measurement Module Lights . . . . . . . . 6-8
Troubleshooting Barcode Problems . . . . . . . . . . . . . . . . 6-8
Barcode Quality . . . . . . . . . . . . . . . . . . . . . . . . . . . . . . . . . . . . . 6-8
Resetting the Barcode Scanner . . . . . . . . . . . . . . . . . . . . . . . . . 6-9
Troubleshooting Internal Printer Problems. . . . . . . . . . 6-11
Troubleshooting Touchscreen Problems . . . . . . . . . . . 6-11
Solving Communication Problems . . . . . . . . . . . . . . . . 6-12
Clearing the Clot from the Reagent Manifold . . . . . . . . . . . . . . 6-13
Clearing the Clot from the Preheater . . . . . . . . . . . . . . . . . . . . 6-17
Clearing the Clot from the Reagent Cartridge . . . . . . . . . . . . . 6-22
Removing Clots Using the Clot-Removal Line . . . . . . . . . . . . . 6-24
Inspecting the Sample Path . . . . . . . . . . . . . . . . . . . . . . . . . . .6-24
Reinstalling the Sensors. . . . . . . . . . . . . . . . . . . . . . . . . . . . . . 6-30
Completing the Inspection Procedure. . . . . . . . . . . . . . . . . . . . 6-30
Removing Obstructions from the CO-ox Sample Path 6-31
Using Diagnostics . . . . . . . . . . . . . . . . . . . . . . . . . . . . . . 6-33
Copying Diagnostic Data . . . . . . . . . . . . . . . . . . . . . . . . . . . . . 6-34
02087462 Rev. V
Page 14

xii Rapidlab 1200 Operator’s Guide: Contents
Using the Diagnostics Screen . . . . . . . . . . . . . . . . . . . . . . . . . 6-34
Performing Tests and Printing Diagnostic Reports. . . . . . . . . . . . . 6-34
Performing the Waste Detector Calibration . . . . . . . . . . . . . . . . . . 6-35
Calibrating the Touchscreen. . . . . . . . . . . . . . . . . . . . . . . . . . . . . . 6-35
Using the Fluidic Functions Screen . . . . . . . . . . . . . . . . . . . . . 6-36
Performing the Reagent Flow Tests . . . . . . . . . . . . . . . . . . . . . . . . 6-36
Priming the AQC Cartridge . . . . . . . . . . . . . . . . . . . . . . . . . . . . . . . 6-37
Performing the Leak Test . . . . . . . . . . . . . . . . . . . . . . . . . . . . . . . . 6-37
Using the Pumps and Valves Screen . . . . . . . . . . . . . . . . . . . . 6-38
Performing the Sample Pump and Wash Pump Tests . . . . . . . . . . 6-39
Performing the R Cartridge Valve Test. . . . . . . . . . . . . . . . . . . . . . 6-40
Performing the AQC Valve Test . . . . . . . . . . . . . . . . . . . . . . . . . . . 6-41
Performing the Measurement Module Pinch Valve Test . . . . . . . . 6-41
Performing the CO-ox Pump Test . . . . . . . . . . . . . . . . . . . . . . . . . 6-42
Using the Cartridges Screen . . . . . . . . . . . . . . . . . . . . . . . . . . 6-42
Ejecting the Wash or Reagent Cartridge . . . . . . . . . . . . . . . . . . . . 6-43
Ejecting the AutomaticQC Cartridge. . . . . . . . . . . . . . . . . . . . . . . . 6-43
Using the Sensors Screen . . . . . . . . . . . . . . . . . . . . . . . . . . . . 6-44
Using the CO-ox Screen. . . . . . . . . . . . . . . . . . . . . . . . . . . . . . 6-45
Performing the Lamp Calibration Test . . . . . . . . . . . . . . . . . . . . . . 6-45
Performing the Wavelength Cal Test . . . . . . . . . . . . . . . . . . . . . . . 6-46
Performing the CO-ox Sample Chamber Test . . . . . . . . . . . . . . . . 6-46
Performing the Lamp On/Off Test. . . . . . . . . . . . . . . . . . . . . . . . . . 6-47
D Codes . . . . . . . . . . . . . . . . . . . . . . . . . . . . . . . . . . . . . . . 6-47
D2 Codes . . . . . . . . . . . . . . . . . . . . . . . . . . . . . . . . . . . . . . . . . 6-48
D2 Excessive Drift: pO2 pCO2. . . . . . . . . . . . . . . . . . . . . . . . . . . . 6-48
D2 Excessive Drift: Na
D2 Excessive Drift: Glu Lac . . . . . . . . . . . . . . . . . . . . . . . . . . . . . . 6-50
D2 Excessive Drift: tHb. . . . . . . . . . . . . . . . . . . . . . . . . . . . . . . . . . 6-50
D3 Codes . . . . . . . . . . . . . . . . . . . . . . . . . . . . . . . . . . . . . . . . . 6-51
D3 Slope Error: pO
D3 Slope Error: pH Na
D3 Slope Error: Glu Lac. . . . . . . . . . . . . . . . . . . . . . . . . . . . . . . . . 6-52
D3 Slope Error: tHb . . . . . . . . . . . . . . . . . . . . . . . . . . . . . . . . . . . . 6-52
D4 Codes . . . . . . . . . . . . . . . . . . . . . . . . . . . . . . . . . . . . . . . . . 6-53
D4 Offset Error: pO2 pCO2 . . . . . . . . . . . . . . . . . . . . . . . . . . . . . . 6-53
D4 Offset Error: pH Na
D4 Offset Error: Glu Lac . . . . . . . . . . . . . . . . . . . . . . . . . . . . . . . . 6-54
D5 Codes . . . . . . . . . . . . . . . . . . . . . . . . . . . . . . . . . . . . . . . . . 6-54
D5 No Endpoint: Ca++ . . . . . . . . . . . . . . . . . . . . . . . . . . . . . . . . . . 6-54
D5 No Endpoint: Glu Lac . . . . . . . . . . . . . . . . . . . . . . . . . . . . . . . . 6-55
D6 Codes . . . . . . . . . . . . . . . . . . . . . . . . . . . . . . . . . . . . . . . . . 6-56
D6 Excessive Noise: pO2 pCO2 . . . . . . . . . . . . . . . . . . . . . . . . . . 6-56
D6 Excessive Noise: pH Na
+ K+
Ca++ Cl¯ . . . . . . . . . . . . . . . . . . . . . . . 6-49
pCO2. . . . . . . . . . . . . . . . . . . . . . . . . . . . . . . 6-51
2
+ K+
Ca++ Cl¯ Ref . . . . . . . . . . . . . . . . . . . 6-51
+ K+
Ca++ Cl¯ . . . . . . . . . . . . . . . . . . . . . . 6-53
+ K+
Ca++ Cl¯. . . . . . . . . . . . . . . . . . . 6-57
02087462 Rev. V
Page 15

Rapidlab 1200 Operator’s Guide: Contents xiii
D6 Excessive Noise: Glu Lac . . . . . . . . . . . . . . . . . . . . . . . . . . . . .6-57
D8–D22 Codes . . . . . . . . . . . . . . . . . . . . . . . . . . . . . . . . . . . . . 6-58
D8 pO2 R Cartridge Error . . . . . . . . . . . . . . . . . . . . . . . . . . . . . . . .6-58
D14 No Sample Detected at FD2 . . . . . . . . . . . . . . . . . . . . . . . . . .6-58
D19 Fluid Detector Error: 1, 2, 3 . . . . . . . . . . . . . . . . . . . . . . . . . . .6-58
D20 Pressure Signal Out of Range . . . . . . . . . . . . . . . . . . . . . . . . .6-59
D21 Processing Error . . . . . . . . . . . . . . . . . . . . . . . . . . . . . . . . . . .6-59
D22 Barometric Pressure Error . . . . . . . . . . . . . . . . . . . . . . . . . . . .6-59
D23 Codes . . . . . . . . . . . . . . . . . . . . . . . . . . . . . . . . . . . . . . . .6-60
D23 Reagent Flow Error: 2, 10 . . . . . . . . . . . . . . . . . . . . . . . . . . . .6-60
D23 Reagent Flow Error: 3, 11 . . . . . . . . . . . . . . . . . . . . . . . . . . . .6-60
D23 Reagent Flow Error: 4, 12 . . . . . . . . . . . . . . . . . . . . . . . . . . . .6-61
D23 Reagent Flow Error: 5, 13 . . . . . . . . . . . . . . . . . . . . . . . . . . . .6-61
D23 Reagent Flow Error: 6 . . . . . . . . . . . . . . . . . . . . . . . . . . . . . . .6-62
D23 Reagent Flow Error: 7, 8 . . . . . . . . . . . . . . . . . . . . . . . . . . . . .6-62
D23 Reagent Flow Error: 14 . . . . . . . . . . . . . . . . . . . . . . . . . . . . . .6-63
D24 Codes . . . . . . . . . . . . . . . . . . . . . . . . . . . . . . . . . . . . . . . .6-63
D24 AQC Material Error: 1, 2, 3. . . . . . . . . . . . . . . . . . . . . . . . . . . .6-63
D32 Codes . . . . . . . . . . . . . . . . . . . . . . . . . . . . . . . . . . . . . . . .6-63
D32 AQC Cartridge Valve Error: 1. . . . . . . . . . . . . . . . . . . . . . . . . .6-63
D32 AQC Cartridge Valve Error: 2. . . . . . . . . . . . . . . . . . . . . . . . . .6-64
D33 Codes . . . . . . . . . . . . . . . . . . . . . . . . . . . . . . . . . . . . . . . .6-64
D33 R Cartridge Valve Error . . . . . . . . . . . . . . . . . . . . . . . . . . . . . .6-64
D34 Codes . . . . . . . . . . . . . . . . . . . . . . . . . . . . . . . . . . . . . . . .6-64
D34 Waste Detector Cal Error: 1 . . . . . . . . . . . . . . . . . . . . . . . . . . .6-64
D34 Waste Detector Cal Error: 2, 3 . . . . . . . . . . . . . . . . . . . . . . . . .6-64
D35 Codes . . . . . . . . . . . . . . . . . . . . . . . . . . . . . . . . . . . . . . . .6-65
D35 Electronics Error: 1-3, 7-12 . . . . . . . . . . . . . . . . . . . . . . . . . . .6-65
D35 Electronics Error: 4. . . . . . . . . . . . . . . . . . . . . . . . . . . . . . . . . .6-65
D35 Electronics Error: 13. . . . . . . . . . . . . . . . . . . . . . . . . . . . . . . . .6-65
D36 Codes . . . . . . . . . . . . . . . . . . . . . . . . . . . . . . . . . . . . . . . .6-65
D36 Cartridge Loading Error . . . . . . . . . . . . . . . . . . . . . . . . . . . . . .6-65
D37 Codes . . . . . . . . . . . . . . . . . . . . . . . . . . . . . . . . . . . . . . . .6-66
D37 Cartridge Eject Error: 1 . . . . . . . . . . . . . . . . . . . . . . . . . . . . . .6-66
D37 Cartridge Eject Error: 2, 3 . . . . . . . . . . . . . . . . . . . . . . . . . . . .6-66
D38–D60 Codes . . . . . . . . . . . . . . . . . . . . . . . . . . . . . . . . . . . . 6-66
D38 Temp Error: 1-12 . . . . . . . . . . . . . . . . . . . . . . . . . . . . . . . . . . .6-66
D39 Obstruction. . . . . . . . . . . . . . . . . . . . . . . . . . . . . . . . . . . . . . . .6-67
D40 W Cartridge Prime Error: 1, 2. . . . . . . . . . . . . . . . . . . . . . . . . .6-67
D41 AQC Cartridge Prime Error: 1, 2, 3 . . . . . . . . . . . . . . . . . . . . .6-68
D42 R Cartridge Prime Error: 1, 2 . . . . . . . . . . . . . . . . . . . . . . . . . .6-68
D50 Glucose Sensor Error. . . . . . . . . . . . . . . . . . . . . . . . . . . . . . . .6-69
D51 Lactate Sensor Error . . . . . . . . . . . . . . . . . . . . . . . . . . . . . . . .6-70
D60 Communications Error: 1, 2 . . . . . . . . . . . . . . . . . . . . . . . . . . .6-70
02087462 Rev. V
Page 16

xiv Rapidlab 1200 Operator’s Guide: Contents
D70 Codes . . . . . . . . . . . . . . . . . . . . . . . . . . . . . . . . . . . . . . . . 6-70
D70 Optics Error: 2 . . . . . . . . . . . . . . . . . . . . . . . . . . . . . . . . . . . . . 6-70
D70 Optics Error: 3, 4, 7 . . . . . . . . . . . . . . . . . . . . . . . . . . . . . . . . . 6-70
D70 Optics Error: 9 . . . . . . . . . . . . . . . . . . . . . . . . . . . . . . . . . . . . . 6-71
D70 Optics Error: 11, 12 . . . . . . . . . . . . . . . . . . . . . . . . . . . . . . . . . 6-71
D71–D77 Codes. . . . . . . . . . . . . . . . . . . . . . . . . . . . . . . . . . . . 6-71
D71 No Sample Detected at FD3 . . . . . . . . . . . . . . . . . . . . . . . . . . 6-71
D73 CO-ox Chamber Position Error . . . . . . . . . . . . . . . . . . . . . . . . 6-72
D75 Lamp Failure . . . . . . . . . . . . . . . . . . . . . . . . . . . . . . . . . . . . . . 6-72
D76 CO-ox Electronics Error: 1-10 . . . . . . . . . . . . . . . . . . . . . . . . . 6-72
D77 CO-ox Temp Error: 1, 2, 3, 4. . . . . . . . . . . . . . . . . . . . . . . . . . 6-72
D78 Codes . . . . . . . . . . . . . . . . . . . . . . . . . . . . . . . . . . . . . . . . 6-73
D78 No Reagent Detected at CO-ox: 1 . . . . . . . . . . . . . . . . . . . . . 6-73
D78 No Reagent Detected at CO-ox: 2, 3 . . . . . . . . . . . . . . . . . . . 6-73
D78 No Reagent Detected at CO-ox: 4 . . . . . . . . . . . . . . . . . . . . . 6-74
Viewing System Messages . . . . . . . . . . . . . . . . . . . . . . . 6-74
7 File Management
File Names and Formats . . . . . . . . . . . . . . . . . . . . . . . . . . 7-1
Copying Data Files . . . . . . . . . . . . . . . . . . . . . . . . . . . . . . . 7-2
Copying Patient, QC, or Calibration Data Files . . . . . . . . . . . . . 7-3
Copying Diagnostic Data . . . . . . . . . . . . . . . . . . . . . . . . . . . . . . 7-3
Viewing the Sample Totals . . . . . . . . . . . . . . . . . . . . . . . . 7-4
8 System Configuration
Using the Setup Menu . . . . . . . . . . . . . . . . . . . . . . . . . . . . 8-1
Setting up QC . . . . . . . . . . . . . . . . . . . . . . . . . . . . . . . . . . . 8-2
Setting Up QC Options. . . . . . . . . . . . . . . . . . . . . . . . . . . . . . . . 8-2
Entering Customized QC Range Limits . . . . . . . . . . . . . . . . . . . . . . 8-3
Setting Up Required QC. . . . . . . . . . . . . . . . . . . . . . . . . . . . . . . 8-3
Setting up Required QC Ranges . . . . . . . . . . . . . . . . . . . . . . . . 8-4
Editing Required QC Ranges . . . . . . . . . . . . . . . . . . . . . . . . . . . . . . 8-5
Setting up AutomaticQC Schedule. . . . . . . . . . . . . . . . . . . . . . . 8-5
Setting up AutomaticQC Ranges . . . . . . . . . . . . . . . . . . . . . . . . 8-6
Setting up High G/L QC Options . . . . . . . . . . . . . . . . . . . . . . . . 8-6
02087462 Rev. V
Setting up Sample Information . . . . . . . . . . . . . . . . . . . . . 8-7
Defining Patient Ranges. . . . . . . . . . . . . . . . . . . . . . . . . . . . . . . 8-7
Using Default Ranges. . . . . . . . . . . . . . . . . . . . . . . . . . . . . . . . . . . . 8-7
Setting up Patient Demographics or Sample Demographics . . . 8-9
Using Patient and Sample Demographics . . . . . . . . . . . . . . . . . . . . 8-9
Page 17

Rapidlab 1200 Operator’s Guide: Contents xv
Defining Patient Demographics . . . . . . . . . . . . . . . . . . . . . . . . . . . .8-10
Defining Sample Demographics . . . . . . . . . . . . . . . . . . . . . . . . . . .8-10
Setting up Parameter Selection at Analysis . . . . . . . . . . . . . . . 8-10
Enabling Parameter Selection at Analysis . . . . . . . . . . . . . . . . . . . .8-11
Defining Custom Panels . . . . . . . . . . . . . . . . . . . . . . . . . . . . . . . . .8-11
Setting up Sample Types . . . . . . . . . . . . . . . . . . . . . . . . . . . . . 8-13
Setting up Parameters. . . . . . . . . . . . . . . . . . . . . . . . . . . 8-13
Using the Parameters On/Off Screen. . . . . . . . . . . . . . . . . . . . 8-13
Specific Parameter Guidelines . . . . . . . . . . . . . . . . . . . . . . . . . . . .8-14
Setting Parameters On or Off . . . . . . . . . . . . . . . . . . . . . . . . . . . . .8-15
Setting up Parameter Units. . . . . . . . . . . . . . . . . . . . . . . . . . . . 8-15
Setting up Demographic Units . . . . . . . . . . . . . . . . . . . . . . . . . 8-15
Default and Alternate Units of Measure . . . . . . . . . . . . . . . . . . . . . .8-16
Required Parameters and Sample Demographics . . . . . . . . . . . . .8-17
Setting up Values . . . . . . . . . . . . . . . . . . . . . . . . . . . . . . . . . . . 8-19
Setting up System Options . . . . . . . . . . . . . . . . . . . . . . . 8-19
Setting up Country Options. . . . . . . . . . . . . . . . . . . . . . . . . . . . 8-19
Selecting a Language . . . . . . . . . . . . . . . . . . . . . . . . . . . . . . . . . . .8-20
Selecting the Date Format . . . . . . . . . . . . . . . . . . . . . . . . . . . . . . . .8-20
Setting up the Date and Time. . . . . . . . . . . . . . . . . . . . . . . . . . 8-20
Setting up the Sound . . . . . . . . . . . . . . . . . . . . . . . . . . . . . . . . 8-21
Setting up Other Options . . . . . . . . . . . . . . . . . . . . . . . . . . . . . 8-21
Setting up Printer and Devices Options . . . . . . . . . . . . 8-22
Selecting Printer Options . . . . . . . . . . . . . . . . . . . . . . . . . . . . . 8-22
Setting up Barcode Options . . . . . . . . . . . . . . . . . . . . . . . . . . .8-23
Selecting the Barcode Only Option for Patient ID Entry . . . . . . . . .8-25
Setting up the Barcode Scanner . . . . . . . . . . . . . . . . . . . . . . . . . . .8-25
Connecting the Barcode Scanner . . . . . . . . . . . . . . . . . . . . . . . . . .8-26
Setting up Communications . . . . . . . . . . . . . . . . . . . . . . . . . . .8-26
Defining Send System Data Option . . . . . . . . . . . . . . . . . . . . . . . . .8-26
Connecting to a Rapidlink
Connecting to a CompleNet
Entering IP Addresses . . . . . . . . . . . . . . . . . . . . . . . . . . . . . . . . . . .8-29
Using DHCP . . . . . . . . . . . . . . . . . . . . . . . . . . . . . . . . . . . . . . . . . .8-30
Selecting sO2 as a Measured or Calculated Value
for LIS Transmission (LIS only) . . . . . . . . . . . . . . . . . . . . . . . . . . . .8-30
®
or Rapidcomm® System . . . . . . . . . . .8-27
®
Network Connection . . . . . . . . . . . . .8-28
Connecting to a Laboratory Information System . . . . . . . . . . . 8-30
Setting up Auto Send Options . . . . . . . . . . . . . . . . . . . . . . . . . . . . .8-32
Setting Up Remote Viewing (Rapidcomm Only) . . . . . . . . . . . . . . .8-32
Setting up Secured Options . . . . . . . . . . . . . . . . . . . . . . 8-35
Setting up System Access . . . . . . . . . . . . . . . . . . . . . . . . . . . . 8-35
Setting up Operator Security Levels. . . . . . . . . . . . . . . . . . . . . 8-35
Defining Operator IDs and Passwords . . . . . . . . . . . . . . . . . . . . . .8-37
02087462 Rev. V
Page 18

xvi Rapidlab 1200 Operator’s Guide: Contents
Setting Up Analysis Options. . . . . . . . . . . . . . . . . . . . . . . . . . . 8-38
Selecting the Save Demographics Option . . . . . . . . . . . . . . . . . . . 8-38
Selecting Demographics Editing. . . . . . . . . . . . . . . . . . . . . . . . . . . 8-39
Displaying Question Result. . . . . . . . . . . . . . . . . . . . . . . . . . . . . . . 8-39
Flagging Microsample Results . . . . . . . . . . . . . . . . . . . . . . . . . . . . 8-40
Defining Analytical Range Limits . . . . . . . . . . . . . . . . . . . . . . . . . . 8-40
Setting up Calibrations . . . . . . . . . . . . . . . . . . . . . . . . . . . . . . . 8-41
Setting up the Calibration Interval. . . . . . . . . . . . . . . . . . . . . . . . . . 8-41
Selecting the Calibration Pending Message. . . . . . . . . . . . . . . . . . 8-41
Saving and Restoring System Setup Data . . . . . . . . . . . . . . . . 8-41
Installing New System Software . . . . . . . . . . . . . . . . . . . . . . . . 8-42
Setting up Correlation Coefficients. . . . . . . . . . . . . . . . . . . . . . 8-44
Setting up Maintenance Functions . . . . . . . . . . . . . . . . . . . . . . 8-44
Setting up a Maintenance Schedule . . . . . . . . . . . . . . . . . . . . . . . . 8-44
Importing and Exporting Maintenance Activities. . . . . . . . . . . . . . . 8-46
Appendix A: Safety Instructions
Protecting Yourself from Biohazards . . . . . . . . . . . . . . . .A-1
References . . . . . . . . . . . . . . . . . . . . . . . . . . . . . . . . . . . . . . . . .A-2
Protecting Yourself from Barcode Scanner Lasers . . . .A-3
Protecting Yourself from Electrical Hazards . . . . . . . . . . A-3
Appendix B: Service, Ordering, and Warranty
Authorized Representative . . . . . . . . . . . . . . . . . . . . . . . .B-1
Limited Instrument Warranty and
Service Delivery Policy . . . . . . . . . . . . . . . . . . . . . . . . . . .B-1
Warranty Period . . . . . . . . . . . . . . . . . . . . . . . . . . . . . . . . . . . . .B-1
Additional Service Period . . . . . . . . . . . . . . . . . . . . . . . . . . . . . .B-2
Service During Normal Hours. . . . . . . . . . . . . . . . . . . . . . . . . . .B-2
Extent of a Service Call . . . . . . . . . . . . . . . . . . . . . . . . . . . . . . .B-2
Service Outside Normal Hours. . . . . . . . . . . . . . . . . . . . . . . . . .B-2
Replacement of Parts. . . . . . . . . . . . . . . . . . . . . . . . . . . . . . . . .B-3
Design Changes and Retrofitting of Instruments . . . . . . . . . . . .B-3
Key Operator Designation . . . . . . . . . . . . . . . . . . . . . . . . . . . . .B-3
OSHA Requirements (US only) . . . . . . . . . . . . . . . . . . . . . . . . . B-3
Warranty and Service Exclusions. . . . . . . . . . . . . . . . . . . . . . . .B-4
Copyright Information . . . . . . . . . . . . . . . . . . . . . . . . . . . . . . . . .B-5
GNU General Public License v.2 . . . . . . . . . . . . . . . . . . . . . . . . . . . B-5
Baptize V1.0 . . . . . . . . . . . . . . . . . . . . . . . . . . . . . . . . . . . . . . . . . . . B-6
BDM Download. . . . . . . . . . . . . . . . . . . . . . . . . . . . . . . . . . . . . . . . . B-7
Zip and Unzip . . . . . . . . . . . . . . . . . . . . . . . . . . . . . . . . . . . . . . . . . . B-8
02087462 Rev. V
Page 19

Rapidlab 1200 Operator’s Guide: Contents xvii
Contacts . . . . . . . . . . . . . . . . . . . . . . . . . . . . . . . . . . . . . . . B-9
Authorized Representative . . . . . . . . . . . . . . . . . . . . . . . . . . . . .B-9
Addresses. . . . . . . . . . . . . . . . . . . . . . . . . . . . . . . . . . . . . . . . . .B-9
Appendix C: System Fluids
Recommended Fill Volumes . . . . . . . . . . . . . . . . . . . . . . C-1
Rapidlab 1200 Cartridges . . . . . . . . . . . . . . . . . . . . . . . . . C-2
Appendix D: Supplies
Appendix E: System Specifications
Viewing Parameter Measurements. . . . . . . . . . . . . . . . . . E-1
Understanding System Limitations . . . . . . . . . . . . . . . . . E-5
Interference Testing. . . . . . . . . . . . . . . . . . . . . . . . . . . . . . E-6
Interference Testing for Rapidlab 1200 Sensors. . . . . . . . . . . . .E-6
Interference Testing for Rapidlab 1200 CO-oximetry . . . . . . . . .E-9
Interference Testing Results for tHb, FO
FMetHb, and FHHb. . . . . . . . . . . . . . . . . . . . . . . . . . . . . . . . . .E-10
Irenat (Sodium Perchlorate) Interference when
Measuring Ionized Calcium . . . . . . . . . . . . . . . . . . . . . . . . . . .E-10
Ethylene Glycol Interference when Measuring Lactate
and Glucose . . . . . . . . . . . . . . . . . . . . . . . . . . . . . . . . . . . . . . .E-11
Hb, FCOHb,
2
Performance Characteristics . . . . . . . . . . . . . . . . . . . . . E-11
Rapidlab 1240 System Performance Characteristics . . . . . . . . E-11
Precision on Controls . . . . . . . . . . . . . . . . . . . . . . . . . . . . . . . . . . E-11
Recovery and Precision of Blood Gases in Human Whole Blood . E-12
Method Comparison with Human Whole Blood Samples . . . . . . . E-17
Rapidlab 1245 System Performance Characteristics . . . . . . . .E-18
Precision on Controls . . . . . . . . . . . . . . . . . . . . . . . . . . . . . . . . . . E-18
Recovery and Precision of Blood Gases in Human Whole Blood . E-20
Recovery and Precision of Hemoglobin Fractions in
Human Whole Blood . . . . . . . . . . . . . . . . . . . . . . . . . . . . . . . . . . . E-25
Method Comparison with Human Whole Blood Samples . . . . . . . E-28
Rapidlab 1260 System Performance Characteristics . . . . . . . .E-30
Precision on Controls. . . . . . . . . . . . . . . . . . . . . . . . . . . . . . . . . . . E-30
Recovery and Precision in Human Whole Blood . . . . . . . . . . . . . . E-33
Method Comparison with Human Whole Blood Samples . . . . . . . E-46
Rapidlab 1265 System Performance Characteristics . . . . . . . .E-49
Precision on Controls. . . . . . . . . . . . . . . . . . . . . . . . . . . . . . . . . . . E-49
02087462 Rev. V
Page 20

xviii Rapidlab 1200 Operator’s Guide: Contents
Recovery and Precision of Blood Gases, Electrolytes,
and Metabolites in Human Whole Blood. . . . . . . . . . . . . . . . . . . . . E-52
Recovery and Precision of Hemoglobin Fractions in Human
Whole Blood . . . . . . . . . . . . . . . . . . . . . . . . . . . . . . . . . . . . . . . . . . E-66
Method Comparison with Human Whole Blood Samples. . . . . . . . E-68
Reference Methods. . . . . . . . . . . . . . . . . . . . . . . . . . . . . . E-72
Calibrator Traceability . . . . . . . . . . . . . . . . . . . . . . . . . . . E-73
References . . . . . . . . . . . . . . . . . . . . . . . . . . . . . . . . . . . . E-73
Appendix F: Symbols
Appendix G: Glossary
Appendix H: Rapidlab 1200 System Maintenance Checklist
Daily Maintenance . . . . . . . . . . . . . . . . . . . . . . . . . . . . . . .H-1
Twice Weekly Maintenance . . . . . . . . . . . . . . . . . . . . . . . . H-1
Weekly Maintenance. . . . . . . . . . . . . . . . . . . . . . . . . . . . . .H-1
Every 60 Days Maintenance. . . . . . . . . . . . . . . . . . . . . . . .H-2
Quarterly Maintenance . . . . . . . . . . . . . . . . . . . . . . . . . . . .H-2
Yearly Maintenance . . . . . . . . . . . . . . . . . . . . . . . . . . . . . . H-2
As Required Maintenance . . . . . . . . . . . . . . . . . . . . . . . . .H-2
Index
02087462 Rev. V
Page 21

1 System Overview and Intended Use
This section is an introduction to the Rapidlab 1200 system.
Intended Use
The Rapidlab 1200 systems are intended for in vitro diagnostic use by healthcare
professionals in the quantitative testing of human whole blood. The systems can
determine the following parameters:
System Parameters
1240 pH, pCO
1245 pH, pCO2, pO2, tHb, FO2Hb, FCOHb, FMetHb, FHHb
, pO
2
2
Features
1260
1265
pH, pCO
pH, pCO
FCOHb, FMetHb, FHHb
, pO2, Na+, K+, Ca++, Cl-, glucose, lactate
2
, pO2, Na+, K+, Ca++, Cl-, glucose, lactate, tHb, FO2Hb,
2
The Rapidlab 1200 systems have the following features:
• Compact design
• Self-contained reagent and wash cartridges that you can replace easily
• Automatic calibrations of the sensors
• Automatic sample aspiration that eliminates variability in sampling technique
• Automatic sampling for QC at customized intervals using the optional
AutomaticQC
®
cartridge
• High resolution touchscreen that tilts for viewing information and making
selections quickly and easily
• Built-in removable storage media to copy patient, QC, and calibration data for
storage, or for export to spreadsheet or database programs
• Communication ports for connecting to external data management systems,
such as the Rapidlink
®
or Rapidcomm® Data Management systems, or an LIS
(laboratory information system)
• Self-contained CO-oximetry sample chamber (Rapidlab 1245 and 1265
systems) that is easy to replace
• Optional external printer availability
02087462 Rev. V
Page 22
1-2 Rapidlab 1200 Operator’s Guide: System Overview and Intended Use
Hardware Overview
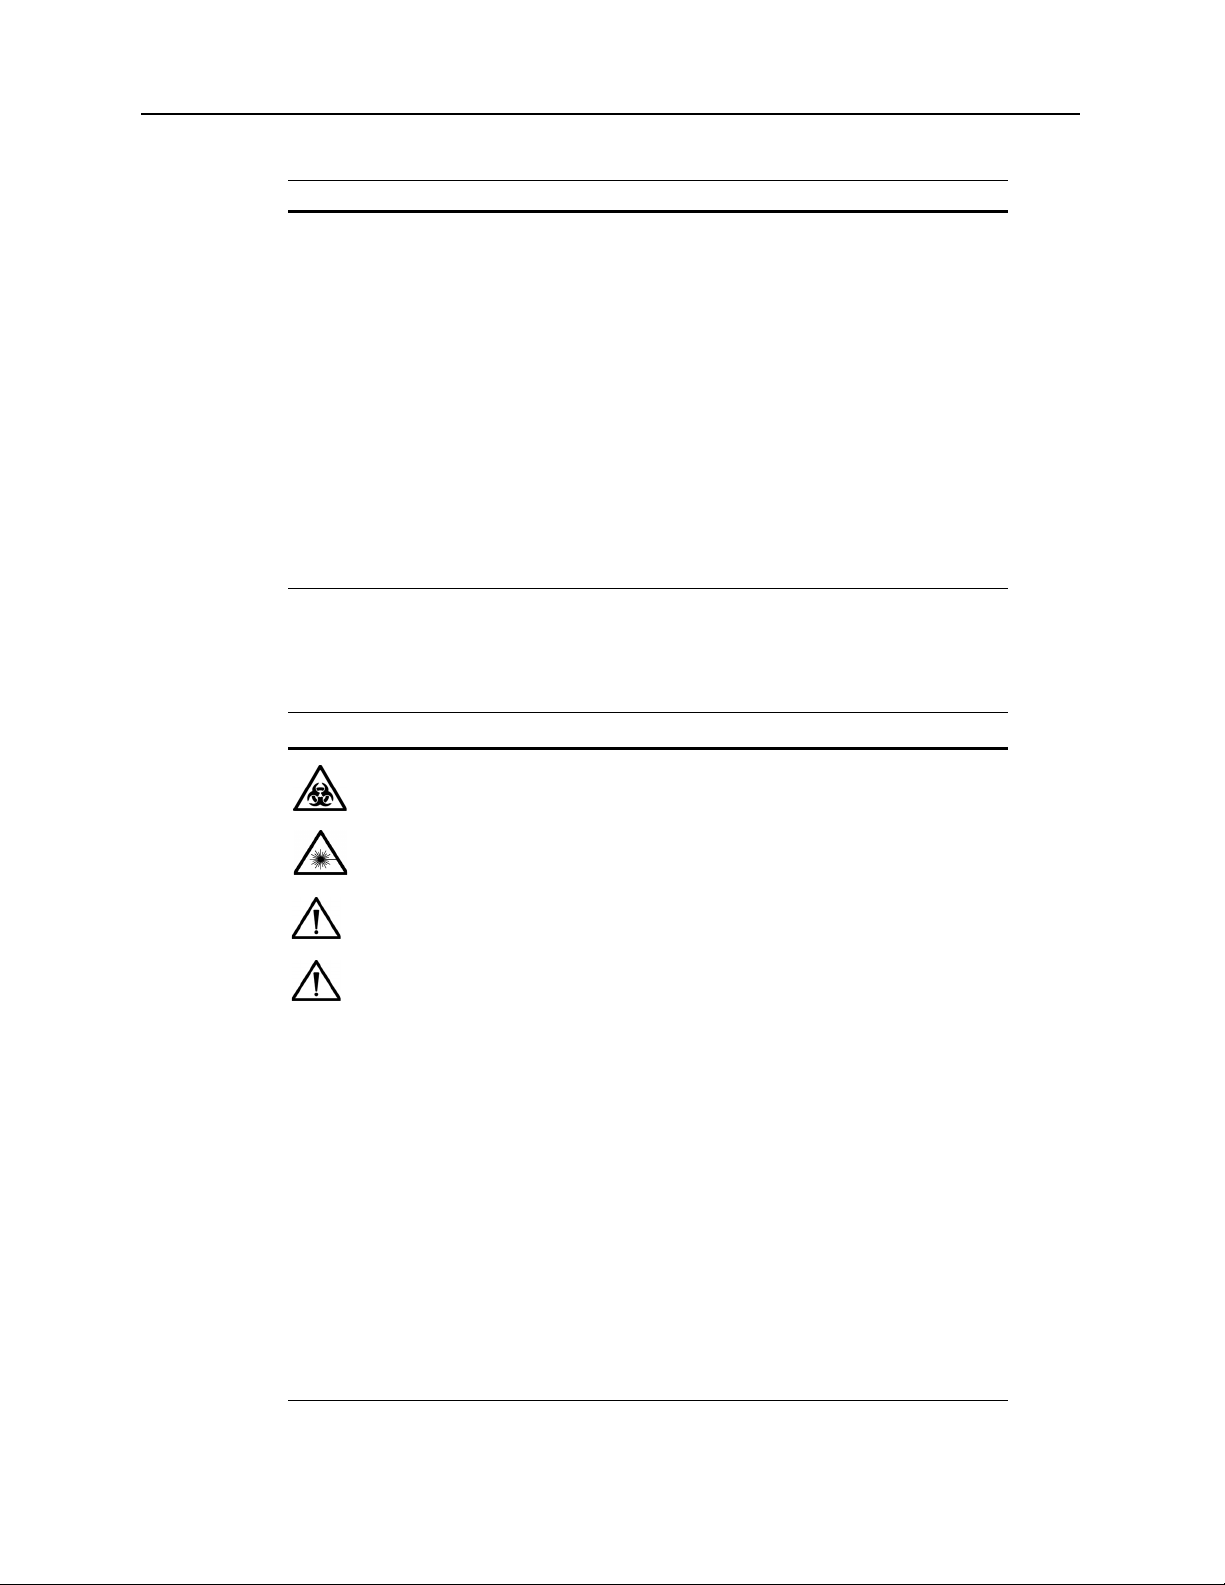
The Rapidlab 1200 system consists of 6 modules.
1 User interface module
2 AutomaticQC module (optional)
3 Waste module
4 Reagent module
5 Wash module
6 Measurement and CO-ox modules
Figure 1-1 Rapidlab 1200 System
02087462 Rev. V
Page 23
Rapidlab 1200 Operator’s Guide: System Overview and Intended Use 1-3
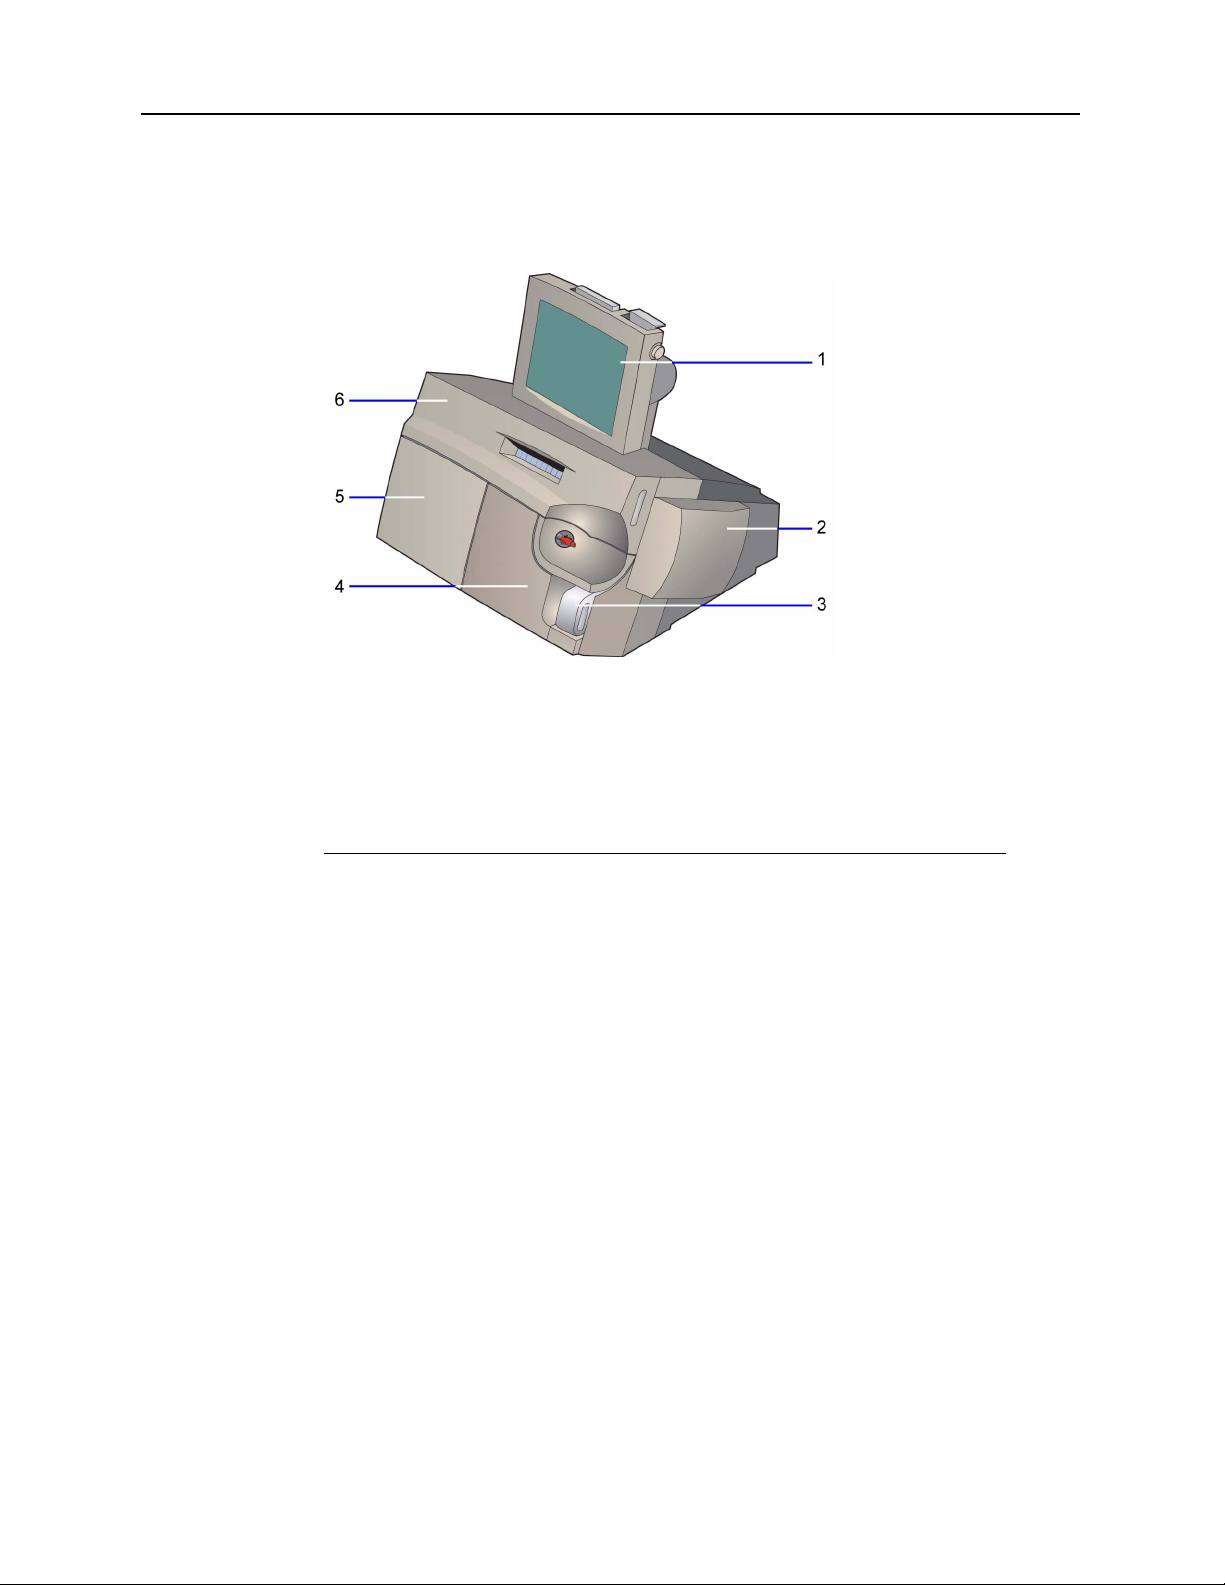
User Interface Module
You use the user interface to request sample analysis, to view and report results,
and to edit demographics. The user interface consists of the touchscreen, the
printer, the CD drive, and the optional barcode scanner.
The adjustable 10.4-inch monitor is easy to clean. You select items on the screen
to make selections and enter data.
1 Printer
2 Touchscreen
Figure 1-2 Rapidlab 1200 System–User Interface Module
The thermal roll printer prints reports for samples, calibrations, and diagnostics.
You can also install an external printer. Refer to Setting up Printer and Devices
Options‚ page 8-22.
02087462 Rev. V
Page 24
1-4 Rapidlab 1200 Operator’s Guide: System Overview and Intended Use
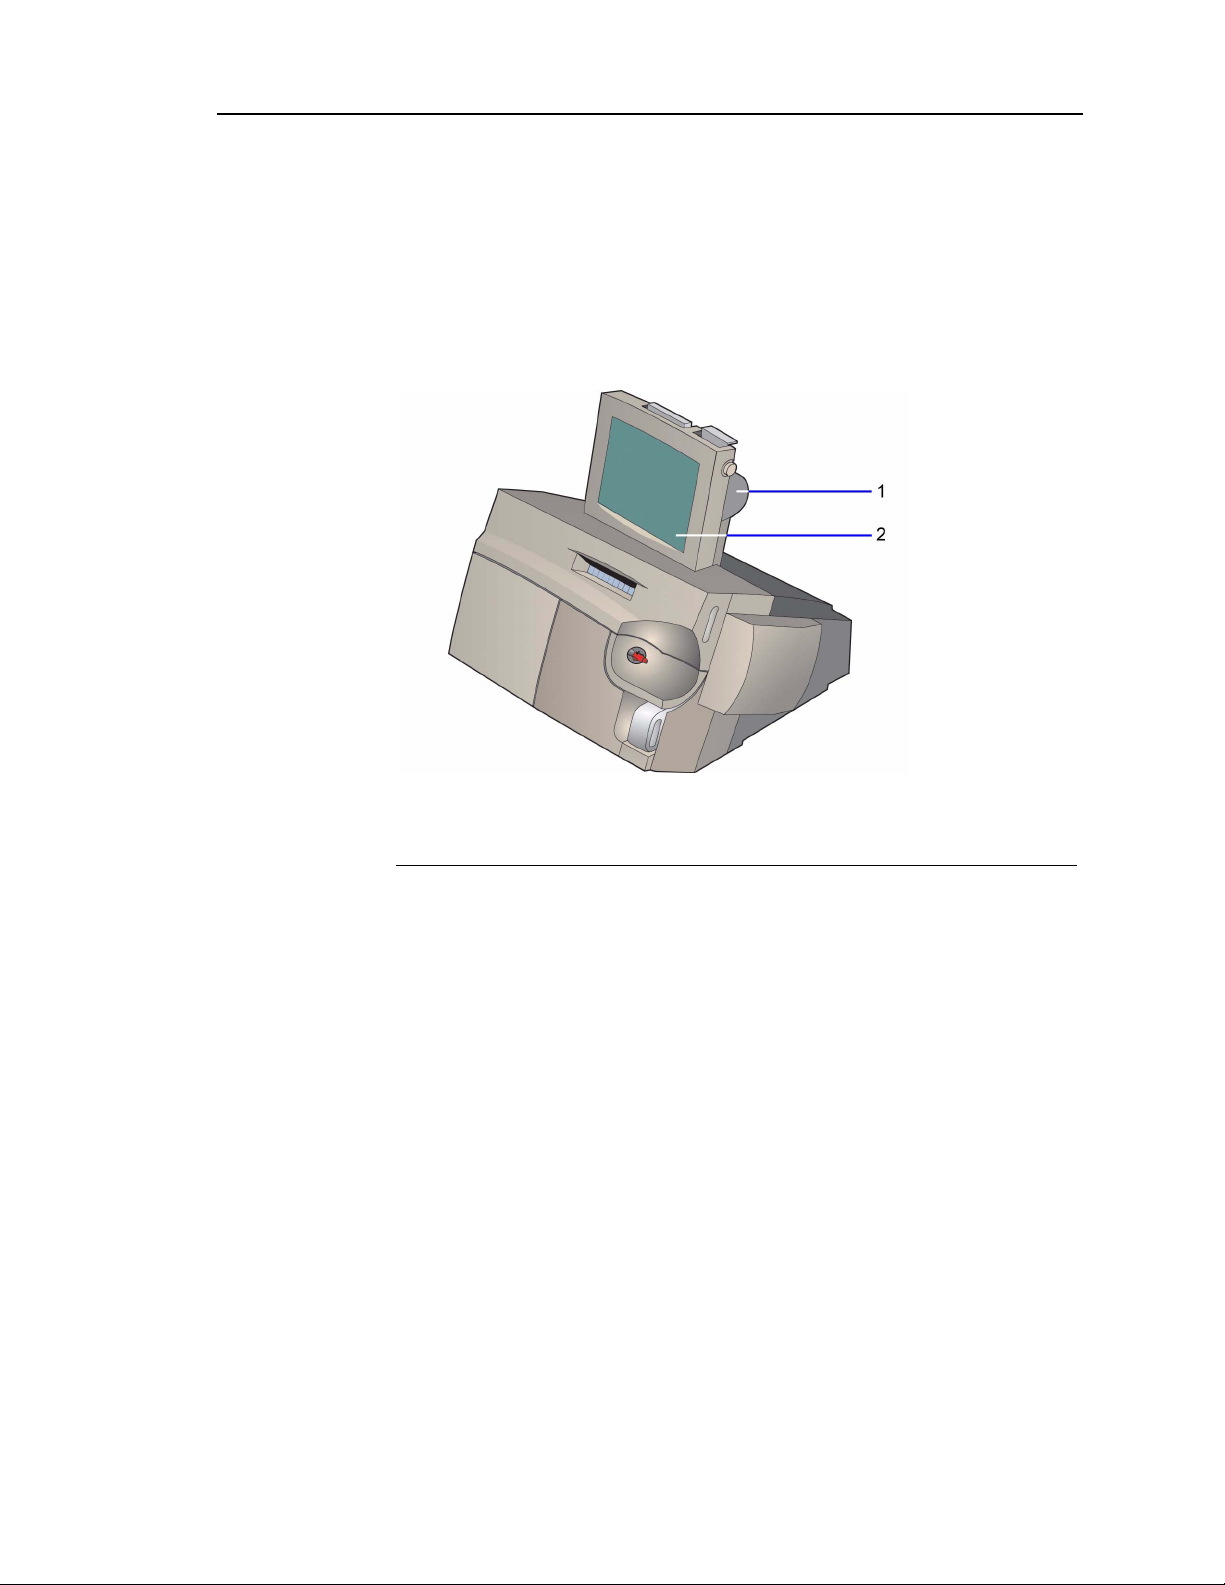
AutomaticQC Module
The optional AutomaticQC module allows the system to automatically analyze QC
materials. The system performs analysis of the AutomaticQC levels at pre-programmed
intervals. For information about programming the intervals, refer to
AutomaticQC Schedule‚ page 8-5.
Setting up
1 AutomaticQC cartridge
Figure 1-3 Rapidlab 1200 System with AutomaticQC Module
The AutomaticQC module consists of the following components:
• AutomaticQC cartridge
• AutomaticQC interface
AutomaticQC Cartridge
The AutomaticQC cartridge has bags containing 3 levels of quality control material used
for verification of performance at several points in the clinical range of the Rapidlab
Level Volume Contents
175 mL
2115 mL
3155 mL
Buffered bicarbonate solution with Na
dioxide, oxygen, nitrogen, dye, glucose, lactate, surfactant, and
preservative.
Buffered bicarbonate solution with Na
dioxide, oxygen, nitrogen, dye, glucose, lactate, surfactant, and
preservative.
Buffered bicarbonate solution with Na
dioxide, oxygen, nitrogen, dye, glucose, lactate, surfactant, and
preservative.
+
, K+, Ca++, Cl-, carbon
+
, K+, Ca++, Cl-, carbon
+
, K+, Ca++, Cl-, carbon
1200.
02087462 Rev. V
Page 25
Rapidlab 1200 Operator’s Guide: System Overview and Intended Use 1-5
The bracket on the AutomaticQC cartridge connects to the support bracket on the
side of the system. When the cartridge lever closes, it punctures the bags of QC
material. The connection to the reagent cartridge allows QC material to flow from
the AutomaticQC cartridge to the reagent cartridge.
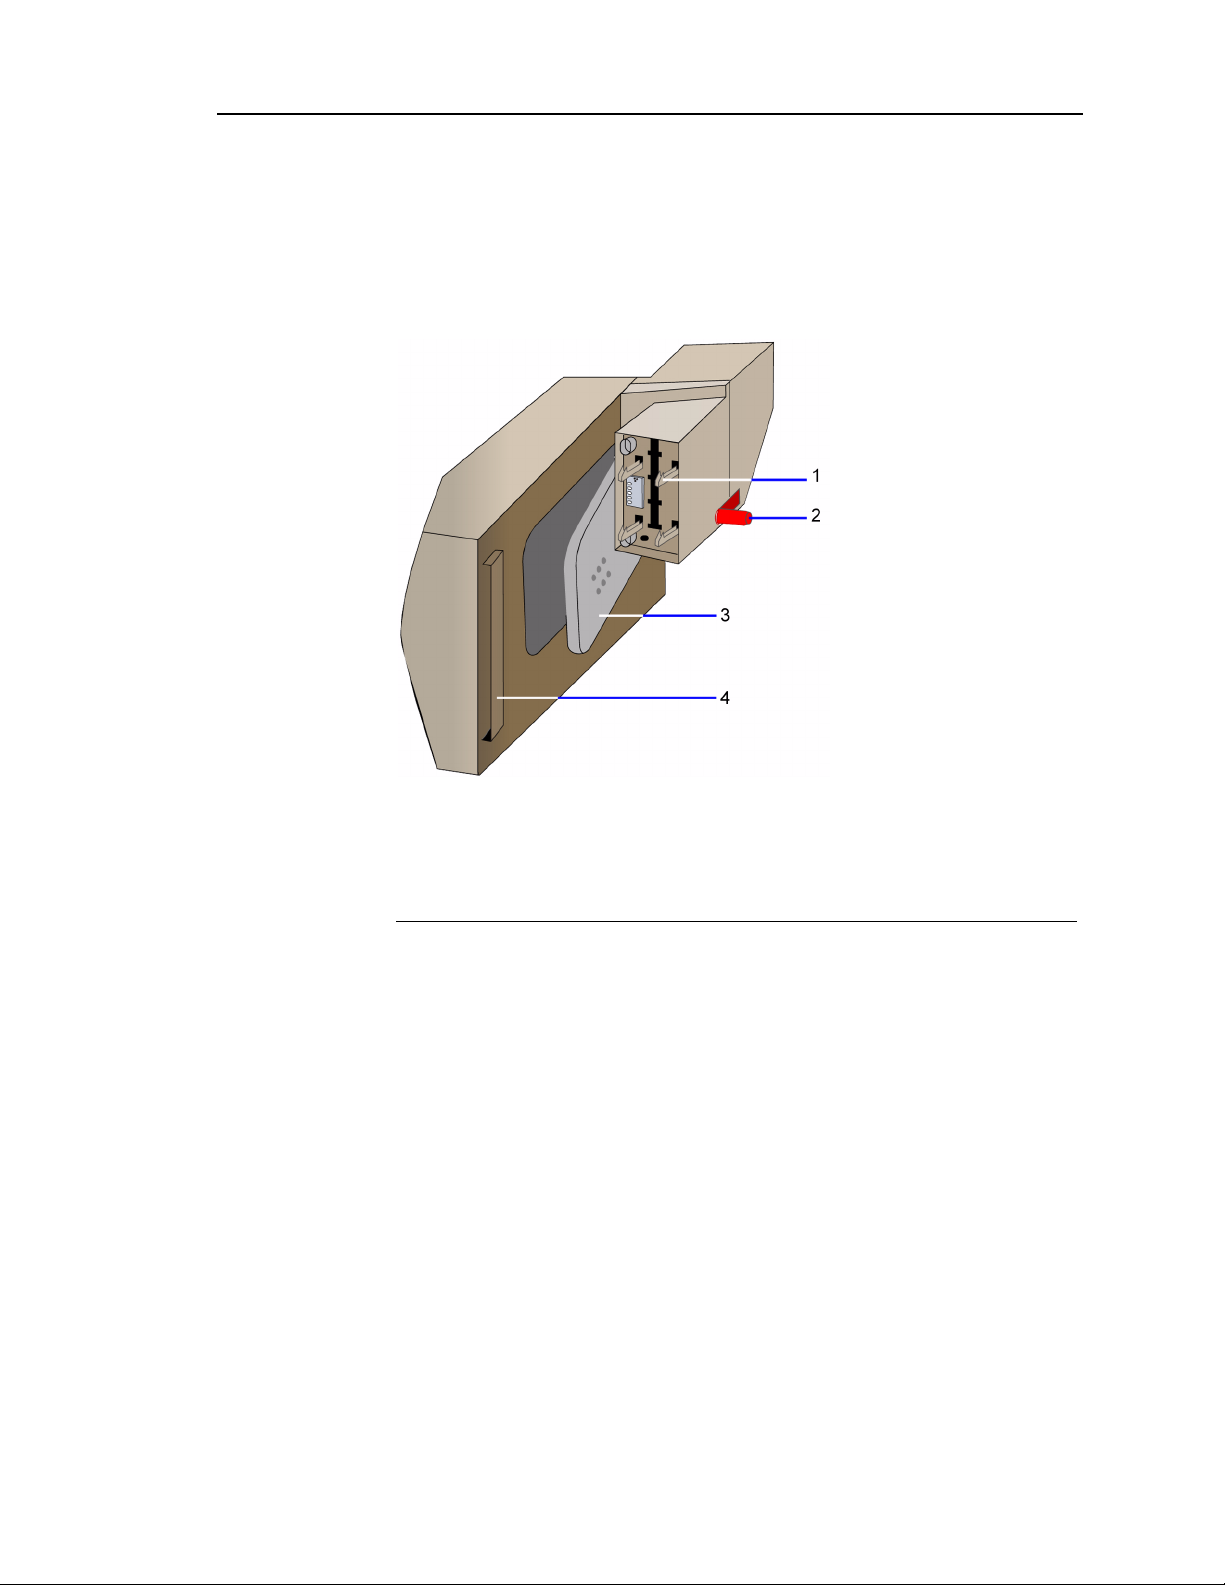
Refer to Figure 1-5 for the system interface connections.
1 Connectors to the latch assembly
2 Connector to the reagent cartridge
3 Cartridge lever
4 Bracket
Figure 1-4 AutomaticQC Cartridge
02087462 Rev. V
Page 26
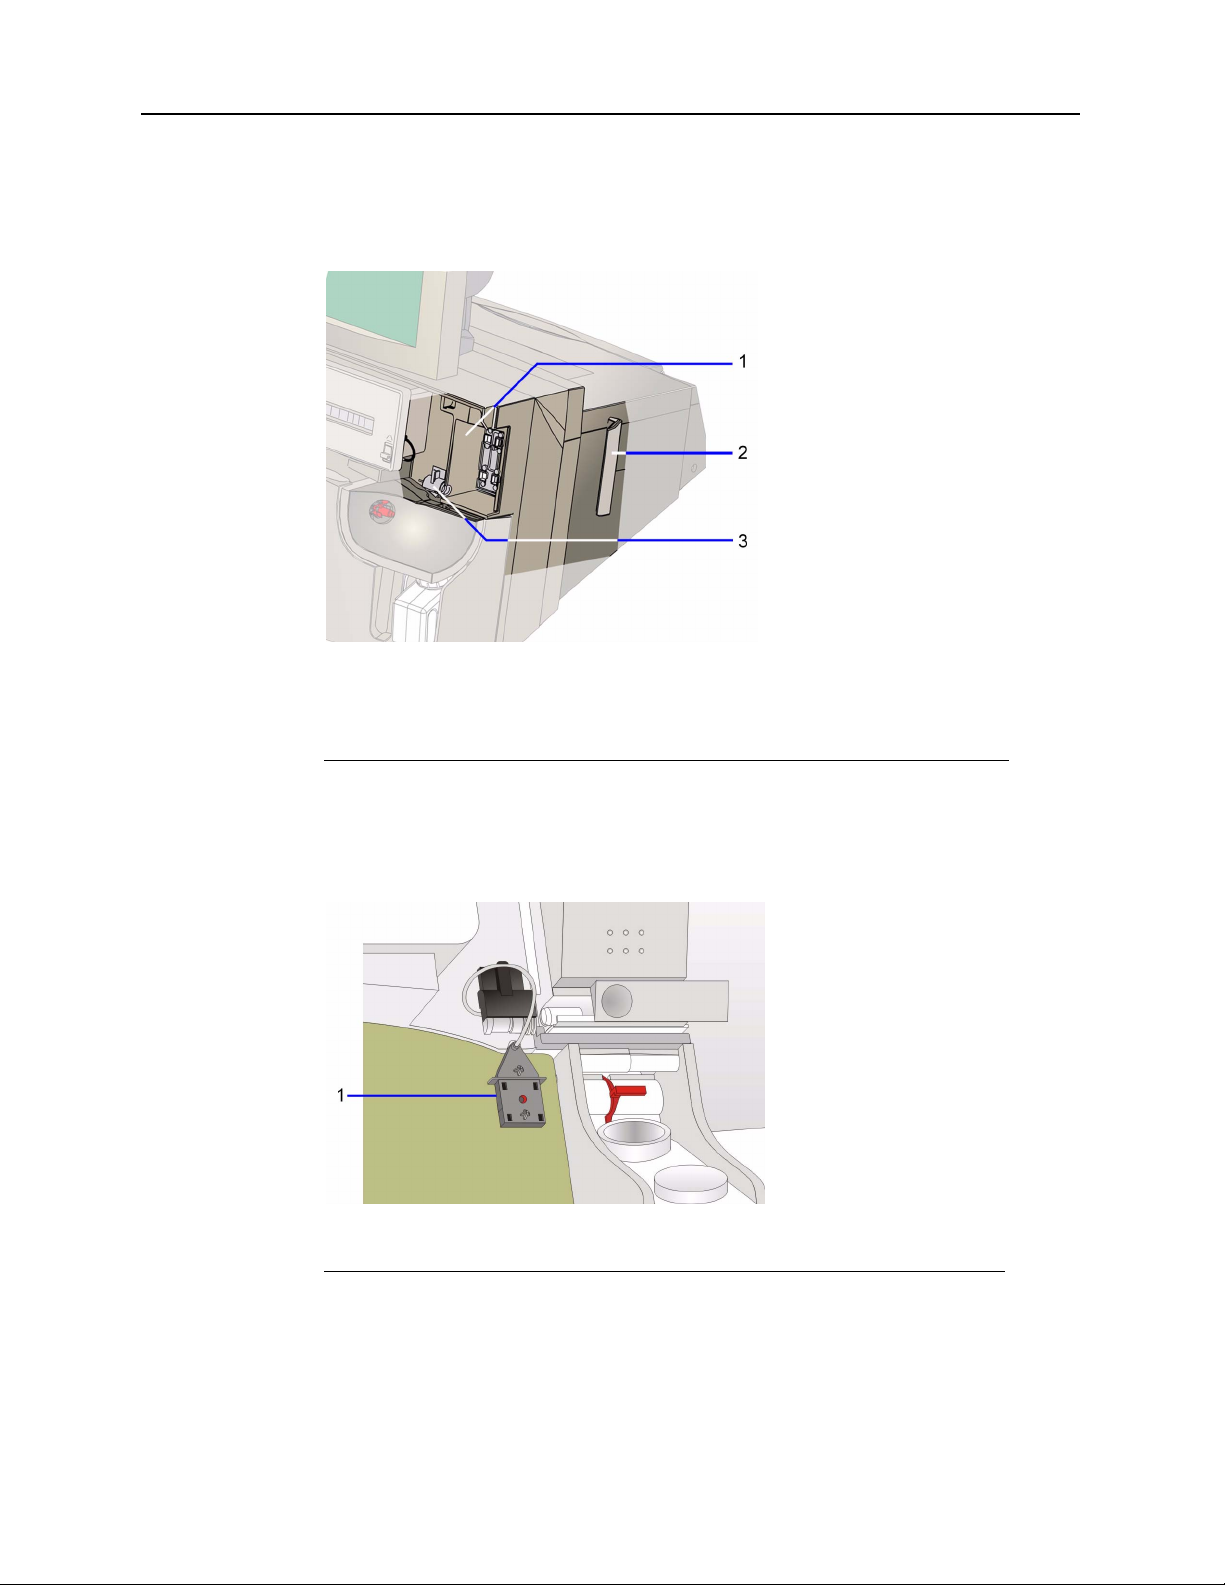
1-6 Rapidlab 1200 Operator’s Guide: System Overview and Intended Use
The latch assembly has 4 connections that secure the cartridge to the system. The
connector connects the AutomaticQC manifold and AutomaticQC cartridge. The support
bracket connects to the bracket on the cartridge.
1 Latch assembly
2 Support bracket
3 Connector
Figure 1-5 AutomaticQC Cartridge System Interface
The AutomaticQC manifold creates the fluid path for AutomaticQC materials to flow to
the sample entry components in the reagent cartridge.
1 AutomaticQC manifold
02087462 Rev. V
Figure 1-6 AutomaticQC Manifold
Page 27
Rapidlab 1200 Operator’s Guide: System Overview and Intended Use 1-7
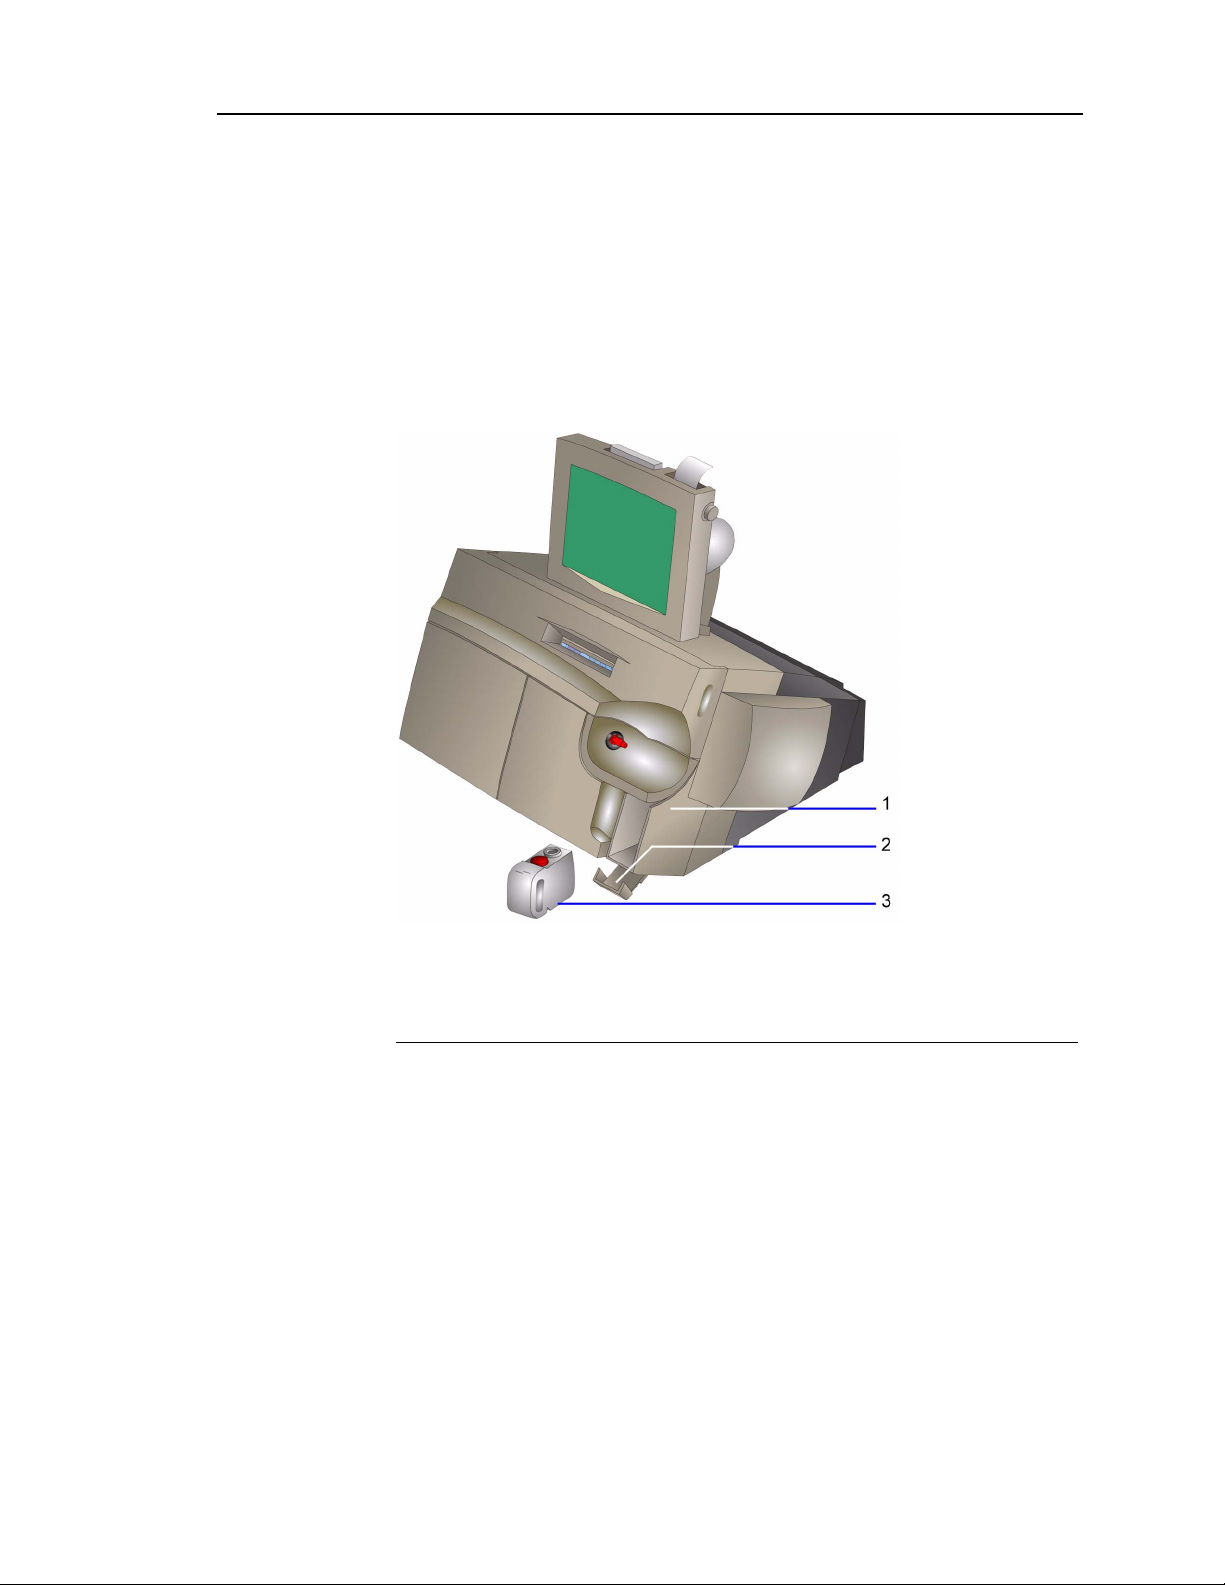
Waste Module
After sample analysis is complete, the waste module collects reagents, samples,
and waste. The waste module consists of the following components:
• waste bottle
• waste bottle housing
• waste bottle latch
• waste detector
1 Waste bottle housing
2 Waste bottle latch
3 Waste bottle
Figure 1-7 Waste Module
02087462 Rev. V
Page 28
1-8 Rapidlab 1200 Operator’s Guide: System Overview and Intended Use
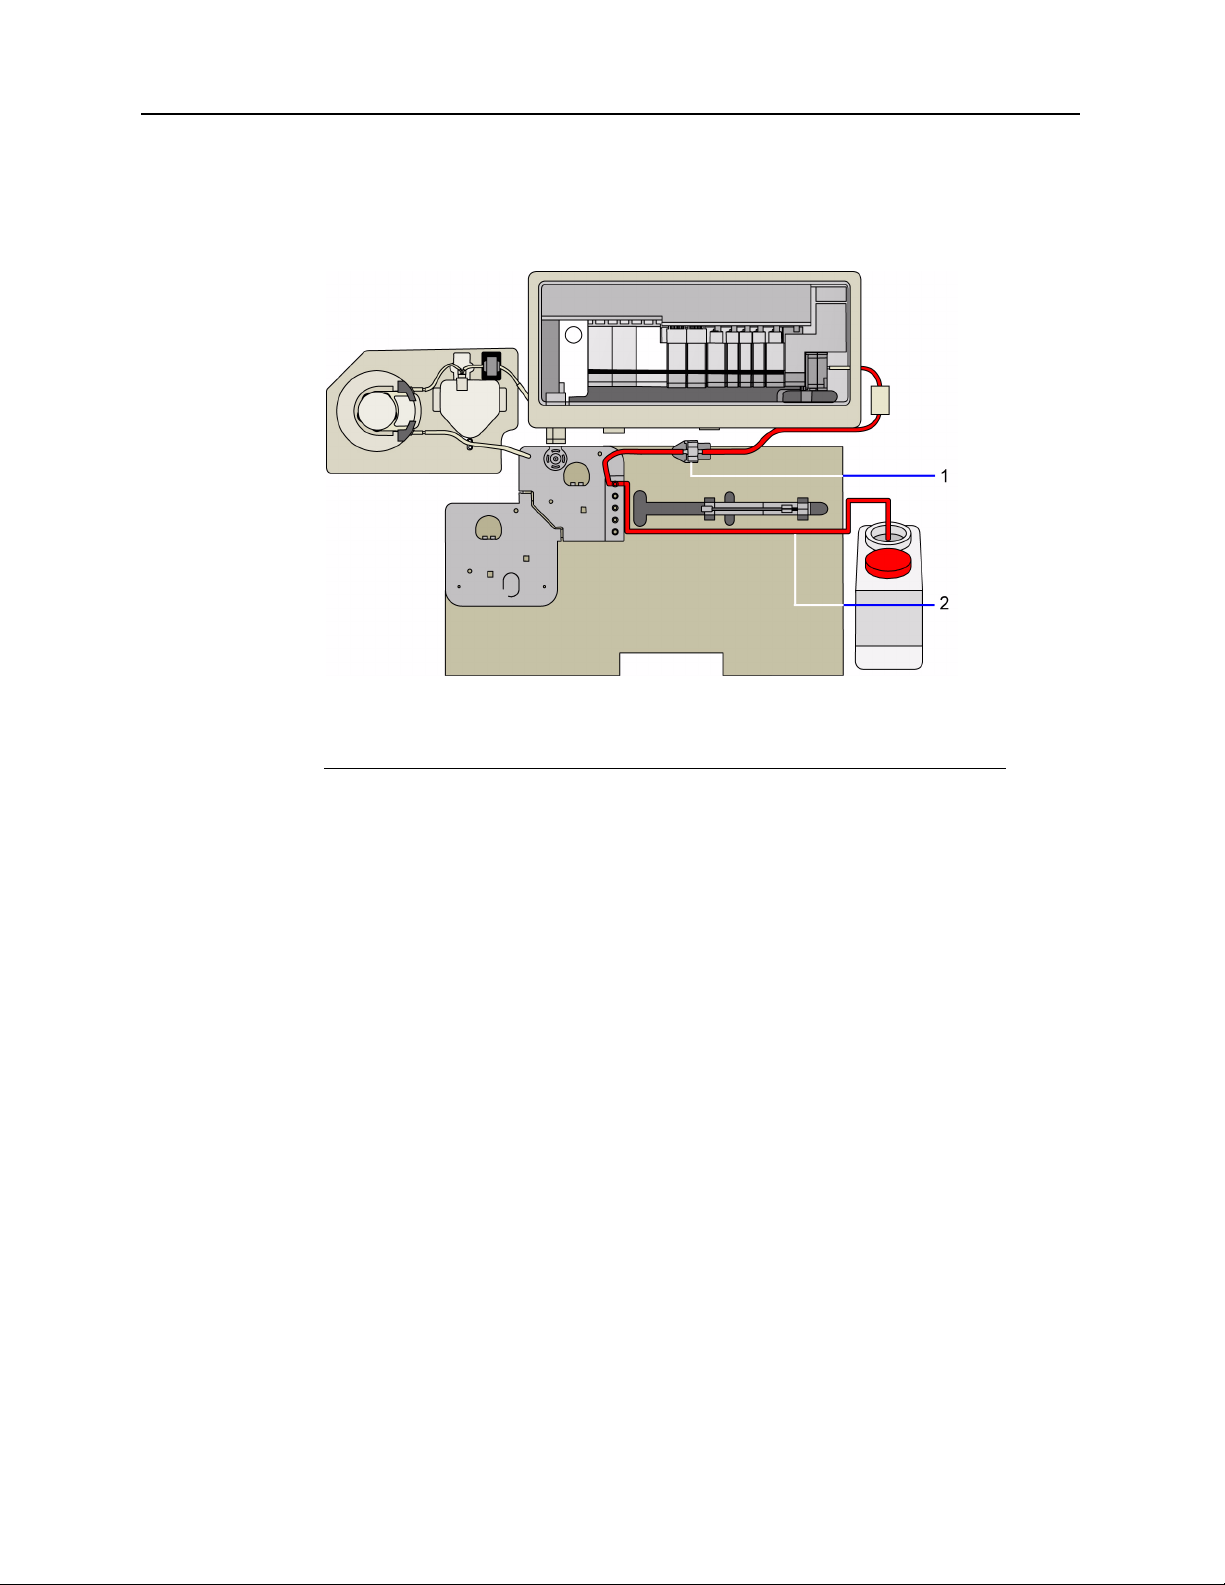
Waste moves from the measurement module through the pressure detector bubbler, and
into the reagent manifold. Waste moves through the reagent manifold and into the waste
bottle.
1 Path from the measurement module to the reagent manifold
2 Path from the reagent manifold to the waste bottle
Figure 1-8 Waste Path
The waste bottle housing protects the waste bottle. The waste detector detects the presence
of the waste bottle and also detects when the bottle is approaching its capacity. The system
alerts you when the waste bottle is between 70 and 100% full. To reduce exposure to
biohazards when you remove the waste bottle, the system prevents fluidic operations from
starting.
02087462 Rev. V
Page 29

Rapidlab 1200 Operator’s Guide: System Overview and Intended Use 1-9
Reagent Module
The reagent module holds the reagents and creates the fluid path for samples,
calibrators, and wash fluid.
The reagent module consists of the following components:
• reagent cartridge
• cartridge interface frame
• reagent manifold
• reagent door
Reagent Cartridge
The reagent cartridge contains the following 2 calibrators, each in foil bags:
Calibrator Volume
Slope 160 mL gases (oxygen, carbon dioxide, nitrogen), salts (alkali
200 460 mL gases (oxygen, carbon dioxide, nitrogen), salts (alkali
Ingredients
halides), organic buffers, catalyst, and surfactant
halides), organic buffers, glucose, lactate, surfactant, and
preservative
You use these calibrators, as well as the RCx and wash in the wash cartridge, to
calibrate the system. The electrolytes, pH, glucose, lactate, and gases in the
reagents are NIST traceable.
The following table lists the targeted calibration points for each analyte in the
reagents:
Analyte Cal Point Slope Point
pH 6.8 7.4
pCO
2
pO
2
+
Na
+
K
++
Ca
-
Cl
Glu 180 mg/dL 0 mg/dL
35 mmHg 70 mmHg
154 mmHg
116 mmol/L 159 mmol/L
4.0 mmol/L 8.0 mmol/L
1.25 mmol/L 0.62 mmol/L
98 mmol/L 69 mmol/L
0 mmHg
*
Lac 2 mmol/L 0 mmol/L
tHb 0 g/dL 15 g/dL
* fixed point via electronic zero
02087462 Rev. V
Page 30
1-10 Rapidlab 1200 Operator’s Guide: System Overview and Intended Use
You introduce samples into the system at the sample port, part of the reagent cartridge.
During sample aspiration, the sample port can hold syringes, capillary tubes, or aspiration
adapters.
1 Sample port
Figure 1-9 Reagent Cartridge–Front View
The sample port attaches to the sliding valve. The sliding valve changes positions
dependent on the function:
• Aspirate patient samples and QC samples
• Select and aspirate reagents and AutomaticQC (AQC) material
1 Sliding valve
2 Sample and wash pump tubing
Figure 1-10 Reagent Cartridge–Back View
The pumps compress the tubing on the cartridge to generate flow. Adjacent rollers on the
roller cage pinch a segment of the tubing in 2 places. The peristaltic action of the moving
rollers pulls the fluid through the tubing.
The cartridge interface frame attaches the reagent and wash cartridges to the system.
When you load the reagent cartridge into the system and close the door, the frame moves
forward and the pierce pins puncture the bags of calibrators in the cartridge to create a
fluid path.
02087462 Rev. V
Page 31

Rapidlab 1200 Operator’s Guide: System Overview and Intended Use 1-11
The cartridge interface frame also engages the fluid connectors on the cartridge
with the connectors on the reagent manifold to create the fluid path for calibrators,
samples, and waste. The pierce probes engage the pierce pins on the interface
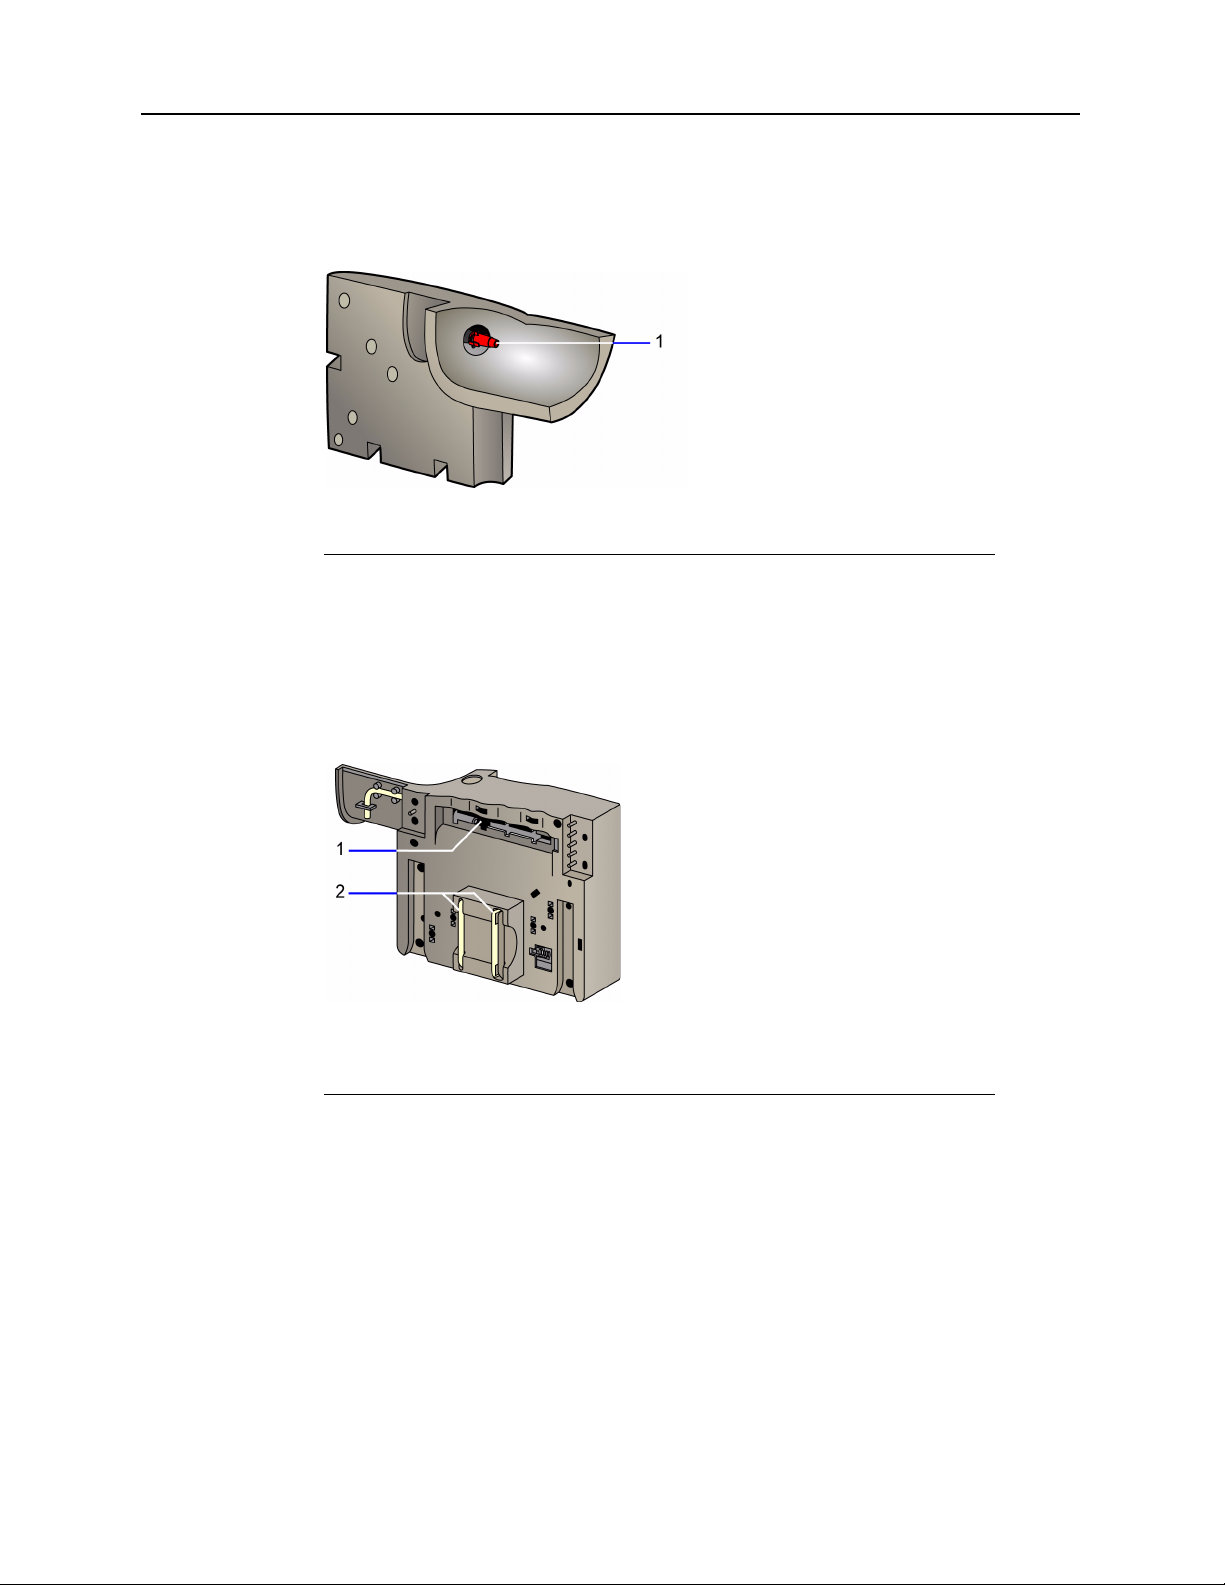
plate and the fittings on the bags of calibrators.
1 Pierce probes
2 Fluid connector for AutomaticQC materials
3 Fluid connectors to the reagent manifold
Figure 1-11 Reagent Cartridge–Back View
The fluid connectors on the reagent manifold engage with the fluid connectors on
the reagent and wash cartridges to create the fluid path for reagents, samples, and
waste.
1 Measurement module waste tubing
2 Sample tubing
3 CO-ox waste tubing
4 RCx reagent from wash cartridge tubing
5 Wash fluid from wash cartridge tubing
Figure 1-12 Reagent Manifold for the Rapidlab 1245 and 1265
Systems–front view
02087462 Rev. V
Page 32

1-12 Rapidlab 1200 Operator’s Guide: System Overview and Intended Use
The reagent manifold contains the tubing for samples, waste, AQC material, wash, and
calibrators.
1 Measurement module waste tubing
2 Sample tubing
3 CO-ox waste tubing
4 RCx reagent from wash cartridge tubing
5 Wash fluid from wash cartridge tubing
Figure 1-13 Reagent Manifold for the Rapidlab 1245 and 1265 Systems–back
view
02087462 Rev. V
Page 33

Rapidlab 1200 Operator’s Guide: System Overview and Intended Use 1-13
Wash Module
The wash module has the following components:
• wash cartridge
• wash door
Wash Cartridge
You load the wash cartridge in the wash door.
1 Wash cartridge
2 Wash door
Figure 1-14 Rapidlab 1200 System–Wash Module
The wash cartridge contains RCx (a calibrator) and wash reagent (a calibrator and
wash fluid) as described in the following table.
Reagent Volume Ingredients
RCx 60 mL gases (oxygen, carbon dioxide, nitrogen), salts (alkali halides),
organic buffers, surfactant, dye, and preservative
Wash 550 mL gases (oxygen, carbon dioxide, nitrogen), salts (alkali halides),
surfactant, and preservative
02087462 Rev. V
Page 34

1-14 Rapidlab 1200 Operator’s Guide: System Overview and Intended Use
When you load the wash cartridge into the system, the cartridge interface frame moves
forward and the pierce pins puncture the bags of calibrator and wash fluid. The cartridge
interface engages the fluid connectors on the cartridge with the connector on the reagent
manifold.
1 Fluid connectors
Figure 1-15 Wash Cartridge–back view
The fluid connectors on the reagent manifold engage with the wash cartridge to create the
fluid path for RCx and wash fluid from the wash cartridge to the sample path.
1 RCx reagent connector
2 Wash fluid connectors
Figure 1-16 Reagent Manifold for Rapidlab 1240 and 1260–front view
02087462 Rev. V
Page 35

Rapidlab 1200 Operator’s Guide: System Overview and Intended Use 1-15
Measurement Module
The system analyzes the sample in the measurement module.
1 Measurement module
Figure 1-17 Rapidlab 1200 Measurement Module Location
The sample moves through and is analyzed in the sensors, which form the sample
path.
1 Measurement module sample path
Figure 1-18 Measurement Module–Sample Path
02087462 Rev. V
Page 36

1-16 Rapidlab 1200 Operator’s Guide: System Overview and Intended Use
The sample enters the measurement module at the sample connector and moves through
the preheater, fluid detector 1, and into the sensors for measurement.
1 Preheater
2 Fluid detector 1
3 Sample connector
4 Sensors
Figure 1-19 Measurement Module
The preheater warms the sample to 37°C and the measurement block ensures a constant
temperature of 37°C. The sample connector provides the fluidic path for the sample from
the sample entry components in the reagent cartridge to the measurement module.
The sensors detect analytes present in the sample and form the sample path. The system
moves the sample through the sensors and the fluid detector 2, into the pinch valve tubing,
and through the pressure detector bubbler.
02087462 Rev. V
Page 37

Rapidlab 1200 Operator’s Guide: System Overview and Intended Use 1-17
The contact assembly provides electrical contact between the sensors and the
system. The pressure detector bubbler detects clots in the measurement module.
1 Fluid detector 2
2 Pinch valve tubing
3 Pressure detector bubbler
Figure 1-20 Measurement Module–Contact Assembly
The measurement module holds up to 11 sensors.
1 pO
2 pCO
Oxygen 7
2
Carbon dioxide 8
2
3 Gnd Sample ground/temperature 9
4 Glu Glucose 10
5 Lac Lactate 11 Ref Reference
6 pH pH
K
Ca
Cl
Na
+
++
-
+
Potassium
Calcium
Chloride
Sodium
Figure 1-21 Measurement Module–Sensors
02087462 Rev. V
Page 38

1-18 Rapidlab 1200 Operator’s Guide: System Overview and Intended Use
Sensors provide direct measurement of a specific substance of interest in a sample. For
more information about sensors, refer to
Rapidlab 1200 Systems Technology‚ page 1-27.
The electrolyte sensors, Na+, K+, Ca++, Cl-, pH sensor, and pCO2 sensor work with a
reference sensor and use potentiometry. For more information about potentiometry, refer
to
Potentiometry‚ page 1-27.
The biosensors (glucose, lactate) and the pO2 sensor use amperometry. For more
information about amperometry, refer to
Amperometry‚ page 1-33.
CO-ox Module
This section applies to the Rapidlab 1245 and 1265 systems.
The Rapidlab 1200 system CO-oximeter measures the concentration of total hemoglobin
and hemoglobin fractions. The CO-ox module contains the following components:
• sample chamber
• sample chamber interface
• polychromator
•pump
02087462 Rev. V
1 CO-ox pump
2 CO-ox sample chamber
Figure 1-22 CO-ox Module
The system measures as the sample flows through the sample chamber. The optics head
directs light through the sample in the sample chamber. The system collects the light at the
other side of the optics head and then the polychromator measures it.
Page 39

Rapidlab 1200 Operator’s Guide: System Overview and Intended Use 1-19
The polychromator measures the intensities of light passed through the sample at
a number of different wavelengths and converts the electrical signal to a digital
value for further processing.
The sample chamber has a sliding cell design that opens and closes to allow for
measurement.
The CO-ox sample chamber is stable for up to 60 days after installation on the
system. CO-ox sample chamber use life is independent of the number of samples
analyzed on the system. The system prompts you when you need to replace the
sample chamber.
Software Overview
Rapidlab® User Interface
Screens consist of the banner area and a display area.
• The banner is at the top of all screens and remains visible when you move
from screen to screen.
The banner contains information about system status and has buttons for
accessing the main system screens.
• The display area contains options and information for the task you are
performing.
1 System status area 4 Status screen
2 Analysis screen 5 Help button
3 Recall screen 6 Current time and date
Figure 1-23 Screen Banner
02087462 Rev. V
Page 40

1-20 Rapidlab 1200 Operator’s Guide: System Overview and Intended Use
Viewing the Banner Information
The screen banner area displays the following information:
• the current system status (Ready, Not Ready, Calibrating, Analyzing)
• the time and type of the next calibration
• status messages (Cal Pending, Required QC Due, AQC Pending, maintenance due or
overdue)
• temperature of patient sample in banner at Results screens, if temperature
demographic is selected in Setup
• remote viewing status for systems connected to an LIS (refer to Setting Up Remote
Viewing (Rapidcomm Only)‚ page 8-32)
1 System status area
2 Cartridge status
Figure 1-24 Banner–Status Information
Viewing Status Messages
The banner displays status messages as reminders for pending tasks. The system always
displays a message for a pending Required QC regardless of other pending tasks.
The system displays a message when maintenance tasks are due and how many are due.
When you perform a maintenance task, the number of tasks on the banner decrements but
the message remains as long as tasks are pending.
Status Symbols
When a cartridge, the CO-ox sample chamber, or the waste bottle approaches its
expiration date or number of tests available, the system displays the appropriate symbol in
the banner:
Supply Symbol % Volume Number of hours
Wash cartridge 10% Less than 24
Reagent cartridge 10% Less than 24
02087462 Rev. V
AutomaticQC cartridge 10 or fewer tests for
any level of QC
material
Less than 24
Page 41

Rapidlab 1200 Operator’s Guide: System Overview and Intended Use 1-21
Supply Symbol % Volume Number of hours
Waste bottle 70% Not limited by time
CO-ox sample chamber Not limited by
volume
Less than 72
The system tracks the number of hours from the install-by-date or expiration date,
which ever date is shorter.
The Analysis symbol accesses the Analysis screen where you analyze samples.
The Recall button accesses stored results. The Status button displays cartridge
status and access to maintenance and diagnostics functions. The Help button
provides information about troubleshooting and maintaining the Rapidlab
1200
system.
Viewing the Display Area
Some functions are common to all the main screens.
Button Function
Continue button.
Displays the next screen for the task you are performing. The system
automatically saves selections and entries that you make.
Print button.
Prints a report. If the system is connected to a Rapidlink or
Rapidcomm system, an LIS, or an external printer, the Rapidlab 1200
system also sends the report to these computer systems or the printer.
Return button.
Displays the previous screen. The system does not save your
selections and entries when you select the Return button.
Video button.
Displays a video demonstration of the steps for a procedure.
Rapidlab Main System Screens
You access the main system screens by selecting the appropriate button on the
banner.
• Analysis screen
• Recall screen
• Status screen
Analysis Screen
The Analysis screen is the main screen for the Rapidlab 1200 systems.
02087462 Rev. V
Page 42

1-22 Rapidlab 1200 Operator’s Guide: System Overview and Intended Use
The group of buttons on the left side of the display area define the type of sample to be
analyzed, patient or QC.
The group of buttons in the center of the display area define the parameters to be
measured. Available parameters are determined by the sample device, sample mode
selected, and system configuration.
Analysis Screen Sample Options
Before analyzing a sample, you need to select a sample type, sample mode, and
parameters. The Rapidlab
1200 systems provide 4 patient sample type options and 4
analysis mode options. The parameters available depend on the type of system and Setup
options you selected.
When analysis is requested, you must also enter patient information. Refer to Entering
Patient Sample Data‚ page 2-22.
The top 4 buttons on the left of the screen represent the patient sample types: arterial
syringe, capillary, venous, and mixed venous.
Analysis Screen Parameter Status
The system displays available parameters in the center of the screen. Each parameter can
be in a different state, indicated by its appearance, depending on operator selections,
definitions in Setup, and current parameter condition.
Parameter Description
Parameter is available but does not display as a button and
cannot be selected. Refer to Enabling Parameter Selection at
Analysis‚ page 8-11.
Parameter is not selected and results will not be reported for this
parameter. Refer to Enabling Parameter Selection at Analysis‚
page 8-11.
Parameter is selected for analysis. Refer to Enabling Parameter
Selection at Analysis‚ page 8-11.
Parameter is not available for analysis because the sensor has
failed calibration. Refer to Troubleshooting Unavailable Buttons‚
page 6-7.
Parameter has failed successive calibrations and is unlikely to
become available with further calibrations until corrective action
is taken. Refer to Troubleshooting Unavailable Buttons‚
page 6-7.
Parameter is not available for analysis because the parameter
failed Required QC or AutomaticQC analysis (the button is
yellow). Refer to Troubleshooting the Yellow Parameter Error‚
page 6-1.
02087462 Rev. V
Page 43

Rapidlab 1200 Operator’s Guide: System Overview and Intended Use 1-23
Parameter Description
Parameter is not available for analysis because Required QC was
not performed when scheduled (the button is purple). Refer to
Troubleshooting the Yellow Parameter Error‚ page 6-1.
Custom Panels
If you define custom panels for your system, the system displays the custom
panels in the lower-left corner of the Analysis screen. Each of the panel buttons
displays the parameters that are in that panel. The number buttons, 1 and 2,
represent the 2 sets of panels currently available on the system.
The system displays the buttons only when panels are defined. Refer to Defining
Custom Panels‚ page 8-11.
1 Custom panel buttons
2 Panel set buttons
Figure 1-25 Custom Panel Buttons
Sampling Modes on the Analysis Screen
To simplify patient analysis tasks, the Rapidlab 1200 systems have 4 modes of
operation:
Mode Description
Microsample Use the Microsample mode when you have insufficient sample
for patient analysis in the default sampling mode.
pH Use the pH mode when you analyze samples for a pH result only.
tHb Use the tHb mode when you analyze samples for tHb,
hemoglobin fractions, and oxygenation parameters only (for
Rapidlab 1245 and 1265 systems).
pH, Glu, Lac Use the pH, Glu, Lac mode to test for pH, Glucose, and Lactate
only.
02087462 Rev. V
Page 44

1-24 Rapidlab 1200 Operator’s Guide: System Overview and Intended Use
Recall Screen
Select the Recall button to access stored results. For information about the Recall button
menu options, refer to the following topics:
Button... Refer to...
Patient Recalling Patient Sample Results‚ page 2-30
QC Recalling QC Results‚ page 4-7, including QC Statistics
and Levey-Jennings Graphs
Calibrations Recalling Calibration Results‚ page 3-4
Events Log Viewing System Messages‚ page 6-74
Copy Stored Results Copying Data Files‚ page 7-2
Sample Totals Viewing the Sample Totals‚ page 7-4
Status Screen
The system automatically displays the Status screen if an event occurs that needs your
attention before routine operation can continue. For example, the system displays the
Status screen with a Not Ready message when an error condition prevents sample analysis
or when you need to replace a cartridge because it is empty or expired.
You can also manually display the Status screen by selecting the Status button on the
banner.
The display area of the Status screen displays the current status of each cartridge:
• the cartridge symbol
• percent volume
• time remaining until the cartridges must be replaced
• buttons to access Status area functions
Buttons on the Status screen display area access several system functions:
Button... Refer to...
Replace Replacing Supplies‚ page 2-2
Maintenance Maintenance‚ page 5-1
Diagnostics Using Diagnostics‚ page 6-33
Calibrate Calibration‚ page 3-1
Setup System Configuration‚ page 8-1
System Info Accessing System Information‚ page 2-5
Shutdown Shutting Down the System‚ page 2-6
02087462 Rev. V
Page 45

Rapidlab 1200 Operator’s Guide: System Overview and Intended Use 1-25
Rapidlab 1200 Systems Sample Path
This section describes the path of a sample through the system from sample entry,
to measurement, and then to the waste bottle.
System Sample Path
The system aspirates the sample at the sample port. The sample moves through
the sample tubing and reagent manifold into the sample connector and into the
measurement module.
1 Sample connector
2 Sample tubing and reagent manifold.
3 Sample port
Figure 1-26 Rapidlab 1200 Sample Path–Sample Port to Measurement
Module
02087462 Rev. V
Page 46

1-26 Rapidlab 1200 Operator’s Guide: System Overview and Intended Use
CO-ox Sample Path
The system splits the sample in the preheater and moves part of the sample through the
CO-ox module. The CO-ox sample moves through the CO-ox sample tubing to the sample
chamber for analysis and exits as waste through the waste tubing. The system analyzes the
sample in the CO-ox sample chamber. After analysis, the system moves the waste to the
reagent manifold, passing through the reagent cartridge, and on to the waste bottle.
1 Preheater
2 Sample chamber
3 Tubing to the reagent manifold
Figure 1-27 Rapidlab 1200 Sample Path–To CO-ox Module to Waste
02087462 Rev. V
Page 47

Rapidlab 1200 Operator’s Guide: System Overview and Intended Use 1-27
Rapidlab 1200 Systems Technology
The measurement technology used for the Rapidlab 1200 systems is based on
electrochemical, biochemical, and optical physics. Electrochemistry is the
measurement of current or voltage in an electrochemical cell. The cell has 2 or
more electrodes that interact with a chemical in solution and are connected to an
electrical system.
Electrodes used for measurement in the Rapidlab 1200 systems are called sensors.
Sensors are responsible for direct measurement of a specific substance of interest
in a sample. The Rapidlab
characteristics:
1200 systems sensors have the following
Molecular or ion-specific
recognition mechanism
Transducer mechanism converts the potential generated by the recognition
Signal processor system conditions the electronic signal from the sensor; the
a membrane that is selective for a specific ion
mechanism to an electrical signal using
potentiometry or amperometry
electronic signals are then converted into a
concentration expressed in units of measure
The molecular recognition mechanism gives a sensor its identity. Each sensor is
designed to selectively measure the activity of a specific substance. Although
many elements in a sample may interact with a sensor, the sensor is highly
selective for 1 substance over others. The common recognition mechanism used
in many Rapidlab
1200 sensors is a membrane designed to be selective for a
specific substance.
The transducer mechanism converts the potential generated by the molecular
recognition mechanism to an electrical signal. In the Rapidlab
1200 systems, this
is accomplished through potentiometry or amperometry. For information about
Potentiometry, continue reading at the next section. For information about
Amperometry, refer to
Amperometry‚ page 1-33.
Potentiometry
Potentiometry is the measurement of the voltage or potential generated between
2
electrodes in an electrochemical cell when no external current is applied and the
cell is in a state of equilibrium. The electrochemical cell consists of 2 electrodes (a
measuring or indicator electrode and a reference electrode), an electrolyte solution
(sample solution), and a measuring device such as a voltmeter. The
electrochemical cell is capable of measuring the concentration or activity of a
substance in a solution.
02087462 Rev. V
Page 48

1-28 Rapidlab 1200 Operator’s Guide: System Overview and Intended Use
Each electrode, which acts as a half-cell with a half-cell potential, contains an inner
reference element immersed in an internal electrolyte solution. The measuring electrode is
designed to respond to changes in the concentration of the specific analyte being measured
in the sample solution. The electrode develops a half-cell potential that is directly related
to the concentration or activity of the specific analyte. The reference electrode provides a
steady, unchanging potential to the cell. Both electrodes are connected to the measuring
device. With the current in the cell at zero, the potential developed by the electrochemical
cell is determined by calculating the difference in potential between the measuring
electrode and the reference electrode.
E
cell
= E
meas
- (E
ref
+ Elj)
where
E
= electrochemical cell potential
cell
E
= measuring electrode half-cell potential
meas
E
= reference electrode half-cell potential
ref
Elj = liquid junction potential
The liquid junction potential (Elj), a small but significant voltage, develops at the liquid
junction between the reference electrode, which contains a solution of saturated potassium
chloride, and the sample solution. This potential occurs because of the different rates at
which chemical species diffuse across the boundary between 2 liquids. This difference in
rates results in a charge separation that gives rise to the liquid junction potential. Although
the potential formed is small, it must be considered when measuring cell potential.
1
System sensors are designed to measure a specific substance in a sample. For the purpose
of measuring a variety of analytes in solution, sensors must have the ability to measure
specific analytes in solution. This ability is known as the recognition mechanism. For
example, an Ion Selective Electrode (ISE) contains a specifically designed membrane that
provides sensor selectivity. Selectivity is the ability of the sensor to interact with a specific
ion in solution. The membrane separates an inner, reference element, which is immersed
in a fixed electrolyte solution, from the sample.
02087462 Rev. V
Page 49

Rapidlab 1200 Operator’s Guide: System Overview and Intended Use 1-29
During analysis, a membrane potential develops as a result of the interaction of
the analyte (ion) at the membrane. The membrane potential is related to the
amount of substance being measured in the sample. The half-cell potential in the
sensor consists of the inner reference element potential plus the membrane
potential.
1 Voltmeter
2 Potassium chloride solution
3 Inner element of the reference electrode
4 Liquid junction potential develops
5 Ion-selective membrane
6 ISE inner reference element
7 A fixed electrolyte solution
Figure 1-28 Electrode Elements
The equation for calculating electrochemical cell potential can be expanded to
include the inner reference element and the membrane potential of the ISE.
E
cell
= (E
ref elmt
+ E
memb
) - (E
+ Elj)
ref
where
E
= electrochemical cell potential
cell
E
E
E
= potential of the ISE inner reference element
ref elmt
= potential of the ISE membrane
memb
= reference electrode half-cell potential
ref
E
= liquid junction potential
lj
02087462 Rev. V
Page 50

1-30 Rapidlab 1200 Operator’s Guide: System Overview and Intended Use
In this equation, the reference electrode potential and the potential of ISE inner reference
element are constant; the liquid junction potential can be controlled. Therefore, the
potential remaining is the potential generated at the membrane. The membrane potential
corresponds to the ion activity and is related directly to the concentration of the ion in
solution. The cell potential is expressed quantitatively by the Nernst equation.
E
= K + (2.3 RT/ZF) log a
cell
i
1
where
E
= electrochemical cell potential
cell
K = a constant from various sources such as the liquid junction
R = gas constant
T = absolute temperature
Z = ionic charge
F = Faraday’s constant
ai = activity of the ion in the sample
This equation states that the cell potential is logarithmically related to the activity of the
analyte in the sample.
The potential that the sensor actually measures is the activity of the analyte in solution. In
clinical chemistry, it is typical that the results be expressed in the concentration of total
substance rather that the activity of the substance. For this reason, the measured results
must be expressed in units of concentration.
The activity equals the numerical value of the concentration of the ion (mol/L) times the
activity coefficient. The activity coefficient is a measure of the degree with which the ion
interacts with other ions in solution. The activity coefficient is dimensionless and depends
on the ionic strength of the solution:
I = 1/2 ∑ m * z
2
where
I = ionic strength of the solution
m = concentration of the ion (mol/L)
z = the charge number of the ions in solution
The activity coefficient generally decreases with increasing ionic strength.
2
02087462 Rev. V
Page 51

Rapidlab 1200 Operator’s Guide: System Overview and Intended Use 1-31
Using an established convention, the activity of ions that are measured by sensors
can be expressed in terms of concentration. This convention contains the
assumption that the normal ionic strength of blood plasma water is 160 mmol/kg.
Because ionic strength is the primary variable affecting the activity coefficient of
ionic species in solution, controlling the ionic strength of calibrating solutions to
160 mmol/kg sets the activity coefficients of ionic species in the calibrating
solutions equal to those of blood plasma water at sample ionic strengths close to
normal. Both calibrations and the expression of measured quantities may then be
made in units of concentration instead of activity.
4
Reference Sensor
The reference sensor for the 1200 systems works with certain measuring sensors
in the measurement module to create an electrochemical cell. The reference
sensor provides a fixed potential, which is independent of analyte activity. The
system compares the fixed potential of the reference sensor to the measured
potential from the following sensors:
Sensor System
pH 1240, 1245, 1260, 1265
Na
K
Cl
Ca
+
+
-
++
1260, 1265
1260, 1265
1260, 1265
1260, 1265
3
02087462 Rev. V
Page 52

1-32 Rapidlab 1200 Operator’s Guide: System Overview and Intended Use
The reference sensor contains a silver (Ag) wire, coated with a layer of silver chloride
(AgCl) and an ion permeable polymer, surrounded by a saturated potassium chloride
-
(KCl) solution. By ensuring that the concentration of Cl
remains unchanged in the
solution, the reference sensor maintains a constant electrical potential. A potassium
chloride (KCl) block is in the reference sensor solution chamber to ensure a saturation
solution of KCl at 37°C.
1 Solution chamber
2 Saturated potassium chloride solution
3 Silver/silver chloride electrode
4 Sample path
Figure 1-29 Reference Electrode
A permeable cellulose membrane separates the KCl solution from the sample and provides
the ionic conduction between the KCl solution and the sample. The membrane completes
the conductive path to the sample from the fixed half-cell potential that is required for the
measurement.
The Ag wire conducts the half-cell potential of the reference sensor to the measurement
device where it is compared to the potential of the measuring sensor. The potential
difference measured reflects the concentration of analyte in the sample. Although the
reference sensor provides a constant potential from sample to sample, the potential
difference measured between sensors varies with each sample.
02087462 Rev. V
Page 53

Rapidlab 1200 Operator’s Guide: System Overview and Intended Use 1-33
+
−= cHpH
10
log
Amperometry
Amperometry is an electrochemical technique used to determine the amount of a
specific substance in solution by applying a fixed voltage between 2 electrodes in
an electrochemical cell, and then measuring the current generated as a result of a
reaction which produces or consumes electrons (oxidation or reduction,
respectively).
The electrochemical cell contains 2 electrodes: the anode,
which is positively
charged and the cathode, which is negatively charged. The measuring electrode,
which is frequently composed of platinum (Pt) or another noble metal, can be
either the anode or the cathode. Each electrode is attached to an external voltage
source.
As the sample comes in contact with the 2 elec
trodes, a known voltage is applied
between the anode and the cathode. The analyte to be measured is either an
oxidizable or reducible species. If the analyte is an oxidizable species, it will
diffuse to the anode where it is oxidized. If the analyte is a reducible species, it
will diffuse to the cathode, where it is reduced. In either case, the electrochemical
reaction produces a current flow between the anode and cathode that can be
measured by a device, such as a milli/micro ammeter. The current measured is
directly proportional to the concentration of substance (oxidizable or reducible)
present in the sample solution.
pH and Blood Gases
The Rapidlab 1200 systems analyze blood samples for pH, pO2, and pCO2.
Hydrogen Ion Activity or pH
The notation of pH expresses the hydrogen ion activity in a solution as the
negative logarithm of the hydrogen ion concentration. The hydrogen ion is
actually the determinant of the acidity of blood or plasma. Normal cellular
metabolism requires an exacting environment where hydrogen ion concentration
must be maintained within narrow limits. Hydrogen ion activity reflects the
acid-base balance within blood. Acids are substances that donate hydrogen ions;
bases are substances that remove hydrogen ions from solution. The lungs, kidneys
and blood bases all work to maintain the acid-base status within the strict limits
for normal cell functioning.
Expressed in concentration units, hydroge
n ion concentrations are very small
numbers that are cumbersome to use. (For example, the common neutral pH of
7.00 is 0.0000001 mol/L.) In 1909 Sorenson converted the numbers
mathematically to simplify their use and described the notation pH:
where (H+) is the molar concentration of hydrogen ions.5
02087462 Rev. V
Page 54

1-34 Rapidlab 1200 Operator’s Guide: System Overview and Intended Use
acid
base
pKpH log+=
acid
base
pH
α
Using this formula, a hydrogen ion concentration of 1 x 10⁻⁷ mol/L has a pH value of 7.
Because pH is the negative logarithm, its value is inversely proportional to the actual
hydrogen ion concentration in a sample. Therefore, as the hydrogen ion concentration
decreases, the pH value increases. As the hydrogen ion concentration increases, the pH
value decreases.
The normal pH range of human blood is 7.35–7.45.
The Henderson-Hasselbalch equation describes how pH expresses the interaction of acid
and base in
blood:
where K is the dissociation constant, which describes the ability to release hydrogen ions.
Because K, and thus pK, is a constant, this equation
can be used to demonstrate that pH is
proportional to the acid-base concentrations in blood:
Therefore, if base increases without a corresponding increase in acid, the pH rises, and if
acid increases without a corresponding increase in base, the pH decreases.
pH is clinically significant as a me
ans of determining acid-base disturbances. Acid-base
disorders can result in several pathologic conditions. Acidosis (low pH) stems from either
respiratory failure (high pCO
) or from metabolic causes (including ketoacidosis, lactic
2
acidosis, uremia, severe diarrhea, hypoaldosteronism, renal tubular disease, drug effects,
or poisoning from several specific agents). Alkalosis (high pH) stems from
hyperventilation (low pCO
) or from metabolic causes (including excessive vomiting,
2
gastric drainage, drug effects, hyperadrenocorticism, potassium depletion, or excessive
alkali intake). Extreme abnormalities of pH reflect a potentially life-threatening
pathophysiologic state that must be corrected promptly.
6,7
02087462 Rev. V
Page 55

Rapidlab 1200 Operator’s Guide: System Overview and Intended Use 1-35
+−
+↔↔+ HHCOCOHOHCO
33222
pH Sensor
The pH sensor, which is based on ISE technology, is a half-cell that forms a
complete electrochemical cell when combined with the external reference sensor.
It contains a silver/silver chloride wire surrounded by a buffer solution. A glass
membrane that is highly sensitive and specific for hydrogen ions separates the
sample from the solution.
1 Buffer solution
2 Silver/silver chloride electrode
3 Sample path
Figure 1-30 pH Sensor
As the sample comes in contact with the membrane of the pH sensor, a membrane
potential develops due to the exchange of hydrogen ions in the membrane. The
silver/silver chloride inner conductor transmits the potential to a voltmeter where
it is compared to the constant potential of the reference sensor. The final measured
potential reflects the hydrogen ion concentration of the sample and is used to
report the pH value of the sample.
Carbon Dioxide Tension (pCO2)
Carbon dioxide (CO2) is produced during normal cell metabolism and is released
into the blood stream where it is transported to the kidneys and lungs for
excretion. CO
dissolved CO
is transported through the blood as bicarbonate (HCO
2
, and carbonic acid (H2CO3). CO2 exists in a dynamic state in the
2
blood as seen in the following equation:
–
),
3
02087462 Rev. V
Page 56

1-36 Rapidlab 1200 Operator’s Guide: System Overview and Intended Use
acid
base
pKpH log+=
322
3
log
COHCO
HCO
pKpH
+
+=
−
32
3
COH
HCO
pH
−
α
The levels of HCO
–
, H2CO3, and dissolved CO2 play a major role in maintaining the pH
3
in blood. This relationship is best described through the Henderson-Hasselbalch equation:
Substituting HCO
–
as the base and dissolved CO2 and H2CO3 as the acid, the equation
3
reads as follows:
Taking the equation further, pH is seen as being proportional to the acid-base relationship:
Although other acids and bases are present in the blood, the H2CO3/HCO
–
relationship is
3
sensitive and dynamic and typically reflects other acid-base changes.
When the measurement of the partial
pressure of carbon dioxide (pCO2) in the blood is
combined with the measured pH, the values can be incorporated into the
–
Henderson-Hasselbalch equation to determine HCO
value is proportional to the content of dissolved CO
used along with pH not only to calculate HCO
3
and ctCO2. Because the pCO2
3
/HCO
2
–
but also to aid in the differentiation of
–
, the value for pCO2 can be
3
acid-base abnormalities.
This analyte reflects the overall respiratory status. Thus high pCO
suppression or failure, whereas low pCO
indicates hyperventilation (which in turn may
2
indicates respiratory
2
stem from hypoxia, anxiety, fever, cerebral disease, cirrhosis, or excessive mechanical
ventilation). Extreme abnormalities of pCO
pathophysiologic state that must be corrected promptly.
reflect a potentially life-threatening
2
6,7
Together, pH and pCO2 provide a more definitive diagnostic tool in assessing respiratory
function. An increase in the pCO
acidosis, a condition in which CO
value and a decrease in pH indicates respiratory
2
is retained by the lungs. A decrease in the pCO2 value
2
and an increase in pH indicates respiratory alkalosis, a condition in which the lungs are
expiring too much CO
relative to the amount produced.
2
02087462 Rev. V
Page 57

Rapidlab 1200 Operator’s Guide: System Overview and Intended Use 1-37
+−
+↔+ HHCOOHCO
322
pCO2 Sensor
The pCO2 sensor is based upon the electrode described by Severinghaus and
8
Bradley.
The pCO2 sensor is a complete electrochemical cell that consists of a
measuring electrode and an internal reference electrode. The measuring electrode,
which is a pH electrode, is surrounded by a chloride bicarbonate solution. A
membrane permeable to gaseous CO
separates this solution from the sample. The
2
internal reference electrode, which contains a silver/silver chloride electrode
surrounded by the chloride-bicarbonate solution, provides a fixed potential.
1 Measuring electrode contact
2 Internal reference electrode contact (Ag/AgCl)
3 Sample path
Figure 1-31 pCO2 Sensor
As the sample comes in contact with the membrane, CO2 diffuses into the
chloride-bicarbonate solution, which causes a change in the hydrogen ion activity:
The internal pH electrode detects the change in hydrogen concentration occurring
in the chloride bicarbonate solution and generates a half-cell potential. This
potential, when compared to the fixed potential of the reference electrode, results
in a measurement that reflects pH change in the chloride bicarbonate solution. The
change in pH is related to the log of the partial pressure of CO
.
2
02087462 Rev. V
Page 58

1-38 Rapidlab 1200 Operator’s Guide: System Overview and Intended Use
Oxygen Tension (pO2)
Oxygen (O2) is essential for cell and tissue metabolism in the body. The cardiopulmonary
system is responsible for transporting oxygen to the cells. Oxygen transport involves 4
major steps: convection and diffusion from the air into the pulmonary circulation,
combination of O
O
through the arteries to the cell, and finally the release into the tissues and utilization of
2
at the cellular level.
O
2
Because it is not possible to measure intra-cellular oxygen tension (pO2), arterial pO2 has
become a standard for clinical evaluation of arterial oxygenation status. Measurement of
pO
(A), which indicates the oxygen tension in arterial blood, reflects the pressure or
2
driving force for moving oxygen from 1 location to the next due to pressure differential; it
is not a measurement of the O
pulmonary gas exchange efficiency from an arterial blood sample.
Complete laboratory evaluation of oxygenation often requires much more than simple
blood gas measurements. Assessment of ventilatory system and acid-base status is
essential to properly interpret clinical significance of arterial oxygenation status. However,
many patients can be evaluated and treated successfully using blood gases alone if clinical
observations and patient history are taken into account.
from the lungs with hemoglobin in red blood cells, transportation of the
2
content, but it provides a measurement tool to evaluate the
2
9
This analyte reflects the ability of the lungs to deliver oxygen to the blood. Hypoxia (low
) may occur despite adequate respiration due to parenchymal lung diseases
pO
2
(pneumonia, asthma, pulmonary edema, and pulmonary fibrosis) due to pulmonary
shunting of blood. Extremely low pO
state that must be corrected promptly.
is a potentially life-threatening pathophysiologic
2
6,7
The measurement of pO2 is significant in evaluating the degree of hypoxemia (a
deficiency of O
pO
is usually 95 mmHg (12.7 kPa) for a healthy young adult living near sea level.
2
However, as with pCO
action is indicated. Generally a pO
in arterial blood) present in a patient. The laboratory reference value for
2
and pH, a wider range of values may occur before any therapeutic
2
of 80 mmHg (10.7 kPa) signals therapeutically
2
significant hypoxemia. Above this value is very little change in oxygen saturation or
oxygen content with changes in oxygen tension, but below this value changes in saturation
can occur rapidly. Exceptions to this limit are newborns, who have an acceptable range of
40
to 70 mmHg (5.3 to 9.3 kPa) and adults over 50 years old, who have a normal
deterioration of lung function that causes a decrease in expected pO
1 mmHg (0.13 kPa) per year.
10
values of about
2
02087462 Rev. V
Page 59

Rapidlab 1200 Operator’s Guide: System Overview and Intended Use 1-39
−−
→++ OHeOHO 442
22
−+
+→ eAgAg 44
pO2 Sensor
The pO2 sensor is based upon the electrode described by Clark.11 It is a complete
electrochemical cell that incorporates amperometric technology. The sensor
consists of a platinum (Pt) cathode, and silver (Ag) anode, an electrolyte solution,
and a gas-permeable membrane.
1 Cathode contact
2 Anode contact
3 Sample path
Figure 1-32 pO2 Sensor
A constant voltage, called a polarizing voltage, is maintained between the anode
and the cathode. As dissolved oxygen from the sample passes through the
membrane into the electrolyte solution, it is reduced at the cathode:
The circuit is completed at the anode, when the Ag is oxidized:
The amount of reduced oxygen is directly proportional to the number of electrons
gained at the cathode. Therefore, by measuring the change in current (electron
flow) between the anode and the cathode, the amount of oxygen in the electrolyte
solution is determined.
9
02087462 Rev. V
Page 60

1-40 Rapidlab 1200 Operator’s Guide: System Overview and Intended Use
Electrolytes
The Rapidlab 1260 and 1265 systems analyze blood samples for Na+, K+, Cl-, and Ca++ in
addition to pH and the blood gases. These systems also report the anion gap and a value
for calcium adjusted to pH of 7.40.
The sensors used for electrolytes are based on ion-selective electrode (ISE) technology.
Each sensor has a membrane that is highly selective for a specific ion.
1 Electrical contact
2 Electrolyte solution
3 Silver/silver chloride electrode
Figure 1-33 Electrolyte Sensor
The recognition mechanism in the ISE is the membrane. Each sensor has a membrane
selective for the specific substance that it measures.
02087462 Rev. V
Page 61

Rapidlab 1200 Operator’s Guide: System Overview and Intended Use 1-41
The potassium sensor membrane is designed as a charge separator. The positively
charged potassium ions selectively interact with the membrane when the sample
interfaces with the membrane. The negatively charged chloride ions do not
interact with the membrane. The charge separation causes the membrane potential
measured by the electrochemical cell.
1 Internal electrolyte solution
2 Membrane
3 Electrolyte solution
4 Randomly oriented ions
Figure 1-34 Illustrated Electrolyte Sensor
02087462 Rev. V
Page 62

1-42 Rapidlab 1200 Operator’s Guide: System Overview and Intended Use
Concentration of Sodium
Sodium (Na+) is the most abundant cation in the extracellular space in the body. Na+ is the
major determinant of extracellular osmotic regulation and plays a central role in
determining body fluid volume. The kidneys are the primary regulator of sodium and
consequently water volume; only minimal amounts of sodium are lost through the skin
and other insensible sites. Two regulatory hormones, aldosterone and the antidiuretic
hormone (ADH), affect kidney function and hence sodium balance. Aldosterone
stimulates the kidneys to reabsorb sodium; ADH stimulates the kidneys to reabsorb water.
Maintaining sodium homeostasis is essential in order to regulate body fluids, maintain
electrical potential in muscle cells, and control cellular membrane permeability.
Abnormal concentrations of Na+ stem from deficit or overload of total body water or of
sodium itself. These abnormal concentrations arise from diverse clinical conditions, such
as congestive heart failure, liver disease (cirrhosis), renal disease, neuropsychiatric
disorders (causing abnormal fluid intake), intravenous fluid therapy, excessive fluid loss
(vomiting, diarrhea, heat stroke), drug therapy (diuretics), diabetes mellitus (causing
osmotic diuresis), and imbalances of hormones (ADH, mineralcorticoid, glucocorticoid)
that regulate sodium and water excretion. An extremely abnormal plasma sodium
concentration may itself directly cause altered mental status, stupor, coma, seizures, brain
swelling, brain dehydration leading to cerebral hemorrhage or, ultimately, death. Thus
extreme abnormalities of sodium reflect a potentially life-threatening pathophysiologic
6,12
state that must be corrected promptly.
Sodium Sensor
The sodium sensor is a half-cell that combines with the external reference sensor to form a
complete electrochemical cell. The sensor contains a silver/silver chloride wire
surrounded by an electrolyte solution that has a fixed concentration of sodium and
chloride ions. The membrane, a specially formulated glass capillary that is highly selective
for sodium ions over other clinically encountered cations, separates the electrolyte
solution from the sample.
As the sample comes in contact with the membrane of the sensor, a potential develops due
to the exchange of sodium ions in the membrane. The potential developing across the
membrane is compared to the constant potential of the external reference sensor. The final
measured potential is proportional to the sodium ion concentration in the sample. The
potential developed by the electrochemical cell varies with the ion activity in each sample.
Concentration of Potassium
Potassium (K+) is the major intracellular cation. K+ plays an important role in maintaining
cell membrane potential in neuromuscular tissue. The normal level within cells is
150 mmol/L, while the normal extracellular potassium level is only 4 mmol/L. A depletion
of extracellular potassium causes an increase in the transmembrane electrical potential
gradient, which impedes the impulse formation and propagation involved in muscle
contraction.
02087462 Rev. V
Page 63

Rapidlab 1200 Operator’s Guide: System Overview and Intended Use 1-43
Most potassium is excreted by the kidney, which is the major regulator of
potassium output in the body. Actually, the kidney is better at conserving sodium
and excreting potassium so in cases where potassium intake stops, the kidney
requires time to adjust and stop excreting potassium. Two hormones, insulin and
aldosterone, can affect the extracellular level of potassium. Both insulin and
aldosterone influence intercellular uptake of potassium, while aldosterone causes
increased potassium excretion through the kidney.
High concentrations of K+ commonly stem from renal insufficiency (or failure),
excessive potassium replacement, drug effects (including some diuretics),
hemolytic disease, or crush injury. Low concentrations stem from gastrointestinal
loss, dietary insufficiency, or drug effects (most diuretics). Other metabolic
imbalances (acid-base, mineralcorticoid, glucocorticoid, insulin effects) also
cause abnormal potassium concentrations. An extremely abnormal plasma
potassium concentration may itself directly cause neuromuscular paralysis,
respiratory failure, cardiac arrhythmia, or cardiac arrest. Thus extreme
abnormalities of potassium reflect a potentially life-threatening pathophysiologic
state that must be corrected promptly.
6,12
Potassium Sensor
The potassium sensor is a half-cell that combines with the external reference
sensor to form a complete electrochemical cell. The sensor contains a silver/silver
chloride wire surrounded by an electrolyte solution that has a fixed concentration
of potassium ions. The membrane, which consists of the ionophore valinomycin
immobilized in a plasticized PVC (polyvinyl chloride) matrix, separates the
electrolyte solution from the sample. Valinomycin is a neutral ion carrier that is
highly selective for potassium ions over other clinically encountered cations.
As the sample comes in contact with the membrane of the potassium sensor, a
membrane potential is created by the interaction of potassium ions with the
membrane. The potential developing in the potassium sensor is compared to the
constant potential of the external reference sensor. The final measured potential is
directly proportional to the potassium ion concentration in the sample. The
potential developed by the electrochemical cell varies with the ion activity in each
sample.
Concentration of Chloride
Chloride (Cl-) is the major extracellular anion in the body. Cl- plays a large role in
maintaining electrical neutrality and normal osmolality, and it participates in the
regulation of acid-base balance. The kidneys are the main regulator of chloride in
the body. Serum levels of chloride usually correspond to increases and decreases
of sodium. Clinically, the serum chloride level alone is rather meaningless. A
change in chloride level does not reveal much about a patient’s condition; it must
be viewed as part of the overall fluid and electrolyte status.
02087462 Rev. V
Page 64

1-44 Rapidlab 1200 Operator’s Guide: System Overview and Intended Use
This assay is used most commonly to distinguish high-anion-gap acidoses (ketoacidosis,
lactic acidosis, uremia, poisoning from several specific agents) from hyperchloremic
acidoses (loss of alkali as in severe diarrhea, hypoaldosteronism, potassium-sparing
diuretics, renal tubular acidosis). In the absence of acidosis, changes in plasma chloride
concentration tend to parallel those of sodium. Thus chloride is high in dehydration and
low in overhydrated states.
Chloride Sensor
7,13
The chloride sensor is a half-cell that combines with the external reference sensor to form
a complete electrochemical cell capable of measuring chloride concentration in a sample.
The sensor contains a silver/silver chloride wire surrounded by an electrolyte solution that
has a fixed concentration of chloride ions. The membrane is a derivitized quaternary
ammonium compound that is immobilized in a polymer matrix. It acts as an ion exchanger
with a high selectivity for chloride ions over other ions present in the sample, and
separates the electrolyte solution from the sample.
As the sample comes in contact with the membrane of the chloride sensor, chloride ion
exchange occurs at the membrane and creates a membrane potential. The potential that
develops in the chloride sensor is compared to the constant potential of the external
reference sensor. The final measured potential is directly proportional to the chloride ion
concentration in the sample. The potential developed by the electrochemical cell varies
with the ion activity in the sample.
Concentration of Ionized Calcium
Ionized calcium (Ca++) is the physiologically active form of calcium, which comprises
approximately 45% of the total calcium in plasma. Ca
smooth vascular muscle and plays a vital part in cardiovascular function. Ca
important in muscle function, nerve function, and bone formation, and it is a cofactor in
many cellular hormone and enzyme reactions.
The action of the parathyroid hormone (PTH) — 1,25 dihydroxyvitamin D (1,25D) — and
calcitonin closely controls the concentration of calcium in extracellular fluid, and
regulates the transport of calcium across the gastrointestinal tract, kidney, and bone.
Calcium is one of the most tightly controlled analytes in the body with fluctuations of less
than 5% occurring about the mean during a 24-hour period.
Ca++ abnormalities typically stem from parathyroid disease, vitamin D imbalance, renal
disease, pancreatitis, drug effects, abnormalities of magnesium or phosphorus,
malignancy, or sarcoidosis. An extreme abnormality of Ca
symptoms, tetany, altered mental status, seizures, heart failure, or arrhythmias. Thus
extreme abnormalities of ionized calcium reflect a potentially life-threatening
pathophysiologic state that must be corrected promptly.
++
is essential for the contractility of
++
is also
14
++
may cause neuromuscular
6,15
02087462 Rev. V
Page 65

Rapidlab 1200 Operator’s Guide: System Overview and Intended Use 1-45
When measuring ionized calcium, pH should also be measured. Because
hydrogen ions compete with calcium for calcium binding sites, a change in
sample pH can have a direct effect on calcium levels. For example, a change in pH
of 0.1 can cause a change in calcium of 0.2
normal range. Its effects, if not taken into account, are clearly significant.
Calcium Sensor
mg/dL, which exceeds the span of the
16
The calcium sensor is a half-cell that combines with the external reference sensor
to form a complete electrochemical cell capable of measuring calcium levels in a
blood sample. The sensor contains a silver and silver chloride wire surrounded by
an electrolyte solution that has a fixed concentration of calcium ions. A
membrane, consisting of an ionophore imbedded in a polyvinyl chloride
membrane, separates the electrolyte solution from the sample. The ionophore is a
compound that is highly selective for calcium ions over other ions.
When the sample comes in contact with the membrane of the measuring sensor, a
membrane potential develops as calcium ions interact with the membrane. This
membrane potential is compared to the constant potential of the external reference
sensor. The final measured potential is proportional to the calcium ion
concentration in the sample. The potential developed by the electrochemical cell
varies with the ion activity in each sample.
Metabolites
The Rapidlab 1260 and 1265 systems analyze blood samples for glucose and
lactate in addition to pH, blood gases, and electrolytes.
Concentration of Glucose
Glucose is the fundamental molecule in carbohydrate metabolism. Carbohydrates,
which provide a major food supply and energy source for the body, are broken
down into simple sugars such as glucose. Glucose is then absorbed through the
intestine, passes through the liver, and eventually enters the vascular system
where it reaches the cell level to be used as fuel.
A number of factors influence the level of blood glucose. Dietary intake has a
direct effect on glucose concentration. Blood levels of glucose will fluctuate
depending on nutritional condition and the time of day when a sample is taken.
Insulin, a hormone produced by specialized cells in the pancreas, plays an
important role in regulating the blood level of glucose. By promoting
glycogenesis (conversion of glucose to glycogen) and by increasing the
permeability of cells to glucose, insulin can decrease blood glucose levels.
02087462 Rev. V
Page 66

1-46 Rapidlab 1200 Operator’s Guide: System Overview and Intended Use
Determining the blood glucose level is helpful in diagnosing many metabolic diseases.
Glucose is elevated in any of the forms of diabetes mellitus, including Type 1, Type 2,
Gestational, or any of the 50 other specific types. More moderate elevations occur in
pre-diabetic conditions known as impaired glucose levels. Diabetics sometimes suffer
acute, life-threatening metabolic crises, such as diabetic ketoacidosis that is typical in
Type 1 or hyperglycemic hyperosmolar nonketotic state that is typical in Type 2. Low
glucose levels most commonly stem from insulin overdose, but also from a number of
disorders collectively known as hypoglycemic disorders. Examples of the latter include
insulinoma, IGF
-secreting tumor, factitious hypoglycemia, postprandial syndrome,
2
severe hepatic disorders, endocrine disorders characterized by deficiencies in
gluconeogenic hormones, and some post-surgical gastric states. Extreme abnormalities of
glucose reflect a potentially life-threatening pathophysiologic state that must be corrected
promptly.
6,17,18
Concentration of Lactate
Lactate acid is an intermediary product of the anaerobic metabolism of glucose.
Glycolysis is the term commonly used to describe the conversion of glucose to lactic acid.
Under normal circumstances, glycolysis occurs during muscle contraction where the rate
of metabolism outpaces the oxygen supply in the cells. During strenuous exercise, the
level of lactic acid increases significantly and passes to the blood where it is transported to
and metabolized by the liver. In normal aerobic conditions, the lactic acid is readily
oxidized in the cell to pyruvic acid, which is eventually degraded to CO
and H2O.
2
The concentration of lactate in the blood is affected by the rate of production, the rate of
metabolism, and the availability of oxygen at the cell level.
Determining the blood lactate level is helpful in assessing the supply of oxygen at the
tissue level. Increased oxygen deprivation causes the normal oxidation of pyruvic acid to
lactate and can cause severe acidosis called lactic acidosis. This condition is characterized
by increased lactate levels and an increased lactate:pyruvic ratio in the blood due to the
lack of cellular oxidative process. Elevations of lactate are a sign of inadequate delivery of
oxygen to the peripheral tissues as occurs in respiratory failure, circulatory failure, and
clinical shock.
7
Glucose and Lactate Biosensors
The glucose and lactate biosensors are complete electrochemical cells that incorporate
amperometric technology to measure glucose or lactate concentration in samples. The
biosensors consist of 4 electrodes.
1 Platinized activated carbon electrode technology license from Cambridge Life Sciences plc. under U.S. Patent Nos 4,970,145
and 5,160,418 and foreign counterparts.
1
02087462 Rev. V
Page 67

Rapidlab 1200 Operator’s Guide: System Overview and Intended Use 1-47
22
)(
712622
)(
6126
OHOHCOOHOHC
acidgluconic
GOX
glucose
+++
→
The measuring electrode contains platinum and glucose oxidase or lactate oxidase
in a binder, while the reference electrode is composed of Ag/AgCl. Two other
electrodes are also present. The counter electrode is a Pt (platinum) conductor that
ensures a constant applied potential. Another measuring electrode, without the
enzyme, determines interfering substances in the sample. The potential from
interfering substances is removed from the total differential measurement. A
microporous cover membrane separates the electrodes from the sample.
1 Glucose or lactate measuring electrode
2 Reference electrode
3 Interference measuring electrode
4 Counter electrode
5 Sample path
Figure 1-35 Glucose and Lactate Biosensor
A constant voltage, called a polarizing voltage, is maintained during analysis. In
the glucose sensor, glucose from the sample interacts with the glucose oxidase on
the surface of the measuring electrode to form hydrogen peroxide and gluconic
acid:
where GOX is the glucose oxidase.
The polarizing voltage is sufficient to cause ox
idation of the hydrogen peroxide to
oxygen:
02087462 Rev. V
Page 68

−+
++→ eOHOH 22
222
1-48 Rapidlab 1200 Operator’s Guide: System Overview and Intended Use
22
)(
34322
)(
363
OHOHCOOHOHC
acidpyruvic
LOD
acidlactic
+++
→
−+
++→ eOHOH 22
222
The loss of electrons in the oxidation of H2O2 creates a current flow that is directly
proportional to the glucose concentration in the sample.
In the lactate sensor, lactic acid from the sample
interacts with the lactate oxidase on the
surface of the measuring electrode to form pyruvic acid and hydrogen peroxide:
where LOD is the lactate oxidase.
The polarizing voltage is sufficient to cause oxidation of the hydrogen peroxide to oxygen:
The loss of electrons in the oxidation of H2O2 creates a current flow that is directly
proportional to the lactate concentration in the sample.
Hemoglobin and its Derivatives
Hemoglobin analysis yields important information necessary to assess the function of the
oxygen transport system. The need for hemoglobin determinations led to the development
of a number of methods to determine the concentration of total hemoglobin, hemoglobin
derivatives, and dyshemoglobins in human whole blood. The presence of dyshemoglobins
and toxins changes the oxygen binding capacity of hemoglobin and therefore its ability to
transport oxygen.
19
Hemoglobin is a tetrameric protein consisting of 2 pairs of polypeptide chains, each chain
having a heme group containing 1 atom of iron. Each molecule of hemoglobin can bind up
to 4 molecules of oxygen, 1 at each heme group. Hemoglobin has a key role in the
transport of oxygen from the lungs to the tissues and the transport of carbon dioxide from
the tissues to the lungs.
The ability of hemoglobin to bind and release oxygen depends on several factors: pH,
, pO2, 2, 3-diphosphoglycerate concentration, and temperature.
pCO
2
20
The presence of dyshemoglobins (hemoglobins not available for reversible binding with
oxygen), such as carboxyhemoglobin, methemoglobin, and sulfhemoglobin, may also
affect the normal oxygen transport mechanism.
02087462 Rev. V
21
Page 69

Rapidlab 1200 Operator’s Guide: System Overview and Intended Use 1-49
Hyperlipemia can result in artificially increased methemoglobin values.
22,23
High
bilirubin concentrations can falsely increase oxyhemoglobin values. Hyperlipemia
and administration of fat emulsions can increase total hemoglobin values.
Samples frozen with liquid nitrogen can have decreased total hemoglobin
levels.23 Samples from patients receiving blood substitutes yield unreliable results
for oxygen content because of the different oxygen solubility of the blood
substitutes.
Total Hemoglobin
Total hemoglobin (tHb) is the total of all measured hemoglobin fractions.21 Total
hemoglobin determination is important in the assessment of oxygen transport and
in the evaluation of anemia. The total hemoglobin reference range for a normal
adult population is 12.0 to 18.0 g/dL.
Total hemoglobin in the CO-ox module is determined using
equation:
tHb = FO
In anemia, hemoglobin is low. Numerous spec
Hb + FHHb + FMetHb + FCOHb
2
ific types of anemia exist but each
stems from 1 of 3 basic causes: Blood loss, destruction of red blood cells, or
failure to produce new red blood cells. In polycythemia, hemoglobin is high.
Polycythemia may be primary, secondary to hypoxia, secondary to dehydration, or
a complication of over-transfusion. Polycythemia may lead to circulatory
complications as a result of increased blood viscosity. Extreme abnormalities of
hemoglobin reflect a potentially life-threatening pathophysiologic state that must
be corrected promptly.
6,24,25
the following
Oxyhemoglobin
Oxyhemoglobin (O2Hb) is the fraction of hemoglobin that is actually delivering
oxygen to body tissues.
26
Oxyhemoglobin is reversibly bound to oxygen.21 The
oxyhemoglobin reference range for arterial blood for a normal population is 94.0
to 97.0%.
The percent of oxyhemoglobin is determined using the following equation:
Hb = cO2Hb / ctHb x 100
FO
2
Deoxyhemoglobin
Deoxyhemoglobin (HHb) refers to the hemoglobin capable of binding oxygen.
21
Deoxyhemoglobin is sometimes referred to as reduced hemoglobin.
deoxyhemoglobin reference range for arterial blood for a normal population is 0.0
to 5.0%.
The
02087462 Rev. V
Page 70

1-50 Rapidlab 1200 Operator’s Guide: System Overview and Intended Use
The percent of deoxyhemoglobin is determined using the following equation:
FHHb =
This is the fraction of hemoglobin that could
pulmonary oxygenation were improved.
cHHb / ctHb x 100
deliver more oxygen to body tissues if
26
Methemoglobin
This is a fraction of hemoglobin that cannot deliver oxygen to body tissues and is elevated
in certain metabolic diseases.
hemoglobin Hi, is hemoglobin whose iron is oxidized to its ferric state [FE(III)] and is
unable to bind oxygen. High methemoglobin concentrations, a condition called
methemoglobinemia, can produce hypoxia and cyanosis. Methemoglobinemia can be the
result of hereditary conditions or of exposure to toxic substances such as nitrates, nitrites,
aniline dyes and their derivatives, and topical anesthetics such as benzocaine.
and other individuals with significant fetal hemoglobin concentrations show increased
susceptibility to methemoglobinemia because fetal hemoglobin converts to
methemoglobin more readily than adult hemoglobin.
range for arterial or venous blood for a normal population is 0.0 to 1.5%.
The percent of methemoglobin is determined using the
FMetHb = cMetHb / ctHb
26
Methemoglobin (MetHb), which is sometimes known as
21
The methemoglobin reference
following equation:
x 100
19,27
Infants
Carboxyhemoglobin
Carboxyhemoglobin (COHb) is hemoglobin covalently bound to carbon monoxide.
Hemoglobin has over 200 times greater affinity for carbon monoxide than for oxygen.
Hemoglobin bound to carbon monoxide is unavailable for oxygen transport, and high
levels of carboxyhemoglobin result in hypoxia and cyanosis, which can be fatal.
The carboxyhemoglobin reference ran
the amount of carboxyhemoglobin in the blood of healthy nonsmokers is very small
(between 0.1% and 0.4%), smoking, air pollution, and occupational exposure to carbon
monoxide affect COHb levels.
19
The percent of carboxyhemoglobin is determined using the following equation:
FCOHb = cOHb / ctHb
x 100
ge for a normal population is 0.0 to 1.5% . While
02087462 Rev. V
Page 71

Rapidlab 1200 Operator’s Guide: System Overview and Intended Use 1-51
Sulfhemoglobin
Sulfhemoglobin (SulfHb) is a stable compound of hemoglobin and sulfur. This is
a fraction of hemoglobin that cannot deliver oxygen to body tissues and may be
elevated in some patients taking sulfur-containing drugs or with certain
26
infections.
often be accompanied by methemoglobinemia. The presence of sulfhemoglobin
affects oxyhemoglobin values and other quantities if its absorbance spectrum is
not accounted for.
is 0.0 to 2.2%.
Sulfhemoglobin has an extremely low affinity for oxygen and may
19
The sulfhemoglobin reference range for a normal population
The CO-oximeter (CO-ox) module detects and indica
tes concentrations of
sulfhemoglobin greater than 1.5%.
Determination of Hemoglobin Derivatives
Hemoglobin derivatives have characteristic absorbance spectra. Each derivative
absorbs light differently at different wavelengths. Similarly, interfering substances
also absorb light at known wavelengths.
The spectral absorption method determines concentration using
For each substance or fraction, the absorbance at a specific wavelength is equal to
the product of the path length, concentration of the fraction or substance, and the
molar absorptivity or the extinction coefficient for that substance, as shown in the
following equation:
= ε1C1 + ε2C2 +... εnCn
A
x
where A
is the absorbance at a specific wavelength, ε is the major extinction
x
coefficient for that fraction or substance at a specific wavelength, and C is the
concentration of the substance.
These equations are based on the work of
Benesch, and Yung.
29
VanAssendelft
28, 29
matrix equations.
and Benesch,
02087462 Rev. V
Page 72

1-52 Rapidlab 1200 Operator’s Guide: System Overview and Intended Use
Before reaching the sample chamber, a portion of the light is diverted to a photodiode
feedback sensor located on the main circuit board. The photodiode sensor provides
electrical feedback to the lamp’s control circuit to control the lamp’s output intensity. The
cable that connects the components of the measurement module is a multi-fiber bundle
containing hundreds of fibers designed to deliver light that is uniformly distributed over
the fiber face.
The sample chamber has a sliding cell design that opens and closes to allow for
measurement. The sample chamber also contains a thermistor to control the temperature
of the sample during measurement and a detector mechanism to sense the position of the
chamber cell.
The polychromater separates the sample into its component wavelengths. The
polychromater measures the intensity of light at the different wavelengths and converts the
electrical signal to a digital value for further processing.
The wavelength calibrator consists of a neon lamp, lenses, and a filter. The neon lamp
emits a stable emission spectrum that is used to test the alignment of the polychromater.
The system makes adjustments to maintain alignment of the polychromator.
Parameters
NOTE: The parameters that your system reports depend on the sensors available on the
system and the parameters selected in Setup.
The Rapidlab 1200 systems provide results for the following parameters:
Parameters Results Description
Blood Gases pCO
Electrolyte
Metabolic HCO
2
pO
2
+
-
+
++
++
+
(7.4)
pH or H
*
Na
K
Ca
Cl
Ca
partial pressure of carbon dioxide
partial pressure of oxygen
hydrogen ion concentration (expressed as pH or
+
H
)
sodium
potassium
calcium ion concentration
chloride
calcium adjusted for pH
AnGap estimated difference of unmeasured cations and
unmeasured anions
¯act actual bicarbonate
3
¯std standard bicarbonate
HCO
3
BE(B) base excess of blood
02087462 Rev. V
BE(ecf) base excess of extracellular fluid
Page 73

Rapidlab 1200 Operator’s Guide: System Overview and Intended Use 1-53
Parameters Results Description
Oxygenation O
ctCO
2
SAT(est) oxygen saturation (estimated)
2
CT(est) oxygen content (estimated)
O
2
†
Hct
total carbon dioxide
hematocrit calculated from tHb
Metabolites
*
Temperature
Corrected
a-v Study
Parameters
†
CO-oximetry
Parameters
†
pO
2/FIO2
arterial pO2 to fraction of inspired O2 ratio
Glu glucose
Lac lactate
pH(T), H
pCO
pO
+
(T)
(T) partial pressure of carbon dioxide
2
(T) partial pressure of oxygen
2
temperature corrected pH
RI(T) respiratory index
(A-a)(T) alveolar-arterial oxygen tension diff
pO
2
(a/A)(T) alveolar-arterial oxygen tension ratio
pO
2
Qsp/Qt(T)
†
Qsp/Qt(T)(est)
physiologic shunt
†
estimated physiologic shunt
ctO2(a) arterial oxygen content
(v) venous oxygen content
ctO
2
( ) mixed venous oxygen content
ctO
2
(Hb) oxygen content of hemoglobin
ctO
2
O
2
O
2
([a- ]/a) a-v extraction index
ctO
2
(a- ) arterial-mixed venous oxygen content
ctO
2
oxygen consumption rate
oxygen delivery
difference
tHb total hemoglobin
FO
Hb oxyhemoglobin
2
FCOHb carboxyhemoglobin
FMetHb methemoglobin
FHHb deoxyhemoglobin
sO
2
hemoglobin oxygen saturation
02087462 Rev. V
Page 74

1-54 Rapidlab 1200 Operator’s Guide: System Overview and Intended Use
(
[
]
(
[
]
31.065.29.2
9.05.24
2
3
tHBA
AstdHCO
×+−
+×+=
−
()
()(
1002.0
2
estSATOtHB
BBEA
−
×
−=
Parameters Results Description
BO
2
p50 oxygen tension at 50% saturation
* Indicates parameters available only on Rapidlab 1260 and Rapidlab 1265 systems.
† Indicates parameters available only on Rapidlab 1245 and Rapidlab 1265 systems.
The sections that follow briefly describe the clinical significance of each of these
parameters.
oxygen binding capacity
Bicarbonate Ion
The majority of CO2 is transported through the body as the bicarbonate ion (HCO
which is the major buffer substance present in the body. Bicarbonate plays a central role in
maintaining the pH level in blood.
Bicarbonate levels are clinically significant in helping to determine the nonrespiratory,
renal (metabolic) component in acid-base blood disorders.
Two versions of bicarbonate exist:
• Actual bicarbonate (HCO
values, based on the recommendations from the Clinical and Laboratory Standards
Institute (CLSI) as follows:
–
HCO
• Standard bicarbonate (HCO
concentration if the blood is equilibrated to a pCO
described by VanSlyke and Cullin
act = 0.0307 × pCO2 × 10
3
–
act), which is determined directly from the pH and pCO2
3
(pH(37)–6.105)
–
std), which is a determination of the plasma HCO
3
of 40 mmHg9 using the equation
2
30
:
)
)
–
),
3
–
3
1000
where
×
)
100
and if sO2 is available, it is used in place of O2SAT(est).
NOTE: If ctHb is not available as an entered value or a measured value, the system uses
15 g/dL as a default value.
Base Excess
Base excess is an empirical expression that approximates the amount of acid or base
required to titrate 1 liter of blood to a normal pH of 7.40. Base excess is a clinically useful
way of assessing the metabolic portion of the acid-base balance.
02087462 Rev. V
9
Page 75

Rapidlab 1200 Operator’s Guide: System Overview and Intended Use 1-55
Base excess permits the estimation of the number of equivalents of sodium
bicarbonate or of ammonium chloride required to correct the blood pH to normal.
A negative value for base excess indicates a base deficit.
Two versions of base excess exist:
• Base excess of extracellular fluid [BE(ecf)], formerly known as in vivo base
excess, determined as follows:
BE(ecf) = HCO
–
act–24.8 + (16.2 × (pH(37)–7.40))
3
• Base excess of blood (BE(B)), formerly known as in vitro base excess,
determined as follows:
BE(B) = (1–0.014 × tHb) × [(HCO
–
act–24.8) + ((7.7 + 1.43 × tHb) ×
3
(pH(37)–7.40))]
NOTE: If ctHb is not available as an entered value or a measured value, the
system uses 15 g/dL as a default value.
The equations for base excess are derived from CLSI recommendations.
19
Total Carbon Dioxide
Total carbon dioxide (ctCO2) is the sum of the dissolved carbon dioxide and the
plasma bicarbonate. When evaluated with pH and pCO
, total carbon dioxide is
2
useful in distinguishing between metabolic and respiratory acid-base disorders.
The system determines total carbon dioxide according to the following equation:
ctCO2 = (0.0307 × pCO2) + HCO
–
act
3
Hematocrit
Hematocrit (Hct) is the ratio of the volume of packed red blood cells to the
volume of human whole blood. Hematocrit, with other parameters such as total
hemoglobin, is useful in the evaluation of anemia.
The estimated hematocrit value is determined using the following equation:
Hct = ctHb × 2.941
where 2.941 is a factor calculated by dividing 100 g/dL by a normal MCHC
(mean corpuscular hemoglobin concentration) of 34%.
Estimated hematocrits should not be used as the sole consideration in the
diagnosis of hematological disorders.
02087462 Rev. V
Page 76

1-56 Rapidlab 1200 Operator’s Guide: System Overview and Intended Use
0.019
CO log
correction CO
2
2
=
Δ
=
p
p
2.30 O 10 9.72
0.071 O 10 5.49
T
CO log
correction CO
3.88
2
9–
3.88
2
–11
2
2
+××
+××
=
Δ
Δ
=
p
pp
p
Patient Temperature Correction
The Rapidlab 1200 systems measurements and determinations are based on a standard
temperature of 37.0°C. During sample analysis, you can enter the actual patient
tempera
pH, pCO
ture value, which enables the system to provide temperature-corrected results for
, and pO2.
2
The system determines temperature-corrected result
factors:
19
s using the following correction
pH correction = ΔpH / ΔT = –0.0147 + 0.0065(7.4–pH)
Δ
T
Hemoglobin Oxygen Saturation
Hemoglobin oxygen saturation (sO2) is a ratio of the amount of hemoglobin bound to
19
oxygen to the total amount of hemoglobin able to bind oxygen.
saturation, with oxygen content and oxygen capacity, is a useful parameter for determining
the amount of oxygen in the blood that is actually available to the tissues and for
determining the effectiveness of oxygen therapy.
Hemoglobin oxygen saturation, expressed as a percent,
is determined using the following
equation:
Hemoglobin oxygen
= (100 x FO2Hb) / (FO2Hb + FHHb)
sO
2
Oxygen Content
Oxygen content is the concentration of the total oxygen carried by the blood, including
oxygen bound to hemoglobin as well as oxygen dissolved in plasma and in the fluid within
red cells.
Clinically, dissolved oxygen is unimportant for most
levels of hemoglobin or in patients receiving hyperbaric oxygen therapy, dissolved oxygen
may be a very significant contributor to oxygen content and thus to oxygen transport.
Oxygen content is determined, using CLSI recommendations, from the
relationship:
= (FO2Hb ×1.39 × ctHb + 0.00314 × pO2)
ctO
2
where ctHb is ex
02087462 Rev. V
pressed in g/dL and FO2Hb is decimal.
situations. However, at very low
following
19
Page 77

Rapidlab 1200 Operator’s Guide: System Overview and Intended Use 1-57
If FO2Hb is unavailable, oxygen content is derived from estimated oxygen
saturation [O
SAT(est)] according to the following equation:
2
O2CT = (1.39 × ctHb × O2SAT(est)/100)+ (0.00314 × pO2)
If ctHb is not measured or entered, O2CT is not displayed or printed.
NOTE: Clinically significant errors can result from incorporating an estimated
value for oxygen saturation in further calculations, such as oxygen content and
shunt fraction (Q
equivalent to fractional oxyhemoglobin.
), or by assuming that the value obtained [O2SAT(est)] is
sp/Qt
19
Oxygen Content of Hemoglobin
The oxygen content of hemoglobin, ctO2(Hb), is the volume of oxygen actually
bound to hemoglobin.
oxygen saturation and oxygen capacity, is a useful parameter for determining the
amount of oxygen in the blood that is actually available to the tissues and for
determining the effectiveness of oxygen therapy.
19
The oxygen content of hemoglobin, with hemoglobin
The oxygen content of hemoglobin for a sample when pO2 is not available is
determined using the following equation:
ctO2(Hb) = (OBF × tHb × FO2Hb)
where OBF is the O2 binding factor. The system uses the default value of 1.39, or
whatever value is entered as the default value in Setup. FO
Hb is in decimal
2
format.
Oxygen Capacity of Hemoglobin
The oxygen capacity of hemoglobin (BO2) is the maximum amount of oxygen
that the hemoglobin in a given quantity of blood can carry. This value represents
the potential of hemoglobin to bind to oxygen and includes all the oxygen that can
19
be bound to the available hemoglobin.
with hemoglobin oxygen saturation and oxygen content, is a useful parameter for
determining the amount of oxygen in the blood that is actually available to the
tissues and for determining the effectiveness of oxygen therapy.
The oxygen capacity of hemoglobin is determined using the following equation:
BO2 = OBF x tHb x (FO2Hb + FHHb)
where OBF is the O2 binding factor. The system uses the default value of 1.39, or
whatever value is entered as the default value in Setup. FO
decimal format.
The oxygen capacity of hemoglobin,
Hb + FHHb are in
2
02087462 Rev. V
Page 78

1-58 Rapidlab 1200 Operator’s Guide: System Overview and Intended Use
()
100*
104.2311002400015
2000204515
6234
234
2
×+−+−
++−
=
NNNN
NNNN
estSATO
p50
Half saturation of hemoglobin by oxygen (p50) indicates the partial pressure of oxygen
when oxygen has saturated 50% of the available hemoglobin. The p50 value indicates the
21
position of the oxygen-hemoglobin dissociation curve:
•Low p50 shifts
the curve to the left and indicates increased oxygen-hemoglobin
affinity
•High p50 shifts the curve to the right and indicates decreased oxygen-hemoglobin
affinity
The p5
0 value is useful in indicating the presence of abnormal hemoglobin that affects the
oxygen transport mechanism, and as an indirect measure of the 2,3 DPG concentration.
The p50 can also indicate changes in pH, pCO
, and temperature.
2
19,21
The p50 value is reported for sO2 values between 20% and 90% and is determined using
the following equation:
p50 = 26
.6 x (pO2c / pO2s)
where
pO
c = pO2 × 10
2
and pO
s is calculated with an interactive program.31
2
–[0.48 x (7.4–pH(37)) + 0.0013BE(B)]
Oxygen Saturation (Estimated)
Oxygen saturation is a ratio, expressed as a percentage, of the volume of oxygen carried to
the maximum volume of oxygen that the hemoglobin can carry. When combined with
knowledge of oxygen content, oxygen saturation is useful for evaluating the amount of
oxygen actually available for the tissues. Oxygen saturation can also be used to evaluate
e effectiveness of oxygen therapy.
th
The system estimates oxygen saturation using t
Thomas
33
as follows:
he relationship described by Kelman32 and
02087462 Rev. V
where
N = pO
[0.48(pH(37)–7.4)–0.0013 BE(B)]
× 10
2
Page 79

Rapidlab 1200 Operator’s Guide: System Overview and Intended Use 1-59
Estimated oxygen saturation [O2SAT(est)] does not account for variations in
2,3
DPG levels, carbon monoxide levels, or the presence of other
dyshemoglobins. Therefore, clinically significant errors can result from
incorporating an estimated value for oxygen saturation into further calculations,
such as oxygen content and pulmonary shunt, or by assuming that the value
obtained is equivalent to fractional oxyhemoglobin.
19
pO2/FIO
2
The pO2/FIO2 ratio is an index of the efficiency of pulmonary oxygen exchange
that relates the arterial pO
to the fraction of inspired oxygen.
2
34
Calcium Adjustment for pH
The ionized calcium concentration is dependent upon sample pH. The calcium
++
value adjusted to pH of 7.40 [Ca
(7.4)] reflects the true ionized calcium
concentration of blood normalized to pH 7.40.
The system adjusts the calcium value according to the following equation:
++
Ca
(7.4) = Ca++ × 10
[–0.178 × (7.40–pH(37))]
35
The calcium value is adjusted only when pH at 37°C is between 7.2 and 7.7,
because no reliable, published clinical data is available for correction at values
outside this
range.
35
Anion Gap
The anion gap (AnGap) is an approximation of the difference between
unmeasured cations and unmeasured anions in the sample and is useful in
determining the cause of metabolic acidosis.
35
An abnormal anion gap indicates electrolyte imbalance or other conditions where
electroneutrality is disrupted, such as diabetes, ingestion of toxins, lactic acidosis,
and dehydration.
The system determines the anion gap as follows:
AnGap = (Na+ + K+)–(Cl- + HCO
–
act)
3
02087462 Rev. V
Page 80

1-60 Rapidlab 1200 Operator’s Guide: System Overview and Intended Use
Gas Exchange Indices
Gas exchange indices are a quick way to estimate the relationship between pulmonary
dysfunction and hypoxia, and to quantitatively determine the degree of pulmonary
shunting. The primary benefit of using gas exchange indices is that they are easy to derive
at the bedside. However, they do not have a high level of correlation with the actual
measurement of arterial and mixed venous blood and should be used with discretion. A
more reliable method is the
and oxygen content.
pO
2
The gas exchange indices are provided with
sp/ t shunt fraction, which is based on measurements of
the Rapidlab 1200 systems for convenience.
Final judgment of their use is at the discretion of the physician.
All gas exchange indices require an arterial sample and
use measured values at patient
temperature.
Alveolar-Arterial Oxygen Tension Difference
The alveolar-arterial oxygen tension difference, pO2(A-a), which is sometimes
abbreviated as A-aDO
, is useful as an index of gas exchange within the lungs if the ctO
2
measurements are not available. The following equation36 is used:
(A-a)(T) = pO2(A)(T)–pO2(a)(T)
pO
2
where pO
pO
2
(A)(T) is the temperature corrected oxygen tension of alveolar gas and
2
(a)(T) is the temperature corrected oxygen tension of arterial blood.
Arterial-Alveolar Oxygen Tension Ratio
The arterial-alveolar oxygen tension ratio, pO2(a/A), which is also referred to as the a/A
ratio, provides an index of oxygenation that remains relatively stable when F
This ratio is useful in predicting oxygen tension in alveolar gas. The following equation is
37
used:
IO2
changes.
2
02087462 Rev. V
pO2(a/A)(T) = pO2(a)(T) / pO2(A)(T) × 100
where pO
pO
2
(a)(T) is the temperature corrected oxygen tension of arterial blood and
2
(A)(T) is the temperature corrected oxygen tension of alveolar gas.
Page 81

Rapidlab 1200 Operator’s Guide: System Overview and Intended Use 1-61
Respiratory Index
The respiratory index (RI(T)) is the ratio of the alveolar-arterial blood
oxygen-pressure difference to arterial pO
for patient temperature. This index is also a means of as
pulmonary shunting.
19
The system determines respiratory index as follows:
, when both values are corrected
2
sessing the degree of
RI(T) = pO
where pO
difference and pO
(A-a)(T) / pO2(a)(T) × 100
2
(A-a)(T) is the temperature-corrected alveolar-arterial oxygen tension
2
(a)(T) is the temperature-corrected oxygen tension of arterial
2
blood.
Arterial-Venous (a-v) Study
This section describes the parameters associated with an a-v study.
Arterial Oxygen Content
The oxygen content of arterial blood [ctO2(a)] is a determination of the total
oxygen carried by the arterial blood, including the oxygen bound to hemoglobin
and the oxygen dissolved in plasma and in the fluid within the red blood cells.
The system determines the oxygen content
19
recommendations
(a) = (OBF × tHb × FO2Hb) + (0.00314 × pO2)
ctO
2
where OBF is the O
as follows:
binding factor. The system uses the default value of 1.39, or
2
whatever value is entered as the default value in Setup. FO
format.
of arterial blood, based on CLSI
Hb is in decimal
2
Mixed Venous Oxygen Content
The oxygen content of mixed venous blood [ctO2( )] is a determination of the
total oxygen carried by the mixed venous (pulmonary artery) blood, including the
xygen bound to hemoglobin and the oxygen dissolved in plasma and in the fluid
o
within the red blood cells.
The system determines the oxygen content of mixed venous
19
recommendations
( ) = (OBF × ctHb × FO2Hb) + (0.00314 × pO2)
ctO
2
where OBF is the O
as follows:
binding factor. The system uses the default value of 1.39, or
2
whatever value is entered as the default value in Setup. FO
format.
blood, based on CLSI
Hb is in decimal
2
02087462 Rev. V
Page 82

1-62 Rapidlab 1200 Operator’s Guide: System Overview and Intended Use
Arterial-Venous Oxygen Content Difference
The arterial-venous oxygen content difference (ctO2(a- )) refers to the oxygen difference
between arterial and venous blood. It is a determina
to the tissues per volume of blood.
34
tion of the amount of oxygen released
When this result is obtained using a mixed venous sample, it is useful as an indicator of
changes in cardiac output and helps to assess the cardiac and metabolic factors affecting
arterial
oxygenation.
9
The system determines the arterial-venous oxygen content difference as follows:
(a- ) = ctO2(a)–ctO2( )
ctO
2
a-v Extraction Index
The a-v extraction index [ctO2([a- ]/a)] aids in the interpretation of the arterial-venous
oxygen content difference and can in
inadequate cardiac output to meet oxygen demands of the tissues.
properly determined using arterial blood and mixed venous blood.
dicate inadequate oxygen content in arterial blood or
9
The value is most
The system determines the a-v extracti
ctO
([a- ]/a) = [ctO2(a- ) / ctO2(a)] x 100
2
on index as follows:
Oxygen Consumption Rate
The oxygen consumption rate ( O2) is a determination of the volume of
oxygen consumed by the body per minute.
9
The system determines the oxygen consumption rate as follows:
O2 = ctO2(a- ) × Qt × 10
Oxygen Delivery
Oxygen delivery ( O2), which is also referred to as oxygen transport, refers to
34
the volume of oxygen per minute that is transported to the t
The system determines oxygen delivery as follows:
O2 = ctO2(a) × Qt × 10
issues.
02087462 Rev. V
Page 83

Rapidlab 1200 Operator’s Guide: System Overview and Intended Use 1-63
Physiologic Shunt
The physiologic shunt [ sp/ t(T)] is that portion of the cardiac output entering
the left side of the heart that does not perfect
calculation represents the best available means of delineating the extent to which
the pulmonary system contributes to hypoxemia.
The system determines the physiologic shunt using the following equation:
sp/ t = [(ctO2(c)–ctO2(a)) / (ctO2(a- ) + ctO2(c)–ctO2(a))] × 100
where
(c) = [OBF x tHb × (1–FCOHb–FMetHb)] + (0.00314 × A)
ctO
2
ly respire with the alveoli. The shunt
9
A = [(F
O = 10
pH
2
and the (
NOTE: If the F
OBF is the oxygen binding factor. The sys
/100) × (pAtm–pH2O)]–{pCO2(T) × [1.25–(0.25 × FIO2/100)]}
IO2
[(0.0244 x temp) + 0.7655]
+ 0.4
) in ctO2(a- ) is for a mixed venous sample.
value is not at least 40, the shunt cannot be calculated.
IO2
tem uses the default value of 1.39, or
whatever value is entered as the default value in Setup.
Estimated Shunt
Pulmonary artery blood gases are not always readily available, but a need to
determine changes in the physiologic shunt may still exist. The best alternative
method for reflecting changes in the physiologic shunt is the estimated shunt
sp/ t(est,T)] value, which is applicable to most hypoxemic patients with
[
cardiovascular stability.
The system determines the estimated shunt using the following equation:
sp/ t(est) = [(ctO2(c)–ctO2(a)) / ((ctO2(a- ), entered) + ctO2(c)–ctO2(a))] ×
100
9
where
(c) = [OBF × tHb × (1–FCOHb–FMetHb)] + (0.00314 × A)
ctO
2
A = [(F
pH
O = 10
2
For ctO
whatever value is entered as the default value
/100) × (pAtm–pH2O)]–{pCO2(T) × [1.25–(0.25 × FIO2/100)]}
IO2
[(0.0244 x temp) + 0.7655]
(a- ) entered, the system uses the default value of 3.5 mL/dL, or
2
+ 0.4
in Setup.
02087462 Rev. V
Page 84

1-64 Rapidlab 1200 Operator’s Guide: System Overview and Intended Use
OBF is the oxygen binding factor. The system uses the default value of 1.39, or whatever
value is entered as the default value in Setup.
02087462 Rev. V
Page 85

Rapidlab 1200 Operator’s Guide: System Overview and Intended Use 1-65
References
1. Kirchhoff JR, Wheeler JF, Lunte CE, Heineman WR. Electrochemistry:
principles and measurements. In: Kaplan LA, Pesce AJ., editors. Clinical
Chemistry: theory, analysis, and correlation. 2nd ed. St. Louis: CV Mosby,
1989:213-227.
2. Siggaard-Andersen O. Electrochemistry. In: Tietz NW, editor. Fundamentals
of clinical chemistry. 3rd ed. Philadelphia: WB Saunders, 1987:87-101.
3. Siggaard-Anderson O, Durst RA, Maas AHJ. Physicochemical quantities and
units in clinical chemistry with special emphasis on activities and activity
coefficients. Pure Appl Chem 1984;56:567-594.
4. Clinical and Laboratory Standards Institute (formerly NCCLS).
Standardization of Sodium and Potassium Ion-Selective Electrode Systems to
the Flame Photometric Reference Method; Approved Standard; CLSI
Document C29-A; (Vol. 15, No. 1); Mar1995.
5. Sørensen, SPL. Enzymstudien. ii, Über die Messung und die Bedeutung der
Wasserstoffionenkonzentration bei enzymatischen Prozessen. Biochem Z
1909;12:131.
6. Emancipator K. Critical values. ASCP practice parameter. Am J Clin Pathol
1997;108:247-253.
7. Levinsky NG. Acidosis and alkalosis. Ch 46 in Isselbacher KJ et al.
Harrison’s Principles of Internal Medicine, 13th Ed. New York:
McGraw-Hill, 1994:253-262.
8. Severinghaus JW, Bradley AF. Electrodes for blood pO
and pCO2
2
determination. J Appl Physiol 1968;13:515-520.
9. Shapiro BA, Harrison RA, Cane RD, Templin R. Clinical application of blood
gases. 4th ed. Chicago: Year Book Medical Publishers, 1989.
10. Moran R, Cormier A. The blood gases: pH, pO
, pCO2. Clin Chem News
2
1988;14(4/5):10-12.
11. Clark LC Jr. Monitor and control of blood and tissue oxygen tensions. Trans
Am Soc Artif Intern Organs 1956:2:41-56.
12. Levinsky NG. Fluids and electrolytes. Ch 45 in Isselbacher KJ et al.
Harrison’s Principles of Internal Medicine, 13th Ed. New York:
McGraw-Hill, 1994:242-253.
13. Tietz NW. Clinical Guide to Laboratory Tests, 3rd Ed. Philadelphia:
Saunders, 1995:124-127.
14. Mundy GR. Calcium homeostasis - the new horizons. In: Moran RF, editor.
Ionized calcium: its determination and clinical usefulness. Proceedings of an
international symposium. Galveston (TX): The Electrolyte Blood Gas
Division of the American Association for Clinical Chemistry, 1986:1-4.
02087462 Rev. V
Page 86

1-66 Rapidlab 1200 Operator’s Guide: System Overview and Intended Use
15. Toffaletti JG. Calcium, magnesium, and phosphate. Ch 47 in Lewandrowski K.
Clinical Chemistry. Laboratory Management & Clinical Correlations. Philadelphia:
Lippincott Williams & Wilkins, 2002:710-724.
16. Ladenson JH. Clinical utility of ionized calcium. In: Moran RF, editor. Ionized
calcium: its determination and clinical usefulness. Proceedings of an international
symposium. Galveston (TX): The Electrolyte Blood Gas Division of the American
Association for Clinical Chemistry, 1986:5-11.
17. Emancipator K. Glucose and carbohydrates. Ch 38 in Lewandrowski K. Clinical
Chemistry. Laboratory Management & Clinical Correlations. Philadelphia:
Lippincott Williams & Wilkins, 2002:561-574.
18. Tietz NW. Clinical Guide to Laboratory Tests, 3rd Ed. Philadelphia: Saunders,
1995:268-273.
19. Clinical and Laboratory Standards Institute (formerly NCCLS). Blood Gas and pH
Analysis and Related Measurements; Approved Standard; CLSI Document C46-A;
(Vol. 21); 2001.
20. Benesch RE, Benesch R, Yung S. Equations for the spectrophotometric analysis of
hemoglobin mixtures. Anal Biochem 1973;55:245-248.
21. Miale JB. Laboratory medicine hematology. 6th ed. St. Louis: CV Mosby, 1982.
22. Clinical and Laboratory Standards Institute (formerly NCCLS). Clinical Laboratory
Waste Management; Approved Guideline; CLSI Document GP5-A; (Vol. 13, No. 22);
Dec 1993.
23. Spurzem JR, Bonekat HW, Shigeoka JW. Factitious methemoglobinemia caused by
hyperlipemia. Chest 1984;86(7):84-86.
24. Bunn HF. Anemia. Ch 56 in Isselbacher KJ et al. Harrison’s Principles of Internal
Medicine, 13th Ed. New York: McGraw-Hill, 1994:313-317.
25. Braunwald E. Hypoxia, polycythemia, and cyanosis. Ch 32 in Isselbacher KJ et al.
Harrison’s Principles of Internal Medicine, 13th Ed. New York: McGraw-Hill,
1994:178-183.
26. Morris MW, Davey FR. Basic examination of blood. Ch 24 in Henry JB. Clinical
Diagnosis and Management by Laboratory Methods, 19th Ed. Philadelphia: Saunders,
1996:549-593.
27. Cooper HA, Hoagland JC. Fetal hemoglobin. Mayo Clin Proc 1972;47(6):402-414.
28. Selby, Samuel M., editor. CRC standard mathematical tables. Cleveland (OH): The
Chemical Rubber Co., 1971.
29. Clinical and Laboratory Standards Institute (formerly NCCLS). Protection of
Laboratory Workers from Instrument Biohazards and Infectious Disease Transmitted
by Blood, Body Fluids and Tissue; Approved Guideline; CLSI Document M29-A;
(Vol 17, No. 20); Dec 1997.
02087462 Rev. V
Page 87

Rapidlab 1200 Operator’s Guide: System Overview and Intended Use 1-67
30. VanSlyke DD, Cullin GE. Studies of acidosis 1. The bicarbonate
concentration of blood plasma, its significance and its determination as a
measure of acidosis. J Biol Chem 1917; 30: 289-346.
31. Aberman A, Cavanille JM, Trotter J, Erbeck D, Weil MH, Shubin H. An
equation for the oxygen hemoglobin dissociation curve. J Appl Physiol 1973;
35(4): 570-571.
32. Kelman GR. Digital computer subroutine for the conversion of oxygen
tension into saturation. J Appl Physiol 1966;21:1375-1376.
33. Thomas LJ. Algorithms for selected blood acid-base and blood gas
calculations. J Appl Physiol 1972; 33:154-158.
34. Malley W. Clinical blood gases: application and noninvasive alternatives.
Philadelphia: WB Saunders, 1990.
35. Burritt MF, Cormier AD, Maas AH, Moran RF, O’Connell KM. Methodology
and clinical applications of ion-selective electrodes. Proceedings of an
international symposium. Danvers (MA): The Electrolyte/Blood Gas
Division of the American Association of Clinical Chemistry, 1987.
36. Martin L. Abbreviating the alveolar gas equation: an argument for simplicity.
Respir Care 1985;30(11):964-967.
37. Peris LV, Boix JH, Salom JV, Valentin V, et al. Clinical use of the arterial/
alveolar oxygen tension ratio. Crit Care Med 1983;11(11):888-891.
02087462 Rev. V
Page 88

1-68 Rapidlab 1200 Operator’s Guide: System Overview and Intended Use
02087462 Rev. V
Page 89

2 Operating the System
This section provides procedural information about operating the Rapidlab 1200
system.
Using Basic System Functions
This section contains information about the following system functions:
• starting up the system
• entering your password
• accessing system information
• accessing online help
• shutting down the system
Starting up the Rapidlab 1200 System
To start up the Rapidlab 1200 system, plug the power cord into an appropriate
power receptacle and turn on the power switch. If this is the first time the system
is being used, refer to
according to the needs of your facility, refer to System Configuration‚ page 8-1.
Replacing Supplies‚ page 2-2. To configure your system
Entering Your Password
Depending on the security options selected in Setup, the system may prompt you
to enter your password before performing some tasks. If prompted for your
password, perform the following steps:
NOTE: For systems connected to the Rapidlink or Rapidcomm system, your
password may expire if you exceed your certification date. You cannot access the
Rapidlab 1200 system until you renew your password.
1. At the interface screen, use the numeric buttons to enter your password.
If you have an alphanumeric password, select
alphanumeric keyboard.
To enter lower- or upper-case characters, select
toggles the keyboard between lower- and upper-case character sets.
NOTE: If your system includes the optional barcode scanner, you may use the
scanner to scan your password barcode. Contact your system supervisor for
assistance.
2. Select
Continue.
After you enter your password, your operator ID displays on screens where
you need to use an operator ID.
Keyboard to use the
LOCK. The LOCK button
02087462 Rev. V
Page 90

2-2 Rapidlab 1200 Operator’s Guide: Operating the System
Replacing Supplies
Before you replace supplies, you can view a video of the following procedures:
• Emptying the waste bottle
•
Replacing the wash cartridge
• Replacing the reagent cartridge
• Replacing the AutomaticQC cartridge
Emptying the Waste Bottle
The system displays the Waste symbol on the banner when the waste bottle is 70% full.
This enables you to empty the bottle at a time when the system is not busy. If you must
replace the bottle before you can perform any other tasks, the system displays a message.
BIOHAZARD: Wear personal protective equipment. Use universal precautions.
Refer to Appendix A, Protecting Yourself from Biohazards for
precautions when working with biohazardous materials.
recommended
1. Select
Status > Waste > Replace.
2. Follow the instructions in the video.
Replacing the Wash Cartridge
The system displays the Wash Cartridge symbol on the banner when less than 10% of the
volume remains or when less than 24 hours remain before the cartridge expires. This
enables you to replace the cartridge at a time when the system is not busy. If you must
replace the cartridge before you can perform any other tasks, the system automatically
displays a message.
BIOHAZARD: Wear personal protective equipment. Use universal precautions.
Refer to Appendix A, Protecting Yourself from Biohazards for
precautions when working with biohazardous materials.
1. Select
Status > Wash Cartridge > Replace > Yes.
2. Follow the instructions in the video.
recommended
02087462 Rev. V
Page 91

Rapidlab 1200 Operator’s Guide: Operating the System 2-3
Replacing the Reagent Cartridge
The system displays the Reagent Cartridge symbol on the banner when less than
10% of the volume remains or when less than 24 hours remain before the cartridge
expires. This enables you to replace the reagent cartridge at a time when the
system is not busy. If you must replace the cartridge before you can perform any
other tasks, the system automatically displays a message.
BIOHAZARD: Wear personal protective equipment. Use universal precautions.
Refer to Appendix A, Protecting Yourself from Biohazards for
precautions when working with biohazardous materials.
recommended
1. Select
CAUTION: Do not move the reagent cartridge valve or the sample port on the
Status > Reagent Cartridge > Replace > Yes.
replacement cartridge prior to installation. Moving the valve or the sample port
may invalidate the reagent cartridge.
2. Follow the instructions in the video.
Replacing the AutomaticQC Cartridge
The system displays the AutomaticQC cartridge symbol on the banner when 10 or
fewer samples remain for any level of QC material, or when less than 24 hours
remain before the cartridge expires. This enables you to replace the AutomaticQC
cartridge at a time when the system is not busy. If you must replace the cartridge
before you can perform any other tasks, the system automatically displays a
message.
When you are replacing the AutomaticQC Cartridge, clean the waste assembly.
Refer to Cleaning the Waste Assembly‚ page 5-27.
NOTE: If you install the new AutomaticQC cartridge incorrectly, the system
displays the Cartridge Reinstall screen. You can view the video again and reinstall
the cartridge correctly.
1. Select
Status > AutomaticQC Cartridge > Replace > Yes.
2. Follow the instructions in the video.
02087462 Rev. V
Page 92

2-4 Rapidlab 1200 Operator’s Guide: Operating the System
Reinstalling the AutomaticQC Cartridge
If you have a problem the first time you install an AQC cartridge, or you remove an AQC
cartridge when in Diagnostics mode, you can reinstall it. You can also reinstall an AQC
cartridge after removing it to clean the waste housing.
NOTE: An AQC cartridge can be reinstalled more than once if it satisfies the AQC
cartridge reinstallation criteria.
AQC Cartridge Reinstallation Criteria
• The cartridge must display arrows on the back of the AQC cartridge interface
assembly. Cartridges without arrows cannot be reinstalled.
• The cartridge must be reinstalled on the system from which it was removed.
• The cartridge must be reinstalled within 6 hours of removal.
• The cartridge must have at least 1 sample left for all levels of AQC.
• The cartridge must have at least 1 day of use-life before expiration.
The system automatically evaluates the cartridge upon installation. If a cartridge fails to
meet the AQC cartridge reinstallation criteria, a message indicates that the AQC cartridge
is invalid. If this message displays you must install a new cartridge.
1. Examine the rear of the cartridge you removed to determine if there are arrows on the
back of the AQC cartridge interface assembly, as shown in Figure 2-1.
If there are no arrows, you cannot replace this AQC cartridge, but must use a new
cartridge.
Figure 2-1 Back of AQC Cartridge Interface Assembly Showing 2 Arrows Used
to Align Valve
02087462 Rev. V
The valve may not be correctly aligned after the cartridge is ejected.
Page 93

Rapidlab 1200 Operator’s Guide: Operating the System 2-5
To check, go to step 2.
Figure 2-2 Valve Aligned so Top of the Valve is Between 2 Arrows
2. Verify the valve is correctly aligned as shown in Figure 2-2, with the top of
the valve between the 2 arrows.
If the valve is not correctly aligned, manually move the valve so the top of the
valve is aligned between the two arrows.
3. Select the Status screen.
Enter your password if necessary.
4. Select the AutomaticQC icon
5. Select Replace > Yes.
6. Follow the instructions in the video to reinstall the cartridge.
Accessing System Information
You may need to access system information for assistance or when ordering
supplies. To access system information, select
Status > System Information.
Accessing Online Help
The system has online Help that provides troubleshooting and maintenance
procedures, and general information about using the system. Select the help
button, which appears as a question mark in the banner section of the main
screens.
The system initiates some online help automatically when you select certain
functions.
02087462 Rev. V
Page 94

2-6 Rapidlab 1200 Operator’s Guide: Operating the System
Shutting Down the System
Use this procedure to remove power from the system for 24 hours or less.
CAUTION: Do not remove power from the system for more than 6 hours if
cartridges are installed. Cartridges installed in the system remain stable for 6
hours without power.
CAUTION: To prevent damage to the hard drive and permanent loss of data, use
this procedure to shut down the system.
1. Select
Status > Shutdown > Yes.
2. When prompted, turn the power switch off.
The power switch is on the back panel of the system.
WARNING: Do not operate the system in the presence of flammable anesthetic
mixture with air, O
, or nitrous oxide. The risk of explosion exists in a potentially
2
explosive environment. Refer to Protecting Yourself from Electrical Hazards‚
page A-3 for recommended precautions when working around electricity.
3. To restore power to the system, turn the power switch on.
02087462 Rev. V
Page 95

Rapidlab 1200 Operator’s Guide: Operating the System 2-7
Collecting Patient Samples
This section describes sample requirements, collection procedures, and handling
techniques for pH and blood gas. The sample collection and handling guidelines
described here are also suitable for CO-ox analysis.
1
Collecting Samples
Collect blood samples under proper medical supervision when selecting a site and
performing the collection procedure. Use sterile technique at all times to avoid
infecting the sample site.
Immediately expel any bubbles that occurre
d during the sample collection. Cap
the sample device immediately after you collect the sample to avoid room air
contamination. When you collect samples with a capillary tube, fill the capillary
tube completely, cap it securely, and mix the sample thoroughly.
CAUTION: Never use mineral oil or mercury in syringes because these substances
may alter sample values and damage the system.
Collect blood in heparinized syringes that
satisfy requirements for blood gas
analysis. Use capillary tubes that contain the appropriate balanced heparin.
NOTE: To prevent hemolysis and maintain sample integrity, use capillary tubes
that do not contain mixing beads.
Using Anticoagulants
For human whole blood samples, use sample devices containing only
calcium-titrated (balanced) heparin or lithium heparin as the anticoagulant.
NOTE: Other anticoagulants, such as EDTA, citrate, oxalate, and fluoride
significantly affect blood pH, sodium, potassium, chloride, ionized calcium
results, and CO-ox results. For more information about substances that interfere
with analyte measurement, refer to Performance Characteristics‚ page E-11.
If you are analyzing samples for ionized calciu
m, you can use a maximum of 15
units of lithium heparin for each 1.0 mL of sample. If you are not analyzing
samp
les for ionized calcium, you can use up to 50 units of lithium heparin for
each 1.0 mL of sample.
1 For more information about collecting and handling patient samples, refer to Clinical and Laboratory Standards
Institute. Blood Gas and pH analysis and Related Measurements: Approved Guideline; CLSI Document C46-A;
(Vol. 21, No. 14); 2001.
02087462 Rev. V
Page 96

2-8 Rapidlab 1200 Operator’s Guide: Operating the System
Using Different Sample Sources
The Rapidlab 1200 systems can analyze samples obtained from the following sources:
Sample Source Description
Arterial blood Arterial blood is commonly recommended for use in blood gas
studies because it accurately reflects acid-base physiology and
oxygenation status.
Arterial blood is routinely obtained from the radial, femoral, or
brachial arteries. Other sites can be used following
catheterization or surgical procedures.
Venous blood Venous blood can provide satisfactory pH and pCO
however, venous pO
values may not be significant in routine
2
values;
2
clinical studies without simultaneous study of arterial pO
Venous blood is routinely obtained from an antecubital vein
using vacuum tube collection systems. Other sites can be used as
necessary. Venous oxygen saturation values reported must be so
labeled to ensure correct interpretation of the results.
Mixed venous
blood
Mixed venous (pulmonary artery) blood may be obtained from a
pulmonary artery catheter after carefully clearing the catheter of
infusion fluid. Take appropriate precautions to prevent mixing of
pulmonary capillary blood with the pulmonary artery blood.
Capillary blood Capillary blood, when carefully collected under the proper
conditions, resembles arterial blood and can be used for blood
gas studies if the sample limitations are understood.
*
Only small
quantities of blood are required for capillary blood analysis.
Capillary blood can be obtained from the heel, finger, or earlobe.
The area chosen should be prewarmed or stimulated before the
puncture to promote arterial circulation. The puncture should be
deep enough to ensure that blood flow is free and rapid. Take
appropriate precautions to minimize hemolysis, because
potassium levels are falsely elevated in hemolyzed blood.
* Clinical and Laboratory Standards Institute. Blood Gas and pH Analysis and Related
Measurements: Approved Guideline; CLSI Document C46-A; (Vol. 21, No. 14); 2001.
.
2
02087462 Rev. V
Page 97

Rapidlab 1200 Operator’s Guide: Operating the System 2-9
Handling and Storing Samples
The following condition can cause erroneous results even when samples are
collected correctly:
• Metabolic activity in the sample that occurs between sampling and
completion of analyses
• Contamination of the sample by room air
• Incorrect mixing of the sample before analysis
To minimize the errors these conditions can cause, use correct storage and
handling techniques. You can minimize errors caused by metabolic changes by
analyzing samples as soon as possible after collection. This is particularly
important for pO
oxygen and glucose, and lactate is rapidly formed during storage. Lactate is
produced by glycolysis and increases while the sample is stored. Glycolysis is
temperature dependent. Lactate increases approximately 0.1
1.0 mM/hour at 37°C.
factors:
• Storage temperature
, glucose, and lactate values, because the sample consumes
2
mM/hour at 4°C and
1
The rate of oxygen consumption depends on several
• White blood cell count
• Reticulocyte count
Observe the following sample-handling and storage steps when you obtain human
whole blood samples:
2
• Analyze the sample as soon as possible to minimize oxygen consumption.
• Blood collected for special studies, such as A-a O
gradients, or shunt studies,
2
should be analyzed within 5 minutes of collection.
• Plastic syringes should not be iced, but kept at room temperature as long as
the blood is analyzed within 30 minutes of collection.
• Oxygen and carbon diaoxide levels in blood kept at room temperature for
30 minutes or less are minimally affected except in the presence of an
elevated leukocyte or platelet count.
• If a prolonged time delay of more than 30 minutes before analysis is
anticipated, the use of glass syringes and storage in ice water are
recommended.
Syringes stored in ice water should not be used for electrolyte determinations
as room temperature effects on diffusion in and out of the red blood cells can
cause unreliable potassium results. Store in ice water is applicable to blood
gas measurements.
1 Wandrup, Clinical Chemistry, 35/8, 1741, (1989)
2 Blood Gas and pH analysis and Related Measurements: Approved Guideline; CLSI Document C46-A;
(Vol. 21, No. 14); 2001.
02087462 Rev. V
Page 98

2-10 Rapidlab 1200 Operator’s Guide: Operating the System
You can store a sample collected in a glass syringe in the ice slurry for up to 2 hours
without significant change in values for pH and pCO
, however, this affects the K+
2
and lactate values. Samples with elevated white blood cell or reticulocyte counts
deteriorate more rapidly, and you should analyze them immediately.
• Before you analyze the sample, roll the syringe or the capillary tube between your
palms and gently invert it several times to mix the sample thoroughly.
Blood cells settle during storage, and if you do not mix the sample well before
analysis, the total hemoglobin results obtained can be falsely decreased or increased.
Mix all samples using a consistent technique.
• If the sample is chilled or has been stored for more than 10 minutes, increase the
mixing time to ensure that the sample is thoroughly mixed.
• Position any labels toward the back of the syringe barrel near the plunger so the label
does not block your ability to insert the syringe into the system or cause it to fall off
after it is inserted.
• Dispose of used sample devices according to your institution’s infection control
policy.
Understanding System Limitations
The following procedural limitations apply to Rapidlab 1260 and 1265 systems:
• Avoid hemolyzed samples because they falsely elevate potassium levels due to
intra-erythrocyte potassium levels.
• Avoid samples with elevated levels of salicylates, salicylate derivatives such as
ibuprofen, and bromide (Br¯), because they falsely elevate chloride levels.
• Avoid samples contaminated with perchlorate (ClO
(I¯), and nitrate (NO
¯), because they falsely elevate chloride levels.
3
• Avoid using excessive levels of heparin anticoagulants.
Excessive levels of heparin anticoagulants cause calcium-heparin chelation and
falsely decrease calcium levels.
• Avoid using sample collection devices containing fluoride/oxalate anticoagulants
(gray-top tubes).
These anticoagulants have a significant effect on glucose and lactate.
¯), thiocyanate (SCN¯), iodide
4
02087462 Rev. V
Page 99

Rapidlab 1200 Operator’s Guide: Operating the System 2-11
Analyzing Samples
This section contains information about analyzing the following samples:
• Syringe samples
•
Capillary samples
• Microsamples
• pH and pH, Glu, and Lac samples
•tHb samples
Analyzing Syringe Samples
Use this procedure to analyze patient blood samples using a syringe.
BIOHAZARD: Wear personal protective equipment. Use universal precautions.
Refer to Appendix A, Protecting Yourself from Biohazards for
precautions when working with biohazardous materials.
recommended
1. Observe all rules and guidelines in Collect
NOTE: If you have a priority sample, but a message is displayed indicating
that the system is busy, select
Cancel to interrupt the system. If Cancel is not
ing Patient Samples‚ page 2-7.
available, wait until the message is not displayed to analyze the patient
sample.
2. At the Analysis screen, select the patient sample type (arterial, venous, mixed
venous).
The default type is a syringe of arterial blood.
3. Scan the barcode for the patient sample, if required.
4. Insert the syringe into the sample port.
5. Select
Analyze.
02087462 Rev. V
Page 100

2-12 Rapidlab 1200 Operator’s Guide: Operating the System
If the system determines that insufficient sample is present or bubbles are in the
sample, you are prompted to position the sample like a microsample. For information
about microsample analysis, refer to Analyzing Microsamples‚ page 2-14.
CAUTION: Do not leave the sample device in the sample port after the system
prompts you to remove it. The system performs a wash after each sample analysis.
Leaving the sample device in place while the system performs a wash could
contaminate that wash with blood and adversely affect the next sample or system
operation.
6. When prompted, remove the sample device and select
7. If prompted, enter demographic information and select
Continue.
Continue.
You can scan the patient ID and accession number in the appropriate field. For more
information about entering data, refer to Entering Patient Sample Data‚ page 2-22.
8. View the results.
For information about how results are displayed on the screen and printed reports,
refer to Viewing Patient Results‚ page 2-27.
9. Select
CAUTION: If the wash that is performed after sample analysis does not
Continue when you finish viewing the results.
completely clean the fluid path, you should perform an additional wash. To
determine if the path is clean, observe if any colored fluid remains in the fluid
path after analysis. To perform a wash at the Analysis screen, select Wash.
The Wash button is grayed out if the system is busy. The Wash button is not
available if the lamp failure or LIS communications error indicators, which
occupy the same space on the screen, are active.
Analyzing Capillary Samples
02087462 Rev. V
Use this procedure to analyze patient blood samples using a capillary tube.
BIOHAZARD: Wear personal protective equipment. Use universal precautions.
Refer to Appendix A, Protecting Yourself from Biohazards for
recommended
precautions when working with biohazardous materials.
NOTE: Always fill the capillary tube completely. Be sure to use the recommended
volume for the sampling mode and system model. For more information about Fill
Volumes, refer to Recommended Fill Volumes‚ page C-1.
1. Observe all rules and guidelines in Collecting Patient Samples‚ page 2-7.
 Loading...