

Page 1

Q2 – Robust performance in complicated times
Roland Busch, Deputy CEO
Ralf P. Thomas, CFO
Analyst Call, May 8, 2020
siemens.comUnrestricted © Siemens 2020
Page 2

Unrestricted © Siemens 2020
May 8, 2020Page 2 Q2 FY 2020 Analyst Call
Notes and forward-looking statements
This document contains statements related to our future business and financial performance and future events or developments involving
Siemens that may constitute forward-looking statements. These statements may be identified by words such as “expect,” “look forward to,”
“anticipate,” “intend,” “plan,” “believe,” “seek,” “estimate,” “will,” “project” or words of similar meaning. We may also make forward-looking
statements in other reports, prospectuses, in presentations, in material delivered to shareholders and in press releases. In addition, our
representatives may from time to time make oral forward-looking statements. Such statements are based on the current expectations and
certain assumptions of Siemens’ management, of which many are beyond Siemens’ control. These are subject to a number of risks,
uncertainties and factors, including, but not limited to, those described in disclosures, in particular in the chapter Report on expected
developments and associated material opportunities and risks of the Annual Report, and in the Half-year Financial Report, which should be
read in conjunction with the Annual Report. Should one or more of these risks or uncertainties materialize, events of force majeure, such as
pandemics, occur or should underlying expectations including future events occur at a later date or not at all or assumptions prove incorrect,
actual results, performance or achievements of Siemens may (negatively or positively) vary materially from those described explicitly or
implicitly in the relevant forward-looking statement. Siemens neither intends, nor assumes any obligation, to update or revise these forwardlooking statements in light of developments which differ from those anticipated.
This document includes – in the applicable financial reporting framework not clearly defined – supplemental financial measures that are or
may be alternative performance measures (non-GAAP-measures). These supplemental financial measures should not be viewed in isolation
or as alternatives to measures of Siemens’ net assets and financial positions or results of operations as presented in accordance with the
applicable financial reporting framework in its Consolidated Financial Statements. Other companies that report or describe similarly titled
alternative performance measures may calculate them differently.
Due to rounding, numbers presented throughout this and other documents may not add up precisely to the totals provided and percentages
may not precisely reflect the absolute figures.
Page 3
Unrestricted © Siemens 2020
May 8, 2020Page 3 Q2 FY 2020 Analyst Call
Our agenda for today
Q2 FY 2020 Financials
Covid-19 impact & Executing Vision 2020+
Page 4
Unrestricted © Siemens 2020
May 8, 2020Page 4 Q2 FY 2020 Analyst Call
Covid-19 update: Operations up and running near normal levels
Successful crisis management – Siemens with proven track record
Covid-19 - Where we are
▪ Priority #1: Employee health & safety
▪ Crisis proven leadership team and highly engaged
employees
▪ Reliable partner with strong balance sheet,
liquidity & rating
Operations up and running near normal levels
▪ Demand highly uncertain
▪ Global supply chains stressed
▪ 24 factory sites closed, mainly in India
▪ ~7.4k employees in short time work
▪ Further cost out initiated
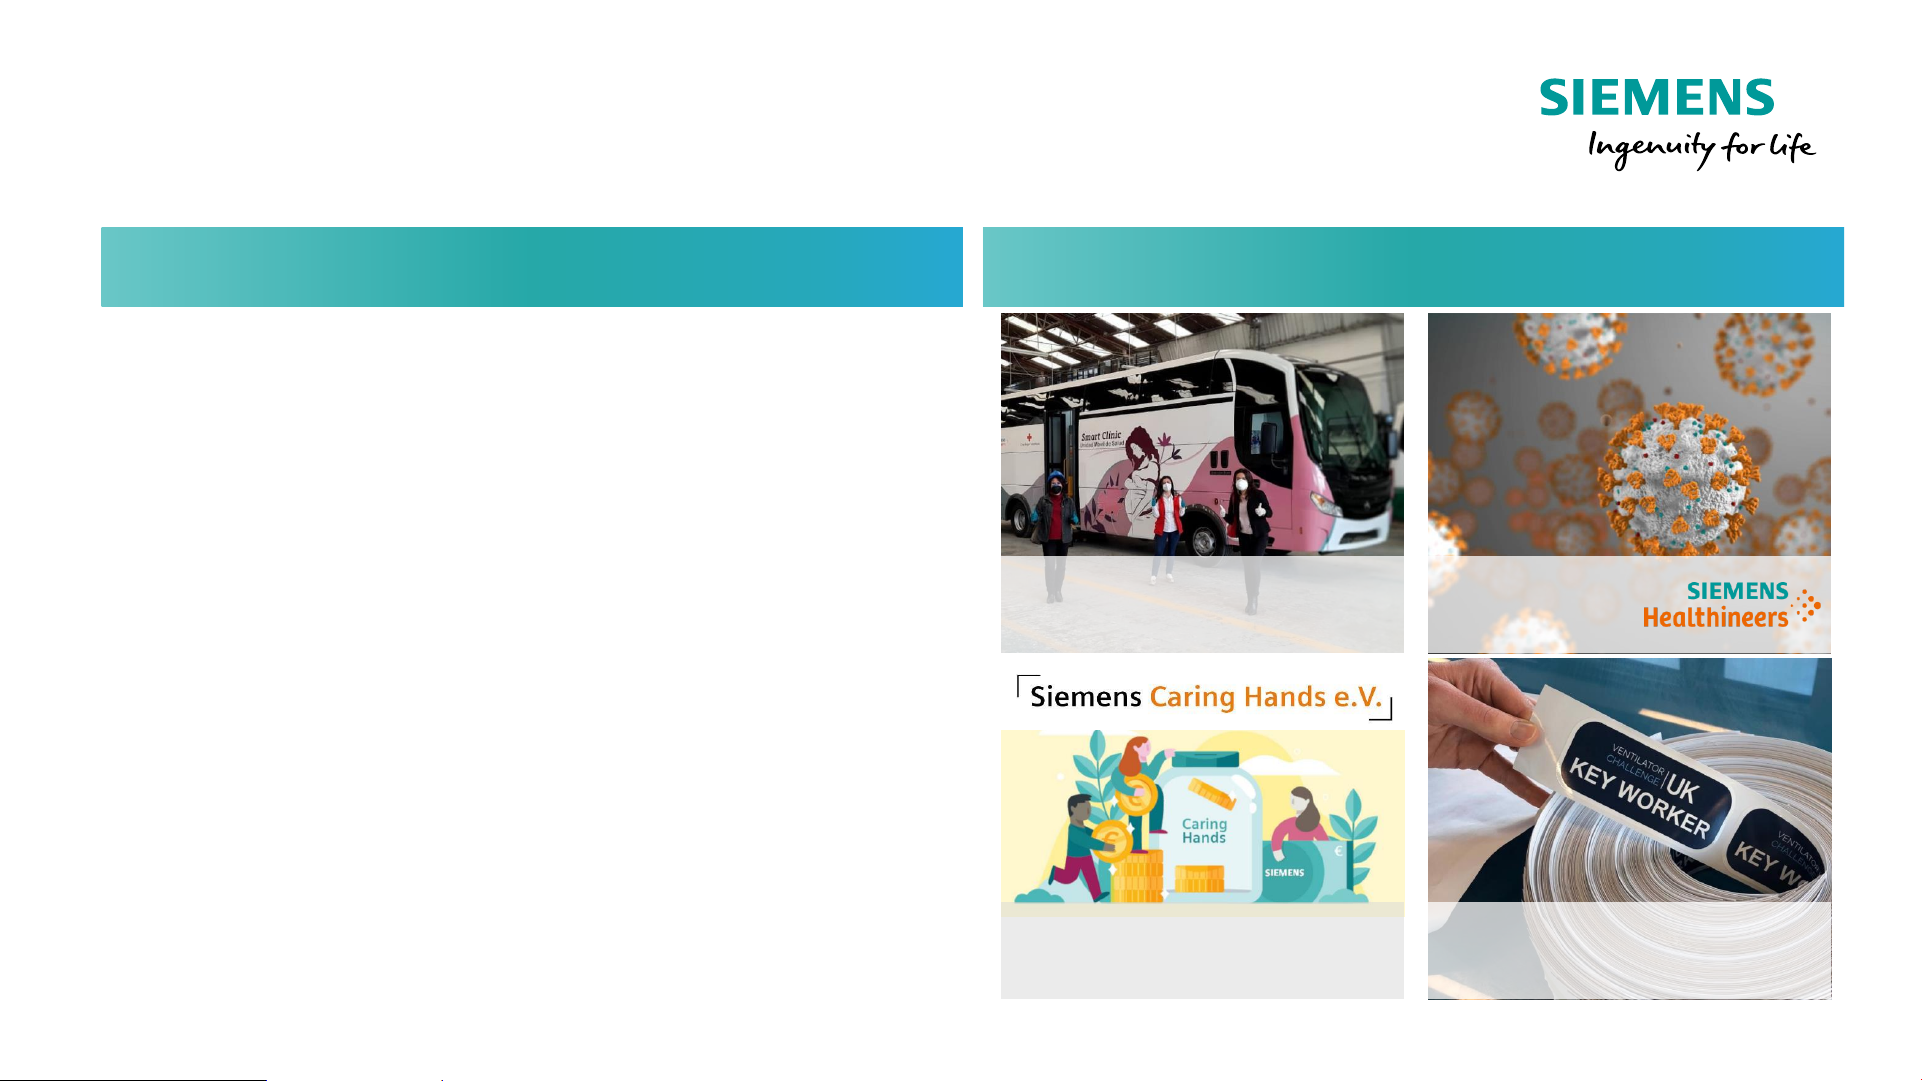
We take social responsibility to fight Covid-19
Covid-19 aid fund
Ramp up ventilator
production in UK
Covid-19 tests
released by
Siemens smart clinic
for Colombia
Page 5
Unrestricted © Siemens 2020
May 8, 2020Page 5 Q2 FY 2020 Analyst Call
Orders
Covid-19 impact not yet fully visible in FY Q2
Revenue IB Adj. EBITA
margin
Indust. ND/EBITDAFree Cash Flow (IB) EPS
-9% -1% 12.1%
€0.80 1.8x
Orders and Revenue growth comparable
€1.1bn
Page 6
Unrestricted © Siemens 2020
May 8, 2020Page 6 Q2 FY 2020 Analyst Call
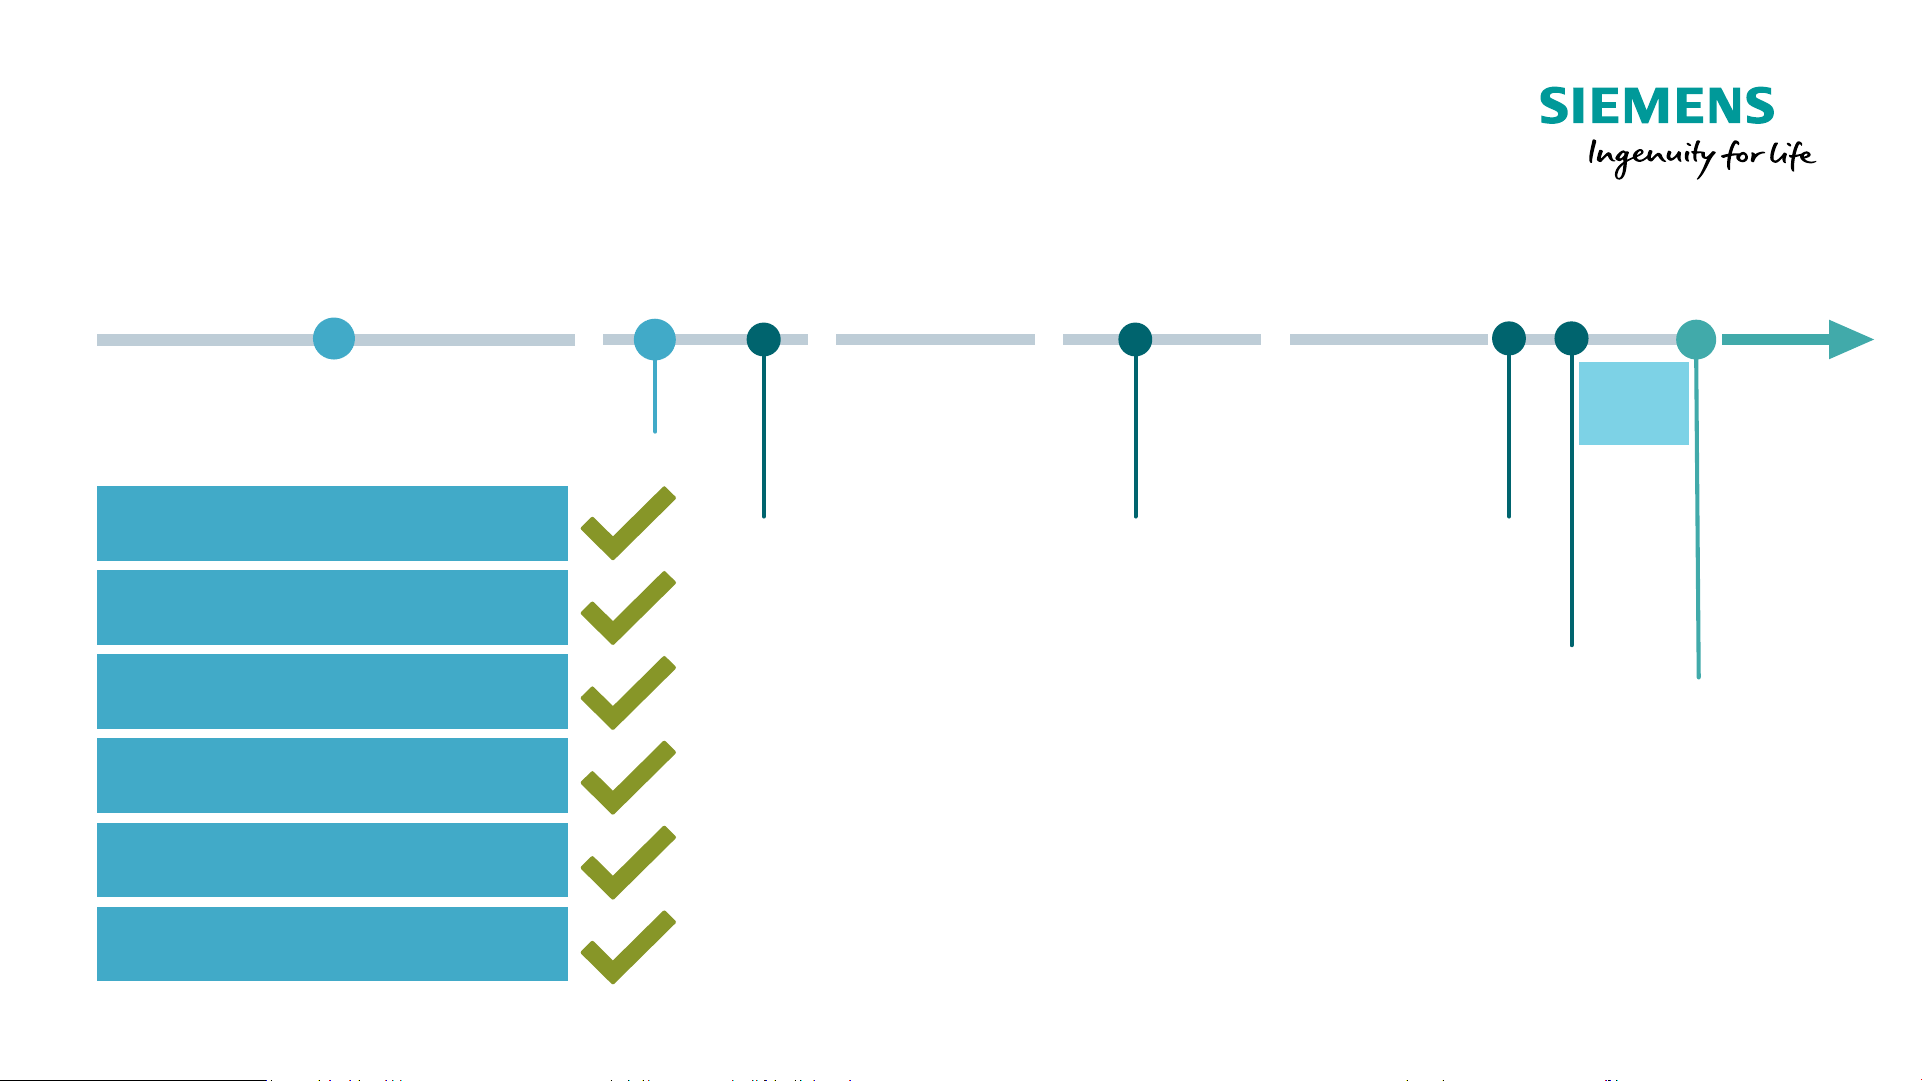
Siemens Energy on track for listing end of September
April
2020
May
2020
June
2020
July
2020
September
2020
Today
Spin-off-
Report
Extraordinary
General Meeting
(Jul 9)
Listing
Brand name announced
Carve-out effective March 31
Road-
show
Portfolio set-up defined
Leadership team in place
Acquisition +8% SGRE stake
Siemens Energy in D/O
March
2020
Carve-out
finalized
August
2020
Prospectus
Capital
Market Day
(Sep 1)
Note: In Q2-20 Siemens booked 3 LGT and 28 small turbines
Page 7
Unrestricted © Siemens 2020
May 8, 2020Page 7 Q2 FY 2020 Analyst Call
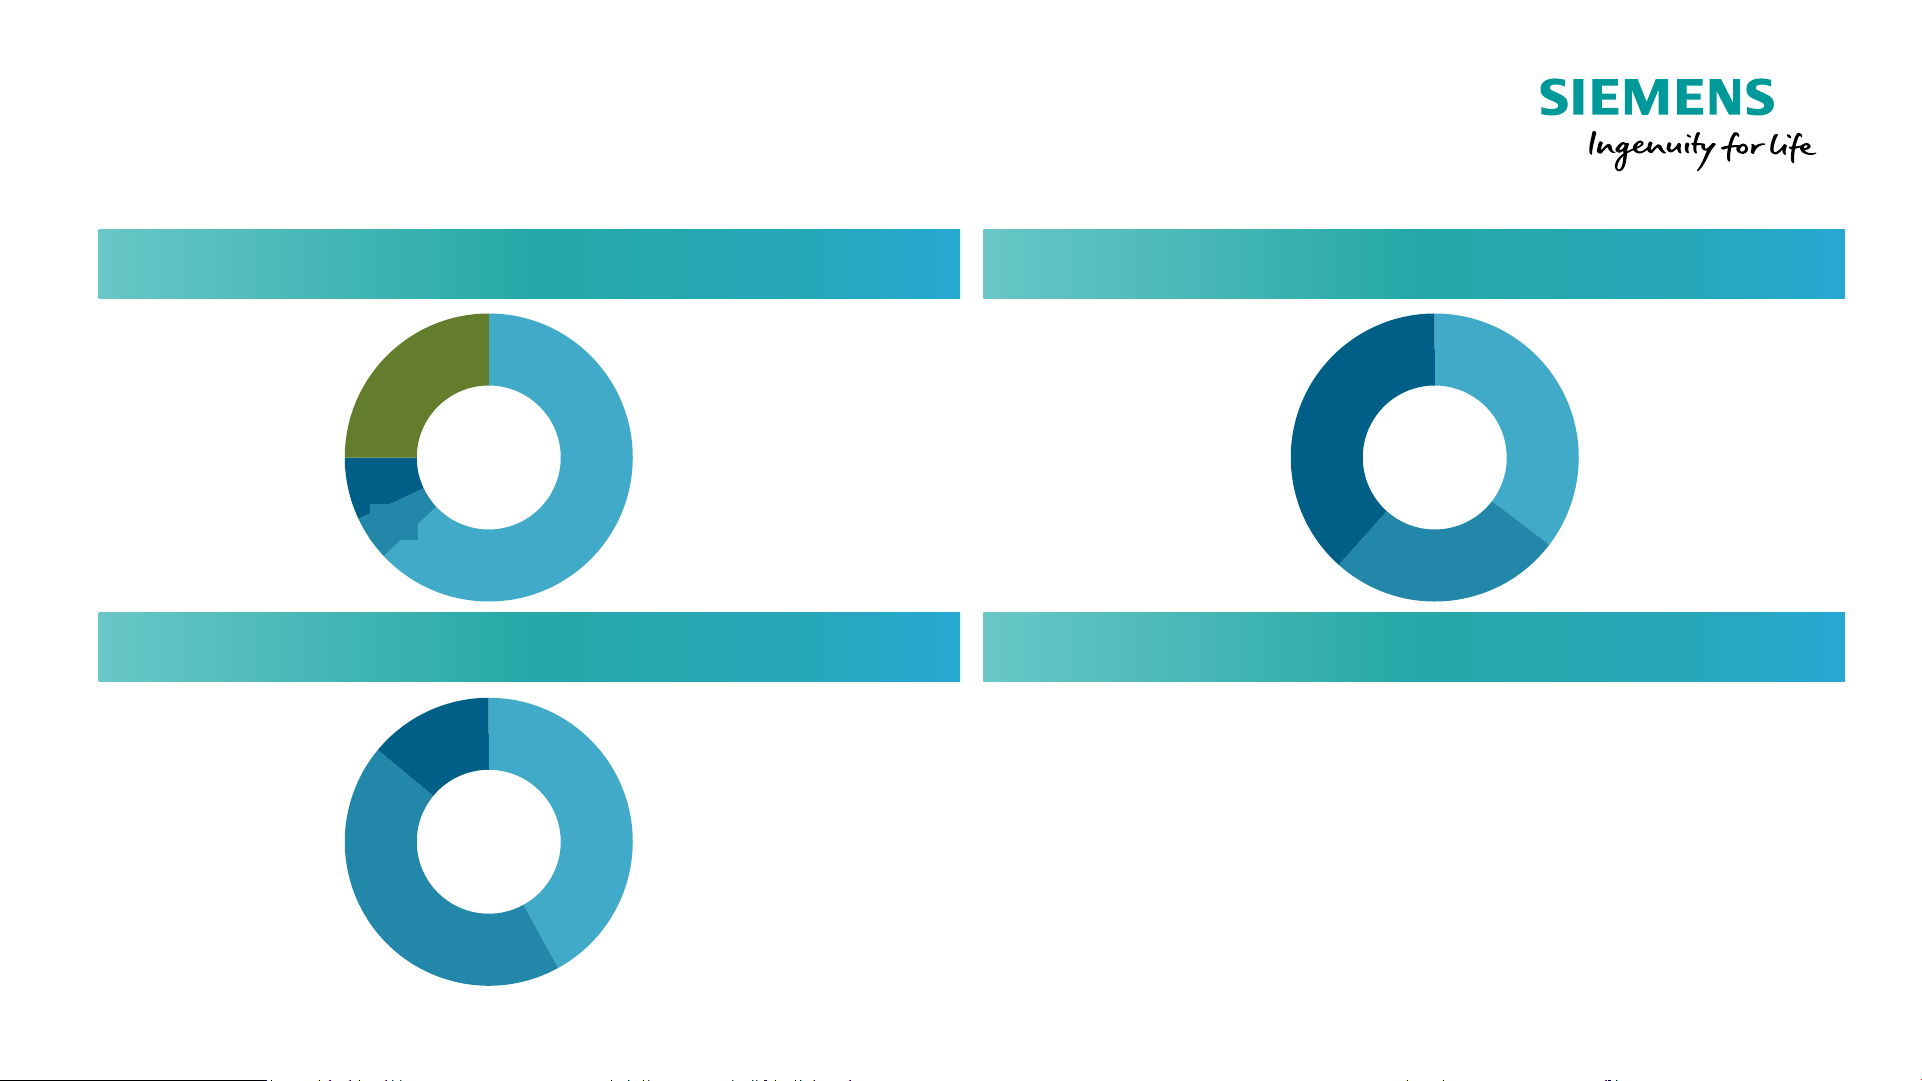
Resilient business portfolio – Ability to weather the storm
Digital Industries – €16.1bn Smart Infrastructure – €14.6bn
Resilient business portfolioMobility – €8.9bn
63%
7%
25%
Solutions
Automation Products
5%
Service
Software
Revenue
FY 2019
35%
26%
38%
Products
Systems & Software
Solutions &
Services
42%
44%
14%
Rolling Stock
Road & Rail
Infrastructure
Service
Revenue
FY 2019
Revenue
FY 2019
▪ Healthy short- and long-cycle business mix
▪ Balanced exposure to customer verticals
▪ Leading digital offerings
▪ Growing service and software share
▪ Strong order backlog
Page 8
Unrestricted © Siemens 2020
May 8, 2020Page 8 Q2 FY 2020 Analyst Call
Competitiveness programs accelerated
Contingency cost measures expanded
~ €320m
by FY 2023
~ €160m
by FY 2021
~ €300m
by FY 2023
~ €150m
by FY 2021
Cost
optimization
Operating
Companies
~ €500m by FY 2023
~ €300m by FY 2021
€90m by FY 2021
Digital Industries Smart Infrastructure
Global
Business
Services
Lean and
effective
governance
~ €320m
by FY 2023
~ €295m
by FY 2021
~ €300 m
by FY 2023
~ €180m
by FY 2021
€90m by FY 2021
Digital Industries Smart Infrastructure
CMD 2019 View
Updated View Q2 FY 20
€50m to be delivered by Siemens Energy
~ €500m by FY 2023
~ €300m by FY 2021
Page 9

Unrestricted © Siemens 2020
May 8, 2020Page 9 Q2 FY 2020 Analyst Call
A leading vertically-integrated mobility player and
integral part of Siemens AG
Siemens Mobility
Key figures FY 2019: €12.9bn Orders | €8.9bn Revenue | 11% Adj. EBITA margin | 37k employees | €32bn Backlog (March 31, 2020)
Rail & Road Infrastructure
Customer Services
Turnkey
Rolling Stock
▪ Vertical market with attractive secular growth trends and
profit pool, allowing superior capital efficiency
▪ Covering entire customer value chain with mutually-
reinforcing businesses
▪ Lead digital transformation, benefitting from Siemens IoT
ecosystem and platform
Leading integrated set-up + excellent strategic fit in Siemens
▪ Resilient performance supported by high order backlog
▪ Stringent execution despite customer access restrictions
▪ Delays & shifts of project awards weigh on order growth
▪ Revenue CAGR > 5% | Adj. EBITA-margin mid-term > 11%
▪ ROCE accretive to Siemens target
Strong execution continues despite Covid-19 impact
Page 10

Unrestricted © Siemens 2020
May 8, 2020Page 10 Q2 FY 2020 Analyst Call
Portfolio Companies (POC)
Portfolio Companies:
Stringent execution of strategy – Flender spin-off planned
Siemens Valeo (50%)
Equity
invest.
Large Drives Applications
Siemens Logistics
Mechanical Systems &
Components (Sykatec)
Commercial Vehicles
Wind Energy Generation
Fully
owned
Mechanical Drives (Flender)
1) Siemens Energy Assets (SEA) transferred into POC during Q2 FY20, containing certain remaining regional business activities of Gas and Power,
which were not carved out to Siemens Energy due to country-specific regulatory restrictions or economic considerations
Exit
▪ Integration of Wind
Energy Generation into
Flender planned
▪ Spin-off and listing of
Flender: Decision by SAG
AGM on Feb 3, 2021 –
preparation started
Turnaround
▪ Execute full potential
plans FY19-FY22
▪ Master Covid-19
challenges
▪ Target FY22: >5% Adj.
EBITA
PE / Value creation approach
Turnaround
Exit
Not carved out
Siemens Energy Assets
1)
Primetals (49%)
Ongoing transformation program
H1 FY 20: Revenue: €2.7bn
Adj. EBITA margin: 0.4%
Page 11

Unrestricted © Siemens 2020
May 8, 2020Page 11 Q2 FY 2020 Analyst Call
Digital Industries (DI)
Holding up in Q2, further decline expected in Q3 FY 20
1.0
Q2 FY 19
3.0
Q2 FY 20
1.0
4.1
3.7
2.7
-10%¹
)
Q2 FY 19 Q2 FY 20
4.1
4.2
+2%¹
)
€m
therein Software
Q2 FY 19 Q2 FY 20
-230bps
15.9%
18.7% 16.9%
17-23%
18.2%
633
652
Q2 FY 19 Q2 FY 20
+3%
0.86 1.11
¹) Comparable
Adj. EBITA margin excl. severance
x.x%
Cash Conversion Rate
x.x
Orders:
Up on safety stocking & larger
contract wins
Revenue:
Short cycle significantly down
Software moderately lower
Free cash flow:
Effective working capital
management
Margin:
Holding up, stringent execution
of cost measures
Orders Revenue
Adj. EBITA Margin Free Cash Flow
€bn
Page 12

Unrestricted © Siemens 2020
May 8, 2020Page 12 Q2 FY 2020 Analyst Call
Covid-19 putting additional headwinds on challenging economic
environment
DI revenue share in vertical end markets
Q2 FY 2020 - Key regions Automation (excl. Software)
1) Y-o-Y industry revenue development
As of Q1/20
Trend next 3-4 quarters
1)
As of Q2/20
2)
Automotive
20%
Machine Tools
15%
Food & Beverage
10%
Pharma & Chemicals
10%
Aerospace & Defense
5%
Electronics &
Semiconductors
10%
Q2 FY 2020 - Software
Revenue -3% on tough comps
FY 2020e modest growth vs PY
Orders +1% | Revenue -13%
Covid-19 intensifying headwinds for
Machinery & Automotive
Orders -2% | Revenue -9%
Q2 heavily impacted from Covid-19 shutdown
Orders +10% | Revenue -18%
Q2 impacted by lockdown measures to fight Covid-19
March with growth momentum due to restart of production
Orders +1% | Revenue -13%
Discrete & Process Automation down
Limited Covid-19 impact in Q2
Note: Orders and revenue growth comparable; Regional data based on volume 3rdparty by customer location
2) Q3 FY 20 weak development in nearly all industries
Page 13

Unrestricted © Siemens 2020
May 8, 2020Page 13 Q2 FY 2020 Analyst Call
Smart Infrastructure (SI)
Stringent implementation of competitiveness program
Q2 FY 20Q2 FY 19
1.3
2.2
1.3
2.2
3.5
3.5
-1%
1)
Q2 FY 19 Q2 FY 20
3.8
3.9
-3%¹
)
therein Products
Q2 FY 19 Q2 FY 20
-510bps
5.2%
10.6%
8.2%
10-15%
10.3%
366
280
Q2 FY 20Q2 FY 19
-23%
1.01
1.52
Orders:
Negative impact, mainly in
solutions & services
Revenue:
Product business down in
short-cycle industries
Margin:
Severance (300bps) & grid edge
investments continuing
¹) Comparable
Adj. EBITA margin excl. severance
x.x%
Cash Conversion Rate
x.x
Orders Revenue
Adj. EBITA Margin Free Cash Flow
Free cash flow:
Stringent working capital
management in difficult
environment
€m
€bn
Page 14

Unrestricted © Siemens 2020
May 8, 2020Page 14 Q2 FY 2020 Analyst Call
Siemens Mobility (MO)
Resilient performance despite Covid-19 headwinds
Q2 FY 19 Q2 FY 20
2.3
2.1
+6%¹
)
3.5
2.4
Q2 FY 19 Q2 FY 20
-32%¹
)
€bn
Q2 FY 20Q2 FY 19
-150bps
9.3%
11.1% 9.5%
9-12%
10.8%
147
-80
Q2 FY 19 Q2 FY 20
n/m
0.64
-0.38
Orders:
Down on tough comps due to
large orders in prior year
Revenue:
Growth on ramp up of large
projects
Free cash flow:
As expected, less payments on
unfavorable milestone timing
and lower orders
¹) Comparable
Adj. EBITA margin excl. severance
x.x%
Cash Conversion Rate
x.x
Orders Revenue
Adj. EBITA Margin Free Cash Flow
Margin:
Strong profitability continuing
€m
Page 15

Unrestricted © Siemens 2020
May 8, 2020Page 15 Q2 FY 2020 Analyst Call
Q2 FY 2020 - Below Industrial Businesses
Performance Q2 FY 2020
€m
therein:
-€67m Pensions
-€78m Corp. Items
Minorities
€44m
Tax Rate
@ 23.0%
652
93
34
SRE
-65
Elim., Corp.
Treasury,
Others
-302
-317
Tax
-8
IB Inc. Cont.
Ops
Net IncomeSFS POC Corp. Items,
Pensions
-146
-185
PPA
1,592
1,014
697
Disc. Ops.
Page 16

Unrestricted © Siemens 2020
May 8, 2020Page 16 Q2 FY 2020 Analyst Call
SFS with strong track record and highly diversified portfolio
▪ Focus on Siemens domains - combine financial and industrial
expertise
▪ Well diversified portfolio with a strong regional footprint in North
America and Europe
▪ Risk management culture at strict arms-length
▪ “Hold to maturity” investor – no credit trading
▪ Matched funding approach limiting risks
31%
62%
7%
Commercial
Finance
Project &
Structured Debt
Equity Business & Other
IBIT
1)
(in €m)
Total
assets
(in €bn)
286
304
1) IBIT = Income before income taxes; 2) Exposure according to split of total assets by Q2 FY20; 3) Allocation of the business to the Siemens business areas
based on the categorization by industry according to ISIC codes
Key figures
Industry diversification
3)
Consistent execution of strategy
Product diversification
2)
653
632
305
11.3
FY08
11.7
FY09 FY18
28.3
29.9
30.1
FY19 FY20 H1
41%
15%
17%
16%
11%
Siemens Core
(SI, DI, MO)
Healthineers
Siemens
Gamesa
Gas and Power
Other (IoT, PoC)
Page 17

Unrestricted © Siemens 2020
May 8, 2020Page 17 Q2 FY 2020 Analyst Call
Strong balance sheet, access to liquidity secured
▪ Strong credit rating: A1 (Moodys), A+ (S&P)
▪ €5bn equivalent bond issuance executed in
February at highly attractive terms
▪ New €3bn undrawn credit facility, adding to
existing €7.5bn undrawn credit lines
▪ US Commercial Paper market substantially
improved, further source for liquidity under
existing US$9bn program
▪ US$1.4bn maturities in remainder of FY 2020
7.8
10.5
Available funds
3.3
Cash &
cash
equivalents
Available Net
Liquidity
1)
3.6
Short-term debt
Committed
credit lines
18.3
11.4
Commercial
Paper
Other
in €bn
Strong liquidity position (March 31, 2020) Liquidity actively managed
Note: excluding Discontinued Operations Energy 1) excludes current interest bearing debt securities of €1.3bn
Page 18

Unrestricted © Siemens 2020
May 8, 2020Page 18 Q2 FY 2020 Analyst Call
FY 2020: Top line guidance revised, EPS guidance suspended
▪ Book-to-bill > 1
AssumptionsFY 2020 Siemens Group
Revenue
FY 2019
58.5
▪ COVID-19 pandemic began to impact financial results in FY Q2
▪ Expect even stronger impacts from pandemic in FY Q3
▪ Beyond FY Q3, macroeconomic developments and influence on
Siemens cannot be reliably assessed – original guidance for FY 2020
no longer confirmed
▪ Expect FY 2020 moderate comparable revenue decline, with b-t-b >1.
Decline in demand most strongly affects DI and SI.
▪ Completion of spin-off and public listing of Siemens Energy before
end of FY 2020
▪ Expect spin-off gain within D/O, amount cannot yet be reliably forecast
▪ Expect material impacts on Net income from spin-off costs and tax
expenses related to carve-out of Siemens Energy
▪ Guidance Basic EPS from Net income for FY 2020 suspended
▪ Moderate
comparable
revenue decline
1) Comparable revenue reflecting reclassification of Gas & Power &
Siemens Gamesa Renewable Energy to Discontinued Operations
in €bn
1)
Page 19

Unrestricted © Siemens 2020
May 8, 2020Page 19 Q2 FY 2020 Analyst Call
Appendix
Page 20

Unrestricted © Siemens 2020
May 8, 2020Page 20 Q2 FY 2020 Analyst Call
DI: Covid-19 putting heavy headwinds on end markets
Cost-out accelerated, contingency measures intensified
Current situation Key mitigating actions
▪ Decline in key customer industries intensified in
March, full impact in FY Q3 expected
▪ China in recovery, US & Europe still to see worse
▪ Key factories run close to normal capacity levels
▪ Daily review of SCM activities to ensure
availability of components & transportation
▪ SW-Development centers impacted by local
shutdowns in U.S. and India
▪ Best practice sharing with China to bring back
white collar employees
160
160
280
CMD May 2019
25
Q2 2020 view
320
15
320
Until FY 23
FY 19
Until FY 21
▪ Accelerate digitalization (commissioning, service)
▪ Short-time-work implemented across all businesses
▪ Flexible time frames to reduce overtime & capacity
▪ Cutbacks in discretionary spending
▪ Capex – Re-prioritization of projects
▪ Close management of receivables & payment terms
in €m
Acceleration of cost optimization program
Contingency measures intensified
1
2
Page 21

Unrestricted © Siemens 2020
May 8, 2020Page 21 Q2 FY 2020 Analyst Call
SI: Competitiveness program accelerated
Execution of Vision 2020+ on track
Current situation Key mitigating actions
▪ Short-time work & mandatory paid time off
▪ Cost cutting measures, e.g. delay of events and of
non-critical IT-projects
▪ Securing customer & ensuring supplier payments
▪ Prioritize planned Capex spending
▪ Heterogeneous development in vertical markets
Healthcare, critical infrastructure
Hospitality, education
▪ Countries with different dynamics
China recovering, U.S. and Europe challenging
▪ Out of 70 factories, 8 closed, mainly in India
▪ Solutions: Many customer sites closed, expect strong
negative Q3 impact
▪ Service: Promotion of new, remote & digital services
▪ Products/Systems: Order decline becomes visible
Competitiveness program enhanced & accelerated
200
280
200
160
440
CMD May 2019 Q2 2020 view
400
Until FY 23
Until FY 21
1
2
Additional contingency measures
–
+
Therein
business mix
€100m
€140m
Page 22

Unrestricted © Siemens 2020
May 8, 2020Page 22 Q2 FY 2020 Analyst Call
Siemens Mobility – a valid contributor to Siemens’ aspirations
Revenue
Growth
▪ Resilient market with >3% growth
supported by megatrends
▪ Enhancing growth momentum:
metro, digitalization, service, growth regions
Adj. EBITA
Margin
ROCE
4% CAGR
over last 5 years
> 5%
> 11%
11-15%
Accretive to Siemens target 15-20%
▪ Portfolio shift to higher margin &
recurring revenue business:
components, products, platforms, digital
services, signalling in the cloud
▪ Selective margin accretive portfolio
moves
▪ Digitalization in own operations
4 - 5%
~15%
10-15%
5-10%
<5%
FY 2019
FY 2009
~6%
11%
Mobility achievements
Mobility mid-term ambition
Siemens mid-term
Profitability of portfolio
Accretive to Siemens target
Page 23

Unrestricted © Siemens 2020
May 8, 2020Page 23 Q2 FY 2020 Analyst Call
Net Debt
Q1 2020
∆ Working Capital
15.5
1.2
-7.2
Net Debt
adjustments
Net Debt
Q2 2020
-0.2
-1.1
Cash flows from
investing activities
Financing and
other topics
19.1
Ind. Net Debt
Q2 2020
27.4 34.6
Q2 ΔQ1
• SFS Debt +26.3 +0.4
• Post emp. Benefits -7.5 +1.1
• Credit guarantees -0.5 +0.0
• Fair value adj. +0.8 +0.2
(hedge accounting)
Ind. Net Debt/
EBITDA (c/o)
1.8x
(Q1 FY20: 1.1x)
Cash &
cash equiv.
€12.7
1)
Cash &
cash equiv.
€9.1bn
2)
Operating Activities
Q2 FY 2020
Net debt bridge
in €bn
therein a.o.:
• Dividend paid -3.2
• Cash flows from d/o -1.6
‒ SGRE stake (Iberdrola) -1.1
‒ Free Cash Flow -0.6
• Interest paid -0.3
• Share buyback -0.9
• FX reval. Net Debt -0.4
Cash flows from
operating activities
(w/o ∆ working capital)
therein a.o.:
• Capex -0.3
• SFS -0.6
1) Sum Cash & cash equivalents of €11.4bn and current interest bearing debt securities of €1.4bn
2) Sum Cash & cash equivalents of €7.8bn and current interest bearing debt securities of €1.3bn
Page 24

Unrestricted © Siemens 2020
May 8, 2020Page 24 Q2 FY 2020 Analyst Call
Provisions decreased in Q2 mainly due to increased discount rate and
D/O of Siemens Energy, partially offset by actual return on plan assets
Q2 FY 2020 – Pensions and similar obligations
1) All figures are reported on a continuing basis
2) Difference between DBO and fair value of plan assets additionally resulted in net defined benefit assets (Q2 2020: +€0.8bn); defined benefit obligation
(DBO), including other post-employment benefit plans (OPEB) of -€0.4bn
in €bn¹
FY 2018 FY 2019
Q1 FY
2020
Q2 FY 2020
D/O
S’ Energy
Defined benefit obligation (DBO)²
-35.9 -40.3 -39.2 -33.4 -3.1
Fair value of plan assets²
28.7 31.3 31.2 26.7 2.2
Provisions for pensions and similar obligations
-7.7 -9.9 -8.6 -7.5 -1.0
Discount rate
2.4% 1.3% 1.5% 1.8%
Interest income
0.5 0.6 0.1 0.1
Actual return on plan assets
0.4 3.2 -0.5 -1.6
Page 25

Unrestricted © Siemens 2020
May 8, 2020Page 25 Q2 FY 2020 Analyst Call
Q2 FY20 Profit Bridge from SHS disclosure to SAG disclosure
Different profit definitions at SHS and SAG to be considered in models
659
612
42
EBIT
(adjusted)
-1
PPA effects
600
Transaction
Cost (M&A)
-17
Severance EBIT
(as reported)
-42
PPA effects
0
Financial
Income
Severance
-30
17
629
in €m
Margin
x.x%
17.9%
16.3%
16.6%
17.1%
disclosure (as of May 8, 2020) disclosure (as of May 5, 2020)
Adj. EBITA
(excl. severance)
Consolidation
and accounting
differences
Adj. EBITA
(as reported)
Page 26

Unrestricted © Siemens 2020
May 8, 2020Page 26 Q2 FY 2020 Analyst Call
Financial calendar
Jul 9, 2020
Extraordinary
AGM
investorrelations@siemens.com
www.siemens.com/investor
+49 89 636-32474
May 8, 2020
Q2 Release
Aug 6, 2020
Q3 Release
Nov 12, 2020
Q4 Release
Jun 12, 2020
JPM Conference
virtual
Sep 10, 2020
MS Conference
London
Sep 1, 2020
CMD Siemens
Energy
 Loading...