

SICK VSPM-6F2113, VSPM-6F2113S19, VSPM-6F2313, VSPM-6F2313S20, VSPM-6F2413 Reference Manual
...Page 1

Inspector PIM60 ver 2.0
Vision sensor
REFERENCE MANUAL
Page 2
WARNING
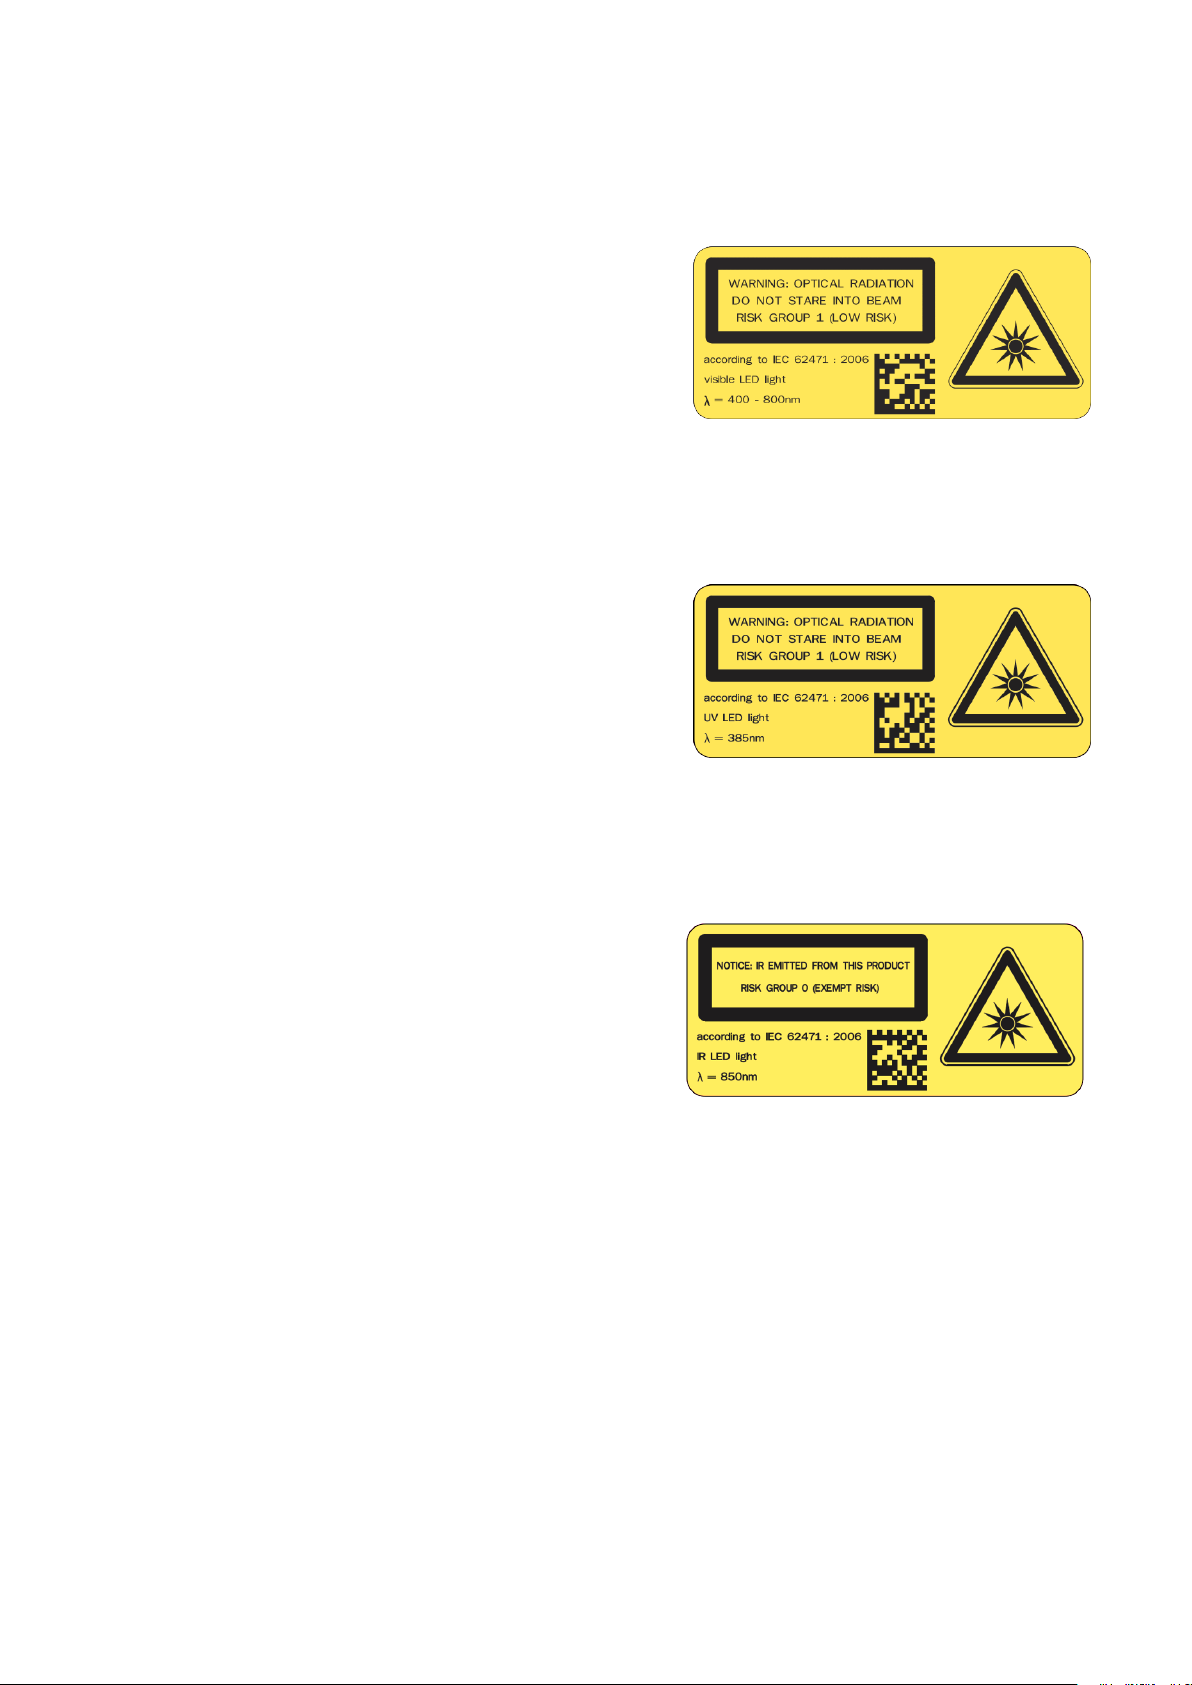
VSPM-6F2113 (Inspector PIM60), VSPM-6B2113 (Inspector PIM60 Base)
The Inspector is equipped with a LED illumination
that must be considered as a lamp system of Risk
Group 1 (low risk) according to IEC 62471:2006
Accessible irradiance at distances > 200 mm:
LB<4 x 10⁴W/(m2sr) within 100 s
LH<106W/(m2sr) within 10 s
WARNING: OPTICAL RADIATION DO NOT STARE INTO BEAM
RISK GROUP 1 (LOW RISK) according to IEC 62471:2006
Visible LED light λ = 400-800 nm
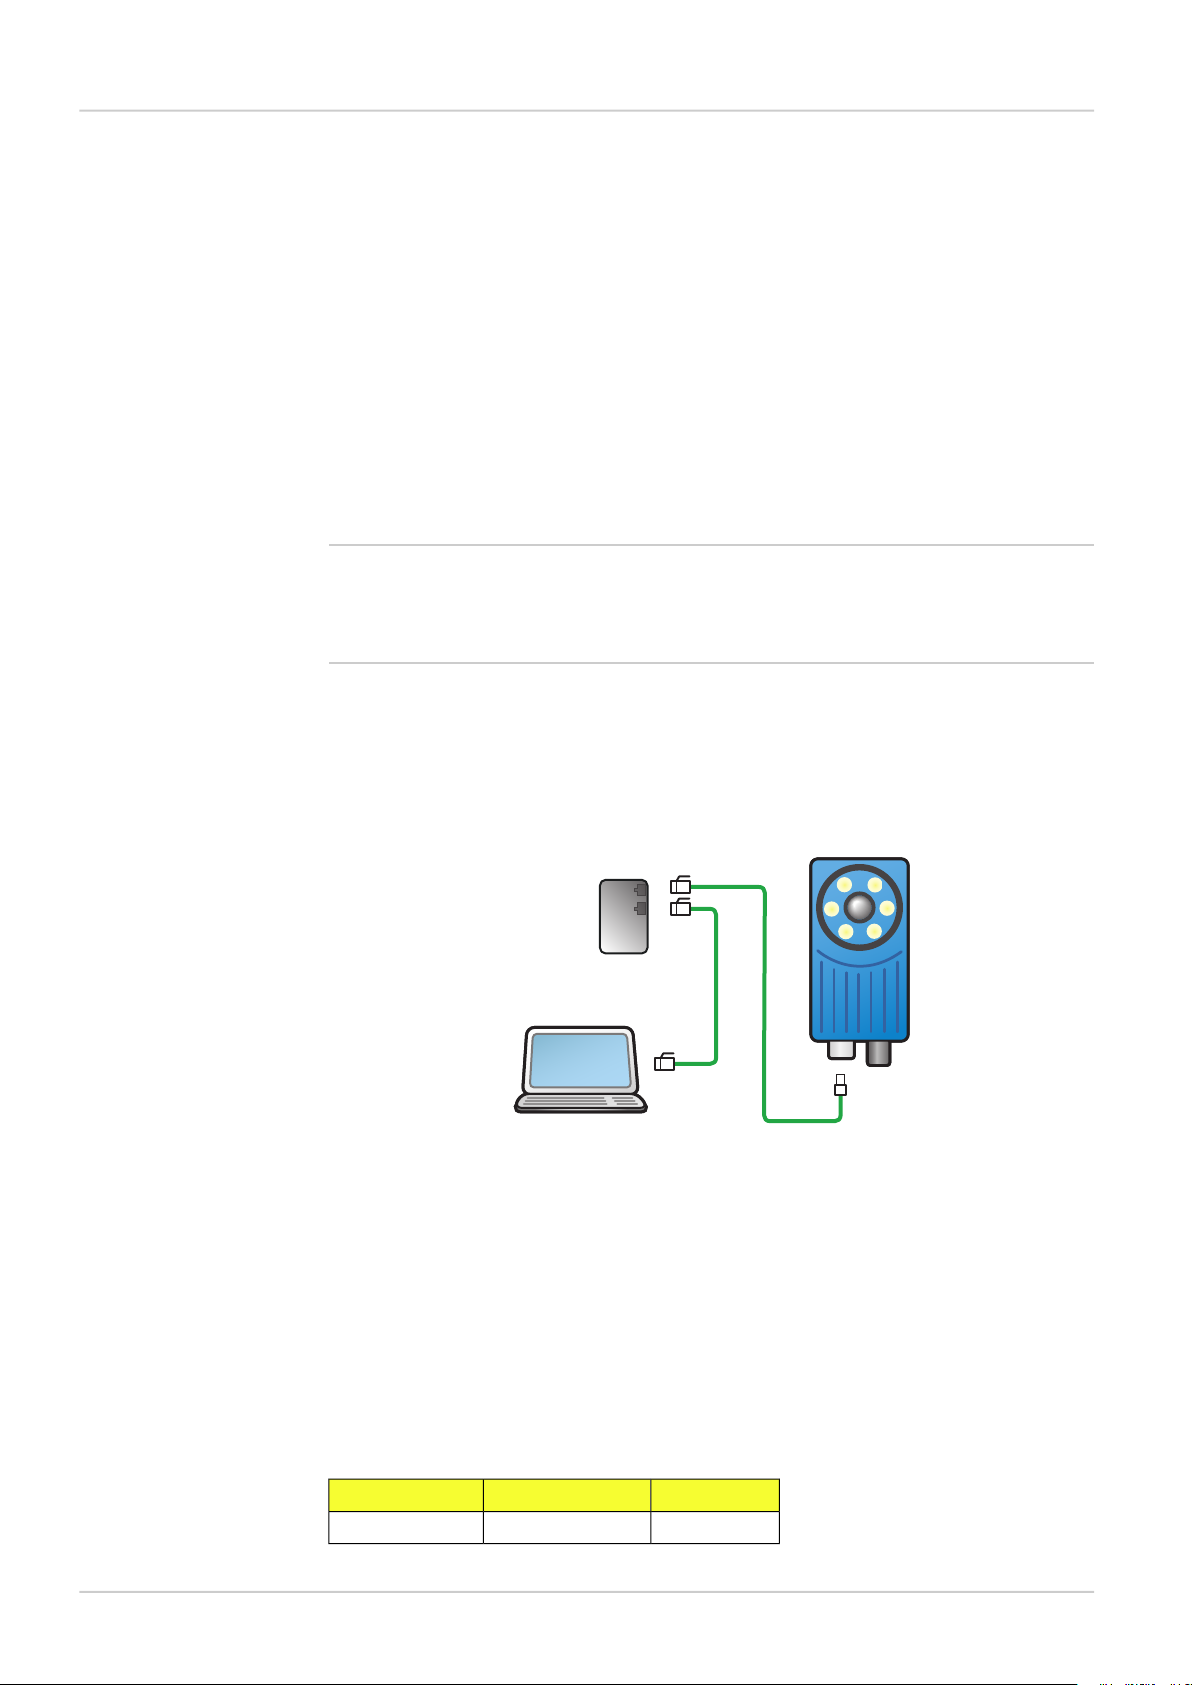
VSPM-6F2313 (Inspector PIM60-LUT)
The Inspector is equipped with a LED illumination
that must be considered as a lamp system of Risk
Group 1 (low risk) according to IEC 62471:2006
Accessible irradiance at distances > 200 mm:
ES< 3 x 10⁻³W/m2within 104s
E
< 33 W/m2within 300 s
UVA
LR< 7 x 10⁶W/(m2sr) within 10 s
WARNING: OPTICAL RADIATION DO NOT STARE INTO BEAM
RISK GROUP 1 (LOW RISK) according to IEC 62471:2006
UV LED light λ = 385 nm
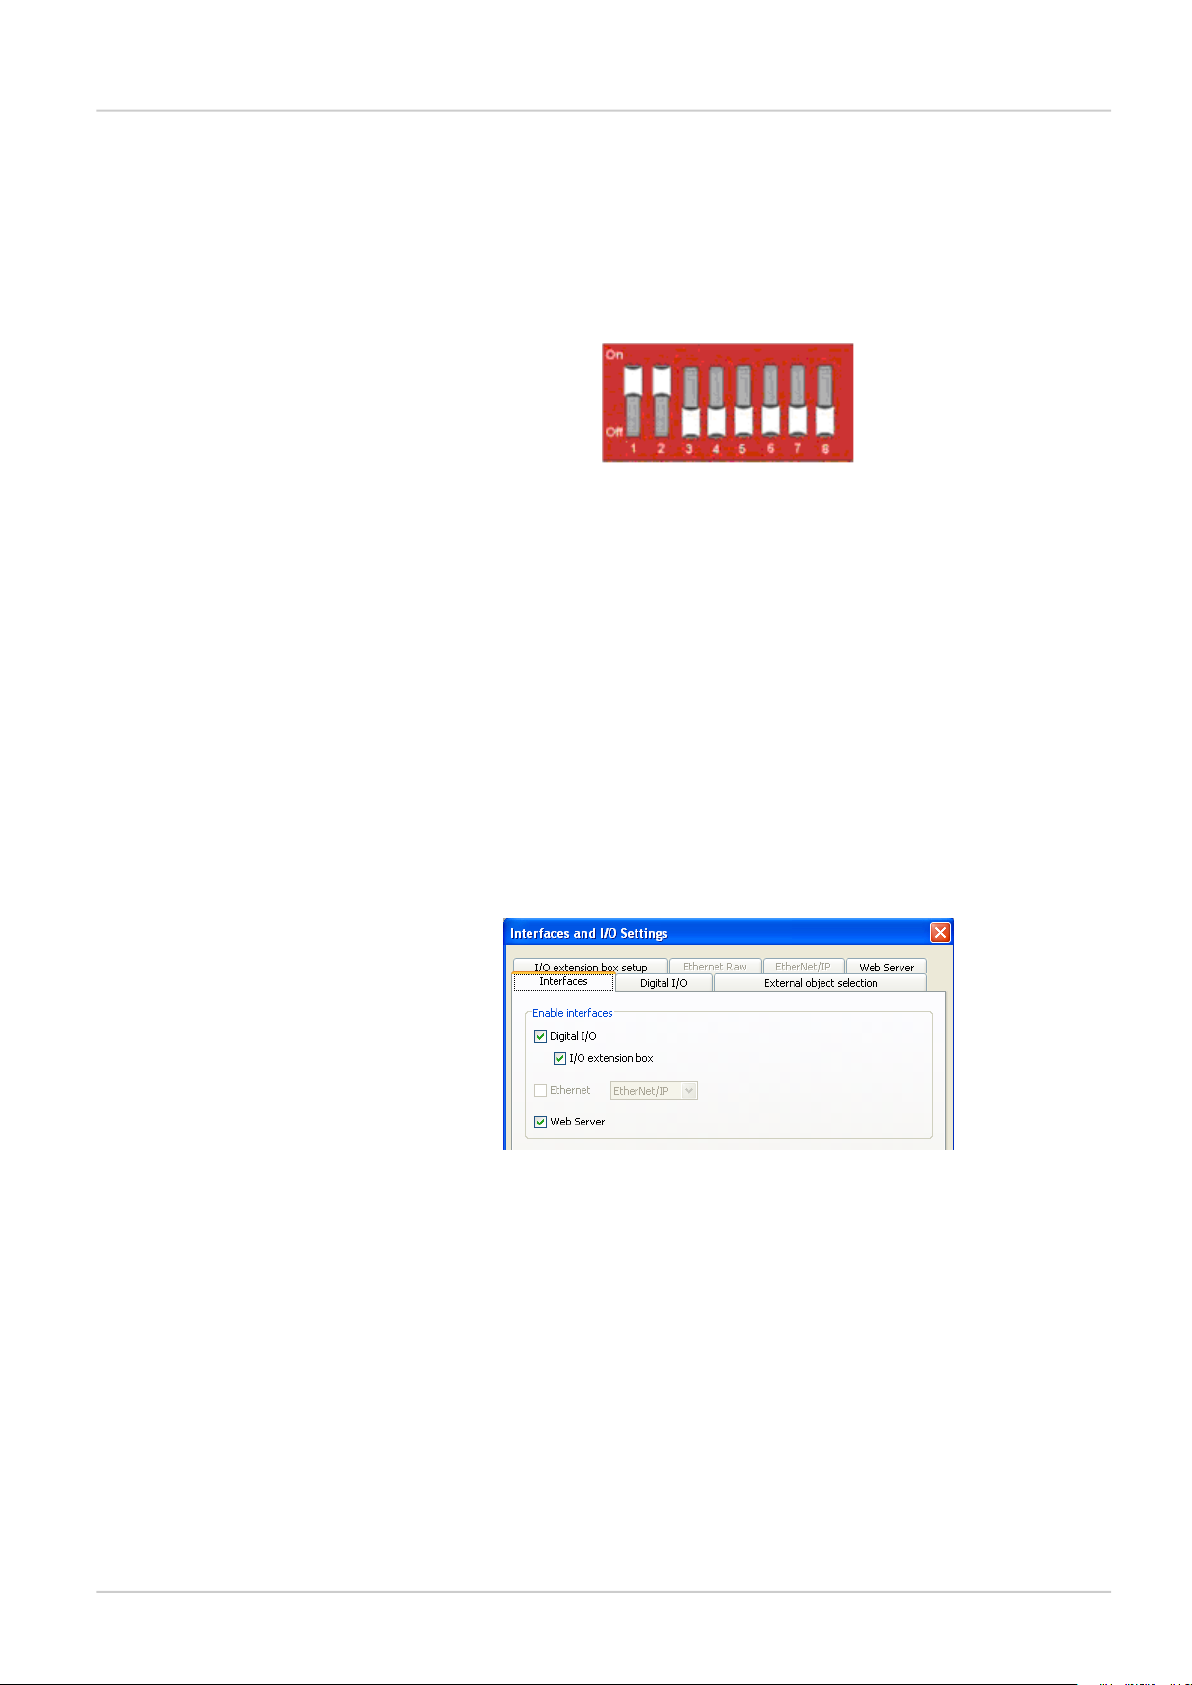
VSPM-6F2413 (Inspector PIM60-IR), VSPM-6B2413 (Inspector PIM60-IR Base)
The Inspector is equipped with an LED illumination that must be considered as a lamp system
of Risk Group 0 / Free Group (exempt risk) according to IEC 62471:2006
Accessible irradiance at distances > 200 mm:
EIR< 100 W/m2within 103s
LIR< 1.2 x 10⁶W/(m2sr) within 103s
NOTICE: IR EMITTED FROM THIS PRODUCT
RISK GROUP 0 (EXEMPT RISK) according to IEC 62471:2006
IR LED light λ = 850 nm
DISCLAIMER
SICK uses standard IP technology for its products, e.g. IO Link, industrial PCs. The focus here is on providing availability of products and services. SICK always assumes that the integrity and confidentiality of data and rights involved
in the use of the above-mentioned products are ensured by customers themselves. In all cases, the appropriate
security measures, e.g. network separation, firewalls, antivirus protection, patch management, etc., are always implemented by customers themselves, according to the situation.
©SICK AG 2013-11-28
All rights reserved
8015726/2013-11
Subject to change without notice
0.1.0.105
Page 3

Reference Manual
Inspector PIM
Table of Contents
Inspector PIM60
Introduction 5
1 Introduction ................................................. ......................................... 6
1.1 Interfaces overview . .. .. .. .. .. .. .. .. .. ................................................. 6
1.2 Intended readers ....................................................................... 6
Interfaces 7
2 I/O extension box .................................................................................. 8
2.1 Physical network connection ........................................................ 8
2.2 Configuration of the IP address on the I/O extension box ................. 8
2.2.1 Basic configuration of the IP address ........ .. .. .. .. .. .. .. .. .. .. 9
2.3 Setup of the I/O extension box in the SOPAS Single Device applica-
tion .... .. .. .. .. .. .. .. .. .. .. .................................................................. 9
2.3.1 Enabling the I/O extension box ................................... 10
2.4 Input and output connections .................................................... 10
2.4.1 Special conditions during startup .. ............................. 10
2.4.2 Connection to the I/O extension box lost during opera-
tion ...................... .. .. .. .. .. .. .. .. .. .. .. ............................ 11
2.4.3 Object selection with I/O extension box ....................... 11
2.4.4 Timing issues ........................................ .. .. .. .. .. .. .. .. .. 11
2.4.5 Use of the digital outputs for logic .............................. 11
2.4.6 Change of Modules in the I/O extension box ................ 11
2.5 Troubleshooting ........ .. .. .. .. .. .. .. .. .. .. ........................................... 11
2.5.1 The I/O LED flashes 10 times .................................... 11
2.5.2 No contact with the I/O extension box ......................... 11
2.5.3 High number of unanswered requests to the I/O exten-
sion box . .. .. .. .. .. .. .. .. .. .. ............................................. 12
3 Web interface ............................................. ......................................... 13
3.1 Introduction ....................................................................... .. .. .. 13
3.2 Get results via Web API ...... .. .. .. .. .. .. .. .. .. .. ................................... 13
3.2.1 Live image ........... .. .. .. .. .. .. .. .. .. .. .. .............................. 13
3.2.2 Detailed results .................... .. .. .. .. .. .. .. .. .. .. ............... 13
3.2.3 Synchronize live image with result .............................. 14
3.2.4 Logged images ........................................................ 14
3.2.5 Statistics .. .. .. .. ......................................................... 15
3.3 Control the sensor via Web API ... .. .. .. .. .. .. .. .. ................................ 15
3.3.1 Basic principles ............................................ .. .... .. .. . 15
3.3.2 Command syntax ..................................................... 15
3.3.3 Current reference object ........................................... 16
3.3.4 Backup and restore configuration ............................... 16
3.4 Create custom web pages . .. ...................................................... 17
3.4.1 Example: Display live image .. .. .. ................................. 19
3.5 Handle the Web API ........................ .. .. .. .. .. .. .. .. .. ........................ 21
4 Ethernet Raw ................... ...................................................... ............. 22
4.1 Introduction ....................................................................... .. .. .. 22
4.1.1 Port interval ............................................................ 22
4.2 Get results via Ethernet Raw .. .. .. .. .. .. .. .. .. .................................... 22
4.2.1 TCP versus UDP . .. .. .. .. .............................................. 22
4.2.2 ASCII versus binary ................................................... 22
4.2.3 Attributes .................................... .. .. .. .. .. .. .. .. .. .. .. .. .... 23
4.2.4 Example formatting strings . .. .. ................................... 23
4.3 Control the sensor via Ethernet Raw ........................................... 26
4.3.1 Basic principles ............................................ .. .... .. .. . 26
4.3.2 Command syntax ..................................................... 26
8015726/2013-11
©SICK AG • Advanced Industrial Sensors • www.sick.com • All rights reserved
Subject to change without notice
3
Page 4

Inspector PIM60
Reference Manual
Inspector PIM
4.3.3 Select reference object .................................. .. .. .. .. .. . 27
4.3.4 Image triggering ....................................................... 27
4.3.5 Single port solution .................................................. 27
5 EtherNet/IP ............................. ........................................................... 28
5.1 Introduction ....................................................................... .. .. .. 28
5.2 Get results via EtherNet/IP ........................................................ 28
5.2.1 Attributes .................................... .. .. .. .. .. .. .. .. .. .. .. .. .... 28
5.2.2 Example formatting strings . .. .. ................................... 28
5.3 Control the sensor via EtherNet/IP . .. .. .. ...................................... 33
5.3.1 Basic principles ............................................ .. .... .. .. . 34
5.3.2 Command syntax ..................................................... 34
5.3.3 Select reference object .................................. .. .. .. .. .. . 34
5.3.4 Image triggering ....................................................... 35
5.3.5 Input assemblies, result channel . ............................... 35
5.3.6 Assemblies command channel ................................... 36
Appendix 38
A Result output formatting ...................................................................... 39
A.1 XML based formatting ............................................................... 39
A.2 XML formatting ........................................................................ 39
A.3 Container specific tags ............................................................ . 40
A.3.1 General tags . ........................................................... 48
A.3.2 Attributes . .. .. .. .. .. .. .. .. ............................................... 49
B Command channel ............................................................................... 52
B.1 Command syntax . .. .................................................................. 52
B.1.1 Commands ID numbers for EtherNet/IP ...................... 53
B.2 Command channel index handling .. ............................................ 54
B.2.1 Introduction ....................... .. .. .. .. .. .. .. .. .. .. .. ................ 54
B.2.2 Blob indexing ........................................................... 54
B.2.3 Polygon indexing . .. .. .. .. .. .. .. .. .. .. ................................. 54
B.2.4 Tools indexing .......................................................... 54
B.3 Command descriptions .. .. .. .. .. .. .. ............................................... 54
B.4 Error codes ... .. .. .. .. .. .. ............................................................... 72
B.5 Version information . ................................................................. 75
B.6 Command examples .. .. .. .. .. .. .. .. .. .. .. ........................................... 75
B.6.1 Command examples Ethernet Raw .. .. .. .. ..................... 75
C Restore configuration over Web API ......................................... ............. 77
C.1 Restore configuration ................................. .. .. .. .. .. .. .. .. .............. 77
C.2 Create session cookie .............................................. .. .. .. .. .. .. .. .. . 77
C.3 Login ................................................................................. .. .. . 77
C.4 Prepare restore mode ............................................................... 78
C.5 Transfer restore file to device ................................................ .. .. . 78
C.6 Device restart ........ .. .. .. .. .. .. .. .. .. .. .............................................. 78
Index ............................................................................................ .. .. .. .. .. .. .. .. 79
4
©SICK AG • Advanced Industrial Sensors • www.sick.com • All rights reserved
Subject to change without notice
8015726/2013-11
Page 5

Introduction
Page 6

Introduction
Introduction
Reference Manual
Inspector PIM
1
Introduction
The Reference Manual is a complement to the Operating Instructions for Inspector PIM60
and covers the functionality of all product variants.
The Reference Manual contains detailed information about the interfaces including syntax
and available functionality. It focuses on Inspector PIM60 specific topics and does not describe
the basic technology behind each interface.
The details of the result output formatting and the contents and syntax of the command
channel are shared by several interfaces. They are described in an appendix valid for all relevant interfaces.
For instructions on configuring the interfaces, refer to the Operating Instructions.
1.1 Interfaces overview
The Reference Manual contains detailed information for the following interfaces:
• I/O Extension Box is used to increase the number of available input and output connections
• Web API interface is intended for integration with external HMI implementations, and for
customized web pages on the Inspector
• Ethernet Raw interface is intended for integration with external PLC equipment
• EtherNet/IP interface is intended for integration with external PLC equipment following the
EtherNet/IP communication standard
1.2 Intended readers
The intended readers of the Reference Manual are users working with integration between
the Inspector PIM60 and other equipment, for example PLC programmers and customized
human machineiInterface (HMI) developers.
The readers are assumed to have knowledge about the Inspector PIM60 product and features
as described in the Operating Instructions for Inspector PIM60. The readers are also assumed
to have knowledge about the basic functionality of the technology of the interfaces used for
the integration.
6
©SICK AG • Advanced Industrial Sensors • www.sick.com • All rights reserved
Subject to change without notice
8015726/2013-11
Page 7

Interfaces
Page 8
Interfaces
I/O extension box
Reference Manual
Inspector PIM
2
I/O extension box
The Inspector PIM60 can be connected to an I/O extension box that increases the number
of digital inputs and outputs. The I/O Extension box is available as an accessory from SICK.
This section covers how the I/O extension box is connected to the Inspector, and how it is
configured.
The following basic steps are required to use the I/O extension box with the Inspector. Details
about the steps are found in the subsequent sections.
1. Connect the I/O extension box to the network.
2. Configure the IP address of the I/O extension box to match the settings of the network,
and the Inspector.
3. Enter the IP address of the I/O extension box in the SOPAS Single Device application.
4. Activate the inputs and/or outputs on the I/O extension box depending on the application.
Note
The SOPAS Single Device application should be closed or set to offline when the power to the
I/O box is disconnected. The I/O extension box needs to be restarted if the IP address is
changed or if the connections to the inputs and outputs on the box are changed.
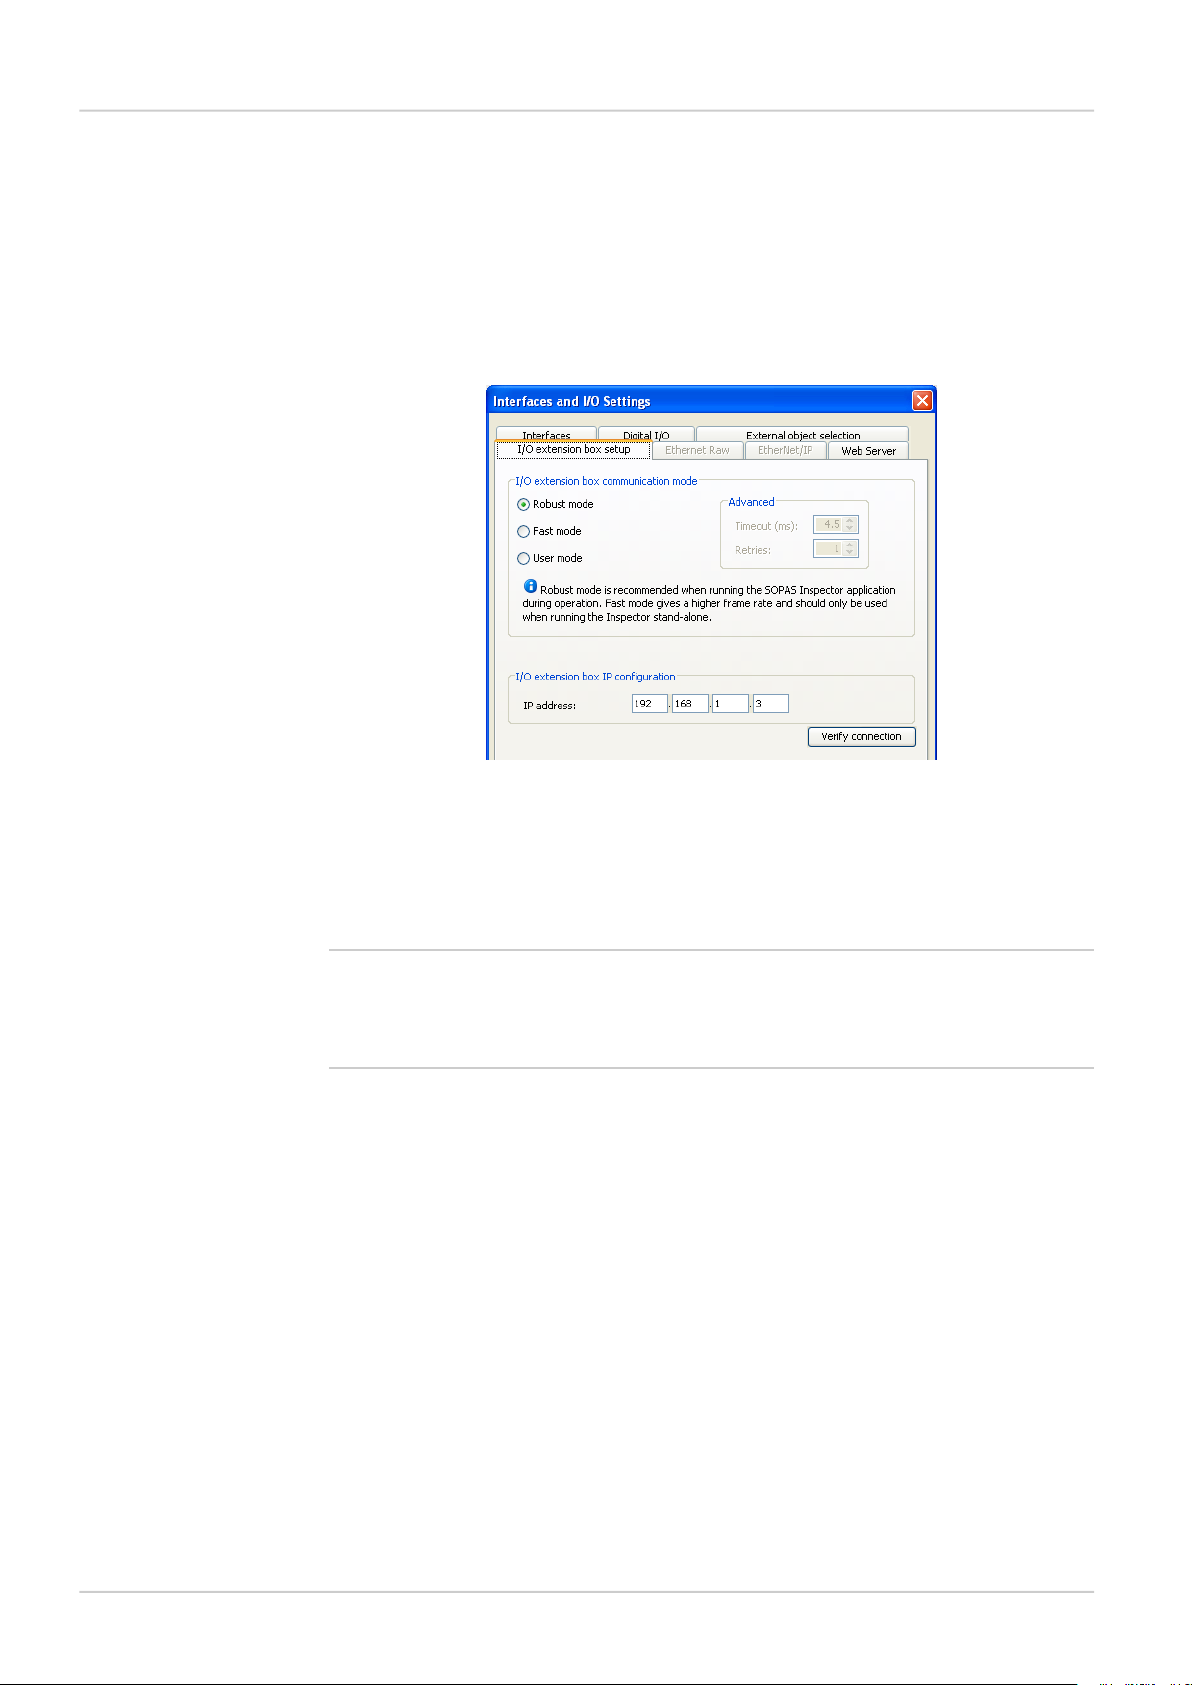
2.1 Physical network connection
To minimize network latency, it is recommended that the I/O extension box is connected
directly to the Inspector. The I/O box has a network switch so that a PC running SOPAS Single
Device can be connected via the I/O box.
InspectorI/O Extension box
PC with SOPAS
Single Device
Figure 2.1 Physical network connection
2.2 Configuration of the IP address on the I/O extension box
This section briefly describes how to configure the I/O extension box for operation with the
Inspector. For details, please refer to the user manual delivered with the I/O extension box.
The IP address of the I/O extension box must be compatible with the addresses of the Inspector and of the PC. For details of how to set and view the IP address of the Inspector, please
refer to the Operating Instructions for Inspector PIM60.
The following is an example of how the IP addresses can be configured for the Inspector, the
I/O box and the PC.
PCI/O Extension BoxInspector PIM60
192.168.1.30192.168.1.3192.168.1.110
8
©SICK AG • Advanced Industrial Sensors • www.sick.com • All rights reserved
Subject to change without notice
8015726/2013-11
Page 9
Reference Manual
Inspector PIM
I/O extension box
2.2.1 Basic configuration of the IP address
The address selection switch on the I/O extension box configures the host part of the IP address, that is, the last of the four parts of the IP address. By default, the first three parts of
the address (also known as the network address) are set to 192.168.1. If the switch is set
to a value other than 0 (all switches set to Off) or 255 (all switches set to On), the I/O extension
box will use the host part of the IP address assigned by the switch.
Figure 2.2 Example
The setting above configures the I/O extension box to have a host ID of 3 corresponding to
the binary value “00000011” where switch 1 is bit 0 (LSB) and switch 8 is bit 7 (MSB). The
I/O box will then have an IP address of 192.168.1.3.
Advanced configuration of the IP address
If the network part of the IP address must be changed from the default 192.168.1 for the
I/O extension box, the internal web server of the I/O extension box can be used. For details
please refer to the manual delivered with the I/O extension box.
Interfaces
2.3 Setup of the I/O extension box in the SOPAS Single Device application
The communication with the I/O extension box is configured using the Interfacesand I/O Settings
dialog from the InspectorPIM60 menu. Check the Digital I/O and I/O extension boxes in the Inter-
faces tab. The I/O extension box is disabled if EtherNet/IP is selected in the same tab.
Figure 2.3 I/O Extension Box setup
Communication mode
It is possible to adjust the way that the Inspector is communicating with the I/O extension
box. The settings are made in the I/O extension box setup tab in the Interfaces and I/O Settings
dialog from InspectorPIM60 menu. There are three modes available:
• Robust mode. This is the default communication mode, and it is the recommended one if
the Inspector is connected to the SOPAS Single Device application during operation.
• Fast mode. This mode allows the Inspector to operate at a higher frame rate but there is
a risk that some data in the communication with the I/O extension box is lost if there is
high load on the network. This mode shall not be used if the Inspector is connected to the
SOPAS Single Device application during operation.
• User mode. This is the advanced communication mode where it is possible to configure
the number of retries that the Inspector performs, and the timeout for each retry. The
timeout is the time (in milliseconds) that the Inspector is waiting for a reply from the I/O
extension box for a request to set outputs or read inputs.
8015726/2013-11
©SICK AG • Advanced Industrial Sensors • www.sick.com • All rights reserved
Subject to change without notice
9
Page 10
Interfaces
I/O extension box
Reference Manual
Inspector PIM
IP configuration
To be able to connect to the I/O extension box, the IP address of the I/O extension box must
be specified in the SOPAS Single Device application.
To specify the IP address of the I/O extension box:
1. Open the Interfaces and I/O Settings dialog from the InspectorPIM60 menu. Enter the selected
IP address of the I/O extension box setup tab in the four fields separated with dots.
2. Click Apply to store the settings.
Figure 2.4 Set up mode and IP address
Verify connection
It is possible to verify that the connection to the I/O extension box can be established by
clicking the Verify connection button. The SOPAS Single Device application will then try to connect
to the I/O extension box, and a message will be displayed informing if the I/O extension box
was found.
Note
It is possible to configure the Inspector for use with the I/O extension box even when the I/O
extension box is not available. As soon as the Inspector detects the I/O extension box on the
network, it will connect to it and start using it as configured.
2.3.1 Enabling the I/O extension box
The use of the inputs and outputs on the I/O extension box is enabled on the Digital I/O tab
of the Interface and I/O Settings dialog from the InspectorPIM60 menu.
2.4 Input and output connections
When delivered, the I/O extension box contains 4 digital inputs and 8 digital outputs. The
digital outputs can be expanded to 16, and the digital inputs of the Inspector PIM60 can be
extended to 5.
Please refer to the manual delivered with the I/O extension box for details on how to connect
the power supply to the box, and where to find the digital inputs and outputs.
10
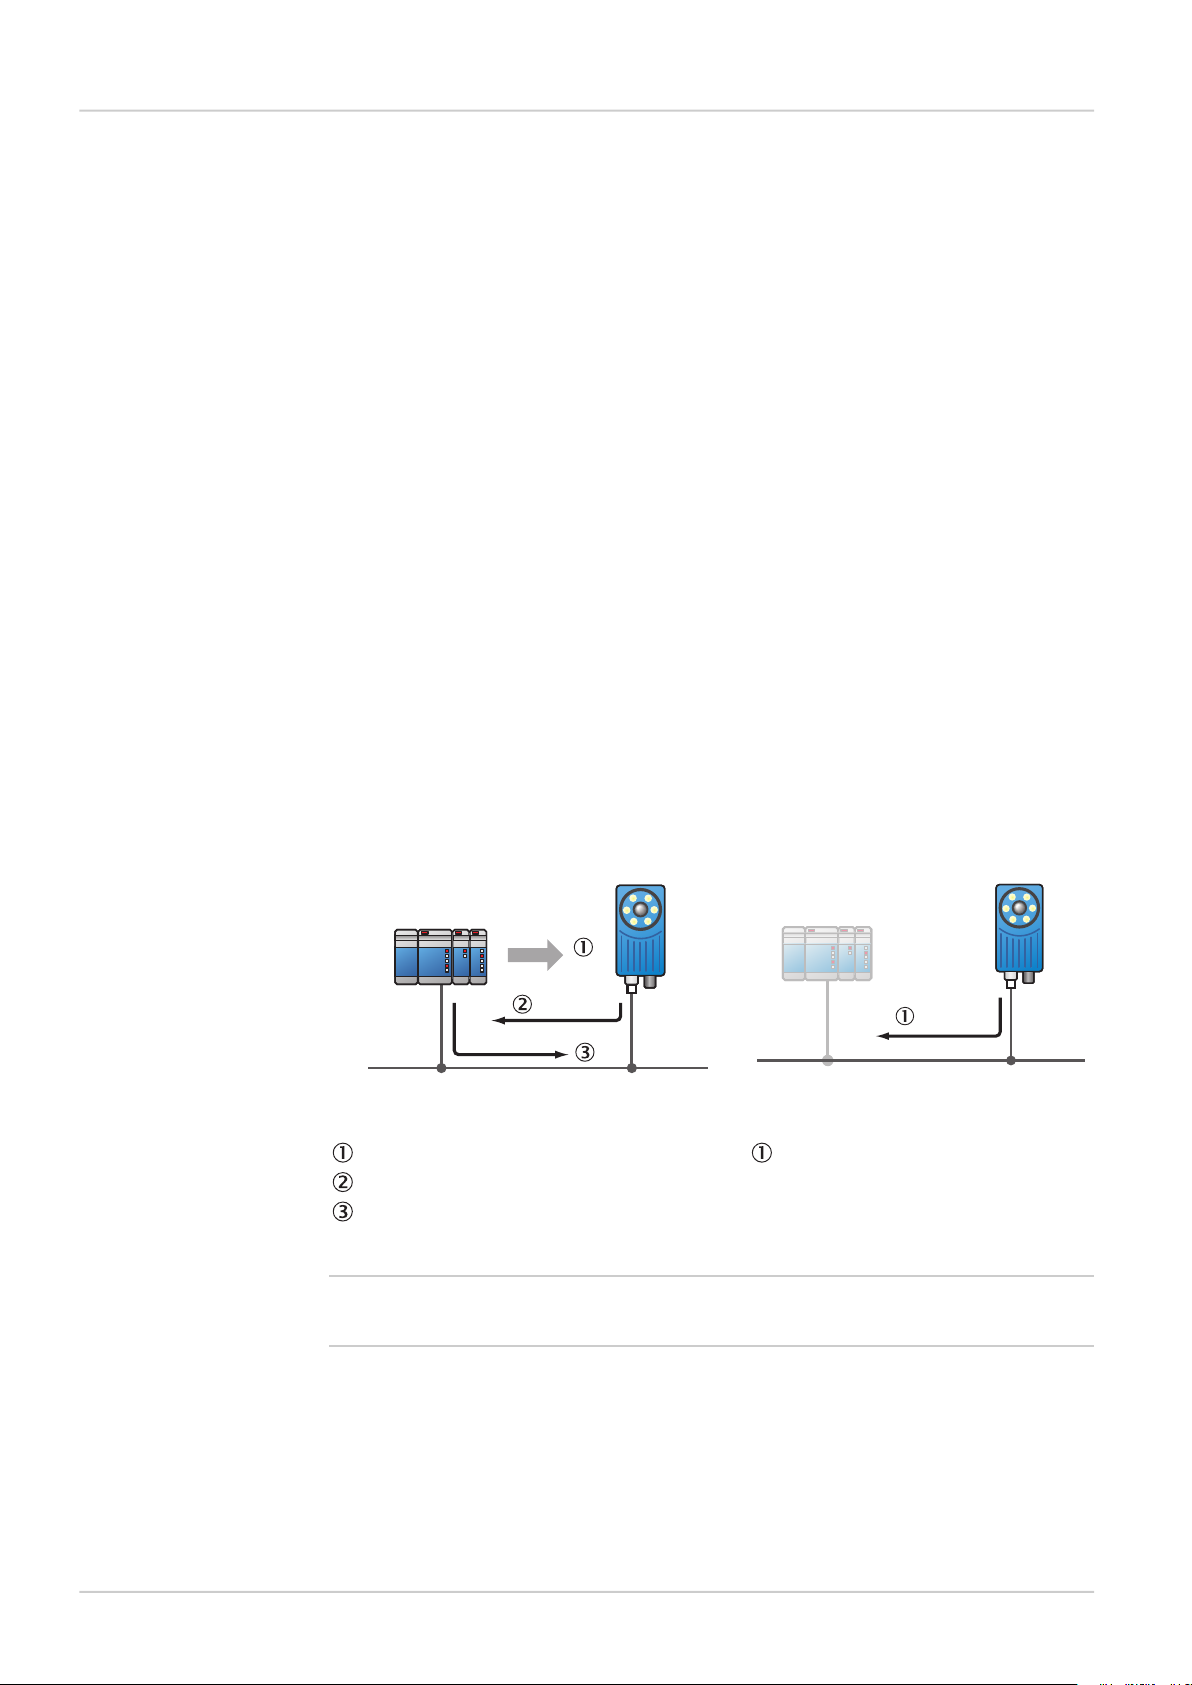
2.4.1 Special conditions during startup
The following applies if the Inspector is configured to use the inputs of the I/O extension box
for object selection:
If the I/O extension box is not available when the Inspector starts up, the Inspector will use
the last reference object selected in the SOPASSingle Device application before saving to flash.
©SICK AG • Advanced Industrial Sensors • www.sick.com • All rights reserved
Subject to change without notice
8015726/2013-11
Page 11

Reference Manual
Inspector PIM
I/O extension box
Interfaces
Once the I/O extension box is available, the Inspector will read the inputs of the box, and
select the corresponding reference object.
2.4.2 Connection to the I/O extension box lost during operation
If the connection to the I/O extension box is lost during operation, the last status of the inputs
on the box will be used until the connection is re-established.
2.4.3 Object selection with I/O extension box
The status of the inputs on the I/O extension box is checked in the end of each inspection
cycle. If the Inspector is configured to use external image trig, the status of the external inputs
will only be checked when an image trig signal has been received.
2.4.4 Timing issues
The digital outputs on the I/O extension box shall be read at minimum delay time as displayed
in the SOPAS Single Device application.
2.4.5 Use of the digital outputs for logic
The digital outputs on the I/O extension box are not guaranteed to be jitter-free. It is not recommended to use these outputs for direct control of other devices. The I/O extension box
shall be connected to a PLC for process control.
2.4.6 Change of Modules in the I/O extension box
The Inspector PIM60 supports I/O extension box configurations with up to 16 digital outputs
and 5 digital inputs (The standard configuration of the I/O extension box contains 8 digital
outputs and 4 digital inputs.). The configuration of an I/O extension box can be changed by
adding/removing I/O modules to/from the I/O extension box. I/O modules are available as
an accessory from SICK. For details about Accessories Ordering information see the Operating
Instructions for Inspector PIM60.
Perform the following steps to connect and use more I/O modules:
1. Close the SOPAS Single Device application.
2. Disconnect the power from the I/O extension box.
3. Connect the additional I/O modules (inputs and/or outputs) to the I/O extension box.
Please refer to the manual delivered with the I/O extension box for details.
4. Re-connect the power to the I/O extension box.
5. Re-start the SOPAS Single Device application.
The additional digital outputs are now be available in the SOPAS Single Device application.
2.5 Troubleshooting
2.5.1 The I/O LED flashes 10 times
If the power to the I/O extension box has been disconnected for a longer period of time, the
internal clock in the box will be reset. The I/O LED on the box will then flash 10 times in red.
This is not a serious error, and the I/O extension box can still be used together with the Inspector without any problems.
8015726/2013-11
2.5.2 No contact with the I/O extension box
Ensure that the network card on the PC has the same network address, for instance
192.168.1, as the I/O extension box. The host part of the IP address (that is the last number
in the IP address) must not be the same as for the I/O extension box or the Inspector.
There are two tools available in Windows to check the network connection and the IP settings:
• Ping. Open the command prompt, and type ping followed by the IP address of the I/O exten-
sion box. If the I/O extension box is available the following text will be displayed: Reply from
x.x.x.x (where x.x.x.x is the IP address of the I/O extension box). If the I/O extension box
©SICK AG • Advanced Industrial Sensors • www.sick.com • All rights reserved
Subject to change without notice
11
Page 12

Interfaces
I/O extension box
Reference Manual
Inspector PIM
could not be found an error message is displayed, for instance Requesttimed out or Destination
host unreachable.
Example: ping 192.168.1.3
• Ipconfig. Open the command prompt and type ipconfig. The current status for the network
cards on the PC will then be displayed. Ensure that the network settings are corresponding
to the setting for the I/O extension box. The current IP address for the Inspector can be
viewed by selecting Device Info from the InspectorPIM60 menu.
The web browser on the PC must be configured not to use a proxy when communicating with
the web server in the I/O extension box.
2.5.3 High number of unanswered requests to the I/O extension box
The advanced communication mode, User mode, can be used to fine tune the communication
with the I/O extension box. It is recommended to try to increase the timeout as a first step,
and if this does not work, try to increase the number of retries. Increasing the number of retries
will reduce the inspection speed.
If the problem persists even if the timeout and the number of retries have been increased,
verify that the network topology does not block the use of UDP packets.
12
©SICK AG • Advanced Industrial Sensors • www.sick.com • All rights reserved
Subject to change without notice
8015726/2013-11
Page 13

Reference Manual
Inspector PIM
Web interface
Interfaces
3
Web interface
3.1 Introduction
The Inspector PIM60's web interface can be used in two different ways:
• Users can use a web browser to open web pages served by the Inspector's built-in web
server.
The Inspector PIM60 is delivered with a set of web pages for handling the Inspector, but
you can also create custom web pages that can be accessed through the Inspector's builtin web server. When you create custom web pages, all functions available through the
Web API can be used.
• Custom applications running on separate systems can use the Web API to directly retrieve
images and results, and retrieve and set parameters on the Inspector.
Details on how to manage and access the web pages served by the Inspector is described
in the Operating Instructions for Inspector PIM60.
Note
All URLs on the Inspector are case sensitive. For example, trying to use /LiveImage.jpg to
retrieve the live image will not work.
3.2 Get results via Web API
3.2.1 Live image
The live image can be retrieved through the Web API by a live image request using the URL:
http://<IP-address>/LiveImage.jpg
The response to the request is a data buffer containing a JPEG image.
If the image is not available, an empty image is returned with a smaller size than a normal
image.
Note
The live image is not available when SOPAS is connected to the Inspector PIM60.
Live image response can be much slower when activating the Send to FTP feature.
Example URLs
Request a live image without overlay graphics:
http://192.168.1.110/LiveImage.jpg
The response to the request is a JPEG image.
Request a live image with overlay graphics:
http://192.168.1.110/LiveImage.jpg?ShowOverlay
Request a live image with simplified overlay graphics:
http://192.168.1.110/LiveImage.jpg?SimplifiedOverlay
3.2.2 Detailed results
The result string, containing the results from the last analyzed image, can be retrieved through
the Web API by a request using the URL:
http://<IP-address>/CmdChannel?gRES
The response is a string that has the following syntax:
rgRES <errorCode> <resultString>
8015726/2013-11
©SICK AG • Advanced Industrial Sensors • www.sick.com • All rights reserved
Subject to change without notice
13
Page 14

Interfaces
Web interface
Reference Manual
Inspector PIM
The result string is the string that is output over Ethernet, and which is defined in the Ethernet
Results Output dialog.
For example, if the current configuration has an object locator and an edge pixel counter,
and Ethernet Results Output uses the default example formatting string, the Inspector would
return the following string:
rgRES 0 194
Image_number: 9639
Object_locator.
Located: 1
Score: 99.00
Scale: 1.00
Position_(X,Y): (237.78,202.05)
Rotation: 20.05
------------------------Edge_pixel_counter_1
Decision: 1
Pixels: 724
The result is not synchronized with the live image. This means that in some situations, if you
retrieve a live image and after that a result string, that string may not contain the result for
the retrieved image, but for an image captured and analyzed later. See Section 3.2.3, “Syn-
chronize live image with result” (page 14) for a solution.
3.2.3 Synchronize live image with result
To synchronize the live image with the result, you need to assign an id to the image. The id
can be up to 16 characters long and can consist of numbers, letters, and special characters.
http://<IP-address>/LiveImage.jpg?id=<ID>
The result for the live image assigned to the <ID> can be listed using the following syntax:
http://<IP-address>/ImageResult?id=<ID>
Note
The image might not update if this method is used due to caching, see Section 3.4.1, “Example: Display live image” (page 19) for more information.
Example URLs
Request a live image without overlay graphics and assign an id to the image:
http://192.168.1.110/LiveImage.jpg?id=ID_ABC123
Request a live image with overlay graphics and assign an id to the image:
http://192.168.1.110/LiveImage.jpg?ShowOverlay&id=ID_ABC123
Request a live image with simplified overlay graphics and assign an id to the image:
http://192.168.1.110/LiveImage.jpg?SimplifiedOverlay&id=ID_ABC123
3.2.4 Logged images
Logged images can be retrieved using the URL:
http://<IP-address>/LogImage.jpg?00
where the argument "00" is the image number. The image number is two digits in the range
[00, 29]. The device keeps writing to the log and therefore the log first has to be locked to
be able to retrieve an image. This is done by using the URL http://<IP-address>/LockLog
The response to the request is a JPEG image. An empty image with a smaller size than a
normal image is returned if no log image is available for a certain position.
To start logging images again the log has to be unlocked first and this is done by using the
URL http://<IP-address>/LockLog?Unlock
14
©SICK AG • Advanced Industrial Sensors • www.sick.com • All rights reserved
Subject to change without notice
8015726/2013-11
Page 15

Reference Manual
Inspector PIM
Web interface
Interfaces
Example URLs
http://192.168.1.110/LockLog
http://192.168.1.110/LockLog?Unlock
Retrieve a logged image without overlay graphics:
http://192.168.1.110/LogImage.jpg?00
Retrieve a logged image with overlay graphics:
http://192.168.1.110/LogImage.jpg?00&ShowOverlay
Retrieve a logged image with simplified overlay graphics:
http://192.168.1.110/LogImage.jpg?00&SimplifiedOverlay
3.2.5 Statistics
To retrieve statistics using the command channel, execute the following command:
gSTAT
Statistics can also be retrieved using the URL:
http://<IP-address>/CmdChannel?gSTAT
The response is rgSTAT 0 followed by an XML formatted string. To read the response in an
web browser, change the view in the web browser to reflect the source code.
Note
The statistic response is only for the active reference object.
3.3 Control the sensor via Web API
The Web API supports using the command channel for reading and updating parts of the
device configuration.
The Web API also supports the functionality to do a backup of the device configuration to a
file and to restore the configuration again. This is a convenient way to handle configurations
without installing and using SOPAS Single Device.
3.3.1 Basic principles
The command channel has a set of basic principles:
• Only one command at a time can be executed.
• Inspector PIM60 responds to each command with a response that includes the result of
the command as well as error codes.
• A specific task to control the Inspector PIM60 includes the command together with its
parameters, see list of command types and parameters in Appendix B, “Command chan-
nel” (page 52).
• Writing a parameter can typically only be done when the device is in Edit mode. Reading
a parameter can be done in both Edit and Run mode.
• It is possible to block configuration changes by deselecting Allow changes via Web Server in
the Web Ser ver tab in the dialog Interfaces and I/O Settings in InspectorPIM60 menu.
8015726/2013-11
3.3.2 Command syntax
The Web API command channel has the following syntax:
http://<IP-address>/CmdChannel?<command>_<identifier>_<argument 1>_<argument 2>..._<argument N>
The ACK message has the following syntax:
<ACK Command> <identifier> <errorCode> <returnValue1> <returnValue2> ...
<returnValueN> <errorMessage>
The command is sent as an ASCII string. The combination of a command with its parameters
will either change the device configuration or fetch information from the device. For more
©SICK AG • Advanced Industrial Sensors • www.sick.com • All rights reserved
Subject to change without notice
15
Page 16

Interfaces
Web interface
Reference Manual
Inspector PIM
command examples see Section B.1, “Command syntax” (page 52) and Section B.6, “Command examples” (page 75).
Note
The command syntax differs from other interfaces where the initial part http://<IP-ad-
dress>/CmdChannel? is added and all space characters (" ") are replaced by an underscore
character ("_"). The ACK messages still contain spaces.
Example URL
The successful execution of the following command
http://192.168.1.110/CmdChannel?sINT_1_1
will perform the command (to select reference object with index 1) and then return the following string:
rsINT 1 0
while a failed command may return:
rsINT 1 8101 Ref bank index is not used.
3.3.3 Current reference object
The reference image of the current reference object can be retrieved using the URL:
http://<IP-address>/ActiveReferenceImage.jpg
The response to the request is a JPEG image.
The reference image of any reference object in the Inspector can be retrieved using the URL:
http://<IP-address>/getRefObject?0
where the argument "0" is the index of the reference object. The object index that corresponds
to each reference object can be found in the Reference object list in the Main view.
The response to the request is a JPEG image. An empty image with a smaller size than a
normal image is returned if no reference object is available for a certain position.
Example URL
http://192.168.1.110/ActiveReferenceImage.jpg
http://192.168.1.110/getRefObject?1
3.3.4 Backup and restore configuration
It is possible to backup and restore the device configuration through the Web API. This is the
same functionality also available through the standard web pages of the Web Server interface.
The backup data contains the device name and reference objects including corresponding
inspection and interface settings.
Note
The backup and restore functionality of the Web Server and the Web API corresponds to the
Export Sopas Parameter backup and Import Sopas Parameter backup in the InspectorPIM60 menu.
The backup data used by the Web API is saved as .sbp files, which can be imported to and
exported from SOPAS Single Device. The Web API can not use .sdv files.
Backup configuration
The URL to export a configuration is http://<IP-address>/backup_config?config1
Example URL:
http://192.168.1.110/backup_config?config1
The result of the request is an .spb file containing the device configuration. This file can be
stored in the file system of the receiving unit and used later in the restore procedure.
16
©SICK AG • Advanced Industrial Sensors • www.sick.com • All rights reserved
Subject to change without notice
8015726/2013-11
Page 17

Reference Manual
Inspector PIM
Web interface
Interfaces
The Web Server standard web pages requires a login to perform a backup. A login is not required when doing a backup through the Web API.
Restore configuration
The restore operation takes a device configuration created with the backup functionality and
replaces the current configuration with the configuration in the backup file.
The operation is a multiple step procedure that requires a login. The details of the procedure
is described in Appendix C, “Restore configuration over Web API” (page 77).
The operation may take several minutes and the Inspector PIM60 is automatically restarted
after the configuration has been transferred to the Inspector PIM60.
Warning
During the restore operation the device is set in a special restore mode only expecting restore
operation requests. Operations and requests via other interfaces like field buses, SOPAS
Single Device, or other web browsers shall then be avoided since they may interfere with the
restore operation.
3.4 Create custom web pages
When creating customized web pages to be stored on and served by the Inspector, you use
the Web API to display images, retrieve results and settings, and change parameters in the
Inspector.
The functions that use the command channel (retrieving results, and getting and setting
parameters) returns the result in text strings, which you need to parse in order to extract the
information that you are interested in. To make this easier, the Inspector PIM60 provides a
JavaScript that you can use in your web pages, and that helps parsing the results.
You use the functions by including the script file inspector.js in your page, and then create
an Inspector object in your own script.
Note
The inspector.js script uses JQuery, so you need to also include the provided jquery.js
script. For more information on JQuery, see www.jquery.com.
<html>
<head>
<title>Custom page</title>
<script type="text/javascript" src="/jquery.js"></script>
<script type="text/javascript" src="/inspector.js"></script>
<script type="text/javascript">
//<!--
var inspector = new Inspector();
...
//-->
</script>
...
The Inspector object has methods that correspond to the commands that can be sent over
the command channel. The available methods are listed in Table 3.1, “Methods in inspector.js” (page 19). When using these methods, you pass the same arguments as when using
the "raw" command channel commands, as described in Appendix B, “Command chan-
nel” (page 52).
The Inspector object returns the (parsed) command response through a callback function.
To use the response, you define a function that takes a single argument – the response object
– and pass that function as an argument to the Inspector's method. In the function you can
8015726/2013-11
©SICK AG • Advanced Industrial Sensors • www.sick.com • All rights reserved
Subject to change without notice
17
Page 18

Interfaces
Web interface
Reference Manual
Inspector PIM
then check whether the command succeeded, and retrieve the information you are interested
in.
For example, to select the first reference object in the current configuration (with index 0),
you would call:
// First, define a callback function that handles the result
function setRefObjResponse(response) {
if (response.httpStatus != 200 || response.errorCode != 0) {
alert(response.errorMessage);
}
};
// Then, call the inspector object's setInt function
// with the arguments:
// identifier = 1 for "Set reference object"
// arg1 = 0, for reference object with index 0
function setRefObj() {
inspector.setInt(1, 0, setRefObjResponse );
};
Tip
As an experienced JavaScript developer, you would probably define your callback function
as an anonymous function directly in the call to the inspector methods:
inspector.setInt(1, 0, function(response) {
if (response.httpStatus != 200 || response.errorCode != 0) {
alert(response.errorMessage);
}
});
The content of the response object depends on the function that you called, as well as the
outcome of the command. The following attributes are common for all methods:
type The response type, which is basically the same as the command type.
See Table B.3, “Command ID numbers - for EtherNet/IP” (page 54).
errorCode If non-zero, the command failed for some reason. See Section B.4, “Error
codes” (page 72).
errorMessage A text message that describes the error. Exists only if the command failed.
httpStatus The HTTP status code. If this is not set to 200, the HTTP request failed
and the Inspector didn't return any result at all.
The following table lists the attributes that are specific to the called method:
18
©SICK AG • Advanced Industrial Sensors • www.sick.com • All rights reserved
Subject to change without notice
8015726/2013-11
Page 19

Reference Manual
Inspector PIM
Web interface
Table 3.1 Methods in inspector.js
Interfaces
Method
mand
gINTgetInt(identifier, arg1, ..., argn, callback)
sINTsetInt(identifier, arg1, ..., argn, callback)
gSTRgetString(identifier, arg1, ..., argn, callback)
Response attributesCorresponding com-
protocolVersiongVERgetVersion(callback)
modegMODgetMode(callback)
values[0]sMODsetMode(mode, callback)
identifier
values[0 ... n]
identifier
values[0 ... n]
identifier
value
identifieraACTperformAction(identifier, args, callback)
-TRIGtrig(callback)
resultStringgRESgetResult(callback)
-/LockLoglockLog(callback)
-/LockLog?UnlockunlockLog(callback)
The result string returned by the getResult() method is the same string that is output over
Ethernet, and which is defined in the Ethernet Results Output dialog.
Note
Do not make another call to the Inspector before the current call has returned a response.
If you do, the current command will be interrupted and will not return any response at all,
making it difficult to figure out whether or not the command was performed on the Inspector.
Normally, this is not a problem, but if you are using timed triggers, you should make sure
that the triggered functions don't interrupt any commands that may currently be performed
on the Inspector.
3.4.1 Example: Display live image
To display the current live image, simply include the image from /LiveImage.jpg on your
web page:
...
<image src="/LiveImage.jpg"/>
..
This image will not update automatically, so you could add some JavaScript that makes the
live image refresh with a certain interval.
...
<script type="text/javascript">
//<!--
function refreshLiveImage() {
var image = document.getElementById("liveImage");
image.src = "/LiveImage.jpg?ShowOverlay" + (new Date()).getTime() );
// The (new Date()...) is a trick to make the browser
// retrieve the image from the Inspector and not from cache
setTimeout(refreshLiveImage, 500);
};
8015726/2013-11
©SICK AG • Advanced Industrial Sensors • www.sick.com • All rights reserved
Subject to change without notice
19
Page 20

Interfaces
Web interface
Reference Manual
Inspector PIM
// Initiate the image and refresh when page is loaded
window.onload = function(){
refreshLiveImage();
};
//-->
</script>
...
</head>
<body>
<img id="liveImage" src="/LiveImage.jpg?ShowOverlay"/>
</body>
Alternatively, you can use the live image component that is used on the Inspector's default
Live image page, which has automatic refresh, setting for refresh interval, and magnifier.
Figure 3.1 Inspector's default live image component
To use the default live image component, include the userliveimage.js script in your page,
and call the sickLiveImage() function as in the following example:
<html xmlns="http://www.w3.org/1999/xhtml">
<head>
<title>Live Image</title>
<script type="text/javascript" src="/jquery.js"></script>
<script type="text/javascript" src="/userliveimage.js"></script>
<script type="text/javascript">
//<!-$(document).ready(function () {
$("#liveImage").sickLiveImage({
width: 640,
height: 480,
nocache: true,
minInterval: 500,
refreshInterval: 1000,
magnifier: true,
imgUrl: "/LiveImage.jpg",
refreshText: "Refresh interval"
});
});
//-->
</script>
</head>
<body>
<div id="liveImage"></div>
</body>
</html>
20
©SICK AG • Advanced Industrial Sensors • www.sick.com • All rights reserved
Subject to change without notice
8015726/2013-11
Page 21

Reference Manual
Inspector PIM
Web interface
Interfaces
More examples can be found on the installation CD, in the folder hmi_web_example inside
the documentation folder. A Custom Web Toolkit can be found on the support pages (visionsupport.sick.com) which provides a framework that simplifies the process of making an
HMI as well as additional templates and examples..
3.5 Handle the Web API
The Web Server and Web API interfaces can be activated or deactivated. When activated, it
is possible to select port number and to allow command channel changes. The same settings
apply both to the Web Server and to the Web API. The Web interfaces are configured in the
Interfaces and I/O settings dialog in the InspectorPIM60 menu.
The Web API is based on standard HTTP request and responses. Recommended request
timeout time is 3 seconds to allow for images to be transferred properly.
8015726/2013-11
©SICK AG • Advanced Industrial Sensors • www.sick.com • All rights reserved
Subject to change without notice
21
Page 22
Interfaces
Ethernet Raw
Reference Manual
Inspector PIM
4
Ethernet Raw
4.1 Introduction
To set up the connection and output results for Inspector PIM60 using Ethernet Raw see
Operating Instructions for Inspector PIM60.
4.1.1 Port interval
The default interval for the ports used by the communication channels is 2114-2116. This
interval can be changed, e.g. if the controlling device does not support the default interval.
The interval is controlled by the field Start port in the Ethernet Raw tab of the Interface and I/O
settings dialog.
The ports are assigned according to the following:
• Ethernet Result Output = start port (default 2114)
• Command channel = start port + 1
• Dedicated image trig = start port + 2
4.2 Get results via Ethernet Raw
The following settings are configured in the Ethernet Result Output dialog under InspectorPIM60
menu.
4.2.1 TCP versus UDP
The basic difference between these protocols, for the Ethernet result output function, is which
side initiates the connection to receive/send the data.
UDP:TCP:
PC/PLC initiates the connection Inspector sends results to the spe-
Inspector sends results to the PC/PLC
PC/PLC acknowledges that results are received (built into the TCP protocol)
Note
For TCP the default port number that the Inspector listens to is 2114.
cified IP address and port, without
knowing if it has been received
22
4.2.2 ASCII versus binary
The Inspector supports the possibility to choose whether the configured output is to be sent
in ASCII format or in a binary format. The parameters that should be transferred in binary
format are also defined in the XML based formatting, but some tags are not supported in the
binary format.
If such a parameter is added to the formatting it will be ignored by the Inspector. In binary
mode all added text and text formatting, for example <SPACE/>, are ignored. Only the values
©SICK AG • Advanced Industrial Sensors • www.sick.com • All rights reserved
Subject to change without notice
8015726/2013-11
Page 23

Reference Manual
Inspector PIM
Ethernet Raw
Interfaces
of the parameters describing the results of inspected images or device information will be
sent. For details on which tags can be used in binary output see the tables in chapter Appendix A, “Result output formatting” (page 39).
4.2.3 Attributes
Attributes are used to control the formatting and identification of inspections. Some of them
can be controlled directly in the Ethernet Result Output dialog in the section Message settings. All
available attributes are listed in the table in section XML Formatting in Section A.3.2, “Attrib-
utes” (page 49).
Min number of digits Specifies the minimum number of digits (including decimal
point) to include in the result. If the value to be sent out has
fewer digits, the result is padded with leading zeros. The default setting is 0 which means the number of digits that will
be sent will differ depending on how many digits are needed.
The maximum number of digits is 9. Note: This attribute is
only applicable for ASCII
Number of decimals Specifies the number of digits to include after the decimal
point for values with decimals. The value will be rounded to
the specified number of decimals. Default value is 2. The
maximum number of decimals is 9. Note: This attribute is only
applicable for ASCII
Degrees/Radians Specifies the unit for the rotation of the object locator, angle
for blobs, angle for edges, and angle measurements.
Little/Big Endian This specifies the order of the bytes transferred from the
device on Ethernet. When using Little endian the least significant byte is transferred first and for Big endian the most
significant byte is transferred first. See the 2-byte example in
tables below. Note: Only applicable when using binary format.
Most significant
byte
Least significant
byte
0111000010000100Value to be sent
from device:
First transferred byteTransfer order
Second transferred
byte
1000010001110000Little endian
0111000010000100Big endian
Pixels/Millimeters Specifies whether position coordinates and distance meas-
urements should be expressed in pixels or millimeters. Note:
The device must be calibrated to be able to use millimeters
as unit of measurement.
4.2.4 Example formatting strings
The auto-generated example string will vary depending on the configuration in the selected
reference object. The intention with the example string is to give an idea of the available tags
and to be a good starting point for creating a suitable format.
Below follow some short descriptions of example strings for different configurations. For more
information about the XML formatting see Appendix A, “Result output formatting” (page 39).
8015726/2013-11
©SICK AG • Advanced Industrial Sensors • www.sick.com • All rights reserved
Subject to change without notice
23
Page 24

Interfaces
Ethernet Raw
Reference Manual
Inspector PIM
Example string for configuration with only an Object locator
<MESSAGE_SIZE/><NEWLINE/>
Image_number:<SPACE/><IMAGE_NUMBER/><NEWLINE/>
Object_locator.<NEWLINE/>
<OBJECT_LOC>
Located:<SPACE/><DECISION/><NEWLINE/>
Score:<SPACE/><SCORE/><NEWLINE/>
Scale:<SPACE/><SCALE/><NEWLINE/>
Position_(X,Y):<SPACE/>(<X/>,<Y/>)<NEWLINE/>
Rotation:<SPACE/><ROTATION/><NEWLINE/>
</OBJECT_LOC>
Size of the message, number of characters (ASCII) or bytes (binary)
Explanatory text and analyzed images number
Explanatory text
Start of container for object locator
Explanatory text and value for locator decision; 0=not found, 1=found
Explanatory text and locator score value, in percent how well of the object is found in
the object locator due to match settings
Explanatory text and locator scale value, factor of analyzed live image compared to
taught reference object
Explanatory text and x and y position of the reference point. This can be outside the
image and therefore negative. Shown in "pixels" or "mm"
Explanatory text and locator rotation, in degrees or radians depending on the configured
value in the Ethernet Result Output settings dialog
End of container for object locator
Result of validating output string with only an Object locator
The result of validating the example formatting output string with output format ASCII can
be as follows:
97
Image_number: 14471
Object_locator.
Located: 1
Score: 96.00
Scale: 1.00
Position_(X,Y): (291.52,238.55)
Rotation: 0.22
The result of validating the example formatting output string for only an object locator with
output format binary will be as follows:
Binary output OK. Number of bytes: 27
Part of example string for configuration with a Blob
Blob_tool.<NEWLINE/>
<BLOB index="0" name="Blob 1">
Found_blobs:<SPACE/><FOUND_BLOBS/><NEWLINE/>
-------------------------<NEWLINE/>
Blob_information:<NEWLINE/>
Position_(X,Y):<SPACE/>(<X/>,<SPACE/><Y/>)<NEWLINE/>
24
©SICK AG • Advanced Industrial Sensors • www.sick.com • All rights reserved
Subject to change without notice
8015726/2013-11
Page 25

Reference Manual
Inspector PIM
Ethernet Raw
Area:<SPACE/><AREA/><NEWLINE/>
Angle:<SPACE/><ANGLE/><NEWLINE/>
Structure:<SPACE/><EDGE_PIXELS/><NEWLINE/>
Touches_ROI_border:<SPACE/><EDGE_FLAG/><NEWLINE/>
</BLOB>
Explanatory text
Start of container for the blob tool named "Blob 1" and instruction to fetch the first (index="0") blob in accordance with the Sort by criteria
Explanatory text and number of found blobs in analyzed image
Separator
Explanatory text
Explanatory text and information of blob with index="0" concerning position and center
of gravity (x and y position), in "pixels" or "mm"
Explanatory text and blob (index="0") area, in "pixels"
Explanatory text and blob (index="0") angle value, in degrees or radians depending on
the configured value in the Ethernet Result Output settings dialog
Explanatory text and blob (index="0") structure value, number of edge pixels inside the
blob
Explanatory text and blob (index="0") edge value, 0=blob fully within ROI, 1= blob touches
ROI border
End of container for blob tool
Interfaces
Result of validating output string with a Blob
The result of validating the example formatting output string with output format ASCII can
be as follows:
Blob_tool.
Found_blobs: 16
------------------------Blob_information:
Position_(X,Y): (177.00, 156.89)
Area: 75
Angle: 154.33
Structure: 0
Touches_ROI_border: 0
The result of validating the example formatting output string for a blob with output format
binary will be as follows:
Binary output OK. Number of bytes: 28
Part of example string for configuration with a Polygon
Polygon1<POLYGON name="Polygon1"><NEWLINE/>
Corners:<SPACE/><NUM_CORNERS/><NEWLINE/>
<CORNERS corners="all">(X,Y):<SPACE/>(<X/>,<Y/>)<NEWLINE/>
</CORNERS>
</POLYGON>
8015726/2013-11
Explanatory text and start of polygon container tag for the polygon tool named "Polygon
1"
Explanatory text and number of polygon corners
Start of container tag for polygon corners with instruction to loop over all polygon corners,
explanatory text, and corner position
End of container for polygon corners
©SICK AG • Advanced Industrial Sensors • www.sick.com • All rights reserved
Subject to change without notice
25
Page 26

Interfaces
Ethernet Raw
Reference Manual
Inspector PIM
End of container for polygon
Result of validating output string with a Polygon
The result of validating the example formatting output string with output format ASCII will be
as follows:
Polygon_1
Corners: 4
(X,Y): (329.15,235.70)
(X,Y): (371.31,235.60)
(X,Y): (372.58,314.97)
(X,Y): (329.82,315.22)
The result of validating the example formatting output string for a polygon with output format
binary will be as follows:
Binary output OK. Number of bytes: 39
Example of a JSON formatted string
It is possible to get an example string in JSON1format. This is typically used in conjugation
with web based HMIs for easier result extraction.
{"MESSAGE": {
"IMAGE_NUMBER":"<IMAGE_NUMBER/>",<SPACE/>
"Pixel_counter_1": {<PIXEL_COUNTER name="Pixel counter 1">
"DECISION":"<DECISION/>",<SPACE/>
"PIXELS":"<PIXELS/>"
</PIXEL_COUNTER>
}}}
{"MESSAGE":{"IMAGE_NUMBER":"2975780", "Pixel_counter_1":{"DECISION":"1", "PIXELS":"5433"}}}
4.3 Control the sensor via Ethernet Raw
The Inspector has a command channel accessible via the Ethernet Raw interface. The command channel makes it possible to read and write a defined set of configuration parameters,
and to trigger image acquisition, via UDP or TCP. This section describes how to setup image
triggering and command channel settings in SOPAS Single Device, as well as the syntax of the
command channel.
4.3.1 Basic principles
The command channel has a set of basic principles:
• Only one command at a time can be executed.
• Each command is followed by a return message (ACK) that includes result of the command
as well as error codes.
• A specific task to control the Inspector PIM60 includes the command together with its
parameters, see list of command types and parameters in Appendix B, “Command chan-
nel” (page 52)).
• Writing a parameter can typically only be done when the device is in Edit mode. Reading
a parameter can be done in both Edit and Run mode.
• It is possible to block configuration changes by deselecting the setting Allow changes via
Ethernet Raw in the EthernetRaw tab in the dialog Interfaces and I/O Settings in the InspectorPIM60
menu.
26
4.3.2 Command syntax
The commands have the following syntax:
1
JSON (JavaScript Object Notation) in accordance with RFC 4627
©SICK AG • Advanced Industrial Sensors • www.sick.com • All rights reserved
Subject to change without notice
8015726/2013-11
Page 27

Reference Manual
Inspector PIM
Ethernet Raw
<command> <identifier> <arg1> <arg2> ... <argN>
Interfaces
The ACK message has the following syntax:
<STX><ACK Command> <identifier> <errorCode> <returnValue1> <returnValue2>
... <returnValueN> <errorMessage><ETX>
where <STX> and <ETX> are the START OF TEXT and END OF TEXT characters (ASCII codes
2 and 3 respectively).
The command is sent as an ASCII string. The combination of a command with its parameters
will either change the device's configuration or fetch information from the device. For more
command examples see Section B.6, “Command examples” (page 75) and Section B.1,
“Command syntax” (page 52).
4.3.3 Select reference object
To enable reference object selection via Ethernet Raw do the following:
1. Choose Interface and I/O Settings from the InspectorPIM60 menu.
2. In the Interface tab choose Ethernet and Ethernet Raw in the listbox.
To select reference object via the command channel, use the command sINT 1 <object
index>. The object index that corresponds to each reference object is shown in the Reference
objects list in the Main view.
4.3.4 Image triggering
It is possible to trigger image acquisition via Ethernet. The communication runs on UDP or
TCP port 2116 (configurable). In order to use this function the triggering has to be enabled
in SOPAS Single Device. In the InspectorPIM60 menu and Interfaces and I/O settings dialog check
the Ethernet box and in the list Ethernet Raw in the Interfaces tab. For the selected reference
object, choose Triggered by Ethernet in the Image settings tab.
4.3.5 Single port solution
In real-time applications, the Inspector is controlled using three ports. However, it is possible
to use only the command port (default 2115) to control the sensor. The single port solution
is only recommended for applications where the cycle time is significantly larger than the
image analysis time. One reason for this is that the image acquisition has a lower priority on
the command port. Another reason is that the Ethernet Result string must be retrieved from
the sensor, therefore image trig and result handling cannot be performed in parallel when
using the single port solution.
This is how the Inspector is controlled by using only the command port:
• The image acquisition is performed by the TRIG command (with lower priority).
• The Ethernet Result Output string is retrieved explicitly by the controlling device, e.g. a PLC.
This is done by the command gRES. The sensor does not send the result automatically on
this port.
• All other commands on the command channel are available as in the standard three port
solution.
8015726/2013-11
©SICK AG • Advanced Industrial Sensors • www.sick.com • All rights reserved
Subject to change without notice
27
Page 28

Interfaces
EtherNet/IP
Reference Manual
Inspector PIM
5
EtherNet/IP
5.1 Introduction
The Inspector PIM60 can be controlled and results
retrieved using the EtherNet/IP™ standard, see
http://www.odva.org/.
To be able to use EtherNet/IP, the EtherNet/IP option has to be enabled and the connection
and output result setup has to be made, see the Operating Instructions for Inspector PIM60.
5.2 Get results via EtherNet/IP
The following settings are configured in the Ethernet Result Output dialog in the InspectorPIM60
menu.
5.2.1 Attributes
Attributes are used to control the formatting and identification of inspection results. Some
of them can be controlled directly in the Ethernet Result Output dialog in the section Message
settings. All available attributes are listed in the table in section XML Formatting in Section A.3.2, “Attributes” (page 49).
Degrees/Radians Choose unit for the rotation for object locator, angle for blobs,
angle for edges, and angle measurements.
Pixels/Millimeters Choose if position coordinates and distance measurements
should be sent in pixel or millimeter unit.
Note: The device must be calibrated for it to be possible to use
the “mm” attribute. An error message is given in the output string
if the device is not calibrated and mm is chosen.
5.2.2 Example formatting strings
The auto-generated example string will vary depending on the configuration in the selected
reference object. The intention with the example string is to give an idea of the available tags
and to be a good starting point for creating a suitable format.
Below follow some short descriptions of example strings for different configurations. For more
information about the XML formatting see Appendix A, “Result output formatting” (page 39).
Example string for configuration with only an Object locator
<IMAGE_NUMBER dataType="DINT" pos="0"/>
<OBJECT_LOC>
<DECISION dataType="SINT" pos="0"/>
<SCORE dataType="REAL" pos="0"/>
<SCALE dataType="REAL" pos="1"/>
<X dataType="REAL" pos="2"/>
<Y dataType="REAL" pos="3"/>
<ROTATION dataType="REAL" pos="4"/>
</OBJECT_LOC>
Analyzed image’s number
Start of container for object locator
Decisions reports whether the object was found (=1) or not found (=0)
28
©SICK AG • Advanced Industrial Sensors • www.sick.com • All rights reserved
Subject to change without notice
8015726/2013-11
Page 29

Reference Manual
Inspector PIM
EtherNet/IP
Interfaces
Score expressed in percent how well the taught object is matched against the live image
Scale is the factor of analyzed live image compared to taught reference object
Position (x) of the reference point of the object locator
Position (y) of the reference point of the object locator
Rotation of the object locator, in degrees or radians depending on the configured value
in the Ethernet Result Output dialog
End of container for object locator
Attribute dataType Specifies the data type to use for this result. When using Ether-
Net/IP the attribute dataType specifies the dataType section in
the selected assembly. The attribute can be SINT, INT, DINT or
REAL. For more details about dataType and pos see table in
Section A.3.2, “Attributes” (page 49).
Attribute pos Used by EtherNet/IP to determine a position in the dataType
section in the selected assembly. The first position number of
the dataType section is 0. The range depends on which assembly
is used. For example if assembly 1 and dataType section SINT
is selected the range of position is [0, 7].
The combination of dataType and pos determine which parameter the result will be mapped
to. For more details about dataType and pos see table in Section A.3.2, “Attributes” (page 49).
Result of validating output string with only an Object locator
The validating in SOPAS Single Device will give the following result:
EtherNet/IP assembly string OK.
Result in PLC with only an Object locator
The table below describes how the Assembly 1's data structure will be populated when using
the configuration example above.
Position ref (pos)
from XML configuration
Offset byteData type
(dataType)
Variable from
example above
DECISION0SINT0
1SINT1
2SINT2
3SINT3
4SINT4
5SINT5
6SINT6
7SINT7
8INT0
10INT1
12INT2
14INT3
16INT4
18INT5
20INT6
22INT7
IMAGE_NUMBER24DINT0
28DINT1
8015726/2013-11
©SICK AG • Advanced Industrial Sensors • www.sick.com • All rights reserved
Subject to change without notice
29
Page 30

Interfaces
EtherNet/IP
Reference Manual
Inspector PIM
Position ref (pos)
from XML configuration
(dataType)
Offset byteData type
32DINT2
36DINT3
40DINT4
Example string for configuration with only a Blob
<IMAGE_NUMBER dataType="DINT" pos="0"/>
<BLOB index="0" name="Blob 1">
<FOUND_BLOBS dataType="SINT" pos="0"/>
<X dataType="REAL" pos="0"/>
<Y dataType="REAL" pos="1"/>
<AREA dataType="DINT" pos="1"/>
<ANGLE dataType="REAL" pos="2"/>
<EDGE_PIXELS dataType="DINT" pos="2"/>
<EDGE_FLAG dataType="SINT" pos="1"/>
</BLOB>
Variable from
example above
SCORE44REAL0
SCALE48REAL1
X52REAL2
Y56REAL3
ROTATION60REAL4
Analyzed image’s number, attributes dataType and pos
Start of container for blob, Index number of the found blob according to current blob
sorting order. Index 0 is the first blob. Name refers to the blob tool's name in the Tools
tab
Number of found blobs
Blob center of gravity (x position), "pixels" or "mm"
Blob center of gravity (y position), "pixels" or "mm"
Blob area in pixels
Angle of the blob, in degrees or radians depending on the configured value in the Ethernet
Result Output dialog
Structure value (number of edge pixels inside the blob)
Edge flag: 0= the blob is fully within the ROI, 1=the blob touches ROI border
End of container for Blob
Attribute dataType Casts to the specified datatype. When using EtherNet/IP the at-
tribute dataType specifies the dataType section in the selected
assembly. The attribute dataType can be SINT, INT, DINT or REAL.
For more details about dataType and pos see table in Section A.3.2, “Attributes” (page 49).
Attribute pos Used by EtherNet/IP to determine a position in the dataType
section in the selected assembly. The first position number of
the dataType section is 0. The range of the attribute pos depends
on which assembly is used. For example if assembly 1 and
dataType section SINT is selected the range of position is 8, i.e.
[0, 7]. For more details about dataType and pos see table in
Section A.3.2, “Attributes” (page 49).
30
©SICK AG • Advanced Industrial Sensors • www.sick.com • All rights reserved
Subject to change without notice
8015726/2013-11
Page 31

Reference Manual
Inspector PIM
EtherNet/IP
Interfaces
Therefore the value of the attributes dataType and pos together specifies which parameter
in the assembly the result value should be mapped to.
Result of validating output string with only a Blob
The validating in SOPAS Single Device will give the following result:
EtherNet/IP assembly string OK.
Result in PLC with only a Blob
The table below describes how the Assembly 1's data structure will be populated when using
the configuration example above.
Position ref (pos)
from XML configuration
(dataType)
Offset byteData type
Variable from
example above
FOUND_BLOBS0SINT0
EDGE_FLAG1SINT1
2SINT2
3SINT3
4SINT4
5SINT5
6SINT6
7SINT7
8INT0
10INT1
12INT2
14INT3
16INT4
18INT5
20INT6
22INT7
IMAGE_NUMBER24DINT0
AREA28DINT1
EDGE_PIXELS32DINT2
36DINT3
40DINT4
X44REAL0
Y48REAL1
ANGLE52REAL2
56REAL3
60REAL4
8015726/2013-11
Part of default string for configuration with only a Polygon
<IMAGE_NUMBER dataType="DINT" pos="0"/>
<POLYGON name="Polygon 1">
<NUM_CORNERS dataType="SINT" pos="0"/>
<CORNERS corners="0">
©SICK AG • Advanced Industrial Sensors • www.sick.com • All rights reserved
Subject to change without notice
31
Page 32

Interfaces
EtherNet/IP
Reference Manual
Inspector PIM
<X dataType="INT" pos="1"/>
<Y dataType="INT" pos="2"/>
</CORNERS>
</POLYGON>
Analyzed image’s number, attributes dataType and pos
Start of container for Polygon, Name refers to the Polygon tool's name in the Tools tab
Number of corners used for this Polygon tool
Number 0 to 15 gives the properties of a single corner. The index of this corner is the
order in which the polygon corner was added when the polygon was drawn
Polygon corner coordinate (x), "pixels" or "mm"
Polygon corner coordinate (y), "pixels" or "mm"
End of tag for corners
End of container for Polygon
Attribute dataType Casts to the specified datatype. When using EtherNet/IP the at-
tribute dataType specifies the dataType section in the selected
assembly. The attribute dataType can be SINT, INT, DINT or REAL.
For more details about dataType and pos see table in Section A.3.2, “Attributes” (page 49).
Attribute pos Used by EtherNet/IP to determine a position in the dataType
section in the selected assembly. The first position number of
the dataType section is 0. The range of the attribute pos depends
on which assembly is used. For example if assembly 1 and
dataType section SINT is selected the range of position is 8, i.e.
[0, 7]. For more details about dataType and pos see table in
Section A.3.2, “Attributes” (page 49).
Therefore the value of the attributes dataType and pos together specifies which parameter
in the assembly the result value should be mapped to.
Result of validating output string with only a Polygon
The validating in SOPAS Single Device will give the following result:
EtherNet/IP assembly string OK.
If the used assembly is too small the validating will give the following result:
EtherNet/IP assembly string not OK. Out of slots for data type INT
Use a larger assembly to solve this problem . Choose a larger assembly in the dialog Interfaces
and I/O settings in the InspectorPIM60 menu and the EtherNet/IP tab.
Result in PLC with only a Polygon
The table below describes how the Assembly 1's data structure will be populated when using
the configuration example above.
Position ref (pos)
from XML configuration
Offset byteData type
(dataType)
Variable from
example above
NUM_CORNERS0SINT0
1SINT1
2SINT2
3SINT3
4SINT4
5SINT5
32
©SICK AG • Advanced Industrial Sensors • www.sick.com • All rights reserved
Subject to change without notice
8015726/2013-11
Page 33

Reference Manual
Inspector PIM
EtherNet/IP
Interfaces
Position ref (pos)
from XML configuration
(dataType)
Offset byteData type
Variable from
example above
6SINT6
7SINT7
X8INT0
Y10INT1
12INT2
14INT3
16INT4
18INT5
20INT6
22INT7
IMAGE_NUMBER24DINT0
28DINT1
32DINT2
36DINT3
40DINT4
44REAL0
48REAL1
52REAL2
56REAL3
60REAL4
5.3 Control the sensor via EtherNet/IP
The Inspector PIM60 has the following EtherNet/IP characteristics:
• Device type: Communication adapter
The Inspector relies on a Scanner device to set up the communication channel. The IP
address of the Inspector can be found by choosing Device Info from the InspectorPIM60
menu.
•
Slim command channel4100Output
Command channel result36101Input
Command channel32102Output
• Minimum RPI: > 16 ms.
When retrieving inspection results via EtherNet/IP, the time between two inspections
should be at least twice the RPI (Requested Packet Interval) specified for the communication
channel.
With the shortest possible RPI, the highest recommended inspection rate is therefore approximately 30 Hz.
Assembly no.CommentSize (bytes)Instance no.Assemblies
1Small result channel64103Input
2Medium result channel124105Input
3Large result channel248107Input
4Extra large result channel484109Input
8015726/2013-11
©SICK AG • Advanced Industrial Sensors • www.sick.com • All rights reserved
Subject to change without notice
33
Page 34

Interfaces
EtherNet/IP
Reference Manual
Inspector PIM
The EDS file for the Inspector PIM60 can be found in the Documentation folder on the Inspector
CD.
The Inspector PIM60 has two Output assemblies that can be used for controlling the Inspector.
To do this the connection has to be set first, see Operating Instructions for Inspector PIM60.
The slim command channel assembly (instance no. 100) is used for controlling the Inspector
in the following ways:
• Select reference object
• Image trig
The command channel assembly (instance no. 102) is also used for controlling the Inspector.
With this assembly you have access to all functions in the command channel, see Section B.3,
“Command descriptions” (page 54).
The two output assemblies are described in detail, see Section 5.3.6, “Assemblies command
channel” (page 36).
5.3.1 Basic principles
The command channel has a set of basic principles:
• In order to be able to change the configuration via EtherNet/IP this must be enabled. This
is done In the dialog Interfaces and I/O Settings from the InspectorPIM60 menu. Check Ethernet
and EtherNet/IP in the tab Interfaces. In the same dialog and tab EtherNet/IP check Allow
changes via EtherNet/IP.
• It is possible to block configuration changes by deselecting the setting Allow changes via
EtherNet/IP in the EtherNet/IP tab in the dialog Interfaces and I/O Settings in InspectorPIM60
menu.
• Writing a parameter can typically only be done when the device is in Edit mode. Reading
a parameter can be done in both Edit and Run mode.
• The commands is sent with help of output assembly 102 and the result is received with
input assembly 101.
• The result for a sent command can be received at the earliest in the next PLC cycle. The
PLC program will have to wait for the result for an undefined number of seconds.
• Make sure that the PLC program waits for a response with the same command and ID as
the sent command.
34
5.3.2 Command syntax
To send commands through the command channel use output assembly 102. The command
channel has the following syntax:
<arg 6><arg 5><arg 4><arg 3><arg 2><arg 1><identifier><command>
Replace <command> with the commands id, see Table B.3, “Command ID numbers - for EtherNet/IP” (page 54).
The result of a command, sent over output assembly 102, can be received through input
assembly 101. The syntax for ACK message is:
<command>
<identifier>
<error
code>
<retVal1>
<retVal2>
<retVal3>
<retVal4>
<retVal5>
<retVal6>
The combination of a command with its parameters will either change the devices configuration or fetch information from the device. For more command examples see Section B.1,
“Command syntax” (page 52) and Section B.6, “Command examples” (page 75).
5.3.3 Select reference object
There are two ways to select reference object with EtherNet/IP and command channel.
©SICK AG • Advanced Industrial Sensors • www.sick.com • All rights reserved
Subject to change without notice
8015726/2013-11
Page 35

Reference Manual
Inspector PIM
EtherNet/IP
Interfaces
The first way to select reference object :
To select the reference object via the slim command channel, change the value of Select
reference object in the slim command channel assembly (instance no. 100). The object
index that corresponds to each reference object can be found in the Reference object list in
the Main view.
If the value in Select reference object does not correspond to any reference object,
the Inspector will ignore the attempt to switch reference object.
The second way to select reference object:
To select reference object via command channel change to Edit mode, 0 0, change the value
to select the reference object, 2 1 <object index> and then change back to Run mode 0
1 in the command channel assembly (instance no. 102). The object index that corresponds
to each reference object can be found in the Reference object list in the Main view.
The time it takes to switch reference object depends on the number of inspections, inspection
type, and sizes of the regions in the reference object. Typically it takes in the order of one
second to switch reference object. For more information see Operating Instructions for Inspector PIM60.
5.3.4 Image triggering
To enable triggering via EtherNet/IP, do the following:
1. Choose Interfaces and I/O Settings from the InspectorPIM60 menu.
2. In the tab Interface choose Ethernet and EtherNet/IP in the list box.
3. In the Image settings tab choose Trig by EtherNet/IP.
To trigger an image acquisition via EtherNet/IP, specify that the slim command channel (instance no. 100) is to be used here and set the value of Trigger to 1. The image capture is
made immediately, without any delays.
The Inspector will capture an image each time the value of Trigger is changed to 1 (i.e.
rising edge). To trigger the next image caption, you must first set the value to 0.
When triggering via EtherNet/IP, the time between two image captions should be at least 4
times the RPI. This means that the maximum triggering rate via EtherNet/IP is approximately
15 Hz.
5.3.5 Input assemblies, result channel
There are four input assemblies, each assembly corresponds to respective assembly in the
EtherNet/IP tab in the Interfaces andI/O Settings dialog. Each assembly has four different dataType
sections, SINT, INT, DINT, and REAL. Each dataType section has a different number of positions, the number of positions depends on the assembly and the dataType selected. Example:
The dataType SINT in assembly 1 has 8 positions [0, 7] and the dataType REAL in assembly
4 has 44 positions [0, 43]. The contents of the assembly are defined from the Ethernet Result
Output dialog.
Note
On the installation CD there is an excel file with templates for the four result input assemblies
(file name: AssemblyMappingPI50andPIM60.xls). These can be used to document the
mapping between position in data structure and what is configured in the Ethernet Result Output
dialog.
Assembly 1 - small result channel
Instance ID: 103
Size: 64 bytes
8015726/2013-11
©SICK AG • Advanced Industrial Sensors • www.sick.com • All rights reserved
Subject to change without notice
35
Page 36

Interfaces
EtherNet/IP
Table 5.1 Input Assembly 1
Assembly 2 - medium result channel
Instance ID: 105
Size: 124 bytes
Table 5.2 Input Assembly 2
Reference Manual
Inspector PIM
Total sizeOffset (bytes)Number/ sizeDatatype
8 bytes08/ 1 byte eachSINT
16 bytes88/ 2 bytes eachINT
20 bytes245/ 4 bytes eachDINT
20 bytes445/ 4 bytes eachREAL
Total sizeOffset (bytes)Number/ sizeDatatype
12 bytes012/ 1 byte eachSINT
24 bytes1212/ 2 bytes eachINT
44 bytes3611/ 4 bytes eachDINT
44 bytes8011/ 4 bytes eachREAL
Assembly 3 - large result channel
Instance ID: 107
Size: 248 bytes
Table 5.3 Input Assembly 3
Assembly 4 - extra large result channel
Instance ID: 109
Size: 484 bytes
Table 5.4 Input Assembly 4
Total sizeOffset (bytes)Number/ sizeDatatype
24 bytes024/ 1 byte eachSINT
48 bytes2424/ 2 bytes eachINT
88 bytes7222/ 4 bytes eachDINT
88 bytes16022/ 4 bytes eachREAL
Total sizeOffset (bytes)Number/ sizeDatatype
44 bytes044/ 1 byte eachSINT
88 bytes4444/ 2 bytes eachINT
176 bytes13244/ 4 bytes eachDINT
176 bytes30844/ 4 bytes eachREAL
36
5.3.6 Assemblies command channel
The value that corresponds to each reference object can be found in the Reference object list
in the Main view.
Slim command channel
The Output assembly contains two parameters that are used for selecting reference object
and trigger inspections.
©SICK AG • Advanced Industrial Sensors • www.sick.com • All rights reserved
Subject to change without notice
8015726/2013-11
Page 37

Reference Manual
Inspector PIM
EtherNet/IP
Instance ID: 100
Size: 4 bytes
Table 5.5 Slim Command channel
2SINTReserved
3SINTReserved
Command channel
Instance ID: 102
Size: 32 bytes
Table 5.6 102 output, Command channel
Offset (bytes)TypeData
0DINTCommand
4DINTIdentifier
8DINTArgument 1
12DINTArgument 2
16DINTArgument 3
20DINTArgument 4
24DINTArgument 5
28DINTArgument 6
Interfaces
ValuesOffset (bytes)TypeData
0-31: Selected reference object0SINTSelect reference object
1: Trigger inspection.1SINTTrigger
Set to 0 before triggering next inspection.
Command channel result
Instance ID: 101
Size: 36 bytes
Table 5.7 101 input Command channel result
Offset (bytes)TypeData
0DINTCommand
4DINTIdentifier
8DINTError code
12DINTReturnvalue 1
16DINTReturnvalue 2
20DINTReturnvalue 3
24DINTReturnvalue 4
28DINTReturnvalue 5
32DINTReturnvalue 6
8015726/2013-11
©SICK AG • Advanced Industrial Sensors • www.sick.com • All rights reserved
Subject to change without notice
37
Page 38

Appendix
Page 39

Reference Manual
Inspector PIM
Result output formatting
Appendix
A
Result output formatting
A.1 XML based formatting
The formatting of the result string is defined by a formatting string written in XML. It is possible
to mix XML tags and free text in the formatting string. The text parts will appear as is in the
result string, whereas the XML tags will be replaced by the appropriate values. All white
spaces in the formatting strings are ignored. In order to include whitespace in the result string
use the tags <SPACE/>, <TAB/> and <NEWLINE/>.
The tags are either container tags or value tags. The container tags do not generate any text
on their own. It is the value tags inside the container tags that generate the text. The following
container tags are valid in the Inspector PIM60:
BLOB
EDGE_PIXEL_COUNTER
CORNERS
ExplanationContainer tag
Used to present values concerning the Object locatorOBJECT_LOC
Used to present values for a found blob in a blob ROI. The index
points out the found blob in accordance with the blob sorting
order. If no index is given this is the same as index = 0.
Used to present values concerning inspections.PIXEL_COUNTER, PATTERN,
Used to present values concerning a defined PolygonPOLYGON
Container tag within the <POLYGON> tag for presenting values
concerning the polygon corners. See example:
<POLYGON>
<CORNERS>
<X/>,<Y/>
</CORNERS>
</POLYGON>
The XML based formatting string is entered in the Formatting string for Ethernet Output part of
the Ethernet Result Output dialog. To get a default string for the current chosen reference object
click Create default formatting string. Click Validate output string to validate the formatting string.
The output that will be sent over Ethernet or errors are reported in the Currentoutput string part
of the Ethernet Result Output dialog.
Note
When using binary transfer, the Validate output string button will only show how many bytes
that will be sent for the current analyzed image and whether the formatting was correct or
not.
The maximum size of the XML buffer is 7900 ASCII characters. This means it will not be
possible to e.g. paste an XML string into to the input field if it's too large. For a larger configuration it might not be possible to configure as much output information as wanted due to
this limitation.
A.2 XML formatting
8015726/2013-11
The content of the Ethernet output is configured using an XML-based formatting string. The
available tags can be categorized into two groups:
• container tags: <OBJECT_LOC>, <POLYGON>, <BLOB>, ...
• value tags: <X/>, <PIXELS/>, <NEWLINE/>, <TIME/>,...
©SICK AG • Advanced Industrial Sensors • www.sick.com • All rights reserved
Subject to change without notice
39
Page 40

Appendix
Result output formatting
Reference Manual
Inspector PIM
The value tags are replaced with a value whereas the container tags are used to group value
tags. The container tags do not generate any text on their own. It is the value tags inside the
container tags that generate the text.
Attribute value must always be enclosed in quotes.
There are three integer tags (<UINT1/>, <UINT2/>, <UINT3/>) for which the values can be
changed (in both Edit and Run mode) using the Command channel.
The <BLOB> container tag contains special functionality for presenting values for a certain
blob. The index value specifies which blob ROI:s result to present. The index order is the order
specified by the Sort by property configured on the Tools tab. The texts and value tags within
the <BLOB> tag will be repeated once for each found blob. If only the properties of a single
blob are wanted, this can be controlled with the index attribute. See Section A.3, “Container
specific tags” (page 40).
A.3 Container specific tags
All tags are listed in the table below. For each container tag, the available value tags are listed.
The binary column states the used data type when using binary output format. Some parts
of the formatting string, such as characters and ASCII tags, are only applicable for the ASCII
format and will be ignored when using binary format, this is also stated in the binary column.
Note
The Binary column in the tables below describes how the data should be interpreted when
received from the device.
Table A.1 Container output string tags
CommentBinaryRangeAttributeValue tagContainer tag
REALcoordUnitXOBJECT_
LOC
X position of the reference
point. Note that this can be
outside the image and therefore negative. In “pixels” or
“mm” depending on attribute
“coordUnit” or configured value
in the Ethernet Result output dialog.
REALcoordUnitY
Y position of the reference
point. Note that this can be
outside the image and therefore negative. In “pixels” or
“mm” depending on attribute
“coordUnit” or configured value
in the Ethernet Result output dialog.
unitROTATION
REAL[-180,
180]
In degrees or radians depending on the configured value in
the Ethernet Result output dialog.
REAL[0.8, 1.2]SCALE
Scale factor of analyzed live
image compared to taught reference object.
REAL[0, 100]SCORE
Score view in percent how well
of the object is found in the
object locator due to match
setting
0=not found, 1=foundUSINT{0, 1}DECISION
40
©SICK AG • Advanced Industrial Sensors • www.sick.com • All rights reserved
Subject to change without notice
8015726/2013-11
Page 41

Reference Manual
Inspector PIM
Result output formatting
PIXEL_
COUNTER
COUNTER
Appendix
CommentBinaryRangeAttributeValue tagContainer tag
any stringnameEDGE_
Name attribute required if
more than one Edge Pixel
Counter exist
UDINTPIXELS
Number of found edge pixels,
expressed in pixels of the inspection region area. The No.
of edge pixels interval in the Tools
tab is specified as number of
pixels within the inspection region. If the located object is
scaled, the number of pixels is
adjusted to be the number of
matching pixels that should
have been found if the located
object had the same size as
the reference object.
USINT{0, 1, 2}DECISION
0=fail, 1=pass, 2=Outside image
any stringnamePIXEL_
Name attribute required if
more than one Pixel Counter
exist
UDINTPIXELS
Number of found pixels, expressed in pixels of the inspection region area. The No. of
pixels in range interval in the
Tools tab is specified as num-
ber of pixels within the inspection region. If the located object is scaled, the number of
pixels is adjusted to be the
number of matching pixels that
should have been found if the
located object had the same
size as the reference object.
USINT{0, 1, 2}DECISION
0=not found, 1=found, 2=Outside image
any stringnamePATTERN
Name attribute required if
more than one Pattern inspection exists
REALcoordUnitX
X position of the reference
point. Note that this can be
outside the image and therefore negative. In “pixels” or
“mm” depending on attribute
“coordUnit” or configured value
in the Ethernet Result output dialog.
REALcoordUnitY
Y position of the reference
point. Note that this can be
outside the image and therefore negative. In “pixels” or
“mm” depending on attribute
“coordUnit” or configured value
8015726/2013-11
©SICK AG • Advanced Industrial Sensors • www.sick.com • All rights reserved
Subject to change without notice
41
Page 42

Appendix
Result output formatting
CORNERS
Reference Manual
Inspector PIM
CommentBinaryRangeAttributeValue tagContainer tag
in the Ethernet Result output dialog.
Pattern matching score.REAL[0, 100]SCORE
USINT{0, 1, 2}DECISION
0=not found, 1=found, 2=Outside image
any stringnamePOLYGON
Name attribute required if
more than one Polygon exists
USINT[2, 16]NUM_
Number of corners used for
this polygon tool.
a
PIXELS
OUTSIDE
USINT{0, 1, 2}DECISION
0=not found, 1=defect, 2 =
pass
Polygon matching score.REAL[0, 100]SCORE
UDINTNUM_
Number of defect pixels inside
crack detection region in polygon. Undefined for single edge
tool.
USINT{0,1}CORNER_
0=polygon completely inside
image, 1=one or more polygon
corner(s) are outside image.
Cannot be used for single edge
tool.
REALcoordUnitDEFECT_X
Coordinate of the first found
pixel that was within the defect
thresholds. In “pixels” or “mm”
depending on attribute “coordUnit” or configured value in
the Ethernet Result output dialog.
Return -1 if defect detection is
not active or no defect found.
Undefined for single edge tool.
REALcoordUnitDEFECT_Y
Coordinate of the first found
pixel that was within the defect
thresholds. In “pixels” or “mm”
depending on attribute “coordUnit” or configured value in
the Ethernet Result output dialog.
Return -1 if defect detection is
not actived or no defect found.
Undefined for single edge tool.
cornersCORNERS
{0, 1,
...,15, all}
"All"biterates over all polygon
corners. Number 0 to 15 gives
the properties of a single
corner. The index of this corner
is the order in which the polygon corner was added when
the polygon was drawn.
c
REALcoordUnitX
REAL
Polygon corner coordinate. In
“pixels” or “mm” depending on
attribute “coordUnit” or con-
42
©SICK AG • Advanced Industrial Sensors • www.sick.com • All rights reserved
Subject to change without notice
8015726/2013-11
Page 43

Reference Manual
Inspector PIM
Result output formatting
Appendix
CommentBinaryRangeAttributeValue tagContainer tag
figured value in the Ethernet
Result output dialog.
For a polygon with two corners
(single edge) the estimated
corner positions are the intersection between the found
edge and the left and right
borders of the search region.
The search region is defined by
the user drawn edge and the
position search parameter. See
also Operating Instructions for
Inspector PIM60 about Single
edge tool.
c
REALcoordUnitY
REAL
Polygon corner coordinate.
“pixels” or “mm” depending on
attribute “coordUnit” or configured value in the Ethernet
Result output dialog.
For a polygon with two corners
(single edge) the estimated
corner positions are the intersection between the found
edge and the left and right
borders of the search region.
The search region is defined by
the user drawn edge and the
position search parameter. See
also Operating Instructions for
Inspector PIM60 about Single
edge tool.
d
BLOBS
THRESHOLD_
d
LOW
THRESHOLD_
any stringnameBLOB
Name attribute required if
more than one Blob tool exists.
The name refers to the Blob
tool's name in the tool tab
[0, 15]index
Index of found blob according
to current blob sorting order.
Index 0 is the first blob
REALcoordUnitX
Blob center of gravity (x position). “pixels” or “mm” depending on attribute “coordUnit”
REALcoordUnitY
Blob center of gravity (y position). “pixels” or “mm” depending on attribute “coordUnit”
Number of found blobs.USINTFOUND_
USINTLIVE_
The lower threshold of the Blob
tool's intensity after applying
ambient light compensation.
USINTLIVE_
The upper threshold of the
Blob tool's intensity after apply-
8015726/2013-11
©SICK AG • Advanced Industrial Sensors • www.sick.com • All rights reserved
Subject to change without notice
43
Page 44

Appendix
Result output formatting
d
HIGH
OR
OR
Reference Manual
Inspector PIM
CommentBinaryRangeAttributeValue tagContainer tag
ing ambient light compensation.
REAL[0, 180]unitANGLE
In degrees or radians depending on attribute “unit” or configured value in the Ethernet
Result output dialog.
UDINTAREA
Blob area (in pixels). In “pixels”
or “mm2” depending on attribute “coordUnit” or configured
value in the Ethernet Result out-
put dialog.
USINT{0, 1}EDGE_FLAG
0 = blob fully within ROI, 1 =
blob touches ROI border
UDINTEDGE_PIXELS
Structure calculation value
(number of edge pixels inside
the found blob)
0=not found, 1=foundUSINT{0, 1}DECISION
any stringnameEDGE_LOCAT-
Name attribute required if
more than one Edge tool exist
REALcoordUnitX
X position of the reference
point. In “pixels” or “mm” depending on attribute “coordUnit” or configured value in
the Ethernet Result output dialog.
REALcoordUnitY
Y position of the reference
point. In “pixels” or “mm” depending on attribute “coordUnit” or configured value in
the Ethernet Result output dialog.
Edge matching score.REAL[0, 100]SCORE
REAL[0, 180]unitANGLE
In degrees or radians depending on attribute “unit” or configured value in the Ethernet
Result output dialog.
USINT{0, 1, 2}DECISION
0=not found, 1=found, 2=Outside image
any stringnameCIRCLE_LOCAT-
Name attribute required if
more than one Circle exist
REALcoordUnitX
X position of the reference
point. In “pixels” or “mm” depending on attribute “coordUnit” or configured value in
the Ethernet Result output dialog.
REALcoordUnitY
Y position of the reference
point. In “pixels” or “mm” depending on attribute “coordUnit” or configured value in
the Ethernet Result output dialog.
Circle matching score.REAL[0, 100]SCORE
44
©SICK AG • Advanced Industrial Sensors • www.sick.com • All rights reserved
Subject to change without notice
8015726/2013-11
Page 45

Reference Manual
Inspector PIM
Result output formatting
DECISION
TANCE
URE_ANGLE
e
TURES
11, 12}
any stringnameMEASURE_DIS-
any stringnameMEAS-
any stringnameEDGE_COUNT
Appendix
CommentBinaryRangeAttributeValue tagContainer tag
REALcoordUnitDIAMETER
Circle's diameter in pixels or
mm depending on attribute
"coordUnit" or configured value
in the Ethernet Result output dialog.
USINT{0, 1, 2,
0=not found, 1=pass, 2=Outside image, 11=Failed on score
value, 12=Failed on diameter
Name attribute required if
more than one Measure distance exists
REALcoordUnitDISTANCE
Measured distance in pixels or
mm depending on attribute
“coordUnit” or configured value
in the Ethernet Result output dialog.
USINT{0, 1}VALID
Indicates whether the value in
the distance tag is a valid
measurement or not. 0=Invalid
1=Valid
USINT{0, 1}DECISION
0=fail (measure distance could
not be done), 1=pass
Name attribute required if
more than one Measure Angle
exist
REALcoordUnitX
X position of the intersection
point. In “pixels” or “mm” depending on attribute “coordUnit” or configured value in
the Ethernet Result output dialog.
REALcoordUnitY
Y position of the intersection
point. In “pixels” or “mm” depending on attribute “coordUnit” or configured value in
the Ethernet Result output dialog.
REAL[0, 180]ANGLE
In degrees or radians depending on attribute “unit” or configured value in the Ethernet
Result output dialog.
USINT{0, 1, 2}VALID
Indicates whether the values
in the angle tag are valid
measurements or not. 0=Invalid 1=Valid 2=Intersection outside image
0=fail, 1=passUSINT{0, 1}DECISION
Name attribute required if
more than one Edge counter
exist
Chosen feature/edge index.[0, 63]index
Number of found features.USINT[0, 64]FOUND_FEA-
8015726/2013-11
©SICK AG • Advanced Industrial Sensors • www.sick.com • All rights reserved
Subject to change without notice
45
Page 46

Appendix
Result output formatting
MIN_PITCH
MAX_PITCH
MEAN_PITCH
e
ordUnit/unit
e
ordUnit/unit
e
ordUnit/unit
e
Reference Manual
Inspector PIM
CommentBinaryRangeAttributeValue tagContainer tag
REALco-
If the chosen Edge counter is
rectangular the value shows
the pitch “pixels” or “mm” depending on attribute “coordUnit” or configured value in
the Ethernet Result output dialog.
If the chosen Edge counter is
circular the value is the pitch
in degrees or radians depending on attribute “unit” or configured value in the Ethernet
Result output dialog.
USINT{0, 1, 2}DECISION
0=Not found, 1=Found,
2=Outside image
REALcoordUnitX
X position for the mid point of
the feature/edge, see footnotef. In “pixels” or “mm” depending on attribute “coordUnit” or configured value in
the Ethernet Result output dialog.
REALcoordUnitY
Y position for the mid point of
the feature/edge, see footnotef. In “pixels” or “mm” depending on attribute “coordUnit” or configured value in
the Ethernet Result output dialog.
REAL[0, 180]ANGLE
Only applicable for Feature type
Single edge. A positive value is
46
©SICK AG • Advanced Industrial Sensors • www.sick.com • All rights reserved
Subject to change without notice
8015726/2013-11
Page 47

Reference Manual
Inspector PIM
Result output formatting
Appendix
CommentBinaryRangeAttributeValue tagContainer tag
a clockwise rotation and a
negative value is a counter
clockwise rotation.
g
The angle of the single edge in
degrees or radians depending
on attribute “unit” or configured value in the Ethernet
Result output dialog.
AL_ANGLE
REAL[0, 180]INTERN-
Only applicable for Feature type
Dark or Bright. The edge's or
feature's angle in the search
h
region.
The angle of the feature in degrees or radians depending on
attribute “unit” or configured
value in the Ethernet Result out-
put dialog.
REALWIDTH
Only applicable for Feature type
Dark or Bright.
If the chosen Edge counter is
rectangular the value shows
the width “pixels” or “mm” depending on attribute “coordUnit” or configured value in
the Ethernet Result output dialog.
If the chosen Edge counter is
circular the value is the width
in degrees or radians depending on attribute “unit” or configured value in the Ethernet
Result output dialog.
8015726/2013-11
USINT[3, 4]POLARITY
Only applicable for Feature type
Single edge. The chosen edge's
polarity in the search direction:
3 = dark to bright, 4 = bright to
dark
a
This tag must be used inside the <POLYGON> container
b
Only available for Ethernet Raw.
c
For EtherNet/IP the position is represented as an INT value. Use the scale attribute to get more decimals
d
This tag must be used inside the <BLOB> container. The value are given for each Blob ROI (not for each found
blob)
e
This tag concerns the whole tool, i.e. not specific to the feature/edge chosen by the index
f
Red arrow points out the midpoint for the Edge count tool
©SICK AG • Advanced Industrial Sensors • www.sick.com • All rights reserved
Subject to change without notice
47
Page 48

Appendix
Result output formatting
g
The angle of the edge relative to the region.
h
The INTERNAL_ANGLE is the angle of a feature, i.e. the relation of the two edges of the feature.
Reference Manual
Inspector PIM
Note
When a tool is related to the object locator and the object locator is not found in the live image
the presented results for the related tools are undefined.
A.3.1 General tags
Table A.2 Generic output string tags
Value tag
CommentBinaryRangeAttrib-
ute
UINTMESSAGE_SIZE • Binary format: The size of the message
in bytes
• ASCII format: The number of characters
in the message
UDINTIMAGE_NUMBER
Analyzed image's number (Resets at
power-up or device reset)
USINT[0, 3]IMAGE_DECISION
USINT[0, 31]REF_OBJECT
0=Not located, 1=Detail failed, 2=All
passed 3=Not located and detail failed
Reference object index
b
a
Used to send single control charactersIGNORED[0, 255]valueASCII
Same as <ASCII value="32"/>IGNOREDSPACE
Same as <ASCII value="9"/>IGNOREDTAB
IGNOREDLAB
Left angular bracket, "<". Useful when
generating XML-formatted output.
IGNOREDRAB
Right angular bracket, ">". Useful when
generating XML-formatted output.
48
©SICK AG • Advanced Industrial Sensors • www.sick.com • All rights reserved
Subject to change without notice
8015726/2013-11
Page 49

Reference Manual
Inspector PIM
Result output formatting
Appendix
Value tag
CommentBinaryRangeAttrib-
ute
Same as <ASCII value="10"/>IGNOREDNEWLINE
Same as <ASCII value="13"/>IGNOREDRETURN
UDINT{s, ms}timeUnitTIME
Current time since device boot. Restarts
from zero after ~10 years (using seconds)
and ~49 days (using milliseconds)
Device serial code.UDINTSERIALCODE
REAL[0, 100]FOCUS
Only valid while the device is in Edit mode.
This is the focus value from the Image
settings tab
UINTTELE-
GRAM_COUNTER
A counter that increments for each telegram sent over the result channel. Resets
at power-up or device reset.
USINT[0, 255]intValueUSINT
If the intValue attribute is not specified
the default value will be zero and the tag
can be used for padding.
UINT[0, 65535]intValueUINT
If the intValue attribute is not specified
the default value will be zero and the tag
can be used for padding.
UDINT[0, 232-1]intValueUDINT
If the intValue attribute is not specified
the default value will be zero and the tag
can be used for padding.
UINT[0, 65535]intValueUINT1
Value can be changed through the command channel.
UINT[0, 65535]UINT2
Value can be changed through the command channel.
UINT[0, 65535]UINT3
Value can be changed through the command channel.
a
If a tool is fixed in field of view and not relative to the object locator, the Image_decision will report the value 3 in
cases when the object locator does not locate the object and the result of the unrelated tool is failed.
b
A reference object's index is presented as a white number on a black background on each reference object in the
Reference objects list in the GUI. The first reference object created is assigned index number 0, and each successive
reference object's index will be incremented by 1. If a reference object is deleted from the reference object list, the
index number assigned to that object will be reused for the next reference object created.
8015726/2013-11
A.3.2 Attributes
Attributes are used to control the formatting and identification of inspections. The table below
describes the formatting attributes for Inspector. Some attributes can also be set, for the
whole formatting string, in the Ethernet Result Output dialog in the InspectorPIM60 menu in the
section Message settings. The attributes operate in a hierarchical way using inheritance. So if
Number of decimals has been set to 3 in the EthernetResult Output dialog, all REAL will be printed
with 3 decimals unless they are inside a tag that states otherwise. Some attributes can also
be set from the Ethernet Result Output dialog from the InspectorPIM60 menu in SOPAS Single Device,
see also Section 4.2.3, “Attributes” (page 23).
©SICK AG • Advanced Industrial Sensors • www.sick.com • All rights reserved
Subject to change without notice
49
Page 50

Appendix
Result output formatting
Table A.3 Formatting attributes
Reference Manual
Inspector PIM
base
intValue
coordUnit
dataType
RangeAttribute
{decimal,
octal, hex}
65535], [0,
232-1]
aligned}
DINT, REAL}
fault
value
al
noneany stringname
0[0, 255], [0,
0[0, 9]digits
pixels{pixels, mm,
AffectsDe-
tools
<UINT>, <UDINT>
REAL
Blob, Pattern,
Single edge,
Circle, Edge
counters, and
Polygon coordinates
Binary
format
YesBlob0[0, 15]index
YesAll values1.0Any REALscale
NoIntegersdecim-
Yes<TIME>s{s, ms}timeUnit
YesIdentification of
No<ASCII>0[0, 255]value
Yes<CORNERS>[0, 15]corners
YesObject locator,
YesAll values{SINT, INT,
NoAll values[0, 43]pos
CommentUsed in
Index of blob according to current blob sorting order. Index 0
is the first blob.
Scales the values before they
are printed. Can for example be
used to express positions as integers in 1/10 pixel units
Integer value to be sent.Yes<USINT>,
Minimum number of characters.NoIntegers and
Number of decimals.NoREAL2[0, 9]decimals
"All"aiterates over all polygon
corners. Number 0 to 15 gives
the properties of a single corner.
The index of this corner is the
order in which the polygon
corner was added when the
polygon was drawn.
Gives result coordinates in pixel,
millimeter or robot aligned millimeter format.
b
Casts to the specified datatype.
When using EtherNet/IP the attribute DataType specifies the
dataType section in the selected
assembly.
Used by EtherNet/IP to determine a position in the dataType
section in the selected assembly. The first position number of the dataType section is 0.
The range of the attribute pos
depends on which assembly is
used.
50
©SICK AG • Advanced Industrial Sensors • www.sick.com • All rights reserved
Subject to change without notice
8015726/2013-11
Page 51

Reference Manual
Inspector PIM
Result output formatting
Appendix
RangeAttribute
fault
value
unit
a
Only available for Ethernet Raw.
b
The device must be calibrated for it to be possible to use the “mm” or "aligned" attribute.
{radians, degrees}
grees
AffectsDe-
Binary
format
YesAnglesde-
Table A.4 Sizes of datatypes
EncodingRangeSizeDatatype
[0, 255]1 byteUSINT
[-128, 127]1 byteSINT
[0, 65535]2 bytesUINT
[-32768, 32767]2 bytesINT
[0, 232-1]4 bytesUDINT
[-231, 231-1]4 bytesDINT
Represented as IEEE 754 binary 324 bytesREAL
a
See Section 4.2.3, “Attributes” (page 23).
a
a
a
a
a
a
a
CommentUsed in
8015726/2013-11
©SICK AG • Advanced Industrial Sensors • www.sick.com • All rights reserved
Subject to change without notice
51
Page 52

Appendix
Command channel
Reference Manual
Inspector PIM
B
Command channel
The Command Channel is used to read and update a selected set of device parameters.
This section describes the Command Channel from a generic point of view. The Command
Channel is available via several of the device interfaces: Ethernet Raw, EtherNet/IP, Web
API. There are differences depending on the possibilities each interface provides. The differences are described in the chapters about each interface.
It is possible to block changes via the command channel individually for each interface using
a setting in the interface configuration, as described in the Operating Instructions for Inspector
PIM60. This makes it possible to allow changes via a PLC oriented interface while blocking
changes via the Web API.
B.1 Command syntax
The tables below describe the different command types as well as ACK messages and their
syntax. The basic principle is that there are three major types of commands (sINT, gINT, and
aACT) and some special commands.
Table B.1 Command syntax
gVER
[argN]
gRES
ExplanationCommand format
Get protocol version that is supported by the addressed device
Set device mode (0 = Run, 1 = Edit)sMOD [mode]
Get the current device mode from the devicegMOD
Set “integer” parameter in the devicesINT [identifier] [arg1] [arg2] … [argN]
Get “integer” parameter from the devicegINT [identifier] [arg1] [arg2] … [argN]
Get "string" parameter from devicegSTR [identifier] [arg1] [arg2]
Action commandsaACT [identifier] [arg1] [arg2] …
Trig an image acquisition and analysisTRIG
Retrieve the latest available Ethernet Result Output
string
Retrieve the latest statistics from the devicegSTAT
52
©SICK AG • Advanced Industrial Sensors • www.sick.com • All rights reserved
Subject to change without notice
8015726/2013-11
Page 53

Reference Manual
Inspector PIM
Command channel
Table B.2 Command response
rgVER [errorCode] [protocolVersion]
rsMOD [errorCode] [errorMessage]
rgMOD [errorCode] [mode] [errorMessage]
rsINT [identifier] [errorCode] [errorMessage]
rgINT [identifier] [errorCode] [ret1]
[ret2] ...[retN] [errorMessage]
raACT [identifier] [errorCode] [errorMessage]
rTRIG [errorCode] [errorMessage]
rgSTR [identifier] [errorCode] [errorMessage/nameString]
rgRES [errorCode] [errorMessage/resultString]
rgSTAT [statistics in XML format]
Appendix
ExplanationACK message
Response to protocol version including the version
that is supported by the device
Response to set mode (Run/Edit) including error code
and error message
Response to fetch current mode (Run/Edit) including
the mode, error code, and error message
Response to set integer parameter and action commands including error code and error message
Response to fetch integer parameter including parameter value, error code and error message
Response to the action command including error code
and error message
Response to the trig command including error code
and error message
Response to the get string command. If errorCode is
0 (No error) the errorMessage is instead the actual
response string
Response to the get latest available Ethernet Result
Output string. If errorCode is 0 (No error) the errorMessage is instead the actual Ethernet Result Output string
Response to get the latest statistics from the device
in XML format
If returned errorCode is 0 no errorMessage will be shown. For explanation of errorCode and
errorMessage see Section B.4, “Error codes” (page 72).
The response message is a receipt that the command is valid and is executed on the Inspector.
However, the following commands take longer time to execute, and may not have finished
executing when you receive the command response:
• All action commands (aACT)
• Select reference object (sINT 1)
• Set mode (sMOD)
When sent over Ethernet Raw, all command responses have a start and end character:
• Start character = STX (This character has the ASCII decimal number 2)
• End character = ETX (This character has the ASCII decimal number 3)
B.1.1 Commands ID numbers for EtherNet/IP
Table with command ID numbers to be used as replacement for the normal command strings
for interfaces where strings not are possible or preferred.
8015726/2013-11
©SICK AG • Advanced Industrial Sensors • www.sick.com • All rights reserved
Subject to change without notice
53
Page 54

Appendix
Command channel
Table B.3 Command ID numbers - for EtherNet/IP
IDCommandDescription
0sMODSet mode
1gMODGet mode
2sINTSet integer
3gINTGet integer
6gSTRGet string
7gVERGet version
8aACTAction command
9TRIGTrig device
Reference Manual
Inspector PIM
B.2 Command channel index handling
B.2.1 Introduction
The index argument in the command descriptions below refers to tool's index when configured
in SOPAS Single Device. The index can be found in the Tools tab in SOPAS Single Device. Hold the
mouse pointer over the current tool to get the index number. There are different indexes
depending on which tool is used.
B.2.2 Blob indexing
The blob index argument in the commands corresponds to the order in which the blobs are
listed in the Tools tab in the SOPAS Single Device, starting with 0.
B.2.3 Polygon indexing
The polygon index argument corresponds to the order in which the polygons are listed in the
Tools tab in the SOPAS Single Device, starting with 0.
B.2.4 Tools indexing
The index argument corresponds to the order in which the pixel counter, edge pixel counter,
pattern, edge tool, edge counter, circle locator, measure distance, and measure angle are
listed in the Tools tab in the SOPAS Single Device, starting with 0. The types of the tools (pixel
counter, edge pixel counter, pattern, edge tool, edge counter, circle locator, measure distance,
or measure angle) do not matter, i.e. if two Pattern tool are listed above a Pixel counter tool,
the Pixel counter tool has index 2. If a tool (pixel counter, edge pixel counter, pattern, edge
tool, edge counter, circle locator, measure distance, or measure angle) in the beginning of
the list is deleted, the following tool (pixel counter, edge pixel counter, pattern, edge tool,
edge counter, circle locator, measure distance, or measure angle) will be updated with a new
index.
B.3 Command descriptions
The way to configure the device through the Ethernet based command channel is based on
the set of commands described above with parameters depending on what the user wants
to do. See tables below with a complete list of command channel actions and functions.
The index argument in the command descriptions below refers to tool's index when configured
in SOPAS Single Device. The index can be found in the Tools tab in SOPAS Single Device. Hold the
mouse pointer over the current tool to get the index number.
54
©SICK AG • Advanced Industrial Sensors • www.sick.com • All rights reserved
Subject to change without notice
8015726/2013-11
Page 55

Reference Manual
Inspector PIM
Command channel
Table B.4 Command channel - actions
Appendix
Description
Command
Identifier
Usable in
Run mode
Arguments
values
RangeReturn
-No1aACTSave settings in
flash
0=use exposure settings,
object
2aACTRe-teach reference
Yes, only in
Run mode.
int autoExp
1=auto adjust
a
No3aACTPerform calibration
int box-
b
Size
-
int calibrationCov-
c
erage
>0
[0,100]
No4aACTRemove calibration
d
Yes5aACTApply IP settings
int useDHCP
0=use manual
settings,
1=use DHCP
Both in run
6aACTRestart the Inspect-
and edit
or
e
mode
No7aACTPerform (calculate)
coordinate align-
f
ment
a
In order to run this command the device must be set to Calibration mode (sINT 20 1).
b
The argument must be given in mm.
c
Returned value is the calibration target coverage in percent.
d
After the aACT 5 command has been executed the Inspector need to be restarted (e.g. using aACT 6) before the
new IP settings are in use.
e
The aACT 6 command will make the device being temporarily disconnected while it is rebooted.
f
This command can only be used if the 4 control points have been set via the sINT 300 command
8015726/2013-11
©SICK AG • Advanced Industrial Sensors • www.sick.com • All rights reserved
Subject to change without notice
55
Page 56

Appendix
Command channel
Table B.5 Command channel functions - Device settings
Reference Manual
Inspector PIM
Description
Command
Identifier
in Run
ArgumentsUsable
ues
mode
Yes112sINTSet interface
permission
int interface
int permission
int permission
int a, int b,
int c, int d
int a, int b,
int c, int d
permission
address
a
address
a
mask
mask
int interfaceYes112gINTGet interface
Yes120sINTSet device IP
int a, int b,
int c, int d
Yes120gINTGet device IP
Yes121sINTSet device net-
int a, int b,
int c, int d
Yes121gINTGet device net-
a
Yes122sINTSet gateway
int a, int b,
int c, int d
Yes122gINTGet gateway
int a, int b,
int c, int d
a
In order for the settings to take effect the aACT 5 command needs to be sent to the device
b
There should be no dots in the argument
RangeReturn val-
Interface: 0=Ethernet
Raw, 1=HTTP, 2=EtherNet/IP
Permission: 1=enable, 0=disable
Interface: 0=Ethernet
Raw, 1=HTTP, 2=EtherNet/IP
Address format:
b
a.b.c.d
Address format:
a.b.c.d
Address format:
b
a.b.c.d
Address format:
a.b.c.d
Address format:
b
a.b.c.d
Address format:
a.b.c.d
Table B.6 Command channel functions - general
Iden-
Description
Command
tifier
able
in
Run
mode
sion
-TRIGTrig device
a
object
figured reference objects
No13sINTChange internal illumin-
ation mode
Mode
tion mode
RangeReturn valuesArgumentsUs-
6=PIM60 1.0int versionYes-gVERGet used protocol ver-
0=Run, 1= Editint modeYes-sMODSet device mode
0=Run, 1= Editint modeYes-gMODGet device mode
-Yes
[0, 31]int objectYes1sINTSelect reference object
[0,31]int objectYes1gINTGet active reference
[0,31]int object-Yes2gINTGet number of con-
0=Off, 1=Onint illum-
0=Off, 1=Onint illumModeYes13gINTGet internal illumina-
56
©SICK AG • Advanced Industrial Sensors • www.sick.com • All rights reserved
Subject to change without notice
8015726/2013-11
Page 57

Reference Manual
Inspector PIM
Command channel
Appendix
Description
b
mode(free-running,
trig)
teger tags in result
output (UINT1-3)
tags in result output
(UINT1-3)
[microseconds]
mode
meters
Command
Identifier
able
in
Run
mode
No14sINTChange exposure
Yes20gINTGet calibration para-
No21sINTSet external trig delay
Yes21gINTGet external trig delay
No22sINTSet digital output delay
Yes22gINTGet digital output delay
exp*100
int modeNo16sINTSwitch trigger
int modeNo20sINTEnter/leave calibration
int parameter
int type, int
delay (milliseconds*10
or ticks)
h
int outputIndex, int
seconds*10
or ticks)
int outputIndex
int trigModeYes16gINTGet trigger mode
int framePeriodYes19gINTGet frame period time
int parameterResult
int type, int delay
(milliseconds*10
or ticks)
int type, int delay
(milliseconds*10
or ticks)
RangeReturn valuesArgumentsUs-
[10,10000]int
[10, 10000]int exp*100Yes14gINTGet exposure
[0, 400]int gainNo15sINTChange gain
[0, 400]int gainYes15gINTGet gain
0=free-running,
1=trig
0=free-running,
1=trig
[0, 2],int index,Yes18sINTChange value of in-
[0,65535]int value
[0, 2],int index,Yes18gINTGet value of integer
[0,65535]int value
0=normal mode,
1=calibration
mode
0=calibration/normal modec,
1=calibratedd,
2=scalinge, 3=originf, 4=rotationg,
5=mean pixel error, 6=max pixel
error
[0=ms, 1=tick],
[1,50000] resp [0
ticks, 200000
ticks]
[0=ms, 1=tick],
[1,50000] resp [0
ticks, 200000
ticks]
[0,19], [0=ms,
1=tick], [(Min
delaytype, int
time)*10,50000]delay (milliresp [0 ticks,
200000 ticks]
[0,19], [0=ms,
1=tick],
[1,50000] resp [0
8015726/2013-11
©SICK AG • Advanced Industrial Sensors • www.sick.com • All rights reserved
Subject to change without notice
57
Page 58

Appendix
Command channel
Reference Manual
Inspector PIM
Description
Command
Identifier
able
RangeReturn valuesArgumentsUs-
in
Run
mode
ticks, 200000
ticks]
[0,19], [0=ms,
1=tick],
ive time
No23sINTSet digital output act-
int outputIndex, int
[1,10000] resp [0type, int
time (milliseconds*10
ticks, 200000
ticks]
or ticks)
[0,19], [0=ms,
1=tick],
[1,10000] resp [0
ive time
Yes23gINTGet digital output act-
int outputIndex
int type, int time
(milliseconds*10
or ticks)
ticks, 200000
ticks]
[0=A, 1=B, 2=C,
3=D]
int x * 100, [-
2147483648,
2147483647]
point
int pointIn-
i
No300sINTSet alignment control
dex,
int x * 100,
int y * 100
int z * 100
int y * 100, [-
2147483648,
2147483647]
int z * 100, [-
2147483648,
2147483647]
a
While possible to trig over all interfaces, it is recommended to use only the following for high speed applications:
• Digital I/O (In3)
• Ethernet Raw (port 2116)
• EtherNet/IP (small assembly)
b
The exposure is expressed in ms multiplied by 100 i.e. 3.8 ms is expressed as 380
c
The result is 0= normal mode or 1= calibration mode.
d
The result is 0= not calibrated or 1= calibrated.
e
The result is expressed in mm/pixel x 10000.
f
The result is expressed in pixels for x and y.
g
The result is expressed in degrees.
h
The delay is expressed in ms multiplied by 10 i.e. 1.5 ms is expressed as 15
i
In order for the settings to take effect the aACT 7 command needs to be sent to the device
58
Table B.7 Command channel functions - Object locator
Description
Command
Identifier
Usable
in Run
Arguments
mode
No32sINTChange object locator
match threshold
threshold
Yes32gINTGet object locator
match threshold
rotation search mode
©SICK AG • Advanced Industrial Sensors • www.sick.com • All rights reserved
Subject to change without notice
RangeReturn
values
[0, 100], percentint
[0, 100], percentint
threshold
0=off, 1=onint modeNo33sINTChange object locator
8015726/2013-11
Page 59

Reference Manual
Inspector PIM
Command channel
Appendix
Description
tion search mode
rotation search limit
tion search limit
scale search mode
scale search mode
robustness
bustness
accuracy
curacy
ject locator
Command
Identifier
Usable
in Run
mode
No38sINTMove and rotate ob-
Arguments
int robNo36sINTChange object locator
int accNo37sINTChange object locator
int x, int
y, int
angle
values
int robYes36gINTGet object locator ro-
int accYes37gINTGet object locator ac-
RangeReturn
0=off, 1=onint modeYes33gINTGet object locator rota-
[0, 180] degreesint limitNo34sINTChange object locator
[0, 180] degreesint limitYes34gINTGet object locator rota-
0=off, 1=onint modeNo35sINTChange object locator
0=off, 1=onint modeYes35gINTGet object locator
0=High robustness,
1=Normal, 2=High
speed
0=High robustness,
1=Normal, 2=High
speed
0=High accuracy,
1=Normal, 2=High
speed
0=High accuracy,
1=Normal, 2=High
speed
x, y = pixels, angle =
degrees. Arguments
are delta values as
compared to the current position and angle.
These can be negative
8015726/2013-11
Yes38gINTGet object locator pos-
ition and rotation
Yes39gINTGet object locator
width and height
Table B.8 Command channel functions - Blob
Description
Command
Identifier
able
Arguments
Us-
in
Run
mode
tensity thresholds
©SICK AG • Advanced Industrial Sensors • www.sick.com • All rights reserved
Subject to change without notice
a
int x, int
y, int
angle
height
ues
x, y = pixels, angle =
degrees. Return values
are absolute values for
the center of the ROI.
These can be negative
as compared to the
origin
[0-640], [0-480]int w, int
RangeReturn val-
[0, 7],int index,No48sINTChange blob in-
[0, 255], min<=maxint min,
[0, 255], min<=maxint max
59
Page 60

Appendix
Command channel
Reference Manual
Inspector PIM
Description
thresholds
thresholds
thresholds
thresholds
Command
Identifier
Usable
in
Run
mode
Arguments
int min,
int max
ance
a
RangeReturn val-
ues
[0, 7],-int indexYes48gINTGet blob intensity
[0, 255],int min,
[0, 255]int max
[0, 7],int index,No49sINTChange blob area
[10, 307200] pixels,
min<=max,
[10, 307200] pixels,
min<=max
[0, 7],-int indexYes49gINTGet blob area
[10, 307200] pixels,int min,
[10, 307200] pixelsint max
[0, 7],int index,No50sINTChange blob angle
[0, 180],int angle,
[0, 90]int angletoler-
thresholds
criteria thresholds
teria thresholds
strength
strength
light compensation mode
compensation
mode
search method
int min,
int max
int method
[0, 7],-int indexYes50gINTGet blob angle
[0, 180],int ref,
[0, 90]int tol
[0, 7],int index,No53sINTChange structure
[0, 100000],
min<=max,
[0, 100000], min<=max
[0, 7],-int indexYes53gINTGet structure cri-
[0, 100000],int min,
[0, 100000]int max
[0, 7],int index,No54sINTChange blob edge
[0, 100] percentint strength
[0, 7],-int indexYes54gINTGet blob edge
[0, 100] percentint strength
[0, 7],int index,No55sINTChange ambient
0=off, 1=onint mode
[0, 7],-int indexYes55gINTGet ambient light
0=off, 1=onint mode
[0, 7],int index,No56sINTChange blob
0=High quality, 1=Normal, 2=High speed
60
method
©SICK AG • Advanced Industrial Sensors • www.sick.com • All rights reserved
Subject to change without notice
int method
[0, 7],-int indexYes56gINTGet blob search
0=High quality, 1=Normal, 2=High speed
8015726/2013-11
Page 61

Reference Manual
Inspector PIM
Command channel
Appendix
Description
blob locator
tion and rotation
blobs
Command
Identifier
Usable
in
Run
mode
Arguments
int x, int y, int
angle
a
ues
int x, int y,
int angle
RangeReturn val-
[0, 7],int index,No58sINTMove and rotate
x, y = pixels, angle = degrees. Arguments are
delta values as compared to the current position and angle. These
can be negative
[0, 7]-int indexYes58gINTGet blob ROI posi-
x, y = pixels, angle = degrees. Return values are
absolute values for the
center of the ROI. These
can be negative as
compared to the origin.
[0, 7]int indexNo59sINTSet number of
[0, 16] min<=maxint min
[0, 16] min<=maxint max
blobs
thresholds in mm
2
int
min*1000,
int
max*1000 [10 * pixel size -
int blobYes61gINTGet blob region
width and height
a
For information about blob indexing see Section B.2.2, “Blob indexing” (page 54)
height
Table B.9 Command channel functions - Polygon
Description
Command
Identifier
Usable
Arguments
a
values
in Run
mode
tion search tolerance
int tol
[0, 7]-int indexYes59gINTGet number of
[0, 16] min<=maxint min,
[0, 16] min<=maxint max
[0, 7]-int indexYes60gINTGet blob area
[10 * pixel size 307200 * pixel size],
min<=max
307200 * pixel size],
min<=max
[0-7], [0-640], [0-480]int w, int
RangeReturn
[0, 7],int index,No64sINTChange polygon posi-
[5, 100] pixels for
single edge
[5, 100] pixels for
polygon
8015726/2013-11
search tolerance
©SICK AG • Advanced Industrial Sensors • www.sick.com • All rights reserved
Subject to change without notice
int tol
[0, 7],-int indexYes64gINTGet polygon position
[5, 100] pixels for
single edge
61
Page 62

Appendix
Command channel
Reference Manual
Inspector PIM
Description
ibility search tolerance
search tolerance
score threshold
threshold
gin
Command
Identifier
Usable
in Run
mode
Arguments
a
values
threshold
gin
RangeReturn
[5, 100] pixels for
polygon
[0, 7],int index,No65sINTChange polygon flex-
[0, 100] pixelsint tol
[0, 7],-int indexYes65gINTGet polygon flexibility
[0, 100] pixelsint tol
[0, 7],int index,No66sINTChange polygon
[0, 100] pixelsint threshold
[0, 7],-int indexYes66gINTGet polygon score
[0, 100] pixelsint
[0, 7],int index,No67sINTChange polygon mar-
[0, 20] pixelsint margin
[0, 7],-int indexYes67gINTGet polygon margin
[0, 20] pixelsint mar-
fect detection width
detection width
fect intensity range
thresholds
intensity range
thresholds
defects threshold
fects threshold
fect detection mode
detection mode
int min,
int max
int min,
int max
[0, 7],int index,No68sINTChange polygon de-
[0, 100] pixelsint width
[0, 7],-int indexYes68gINTGet polygon defect
[0, 100] pixelsint width
[0, 7],int index,No69sINTChange polygon de-
[0, 255], min<=max,
[0, 255], min<=max
[0, 7],-int indexYes69gINTGet polygon defect
[0, 255],
[0, 255]
[0, 7],int index,No70sINTChange polygon max
[0, 100] pixelsint max
[0, 7],-int indexYes70gINTGet polygon max de-
[0, 100] pixelsint max
[0, 7],int index,No71sINTChange polygon de-
0=off, 1=onint mode
[0, 7],-int indexYes71gINTGet polygon defect
0=off, 1=onint mode
62
int x, int y
©SICK AG • Advanced Industrial Sensors • www.sick.com • All rights reserved
Subject to change without notice
[0, 7],int index,No72sINTMove polygon
x, y = pixels, Arguments are delta values. These can be
8015726/2013-11
Page 63

Reference Manual
Inspector PIM
Command channel
Appendix
Description
Command
Identifier
Usable
Arguments
a
values
in Run
mode
use
int delta-x, int
delta-y
a
For information about polygon indexing see Section B.2.3, “Polygon indexing” (page 54)
RangeReturn
negative as compared to the origin.
----72gINTReserved for future
[0, 7],int index,No73sINTMove polygon corner
[0-15]int corner,
delta-x, delta-y =
pixels. Arguments are
delta values. These
can be negative as
compared to the origin.
[0-7],-int indexYes73gINTGet polygon corner
[0-15]-int corner
x, y = pixelsint x, int y
Table B.10 Command channel functions - Pixel counter
Description
Command
Identifier
Usable
in Run
Arguments
a
values
RangeReturn
mode
[0, 63],int index,No80sINTChange pixel
counter intensity
range thresholds
int min,
int max
[0, 255], min<=max,
[0, 255], min<=max
[0, 63],-int indexYes80gINTGet pixel counter intensity range
thresholds
int min,
int max
[0, 255],
[0, 255]
[0, 63],int index,No81sINTChange No. of pixels
in range thresholds
int min,
int max
[0, ROI sizeb] pixels ,
min<=max,
[0, ROI sizeb] pixels,
min<=max
[0, 63],-int indexYes81gINTGet No. of pixels in
range thresholds
[0, ROI sizeb] pixels,int min,
[0, ROI sizeb] pixelsint max
a
For information about tools indexing see Section B.2.4, “Tools indexing” (page 54)
b
ROI size is the size of the pixel counter ROI in the reference object. Value can be fetched with the command gINT
87
8015726/2013-11
©SICK AG • Advanced Industrial Sensors • www.sick.com • All rights reserved
Subject to change without notice
63
Page 64

Appendix
Command channel
Reference Manual
Inspector PIM
Table B.11 Command channel functions - Edge pixel counter
Description
Command
Identifier
Usable
in Run
Arguments
a
ues
RangeReturn val-
mode
[0, 63],int index,No82sINTChange edge pixel
counter edge
[0, 100]int strength
strength
[0, 63],-int indexYes82gINTGet edge pixel
counter edge
[0, 100]int strength
strength
[0, 63],int index,No83sINTChange No. of
edge pixels
thresholds
int min,
int max
[0, ROI sizeb] pixels,
min<=max
[0, ROI sizeb] pixels,
min<=max
[0, 63],-int indexYes83gINTGet No. of edge
pixels thresholds
int
10000*min,
int
10000*max
a
For information about tools indexing see Section B.2.4, “Tools indexing” (page 54)
b
ROI size is the size of the edge pixel counter ROI in the reference object. Value can be fetched with the command
gINT 87
[0, ROI sizeb] pixels,
min<=max
[0, ROI sizeb] pixels,
min<=max
Table B.12 Command channel functions - Pattern
Description
Command
Identifier
Usable in
Run
Arguments
a
mode
tion tolerance
tolerance
score threshold
threshold
a
For information about tools indexing see Section B.2.4, “Tools indexing” (page 54)
Table B.13 Command channel functions - Edge tool
Description
Command
Identifier
Usable
in Run
Arguments
a
values
mode
edge contrast
RangeReturn
values
[0, 63],int index,No84sINTChange pattern posi-
[0, 4] pixelsint tolerance
[0, 63],-int indexYes84gINTGet pattern position
[0, 4] pixelsint tol
[0, 63],int index,No85sINTChange pattern
[0, 100] percentint threshold
[0, 63],-int indexYes85gINTGet pattern score
[0, 100] percentint
threshold
RangeReturn
[0, 63],int index,No150sINTChange edge tool
[0, 100]int contrast
64
contrast
©SICK AG • Advanced Industrial Sensors • www.sick.com • All rights reserved
Subject to change without notice
[0, 63],-int indexYes150gINTGet edge tool edge
[0, 100]
8015726/2013-11
Page 65

Reference Manual
Inspector PIM
Command channel
Appendix
Description
line fit criteria
fit criteria
polarity
ity
score threshold
Command
Identifier
Usable
in Run
mode
Arguments
int criterion
int polarity
a
values
int contrast
int criterion
int criterion
RangeReturn
[0, 63],int index,No151sINTChange edge tool
[0, 2] (0 = best fit, 1
= first, 2 = last)
[0, 63],-int indexYes151gINTGet edge tool line
[0, 2] (0 = best fit, 1
= first, 2 = last)
[0, 63],int index,No152sINTChange edge tool
[0, 2] (0 = any, 1 =
bright to dark, 2 =
dark to bright)
[0, 63],-int indexYes152gINTGet edge tool polar-
[0, 2] (0 = any, 1 =
bright to dark, 2 =
dark to bright)
[0, 63],int index,No153sINTChange edge tool
[0, 100]int threshold
threshold
threshold
a
For information about tools indexing see Section B.2.4, “Tools indexing” (page 54)
Table B.14 Command channel functions - Find maximum
Description
Command
Identifier
Usable
in Run
Arguments
a
values
mode
um edge contrast
edge contrast
trast
um criteria
criteria
int criterion
int criterion
[0, 63],-int indexYes153gINTGet edge tool score
[0, 100]int
RangeReturn
[0, 63],int index,No220sINTChange find maxim-
[0, 100]int contrast
[0, 63],-int indexYes220gINTGet find maximum
[0, 100]int con-
[0, 63],int index,No221sINTChange find maxim-
[0, 2] (0 = first, 1 =
last)
[0, 63],-int indexYes221gINTGet find maximum
[0, 2] (0 = first, 1 =
last)
8015726/2013-11
um polarity
©SICK AG • Advanced Industrial Sensors • www.sick.com • All rights reserved
Subject to change without notice
int polarity
[0, 63],int index,No222sINTChange find maxim-
[0, 2] (0 = any, 1 =
bright to dark, 2 =
dark to bright)
65
Page 66

Appendix
Command channel
Reference Manual
Inspector PIM
Description
Command
Identifier
Usable
in Run
Arguments
a
values
mode
polarity
int criterion
a
For information about tools indexing see Section B.2.4, “Tools indexing” (page 54)
Table B.15 Command channel functions - Circle
Description
Command
Identifier
Usable
Arguments
a
ues
in
Run
mode
edge contrast
contrast
meter thresholds
(without search
enabled)
int max
int unit
RangeReturn
[0, 63],-int indexYes222gINTGet find maximum
[0, 2] (0 = any, 1 =
bright to dark, 2 =
dark to bright)
RangeReturn val-
[0, 63],int index,No160sINTChange circle
[0, 100]int contrast
[0, 63],-int indexYes160gINTGet circle edge
[0, 100]int contrast
[0, 63],int index,No161sINTChange circle dia-
[1, max]int min
[5, circle within FOV]
[0, 1] (0 = pixels, 1 =
millimeters)
b
meter thresholds
(with search en-
abled)
er thresholds
fit criteria
criteria
int min
int max
int unit
int unit
int criterion
-
int min
int max
int criterion
[0, 63],int index,No161sINTChange circle dia-
[shortest search region
side/3, max]
[min, shortest search
region side]
[0, 1] (0 = pixels, 1 =
millimeters)
[0, 63],-int index,Yes161gINTGet circle diamet-
[0, 1] (0 = pixels, 1 =
millimeters)
Min threshold in the
unit specified,
Max threshold in the
unit specified
[0, 63],int index,No162sINTChange circle line
[0, 2] (0 = strongest, 1
= first, 2 = last)
[0, 63],-int indexYes162gINTGet circle line fit
[0, 2] (0 = strongest, 1
= first, 2 = last)
66
larity
©SICK AG • Advanced Industrial Sensors • www.sick.com • All rights reserved
Subject to change without notice
[0, 63],int index,No163sINTChange circle po-
8015726/2013-11
Page 67

Reference Manual
Inspector PIM
Command channel
Appendix
Description
bustness
ness
score threshold
Command
Identifier
Usable
in
Run
mode
Arguments
a
int polarity
int robustness
ues
int criterion
int criterion
RangeReturn val-
[0, 2] (0 = any, 1 =
bright to dark, 2 = dark
to bright)
[0, 63],-int indexYes163gINTGet circle polarity
[0, 2] (0 = any, 1 =
bright to dark, 2 = dark
to bright)
[0, 63],int index,No164sINTChange circle ro-
[0, 4] (0 = high robustness to 4 = high speed)
[0, 63],-int indexYes164gINTGet circle robust-
[0, 4] (0 = high robustness to 4 = high speed)
[0, 63],int index,No165sINTChange circle
[0, 100]int threshold
threshold
quality
meter offset compensation
er offset compensation
meter tolerance
thresholds
int quality
int offset*1000
int unit
int unit
int min*1000
int max*1000
int unit
threshold
int quality
-
int offset*1000
[0, 63],-int indexYes165gINTGet circle score
[0, 100]int
[0, 63],int index,No166sINTChange circle
[0, 6] (0 = tolerant to 6
= exact)
[0, 63],-int indexYes166gINTGet circle quality
[0, 6] (0 = tolerant to 6
= exact)
[0, 63],int index,No167sINTChange circle dia-
[-1000000,1000000]
[0, 1] (0 = pixels, 1 =
millimeters)
[0, 63],-int index,Yes167gINTGet circle diamet-
[0, 1] (0 = pixels, 1 =
millimeters)
[0, 63],int index,No169sINTChange circle dia-
[0, 640000] min<=max
[0, 640000]
[0, 1] (0 = pixels, 1 =
millimeters)
8015726/2013-11
er tolerance
int unit
thresholds
©SICK AG • Advanced Industrial Sensors • www.sick.com • All rights reserved
Subject to change without notice
-
int
min*1000
[0, 63],-int index,Yes169gINTGet circle diamet-
[0, 1] (0 = pixels, 1 =
millimeters)
[0, 640000] min<=max
67
Page 68

Appendix
Command channel
Reference Manual
Inspector PIM
Description
Command
Identifier
Usable
Arguments
a
ues
RangeReturn val-
in
Run
mode
int
[0, 640000]
max*1000
a
For information about tools indexing see Section B.2.4, “Tools indexing” (page 54)
b
When creating the circle without search, the max diameter that can be set is the diameter that keeps the circle
within the configured FOV. E.g. if using the full resolution FOV and placing the circle in the center of the image, the
max value without search can be set to 480 pixels.
The table below lists the move commands for the Pixel counter, Edge pixel counter, Pattern,
Edge, and Circle tools.
Table B.16 Command channel functions - Common commands for Pixel counter, Edge
pixel counter, Pattern, Edge, and Circle tools
Description
Command
Identifier
Usable
in Run
Arguments
a
values
RangeReturn
mode
[0, 63],
x, y = pixels, angle = degrees. Arguments are delta
inspection
No86sINTMove and rotate
int index,
int x, int y,
int angle
values. These can be negative as compared to the origin.
int indexYes86gINTGet inspection po-
sition and rotation
-
int x, int
y, int
angle
int indexYes87gINTGet number of
pixels in ROI, (Val-
-
int pixels
id for Pixel
Counter and Edge
Pixel Counter)
a
For information about tools indexing see Section B.2.4, “Tools indexing” (page 54)
Table B.17 Command channel functions - Distance
Description
Command
Identifier
Usable
in Run
Arguments
a
ues
mode
measurement
thresholds
int min*1000
int max*1000
int unit
[0, 63],
x, y = pixels, angle = degrees. Return values are
absolute values for the
center of the ROI. These
can be negative as compared to the origin.
[0, 63],
Number of pixels in the reference object's ROI
RangeReturn val-
[0, 63],int index,No170sINTChange distance
[0, VGA image diagonal]
[0, VGA image diagonal]
[0, 1] (0 = pixels, 1 =
millimeters)
min ≤ max
68
©SICK AG • Advanced Industrial Sensors • www.sick.com • All rights reserved
Subject to change without notice
8015726/2013-11
Page 69

Reference Manual
Inspector PIM
Command channel
Appendix
Description
Command
Identifier
Usable
in Run
Arguments
a
ues
mode
measurement
thresholds
int unit
-
int
min*1000
int
max*1000 [0, VGA image diagon-
offset compensation
int offset*1000
int unit
set compensation
int unit
-
int offset*1000
a
For information about tools indexing see Section B.2.4, “Tools indexing” (page 54)
Table B.18 Command channel functions - Angle
Description
Command
Identifier
Usable
in Run
Arguments
a
ues
mode
measurement
thresholds
int
min*1000
int
max*1000
RangeReturn val-
[0, 63],-int index,Yes170gINTGet distance
[0, 1] (0 = pixels, 1 =
millimeters)
[0, VGA image diagonal]
al]
[0, 63],int index,No173sINTChange distance
[-1000000,1000000]
[0, 1] (0 = pixels, 1 =
millimeters)
[0, 63],-int index,Yes173gINTGet distance off-
[0, 1] (0 = pixels, 1 =
millimeters)
RangeReturn val-
[0, 63],int index,No180sINTChange angle
[0, 100]
[0,180000], min ≤
max
8015726/2013-11
urement
thresholds
int
min*1000
int
max*1000
set compensation
compensation
set*1000
int offset*1000
a
For information about tools indexing see Section B.2.4, “Tools indexing” (page 54)
©SICK AG • Advanced Industrial Sensors • www.sick.com • All rights reserved
Subject to change without notice
[0, 63],-int indexYes180gINTGet angle meas-
[0, 100]
[0,180000], min ≤
max
[0, 63],int index,No181sINTChange angle off-
[-1000000,1000000]int off-
[0, 63]-int indexYes181gINTGet angle offset
69
Page 70

Appendix
Command channel
Table B.19 Command channel functions - Edge counter
Description
counter edge contrast
edge contrast
counter edge quality
edge quality
counter feature
width
Command
Identifier
Usable
in
Run
mode
Arguments
int min*10
int max*10
int unit
a
ues
Reference Manual
Inspector PIM
RangeReturn val-
[0, 63],int index,No190sINTChange Edge
[0, 100]int contrast
[0, 63],-int indexYes190gINTGet Edge counter
[0, 100]int contrast
[0, 63],int index,No191sINTChange Edge
[0, 6]int robustness
[0, 63],-int indexYes191gINTGet Edge counter
[0, 6]int quality
[0, 63],int index,No192sINTChange Edge
[0, VGA image diagonal]
[0, VGA image diagonal]
[0, 1] (0 = pixels, 1 =
millimeters)
b
min ≤ max
feature width
counter feature
type
feature type
min max features
max features
int unit
int type
-
int min*10
int max*10
int type
[0, 63],-int index,Yes192gINTGet Edge counter
[0, 1] (0 = pixels, 1 =
millimeters)
[0, VGA image diagonal]
[0, VGA image diagonal]
[0, 63],int index,No193sINTChange Edge
(0 = bright, 1 = dark,
2 = single edge)
[0, 63],-int indexYes193gINTGet Edge counter
(0 = bright, 1 = dark,
2 = single edge)
[0, 63],int index,No194sINTChange edge count
[0, 63]int min
[0, 63]int max
min ≤ max
[0, 63],-int indexYes194gINTGet edge count min
[0, 64]int min
[0, 64]int max
70
search method robustness
©SICK AG • Advanced Industrial Sensors • www.sick.com • All rights reserved
Subject to change without notice
[0, 63],int index,No195sINTChange edge count
[0, 4]int robustness
8015726/2013-11
Page 71

Reference Manual
Inspector PIM
Command channel
Appendix
Description
search method robustness
pitch threshold
pitch threshold
Command
Identifier
Usable
in
Run
mode
Arguments
a
int min*1000
int max*1000
int unit
int unit
RangeReturn val-
ues
[0, 63],-int indexYes195gINTGet edge count
[0, 4]int robust-
ness
[0, 63],int index,No197sINTChange edge count
[0, VGA image diagonal]
[0, VGA image diagonal]
[0, 1] (0 = pixels, 1 =
millimeters)
min ≤ max
[0, 63],-int index,Yes197gINTGet edge count
-
int
min*1000
int
[0, 1] (0 = pixels, 1 =
millimeters)
[0, VGA image diagonal]
max*1000 [0, VGA image diagon-
al]
single edge polarity
single edge polarity
a
For information about tools indexing see Section B.2.4, “Tools indexing” (page 54)
b
"0" is the only valid value for circular.
int polarity
int polarityint polarity
Table B.20 Command channel functions - Get names
Description
Command
Identifier
in Run
ArgumentsUsable
mode
Yes1gSTRGet name of
device
Yes2gSTRGet name of refer-
ence object
ject
Yes3gSTRGet name of Object
Locator
ject
[0, 63],int index,No199sINTChange edge count
[0, 2] (0=any,
1=bright to dark,
2=dark to bright)
[0, 63],-int index,Yes199gINTGet edge count
[0, 2] (0=any,
1=bright to dark,
2=dark to bright)
RangeReturn val-
ues
[0,31]-int referenceOb-
string name
[0,31]-int referenceOb-
string name
8015726/2013-11
Yes4gSTRGet name of Pixel
counter
ject
int index
©SICK AG • Advanced Industrial Sensors • www.sick.com • All rights reserved
Subject to change without notice
[0, 31],-int referenceOb-
a
string name
[0, 63]-
71
Page 72

Appendix
Command channel
Reference Manual
Inspector PIM
Description
pixel counter
tern
gon
tool
Command
Identifier
in Run
mode
Yes5gSTRGet name of Edge
Yes6gSTRGet name of Pat-
Yes7gSTRGet name of Blob
Yes8gSTRGet name of Poly-
Yes9gSTRGet name of edge
Yes10gSTRGet name of circle
ArgumentsUsable
ject
int index
ject
int index
ject
int index
ject
int index
ject
int index
ject
int index
RangeReturn val-
ues
[0, 31],-int referenceOb-
a
string name
[0, 63]-
[0, 31],-int referenceOb-
a
string name
[0, 63]-
[0, 31],-int referenceOb-
b
string name
[0, 7]-
[0, 31],-int referenceOb-
c
string name
[0, 7]-
[0, 31],-int referenceOb-
a
string name
[0, 63]-
[0, 31],-int referenceOb-
a
string name
[0, 63]-
Yes11gSTRGet name of
Measure distance
ject
int index
a
string name
Yes12gSTRGet name of
Measure angle
ject
int index
a
string name
Yes13gSTRGet Edge counter
name
ject
int index
a
string name
Yes14gSTRGet all tool names
(except the Object
Locator)
ject
int format
-
string list of
names
a
For information about tools indexing see Section B.2.4, “Tools indexing” (page 54)
b
For information about blob indexing see Section B.2.2, “Blob indexing” (page 54)
c
For information about polygon indexing see Section B.2.3, “Polygon indexing” (page 54)
d
CSV (Comma separated values) in accordance with RFC 4180
JSON (JavaScript Object Notation) in accordance with RFC 4627
[0, 31],-int referenceOb-
[0, 63]-
[0, 31],-int referenceOb-
[0, 63]-
[0, 31],-int referenceOb-
[0, 4]-
[0, 31],-int referenceOb-
[0, 1] (0=CSV
format,
1=JSON
format)
d
72
B.4 Error codes
The tables below list error codes that may result from commands or configuration of the
device. The error codes are valid for EtherNet/IP, Ethernet Raw, and Web Server. Both error
code and an explaining text are shown when using Ethernet Raw for configuring the device
©SICK AG • Advanced Industrial Sensors • www.sick.com • All rights reserved
Subject to change without notice
8015726/2013-11
Page 73

Reference Manual
Inspector PIM
Command channel
Appendix
through the command channel. When using EtherNet/IP for configuring the device through
the command channel will only view the error code.
Table B.21 Error codes - Command errors
DescriptionError code
No error0
Index out of bounds, for example trying to use an image bank above 328000
Incorrect number of arguments, too many or too few arguments are supplied8001
8002
A parameter value is out of bounds, for example it was not in the allowed range
as described in the command list
Command with no valid identifier, for example sINT 2008003
An invalid mode was supplied sMOD, for example sMOD 28004
The device is performing an operation and cannot accept new command8005
Set commands are disabled for this interface8006
This command is only available for GET8007
8015726/2013-11
©SICK AG • Advanced Industrial Sensors • www.sick.com • All rights reserved
Subject to change without notice
73
Page 74

Appendix
Command channel
Table B.22 Error codes - Configuration errors
DescriptionError code
No error0
Operation is not allowed in current mode8100
The reference bank is not used on the device8101
8102
Operation is not allowed, for example trying sINT 20 0 when not in calibration
mode
Reference Manual
Inspector PIM
8103
8113
8115
Calibration mode is not enabled when trying to perform calibration or trying to
remove non-existent calibration
No object locator is available in current reference bank8104
No blob tool with this index exists8105
Polygon defect detection is not enabled8106
No polygon with supplied index exists8107
No pixel counter with supplied index exists8108
No edge pixel counter with supplied index exists8109
No pattern inspection with supplied index exists8110
The move or rotation caused the ROI to appear outside of the FOV8111
Trig is not activated8112
The specified IP address was invalid, or an invalid combination of addresses
was used
The specified network mask was invalid8113
The specified gateway address was invalid8113
The combination of IP settings was invalid8113
Calibration failed8114
Interface not available. Only interfaces that exist in the product can be enabled/disabled
No edge tool with supplied index exists8116
No angle tool with supplied index exists8117
No circle with supplied index exists8118
No distance tool with supplied index exists8119
The specified tool does not have a region (it is a measurement)8120
The tool type of the specified tool does not support this command8121
No tool with supplied index exists8122
No edge count tool with supplied index exists8123
Search region is not enabled8124
Width or height is invalid8125
No tools in configuration8126
Invalid unit specified8127
Alignment to specified control points failed8128
74
©SICK AG • Advanced Industrial Sensors • www.sick.com • All rights reserved
Subject to change without notice
8015726/2013-11
Page 75

Reference Manual
Inspector PIM
Command channel
Appendix
B.5 Version information
The command channel is continually extended with new commands. The intention is to always
keep the command set backwards compatible with earlier versions. This table lists the
available versions and the updates between each version.
Table B.23 Command channel versions
CommentsReleased inVersion
First official versionPIM60 1.06
B.6 Command examples
B.6.1 Command examples Ethernet Raw
Note that the ACK messages in the below tables don't include the start and end character
that is included in all ACK messages. See Section B.1, “Command syntax” (page 52) for more
information on start and end character.
Table B.24 Commands Ethernet Raw - general examples
200-255 for polygon 2
polygon 2
ject
second reference object
ACK messageCommandDescription
rsMOD 0sMOD 0Switch to Run mode
rsMOD 0sMOD 1Switch to Edit mode
rgMOD 0 1gMODGet device mode
rsINT 16 0sINT 16 0Set trigger mode to free-running
rsINT 16 0sINT 16 1Set trigger mode to triggered
gINT 16Get trigger mode
gINT 69 2Get defect intensity thresholds for
gSTR 2 1Get name of second reference ob-
gSTR 8 1 1Get name of second polygon in
rgINT 16 0 0 – if free-running
rgINT 16 0 1 – if triggered by Ethernet
rsINT 69 0sINT 69 2 200 255Set defect intensity thresholds to
rgINT 69 0 200 255 – if OK
rgINT 69 8107 polygon does not exist – if not OK
rgSTR 2 0 Object 2 - if OK
rgSTR 2 8000 Ref bank index is not
used. - if not OK
rgSTR 8 0 Polygon 2 - if OK
rgSTR 8 8107 No polygon with this
index exists. - if not OK
8015726/2013-11
©SICK AG • Advanced Industrial Sensors • www.sick.com • All rights reserved
Subject to change without notice
75
Page 76

Appendix
Command channel
Reference Manual
Inspector PIM
Table B.25 Commands Ethernet Raw - device settings and actions examples
a
Set device IP address
Apply IP settings
sINT 120 192 168 1 110
aACT 5 0
b
ACK messageCommand(s)Description
rsINT 120 0
raACT 5 0
Set device netmask
Apply IP settings
Set device gateway (optional)
Apply IP settings
Enter calibration mode
Perform calibration
a
The below examples can also be done by sending the set device IP address, set device netmask and set device
gateway in a sequence and then send the aACT 5 command to activate all these settings
b
The aACT 5 command will make the device being temporarily disconnected while the new settings are applied.
After this command the new IP address will have to be used in order to connect to the device
c
Returned value is the calibration target coverage in percent
sINT 121 255 255 255 0
aACT 5 0
b
sINT 122 192 168 1 1
aACT 5 0
b
sINT 20 1
aACT 3 6
rsINT 121 0
raACT 5 0
rsINT 122 0
raACT 5 0
rsINT 20 0
raACT 3 0 75
c
76
©SICK AG • Advanced Industrial Sensors • www.sick.com • All rights reserved
Subject to change without notice
8015726/2013-11
Page 77

Reference Manual
Inspector PIM
Restore configuration over Web API
Appendix
C
Restore configuration over Web API
The restore configuration operation takes a device configuration created with the backup
functionality and replaces the current configuration with the configuration in the backup file.
The operation is a multiple step procedure with the following steps:
1. Create session cookie
2. Login
3. Prepare restore mode
4. Transfer restore file to device
5. Device restart
The restore operation will remove the previous configuration and replace it with a new configuration. The IP address and the chessboard calibration will not be updated by the restore
operation. It is not possible to use the device for other purposes during the restore operation.
The operation may take several minutes to perform and the time is partly depending on the
size of the backup file.
C.1 Restore configuration
The restore configuration operation takes a device configuration created with the backup
functionality and replaces the current configuration with the configuration in the backup file.
The operation is a multiple step procedure with the following steps:
1. Create session cookie
2. Login
3. Prepare restore mode
4. Transfer restore file to device
5. Device restart
The restore operation will remove the previous configuration and replace it with a new configuration. The IP address and the chessboard calibration will not be updated by the restore
operation. It is not possible to use the device for other purposes during the restore operation.
The operation may take several minutes to perform and the time is partly depending on the
size of the backup file.
8015726/2013-11
C.2 Create session cookie
A session cookie is used to handle operations requiring login with user name and password.
The session cookie is created before performing the login operation and the cookie must
then be supplied in the login operation and for all following operations.
Operations
CREATE COOKIE
C.3 Login
A login with the user name "Maintenance" is required to change information on the device.
The password is the password stored on the device. Default password is "Inspector".
Operations
CREATE SOCKET
CONNECT TO SOCKET(<IP address>, port = 80)
SEND HTTP POST REQUEST (to="/HandleConfig", data = "sopas_username=Maintenance&sopas_password=<login_password>")
©SICK AG • Advanced Industrial Sensors • www.sick.com • All rights reserved
Subject to change without notice
77
Page 78

Appendix
Restore configuration over Web API
Reference Manual
Inspector PIM
CLOSE SOCKET
URL template (replace items in "<>")
POST /HandleConfig HTTP/1.1\r\nHost: <IP address>\r\nConnection: KeepAlive\r\nCookie: <Session cookie>\r\n\r\nsopas_username=Maintenance&sopas_password=<login_password>
C.4 Prepare restore mode
This operation will terminate normal device operation and set the device to focus on receiving
the backup file contents.
After the completion of this step, the device is in transfer file mode. All other interaction with
the device except the transfer file requests may interfere with the transfer file operation and
should be avoided.
Operations
CREATE SOCKET
CONNECT TO SOCKET(<IP address>, port = 80)
SEND HTTP GET REQUEST (to="/SelectRestore?prepare_on")
CLOSE SOCKET
URL template (replace items in "<>")
GET /SelectRestore?prepare_on HTTP/1.1\r\nHost: <IP address>\r\nConnection: Keep-alive\r\nCookie: <Session cookie>\r\n\r\n
C.5 Transfer restore file to device
During the transfer phase the contents of the backup file is transferred to the device.
Operations
CREATE SOCKET
CONNECT TO SOCKET(<IP address>, port = 80)
SEND HTTP POST REQUEST (to="/RestoreConfig", data=<full path to backup
file>)
CLOSE SOCKET
URL template (replace items in "<>")
POST /RestoreConfig HTTP/1.1\r\nContent-Length: <File size>\r\nHost: <IP
address>\r\nCookie: <Session cookie>\r\nConnection: Keep-Alive\r\nContentType: multipart/form-data; boundary=cd07053eab074616b9c4703b70584d7dwH!aE1l@?dP/K:Pd-cd07053eab074616b9c4703b70584d7d\r\nContent-Disposition: form-data;
name="datafile"; filename="<full path to backup file>"\r\nContent-Type:
text/plain; charset=utf-8\r\n\r\nFormatVersion=RAW01.00 <Data and more
data>
78
C.6 Device restart
When the transfer is completed, the parameters on the device are updated and the configuration is stored permanently on the flash file system. The device is then restarted.
©SICK AG • Advanced Industrial Sensors • www.sick.com • All rights reserved
Subject to change without notice
8015726/2013-11
Page 79

Reference Manual
Inspector PIM
Index
A
Activate and deactivate web interfaces, 21
Assemblies command channel, output, 36
Assemblies result channel, input, 35
Attributes
Ethernet Raw, 23
EtherNet/IP, 28
Result output formatting, 49
B
Backup configuration, 16
Basic principles
Ethernet Raw, 26
EtherNet/IP, 34
Web interface, 15
C
Command channel, 52
Command types, 52
Error codes, 72
EtherNet/IP, 53
Examples, 75
Functions, 54
Version information, 75
Command channel, slim, 36
Command syntax
Ethernet Raw, 26
EtherNet/IP, 34
Web interface, 15
Container specific tags, 40
Control the sensor
Ethernet Raw, 26
EtherNet/IP, 33
Web interface, 15
Coordinates via Ethernet
Attributes, 23
Validate output string, 39
XML based formatting, 39
XML formatting, 39
Current reference object, 16
Custom web pages, 17
Display live image, 19
D
Digital inputs and outputs, 8
E
Error codes, Command channels, 72
Ethernet Raw, 22
ASCII versus binary, 22
Basic principles, 26
Command syntax, 26
Control the sensor via Ethernet Raw, 26
Image trig, 27
Port interval, 22
Reference object, 27
Single port solution, 27
TCP versus UDP, 22
EtherNet/IP, 28
Basic principles, 34
Command syntax, 34
Control the sensor via EtherNet/IP, 33
Image trig, 35
Input assemblies result channel, 35
Output assemblies command channel, 36
Reference object, 34
F
Formatting strings, 23, 28
Ethernet Raw, 23
EtherNet/IP, 28
I
I/O extension box, 8
Configure the IP address, 8
Input and output connections, 10
Physical network connection, 8
Setup the I/O extension box, 9
Troubleshooting, 11
Image trig
Ethernet Raw, 27
EtherNet/IP, 35
P
Port interval
Ethernet Raw, 22
R
Reference object
Ethernet Raw, 27
EtherNet/IP, 34
Restore configuration, 16, 77
Result in PLC, 29, 31, 32
Result output formatting, 39
Container specific tags, 40
General tags, 48
Results via Ethernet Raw, 22
Results via EtherNet/IP, 28
Results via Web API, 13
S
Setup the I/O extension box in SOPAS Single Device, 9
Single port solution
Ethernet Raw, 27
T
Troubleshooting
I/O extension box, 11
8015726/2013-11
©SICK AG • Advanced Industrial Sensors • www.sick.com • All rights reserved
Subject to change without notice
79
Page 80

V
Validate output string, 39
Version information, command channels, 75
W
Web API
Restore configuration, 77
Web interface, 13
Basic principles, 15
Command syntax, 15
Control the sensor via Web API, 15
Custom web pages, 17
Live image, 13
Logged image, 14
Results, 13
X
XML based formatting, 39
XML formatting, 39
Reference Manual
Inspector PIM
80
©SICK AG • Advanced Industrial Sensors • www.sick.com • All rights reserved
Subject to change without notice
8015726/2013-11
Page 81

Page 82

SICK AG | Waldkirch | Germany | www.sick.com
∙ A4 4c int41
8015726/2013-11
Australia
Phone +61 3 9457 0600
1800 334 802 – tollfree
E-Mail sales@sick.com.au
Belgium/Luxembourg
Phone +32 (0)2 466 55 66
E-Mail info@sick.be
Brasil
Phone +55 11 3215-4900
E-Mail sac@sick.com.br
Canada
Phone +1 905 771 14 44
E-Mail information@sick.com
Česká republika
Phone +420 2 57 91 18 50
E-Mail sick@sick.cz
China
Phone +86 4000 121 000
E-Mail info.china@sick.net.cn
Phone +852-2153 6300
E-Mail ghk@sick.com.hk
Danmark
Phone +45 45 82 64 00
E-Mail sick@sick.dk
Deutschland
Phone +49 211 5301-301
E-Mail info@sick.de
España
Phone +34 93 480 31 00
E-Mail info@sick.es
France
Phone +33 1 64 62 35 00
E-Mail info@sick.fr
Great Britain
Phone +44 (0)1727 831121
E-Mail info@sick.co.uk
India
Phone +91–22–4033 8333
E-Mail info@sick-india.com
Israel
Phone +972-4-6881000
E-Mail info@sick-sensors.com
Italia
Phone +39 02 27 43 41
E-Mail info@sick.it
Japan
Phone +81 (0)3 3358 1341
E-Mail support@sick.jp
Magyarország
Phone +36 1 371 2680
E-Mail office@sick.hu
Nederland
Phone +31 (0)30 229 25 44
E-Mail info@sick.nl
Norge
Phone +47 67 81 50 00
E-Mail austefjord@sick.no
Österreich
Phone +43 (0)22 36 62 28 8-0
E-Mail office@sick.at
Polska
Phone +48 22 837 40 50
E-Mail info@sick.pl
România
Phone +40 356 171 120
E-Mail office@sick.ro
Russia
Phone +7-495-775-05-30
E-Mail info@sick.ru
Schweiz
Phone +41 41 619 29 39
E-Mail contact@sick.ch
Singapore
Phone +65 6744 3732
E-Mail sales.gsg@sick.com
Slovenija
Phone +386 (0)1-47 69 990
E-Mail office@sick.si
South Africa
Phone +27 11 472 3733
E-Mail info@sickautomation.co.za
South Korea
Phone +82 2 786 6321/4
E-Mail info@sickkorea.net
Suomi
Phone +358-9-25 15 800
E-Mail sick@sick.fi
Sverige
Phone +46 10 110 10 00
E-Mail info@sick.se
Taiwan
Phone +886 2 2375-6288
E-Mail sales@sick.com.tw
Türkiye
Phone +90 (216) 528 50 00
E-Mail info@sick.com.tr
United Arab Emirates
Phone +971 (0) 4 88 65 878
E-Mail info@sick.ae
USA/México
Phone +1(952) 941-6780
1 (800) 325-7425 – tollfree
E-Mail info@sickusa.com
More representatives and agencies
at www.sick.com
Córdoba
Calle Gabriel Ramos Bejarano
Parc. 119-C, P.I. Las Quemadas
14014 Córdoba
Tel: 957 326 200
info@fluitronic.es
Sevilla
Arquitectura, 1 Torre 6 Pta 4 Mod 1
Avda.
Parque Empresarial "Torneo"
41015 Sevilla
Tel: 954 186 840
Madrid
Avda. Vía Láctea, 4, local 32
San Fernando de Henares
28830 Madrid
Tel: 910 562 969
 Loading...