

Page 1

TELEMATIC DATA COLLECTOR
Gateway systems
OPERATING INSTRUCTIONS
Page 2

2
8021804/2017-11-27|SICK
TRANSLATION O F THE ORIGINAL IN STRUCTIONS | Telem atic Data Collector
Subject to change without notice
Product described
Product name: Telematic Data Collector
Document identification
Title: Telematic Data Collector operating instructions
Status: 2017-11-27
Manufacturer
SICK AG
Erwin-Sick-Str. 1 · 79183 Waldkirch · Germany
Trademarks
IBM is a trademark of the International Business Machine Corporation.
only used here for identification purposes.
Original documents
The German version 8021803 of this document is an original document of
In case of doubt, contact SICK AG or your local dealer.
Legal notes
Subject to change without notice
© SICK AG. All rights reserved
Part number: 8021804
MS-DOS is a trademark of the Microsoft Corporation.
Windows is a trademark of the Microsoft Corporation.
Other product names in this document may also be trademarks and are
SICK AG.
SICK AG does not assume liability for the correctness of a non-authorized
translation.
Page 3

3
8021804/2017-11-27|SICK
Subject to change without notice
TRANSLATION O F THE ORIGINAL IN STRUCTIONS | Telematic Data Collector
Contents
ABOUT THESE OPERATING INSTRUCTIONS 1
1 About these operating instructions ................................................................................ 6
1.1 Described software versions ............................................................................... 6
1.2 Purpose of this document .................................................................................... 6
1.3 Target group ......................................................................................................... 6
1.4 Information depth ................................................................................................ 7
1.5 Abbreviations used............................................................................................... 7
1.6 Symbols used ....................................................................................................... 8
2 Safety ................................................................................................................................. 9
2.1 Qualified personnel .............................................................................................. 9
2.2 Applications of the system ................................................................................... 9
2.3 Intended use ......................................................................................................... 9
2.4 General safety notes and protective measures .............................................. 10
2.4.1 Safety notes and symbols ................................................................. 10
2.4.2 General safety notes .......................................................................... 11
2.4.3 Potential sources of danger .............................................................. 12
2.5 Protecting the environment .............................................................................. 13
3 System description ........................................................................................................ 14
3.1 Scope of delivery ............................................................................................... 14
3.2 System components.......................................................................................... 18
3.2.1 TDC devices – collecting and transmitting sensor data .................. 18
3.2.1.1 The TDC device as a receiver ........................................... 18
3.2.1.2 The TDC device as a sender ............................................. 19
3.2.2 Processing and visualizing sensor data on the SICK online
portal ................................................................................................... 21
3.2.2.1 Components of the SICK online portal ............................. 21
3.2.2.2 Multi-client capability and access rights .......................... 21
3.2.2.3 Visualization and monitoring ............................................ 22
3.3 Interfaces for integration into customer applications ..................................... 23
3.4 Status indicators for the TDC devices .............................................................. 25
3.4.1 TDC-B100/TDC-B200 ........................................................................ 25
3.4.2 TDC-M100 .......................................................................................... 26
4 Mounting ........................................................................................................................ 27
4.1 Inserting the SIM card (not EU countries or for MQTT operation) .................. 27
4.2 Mounting the TDC-B100/200 .......................................................................... 30
4.3 Mounting the TDC-M100 .................................................................................. 30
5 Electrical installation .................................................................................................... 31
5.1 Connecting TDC devices ................................................................................... 31
5.1.1 Connectors on the TDC devices ........................................................ 31
5.1.2 Connecting the TDC device to the voltage supply ............................ 32
5.1.3 Connecting the TDC device to the ignition system ........................... 34
5.1.4 Connecting the TDC device to SICK sensors .................................... 35
5.1.5 Connecting fuel level sensors ........................................................... 38
5.2 Screwing on the GSM antenna ......................................................................... 39
5.3 Connecting the GPS antenna ........................................................................... 39
6 Commissioning .............................................................................................................. 40
6.1 Launching the TDC devices .............................................................................. 40
6.2 Preparing the configuration PC ........................................................................ 40
Page 4

1 ABOUT THESE OPERATING INSTRUCTIONS
4
8021804/2017-11-27|SICK
TRANSLATION O F THE ORIGINAL IN STRUCTIONS | Telem atic Data Collector
Subject to change without notice
6.3 General notes .....................................................................................................40
6.3.1 Establishing a connection with the configuration PC .......................41
6.3.2 Installing TDC Configurator ................................................................42
6.4 Connecting to the TDC device ...........................................................................43
6.4.1 Launching the configuration software ...............................................43
6.4.2 Establishing a connection to the TDC device ....................................44
6.5 Adjusting the standard parameters and configuring the interfaces ...............46
6.5.1 General settings ..................................................................................46
6.5.1.1 General ...............................................................................46
6.5.1.2 GPRS connection data .......................................................48
6.5.1.3 Tracking ..............................................................................51
6.5.2 Configuring the interfaces ..................................................................53
6.5.2.1 What are telemetry elements? ..........................................53
6.5.2.2 Configuring a telemetry element for a digital signal ........55
6.5.2.3 Copying a telemetry element.............................................60
6.5.2.4 Configuring a telemetry element for a motor signal ........61
6.5.2.5 Configuring a telemetry element for a fuel level sensor ..62
6.5.3 Configuring the internal sensors ........................................................63
6.5.4 Transferring the configuration to the TDC device .............................64
6.5.5 Saving the configuration on the PC ...................................................64
6.5.6 Recording ............................................................................................64
6.5.7 Displaying system information ...........................................................65
7 Monitoring .......................................................................................................................66
7.1 Setting up a customer account for the SICK online portal ..............................66
7.1.1 Applying for a customer account .......................................................66
7.1.2 Notification about your customer account ........................................70
7.2 Configuring the TDC Management System.......................................................71
7.2.1 Logging in to the TDC Management System .....................................71
7.2.2 Registering additional TDC devices ...................................................72
7.2.3 Configuring a dashboard ....................................................................73
7.2.3.1 Creating a dashboard ........................................................73
7.2.3.2 Defining the structure for displaying telemetry
elements on the dashboard ..............................................74
7.2.4 Visualizing key figures using widgets on the dashboard ..................76
7.2.4.1 Adding key figures for sensor data ...................................76
7.2.4.2 Adding key figures for alarms ............................................78
7.2.4.3 Adding diagrams ................................................................79
7.2.5 Analyzing sensor data in detail ..........................................................81
7.2.6 Administering the management platform .........................................82
7.3 Working with fleet management .......................................................................83
7.3.1 Position display ...................................................................................83
7.3.2 Displaying the vehicle list with detailed information ........................84
7.3.3 Displaying current vehicle fuel levels ................................................84
7.3.4 Accessing information about a specific vehicle ................................85
7.3.5 Accessing fuel consumption information ..........................................88
7.3.6 Analyzing the kilometers covered ......................................................90
7.4 Transferring data to a customer application using an API interface ..............92
7.4.1 Input parameter ..................................................................................92
7.4.2 Example for API call ............................................................................93
7.5 Accessing data from the TDC device via the MQTT interface ..........................94
7.5.1 Description of the MQTT interface structure .....................................94
7.5.2 Description of the MQTT protocol ......................................................95
Page 5

ABOUT THESE OPERATING INSTRUCTIONS 1
5
8021804/2017-11-27|SICK
Subject to change without notice
TRANSLATION O F THE ORIGINAL IN STRUCTIONS | Telematic Data Collector
8 Maintenance .................................................................................................................. 97
8.1 Maintenance during operation ......................................................................... 97
8.1.1 Visual inspection ................................................................................ 97
8.1.2 Cleaning .............................................................................................. 98
8.2 Replacing components ................................................................................... 100
8.2.1 Basic procedure ............................................................................... 100
8.2.2 Replacing the GPS antenna ............................................................ 100
8.2.3 Replacing the TDC device overcurrent protection device .............. 101
8.2.4 Replacing the TDC device ................................................................ 102
9 Annex ............................................................................................................................ 103
9.1 Technical data ................................................................................................. 103
9.1.1 TDC-B100 data sheet ...................................................................... 103
9.1.2 TDC-B200 data sheet ...................................................................... 105
9.1.3 TDC-M100 data sheet ..................................................................... 108
9.2 Dimensional drawings ..................................................................................... 110
9.2.1 TDC-B100 dimensional drawing...................................................... 110
9.2.2 TDC-B200 dimensional drawing...................................................... 110
9.2.3 TDC-M100 dimensional drawing ..................................................... 110
10 Figures and tables ....................................................................................................... 111
10.1 List of tables .................................................................................................... 111
10.2 List of figures ................................................................................................... 112
Page 6
1 ABOUT THESE OPERATING INSTRUCTIONS
6
8021804/2017-11-27|SICK
TRANSLATION O F THE ORIGINAL IN STRUCTIONS | Telem atic Data Collector
Subject to change without notice
Software
Function
Status
TDC Configurator
Configuring the TDC devices
≥ V 1.0-0-0
Target group
Tasks
Entity operating the customer system
System user
Operating the system:
The system user reports faults to the system manager.
System manager
Mounting, electrical installation, maintenance, and replacement
The system manager submits support requests to SICK.
SICK
SICK service technician
Commissioning, configuration, and support.
1 About these operating instructions
Please read this chapter carefully before you begin working with this documentation and
the Telematic Data Collector (TDC for short) gateway system.
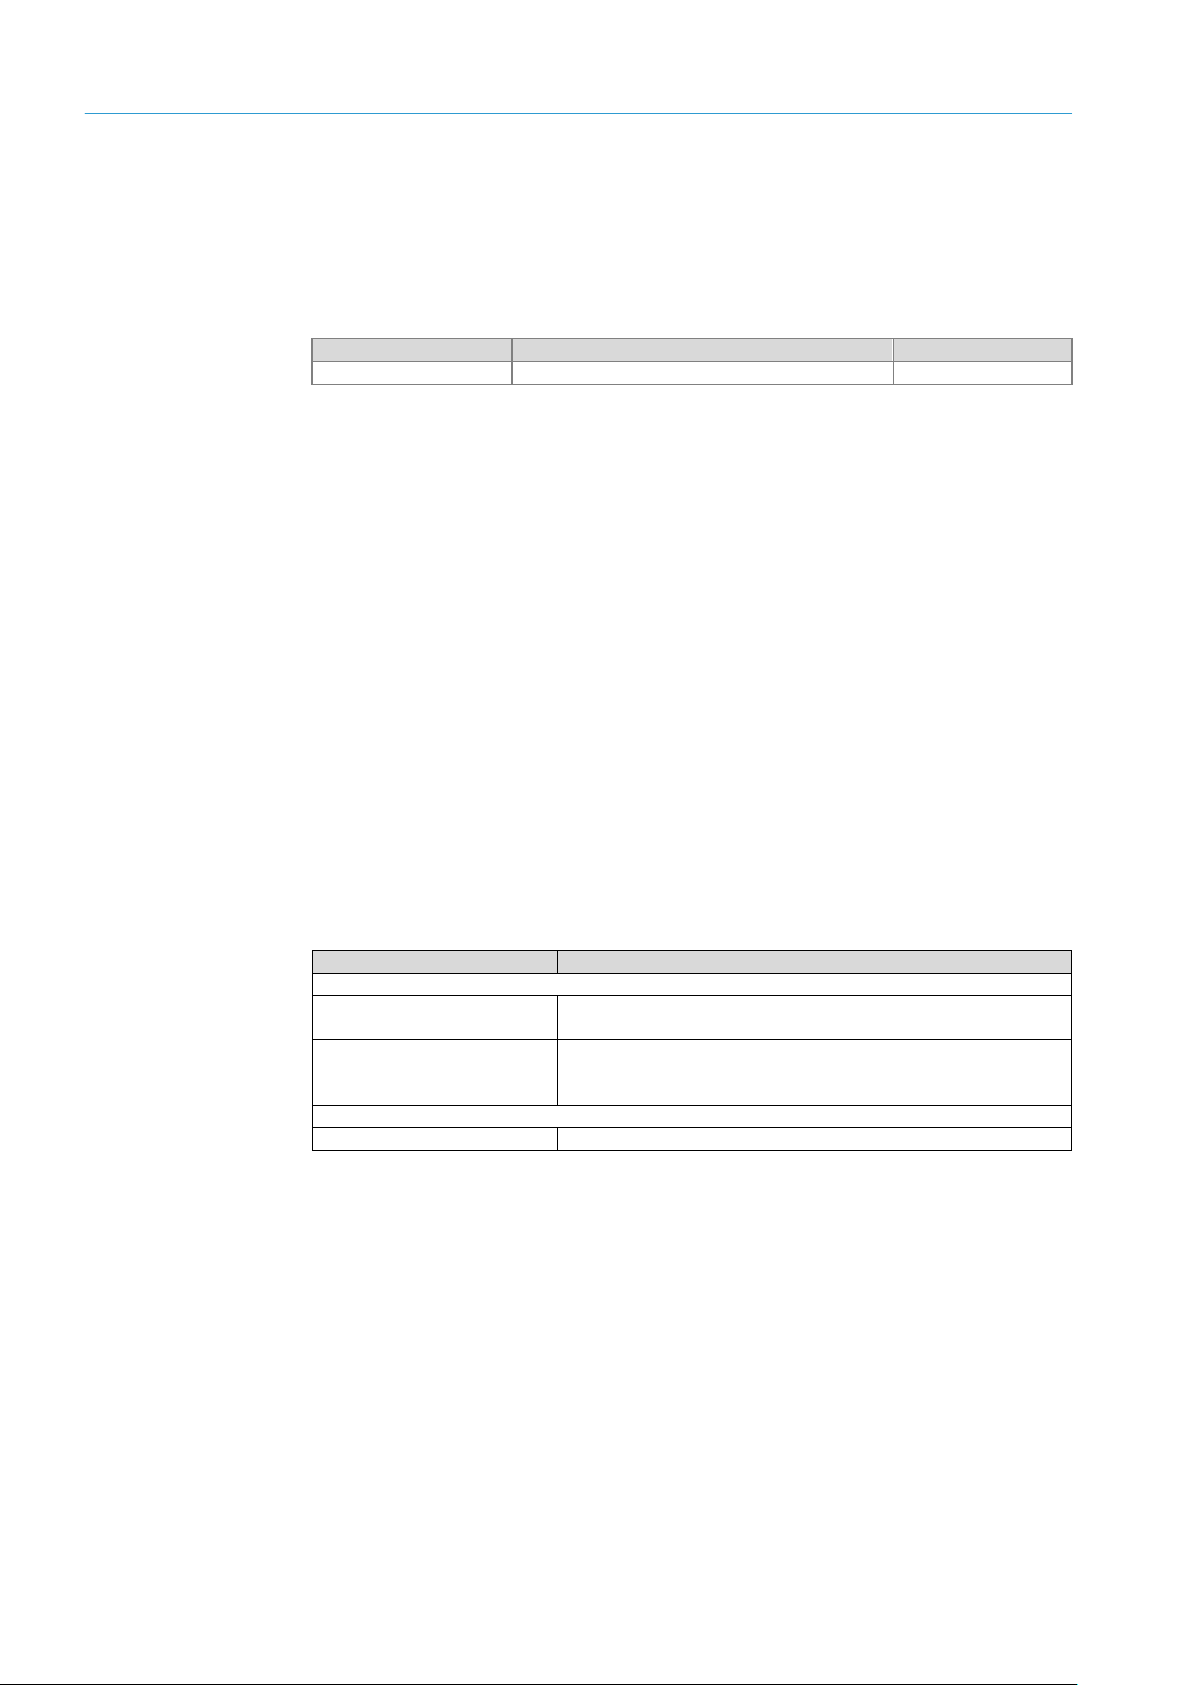
1.1 Described software versions
Tab. 1: Software versions
1.2 Purpose of this document
These operating instructions are designed to give technical personnel instructions on
the safe mounting, configuration, electrical installation, commissioning, operation, and
maintenance of the gateway system as well as on the connection and configuration of
the sensors.
These operating instructions do not provide information on operating vehicles or
machines into which the individual devices of the gateway system have been or are going
to be integrated. Additional information on this can be found in the customer
documentation.
1.3 Target group
These operating instructions are intended for people integrating the devices of the
gateway system into a vehicle or machine and performing initial commissioning,
operation, and maintenance.
They are also intended for the planners and integrators of the customer system, as well
as the operating entity with responsibility for it.
Tab. 2: Target group
of system components:
Page 7

7
8021804/2017-11-27|SICK
Subject to change without notice
TRANSLATION O F THE ORIGINAL IN STRUCTIONS | Telematic Data Collector
1.4 Information depth
ABOUT THESE OPERATING INSTRUCTIONS 1
Note
These operating instructions contain information about the following topics related to the
profiling system:
• System description
• Mounting
• Electrical installation
• Commissioning
• Operation
• Maintenance and care
• Fault diagnosis and troubleshooting
• Technical data and dimensional drawings
When planning and using the gateway system, technical skills are also required that are
not covered by this document.
The official and legal regulations for operating the system must always be complied with.
Further information about the device components used in the gateway system can be
found in the respective operating instructions.
1.5 Abbreviations used
API
APN
CAN bus
GSM
GPRS
GPS
MQTT
SIM
TDC
Application programming interface
Access point name = access point of the network operator in the GPRS data network
Controller area network = serial bus system
Global system for mobile communications = technical wireless standard for digital
wireless telephony
General packet radio service = the name given to the packet-based service for
transmitting data within GSM networks
Global positioning system = global satellite navigation system for position determination
Message queue telemetry transport = open messaging protocol for transmitting telemetry
data between devices in the form of messages
Subscriber identity module = chip card for cell phones
Telematic Data Collector = system used to collect and transmit telemetry data
Page 8

1 ABOUT THESE OPERATING INSTRUCTIONS
8
8021804/2017-11-27|SICK
TRANSLATION O F THE ORIGINAL IN STRUCTIONS | Telem atic Data Collector
Subject to change without notice
1.6 Symbols used
Recommendation
Note
1. / 2. ...
Step by step
Action
Recommendations are designed to assist you in the decision-making process with respect
to the use of a certain function or technical measure.
Notes provide information about the features of a device, application tips, or other useful
information.
Instructions that must be carried out in the described order are referred to as step-by-step
instructions and are indicated by numbered lists. Carefully read and follow the
instructions for taking action.
Instructions for taking action are indicated by an arrow. Carefully read and follow the
instructions for taking action.
Page 9

9
8021804/2017-11-27|SICK
Subject to change without notice
TRANSLATION O F THE ORIGINAL IN STRUCTIONS | Telematic Data Collector
2 Safety
This chapter concerns your own safety and the safety of the system operator.
Please read this chapter carefully before you begin working with the gateway system.
▸
2.1 Qualified personnel
The gateway system must only be commissioned and maintained by properly qualified
personnel.
A qualified person
• has sufficient skills in the field of the respective equipment based on their technical
training and experience and
• has been instructed by the manufacturer in system operation and all applicable safety
guidelines and
• is familiar with all relevant country-specific occupational safety regulations, work safety
regulations, guidelines, and generally accepted technical rules and standards
(e.g., DIN standards, VDE regulations, country-specific rules) to such an extent that
they are able to evaluate the safe condition of the power-driven machinery, and
• has access to and has read the operating instructions.
2.2 Applications of the system
SAFETY 2
The Telematic Data Collector (TDC) gateway system is a system used to receive and
transmit telemetry data on a cloud server. It is, for example, ideal for sensor-controlled
monitoring tasks, vehicle tracking, working hours management, and access control as
well as for remote measurement.
The gateway system uses one or more TDC devices to collect data. The TDC devices
feature all of the standard interfaces that are required to integrate sensors and other
devices.
The sensor data received is transmitted to the cloud via the mobile network through either
the SICK online portal or a customer server.
The SICK online portal is a platform that can be used to visualize sensor data on a webbased user interface, allowing for convenient monitoring.
The TDC gateway system also supports the integration of recorded sensor data into all
leading business applications. Integration is an option when using either the SICK online
portal or a cloud-based customer server via an API included as part of the scope of
delivery or via the MQTT protocol in a defined topic structure.
2.3 Intended use
The gateway system may only be used by qualified personnel in the environment in which
it was mounted and initially commissioned by qualified personnel in accordance with
these operating instructions.
Note
If used in any other way or if alterations are made to the gateway system – including
in the context of mounting and installation – this will render void any warranty claims
directed to SICK AG.
Page 10
2 SAFETY
10
8021804/2017-11-27|SICK
TRANSLATION O F THE ORIGINAL IN STRUCTIONS | Telem atic Data Collector
Subject to change without notice
HAZARD
WARNING
WARNING
NOTE
2.4 General safety notes and protective measures
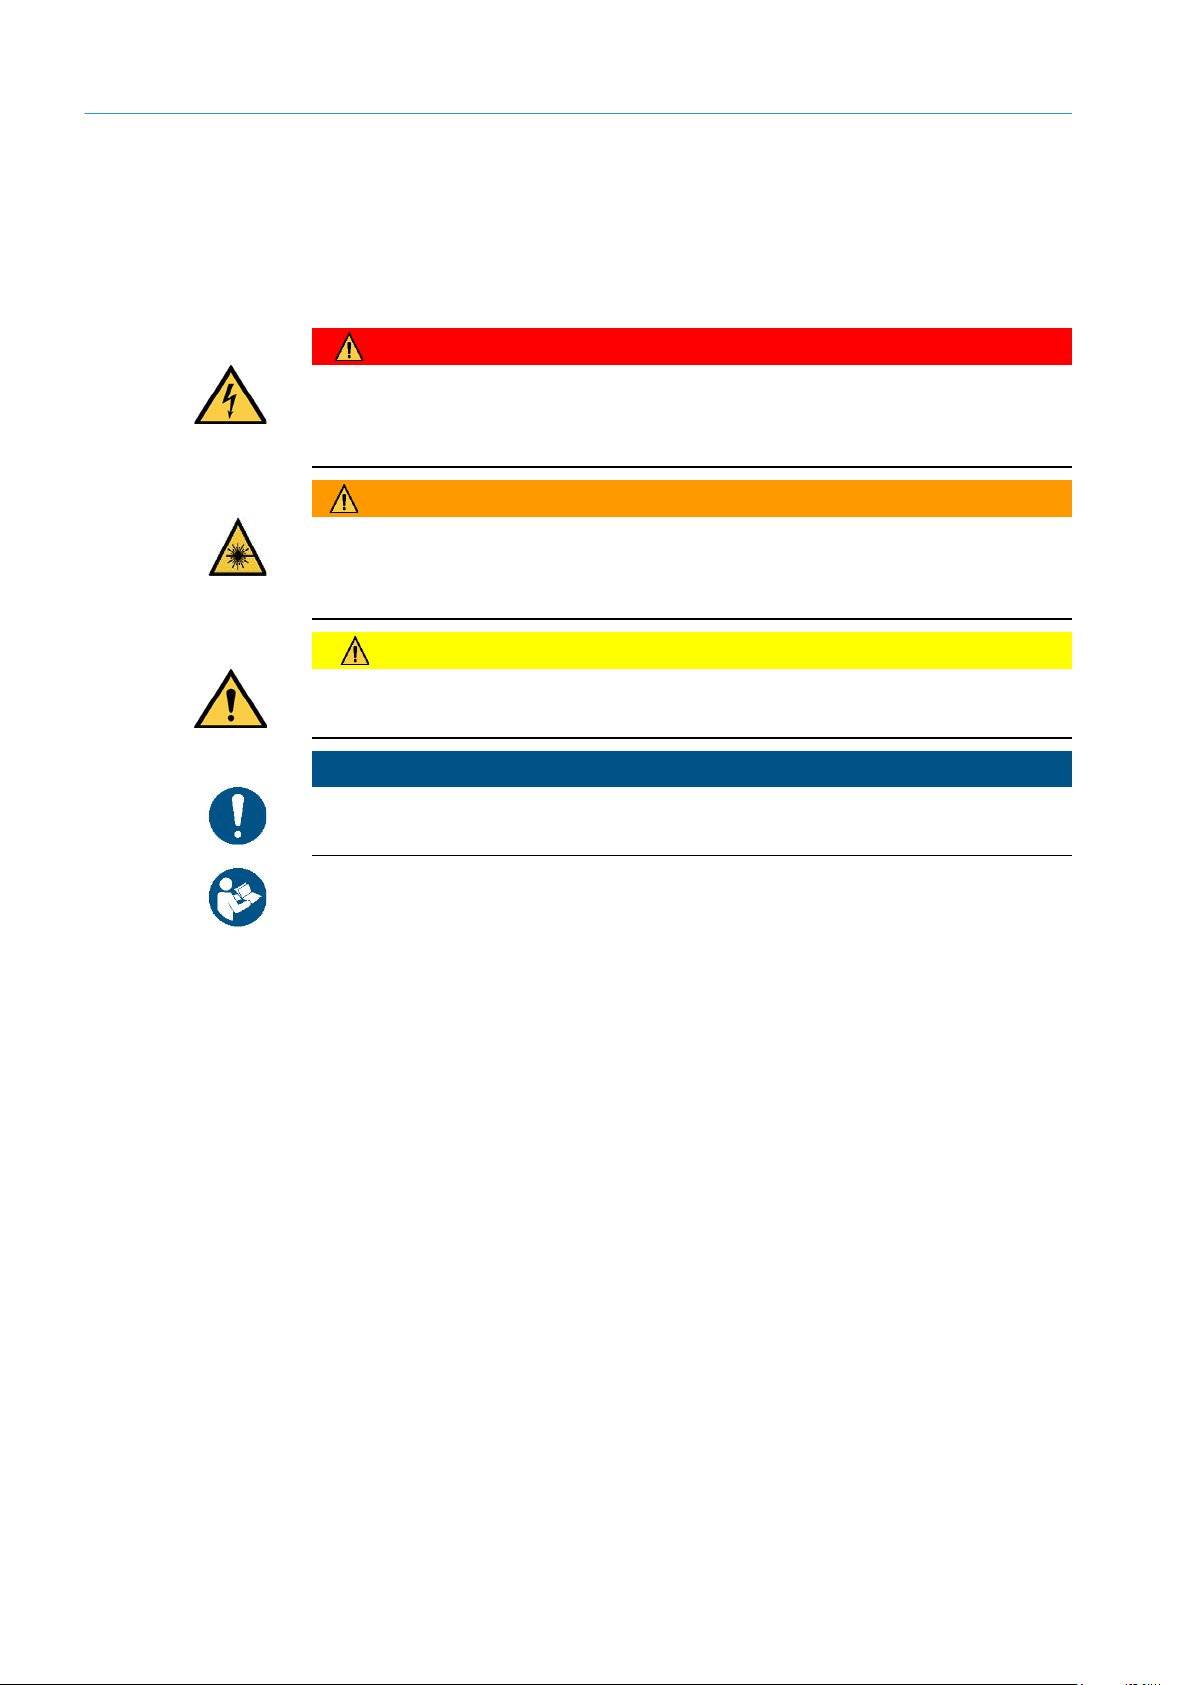
2.4.1 Safety notes and symbols
The following safety and hazard notes concern your own safety, the safety of third parties,
and the safety of the devices. You must therefore observe these symbols at all times.
Denotes an immediate hazard that may result in severe to fatal injuries.
The symbol shown on the left-hand side of the note refers to the type of hazard in
question (the example here shows a risk of injury resulting from electrical current).
Denotes a potentially dangerous situation that may result in severe to fatal injuries.
The symbol shown on the left-hand side of the note refers to the type of hazard in
question (the example here shows a risk of damage to the eye by laser beams).
Denotes a potentially dangerous situation that may result in minor personal injury or
possible material damage.
Denotes a potential risk of damage or functional impairment of the device or the devices
connected to it.
This symbol refers to supplementary technical documentation.
Page 11

11
8021804/2017-11-27|SICK
Subject to change without notice
TRANSLATION O F THE ORIGINAL IN STRUCTIONS | Telematic Data Collector
2.4.2 General safety notes
WARNING
The gateway system has been designed such that it can be operated safely. Protective
devices reduce potential risks to the maximum possible extent. However, a certain level
of risk will always remain.
Awareness of potential sources of danger in the system will help you to work in a safer
manner and thus prevent accidents.
To avoid risks, please also observe the special warnings in each of the individual
chapters.
Safety notes
Observe the following to ensure the safe use of the gateway system as intended.
• The notes in these operating instructions (e.g., regarding use, mounting, or installation)
must be observed.
• All official and statutory regulations governing the operation of the gateway system
must be complied with.
• National and international legal specifications apply to the installation and use of the
system, to its commissioning, and to recurring technical inspections, in particular:
- Work safety regulations and safety rules
- Any other relevant safety provisions
• All checks must be carried out by qualified personnel or specially authorized and
commissioned personnel, and must be recorded and documented to ensure that they
can be reconstructed and retraced at any time.
• These operating instructions must be made available to the operator of the system
in which the components of the gateway system are used.
• The operator of the gateway system must be instructed by qualified personnel and
must read the operating instructions.
SAFETY 2
Page 12
2 SAFETY
12
8021804/2017-11-27|SICK
TRANSLATION O F THE ORIGINAL IN STRUCTIONS | Telem atic Data Collector
Subject to change without notice
HAZARD
WARNING
NOTE
WARNING
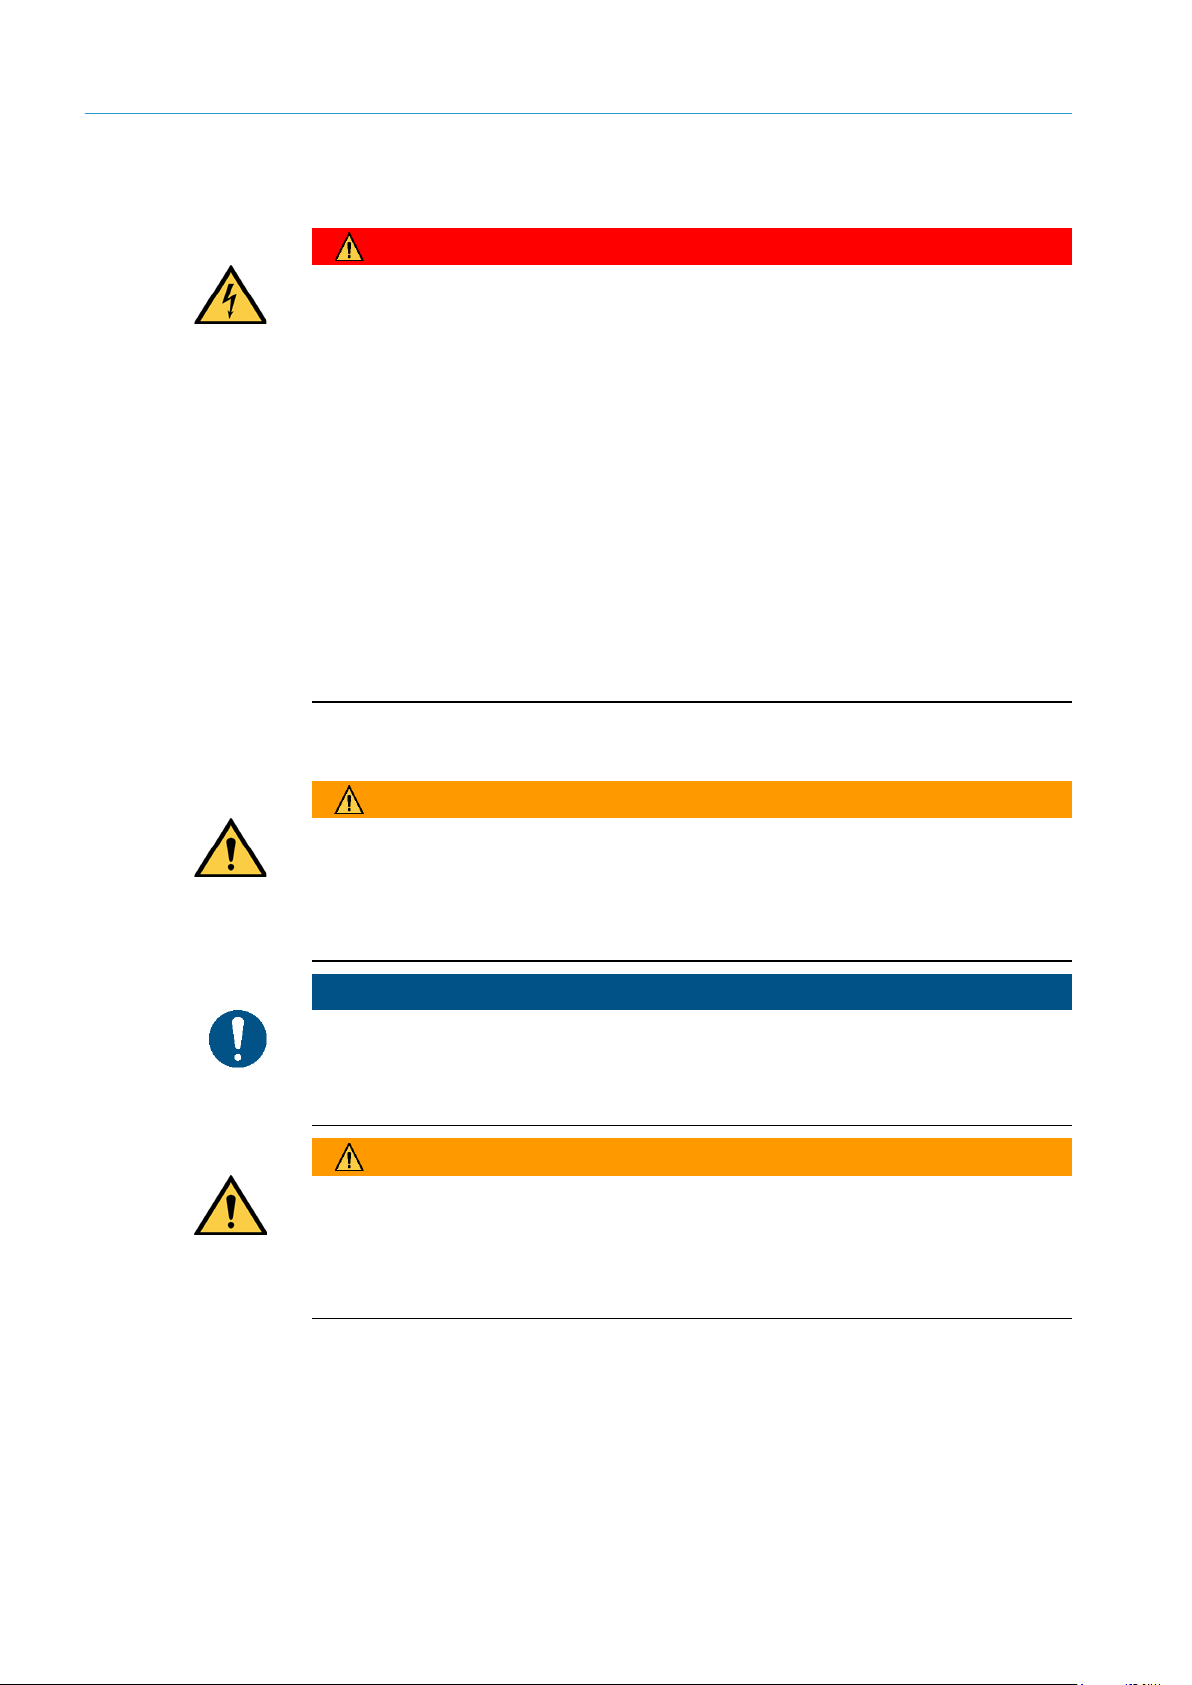
2.4.3 Potential sources of danger
Electrical current
Risk of injury and damage caused by electrical current
Improper handling of live devices may lead to severe personal injury or death by electric
shock.
Electrical installation and maintenance work must only be carried out by personnel
▸
authorized to do so.
The power supply must be disconnected when attaching and detaching electrical
▸
connections.
Select and implement wire cross-sections and their correct fuse protection in accordance
▸
with the applicable standards.
Do not touch any live parts.
▸
In the event of danger, immediately disconnect the device from the grid.
▸
Always use original fuses with the specified current rating.
▸
Report any damaged cables to the maintenance team without delay.
▸
Observe the up-to-date safety regulations when working on electrical systems.
▸
Commissioning/operation/maintenance
Risk resulting from incorrect commissioning and configuration
Do not commission until a thorough check has been performed by qualified personnel.
Before carrying out initial commissioning of the devices of the gateway system, you must
have the system checked and approved by qualified personnel.
Claims under the warranty rendered void
The housings of the devices must not be opened. The devices are sealed.
If the device is opened, any warranty claims against SICK AG will be void.
Risk resulting from faults
Cease operation if the cause of the malfunction has not been clearly identified.
Immediately deactivate the TDC device if you cannot clearly identify the fault and if you
▸
cannot safely remedy the problem.
Page 13

13
8021804/2017-11-27|SICK
Subject to change without notice
TRANSLATION O F THE ORIGINAL IN STRUCTIONS | Telematic Data Collector
2.5 Protecting the environment
The components of the gateway system have been designed to minimize their impact on
the environment. They consume only little energy.
Always act in an environmentally responsible manner at work. For this reason, please note
the following information regarding disposal.
Disposal after final decommissioning
Always dispose of unusable or irreparable devices in accordance with the applicable
▸
waste disposal regulations specific to your country.
Remove the plastic parts and recycle the aluminum housing of the TDC device.
▸
Dispose of all electronic assemblies as hazardous waste. The electronic assemblies are
▸
easy to dismantle.
Note
SICK AG does not take back devices that are unusable or irreparable.
SAFETY 2
Page 14
3 SYSTEM DESCRIPTION
14
8021804/2017-11-27|SICK
TRANSLATION O F THE ORIGINAL IN STRUCTIONS | Telem atic Data Collector
Subject to change without notice
3 System description
This chapter describes the layout and operating principle of the gateway system, in
particular the interaction of the different components.
Note
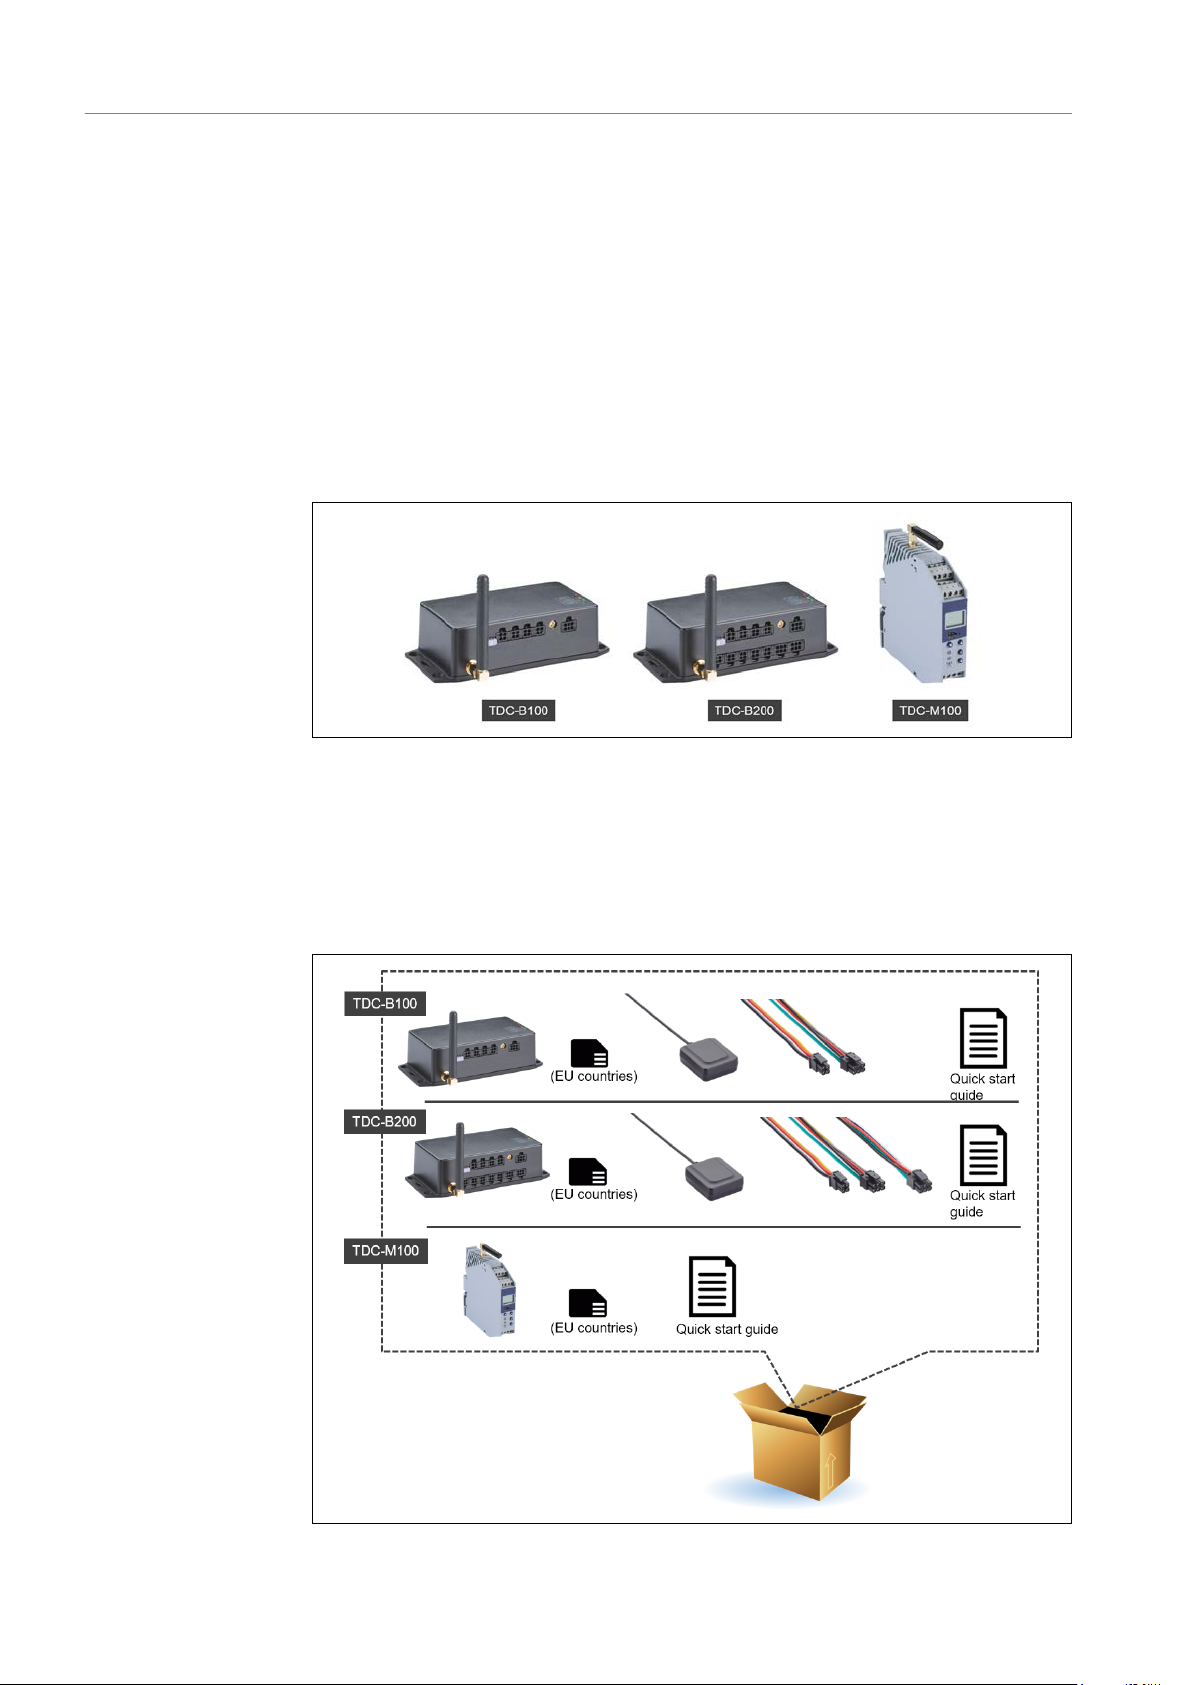
3.1 Scope of delivery
Always read this chapter before you mount, install, and commission the components of
the gateway system.
Depending on the installation conditions and number of interfaces required, the gateway
system uses the TDC-B100, TDC-B200 or TDC-M100 device variants. The different TDC
devices are suitable for different installation conditions and numbers of interfaces.
Fig. 1: TDC gateway system device variants
All TDC devices come with a GSM antenna, installed overcurrent protection device, and
SIM card inserted for operation in EU countries.
The scope of delivery for TDC devices in the B series also includes a GPS antenna, a
voltage supply cable, and cables for connecting sensors. Additional cables can be ordered
as accessories.
Fig. 2: TDC gateway system scope of delivery
Page 15

SYSTEM DESCRIPTION 3
15
8021804/2017-11-27|SICK
Subject to change without notice
TRANSLATION O F THE ORIGINAL IN STRUCTIONS | Telematic Data Collector
NOTE
Number
Part No.
Description
1 TDC gateway system consisting of:
n
6064656
TDC-B100 with GSM antenna and installed overcurrent protection
TDC Configurator configuration software
n
6067023
GPS antenna
n
6067024
3-A back-up overcurrent protection device
n
6067018
RS485 connecting cable (4-pin)
and/or
n
6064657
TDC-B200 with GSM antenna and installed overcurrent protection
configuration software
n
6067023
GPS antenna
n
6067024
3-A back-up overcurrent protection device
n
6067019
INPUT cable (6-pin)
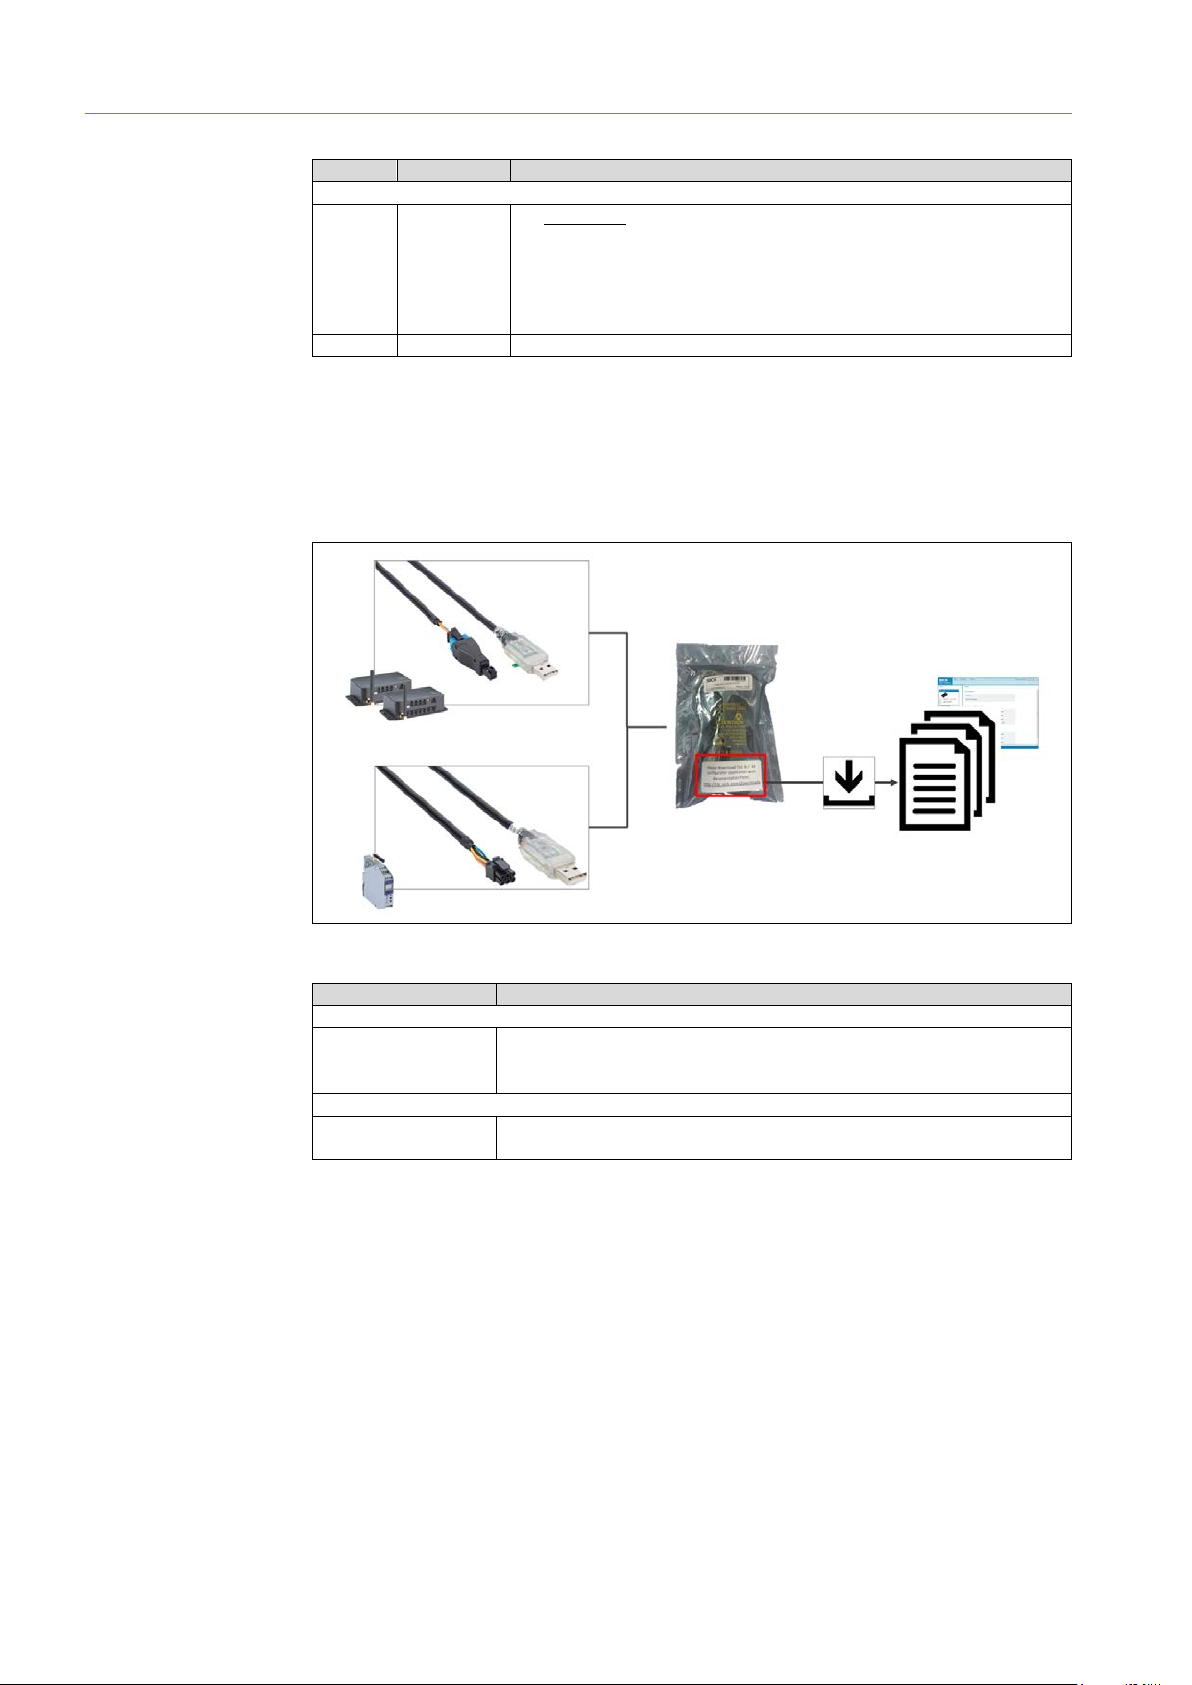
A quick start guide is also included as part of the scope of delivery to provide assistance
at the initial commissioning stage. The quick start guide also includes a download link
for the operating instructions, system documentation, interface specifications, and TDC
Configurator configuration software.
Fig. 3: Quick start guide including download link for the documentation and configuration
Basic inspection for completeness and damage
It is recommended that you carefully check for and report transport damage of any kind
as soon as possible after receiving the system.
Also verify that the delivery includes all components listed on the delivery note.
▸
▸
software
Report any incomplete or damaged deliveries to Customer Service.
Always document the damage by taking photographs.
device
SIM card inserted for operation in EU countries
Quick start guide including a download link for the operating
instructions, system documentation, interface specifications, and
1 cable set consisting of:
Cable for the voltage supply and connection of a peripheral device
to two digital inputs (6-pin)
device
SIM card inserted for operation in EU countries
Download link for the operating instructions, system
documentation, interface specifications, and TDC Configurator
1 cable set consisting of:
Cable for the voltage supply and connection of a peripheral device
to two digital inputs (6-pin)
RS485 connecting cable (4-pin)
Page 16
3 SYSTEM DESCRIPTION
16
8021804/2017-11-27|SICK
TRANSLATION O F THE ORIGINAL IN STRUCTIONS | Telem atic Data Collector
Subject to change without notice
Number
Part No.
Description
and/or
n
6065413
TDC-M100 with GSM antenna and installed overcurrent protection
TDC Configurator configuration software
n
6067024
3-A back-up overcurrent protection device
Part No.
Description
TDC-B100 / TDC-B200
6066259
Cable for connecting the TDC-B100 to a configuration PC, Micro-Fit USB
Drivers are included in the configuration software
TDC-M100
6066258
Cable for connecting the TDC-M100 to a configuration PC, Micro-Fit USB
Drivers are included in the configuration software
Tab. 3: TDC gateway system scope of delivery
Configuration cables (optional)
There is an optional configuration cable available for all device types that can be used to
connect the TDC device to a configuration PC. The label on the packaging also includes
the link with the access data for the documentation and configuration software.
device
SIM card inserted for operation in EU countries
Quick start guide including a download link for the operating
instructions, system documentation, interface specifications, and
Fig. 4: Configuration cables (optional)
(6-pin)
Tab. 4: Configuration cables (optional) – part numbers
Page 17
SYSTEM DESCRIPTION 3
17
8021804/2017-11-27|SICK
Subject to change without notice
TRANSLATION O F THE ORIGINAL IN STRUCTIONS | Telematic Data Collector
Part No.
Description
TDC-B100
6067018
1 cable set consisting of:
(included in delivery)
6067022
1 cable set with 3 cables (UART/USB, CAN1, DIAG)
TDC-B200
1 cable set consisting of:
(included in delivery)
6066260
1 cable set with 9 cables (UART, CAN1, DIAG, RS-232, OUTPUTS,
1Wire, USB, CAN2, FULL RS-232)
Part No.
Description
6066264
LLS30160-700mm-RS232/485 fuel level sensor with mounting kits,
connecting cable, and quick start guide.
Part No.
Description
5337537
SIM card (for operation in EU countries)
6067024
MINI ATO overcurrent protection device, 32 V, 3 A, 0297003. L
5337536
EAD PST2100SMA RA GSM antenna, penta band
6067023
GPS antenna (only TDC-B100/TDC-B200)
Additional cables (optional)
Preconfigured cables can be obtained for connecting sensors and devices to TDC devices
in the B series.
TDC PWR+2IN – 90 cm, Micro-Fit 4-pin, open ends
TDC RS485 – 30 cm, Micro-Fit 4-pin, open ends
TDC PWR+2IN – 90 cm, Micro-Fit 4-pin, open ends
TDC RS485 – 30 cm, Micro-Fit 4-pin, open ends
TDC INPUTS – 30 cm, Micro-Fit 6-pin, open ends
Tab. 5: Additional connecting cables (optional) – part numbers
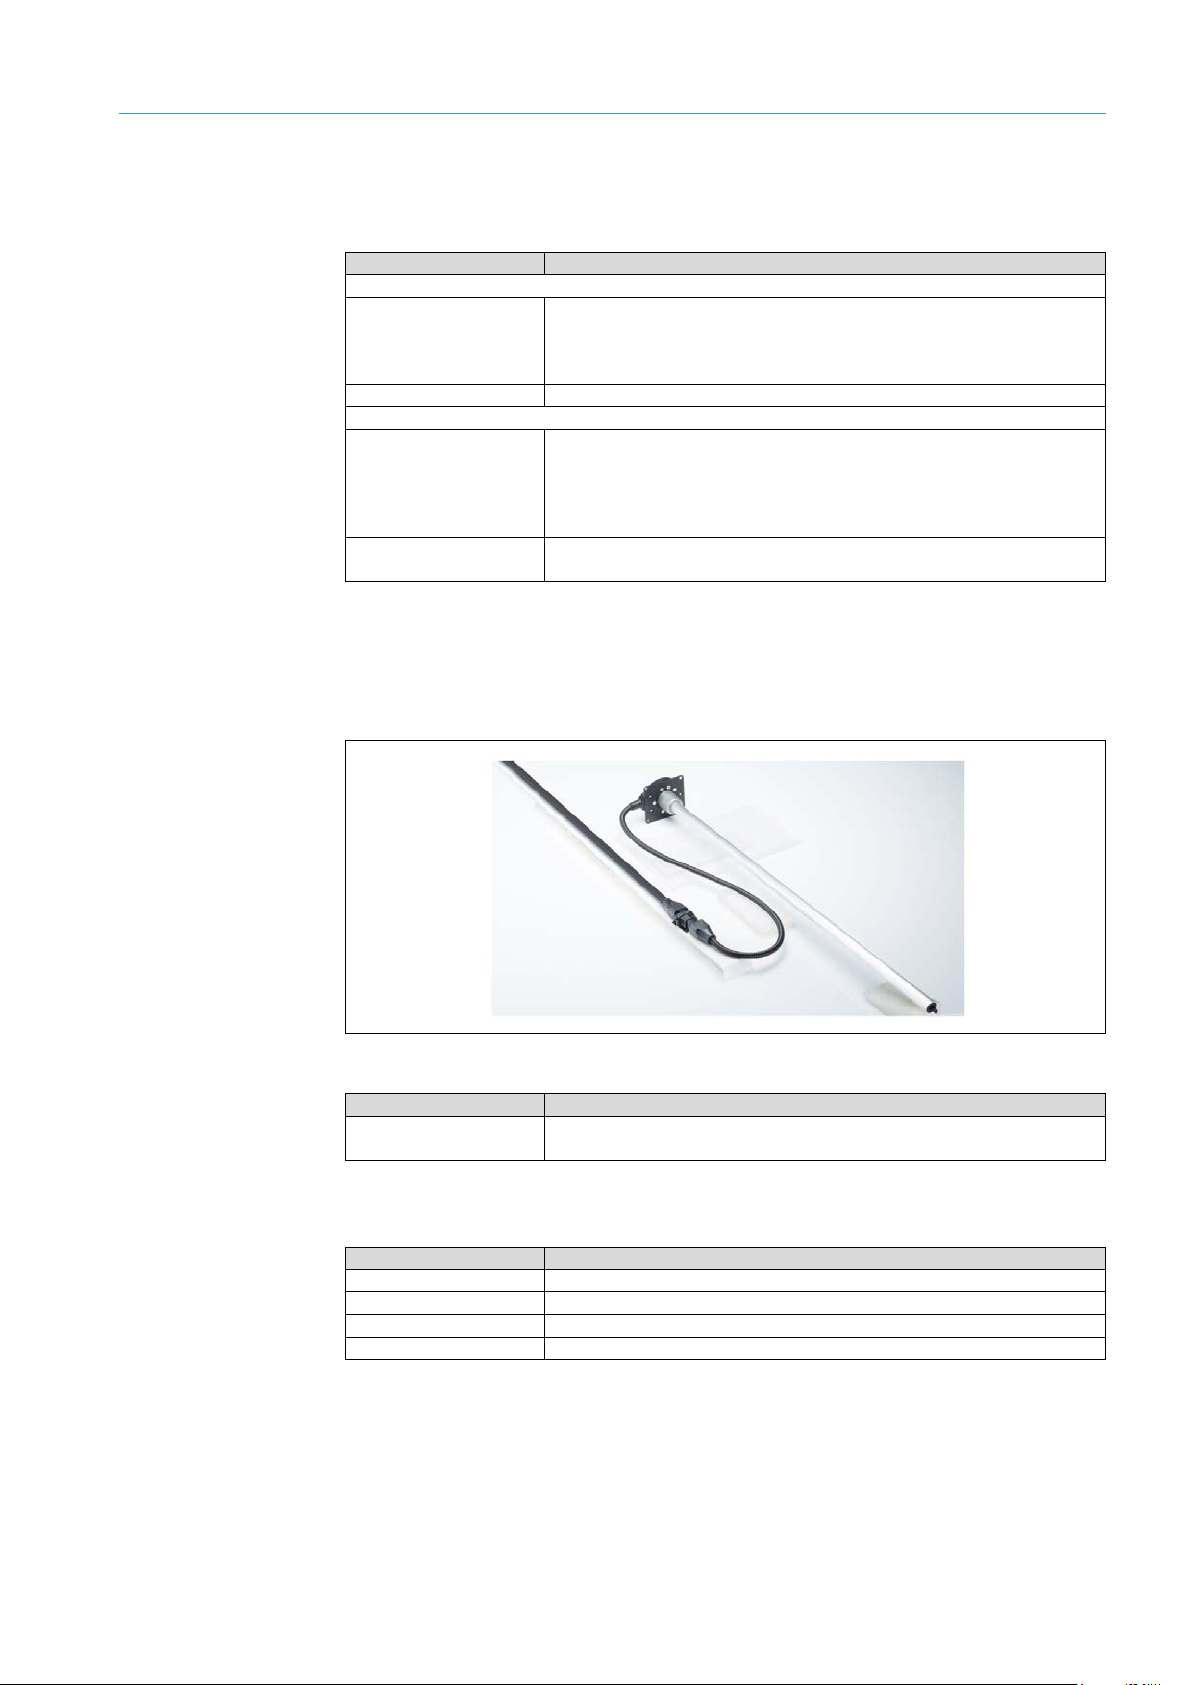
Fuel level sensor for TDC-B200 (optional)
A fuel level sensor manufactured by Omnicomm is available as an optional accessory for
the TDC-B200 device.
Fig. 5: Fuel level sensor (optional)
Tab. 6: Fuel level sensor (optional) – part number
Spare parts
Tab. 7: Spare parts – part numbers
Page 18
3 SYSTEM DESCRIPTION
18
8021804/2017-11-27|SICK
TRANSLATION O F THE ORIGINAL IN STRUCTIONS | Telem atic Data Collector
Subject to change without notice
3.2 System components
3.2.1 TDC devices – collecting and transmitting sensor data
The gateway system uses TDC devices to receive and transmit sensor data.
• As a receiver, the TDC device collects data from connected sensors and devices.
• As a sender, the TDC device transmits the sensor data received to the cloud via the
mobile network.
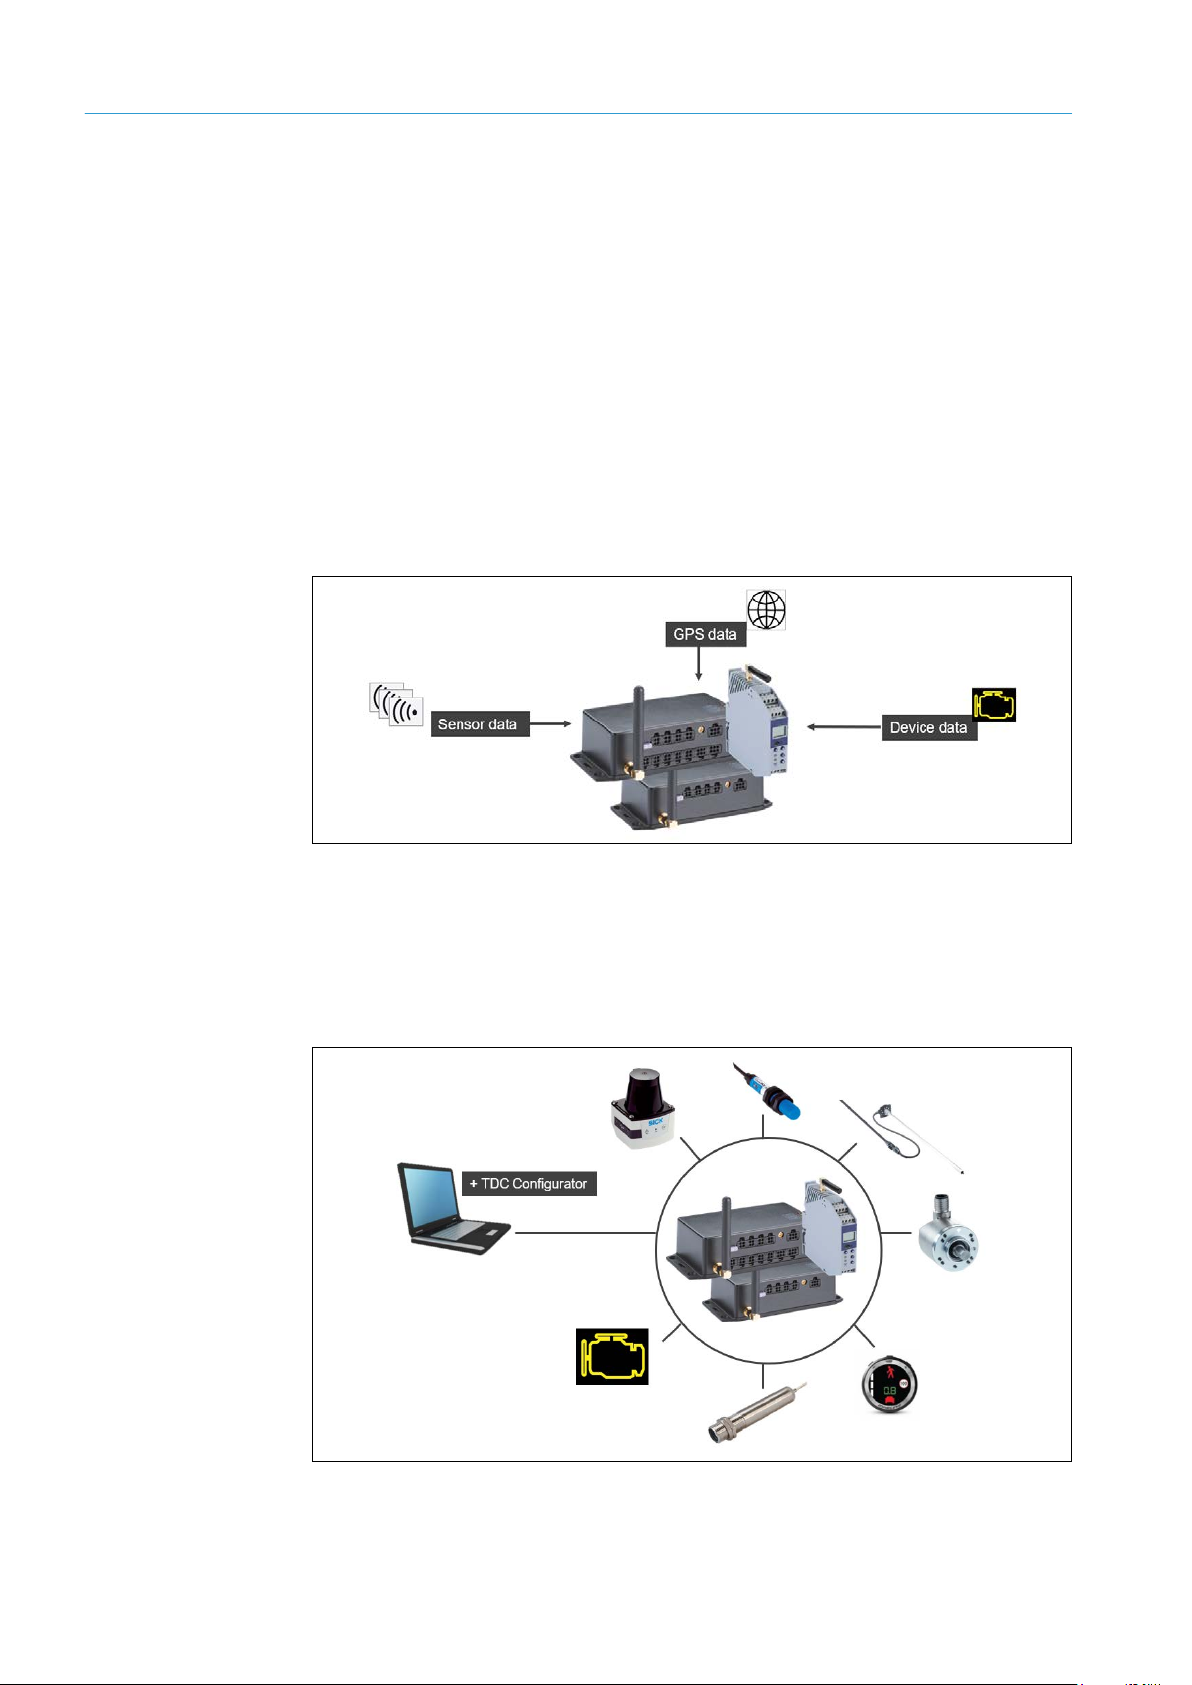
3.2.1.1 The TDC device as a receiver
A TDC device will generally receive sensor data from a vehicle or a machine. For this to
happen, the sensors are connected to the TDC device via appropriate interfaces.
The TDC device also has built-in sensors that are used to detect the movement of the
vehicle. This movement data can be output along with GPS data (this only applies to TDC
devices of the B series). A GPS antenna is included in the scope of delivery for these
devices.
Fig. 6: The TDC device as a sensor data receiver
Which sensors and devices can be integrated?
The TDC device features all of the standard interfaces that are required to integrate
sensors and other devices. Digital, analog, and CAN bus-based signals can be processed.
The interfaces are configured via the TDC Configurator configuration software included in
the scope of delivery.
Fig. 7: TDC device interfaces for the integration of sensors
Page 19

19
8021804/2017-11-27|SICK
Subject to change without notice
TRANSLATION O F THE ORIGINAL IN STRUCTIONS | Telematic Data Collector
• SICK sensors of the TiM series detect the presence of an object within a specified area
(detection). They are ideally suited for monitoring the area around a vehicle, for
instance. If an object is detected in the monitored area, the result is output via the
digital output.
• Capacitive level sensors (such as those from the company Omnicomm) are used for
the level measurement of fuels and oils. When using a capacitive measuring method,
an insulated measurement electrode forms an electric capacitor with the medium
surrounding it. As the level and in turn the capacitance decreases, the latter is analyzed
by electronics and communicated by an electrical signal.
• Capacitive proximity sensors, such as SICK sensors of the CM series, can detect all
kinds of materials beyond a surface. This allows a minimum level to be detected, for
example.
• A TDC device can also process signals from other devices or motors. Vehicle activities
can be traced upon connection to the ignition system.
3.2.1.2 The TDC device as a sender
When using the SICK online platform, the TDC device transmits the sensor data received
to the SICK cloud server in real time. This happens automatically via the mobile network
using the SIM card inserted into the TDC device.
If a cloud-based customer server is used instead of the SICK online portal, it is not
possible to transmit the sensor data directly. However, there is the option to access the
data on the customer server using the MQTT interface of the device in question.
The TDC device alarm management system can be configured and used to trigger a realtime alarm in the form of SMS messages via input signals.
SYSTEM DESCRIPTION 3
Fig. 8: The TDC device as a sensor data sender
Page 20
3 SYSTEM DESCRIPTION
20
8021804/2017-11-27|SICK
TRANSLATION O F THE ORIGINAL IN STRUCTIONS | Telem atic Data Collector
Subject to change without notice
Permanent data transmission in online mode
The TDC device is connected to a voltage supply and permanently supplied with voltage.
It is also always connected to the mobile network via the SIM card. The GPRS access data
for the SICK online portal is shared with the device through the TDC Configurator
configuration software.
This means that the TDC device is always online, regardless of whether the vehicle or
machine into which the TDC is installed has been started up or not. Sensor data is
therefore always transmitted in real time – even when the motor is not running. Given an
appropriate connection to the TDC device, starting up a motor or machine would therefore
constitute a signal in itself, which could then be transmitted and analyzed.
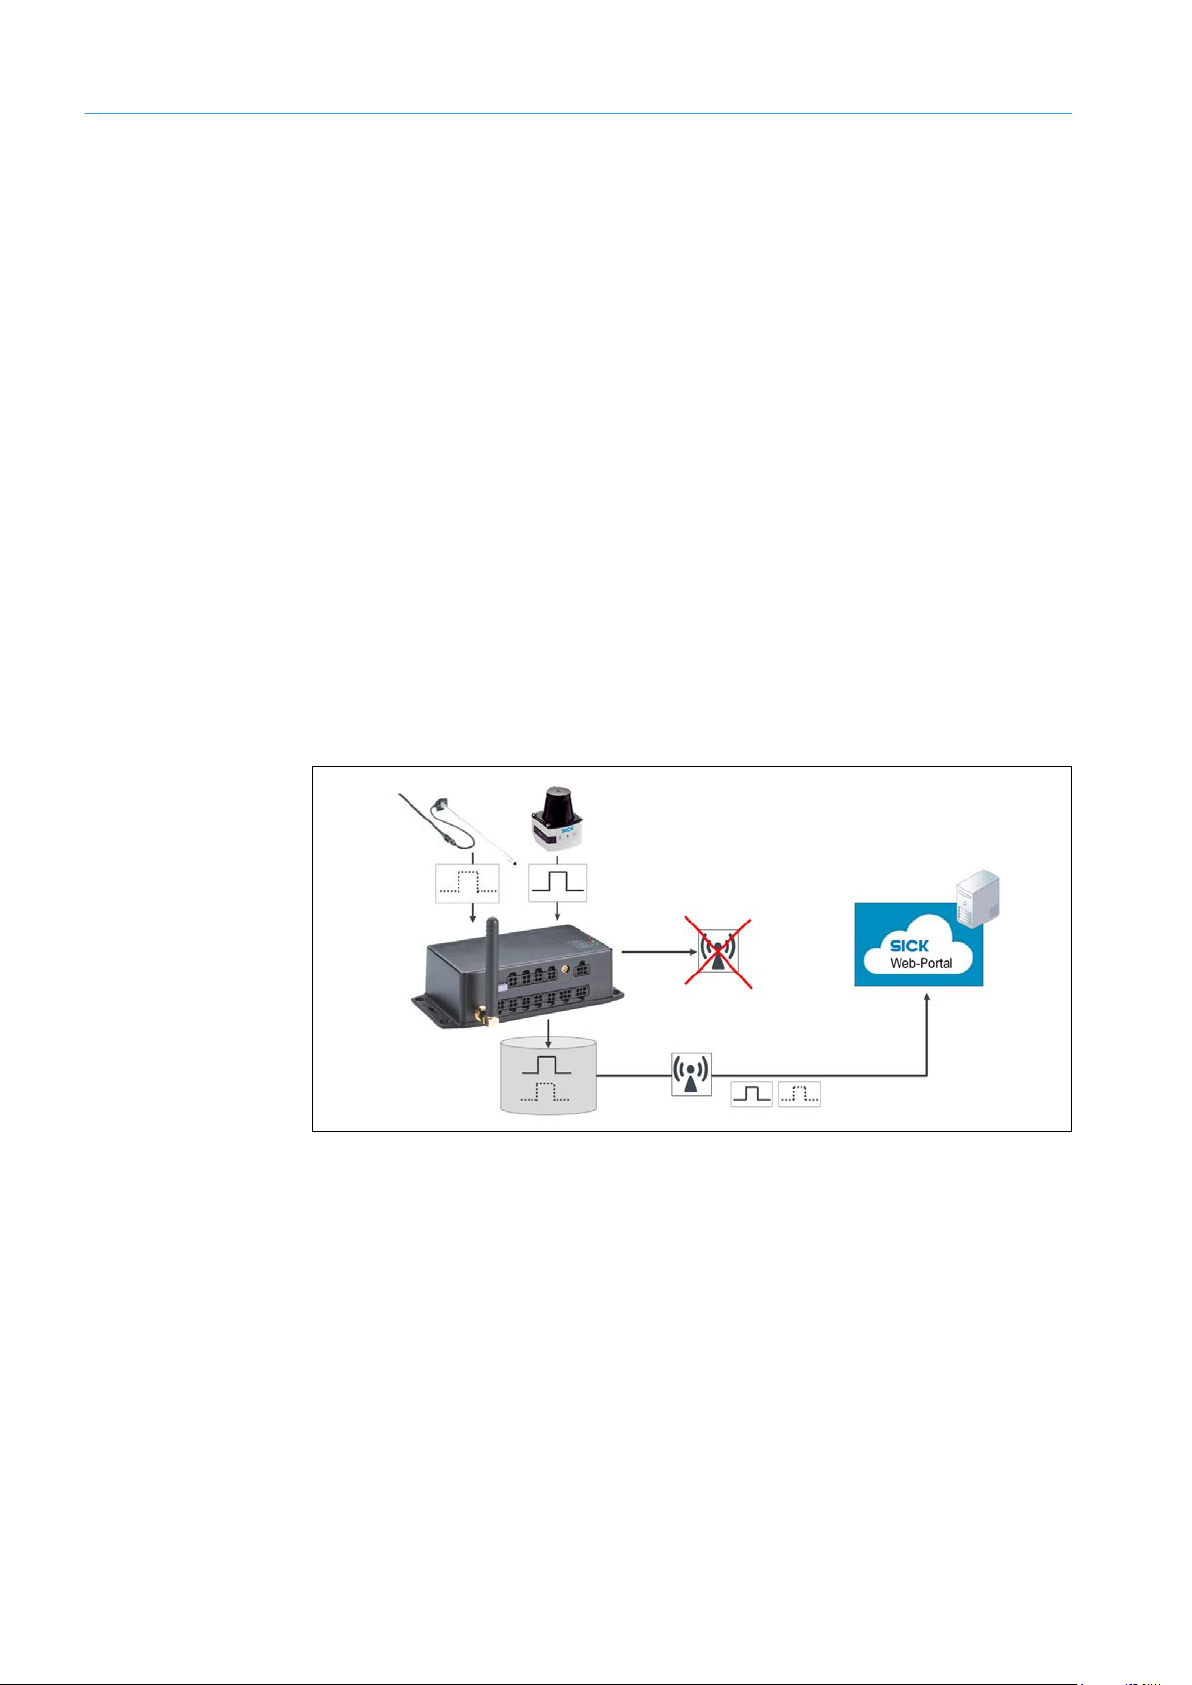
Data storage in offline mode
If there is no mobile signal, the data received from the connected sensors is stored on the
internal device memory. No matter how many sensors are connected, sensor data can be
stored for up to one month.
Note
If the device is not connected to a voltage supply, it will not be possible to save sensor data.
The TDC device will be back online as soon as a connection to the mobile network is
reestablished, and at this point the sensor data that has been saved will be transmitted
automatically to the SICK online portal. When using an internal customer server, it will be
possible to access data again once the connection has been restored.
Fig. 9: Data storage on the TDC device in offline mode
If the connection to the mobile network is interrupted for longer than one month, the data
stored on the internal device memory will be overwritten in line with the FIFO (first in, first
out) principle. What this means is that the data that was stored first will be the first to be
overwritten.
This principle ensures that the data from the last four weeks is always available – even
when the connection to the mobile network is interrupted for a prolonged period of time.
Device logging
TDC device activity, such as when a voltage supply is connected or the mobile network is
accessed, is reported to the SICK online portal.
Using the notification management system, the SICK online portal can issue a message
in the event of a mains voltage failure or a failure of the mobile network (for further
information on this, please also refer to Chapter 3.2.2.3 Visualization and monitoring).
Page 21
21
8021804/2017-11-27|SICK
Subject to change without notice
TRANSLATION O F THE ORIGINAL IN STRUCTIONS | Telematic Data Collector
3.2.2 Processing and visualizing sensor data on the SICK online portal
The SICK online portal is a standard cloud solution. It is the central platform used for
processing and visualizing the delivered sensor data.
3.2.2.1 Components of the SICK online portal
The cloud server receives and stores the sensor data transmitted by an individual TDC
device.
The data can be visualized in real time on a web-based user interface. Sensor data can be
accessed from any computer or mobile device by logging in to the portal site. All common
web browsers are supported.
Sensor data can then be transferred to a customer application using an API interface.
SYSTEM DESCRIPTION 3
Fig. 10: Components of the SICK online portal
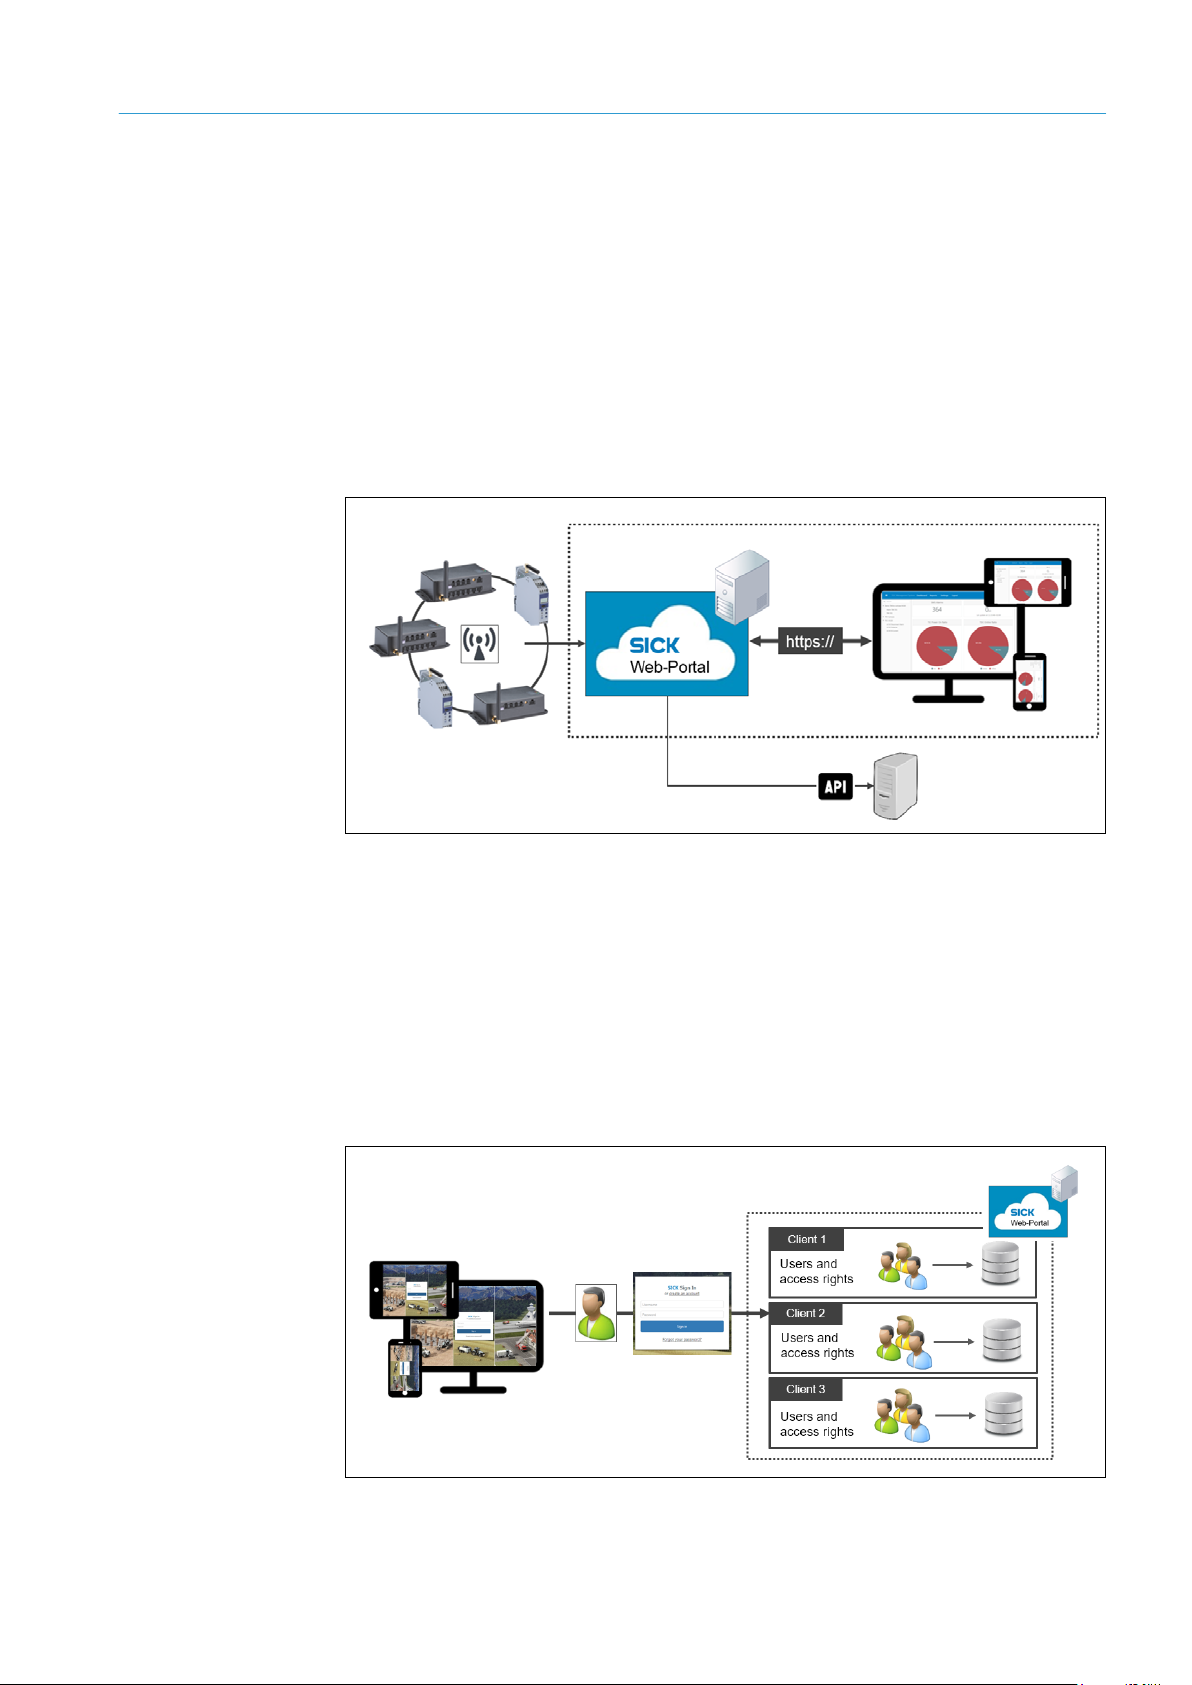
3.2.2.2 Multi-client capability and access rights
The cloud solution has multi-client capability, which allows the SICK online portal to be
used by multiple clients on the same server, with each client only being able to view and
edit their own data.
The SICK online portal is accessed from a browser using the URL of the cloud server.
Users must log in using a user name and password.
At the client level, the SICK online portal also supports various user levels with
corresponding access rights as far as sensor data and program functions are concerned.
Fig. 11: Multi-client capability and access rights on the SICK online portal
Page 22
3 SYSTEM DESCRIPTION
22
8021804/2017-11-27|SICK
TRANSLATION O F THE ORIGINAL IN STRUCTIONS | Telem atic Data Collector
Subject to change without notice
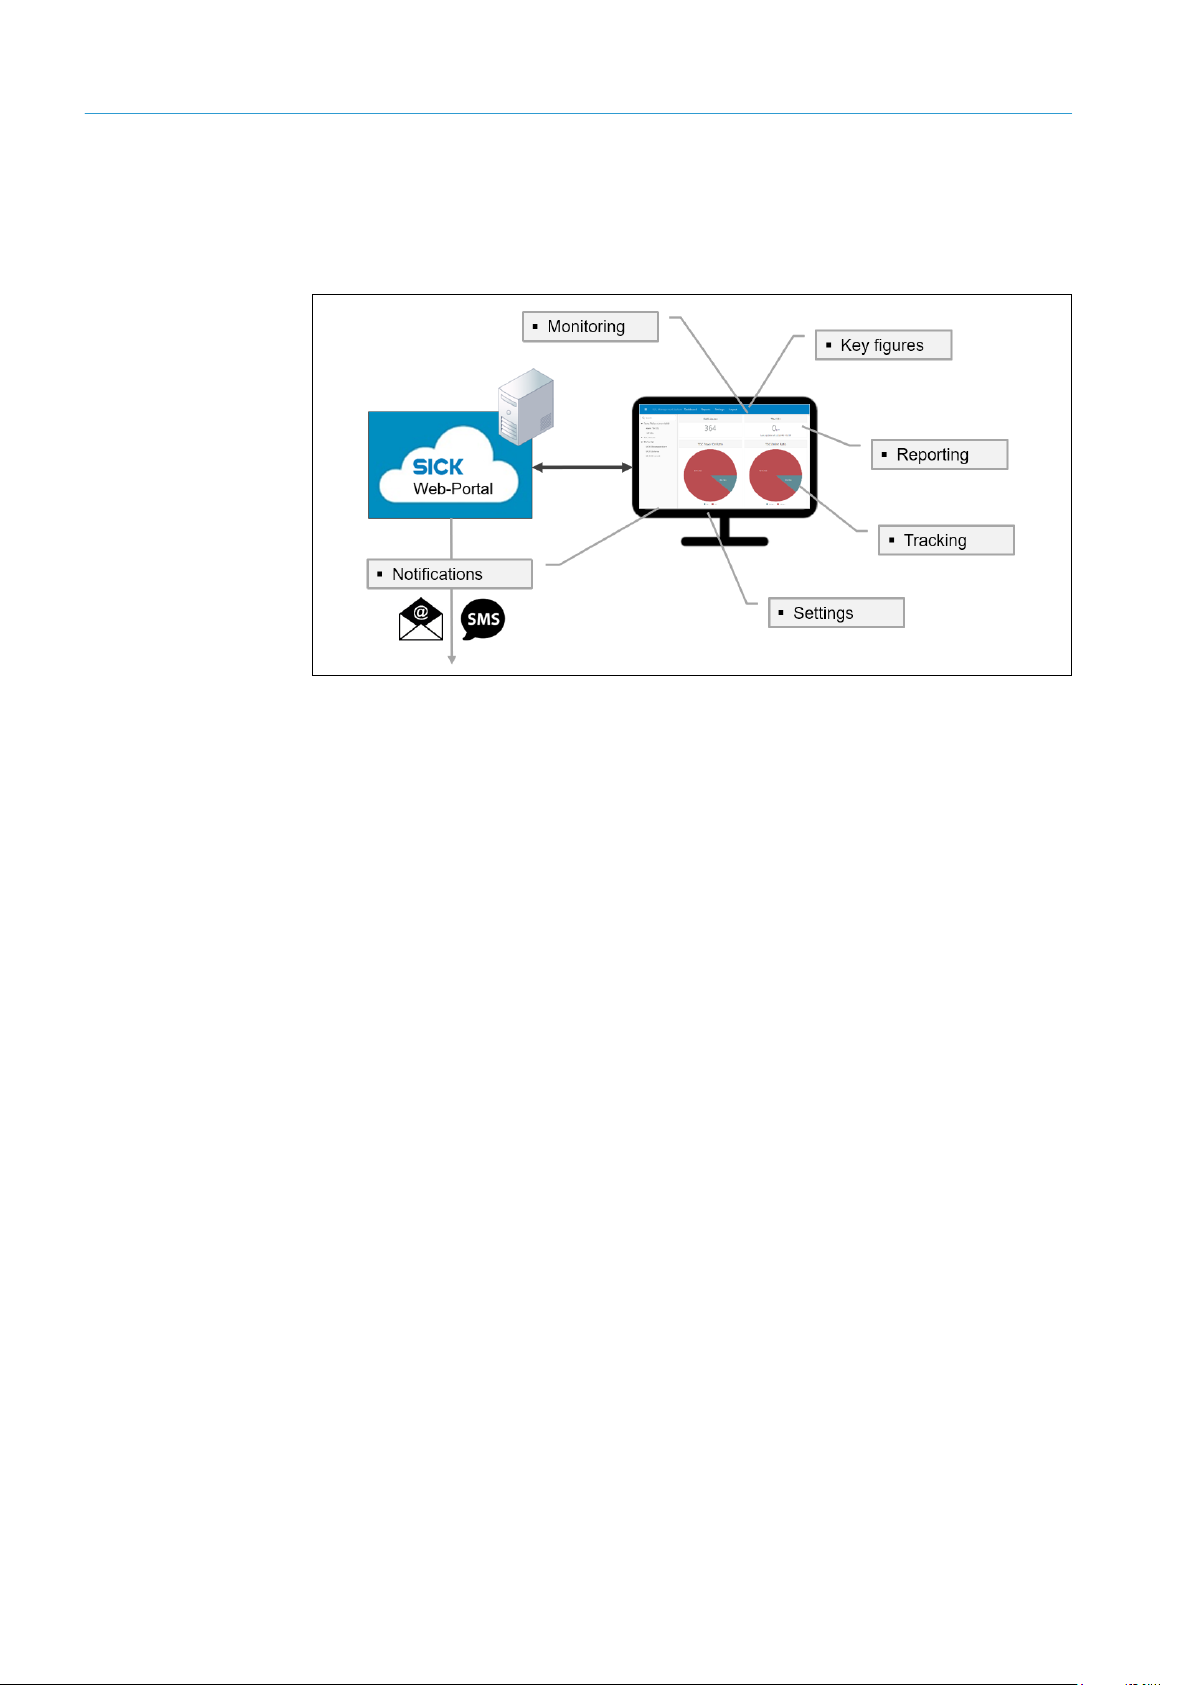
3.2.2.3 Visualization and monitoring
Viewing a graphical overview of the data on the SICK online portal allows for vehicle
activity, fuel levels, and even suspicious movements or potential collision hazards in the
vicinity of vehicles and machines to be monitored effectively.
Fig. 12: Visualization of sensor data and monitoring on the SICK online portal
Information is condensed in the form of key figures for the purposes of aiding the
decision-making process, controlling and monitoring measures, or running comparisons
within a company or across multiple companies.
Comprehensive reporting helps in the analysis and assessment of sensor data – even
over a prolonged period. Custom reports can be defined.
In addition to the alarm management system specific to the TDC device, the SICK online
portal also has its own notification system that issues messages in line with rules that
can be freely defined and displays them in the portal message center based on the user
and/or user group.
The automated notifications issued by the system can also be sent in e-mail or SMS
format via the integrated e-mail server for the SICK online portal.
Page 23
23
8021804/2017-11-27|SICK
Subject to change without notice
TRANSLATION O F THE ORIGINAL IN STRUCTIONS | Telematic Data Collector
3.3 Interfaces for integration into customer applications
The system solution supports the integration of recorded sensor data into all leading
business applications (ERP, CRM OMD, BI, etc.).
There are two options available for integration, which is possible regardless of whether
the SICK online portal or a cloud-based customer server is used.
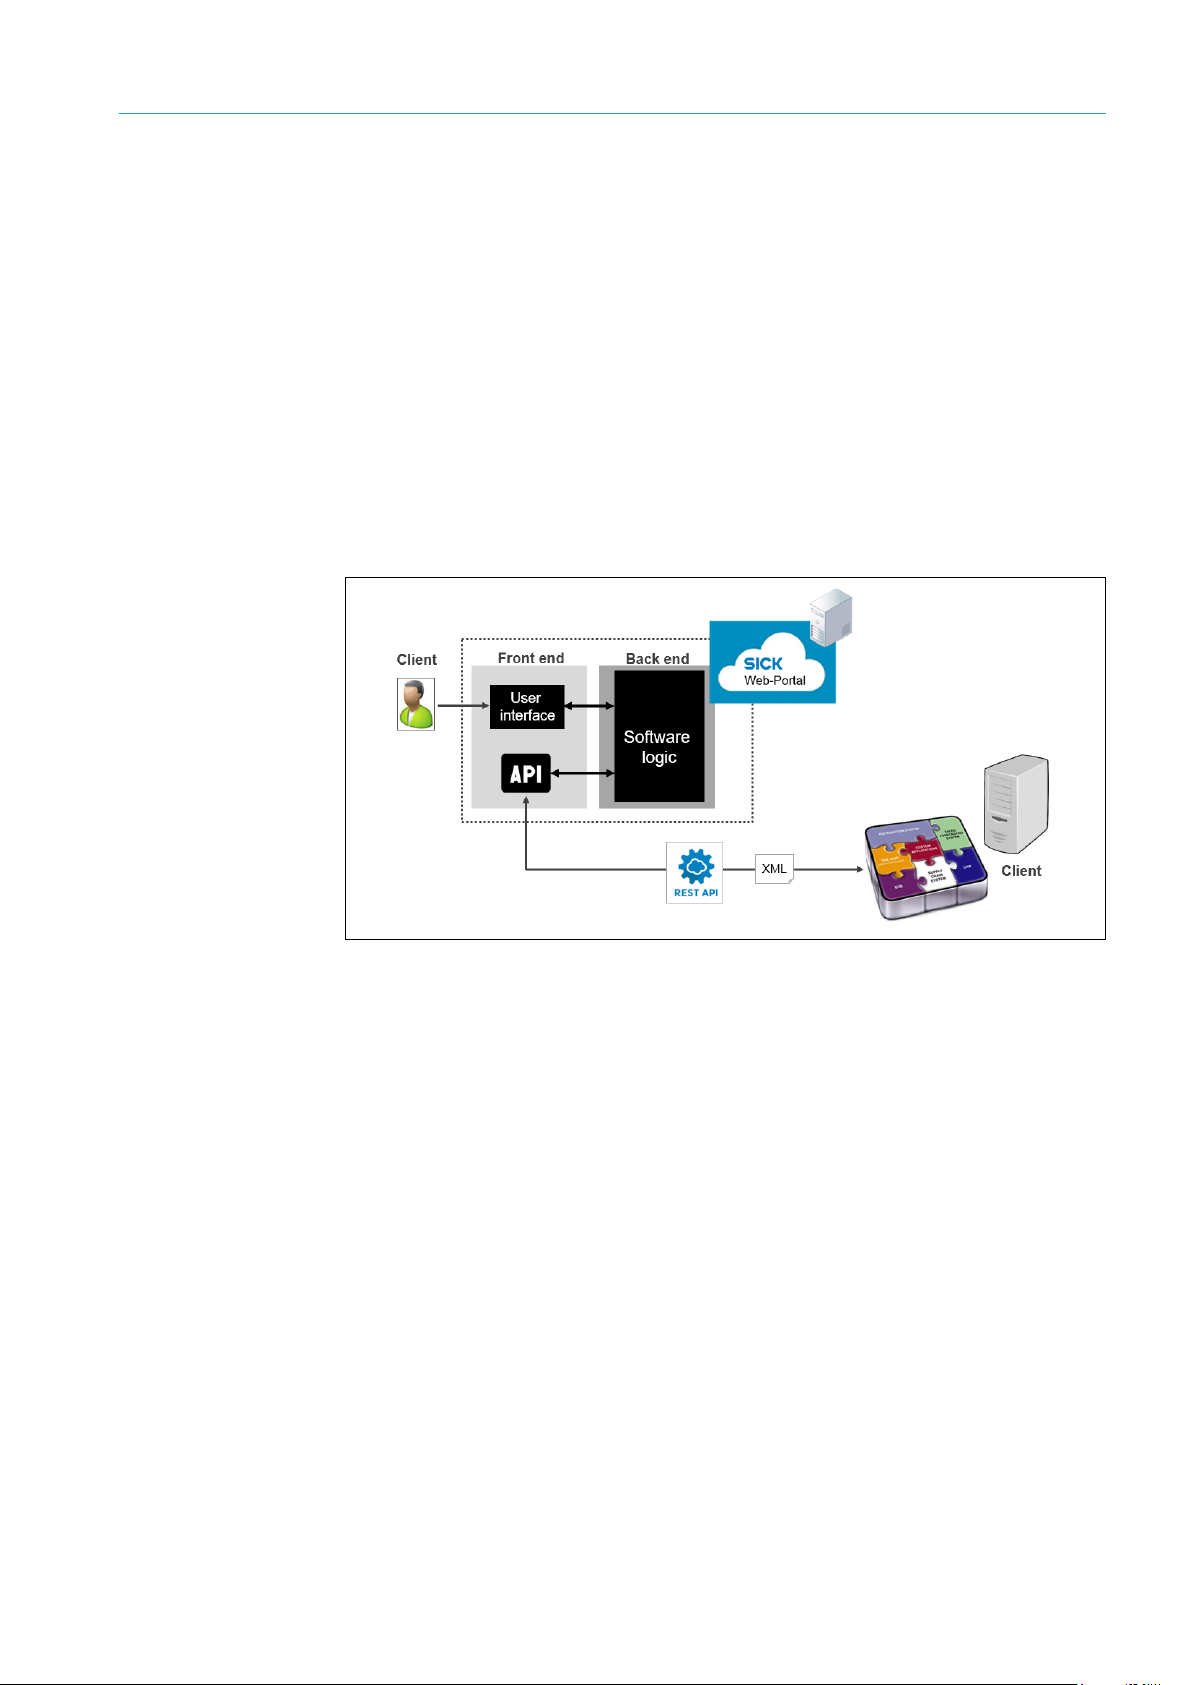
Transferring data from the SICK cloud via an API
If the SICK online portal is used to process and visualize the sensor data, the data can
be transferred directly from the SICK online portal to a customer application. The data is
transferred via a programming interface (API) included in the scope of delivery.
This programming interface grants access to the software logic of the SICK online portal,
allowing files and content to be processed further among different programs.
Communication with the API uses the REST standard protocol in XML data format.
SYSTEM DESCRIPTION 3
Note
Fig. 13: Transferring data from the SICK cloud to a customer application via an API
For further information on the methods used with the API, refer to Chapter 7.4
Transferring data to a customer application using an API interface.
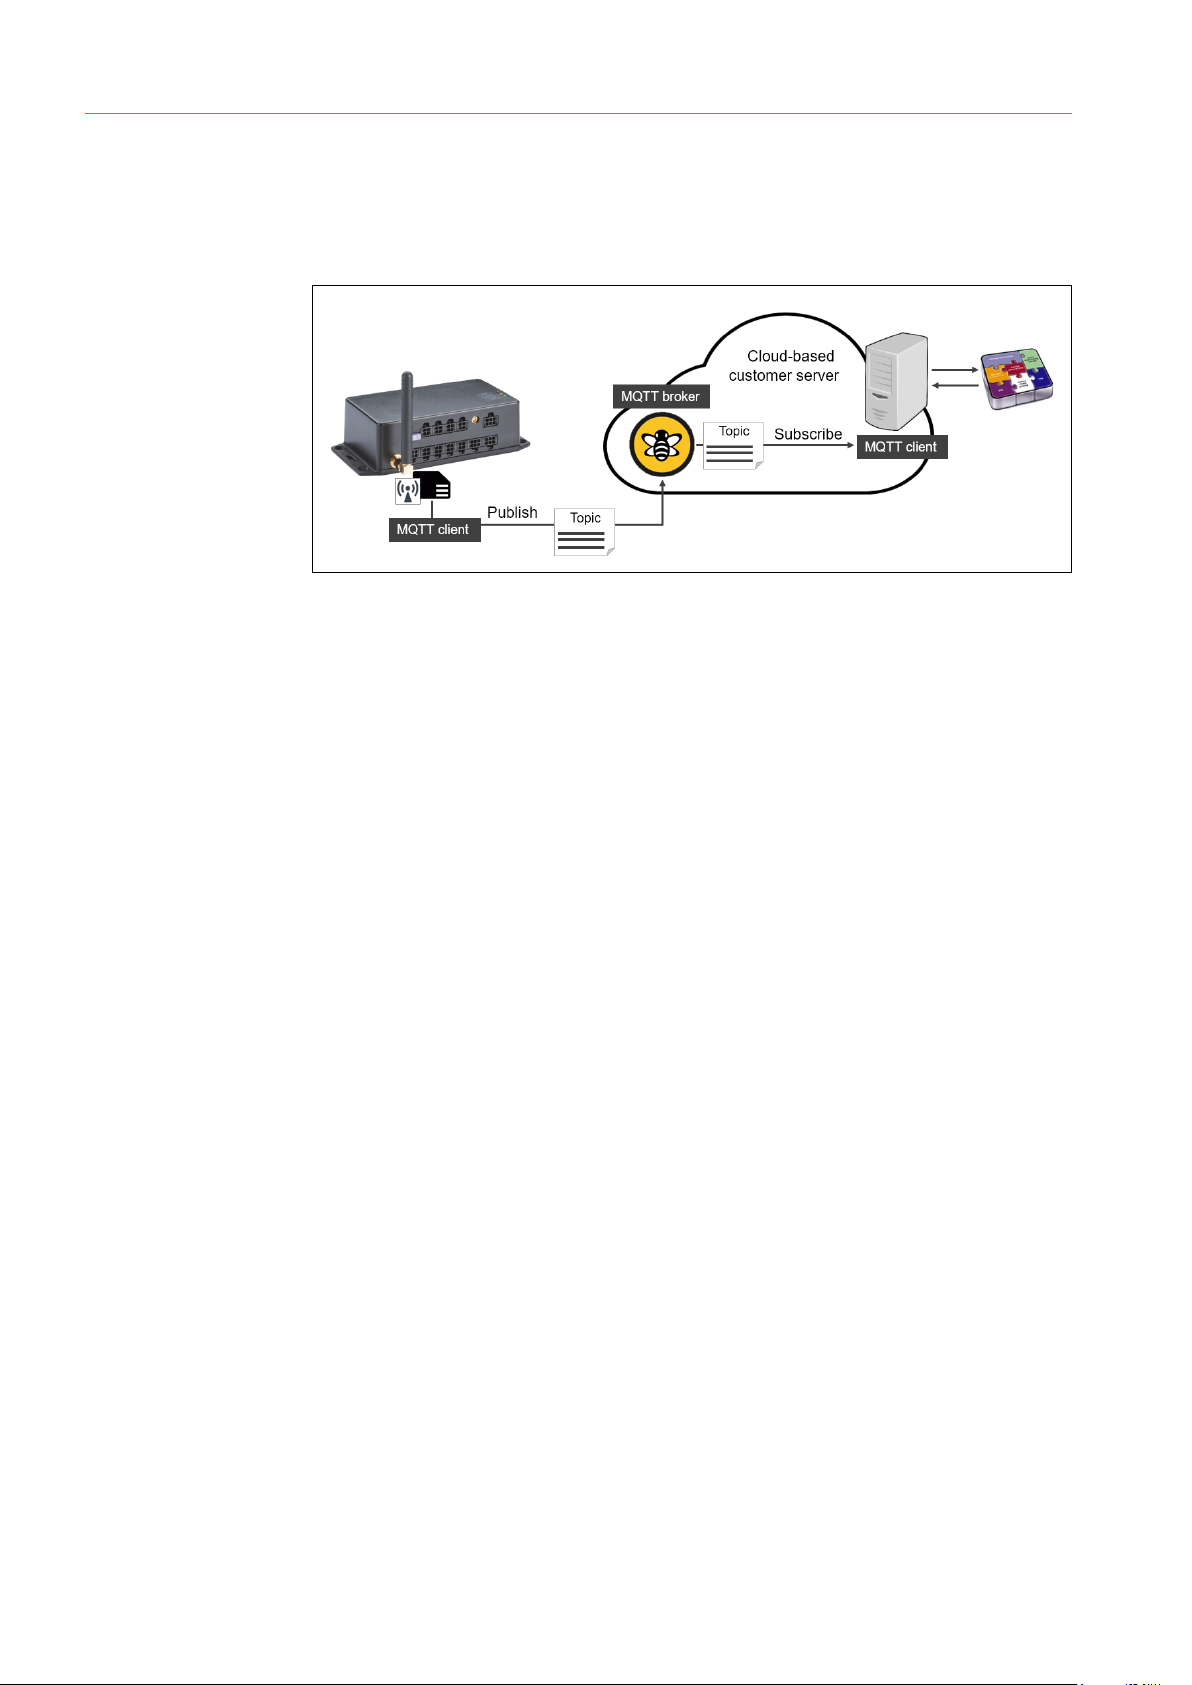
Accessing data from the TDC device via MQTT
If a customer's own server is used instead of the SICK online portal, it is not possible to
transmit the sensor data directly from the TDC device to the server. Data can only be
accessed using the MQTT interface.
MQTT is a special publish-subscribe-based messaging protocol. Here topics are set up by
the user, which are then used by clients (in the role of a publisher) to prepare messages
and by other clients (in the role of a subscriber) to receive messages.
On the basis of this principle, communication takes place via a central hub known as the
MQTT message broker. Each message sent by a client includes a topic with the data.
Every MQTT client that wants to receive messages for the topic must subscribe to them
through the message broker.
Whenever there are new messages, interested clients will be notified by the broker,
ensuring efficient communication with the subscribers. However, the individual clients are
only familiar with the message broker and not the other subscribers.
Page 24
3 SYSTEM DESCRIPTION
24
8021804/2017-11-27|SICK
TRANSLATION O F THE ORIGINAL IN STRUCTIONS | Telem atic Data Collector
Subject to change without notice
Within the system, the TDC device takes on the role of the publisher. It sends topics
with sensor data to the mobile network in a defined structure via the MQTT protocol.
The customer server subscribes to this data. Messages can be accessed and further
processed by this server using the defined topic structure.
Fig. 14: Accessing data from the TDC device via MQTT
Note
For more information on the topic structure of the MQTT interface, refer to Chapter 7.5
Accessing data from the TDC device via the MQTT interface.
Page 25
25
8021804/2017-11-27|SICK
Subject to change without notice
TRANSLATION O F THE ORIGINAL IN STRUCTIONS | Telematic Data Collector
3.4 Status indicators for the TDC devices
LED
Color
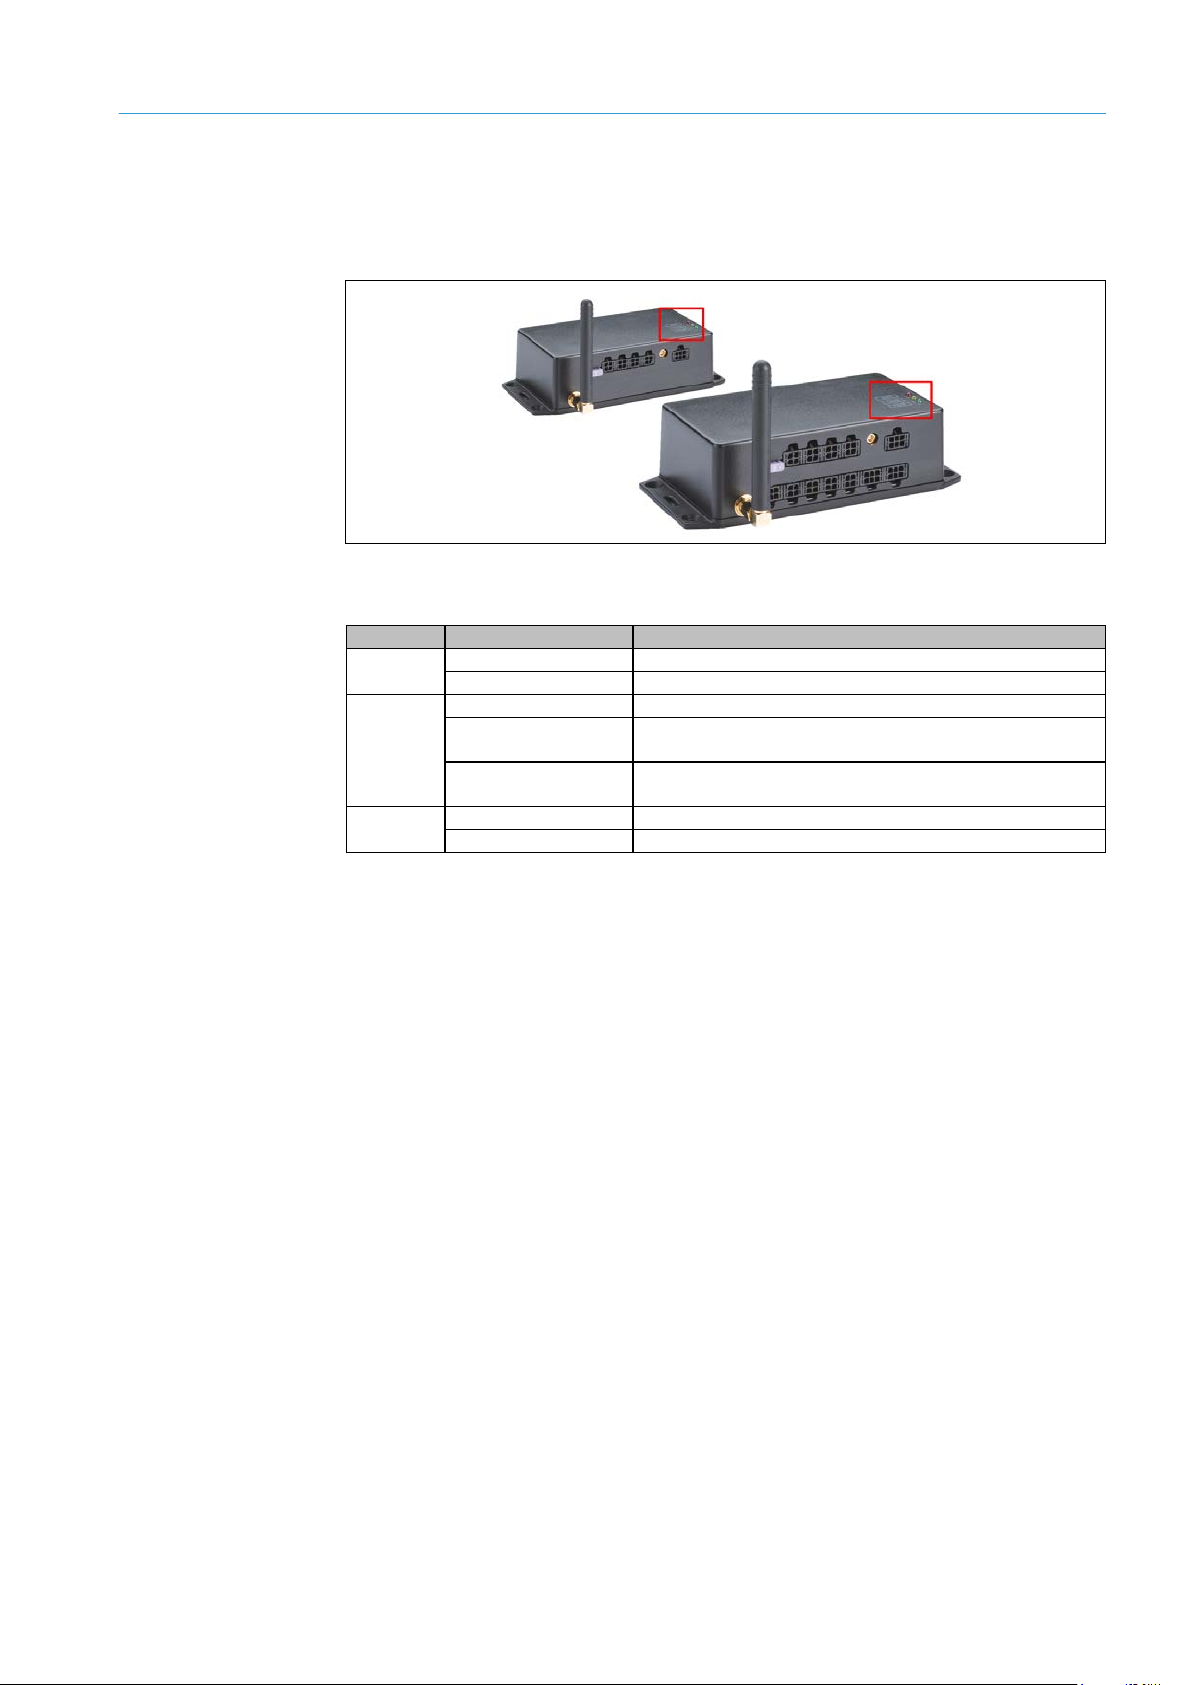
Meaning
Red (permanent)
No valid GPS signal found or no GPS antenna connected.
Red (periodical)
GPS signal found.
Yellow (permanent)
Device not connected to the mobile network.
Yellow (periodical
with a pulse)
Device connecting to the mobile network.
Yellow (periodical
with two pulses)
Device connected to the mobile network.
OFF
Device switched off or booting.
Green (permanent)
Device switched on.
3.4.1 TDC-B100/TDC-B200
The TDC-B100 and TDC-B200 devices each have three status LEDs.
Fig. 15: TDC-B100/TDC-B200 status indicators
The LEDs have the following meanings:
SYSTEM DESCRIPTION 3
GPS
COM
PWR
Tab. 8: TDC-B100 / TDC-B200 status indicators
Page 26
3 SYSTEM DESCRIPTION
26
8021804/2017-11-27|SICK
TRANSLATION O F THE ORIGINAL IN STRUCTIONS | Telem atic Data Collector
Subject to change without notice
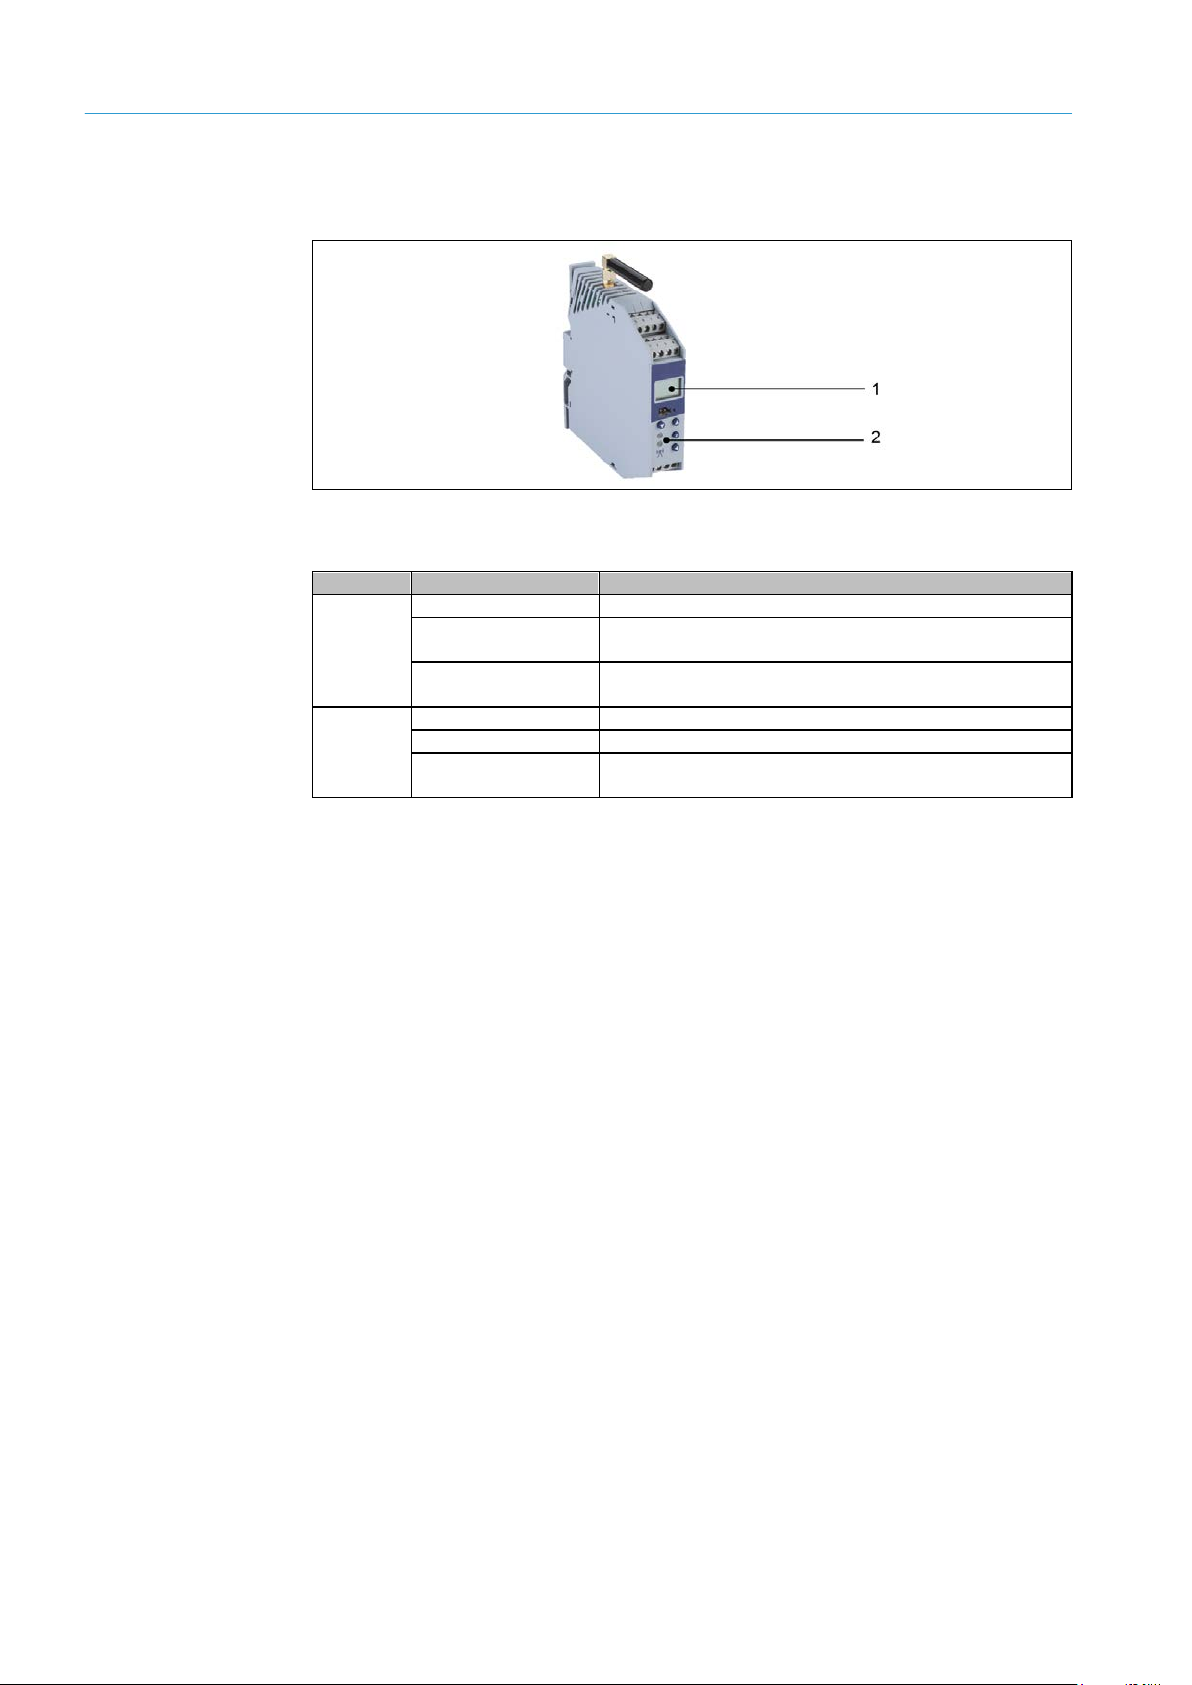
LED
Color
Meaning
Yellow (permanent)
Device not connected to the mobile network.
Yellow (periodical
with a pulse)
Device connecting to the mobile network.
Yellow (periodical
with two pulses)
Device connected to the mobile network.
Off
Device switched off or booting.
Red (permanent)
Counter has no reference.
Red/green
(alternating)
Counter reference OK.
3.4.2 TDC-M100
The TDC-M100 device has a 7- and 16-segment display (1) and two LEDs (2).
Fig. 16: TDC-M100 status indicators
The LEDs have the following meanings:
LED 1
Note
LED 2
Tab. 9: TDC-M100 status indicators
Manual operation and configuration of the TDC device using the four pushbuttons on the
front of the device is visualized on the two-line display.
Page 27
27
8021804/2017-11-27|SICK
Subject to change without notice
TRANSLATION O F THE ORIGINAL IN STRUCTIONS | Telematic Data Collector
4 Mounting
WARNING
WARNING
Note
MOUNTING 4
The TDC device should be mounted as close as possible to the battery for connection to
the voltage supply or close to the electrical installation for the connection of peripherals.
A SIM card for operation in EU countries and a 3-A fuse are already included in the TDC
devices.
Be sure to closely observe the following notes during mounting:
Mount the TDC device so that it is protected from dirt and mechanical damage.
Use a cover plate where possible.
We recommend installing the device in a connection box with PG connectors to ensure
compliance with protection class IP65.
4.1 Inserting the SIM card (not EU countries or for MQTT operation)
If the TDC device is being operated in an EU country in conjunction with the SICK cloud,
the SIM card inserted at the factory can be used for data transmission.
If the device is being operated in a country outside of the EU, the customer will have to
insert a SIM card from their telecommunications provider.
Note
Only use M2M SIM cards.
Ensure the device is switched off before inserting a SIM card.
Page 28
4 MOUNTING
28
8021804/2017-11-27|SICK
TRANSLATION O F THE ORIGINAL IN STRUCTIONS | Telem atic Data Collector
Subject to change without notice
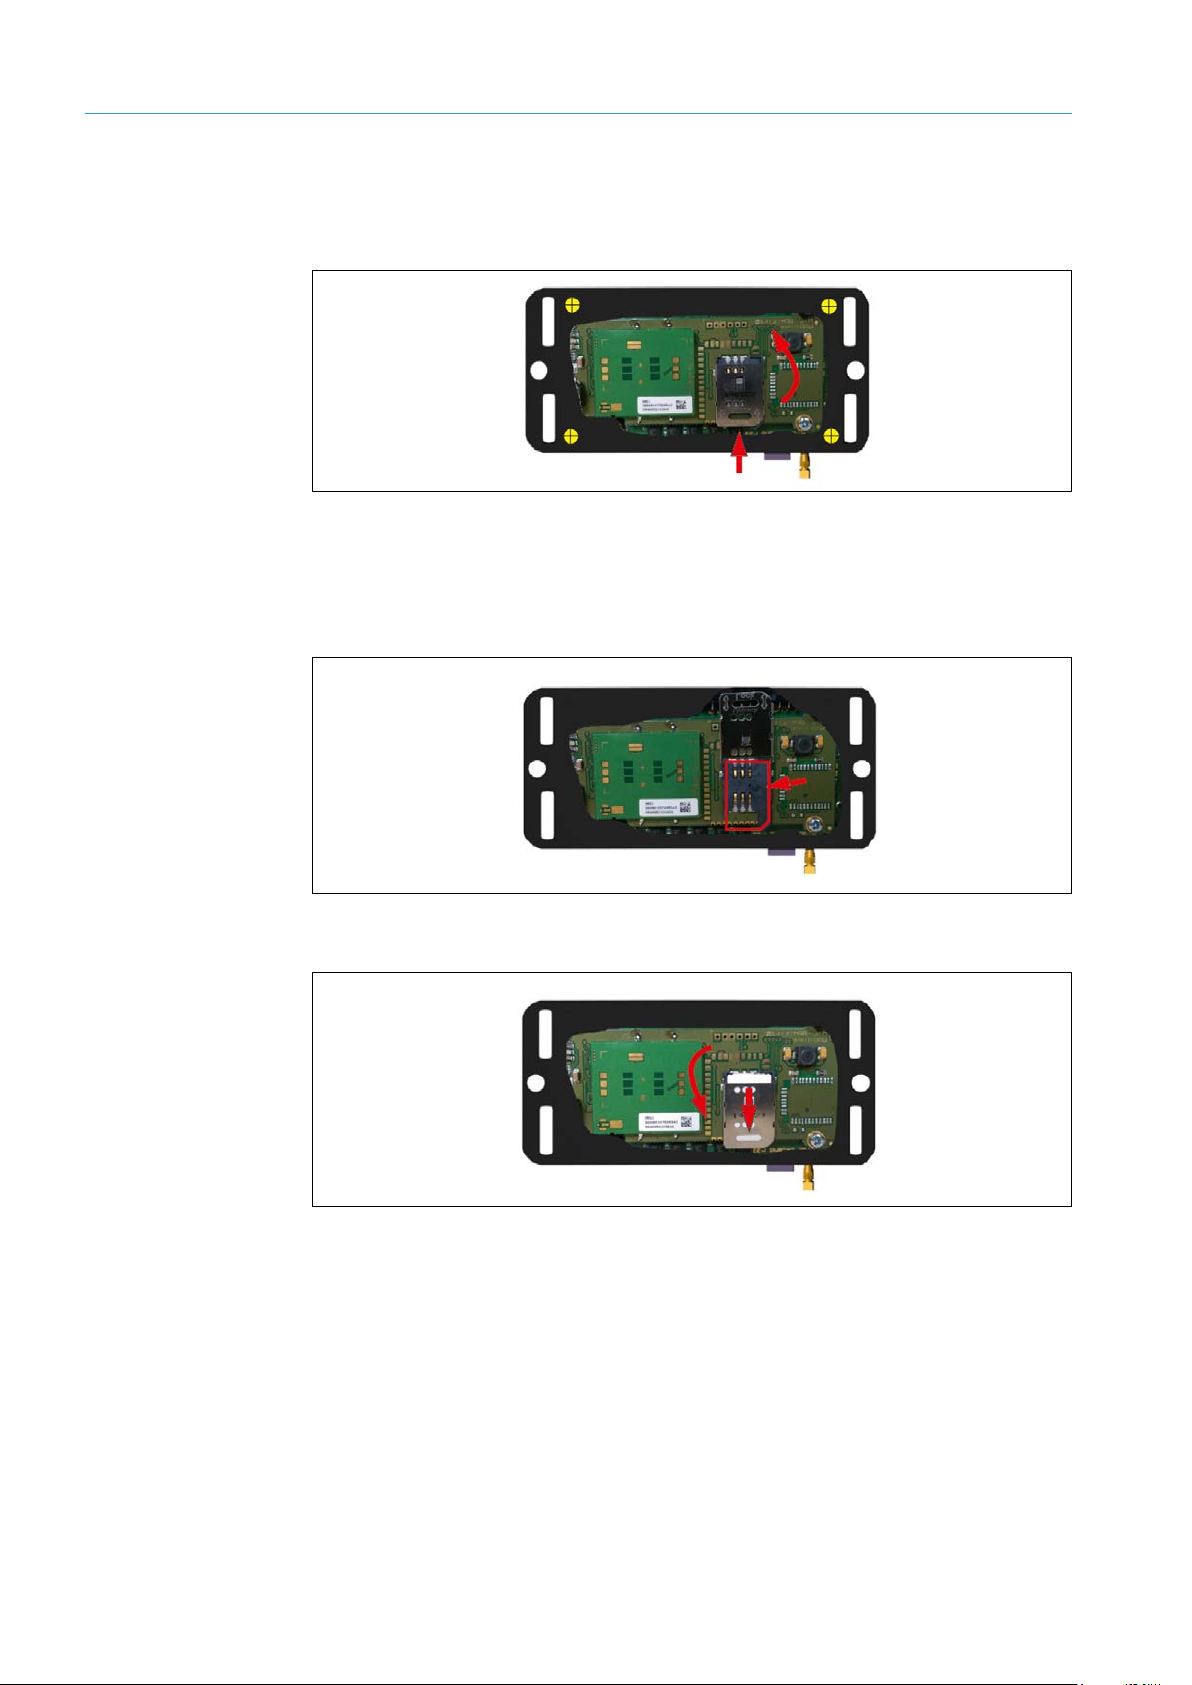
TDC-B100/TDC-B200
1. Loosen and remove the four screws on the bottom of the device.
2. Push the SIM card holder to release the catch and fold it up. Follow the red arrows.
3. Remove the SIM card that was inserted for operation within the EU at the factory and
insert a SIM card from your telecommunications provider into the SIM card holder with
the contacts facing down.
4. Close the fixing plate to hold the SIM card in place in the SIM card holder (follow the
arrows).
5. Fold the SIM card holder down to close it, pushing it down firmly to activate the catch.
Follow the red arrows.
Page 29
29
8021804/2017-11-27|SICK
Subject to change without notice
TRANSLATION O F THE ORIGINAL IN STRUCTIONS | Telematic Data Collector
Note
MOUNTING 4
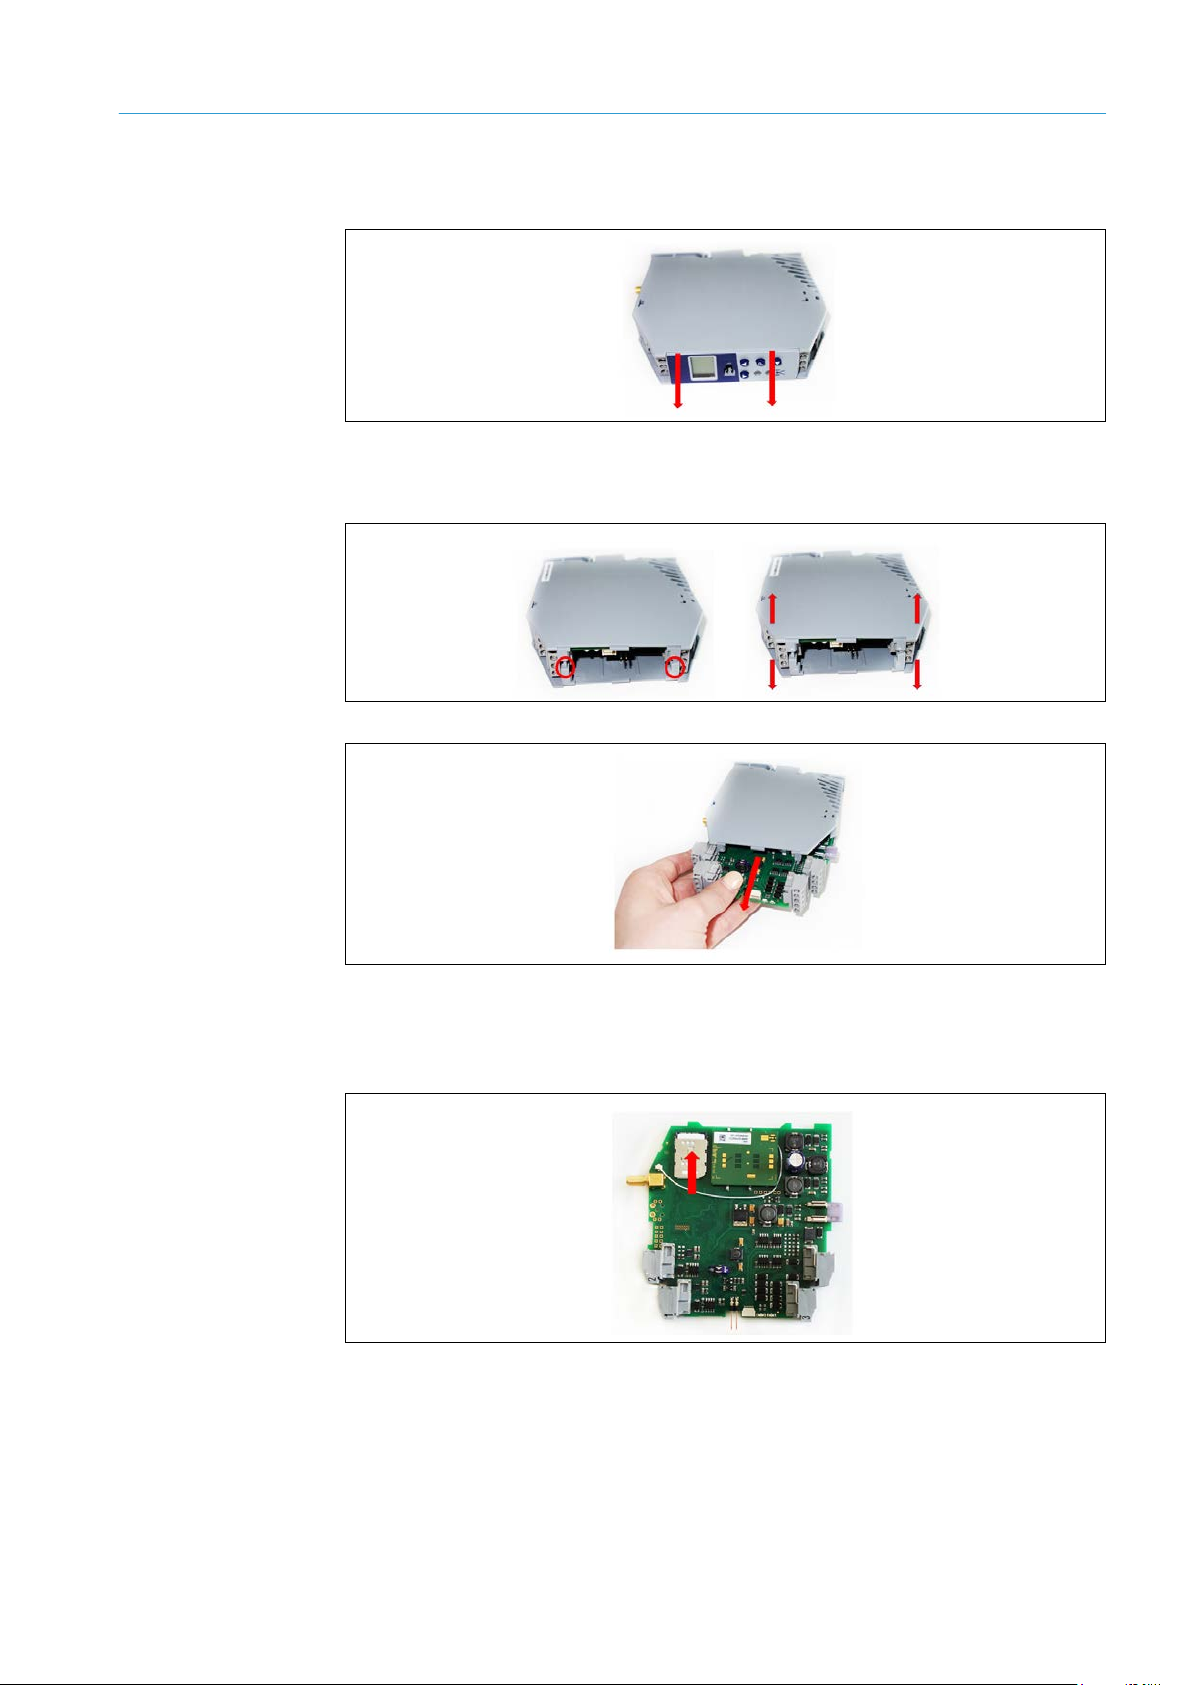
TDC-M100
1. Remove the plastic cover with the display and navigation buttons.
Be aware of the two spacers between the plastic covers.
2. Open the device by pulling the two sides of the plastic housing out of the plastic
brackets and separating them from one another.
3. Remove the whole PCB.
4. Lift up the SIM card holder a little.
Remove the SIM card that was inserted for operation within the EU at the factory and
insert a SIM card from your telecommunications provider into the SIM card holder with
the contacts facing down.
5. Fold the SIM card holder down to close it, pushing it down firmly to lock it.
6. Insert the PCB back into the housing.
7. Reassemble the two sides of the plastic housing..
8. Insert the spacers and mount the plastic cover with the display.
Page 30
4 MOUNTING
30
8021804/2017-11-27|SICK
TRANSLATION O F THE ORIGINAL IN STRUCTIONS | Telem atic Data Collector
Subject to change without notice
4.2 Mounting the TDC-B100/200
Use the mounting holes on the bottom of the device for the mounting process.
Fig. 17: Mounting the TDC-B100 /TDC-B200
Mounting on a plate
Mount the device using four M4 pan-head screws.
▸
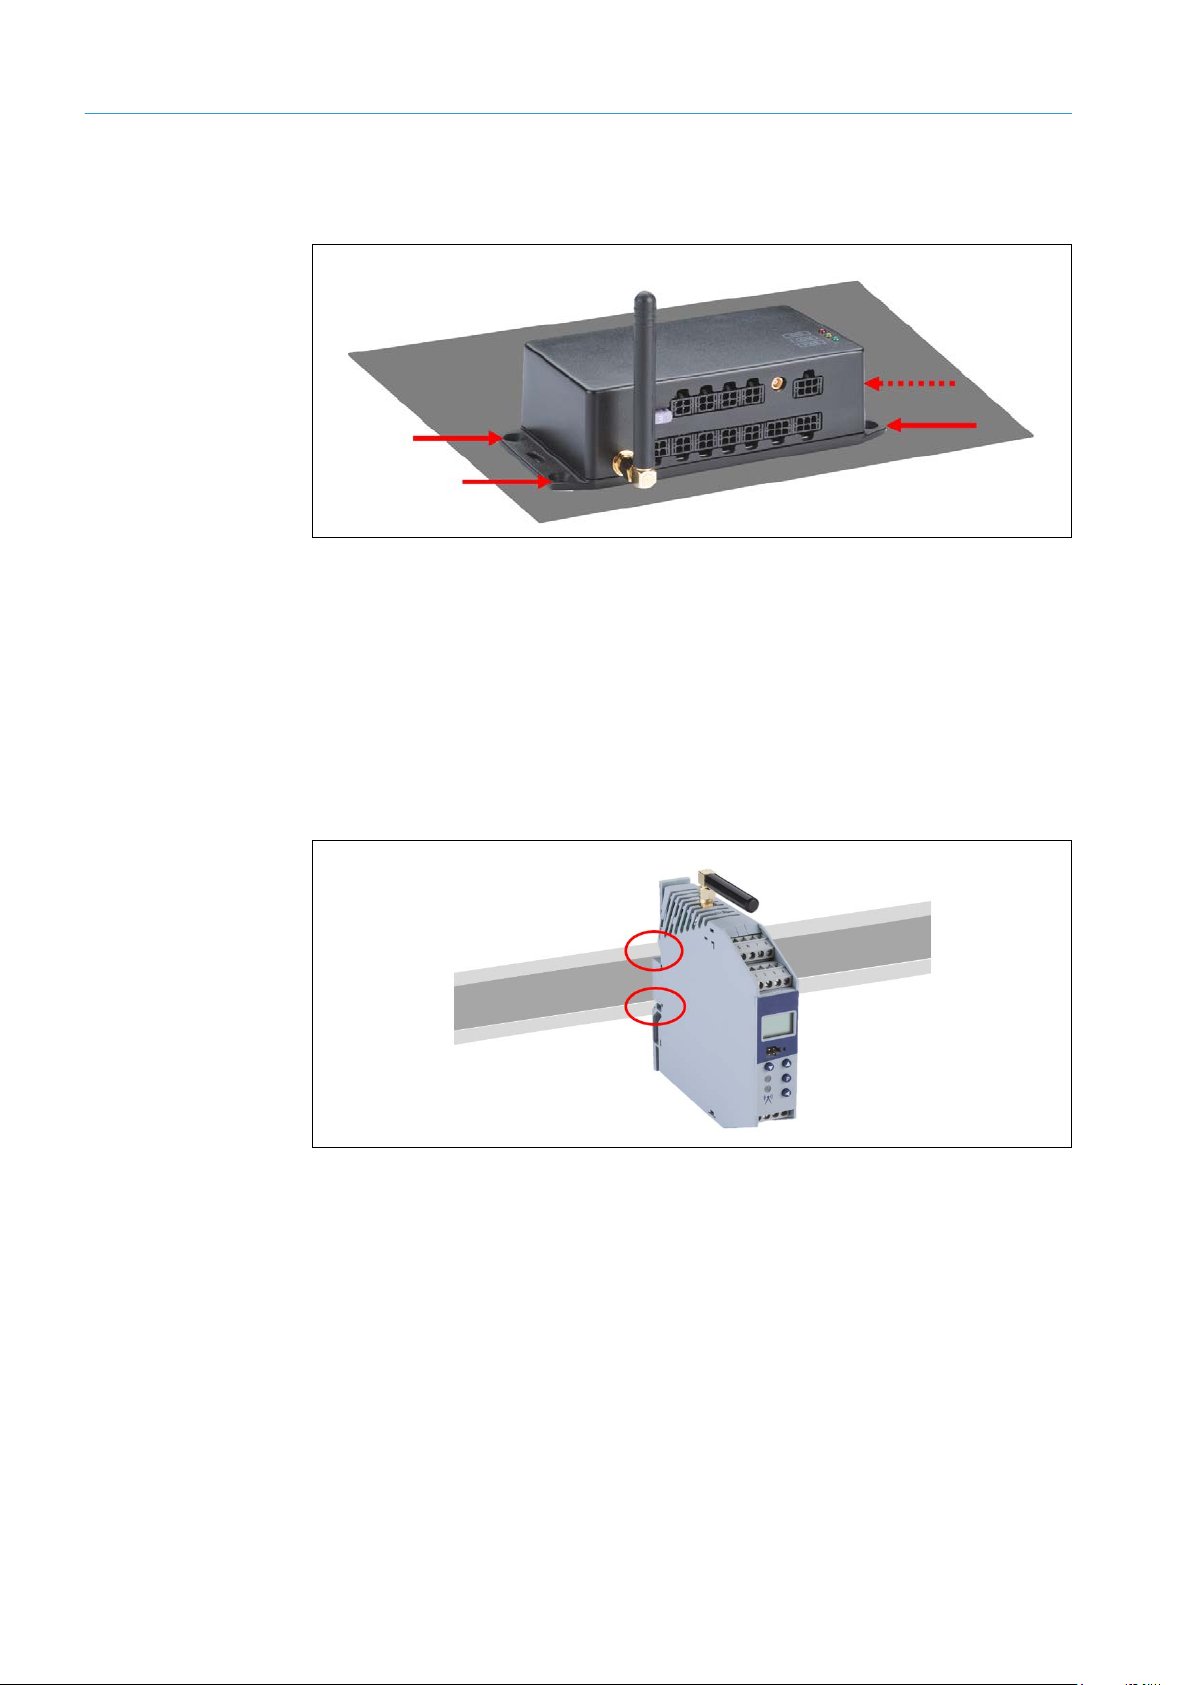
4.3 Mounting the TDC-M100
The TDC-M100 device is designed to be mounted in a control cabinet. This device variant
is mounted on a mounting rail. Any mounting orientation will be suitable.
Fig. 18: Mounting the TDC-M100
Mounting on a mounting rail
1. Position the device from above with the bracket on the mounting rail.
2. At the same time, push on the front of the device in the direction of the mounting rail
until you hear the device click into place.
Page 31

31
8021804/2017-11-27|SICK
Subject to change without notice
TRANSLATION O F THE ORIGINAL IN STRUCTIONS | Telematic Data Collector
5 Electrical installation
5.1 Connecting TDC devices
5.1.1 Connectors on the TDC devices
Depending on the device variant, the TDC devices have clamp or plug connectors with
four or six pins.
ELECTRICAL INSTALLATION 5
Fig. 19: Connections to the TDC devices (overview)
For details about the pin assignments, please refer to the operating instructions for the
specific devices concerned.
Page 32

5 ELECTRICAL INSTALLATION
32
8021804/2017-11-27|SICK
TRANSLATION O F THE ORIGINAL IN STRUCTIONS | Telem atic Data Collector
Subject to change without notice
PWR
Pin
Wire color
Connection
3
Black
GND
4
Red
DC-IN
5.1.2 Connecting the TDC device to the voltage supply
A TDC device is connected to the vehicle battery to guarantee that it is permanently
supplied with voltage.
A 4-wire connecting cable is used for the connection. Two wires here help with the
connection to the voltage supply, while the two other wires are used to also connect
a sensor and/or to connect the TDC device to the motor ignition system (see below).
Connecting the TDC-B100 / TDC-B200 to the voltage supply
The 4-wire connecting cable has a Micro-Fit plug connector on one side for the connection
to the device and open ends on the other side for the connection to the voltage supply.
Fig. 20: Connecting the TDC-B100 / TDC-B200 to the voltage supply
1. Plug the Micro-Fit male connector on the connecting cable for the TDC device into the
PWR female connector.
2. Use the red and black wires of the connecting cable to connect the TDC device to the
voltage supply:
Tab. 10: Connecting the TDC-B100 /TDC-B200 to the voltage supply
Page 33

ELECTRICAL INSTALLATION 5
33
8021804/2017-11-27|SICK
Subject to change without notice
TRANSLATION O F THE ORIGINAL IN STRUCTIONS | Telematic Data Collector
Pin
Wire color
Connection
13
Red
DC-IN
14
Black
GND
Connecting the TDC-M100 to the voltage supply
The 4-wire connecting cable has open ends on both sides.
Fig. 21: Connecting the TDC-M100 to the voltage supply
Use the red and black wires of the connecting cable to connect the TDC device to the
▸
voltage supply:
Tab. 11: Connecting the TDC-M100 to the voltage supply
Page 34

5 ELECTRICAL INSTALLATION
34
8021804/2017-11-27|SICK
TRANSLATION O F THE ORIGINAL IN STRUCTIONS | Telem atic Data Collector
Subject to change without notice
PWR
Pin
Wire color
Connection
2
Yellow
IN A/IGN
Pin
Wire color
Connection
15/16
Yellow
Digital input
5.1.3 Connecting the TDC device to the ignition system
If you want to find out whether or not the vehicle motor is running, connect the TDC device
to the ignition system. The motor signal is processed by the TDC device via a digital input.
A wire of the connecting cable for the voltage supply is used for the connection.
Connecting the TDC-B100/TDC-B200 to the ignition system
Fig. 22: Connecting the TDC-B100 /TDC-B200 to the ignition system
1. If you have not already done so, plug the Micro-Fit male connector on the connecting
cable for the TDC device voltage supply into the PWR female connector.
2. Use the yellow wire to connect the TDC device to the ignition system.
Tab. 12: Connecting the TDC-B100 /TDC-B200 to the ignition system
Connecting the TDC-M100 to the ignition system
Fig. 23: Connecting the TDC-M100 to the ignition system
Use the yellow connecting cable to connect the TDC device to either the IN-E or IN-F
▸
input.
Tab. 13: Connecting the TDC-M100 to the ignition system
Page 35

35
8021804/2017-11-27|SICK
Subject to change without notice
TRANSLATION O F THE ORIGINAL IN STRUCTIONS | Telematic Data Collector
5.1.4 Connecting the TDC device to SICK sensors
Pin
Wire color
Connection
1
Blue
IN C 2 Pink
IN D
3
Gray
IN D 4 Violet
IN F
5
White
IN G 6 Brown
IN H
SICK sensors are usually connected to the TDC device via two digital inputs. Depending on
how many sensors are connected to the TDC device, use the two wires of the connecting
cable for the voltage supply (TDC devices in the B series only) or a suitable INPUT cable
for the connection.
The wires are to be connected by the customer to the connecting cable of the relevant
sensor via a compatible Micro-Fit adapter (4- or 6-pin).
Voltage can be supplied to the sensor via the voltage supply to the CAN bus or the RS485
bus.
Note
The TDC devices also feature interfaces that can be used to connect sensors from thirdparty providers.
For additional information on the connection, please see the operating instructions for the
relevant TDC device or sensor.
Connecting the TDC-B100/TDC-B200 to a sensor
ELECTRICAL INSTALLATION 5
Fig. 24: Connecting the TDC-B100 /TDC-B200 to SICK sensors
1. Plug the Micro-Fit male connector on the connecting cable for the TDC device into the
Input female connector.
2. For each sensor, connect two wires to the connecting cable of the corresponding
sensor via an adapter.
Inputs
Tab. 14: Connecting the TDC-B100 /TDC-B200 to SICK sensors
Page 36

5 ELECTRICAL INSTALLATION
36
8021804/2017-11-27|SICK
TRANSLATION O F THE ORIGINAL IN STRUCTIONS | Telem atic Data Collector
Subject to change without notice
CAN1
Pin
Wire color
Connection
CAN2
RS485
PWR
Pin
Wire color
Connection
1
White
IN B
2
Yellow
IN A/IGN
CAN1
Pin
Wire color
Connection
CAN2
RS485
3. Plug the male connector on the CAN/RS485 connecting cable for the TDC device into
the RS485, CAN1, or CAN2 female connector.
4. For each sensor, connect pin 4 of the cable to the connecting cable of the corresponding
sensor via an adapter. Voltage will then be supplied to the sensor.
4 Blue DOUT CAN1
4 Blue DOUT CAN2 (TDC-B200 only)
Note
4 Blue DOUT RS485
Tab. 15: Connecting the TDC-B100 /TDC-B200 to SICK sensors (voltage supply)
For the TDC-B200, the yellow and white wires of the connecting cable for the voltage
supply can also be used for signal transmission for one sensor. For the TDC-B100, this
is the only possible variant.
In addition, the sensor needs to be connected to an output for the voltage supply as
described.
4 Blue DOUT CAN1
4 Blue DOUT CAN2 (TDC-B200 only)
4 Blue DOUT RS485
Tab. 16: Connecting the TDC-B100 /TDC-B200 to one SICK sensor via the cable for the voltage
supply
Page 37

37
8021804/2017-11-27|SICK
Subject to change without notice
TRANSLATION O F THE ORIGINAL IN STRUCTIONS | Telematic Data Collector
Pin
Connection
9/10
Configured as digital inputs for signal transmission
5/1
Voltage supply output for connected sensors
Pin
Connection
15
IN-E digital input
16
IN-F digital input
5/1
Voltage supply output for connected sensors
Note
ELECTRICAL INSTALLATION 5
Connecting the TDC-M100 to a SICK sensor
Fig. 25: Connecting the TDC-M100 to SICK sensors
1. Connect the two wires of the connecting cable for the TDC device to two digital inputs.
If you use the I/O connections, you must ensure that they have been configured as
inputs.
2. Connect one wire of the connecting cable for the TDC device to the DOUT CAN1 or
DOUT RS485 input. Voltage will then be supplied to the sensor.
3. Connect the wires to the connecting cable of the sensor via an adapter.
Note
11/12
Tab. 17: Connecting the TDC-M100 to SICK sensors
The yellow and white wires of the connecting cable for the voltage supply can also
be used for signal transmission for one sensor. In addition, the sensor needs to be
connected to an output for the voltage supply as described.
Tab. 18: Connecting the TDC-M100 to one SICK sensor via the cable for the voltage supply
Page 38

5 ELECTRICAL INSTALLATION
38
8021804/2017-11-27|SICK
TRANSLATION O F THE ORIGINAL IN STRUCTIONS | Telem atic Data Collector
Subject to change without notice
RS485
Pin
Wire color
Connection
1/2
Blue
RS485 A / RS485 B
3
White
GND
4
Brown
PWR-OUT
5.1.5 Connecting fuel level sensors
Fuel level sensors manufactured by Omnicomm are connected to the TDC device via
the RS485 interface. The device is supplied with all the required connecting cables.
Note
On the basis that TDC-M100 TDC devices cannot supply GPS information revealing the
vehicle location, it is recommend that the fuel level sensor is only operated with TDCB100 /TDC-B200 TDC devices. Otherwise, the signal from the fuel level sensor for the
TDC-M100 will only be supplied with a time stamp and no position determination.
Use the connecting cable included in the delivery.
▸
Fig. 26: Connecting the TDC-B100 /TDC-B200 to fuel level sensors
1. Plug the Micro-Fit male connector on the connecting cable for the TDC device into the
RS485 female connector.
2. Connect the wires of the connecting cable to the fuel level sensor via an adapter as
follows:
Tab. 19: Connecting the TDC-B100 /TDC-B200 to fuel level sensors
Page 39

39
8021804/2017-11-27|SICK
Subject to change without notice
TRANSLATION O F THE ORIGINAL IN STRUCTIONS | Telematic Data Collector
5.2 Screwing on the GSM antenna
The GSM antenna is not installed at the factory. It needs to be screwed on before the
devices are commissioned.
Fig. 27: Screwing on the GSM antenna
1. Hold the device in place with one hand.
2. Place the GSM antenna on the antenna connector on the TDC device.
3. Screw the GSM antenna clockwise onto the antenna connector on the device.
ELECTRICAL INSTALLATION 5
5.3 Connecting the GPS antenna
The GPS antenna is usually installed in the driver's cab with clear visibility upward or in
the vehicle roof area.
Have an expert install the connecting cable in the vehicle depending on where exactly the
antenna is being installed and connect this to the TDC-B100/TDC-B200 device via the
Cinch male connector.
Note
The TDC-M100 device cannot supply any GPS information, as there is no connector for
a GPS antenna.
Connecting the GPS antenna to the TDC-B100 /TDC-B200
Fig. 28: Connecting the GPS antenna to the TDC-B100 /TDC-B200
Plug the Cinch male connector on the connecting cable for the TDC-B100/TDC-B200
▸
device into the GPS female connector.
Page 40

6 COMMISSIONING
40
8021804/2017-11-27|SICK
TRANSLATION O F THE ORIGINAL IN STRUCTIONS | Telem atic Data Collector
Subject to change without notice
HAZARD
HAZARD
6 Commissioning
6.1 Launching the TDC devices
Establish the voltage supply for the TDC devices. All sensors connected to the TDC device
will then also be supplied with voltage.
Operational readiness after 60 seconds
The TDC device is ready for operation after approximately 60 seconds.
Check the operational status of the TDC device by looking at the status indicators.
▸
6.2 Preparing the configuration PC
6.3 General notes
Disconnecting the power to the system
Make sure that all the components of the gateway system are disconnected from the
▸
power supply during the electrical installation work.
Risk of injury due to electrical current
Standard safety requirements must be met when working on electrical systems.
▸
The power supply must be disconnected when attaching and detaching electrical
▸
connections.
Page 41

41
8021804/2017-11-27|SICK
Subject to change without notice
TRANSLATION O F THE ORIGINAL IN STRUCTIONS | Telematic Data Collector
6.3.1 Establishing a connection with the configuration PC
Part No.
Description
6066259
TDC-B100 /TDC-B200 configuration cable
6066258
TDC-M100 configuration cable
The TDC device is configured via a configuration PC with the TDC Configurator
configuration software installed on it.
Fig. 29: Connecting the TDC device and the configuration PC
Connecting the configuration PC
The configuration PC is connected to the TDC device using the configuration cable, which
can be procured separately as an accessory.
The configuration cable has a device-specific Micro-Fit plug connector for the connection
to the TDC device and a USB connector for the connection to the configuration PC.
COMMISSIONING 6
TDC-M100 connection
1. Plug the device-specific Micro-Fit male connector on the configuration cable into the
DIAG female connector on the TDC device.
2. Connect the cable to a free USB port on the configuration PC.
Page 42

6 COMMISSIONING
42
8021804/2017-11-27|SICK
TRANSLATION O F THE ORIGINAL IN STRUCTIONS | Telem atic Data Collector
Subject to change without notice
6.3.2 Installing TDC Configurator
Install the TDC Configurator configuration software. Download the configuration software
from the SICK website in the form of a zipped folder that also contains the system
documentation and interface files. The link with the access data for the download can be
found in the quick start guide and on the packaging for the configuration cable.
Installing TDC Configurator
1. Unpack the zipped folder in a temporary directory on the configuration PC.
2. Start the installation by double-clicking on the Setup.exe file.
The installation wizard will open. A note will appear to point out that the drivers for the
configuration cable will also be installed when the configuration software is installed for
the first time.
3. Start the installation by clicking on Install.
4. Follow the instructions in the installation wizard.
5. Once the configuration software has been installed, the drivers for the configuration
cable will also be installed. These drivers will be installed in the corresponding directory
of the operating system.
6. Complete the installation.
The configuration PC will then have to be restarted.
Depending on the configuration, a program group is created and an icon is placed on the
desktop.
Page 43

43
8021804/2017-11-27|SICK
Subject to change without notice
TRANSLATION O F THE ORIGINAL IN STRUCTIONS | Telematic Data Collector
6.4 Connecting to the TDC device
6.4.1 Launching the configuration software
Launch the configuration software and log in to TDC Configurator at the Service user
level.
Logging in
1. To log in, click on the program icon in the Windows start menu or on the desktop.
The login window will open.
2. Under Access, select the Service user level.
3. Enter servicelevel as the password.
4. Click OK to confirm.
The configuration software will open.
The TDC Configurator configuration interface
The TDC Configurator configuration interface is divided into several sections.
COMMISSIONING 6
• A number of functions can be found in the menu bar. This is where the connection to
the TDC device is established and where parameters can be written onto the device
or loaded into the configuration software from the device. A configuration can also be
stored on a local data card.
• In the top left-hand corner, you can see the Device box for the connected TDC device.
No information about the device is currently being displayed in this box because the
connection is yet to be established.
• In the bottom left-hand corner, you can see the TDC device configuration. This is where
the connection settings are saved and the sensor interfaces are configured.
• The right-hand side is used for entries depending on the current processing context.
Page 44

6 COMMISSIONING
44
8021804/2017-11-27|SICK
TRANSLATION O F THE ORIGINAL IN STRUCTIONS | Telem atic Data Collector
Subject to change without notice
6.4.2 Establishing a connection to the TDC device
Start with establishing a connection to the connected TDC device. To do this, select the
COM port that has been used to connect the TDC device to the configuration PC.
Selecting the COM port in TDC Configurator
1. Open the Select communication port window via Device
Connect.
Note
2. Select the COM port that has been used to connect the TDC device to the configuration
PC.
If you are not sure which port has been used to connect to the configuration PC,
open up the device manager on the operating system in order to check the COM port
allocation.
3. Click OK to confirm.
Device data
As soon as the connection to the TDC device has been established, the device will appear
in the Device box along with details such as its IMEI and firmware version.
The connection status of the device will then be Connected.
Page 45

45
8021804/2017-11-27|SICK
Subject to change without notice
TRANSLATION O F THE ORIGINAL IN STRUCTIONS | Telematic Data Collector
Note
COMMISSIONING 6
Loading the standard parameters
At the initial commissioning stage, the standard parameters included on the connected
device as the factory settings will be automatically downloaded and transferred over to
the configuration software.
The standard parameters can then be adapted to the requirements of the individual
application. The bottom left-hand corner of the programming interface is now activated
and entries can be made.
Fig. 30: Loading the standard parameters
A note will appear in the status bar when the configuration has been loaded successfully.
Page 46

6 COMMISSIONING
46
8021804/2017-11-27|SICK
TRANSLATION O F THE ORIGINAL IN STRUCTIONS | Telem atic Data Collector
Subject to change without notice
6.5 Adjusting the standard parameters and configuring the interfaces
Parameters can be entered under the two tabs Settings and Telemetry Elements.
• The Settings tab is mainly used to configure the connection settings and movement
monitoring.
• The Telemetry Elements tab is used to configure the interfaces for peripheral devices
and to process the input signals.
6.5.1 General settings
It is recommended to edit the standard parameters under the Settings tab from the top
down.
The parameters are displayed in a tree structure, which offers the user guidance for the
configuration process.
6.5.1.1 General
The General section contains information about the TDC device. This makes it easier to
identify and manage each individual TDC device when multiple devices are in use. This is
also where phone numbers are entered for SMS alerts.
Last edited
From the Last edited section, it is possible to find out which user was last to edit the
parameters and when. The name of the user logged on to the operating system at the
time of processing is displayed here..
Note
The last time the parameters were edited and the corresponding user are shown for all
of the parameters under the Settings tab.
Page 47

47
8021804/2017-11-27|SICK
Subject to change without notice
TRANSLATION O F THE ORIGINAL IN STRUCTIONS | Telematic Data Collector
Note
Note
COMMISSIONING 6
General
Enter a meaningful name for the device in the Device name field (e.g., the installation
▸
location).
A short name for the device can be stored in the Device identification field. Do not
▸
select the vehicle registration number as the short name, as these are subject to
change and cannot be used as a way to clearly identify the device.
Enter the phone number of the contact person responsible for the TDC device in the
▸
Admin phone num. field.
If the Daily reset enabled checkbox is checked, the device's memory will be deleted
▸
every day.
Hovering the cursor over an input field will bring up a short description.
Alerting
Up to five phone numbers can be saved in the Alerting section. If a real-time alarm is
triggered, the TDC device will send SMS messages to these numbers.
The specific sensors that should trigger an alarm under specific input conditions can be
defined via corresponding telemetry elements (for further information on this, refer to the
next chapter).
Page 48

6 COMMISSIONING
48
8021804/2017-11-27|SICK
TRANSLATION O F THE ORIGINAL IN STRUCTIONS | Telem atic Data Collector
Subject to change without notice
6.5.1.2 GPRS connection data
In the Connectivity section, specify how the SIM card should connect to the SICK or
customer server.
Note
GPRS data for applications in EU countries
If the TDC device is being used in an EU country, the GPRS access data for the SICK
server is automatically stored when the standard parameters are uploaded. The Access
Point Name is preset in the APN Name field in the Connectivity / GPRS section. The
user name and password for the access point are not displayed, however.
There is an explanatory text on the right-hand side of the input fields pointing out that
there is no input required here if the device is being used in an EU country.
The content in the fields must not be changed.
The Reset to defaults option restores the access data for the SICK cloud.
Page 49

COMMISSIONING 6
49
8021804/2017-11-27|SICK
Subject to change without notice
TRANSLATION O F THE ORIGINAL IN STRUCTIONS | Telematic Data Collector
GPRS data for applications in countries outside of the EU
If the TDC device is being used in a country outside of the EU, the user-inserted SIM card
from the telecommunications provider in the respective country will need to be configured.
After the standard parameters have been uploaded, the fields in the Connectivity / GPRS
section will be left empty.
The telecommunications provider in the respective country will need some information in
advance, which can be found in the checklist to the right of the input field. The details that
need to be passed on to them include – among others - the IP address of the SICK server.
In return, the telecommunications provider will provide the APN (Access Point Name)
along with the user name and password.
Fig. 31: Requesting GPRS connection data for applications in countries outside of the EU
Insert the information provided by the telecommunications provider in the
▸
corresponding fields in the Connectivity / GPRS section.
Page 50

6 COMMISSIONING
50
8021804/2017-11-27|SICK
TRANSLATION O F THE ORIGINAL IN STRUCTIONS | Telem atic Data Collector
Subject to change without notice
Saving MQTT access data from the customer server
If the TDC device is to be accessed by a customer server, the MQTT access data will need
to be entered in the Connectivity / MQTT section. There is a checklist here too offering
assistance with inputting this information.
1. Enter the IP address and port of the MQTT broker installed on the customer server.
2. Check the Use custom MQTT credentials checkbox if a user name and password need
to be entered when logging in to the MQTT broker.
Page 51

51
8021804/2017-11-27|SICK
Subject to change without notice
TRANSLATION O F THE ORIGINAL IN STRUCTIONS | Telematic Data Collector
6.5.1.3 Tracking
COMMISSIONING 6
Save details relating to movement monitoring in the Tracking section.
GPS accuracy / GPS sampling rate settings
For TDC-B100 /TDC-B200 devices, GPS is activated when the standard parameters are
being loaded. The settings relating to GPS accuracy can be adjusted as required.
1. Use the parameters in the Tracking / GPS / Moving and Tracking / GPS / Stopped
sections to set the GPS sampling rate.
2. Use the Max DOP (DOP = Dilution of precision) parameter to configure the GPS
accuracy.
Note
With TDC-M100 TDC devices, there are no GPS settings available.
Page 52

6 COMMISSIONING
52
8021804/2017-11-27|SICK
TRANSLATION O F THE ORIGINAL IN STRUCTIONS | Telem atic Data Collector
Subject to change without notice
NOTE
FMS
Fleet management systems can also be connected via the TDC device's CAN interface.
Fleet management systems are interfaces that can be used to access vehicle data from
a vehicle's CAN bus.
The tasks assumed by a fleet management system include position detection and service
life identification, route tracking, monitoring of fueling data, and collection and processing
of diagnostics data, which is continually recorded during journeys. This list also includes
customer-specific toll billing and economic journey analysis.
1. Check the Enabled checkbox to activate the CAN connection.
2. In the Interface field, select the specific CAN interface of the TDC device to which the
vehicle data should be transmitted.
For more detailed information on integrating your fleet management system in the FMS
section, please get in touch with your SICK sales partner.
Page 53

53
8021804/2017-11-27|SICK
Subject to change without notice
TRANSLATION O F THE ORIGINAL IN STRUCTIONS | Telematic Data Collector
6.5.2 Configuring the interfaces
The interfaces for the sensors connected to the TDC device can be configured under the
Telemetry Elements tab. As a general rule, digital and analog sensors can be detected
and configured along with those connected via a CAN bus.
Getting started
Switch to the Telemetry Elements tab.
▸
All of the device inputs are displayed in a tree structure. The configuration software
automatically detects which inputs are in use and issuing an input signal. Any inputs
issuing an input signal are identified in the tree structure by a green circle icon. A red
circle icon is used to indicate that an input is not in use.
COMMISSIONING 6
6.5.2.1 What are telemetry elements?
At least one telemetry element needs to be set up for each interface to enable signal
values to be transmitted to the connected server.
A telemetry element contains details on the physical interface as well as details on the
logical processing of incoming signals.
• Details on the physical interface may include the type of signal, the type of sensor
connected, and the voltage supply source.
• Details on the logical processing of the sensor signal cover the conditions which have
to be met for a signal value to be transmitted and/or a real-time alarm to be triggered,
for example. The conditions are defined using so-called triggers.
Note
By setting up several telemetry elements for an interface, it is possible to configure
various ways of processing one and the same sensor signal.
Page 54

6 COMMISSIONING
54
8021804/2017-11-27|SICK
TRANSLATION O F THE ORIGINAL IN STRUCTIONS | Telem atic Data Collector
Subject to change without notice
Example 1
Example 2
For the telemetry element shown in the following diagram, no trigger has been defined for
a digital signal (Trigger = None).
Fig. 32: Telemetry element for transmission of all sensor data to the cloud
• The TDC device will not transmit the received signal values immediately. Instead, it and
will initially store them for the specified period. All values recorded within that period
will subsequently be transmitted to the server.
• In the example shown, the signal values will be transmitted every 3,600 seconds.
In the following example, three telemetry elements have been set up for one interface.
Fig. 33: Telemetry elements for triggering, real-time alarms, and activating outputs
• In order to avoid all of the signal values always being transmitted to the server, a trigger
has been defined in the first telemetry element. This ensures that the recorded signal
values are only transmitted once a certain condition has been met. In the example
shown, the transmission is linked to a change in the signal values (Trigger = On Change).
This means that the transmission will be triggered as soon as there is a change in the
signal values – regardless of the time frame set.
Owing to the large volume of data, this will lay the foundations for meaningful
monitoring in the cloud. Occuring anomalies can be identified sooner.
Page 55

55
8021804/2017-11-27|SICK
Subject to change without notice
TRANSLATION O F THE ORIGINAL IN STRUCTIONS | Telematic Data Collector
Note
COMMISSIONING 6
• Rather than defining the transmission of data to the cloud, the second telemetry
element defines the triggering of a real-time alarm when there is a change in the signal
values (Trigger is also set as On Change).
• Under the same conditions (when there is a change in the signal values), a third
telemetry element activates an output in order to trigger a transducer in the event of an
alarm, for example.
Analog signals can have any values within a particular range, for which corresponding
telemetry elements can be defined with conditions for transmission to the cloud and/or
real-time alarms.
Fig. 34: Analysis of analog signal values in telemetry elements
6.5.2.2 Configuring a telemetry element for a digital signal
The following example uses a digital sensor to illustrate the steps required to configure
an interface.
Getting started
1. Under the Telemetry Elements tab, mark the input to which the digital sensor is
connected.
2. Click on the Add button.
A telemetry element is set up underneath the interface. The input fields used to
configure the telemetry element are shown on the right-hand side.
Page 56

6 COMMISSIONING
56
8021804/2017-11-27|SICK
TRANSLATION O F THE ORIGINAL IN STRUCTIONS | Telem atic Data Collector
Subject to change without notice
Note
Note
To the right of the input fields used for interface definition, there is a window containing
details on the expected bandwidth for data transmission. The values are statistical values
which are calculated on the basis of the sensors connected to the TDC device.
The Description window contains a brief description of each of the configured interface
parameters.
It is impossible to describe all of the input parameters available in the following sections.
For this reason, it is recommended that you use the explanations provided for each of
▸
the fields when you are entering information. You can see these by hovering the cursor
over the respective input field.
Physical interface details
1. Enter a meaningful name for the telemetry element in the Description field.
2. When a telemetry element is set up, the system assigns a unique identifier in the Name
field. This cannot be changed manually.
3. The interface that is currently selected is preset in the Signal source field.
4. In the Sensor type field, select the type of sensor that is connected to the interface.
The drop-down list includes a range of SICK sensors.
In the example, we are selecting a UM18 digital sensor. Once a SICK sensor has been
selected, the majority of the parameters under Conversion, Filtering, and Sampling
are preset.
Note
If the sensor you are looking for does not appear in the list, select the option Standard
digital sensor (for a digital sensor). Default values will be entered for the parameters,
which will then need to be updated with the correct data for the sensor in question.
Page 57

57
8021804/2017-11-27|SICK
Subject to change without notice
TRANSLATION O F THE ORIGINAL IN STRUCTIONS | Telematic Data Collector
Note
COMMISSIONING 6
5. For SICK sensors, it is necessary to enter the TDC device interface being used for the
voltage supply to the sensor in the Power Supply field (for further information on this,
refer also to Chapter 5.1.4 Connecting the TDC device to SICK sensors).
A list of all the possible voltage supply interfaces will be displayed for the type of device
selected.
Select the proper interface.
Conversion
1. When a SICK sensor is selected, the corresponding signal type will be automatically
entered in the Signal kind field. This is Digital in the example shown.
The signal type entered can be updated accordingly for sensors that can emit both
analog and digital signals.
2. The value displayed in the Threshold field indicates the value used as the threshold
for processing a digital signal. In the example shown, this value is 5 V. If the value
falls below the threshold, the input value is taken and displayed as an output value of
0 (status: Low) and if the value exceeds the threshold, the input value is taken and
displayed as a constant output value of 1 (status: High).
The relevant input fields will be displayed when analog signals are being processed.
Filtering
The filter settings will have been preset once a SICK sensor has been selected. These
settings can normally be adopted as they are.
The value in the Measuring interval field indicates the intervals at which signal values
should be transferred from the interface to the TDC device. The default setting is 500 ms,
in which case two signal values will be processed from the connected sensor within
1 second.
Page 58

6 COMMISSIONING
58
8021804/2017-11-27|SICK
TRANSLATION O F THE ORIGINAL IN STRUCTIONS | Telem atic Data Collector
Subject to change without notice
Trigger
Meaning
The trigger applies when the current signal value differs from the previous
signal value by more than the value set under the Threshold parameter.
The trigger applies when the current signal value falls within the range set
using the Upper Limit and Lower Limit parameters.
The trigger applies when the current signal value is above or below the range
set using the Upper Limit and Lower Limit parameters.
The trigger applies when the current signal value falls within the range set
is above or below this range.
The trigger applies when a connected application has been launched on the
TDC device.
The trigger applies when the current signal value is above or below the range
This trigger is only applicable when analog signals are being processed.
Sampling
The processing method for the signal values is specified in the Sampling section.
Applying
all values
Using
triggers
1. If all of the signal values are to be transmitted to the server without any restrictions,
2. The Time sample period field is used to specify the amount of time for which the signal
If, however, the signal values are to be transmitted only when certain conditions apply,
this will need to be set up using the Trigger field. Depending on which trigger is selected,
further settings may be required.
there is no need for any triggers to be set. The setting in the Trigger field should be left
as None.
values are to be stored before being transmitted to the cloud server. With the default
setting, the signal values will be transmitted every 3,600 seconds.
You can select from the following triggers for processing signals:
OnChange
OnEnter
OnExit
OnBoth
OnStartup
Hysteresis
Tab. 20: Triggers for processing signals
using the Upper Limit and Lower Limit parameters OR when the signal value
set using the Upper Limit and Lower Limit parameters in line with the
principle of hysteresis.
Page 59

59
8021804/2017-11-27|SICK
Subject to change without notice
TRANSLATION O F THE ORIGINAL IN STRUCTIONS | Telematic Data Collector
Transmitting data to
the server
Configuring SMS alerts
COMMISSIONING 6
Determining action
In the Action section, specify how the input signal is to be processed by the telemetry
element when the previously defined conditions have been met.
For transmitting data to the cloud sever, MQTT Publish is preset as the transmission
mode in the Action field.
• If data is being transmitted to the SICK server, there is no need to specify the topic
structure.
• If data is being retrieved by a customer server, a custom topic can be added to the
MQTT Topic field.
Select the option SMSAlert for the Action field to have the telemetry element trigger
▸
a real-time alarm in the form of SMS messages. No further information is required.
Activating an output
SMS messages will be sent automatically to all phone numbers entered under
Settings
Select the option ActivateOutput for the Action field to have the telemetry element
▸
General.
activate an output.
Select the output to be activated in the Output field. All configured TDC device outputs will
be available for selection.
Page 60

6 COMMISSIONING
60
8021804/2017-11-27|SICK
TRANSLATION O F THE ORIGINAL IN STRUCTIONS | Telem atic Data Collector
Subject to change without notice
6.5.2.3 Copying a telemetry element
When setting up multiple telemetry elements for one interface, it is possible to copy and
adjust an existing element.
In the example shown below, we are copying the telemetry element for the data
transmission trigger and using it as the basis for the telemetry element for real-time
alarms.
Mark the telemetry element in the list.
1. Under the Telemetry Elements tab, mark the telemetry element to be copied. In the
example shown, this is the telemetry element configured previously.
2. Right-click to open the context menu and select the option Duplicate. This creates a
new telemetry element.
3. Amend the description for the telemetry element in the Description field. The unique
identifier will be assigned automatically and entered in the Name field.
4. Then it is just the settings for signal processing and the action to be performed that
need to be adjusted for real-time alarms. The other settings can all be left as they are.
Page 61

61
8021804/2017-11-27|SICK
Subject to change without notice
TRANSLATION O F THE ORIGINAL IN STRUCTIONS | Telematic Data Collector
6.5.2.4 Configuring a telemetry element for a motor signal
If a wire of the connecting cable for the voltage supply has been connected to the motor
ignition system (refer to Chapter 5.1.3 Connecting the TDC device to the ignition system),
the incoming signal will be detected at the corresponding input and configured as follows.
1. Mark the corresponding input under the Telemetry Elements tab.
2. Click on the Add button.
3. Assign a meaningful name to the telemetry element in the Description field. The
unique identifier will be assigned automatically and entered in the Name field.
4. Configure the interface by following the instructions provided for digital sensors.
5. Select Standard digital sensor as the type in the Sensor Type field and apply the
settings for a Digital signal as described in the previous chapter.
COMMISSIONING 6
6. In the Sampling section, select OnStartup or OnChange as the trigger, for example.
Page 62

6 COMMISSIONING
62
8021804/2017-11-27|SICK
TRANSLATION O F THE ORIGINAL IN STRUCTIONS | Telem atic Data Collector
Subject to change without notice
6.5.2.5 Configuring a telemetry element for a fuel level sensor
If a fuel level sensor manufactured by Omnicomm has been connected to the RS485
input, the input signal will be detected automatically and configured as follows.
1. Mark the corresponding input under the Telemetry Elements tab.
2. Click on the Add button.
3. Assign a meaningful name to the telemetry element in the Description field.
4. Click in the Signal source field and select the fuel level sensor. Numeric value will be
preset as the signal type.
5. Select the desired settings for Filtering, Sampling, and Action as described.
Page 63

63
8021804/2017-11-27|SICK
Subject to change without notice
TRANSLATION O F THE ORIGINAL IN STRUCTIONS | Telematic Data Collector
6.5.3 Configuring the internal sensors
Every TDC device has internal sensors which, for example, provide information about the
temperature or the voltage supply of the TDC device. This information can – in the same
way as external sensor data - be transmitted to the cloud server using corresponding
telemetry elements. This can be useful for identifying the potential risk of the TDC device
overheating at an early stage, for example.
The internal sensors are configured in the same way as the external device interfaces.
1. Mark the option Internal under the Telemetry Elements tab.
2. Click on Add to create a new telemetry element.
The following figure shows the settings for transmitting temperature values. In the
example, the temperature value is transmitted as a numeric value with Celsius as the unit
every 10 ms.
COMMISSIONING 6
Page 64

6 COMMISSIONING
64
8021804/2017-11-27|SICK
TRANSLATION O F THE ORIGINAL IN STRUCTIONS | Telem atic Data Collector
Subject to change without notice
6.5.4 Transferring the configuration to the TDC device
Finally, transfer the device parameters from the configuration software to the TDC device,
thereby permanently saving them on the device.
Select Parameter Write to device in the menu bar.
▸
Note
6.5.5 Saving the configuration on the PC
Note
6.5.6 Recording
Once the parameters have been transferred, the TDC device will shut down and start back
up automatically. This might take around 60 seconds.
Use the LED display to ensure proper operation.
▸
You can also save the configured and displayed settings in a configuration file on your PC.
The settings saved within this file can be loaded at a later date (if required) and
transferred to the TDC device.
1. Select the command Parameter
2. Select a directory and file name and then confirm your choice.
Select Parameter
to the connected TDC device.
Load from File to transfer the parameters from the configuration file
Write to File in the menu bar.
Note
All actions performed by the TDC device are recorded.
Select View Communication to open the log.
▸
Click on the Clear button to delete entries currently in the list.
Page 65

COMMISSIONING 6
65
8021804/2017-11-27|SICK
Subject to change without notice
TRANSLATION O F THE ORIGINAL IN STRUCTIONS | Telematic Data Collector
In the event that faults occur, the log file can come in useful for troubleshooting at the
first-level support stage.
Select Viewer LogFile to open the log.
▸
6.5.7 Displaying system information
Use the Summary display to view current device information and statuses.
To access this, select View Summary.
▸
Note
The details can be copied to the clipboard for later use.
Page 66

7 MONITORING
66
8021804/2017-11-27|SICK
TRANSLATION O F THE ORIGINAL IN STRUCTIONS | Telem atic Data Collector
Subject to change without notice
7 Monitoring
7.1 Setting up a customer account for the SICK online portal
Before you can log in and use the SICK online portal, you will first need to register with
SICK. Registration follows several steps:
Fig. 35: Setting up a customer account for the SICK online portal (flowchart)
1. Apply for a new customer account. When registering, you will need to name one of the
TDC devices you have procured along with company and user details.
You will receive a confirmation e-mail immediately informing you that the account will
be created within 24 hours.
2. You will receive another confirmation e-mail once your customer account has been set
up on the SICK page. This also contains your login details for the new customer
account.
3. When you log in to the SICK online portal for the first time, you will need to register all
of the TDC devices you have procured.
7.1.1 Applying for a customer account
The first step is to apply for a new customer account on the SICK online portal.
Getting started
1. To start the registration process, enter the following URL into your browser:
http://tdc.sick.com
The login window will open.
Page 67

67
8021804/2017-11-27|SICK
Subject to change without notice
TRANSLATION O F THE ORIGINAL IN STRUCTIONS | Telematic Data Collector
Tip
MONITORING 7
2. Click on the create an account link. This will take you to the SICK Registration
window.
Entering device information
When applying for a customer account, you only have to register one device – even if you
have procured multiple devices. Any other devices can be registered on the SICK online
portal at a later stage.
1. Under Device, enter the IMEI for one of the TDC devices you have procured. The IMEI
is a unique identifier for the TDC device and therefore a way of verifying you as a
customer. Once you have exited the field, the IMEI will be checked to ensure that it has
been entered correctly.
The IMEI can be found within your ordering information or on the identification plate.
Hover the cursor over the field for an input help. The number shown in red is there to
illustrate where exactly the IMEI can be found on the type label.
The specific number shown here is only an example. It does not correspond to a real
IMEI.
2. Under TDC Serial Number, enter the serial number for the TDC device, which can be
found on the identification plate. Again, hover the cursor over the field here for an input
help.
Page 68

7 MONITORING
68
8021804/2017-11-27|SICK
TRANSLATION O F THE ORIGINAL IN STRUCTIONS | Telem atic Data Collector
Subject to change without notice
Entering company and user details
Next, enter details for the company and the user. The user entered here will later be set
▸
up as a user with administrator rights on the SICK online portal.
Specifying the time zone
The gateway system always saves all measured values from the sensors in UTC, which
stands for Coordinated Universal Time. Using universal time makes it possible to calculate
or specify the time consistently anywhere in the world.
Taking UTC as the base time, each time zone can be specified in terms of the number of
hours it differs from another time zone. This way, the difference between a particular time
zone and universal time is indicated using "UTC+/- X hours".
The browser’s UTC timezone is preset in the corresponding field. In this example, the time
zone is UTC+1.00 (Amsterdam, Berlin, etc.).
Example
On the basis of this setting, all measured values in the analyses on the SICK online portal
will be displayed with an offset of UTC+1 hour (winter time) or UTC+2 hours (summer
time). If UTC-5.00 Eastern Time (US & Canada) were to be selected as the time zone
here instead, the offset displayed would be UTC-5.
Consider the local time in which sensor values should be displayed for monitoring and
▸
alter the suggested time zone accordingly.
A sensor records a measured value in New York at 05:00 local time. The measured value
is saved at 10:00 UTC.
• For a user based in Germany, where the time zone is set as UTC+1.00 (Amsterdam,
Berlin, etc.), the measured value will be given a time stamp of 11:00 (UTC+1) in their
analyses.
Page 69

MONITORING 7
69
8021804/2017-11-27|SICK
Subject to change without notice
TRANSLATION O F THE ORIGINAL IN STRUCTIONS | Telematic Data Collector
• If the user based in Germany generally wants to see the actual local time at which
measured values were recorded in New York, they will have to switch their time zone to
UTC-5.00 Eastern Time (US & Canada) accordingly.
Entering contact details
Under Contact Information, enter the e-mail address to which the confirmation e-mail
▸
containing the login details should be sent.
Note
Two further phone numbers can be added under the Phone tab.
Submitting the registration application
1. Confirm that you have read and agree to the terms and conditions of SICK Cloud.
2. Click on Register.
3. If the IMEI you entered does correspond to a device that has been ordered, the
registration application will be submitted. A message will pop up when this has
happened.
Page 70

7 MONITORING
70
8021804/2017-11-27|SICK
TRANSLATION O F THE ORIGINAL IN STRUCTIONS | Telem atic Data Collector
Subject to change without notice
Confirmation e-mail
A confirmation e-mail will be sent automatically to the e-mail address you entered on the
registration form.
Click on the Confirm link in this e-mail when you have received it. You will see a message
indicating that your registration application will be processed by SICK within 24 hours.
7.1.2 Notification about your customer account
If all of the information you submitted is deemed to be correct and in order, a customer
account will be created for you with a user name and password.
An e-mail containing your login details will be sent automatically to the e-mail address you
entered on the registration form.
Page 71

71
8021804/2017-11-27|SICK
Subject to change without notice
TRANSLATION O F THE ORIGINAL IN STRUCTIONS | Telematic Data Collector
7.2 Configuring the TDC Management System
The TDC Management System is the central platform of the SICK online portal. It allows
connected SICK sensors to be monitored on the basis of parameters. For this purpose,
all information relating to the connected sensors is provided with a time stamp and GPS
information.
The management platform will at first be empty. Subsequently, you will have to create one
or more dashboards for monitoring purposes, specifying which telemetry elements are to
be analyzed within them. Key figures are displayed using widgets.
If multiple TDC devices are in use, the first step will be to register them on the
management platform.
7.2.1 Logging in to the TDC Management System
Log in to the TDC Management System.
Getting started
1. Enter the following URL into your browser: http://tdc.sick.com
The login window will open.
2. Enter the user name and password that were sent to you by e-mail.
3. Click on Sign in. The SICK online portal opens up with the TDC Management System.
MONITORING 7
The menu bar at the top includes the central workspaces for the management platform.
It is visible in all working contexts.
The name of the user who is logged in is shown on the right-hand side of the menu bar.
The user icon allows you to view the user data and to log out of the TDC Management
System.
Page 72

7 MONITORING
72
8021804/2017-11-27|SICK
TRANSLATION O F THE ORIGINAL IN STRUCTIONS | Telem atic Data Collector
Subject to change without notice
7.2.2 Registering additional TDC devices
At this point in time, only one TDC device is registered on the TDC management platform.
That device is the one that was entered when the customer account was created (for
further information on this, refer to 7.1 Setting up a customer account for the SICK online
portal).
If you have bought multiple TDC devices that you would like to monitor on the platform,
it will now be necessary to register them there.
1. Click on the gear icon in the menu bar and select the option Devices. The list of
registered TDC devices will open. It will include the TDC device that was entered at the
registration stage (for further information on this, refer to Chapter 7.1.1 Applying for a
customer account).
Tip
2. Click on the plus icon in the window. The New devices window will open.
3. Register the TDC devices you have procured by entering the serial and IMEI numbers.
It is not necessary to enter the data manually. Instead, you can use the electronic
document that you have received after making the purchase to make it easier to input
the data. This document includes a list of the serial and IMEI numbers for the devices
procured.
4. Copy the entries in the list and paste them in the New devices window.
5. Complete the device registration process by clicking on Send.
Page 73

73
8021804/2017-11-27|SICK
Subject to change without notice
TRANSLATION O F THE ORIGINAL IN STRUCTIONS | Telematic Data Collector
7.2.3 Configuring a dashboard
7.2.3.1 Creating a dashboard
Create a dashboard from the home page on the TDC management platform. You can
always configure multiple dashboards on the TDC platform.
1. Switch back to the home page. To do this, click on TDC Management System in the
menu bar.
MONITORING 7
2. In the Dashboards section, click on New Dashboard.
3. Enter a meaningful name for the dashboard (e.g., the name of a TDC device location).
4. Click on Save. The empty dashboard will open.
Page 74

7 MONITORING
74
8021804/2017-11-27|SICK
TRANSLATION O F THE ORIGINAL IN STRUCTIONS | Telem atic Data Collector
Subject to change without notice
Dashboards have the following structure:
• All of the telemetry elements to be monitored and analyzed on the dashboard will later
appear on the left-hand side.
• The content to be monitored in individual widgets is specified on the right-hand side.
7.2.3.2 Defining the structure for displaying telemetry elements on the dashboard
You can choose how telemetry elements are displayed by creating a tree structure using
what are known as units.
Getting started
1. Switch back to the home page of the management system. To do this, click on TDC
Management System in the menu bar.
2. In the Units section, click on New Unit. All TDC devices with the telemetry elements
configured in TDC Configurator are shown in a list. In the following example, only one
TDC device has been registered on the TDC Management System.
Defining the structure
On the left-hand side of the window, define the structure for listing the telemetry elements
on the dashboard.
1. Click on the icon with the three dots to select Add Unit to add another level underneath
the Root level.
2. Enter a meaningful name for the level (e.g., the name of the TDC device).
Page 75

MONITORING 7
75
8021804/2017-11-27|SICK
Subject to change without notice
TRANSLATION O F THE ORIGINAL IN STRUCTIONS | Telematic Data Collector
Assigning telemetry elements
1. Drag the telemetry elements displayed underneath the relevant TDC device on the
right-hand side and drop them on the correct structure level.
2. Switch back to the dashboard. To do this, click on the speedometer icon in the menu
bar and select the dashboard you have just created.
The applied telemetry elements will appear within the defined structure in the left-hand
section.
Page 76

7 MONITORING
76
8021804/2017-11-27|SICK
TRANSLATION O F THE ORIGINAL IN STRUCTIONS | Telem atic Data Collector
Subject to change without notice
7.2.4 Visualizing key figures using widgets on the dashboard
Data is visualized on the dashboard in the form of what are known as widgets. Technically
speaking, a widget is a graphics window holding a link to a telemetry element.
Widgets can be positioned anywhere within the window and their size can be adjusted as
desired. Different types of widgets are used for different types of data.
Go to the toolbar on the dashboard and click on Add Widgets.
▸
The Add Widget window will open.
This window is divided into four tabs, which you will be guided through in the style of a
wizard when you press Next.
1. Under the Type tab, specify the type of widget.
2. Assign the correct telemetry element under the Telemetry Element tab.
3. Enter the name of the widget under the Basic settings tab and add a more detailed
description if desired.
4. The details to be provided under the Configuration tab depend on the type of widget
selected. Filter settings and analysis time frames can be specified here, for example.
7.2.4.1 Adding key figures for sensor data
A sensor value is visualized in the form of the following widget, which provides a quick
way of checking whether a sensor is working correctly and delivering measurement data.
1. Under the Type tab, select Latest value as the type of widget.
Page 77

77
8021804/2017-11-27|SICK
Subject to change without notice
TRANSLATION O F THE ORIGINAL IN STRUCTIONS | Telematic Data Collector
Note
MONITORING 7
2. Under the Telemetry Elements tab, select the telemetry element to be visualized in
the widget.
The list includes all telemetry elements, showing their name and the IMEI for the
corresponding TDC device in brackets.
If there is a large number of telemetry elements, use the search function to narrow
▸
down the list and find specific elements.
3. Enter a name for the widget under the Basic settings tab.
4. For Latest value widgets, you can specify whether or not an icon should be displayed
in the widget under the Configuration tab.
5. To finish creating your new widget, click on Save.
The widget will then be shown on the dashboard. In the following example, the widget
is visualizing the last measured value from a digital sensor.
Page 78

7 MONITORING
78
8021804/2017-11-27|SICK
TRANSLATION O F THE ORIGINAL IN STRUCTIONS | Telem atic Data Collector
Subject to change without notice
7.2.4.2 Adding key figures for alarms
The following widget reveals how often a sensor has triggered a real-time alarm in the
form of SMS messages.
1. Under the Type tab, select SMS alarms as the type of widget.
2. Under the Telemetry Elements tab, select the telemetry element that has been
configured for alarms in TDC Configurator.
3. Under the fourth tab – Configuration – enter the period within which alarms should be
analyzed and displayed in the widget. Two different periods can be analyzed using the
First value filter and Second value filter fields.
4. To finish creating your new widget, click on Save.
The widget is visualizing the number of alarms from the past hour (Last 1 h option in
the First value filter field) and the number of alarms from the last 30 days (Last 30 d
option in the Second value filter field).
Page 79

79
8021804/2017-11-27|SICK
Subject to change without notice
TRANSLATION O F THE ORIGINAL IN STRUCTIONS | Telematic Data Collector
The bell icon in the menu bar gives you a list of all SMS alarms.
7.2.4.3 Adding diagrams
MONITORING 7
Widgets can also include pie charts as a way of documenting proper operation of the TDC
device, for example. In the following example, we create a widget that visualizes the
voltage supply to a TDC device. An internal sensor built into the TDC device provides this
information (for further information on this, refer also to Chapter 6.5.3 Configuring the
internal sensors).
1. Under the Type tab, select Pie chart as the type of widget.
2. Under the Telemetry Elements tab, select the telemetry element that has been
configured to transmit the voltage currently being applied to the TDC device.
Page 80

7 MONITORING
80
8021804/2017-11-27|SICK
TRANSLATION O F THE ORIGINAL IN STRUCTIONS | Telem atic Data Collector
Subject to change without notice
3. Enter the period to be analyzed, e.g., the last 24 hours, in the Period field under the
Configuration tab.
Use the table at the bottom to save the value that the sensor should deliver. Click on
the Edit button to make an entry. Select the correct operator and enter the value
expected in the Value column. In the example here, this value is 24 V.
4. To finish creating your new widget, click on Save.
The chart is a way of visualizing the operational readiness of the TDC device over the
past 24 hours, providing a quick way of checking how long the TDC device was without
voltage and was therefore not operational.
Page 81

81
8021804/2017-11-27|SICK
Subject to change without notice
TRANSLATION O F THE ORIGINAL IN STRUCTIONS | Telematic Data Collector
7.2.5 Analyzing sensor data in detail
From the list of telemetry elements on the left-hand side of the dashboard, detailed
information on the connected sensors can be displayed and analyzed.
A telemetry element can be selected from the structure defined for your dashboard or
from a list containing all telemetry elements configured for the TDC devices. You can
use the two icons above the list to switch between these two views.
1. Click on the Show devices view icon. All of the telemetry elements for the registered
TDC devices will be displayed.
2. Mark a telemetry element in the list. In this example, a digital sensor is selected.
The signal statuses provided by the sensor can be analyzed for different periods. In
addition to this, a customized time window can be defined.
MONITORING 7
The calendar icon can be used to compare two different periods.
Collapse the list of telemetry elements using the menu icon to get more space on the
▸
screen for data analysis.
Page 82

7 MONITORING
82
8021804/2017-11-27|SICK
TRANSLATION O F THE ORIGINAL IN STRUCTIONS | Telem atic Data Collector
Subject to change without notice
7.2.6 Administering the management platform
On the TDC Management System, it is possible to create multiple dashboards so your
sensor data can be visualized. More widgets can be added to a dashboard at any point.
Widgets that have already been placed on a dashboard can be edited or deleted. More
TDC devices can also be added.
In this chapter, you will get a brief overview of the editing options available.
Note
1. Adding another dashboard
Click on the speedometer icon in the menu bar and select New Dashboard. The Create
▸
Dashboard window will open (refer to 7.2.3.1 Creating a dashboard).
2. Opening a dashboard
Click on the speedometer icon in the menu bar and select the desired dashboard from
▸
the list of dashboards that have been created.
The dashboard will open along with all of its widgets.
3. Editing widgets
Each widget has an edit icon.
• Click on Edit Widgets to open a widget and then change a filter setting or analysis
period, for example.
• Click on Delete Widgets to remove a widget from the dashboard.
Click on API Data to view the API call returning the sensor data (refer also to 7.4
Transferring data to a customer application using an API interface).
4. Adding a widget
Click on Add Widget in the menu bar to add another widget to the dashboard.
▸
5. Deleting a dashboard
Click on the edit icon on the dashboard and select the command Delete Dashboard.
▸
6. Adding more TDC devices
Click on the gear icon in the menu bar and select the option Devices (for further
▸
information on this, refer to Chapter 7.2.2 Registering additional TDC devices).
Page 83

83
8021804/2017-11-27|SICK
Subject to change without notice
TRANSLATION O F THE ORIGINAL IN STRUCTIONS | Telematic Data Collector
7.3 Working with fleet management
7.3.1 Position display
The fleet management platform is mainly used for position detection, service life
identification, route tracking, and monitoring of fueling data for vehicles. It can provide
you with a wealth of information about the vehicles in your fleet. The fleet management
platform is opened from within the TDC Management System.
The chapter that follows concentrates on a few of the main analyses as well as general
navigation.
Getting started
Click on the fleet management icon in the menu bar of the SICK management system.
▸
The fleet management platform will open up in a new tab.
At the top of the window, there are several tabs covering the various aspects of fleet
management. When you open up fleet management, the Position display tab will be
active.
MONITORING 7
Once open, the Position display tab has the following structure:
• In the bottom left-hand corner, there is a list of all vehicles in your fleet. The vehicles
will have the names you assigned to the corresponding telemetry elements in TDC
Configurator.
Above that, there are input fields that can be used to conduct a specific Vehicle
search.
The icons in the top section (Tools/settings) can be used to open a list containing
detailed information on vehicles.
• To start with, the current locations of all vehicles will be visualized on a Google Maps
map in the middle section. When one vehicle has been selected, it will be possible to
track its route on the map.
The map can be panned in the window using the mouse. The icons on the map can be
used to change the view.
• The Calendar on the right-hand side can be used to narrow down the time frame to
individual days. The section underneath that displays more detailed information based
on the working context selected.
Page 84

7 MONITORING
84
8021804/2017-11-27|SICK
TRANSLATION O F THE ORIGINAL IN STRUCTIONS | Telem atic Data Collector
Subject to change without notice
7.3.2 Displaying the vehicle list with detailed information
Click on the Current position icon on the left-hand side of the Tools/settings section.
▸
The list containing detailed information on all vehicles will open. Each vehicle is displayed
in a row containing the current vehicle positions, the driver, and the journey times for the
last trip. The list also provides information on the vehicle such as the mileage, the number
of kilometers covered, and the maximum speed. Vehicle data is read from the vehicle's
CAN bus if fleet management has been configured in TDC Configurator.
7.3.3 Displaying current vehicle fuel levels
Click on the Current fuel level icon on the left-hand side of the Tools/settings section.
▸
A list will open that can be used to monitor fueling data. You can view the tank capacity
and the current fuel level in liters and as a percentage for each vehicle at any given time.
Page 85

85
8021804/2017-11-27|SICK
Subject to change without notice
TRANSLATION O F THE ORIGINAL IN STRUCTIONS | Telematic Data Collector
7.3.4 Accessing information about a specific vehicle
To start with, the Position display tab visualizes all vehicles in the fleet.
There are two ways to narrow the position display feature down to include data for just
one vehicle:
• Mark the vehicle in the Vehicle list in the bottom left-hand corner.
• Find the vehicle you are looking for using the Vehicle search function.
Accessing route information for a vehicle
Once a vehicle has been selected, the position display view will change.
MONITORING 7
• A toolbar containing predefined reports for the selected vehicle will appear underneath
the Position display tab.
• The map will now show the route most recently covered by the vehicle.
• The Info section on the right-hand side contains information on the current location of
the selected vehicle. The event last sent by the TDC device is displayed, providing an
effective way of checking whether the TDC device is operating properly.
If the fleet management system has been configured in TDC Configurator (for further
information on this, refer to Chapter 6.5.1.3 Tracking), the current mileage is accessed
from the vehicle's CAN bus and is displayed here.
Page 86

7 MONITORING
86
8021804/2017-11-27|SICK
TRANSLATION O F THE ORIGINAL IN STRUCTIONS | Telem atic Data Collector
Subject to change without notice
Displaying a route
In the calendar in the top right-hand corner, select the day for which you would like to
▸
view the vehicle's route on the map.
Displaying details on a selected position
If you click on a particular position along the route, a pop-up window will appear that
▸
contains details on the position selected.
Page 87

MONITORING 7
87
8021804/2017-11-27|SICK
Subject to change without notice
TRANSLATION O F THE ORIGINAL IN STRUCTIONS | Telematic Data Collector
Displaying a list of journeys
1. Click on the List of journeys icon in the toolbar for the Position display tab to show the
movements of a vehicle over a given period of time.
2. First, enter the period of time you are interested in.
3. Then, click on the Report button. A list of journeys will be generated and displayed in a
separate window.
In the list, you can see information such as the start and end location for each route,
the mileage at the end of the journey, and the kilometers covered.
Page 88

7 MONITORING
88
8021804/2017-11-27|SICK
TRANSLATION O F THE ORIGINAL IN STRUCTIONS | Telem atic Data Collector
Subject to change without notice
7.3.5 Accessing fuel consumption information
Determining fuel consumption is of central importance for successful fleet management.
Displaying consumption in a graph
The graphical display gives you an quick indication of unusual fuel consumption.
1. Under the Position display tab, select the vehicle and the day for which you want fuel
consumption information to be visualized.
2. Click on the Fuel graph icon in the toolbar for Position display.
If the graph shows a steady fall, this indicates that fuel consumption is regular.
Note
If the consumption graph shows a drastic drop within a short period of time, this may
be a sign that fuel is being stolen.
Page 89

MONITORING 7
89
8021804/2017-11-27|SICK
Subject to change without notice
TRANSLATION O F THE ORIGINAL IN STRUCTIONS | Telematic Data Collector
The level will jump up over a short period of time when refueling.
Generating a consumption report for a specific period
1. Under the Position display tab, select the vehicle for which you want to generate
a consumption report.
2. Click on the Fuel icon in the toolbar.
3. Set the period of time to be covered by the consumption report.
4. Click on the Report button. Fuel consumption information will be displayed for the
vehicle, with each day during the period selected having its own row.
The information covered in the list includes the number of kilometers traveled on the
day, the level at the beginning and end of a journey, and the fuel consumption.
Combined with details on speed, it is possible to quickly check whether or not the fuel
consumption seems plausible.
Page 90

7 MONITORING
90
8021804/2017-11-27|SICK
TRANSLATION O F THE ORIGINAL IN STRUCTIONS | Telem atic Data Collector
Subject to change without notice
7.3.6 Analyzing the kilometers covered
The Reports tab provides reports that can be used across departments to perform
analyses over longer periods of time. The vehicle data in these reports can be narrowed
down by driver or vehicle among other options.
In the following example, the number of kilometers traveled by one vehicle each day is
being analyzed.
1. Switch to the Reports tab.
2. On the left-hand side, select the department(s) to be analyzed. To do this, open up the
tree structure for the departments and check the checkboxes for users, vehicles, or
drivers.
3. Then, on the left-hand side, select the period of time to be analyzed. You can do this
either by using the date fields/selecting the predefined periods at the top or by keeping
the mouse button pressed and marking the period in the calendar. Days can be
marked across different months.
Page 91

MONITORING 7
91
8021804/2017-11-27|SICK
Subject to change without notice
TRANSLATION O F THE ORIGINAL IN STRUCTIONS | Telematic Data Collector
4. Next, in the middle section, select the report required. In this example, the FMS
kilometers report is opened.
This report includes the number of kilometers covered each day along with the start
and end date for each trip and the fuel consumption.
Page 92

7 MONITORING
92
8021804/2017-11-27|SICK
TRANSLATION O F THE ORIGINAL IN STRUCTIONS | Telem atic Data Collector
Subject to change without notice
Description
Returns input activities for given objects input in some period.
Path
/Feed/{b2bUsername}/{b2bPassword}/{externSystem}/
Inputs/InputActivity
Successful
response
Status code
200
MIME type
application/xml
B2B authentication
Status code
403
MIME type
application/xml
Status description
Authentication failed
Wrong parameters
Status code
400
MIME type
application/xml
Status description
Bad request
Unknown error
Status code
503
MIME type
application/xml
Status description
Service unavailable
Extern system parameter names
Parameter type
Parameter description
ObjectId
Integer
ID of the object
InputId
Integer
ID of input
DateTimeFrom
DateTime
UTC period from which input activity
will be searched
DateTimeTo
DateTime
UTC period to which input activity will
be searched
7.4 Transferring data to a customer application using an API interface
The REST-based platform API for the gateway system provides a number of ways of
connecting external applications to the SICK online portal.
As a general rule, communication with the platform API uses XML data format.
Requests sent to the REST platform are transmitted via the HTTP requests ContentType
and Accept in XML forms.
Responses to REST requests are likewise returned in XML data format.
As the REST service does not have its own encryption method, the HTTPS protocol is used
to guarantee that communication between external systems and the SICK online portal is
secure.
The B2B user name and password, and a B2B external system ID are used for
authentication on the REST platform.
Note
7.4.1 Input parameter
Please get in touch with the SICK Customer Support team to receive and activate the
connection data required to connect to the REST platform.
Testing REST services
SoapUI can be used to systematically test REST services free of charge. The application
provides a straightforward way of sending HTTPS requests and response analyses, and in
turn of configuring access to platform API services.
Parameters
required
failed response
response
response
Page 93

93
8021804/2017-11-27|SICK
Subject to change without notice
TRANSLATION O F THE ORIGINAL IN STRUCTIONS | Telematic Data Collector
XML request example
<?xml version='1.0' encoding='utf-8'?>
<InputActivityRequest>
<ObjectId>1234</ObjectId>
<InputId>1234</InputId>
<DateTimeFrom>2016-03-24T07:00:00Z</DateTimeFrom>
<DateTimeTo>2016-03-24T07:00:00Z</DateTimeTo>
</InputActivityRequest>
XML response example (success)
<Response xmlns:xsi="http://www.w3.org/2001/XMLSchema-instance"
xmlns:xsd="http://www.w3.org/2001/XMLSchema">
...
</Response>
XML response example (not success)
<Response xmlns:xsd="http://www.w3.org/2001/XMLSchema"
xmlns:xsi="http://www.w3.org/2001/XMLSchema-instance">
...
</Response>
7.4.2 Example for API call
MONITORING 7
The following example shows the API call returning the sensor data for the sensor with
ID 99 from 2017-08-01 until 2017-08-21. For further information on API calls from
the TDC Management System, refer to Chapter 7.2.6 Administering the management
platform.
Sample Response: [{"Time":"2017-08-
01T00:00:02+02:00","Value":"15.4"},{"Time":"2017-08-
01T00:00:12+02:00","Value":"15.4"},{"Time":"2017-08-
01T00:00:22+02:00","Value":"15.3"}, ...]
Page 94

7 MONITORING
94
8021804/2017-11-27|SICK
TRANSLATION O F THE ORIGINAL IN STRUCTIONS | Telem atic Data Collector
Subject to change without notice
Position No.
Topic structure
Explanation
1
Constant identifier
Fixed value = Wigo
2
IMEI of the TDC device
See the TDC device
3
Directional information
out: Data is sent from the TDC device
in: Data has to be input in the TDC device
4
MQTT ID of the sensor
Refer to the information in the configuration of the
sensor in question
Port
Explanation
1883
Standard port (with IANA reserved for use with MQTT)
8883
Standard port (use of MQTT with SSL encryption)
7.5 Accessing data from the TDC device via the MQTT interface
7.5.1 Description of the MQTT interface structure
Sensor data from the individual TDC devices is accessed via the MQTT protocol. MQTT
communication here is based on the concept of topics. This involves each MQTT message
being assigned a topic that acts as a unique identifier for that message (for further
information on this, refer to Chapter 3.3 Interfaces for integration into customer
applications).
Topics are simple strings that are separated by forward slashes to reflect a hierarchy of
sorts –similar to a simple URL.
TDC devices of the gateway system use the following topic structure:
Tab. 21: Topic structure of the MQTT protocol
Example
Notes
If a TDC device with
configured with the MQTT ID
message:
wigo/123456789/out/Pressure1
Measurement data is transmitted in text format with the numeric value followed by the
unit, e.g.,
4.5 kPa, 304 m, 0.045 kg.
Digital inputs are sent as note
From MQTT V 3.1, a user name and password can be assigned to the MQTT protocol.
Encryption can be taken care of over the network using SSL independently of the MQTT
protocol.
Ports
123456789 as its IMEI were to send pressure measurements
Pressure 1, the following topic would be assigned to the
1 for active and 0 for inactive.
Tab. 22: MQTT standard ports
Page 95

95
8021804/2017-11-27|SICK
Subject to change without notice
TRANSLATION O F THE ORIGINAL IN STRUCTIONS | Telematic Data Collector
7.5.2 Description of the MQTT protocol
Group
Text
Description
Modem/GPRS
Initializing and detecting modem...
Device is in process of detecting type of modem and
initializing it
Modem/GPRS
Modem could not be detected
Error condition when modem cannot be detected. Indicates
hardware malfunction.
Modem/GPRS
SMS system started
SMS send and receive subsystem ready
Modem/GPRS
Modem port opened at x baud
Modem port was successfully opened at baud rate of x
Modem/GPRS
Baud changed to x, reopening com port
Attempting to change baud rate of modem connection to x
Modem/GPRS
Modem detected: x
Statement revealing what kind of modem has been detected
Modem/GPRS
Telit modem driver started
Driver for "Telit" modem is started
Modem/GPRS
CREG is x
CREG status is x. CREG represents status of registration of
5 Registered, roaming
Modem/GPRS
CGREG is x
CGREG status is x. CGREG represents status of registration of
5 Registered, roaming
Modem/GPRS
Sim inserted!
SIM card is detected as inserted
Modem/GPRS
IMEI is x
IMEI of the modem
Modem/GPRS
CCID is '89423053014015087575'
Serial number of the SIM card
Modem/GPRS
Found default GPRS settings for inserted
SIM card
Automatic settings for internet access are used for inserted
SIM card
Modem/GPRS
SIM ready
SIM card is ready to be used
Modem/GPRS
GPRS> ActivationRequested
GPRS system is requesting activation
Modem/GPRS
GPRS> WaitActivationStart
GPRS system is waiting for activation to start
Modem/GPRS
GPRS> Activating
GPRS activation has started
Modem/GPRS
GPRS> Active
GPRS is active
Modem/GPRS
Assigned IP address is 'x'
IP address is assigned to device, x
Modem/GPRS
Telit->Connect request for socket 1...
TCP/IP socket connection to server is requested to modem
Modem/GPRS
Sync->Starting connection (x)...
Server synchronization system is requesting to start
connection to server
Modem/GPRS
Operator is x
Specifies current operator name
Modem/GPRS
Signal level is x
Specifies current GSM signal level
Sync->OnReceiveAuthResponse: x, y, z,
AuthOK=r
Device has received authentication response. Result is r
Sync->Connected and authenticated
Connection to server is fully established
WriteSlot: Data x bytes, Offsets y bytes
Device has sent a chunk of data records to server
Sync->Utc request RTT x ms
Device received time synchronization response from server
Bootloader
Checking for new FW in external flash...
At startup, bootloader checks if there is new firmware that
needs to be installed
Bootloader
Found new firmware with size: x B
Appears when bootloader detects new firmware to install
Bootloader
Checking CRC...
Bootloader starts checking integrity of new firmware
Bootloader
Erasing internal flash...
Bootloader is erasing internal flash in preparation for
installation
Bootloader
Flashing new FW...
Bootloader is installing new firmware
Bootloader
New FW successfully flashed!
New firmware installation has been completed successfully
Bootloader
Exiting bootloader...
Bootloader procedure is finished
MONITORING 7
GSM system. CREG can have the following statuses:
0 Not registered, not searching
1 Registered, home network
2 Not registered, searching
3 Registration denied
4 Unknown
GPRS system. CGREG can have the following statuses:
0 Not registered, not searching
1 Registered, home network
2 Not registered, searching
3 Registration denied
4 Unknown
Page 96

7 MONITORING
96
8021804/2017-11-27|SICK
TRANSLATION O F THE ORIGINAL IN STRUCTIONS | Telem atic Data Collector
Subject to change without notice
Group
Text
Description
Startup
Boot reason: x
Specifies reason for boot. Possible reasons:
POR/PDR
Startup
procedure
Recent Reset Count = x
Number of resets from the last time device worked for more
than 10 minutes without reset.
Startup
procedure
App->Received last ON time: x
Shows last time device was ON, if possible to determine
Flash->FW Sector check completed
FLASH subsystem has completed FLASH memory check
System status
HeapMonitor->FH: x
HeapMonitor reports quantity of available heap memory of x
Configuration
Config->Loaded successfully (V:x, T:y)
Configuration was loaded, of type x and time stamp y.
Positioning/GPS
Positioning->Initialized (Mod: x
DiscontinuityFilter: y)
Positioning services were initialized
procedure
Tab. 23: MQTT protocol description
Undefined
Wake-up from standby
Reset while standing by
Low power management reset
WWDG
IWDG
Software
NRST pin
Brown-out
Page 97

97
8021804/2017-11-27|SICK
Subject to change without notice
TRANSLATION O F THE ORIGINAL IN STRUCTIONS | Telematic Data Collector
8 Maintenance
WARNING
WARNING
8.1 Maintenance during operation
8.1.1 Visual inspection
Perform the following checks at regular intervals:
Checking plug connectors
Unscrew the sensor plug connectors and check the male contacts for moisture and
▸
traces of corrosion.
Plug connectors damaged by corrosion
Plug connectors that have been damaged by corrosion must be replaced straight away.
Corroded plug connectors can have a major negative impact on the sensor.
MAINTENANCE 8
Checking cables
Regularly check the electrical installation. Check that all cable connections are securely
▸
attached.
Loose connections or scorched cables
Defects such as loose connections, scorched cables, or cables with damaged
▸
insulation must be corrected or replaced immediately.
Checking screw connections
Make sure that screw connections are secure.
Page 98

8 MAINTENANCE
98
8021804/2017-11-27|SICK
TRANSLATION O F THE ORIGINAL IN STRUCTIONS | Telem atic Data Collector
Subject to change without notice
WARNING
8.1.2 Cleaning
Recommendation
Sensors in the
TiM series
TDC devices
The TDC devices are maintenance-free. Maintenance is not necessary to ensure proper
operation.
Depending on the surroundings, it is recommended that dust be removed from the
housing.
SICK sensors
SICK sensors in the TiM series are maintenance-free. Maintenance is not necessary to
ensure compliance with laser class 1.
To achieve the full optical output of the sensor, the front screen should be regularly
checked for contamination.
Fig. 36: Cleaning SICK sensors in the TiM series
Switch off the device during cleaning.
▸
Get rid of any contamination on the front screen to avoid incorrect measurements.
▸
Wipe the front screen with a soft, wet sponge.
▸
Then dry the front screen with a clean cloth.
▸
Damage to the front screen
The front screen is made of polycarbonate. The optical output is weakened by scratches
and streaks on the front screen.
Do not use aggressive cleaning agents.
▸
Do not use abrasive cleaning agents.
▸
Avoid scratching and chafing movements on the front screen.
▸
Page 99

MAINTENANCE 8
99
8021804/2017-11-27|SICK
Subject to change without notice
TRANSLATION O F THE ORIGINAL IN STRUCTIONS | Telematic Data Collector
Capacitive proximity
sensors
SICK capacitive proximity sensors are maintenance-free. We recommend that you clean
the interfaces at regular intervals.
Fig. 37: Cleaning SICK capacitive proximity sensors
Switch off the device during cleaning.
▸
Get rid of any contamination on the interface to avoid incorrect measurements.
▸
Wipe the interface with a soft, wet sponge.
▸
Then dry the interface with a clean cloth.
▸
Page 100

8 MAINTENANCE
100
8021804/2017-11-27|SICK
TRANSLATION O F THE ORIGINAL IN STRUCTIONS | Telem atic Data Collector
Subject to change without notice
HAZARD
HAZARD
NOTE
Part No.
Description
5337536
EAD PST2100SMA RA GSM antenna, penta band
8.2 Replacing components
8.2.1 Basic procedure
Disconnect the power to the system
Make sure the voltage supply to the devices is disconnected throughout the entire time
▸
that you are carrying out maintenance and repair work.
Risk of injury due to electrical current
Only a qualified electrician or trained person working under the guidance and supervision
of a qualified electrician is permitted to work on electrical systems or equipment, and they
must comply with the electrical regulations.
Claims under the warranty rendered void
Some of the housing screws on the devices are sealed.
Any claims against SICK AG under the warranty will be rendered void if the seals are
damaged or if the device is opened.
The housing must only be opened by authorized SICK service personnel.
8.2.2 Replacing the GPS antenna
A defective GPS antenna must be replaced immediately. Otherwise, position
determination is not possible.
You can order a GPS antenna for the TDC-B100/TDC-B200 devices under the following
part number:
Tab. 24: Part number for the GPS antenna
Replacing the GPS antenna
Fig. 38: Replacing the GPS antenna
 Loading...