

Page 1

MARSIC200
Ship Emission Measuring Device
Installation and Initial Start-up
T E C H N I C A L I N F O R M A T I O N
Page 2

Described product
MARSIC200
Manufacturer
SICK AG
Erwin-Sick-Str. 1
79183 Waldkirch
Germany
Legal information
This work is protected by copyright. Any rights derived from the copyright shall be
reserved for SICK AG. Reproduction of this document or parts of this document is only
permissible within the limits of the legal determination of Copyright Law. Any modifica‐
tion, abridgment or translation of this document is prohibited without the express writ‐
ten permission of SICK AG.
The trademarks stated in this document are the property of their respective owner.
© SICK AG. All rights reserved.
Original document
This document is an original document of SICK AG.
2
T EC H NI C AL IN F OR M AT I ON | MARSIC200 8017324/15A2/V6-0/2019-10 | SICK
Subject to change without notice
Page 3

Contents
CONTENTS
1 About this document........................................................................ 6
1.1 Function of this document....................................................................... 6
1.2 Target group.............................................................................................. 6
1.3 Further information................................................................................... 6
1.4 Symbols and document conventions...................................................... 6
1.4.1 Warning symbols...................................................................... 6
1.4.2 Warning levels / Signal words................................................. 7
1.4.3 Information symbols................................................................ 7
2 Installation.......................................................................................... 8
2.1 Gas supply terminology............................................................................ 8
2.2 Installation information............................................................................ 8
2.2.1 Power supply information........................................................ 8
2.2.2 Notes on the gas supply.......................................................... 8
2.2.3 Tube screw fitting..................................................................... 9
2.3 Scope of delivery....................................................................................... 10
2.4 Provision by operator................................................................................ 10
2.5 Installation overview................................................................................. 11
2.5.1 System layout for 1 ... 4 measuring points............................ 13
2.6 Checklist for mechanical and electrical installation............................... 15
2.6.1 Installing the enclosure........................................................... 15
2.6.2 Laying and connecting the gas lines...................................... 15
2.6.3 Lay and connect the electric lines between sampling
probe with sample conditioning and distribution unit........... 16
2.6.4 Lay and connect the electric line between distribution unit
and analyzer............................................................................. 19
2.7 Installing the sampling probe.................................................................. 21
2.8 Installing the sample gas line.................................................................. 22
2.9 Installing the sample conditioning........................................................... 24
2.9.1 Fitting the sample conditioning.............................................. 24
2.9.2 Gas connections on sample conditioning ............................. 25
2.9.3 Electrical installation of sample conditioning........................ 27
2.10 Installing the distribution unit.................................................................. 27
2.10.1 Fitting the distribution unit...................................................... 29
2.10.2 Gas connections on distribution unit..................................... 30
2.10.3 Electrical installation of distribution unit............................... 31
2.10.4 Measuring point switchover.................................................... 32
2.11 Installing the analyzer.............................................................................. 33
2.11.1 Fitting the analyzer.................................................................. 34
2.11.2 Gas connections on analyzer.................................................. 34
2.11.3 Electrical installation of analyzer............................................ 35
3 Initial start-up..................................................................................... 36
3.1 Initial start-up............................................................................................ 36
8017324/15A2/V6-0/2019-10 | SICK T EC H NI C AL IN F OR M AT I ON | MARSIC200
Subject to change without notice
3
Page 4

CONTENTS
4 Configuration software..................................................................... 38
4.1 Software SOPAS ET................................................................................... 38
4.2 Passwords................................................................................................. 38
5 Adjustment functions....................................................................... 39
5.1 Configuring test gases (Test Gas Table).................................................. 39
5.2 Performing a manual adjustment............................................................ 41
5.3 Automatic adjustments/validations........................................................ 44
5.3.1 Function of automatic adjustments/validations.................... 45
5.3.2 Start options............................................................................ 45
5.3.3 Programming automatic adjustments/validations................ 45
6 Tests and settings............................................................................. 47
6.1 Information................................................................................................ 47
6.2 Setting the time........................................................................................ 47
6.3 Interfaces (I/O)......................................................................................... 47
6.3.1 Digital inputs............................................................................ 47
6.3.2 Digital outputs.......................................................................... 48
6.3.3 Analog outputs......................................................................... 49
6.4 Adapting the hardware............................................................................. 49
6.4.1 Setting analog interfaces........................................................ 50
6.5 Configuring measured values.................................................................. 50
6.6 Measuring points - automatic.................................................................. 52
6.6.1 Function of the measuring points automatic......................... 52
6.6.2 Criteria for measuring point automatic.................................. 52
6.6.3 Configuring measuring point automatic................................. 53
6.7 Backup of settings.................................................................................... 53
7 Technical data.................................................................................... 55
7.1 Dimensional drawings.............................................................................. 55
7.1.1 Dimensional drawing of sample conditioning........................ 55
7.1.2 Dimensional drawing of distribution unit............................... 56
7.1.3 Dimensional drawing of analyzer............................................ 57
7.1.4 Dimensional drawing of sampling probe................................ 58
7.1.5 Sample gas line, heated.......................................................... 58
7.2 Gas flow diagram...................................................................................... 59
7.3 Measuring parameters............................................................................. 61
7.4 Ambient conditions................................................................................... 61
7.5 Sample gas conditions............................................................................. 62
7.6 Design as wall enclosure.......................................................................... 62
7.7 Sample gas line, heated........................................................................... 63
7.8 Interfaces and protocols.......................................................................... 63
7.9 Energy supply............................................................................................ 64
7.10 Emissions.................................................................................................. 65
7.11 Torques for screw fittings......................................................................... 65
7.12 Tube connections...................................................................................... 66
4
T EC H NI C AL IN F OR M AT I ON | MARSIC200 8017324/15A2/V6-0/2019-10 | SICK
Subject to change without notice
Page 5

CONTENTS
7.13 Sample gas conditions............................................................................. 66
8017324/15A2/V6-0/2019-10 | SICK T EC H NI C AL IN F OR M AT I ON | MARSIC200
Subject to change without notice
5
Page 6
1 ABOUT THIS DOCUMENT
1 About this document
1.1 Function of this document
This document describes:
Installation
•
Initial start-up
•
Operation via SOPAS ET
•
NOTICE
This Manual is only valid in combination with the MARSIC Operating Instructions.
1.2 Target group
This document is addressed to technicians (persons with technical understanding)
operating and maintaining the measuring system.
The technicians must have been trained on the device.
Requirements for the technician
The technician must be familiar with the exhaust gas technology on the ship (over‐
•
pressure, toxic and hot flue gases) and be able to avoid hazards when working on
gas ducts.
The technician must be familiar with handling compressed gas cylinders (test
•
gases).
The technician must be able to avoid hazards caused by noxious test gases.
•
Only allow an authorized electrician to work on the electrical system or electrical
•
subassemblies.
1.3 Further information
“MARSIC200” Operating Instructions
•
Sampling Probe Operating Instructions
•
Instructions for laying the sample gas line
•
Sample Gas Cooler Operating Instructions
•
GMS800 BCU Operating Instructions
•
GMS800 Technical Information
•
Optional: MPR (Meeting Point Router) Operating Instructions
•
System documentation (parts list, device data, wiring diagram, system-relevant
•
components)
1.4 Symbols and document conventions
1.4.1 Warning symbols
Table 1: Warning symbols
Symbol Significance
Hazard (general)
Hazard by voltage
6
T EC H NI C AL IN F OR M AT I ON | MARSIC200 8017324/15A2/V6-0/2019-10 | SICK
Subject to change without notice
Page 7

Symbol Significance
Hazard in potentially explosive atmospheres
Hazard by explosive substances/mixtures
Hazard by toxic substances
Hazards by noxious substances
Hazard by high temperature
Hazard for the environment/nature/organic life
1.4.2 Warning levels / Signal words
ABOUT THIS DOCUMENT 1
DANGER
Risk or hazardous situation which will result in severe personal injury or death.
WARNING
Risk or hazardous situation which could result in severe personal injury or death.
CAUTION
Hazard or unsafe practice which could result in less severe or minor injuries.
Notice
Hazard which could result in property damage.
Note
Hints
1.4.3 Information symbols
Table 2: Information symbols
Symbol Significance
Important technical information for this product
Important information on electric or electronic functions
8017324/15A2/V6-0/2019-10 | SICK T EC H NI C AL IN F OR M AT I ON | MARSIC200
Subject to change without notice
7
Page 8
2 INSTALLATION
2 Installation
2.1 Gas supply terminology
Definition of the gases used:
Zero gas: Gas used to adjust the zero point. Instrument air or nitrogen (N2).
•
Span gas: Gas used to adjust the upper measuring range value.
•
Test gas: Generic term for zero and span gas.
•
Instrument air: Clean compressed air.
•
Quality of gases: see "Sample gas conditions", page 66.
2.2 Installation information
2.2.1 Power supply information
The operator is responsible for correct laying and connection of the electric lines.
WARNING
Danger to life by electric voltage
Only allow an authorized electrician to work on the electric system
b
ATTENTION
Observe 115 V or 230 V versions.
The following subassemblies have a 115 V or 230 V version:
Sample gas line
•
Sample gas pump (in distribution unit)
•
Cooler (in sample conditioning)
•
Analyzer
•
Check that the voltage on the type plate matches the power supply.
When selecting and laying the electric lines for power supply, observe the technical
data (see "Energy supply", page 64) and the applicable local standards and guide‐
lines.
2.2.2 Notes on the gas supply
The operator is responsible for the correct laying of the sample gas lines.
ATTENTION
Risk of contamination of the analyzer by unclean instrument air.
Only use instrument air corresponding to the prescribed specification (see Techni‐
b
cal Data).
Install a suitable instrument air conditioning when necessary.
b
Gas Quality Inlet pressure Flow rate
Instrument air Particle size max. 1 μm
Oil content max. 0.1 mg/m
Zero point gas Nitrogen 5.0 Max. +300 hPa Typically 60 l/h
8
T EC H NI C AL IN F OR M AT I ON | MARSIC200 8017324/15A2/V6-0/2019-10 | SICK
Max. +300 hPa Typically 60 l/h
3
Subject to change without notice
Page 9
INSTALLATION 2
Gas Quality Inlet pressure Flow rate
Span gas External span gas
Precision: ± 2 %
Concentration: 80% ... 100%
of measuring range
The span gas must comply
with the specifications of the
standards to be applied (e.g.,
MARPOL Annex VI)
Flow plan see "Gas flow diagram", page 59
Dimension of connections of PTFE tubes: DN4/6.
The operator is responsible for the correct laying of the sample gas lines.
Observe the enclosed information concerning the laying of the heated sample gas line.
CAUTION
The PTFE tubes are susceptible to kinks.
Lay PTFE tubes in large arcs and plan a kink protection as necessary.
b
Observe the clearances when fitting the enclosures: see "Dimensional drawings",
b
page 55.
Max. +300 hPa Typically 60 l/h
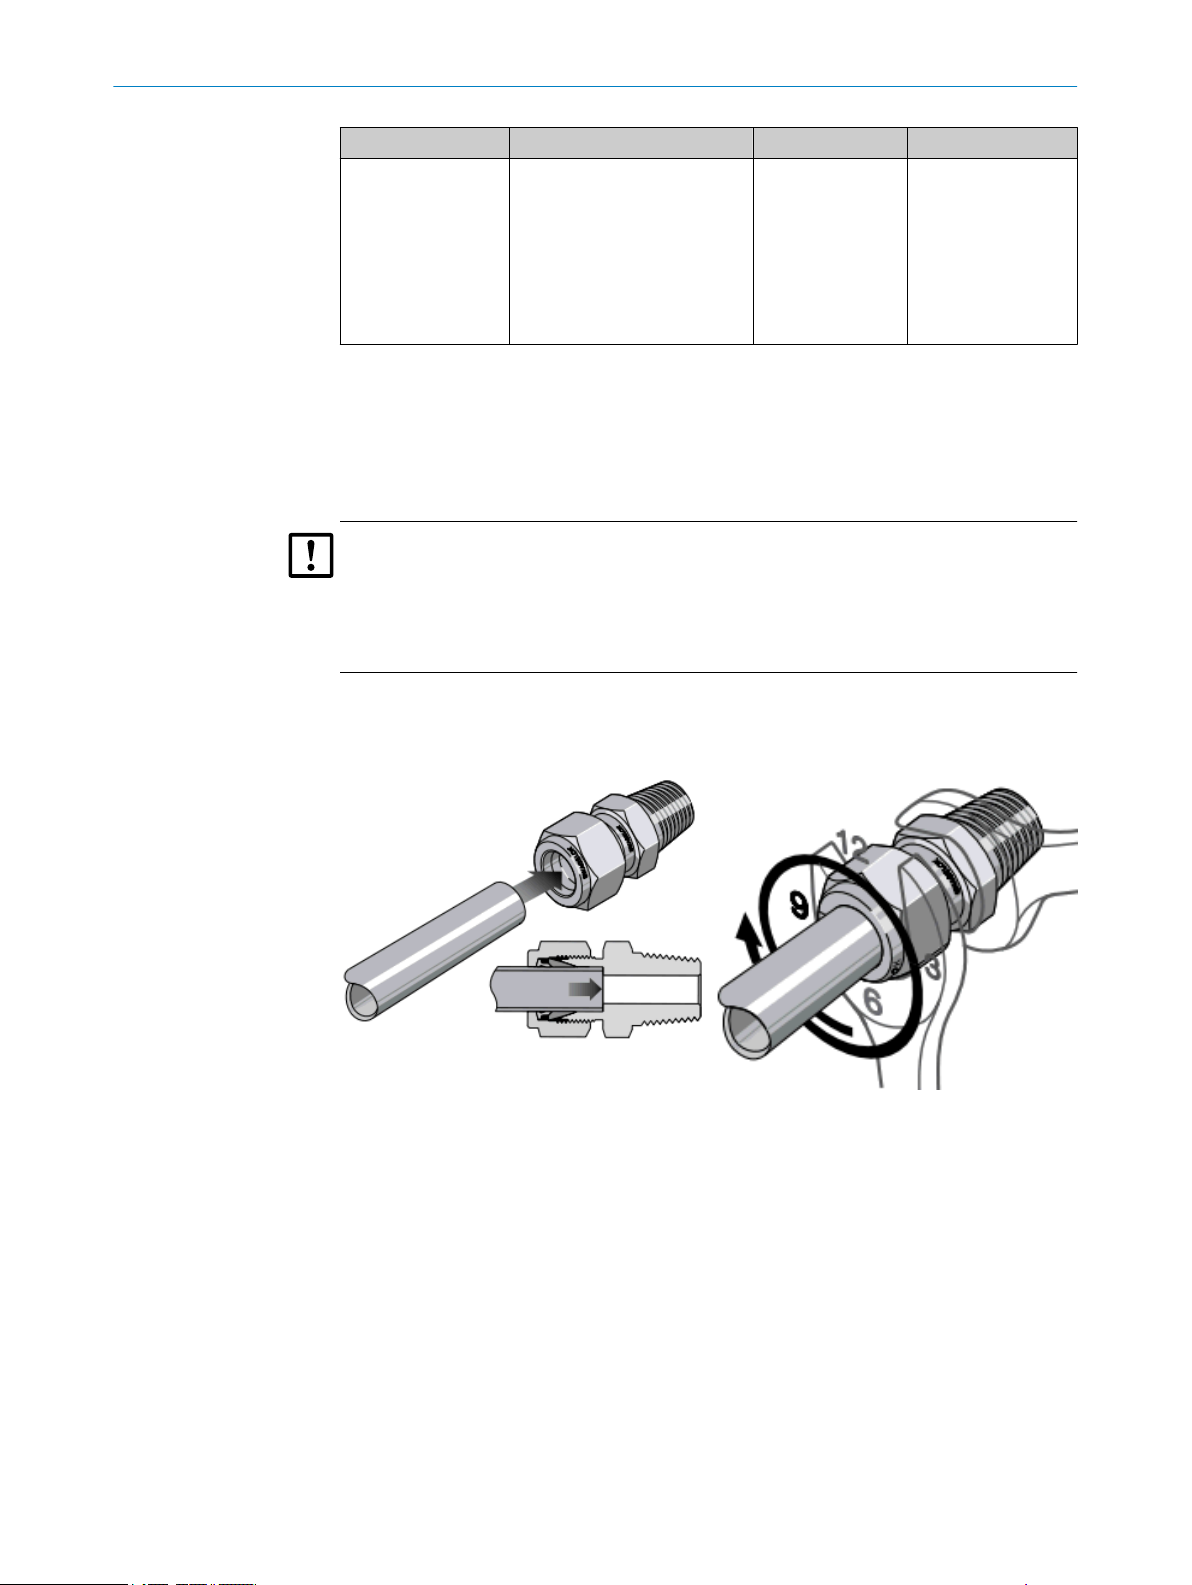
2.2.3 Tube screw fitting
Swagelok screw fitting
b
Push the tube up to the stop in the tube
screw fitting.
Turn the cap nut finger-tight.
During initial assembly: Hold the fitting
b
bolt steady and tighten the cap nut with
1 1/4 revolutions.
During refitting: Tighten the cap nut to
b
the previous position (the resistance
increases noticeably) and then slightly
tighten.
8017324/15A2/V6-0/2019-10 | SICK T EC H NI C AL IN F OR M AT I ON | MARSIC200
Subject to change without notice
9
Page 10
2 INSTALLATION
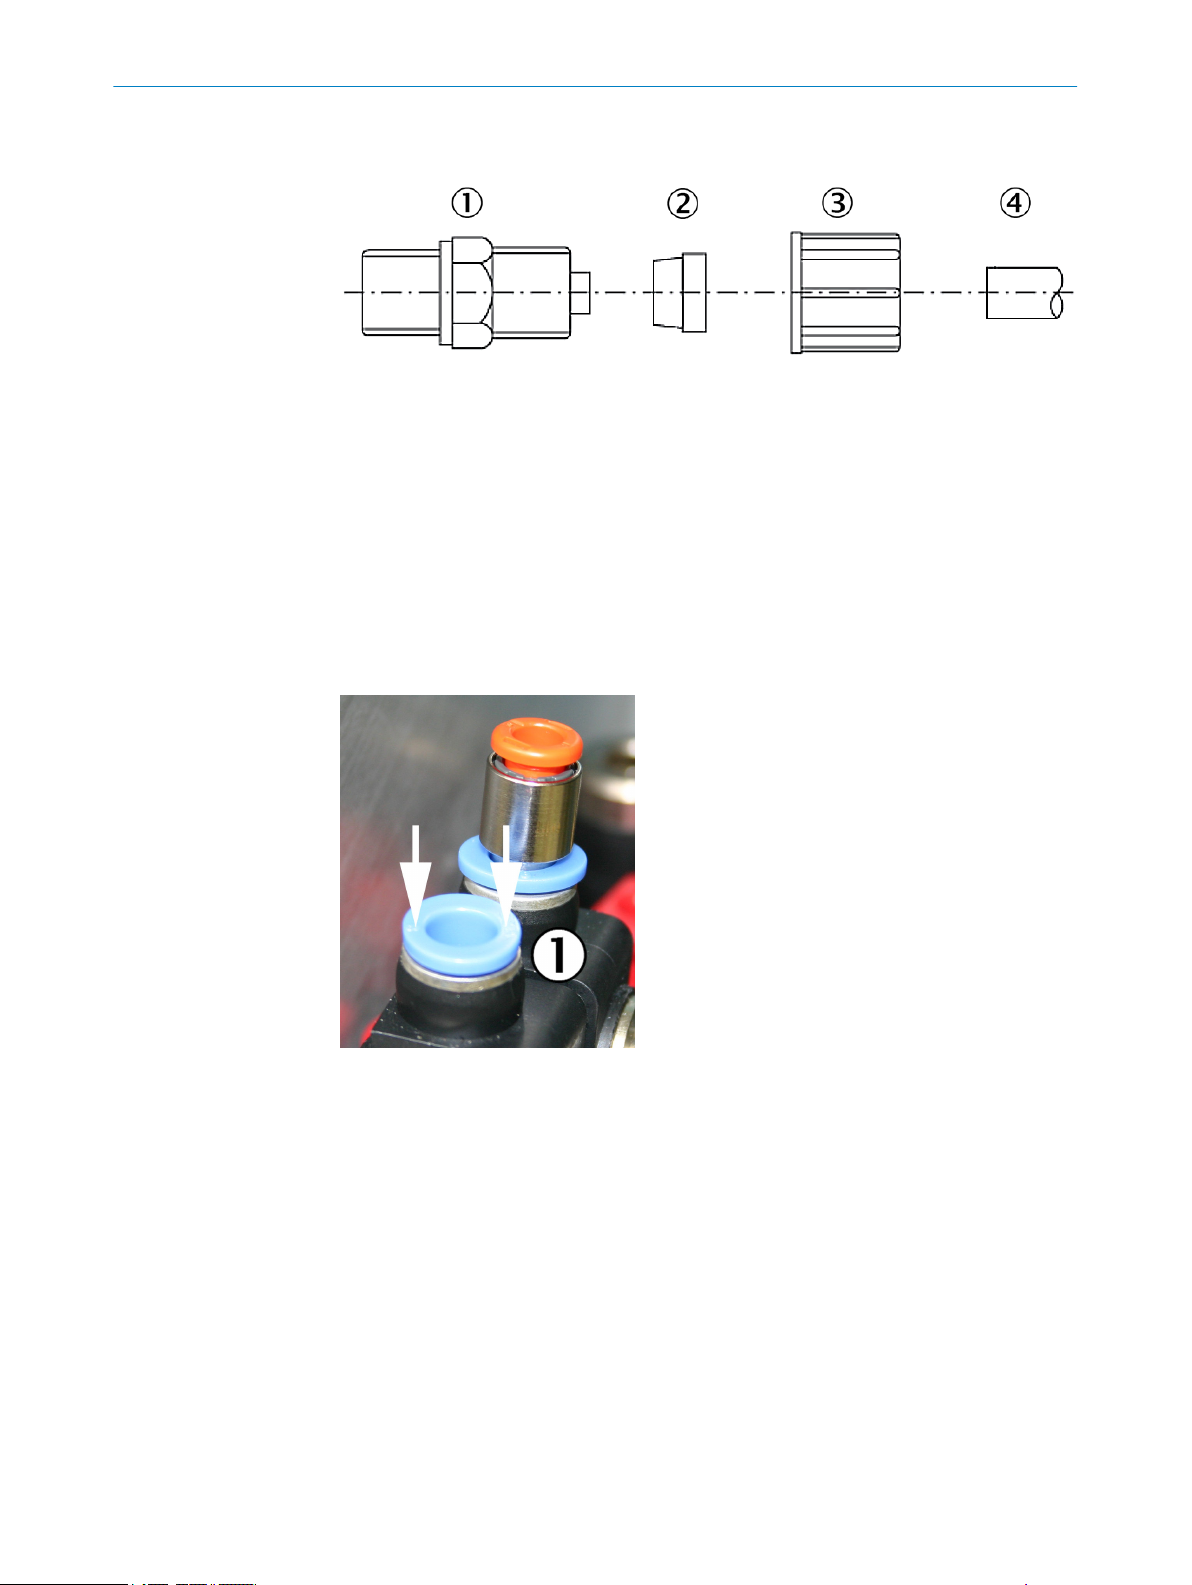
Plastic fitting
Figure 1: Hose fitting
Screw-in piece
1
Clamping ring
2
Knurled nut
3
Hose
4
Place the knurled nut and the clamping ring on the hose.
b
Observe the location of the clamping ring (see drawing).
Place the hose on the screw-in piece.
b
Turn the knurled nut hand-tight.
b
Push-in fitting pneumatic
Retaining ring
1
2.3 Scope of delivery
Please see the delivery documents for the scope of delivery.
2.4 Provision by operator
Inserting the tube: Push the tube in.
b
Removing the tube: Press the retaining ring
b
in and pull the tube out.
10
To be provided by operator:
Fixing accessories of enclosures (dowels, screws, etc.)
•
PTFE tubes and screw fittings: Depending on order
•
Grounding conductor for analyzer
•
Fixing accessories for heated sample gas line
•
Fixing accessories for PTFE tubes
•
Nitrogen or instrument air as zero gas: Observe the required quality: see "Sample
•
gas conditions", page 66
T EC H NI C AL IN F OR M AT I ON | MARSIC200 8017324/15A2/V6-0/2019-10 | SICK
Subject to change without notice
Page 11
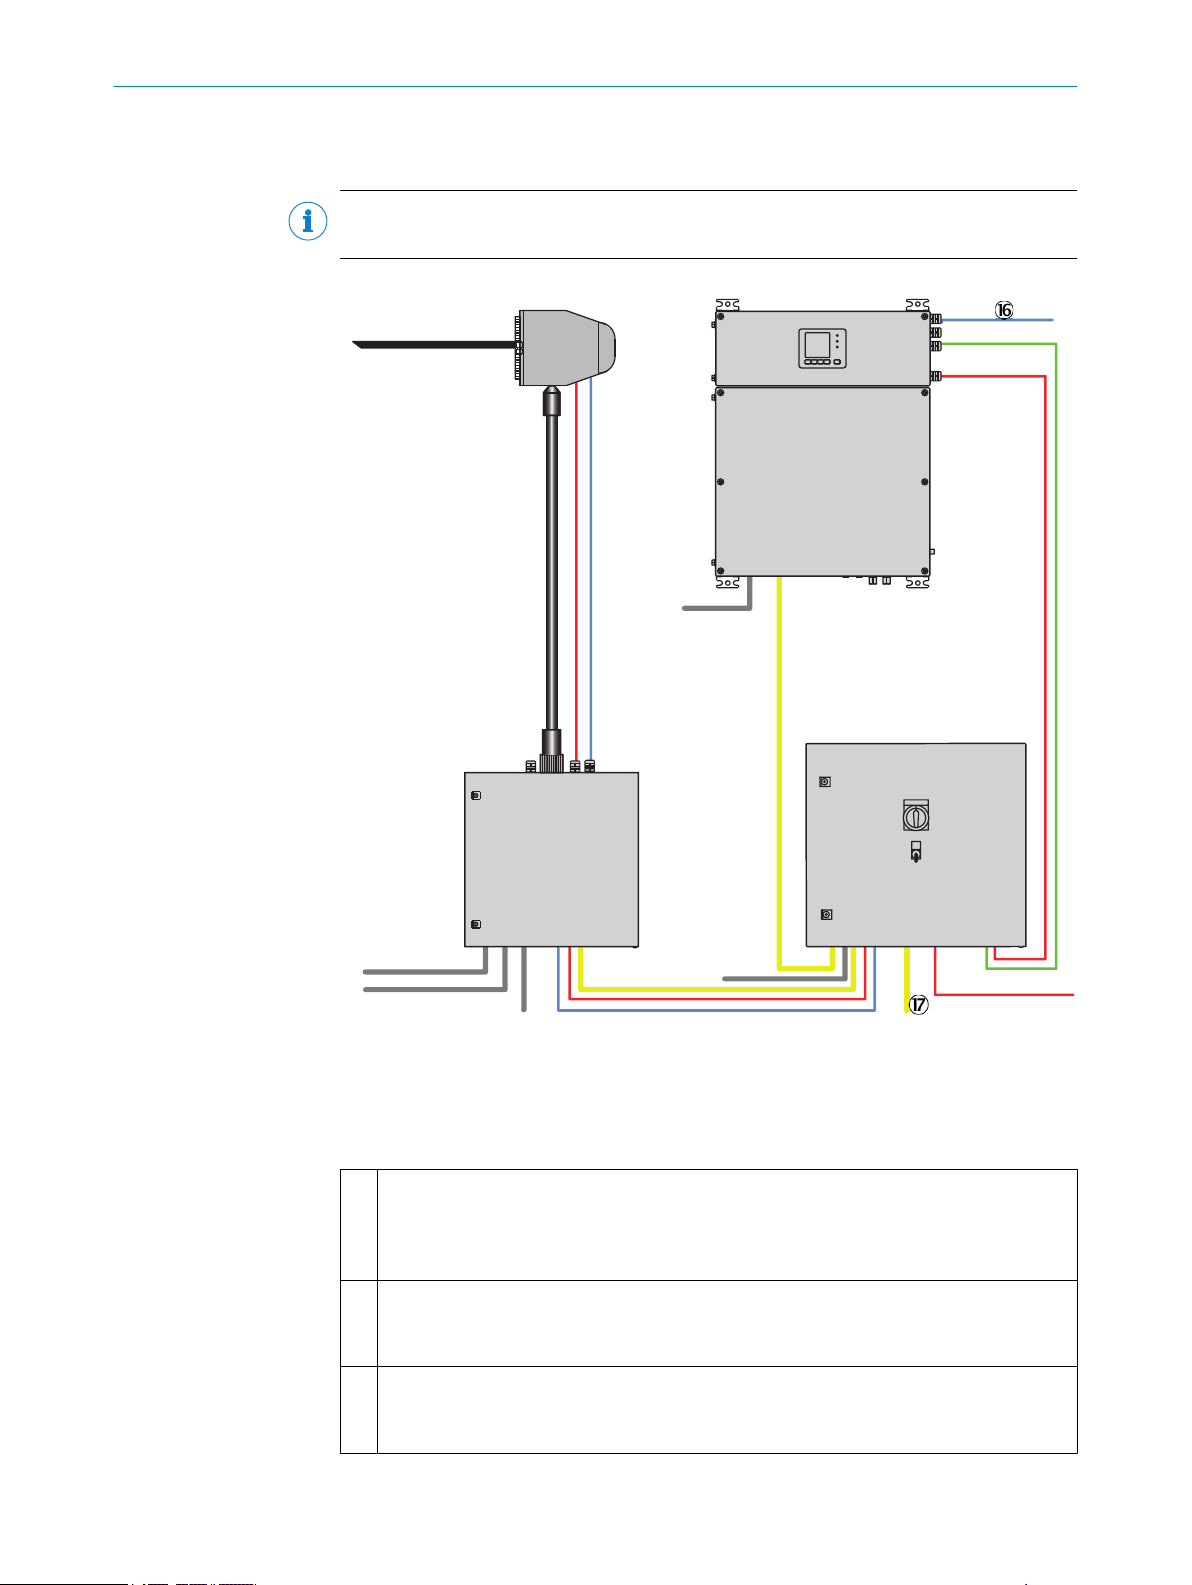
2.5 Installation overview
7
7
8
9
1
ß
2
3
3
4
5
5
6
à
à
á
â
ã
ä
NOTE
Gas flow diagram see "Gas flow diagram", page 59
INSTALLATION 2
Figure 2: Installation - overview
Red Power supply
Blue and green Signal line
Yellow PTFE gas line
Heated sampling probe with:
1
Sampling tube
•
Sample gas filter
•
Backflushing
•
Heated sample gas line, sampling probe - sample conditioning:
2
Sample gas
•
Instrument air/test gas (optional)
•
Lines, sampling probe - sample conditioning
3
Power supply of the sampling probe
•
Signal line
•
8017324/15A2/V6-0/2019-10 | SICK T EC H NI C AL IN F OR M AT I ON | MARSIC200
Subject to change without notice
11
Page 12

2 INSTALLATION
Sample conditioning with:
4
Sample gas cooler
•
Solenoid valve for feeding instrument air/test gas to the sampling probeTest gas feed
•
Gas inlets of sample conditioning:
5
Instrument air to backflush the probe
•
Only possible for measuring point 1: Test gas for adjustment via probe (optional)
•
Unheated sample gas line, sample conditioning - distribution unit
6
Lines, sample conditioning - distribution unit:
7
Power supply of sample conditioning
•
Signal line
•
Distribution unit with:
8
Power supply, complete system with central power distribution
•
System fuses
•
Main switch
•
“Stand-by” switch
•
Flow indicator
•
Sample gas fine filter
•
Water trap
•
Sample gas pump
•
Sample gas valve (test gas feed optional)
•
Measuring point switchover (for 2 ... 4 measuring points)
•
Bypass pump (for 2 ... 4 measuring points)
•
Inlet for central power supply for the complete system
9
The distribution unit provides electrical power for all system modules.
•
Unheated sample gas line from distribution unit to analyzer
ß
Lines, distribution unit - analyzer:
à
Analyzer power supply
•
Signal lines
•
Analyzer
á
Control unit
•
Measuring modules:
•
Gas module (flow, humidity and pressure)
°
DEFOR (NO, NO2 and SO2)
°
FINOR (CO2)
°
OXOR (O2), option
°
Analog and digital interfaces
•
Ethernet
•
Sample gas outlet
â
Test gas inlet
ã
Test gas connection during adjustment
Condensate outlet
ä
Signal lines/Ethernet to periphery
å
12
T EC H NI C AL IN F OR M AT I ON | MARSIC200 8017324/15A2/V6-0/2019-10 | SICK
Subject to change without notice
Page 13
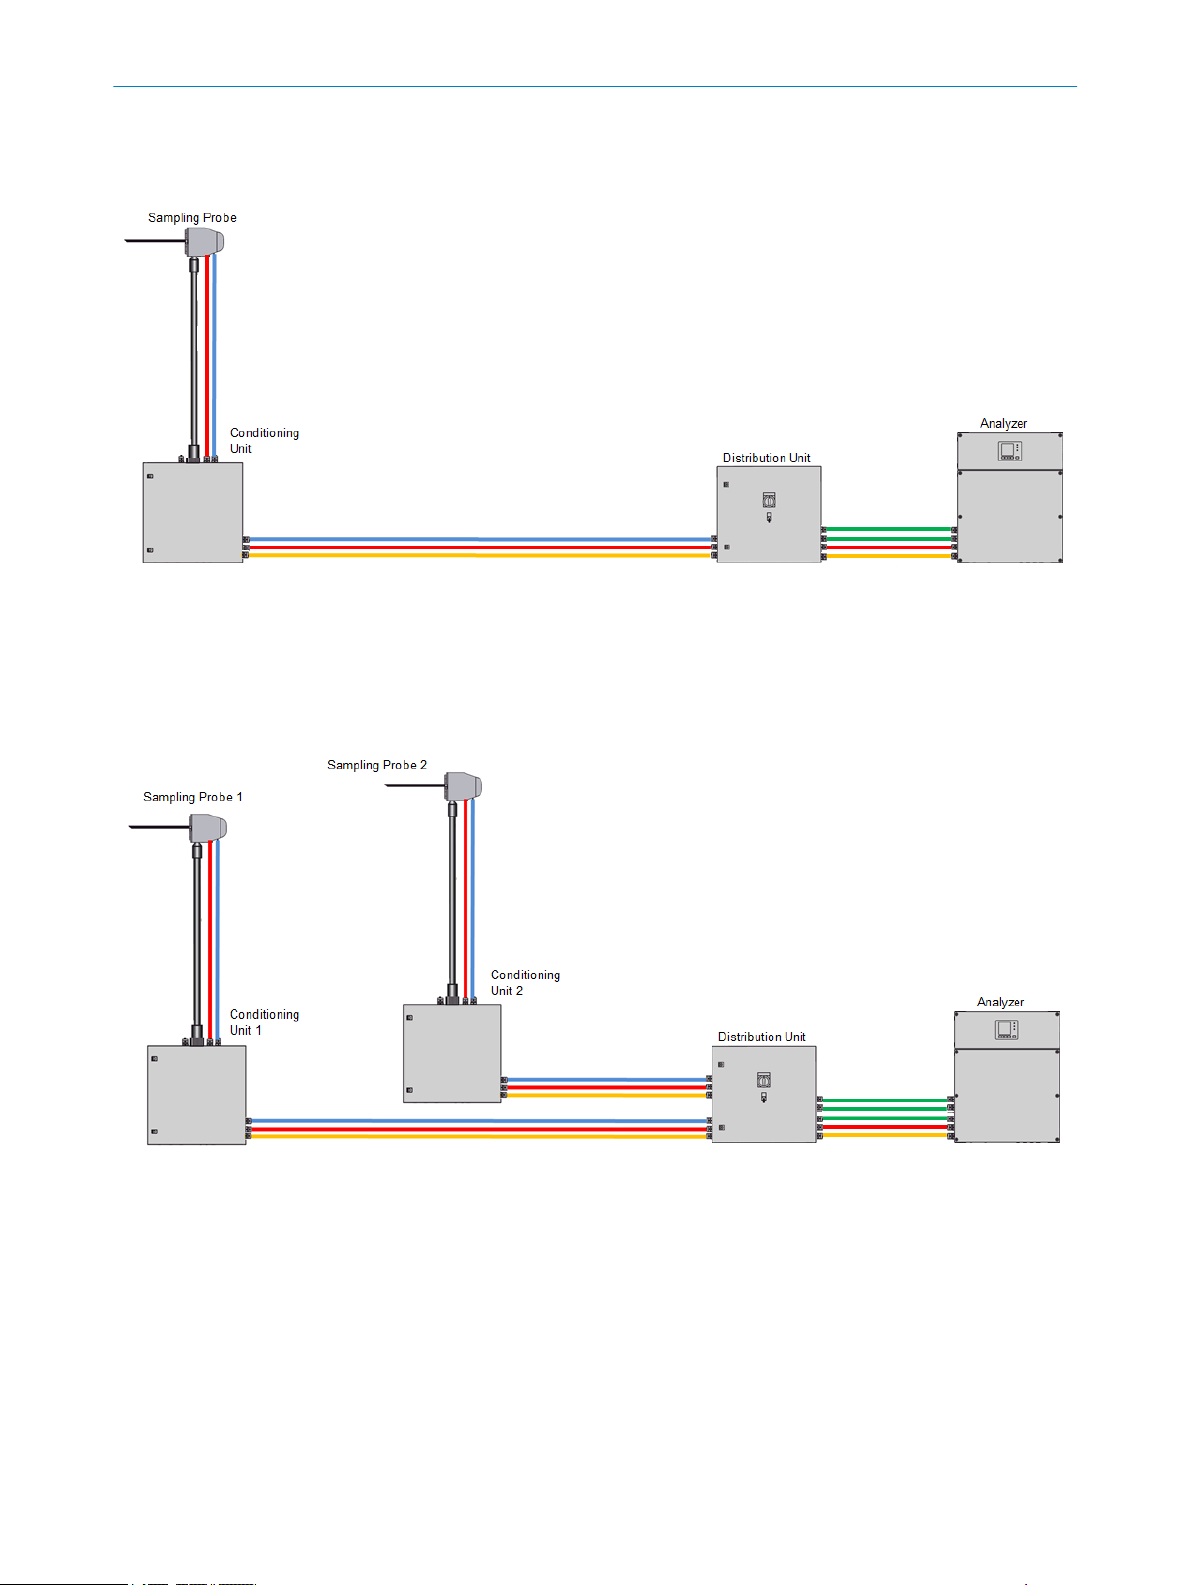
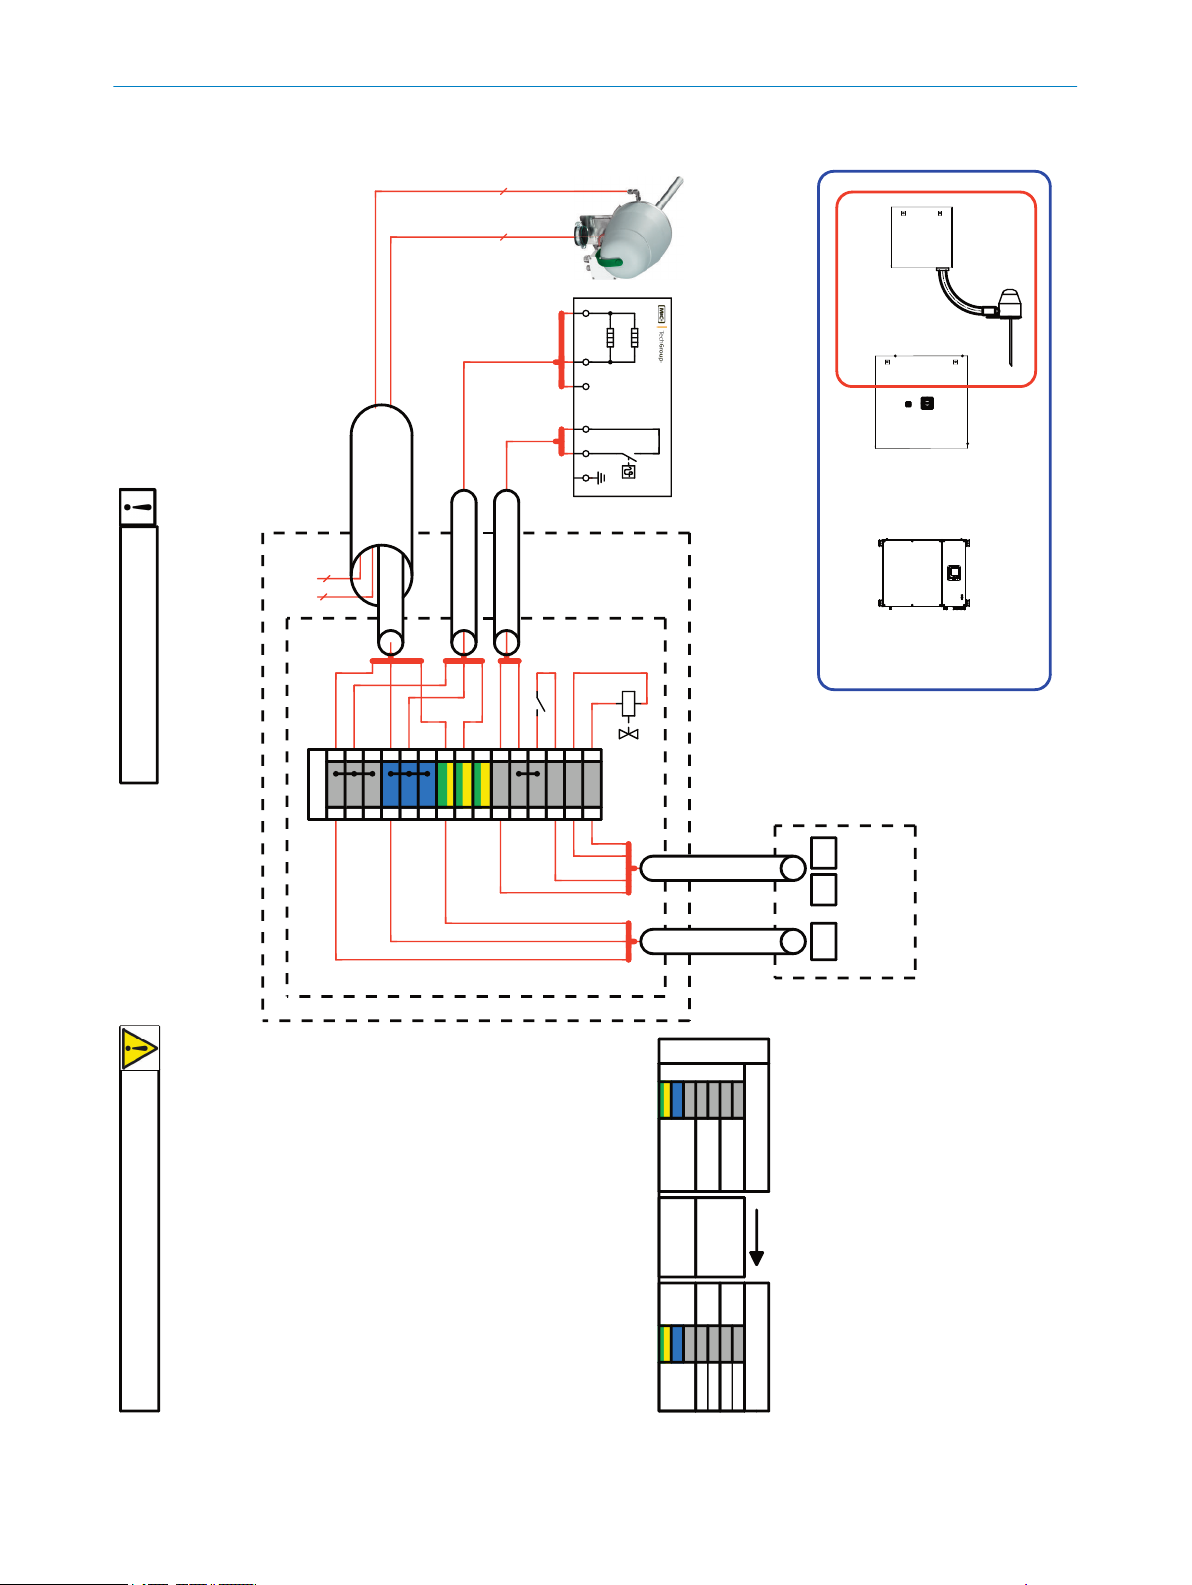
2.5.1 System layout for 1 ... 4 measuring points
1 measuring point
Red Power (3x1.5; Order no: 6056215)
Blue Signal (4x0.75; Order no: 6056229)
Green Signal (7x1.5; Order no: 6056230)
Yellow PTFE line (4/6; Order no: 5310243)
INSTALLATION 2
2 measuring points
Red Power (3x1.5; Order no: 6056215)
Blue Signal (4x0.75; Order no: 6056229)
Green Signal (7x1.5; Order no: 6056230)
Yellow PTFE line (4/6; Order no: 5310243)
8017324/15A2/V6-0/2019-10 | SICK T EC H NI C AL IN F OR M AT I ON | MARSIC200
Subject to change without notice
13
Page 14
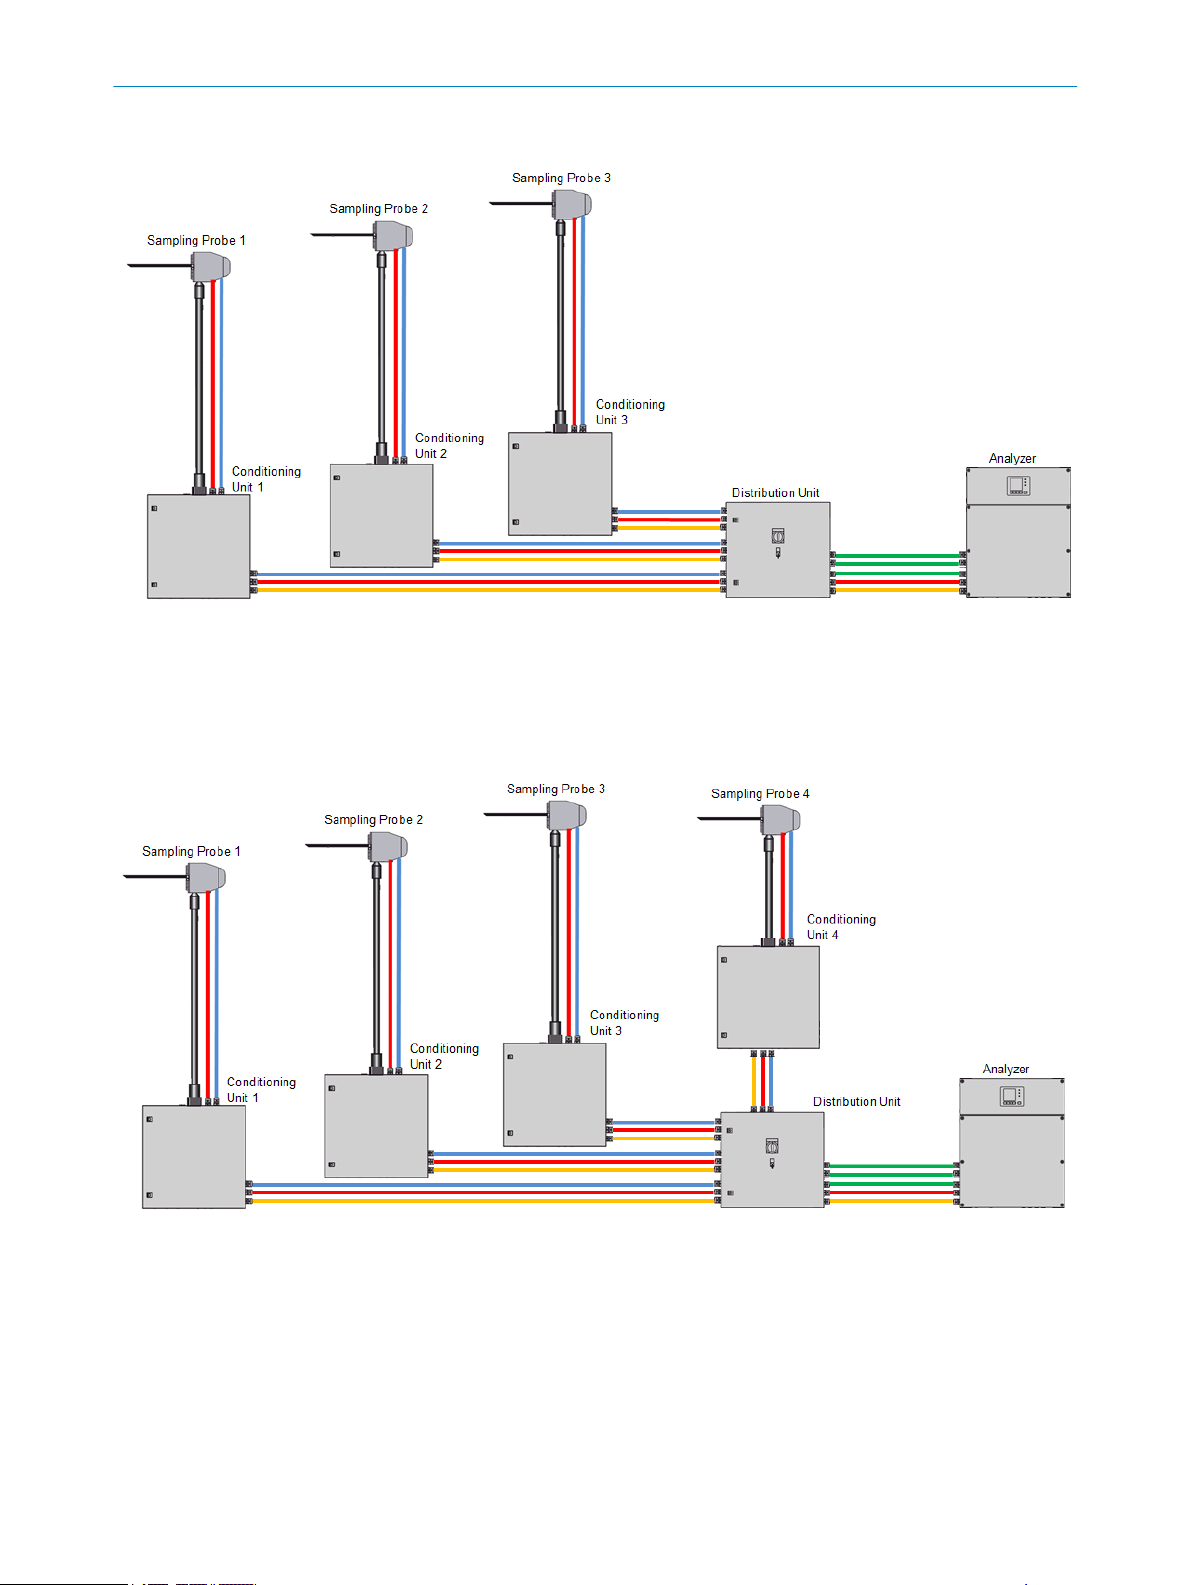
2 INSTALLATION
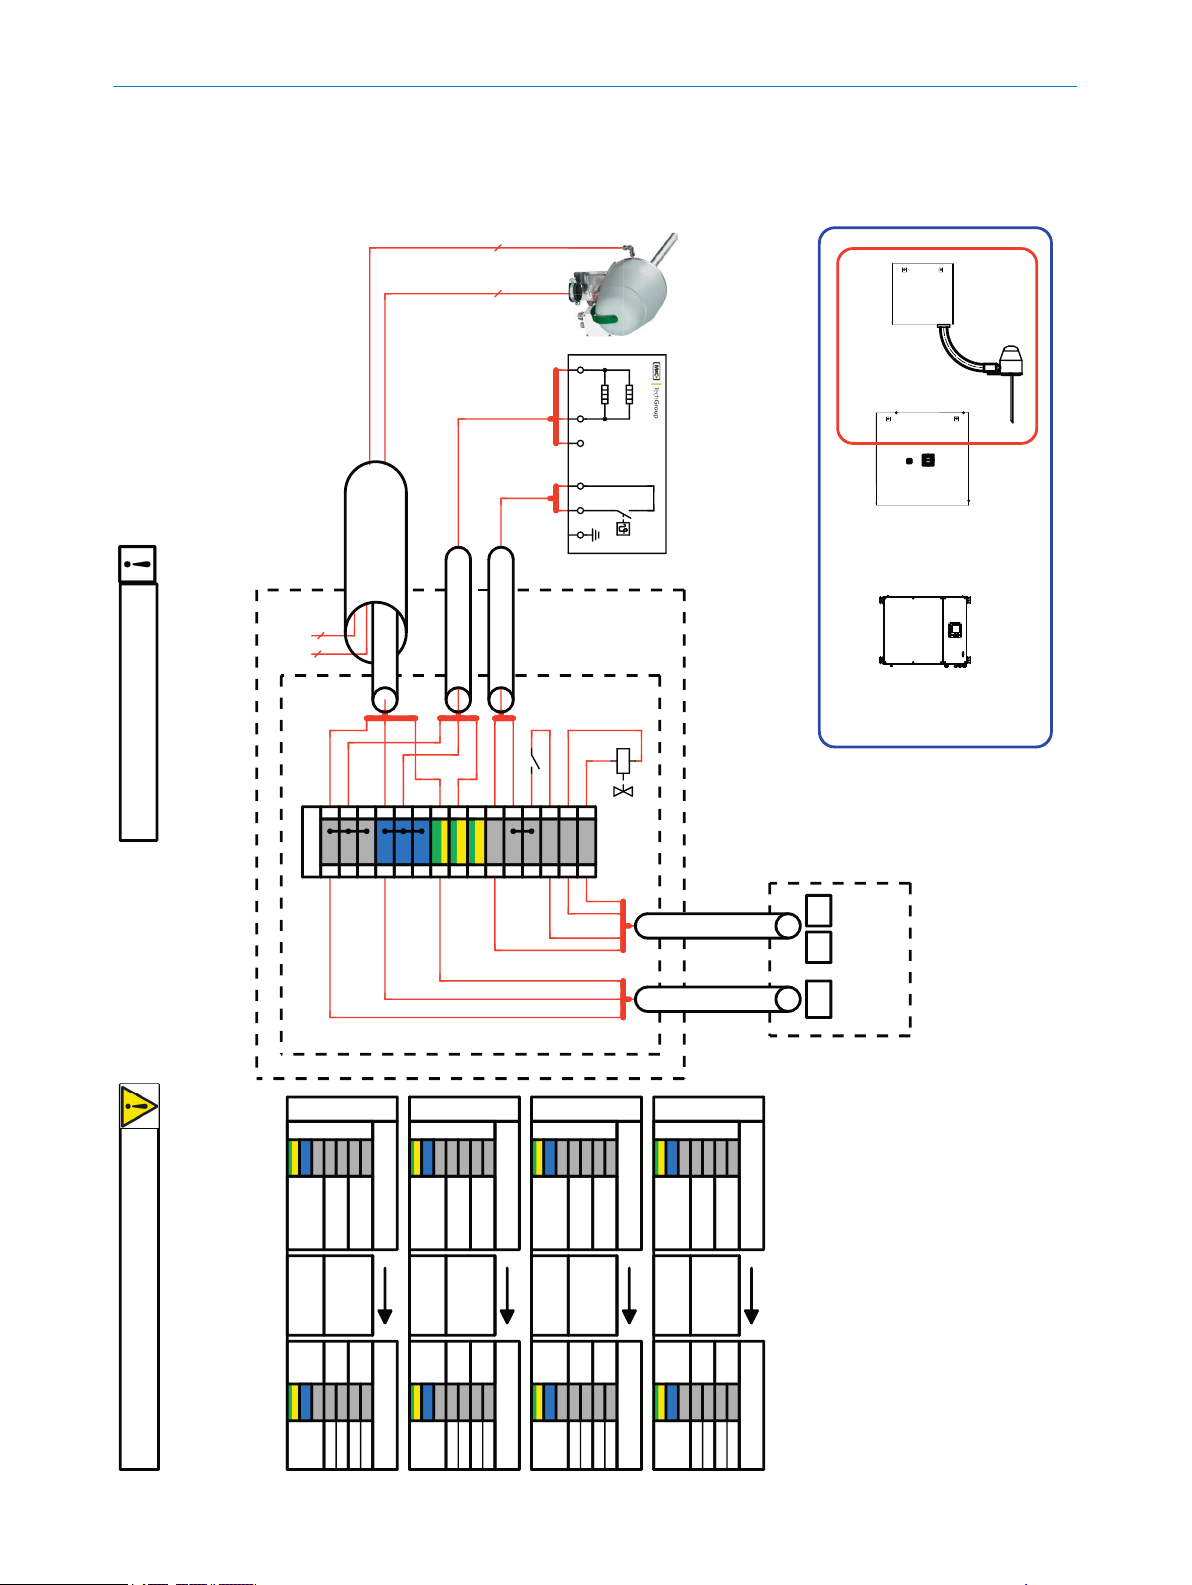
3 measuring points
Red Power (3x1.5; Order no: 6056215)
Blue Signal (4x0.75; Order no: 6056229)
Green Signal (7x1.5; Order no: 6056230)
Yellow PTFE line (4/6; Order no: 5310243)
4 measuring points
Red Power (3x1.5; Order no: 6056215)
Blue Signal (4x0.75; Order no: 6056229)
Green Signal (7x1.5; Order no: 6056230)
Yellow PTFE line (4/6; Order no: 5310243)
14
T EC H NI C AL IN F OR M AT I ON | MARSIC200 8017324/15A2/V6-0/2019-10 | SICK
Subject to change without notice
Page 15
2.6 Checklist for mechanical and electrical installation
NOTE
The circuit diagrams shown in this Chapter are also available in larger format in the sys‐
tem documentation..
2.6.1 Installing the enclosure
Table 3: Installing the enclosure
Enclosure Reference
Installation of sampling probe see "Installing the sampling probe", page 21
Installation of sample conditioning see "Fitting the sample conditioning", page 24
Installation of distribution unit see "Installing the distribution unit", page 27
Installation of analyzer see "Fitting the analyzer", page 34
Optional: Installation of MPR see enclosed “MPR Operating Instructions”
2.6.2 Laying and connecting the gas lines
Table 4: Connecting gas lines
1
Gas line Connection
Heated sample gas line: From sampling probe
2
to sample conditioning
Sample gas line: From sample conditioning to
6
distribution unit
Sample gas line: From distribution unit to ana‐
ß
lyzer
Analyzer sample gas outlet Analyzer: see chapter 2.11.2
â
Instrument air feeding to sample conditioning Sample conditioning: see chapter 2.9.2
5
Test gas feeding to sample conditioning
5
(optional)
Instrument air feeding from sample condition‐
3
ing to sampling probe (optional)
Zero gas feeding to distribution unit Distribution unit: see chapter 2.10.2
ã
Sample conditioning condensate outlet Sample conditioning: see chapter 2.9.2
ä
1
Numbering see "Installation overview", page 11
Sampling probe: see chapter 2.7
Sample conditioning: see chapter 2.9.2
Sample conditioning: see chapter 2.9.2
Distribution unit: see chapter 2.10.2
Distribution unit: see chapter 2.10.2
Analyzer: see chapter 2.11.2
Sample conditioning: see chapter 2.9.2
Sampling probe: see chapter 2.7
INSTALLATION 2
8017324/15A2/V6-0/2019-10 | SICK T EC H NI C AL IN F OR M AT I ON | MARSIC200
Subject to change without notice
15
Page 16
To sampling Probe (Power)
Marine Line (3x1,5) 6056215
Preparation Unit (UM1) Distribution unit (UM5)
101314
15
147
1
2
14
18
123
Alarm
Valve KK10
Power
Marine Line
(4x0,75)
6056229
Marine Line
(3x1,5)
6056215
XD21
XD61
XD2
To distributor unit (Power)
Marine Line (3x1,5) 6056215
To distributor unit (Signal)
Marine Line (4x0,75) 6056229
Power
+24V
XD1
DI 10Vcontrol
2
2
gy
3
3
gy
bu
4
4
bu bu
556
6
gnye
7
7
gnye
8
8
gnye
9
9
1
1
gy
10
10
gy
gy
11
11
gy
12
12
gy
13
13
gy
14
14
gy
15
15
PELN
Line 1
Distribution unit
(see next Page for details)
UM1
UM5
BQ1
UC1
sample gas line
UM1
junction box
UM5
XD2XD21 XD61
All cable diameters are proposals! The customer must check this diameters!
Parameters are e.g.: voltage drop, cable cluster, laying procedure etc.
WD3
WD6
WD2
WD1
Preparation Unit (UM2) Distribution unit (UM5)
101314
15
147
3
4
15
19
123
Alarm
Valve KK10
Power
Marine Line
(4x0,75)
6056229
Marine Line
(3x1,5)
6056215
XD21
XD61
XD2
Power
+24V
XD1
DI 20Vcontrol
Line 2
XD1
Preparation Unit
L PEN
PELN
Preparation Unit (UM3) Distribution unit (UM5)
101314
15
147
5
6
16
20
123
Alarm
Valve KK10
Power
Marine Line
(4x0,75)
6056229
Marine Line
(3x1,5)
6056215
XD21
XD61
XD2 Power
+24V
XD1
DI 30Vcontrol
Line 3
4 5
5
4
To sampling Probe (signal)
Marine Line (4x0,75) 6056229
Preparation Unit (UM4) Distribution unit (UM5)
101314
15
147
7
8
17
21
123
Alarm
Valve KK10
Power
Marine Line
(4x0,75)
6056229
Marine Line
(3x1,5)
6056215
XD21
XD61
XD2 Power
+24V
XD1
DI 40Vcontrol
Line 4
Connection of the sample preparation
is always the same
5...15m
54
L
2
N
3
6
200W
200W
PE
1
PE
rdbu
KK10
A
EC1
IN
rd
bu
13
-EC1
x1
x2
-KK10
INSTALLATION
2
2.6.3 Lay and connect the electric lines between sampling probe with sample conditioning and distribu‐
tion unit
MULTI version distribution unit for two to four measuring points
Figure 3: Wiring diagram
16
T EC H NI C AL IN F OR M AT I ON | MARSIC200 8017324/15A2/V6-0/2019-10 | SICK
Subject to change without notice
Page 17
SINGLE version distribution unit for one measuring point
Preparation Unit
L PEN
PELN
4 5
5
4
To sampling Probe (signal)
Marine Line (4x0,75) 6056229
To sampling Probe (Power)
Marine Line (3x1,5) 6056215
Preparation Unit (UM1) Distribution unit (UM5)
101314
15
147
1
2
14
18
123
Alarm
Valve KK10
Power
Marine Line
(4x0,75)
6056229
Marine Line
(3x1,5)
6056215
XD21
XD61
XD2
To distributor unit (Power)
Marine Line (3x1,5) 6056215
To distributor unit (Signal)
Marine Line (4x0,75) 6056229
Power
+24V
XD1
DI 10Vcontrol
2
2
gy
3
3
gy
bu
4
4
bu bu
556
6
gnye
7
7
gnye
8
8
gnye
9
9
1
1
gy
10
10
gy
gy
11
11
gy
12
12
gy
13
13
gy
14
14
gy
15
15
XD1
PELN
Line 1
UM1
UM5
BQ1
UC1
UM1
junction box
UM5
XD2XD21 XD61
All cable diameters are proposals! The customer must check this diameters!
Parameters are e.g.: voltage drop, cable cluster, laying procedure etc.
WD3
WD6
WD2
WD1
Connection of the sample preparation
is always the same
5...15m
sample gas line
Distribution unit
(see next Page for details)
54
L
2
N
3
6
200W
200W
PE
1
PE
rdbu
KK10
A
EC1
IN
rd
bu
13
-EC1
x1
x2
-KK10
INSTALLATION
2
Figure 4: Wiring diagram
8017324/15A2/V6-0/2019-10 | SICK T EC H NI C AL IN F OR M AT I ON | MARSIC200
Subject to change without notice
17
Page 18

2 INSTALLATION
Line Connection
Power supply from distribution unit to sample conditioning Distribution unit: see "Electrical installation of distribution
unit", page 31
Sample conditioning: see chapter 2.9.3
Power supply from sample conditioning to sampling probe Sample conditioning: see chapter 2.9.3
Sampling probe: see chapter 2.7
Status signals between analyzer and sample conditioning Distribution unit: see "Electrical installation of distribution
unit", page 31
Sample conditioning: see chapter 2.9.3
Status signals from sampling probe to sample conditioning Sampling probe: see chapter 2.7
Sample conditioning: see chapter 2.9.3
18
T EC H NI C AL IN F OR M AT I ON | MARSIC200 8017324/15A2/V6-0/2019-10 | SICK
Subject to change without notice
Page 19
XD61
Analog Signals
supplyes by customer
All cable diameters are proposals! The customer must check this diameters!
Parameters are e.g.: voltage drop, cable cluster, laying procedure etc.
MARSIC200 Analyzer
Status Signals
supplyes by customer
WD1
UM1
UM5
BQ1
WD4
WD6
WD2
WD3
WD5
WD7
Marine Line
(7x1,5) 6056230
Marine Line
(3x1,5) 6056215
Marine Line
(7x1,5) 6056230
Marine Line
(7x1,5) 6056230
35678
9
1-X3
State SP 10VState SP 2
State SP 3
State SP 4
Standby
SP2
X
X
X
124710
1-X5
bypass pump
sample gas pump
Purge gas
Test gas
1
4710
2-X4
MP1 Bypass (KF4)
MP2 Bypass (KF5)
MP3 Bypass (KF6)
MP4 Bypass (KF7)
147
10
2-X5
MP1 Active (KF8)
MP2 Active (KF9)
MP3 Active (KF10)
MP4 Active (KF11)
24V*
SP3
SP4
SP1
XXX
XXXXX
X
XXXXXXX
Analyzer (BQ1)
L
N
XXX X
X
X
XXX
XXX
XXXXXXX
XXXXX
XXXXX
X
X
X
XXX
XXX
X
X
X
X
X
XXX
X
X
1-X5
2
5
8
11
2-X4
2
5
8
11
2-X5
2
5
8
11
SP1...SP4
X X X X
X X X X X X X X X X X X
External Power supply
supplyes by customer
distributor unit
XD61
XD2
XD21
XD1
12345
6
XD61
12345
6
789
101112
13
Distribution unit (UM5)
456
XD2
5
5N
5PE
SP1 SP2...SP4
State SP 10VState SP 2
State SP 3
State SP 4
Standby
bypass pump
sample gas pump
Purge gas
Test gas
MP Bypass (KF4)
MP2 Bypass (KF5)
MP3 Bypass (KF6)
MP4 Bypass (KF7)
MP1 Active (KF8)
MP2 Active (KF9)
MP3 Active (KF10)
MP4 Active (KF11)
24V*
XD62
* connect 24V at 1-X5; 2-X4 and 2-X5
according to the wiring diagram
24V+
/1-X5
PE
INSTALLATION
2
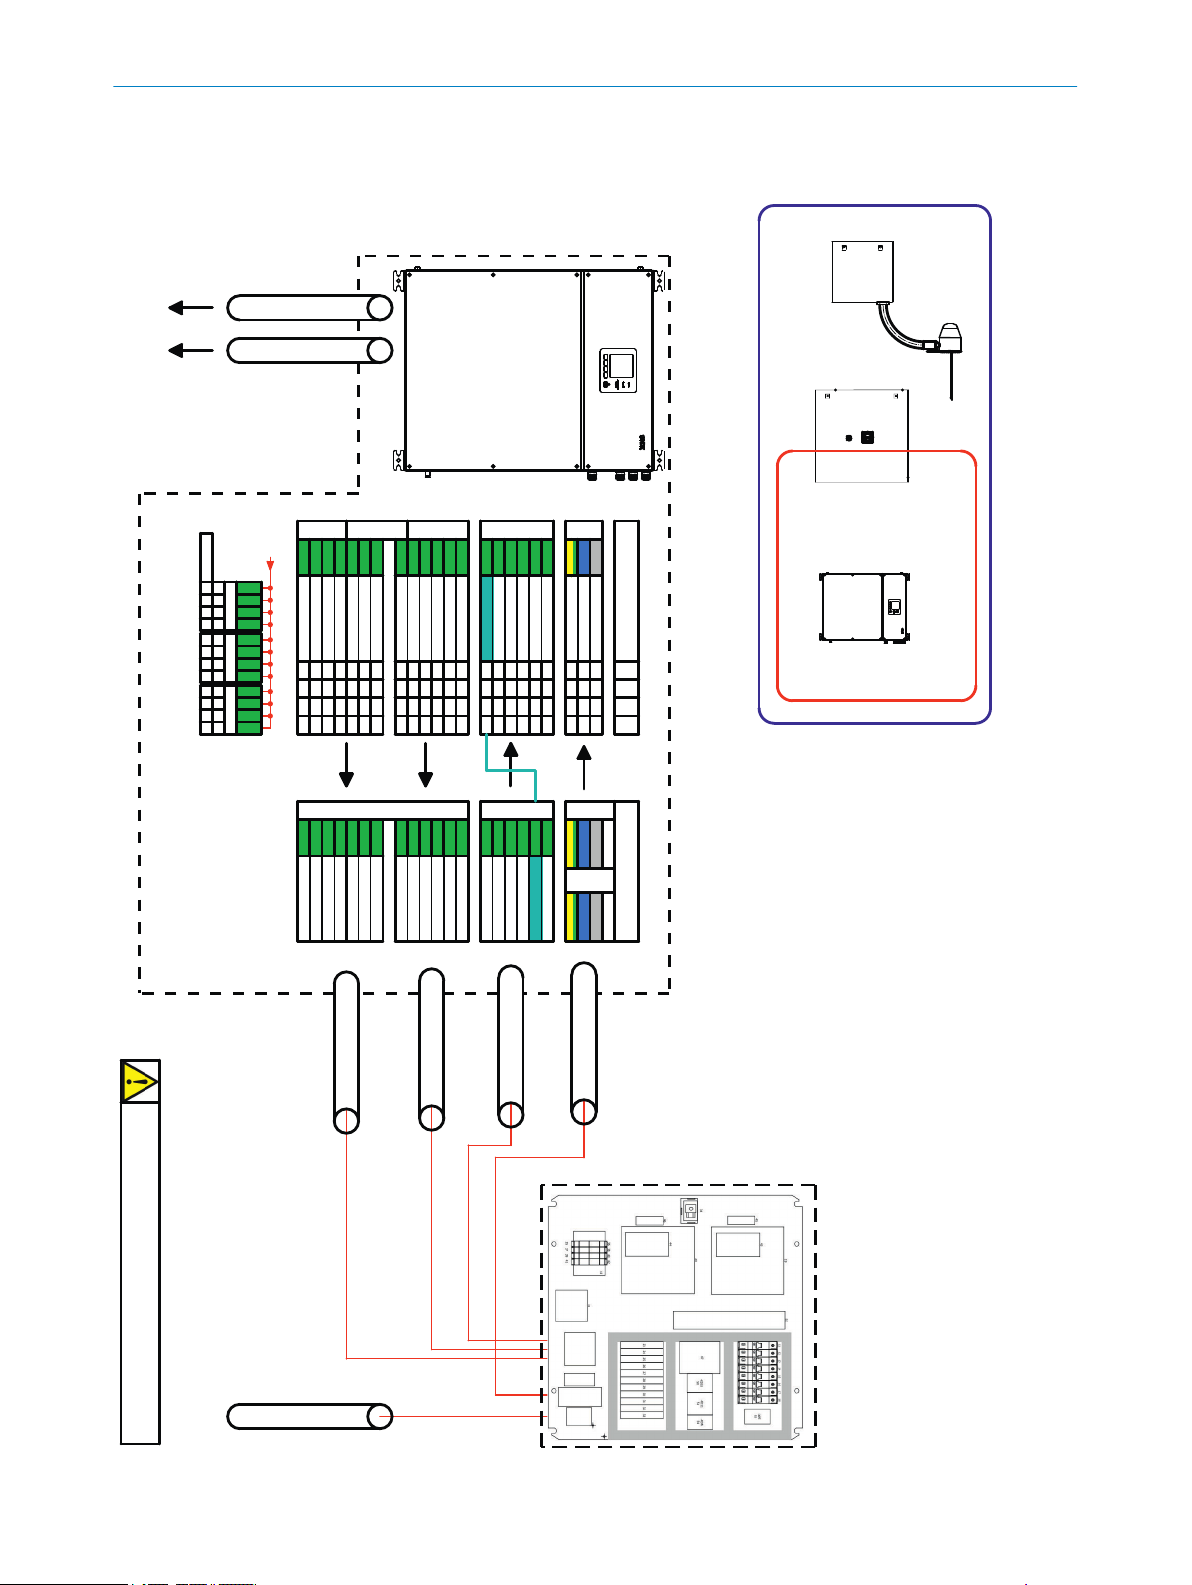
2.6.4 Lay and connect the electric line between distribution unit and analyzer
MULTI version distribution unit for two to four measuring points
19
Figure 5: Wiring diagram
8017324/15A2/V6-0/2019-10 | SICK T EC H NI C AL IN F OR M AT I ON | MARSIC200
Subject to change without notice
Page 20
XD61
Analog Signals
All cable diameters are proposals! The customer must check this diameters!
Parameters are e.g.: voltage drop, cable cluster, laying procedure etc.
MARSIC200 Analyzer
Status Signals
supplyes by customer
WD1
UM1
UM5
BQ1
WD4
WD6
WD2
WD3
Marine Line
(7x1,5) 6056230
Marine Line
(3x1,5) 6056215
supplyes by customer
359
1-X3
Status SP10VStandby
2
10
1-X5
sample gas pump
Purge gas
Analyzer (BQ1)
L
N
1-X5
2
5
8
11
X X X X
24V*7Test gas
1
External Power supply
supplyes by customer
distributor unit
XD61
XD2
XD21
XD1
123
XD62
* connect 24V at 1-X5
according to the wiring diagram
Distribution unit (UM5)
456
XD2
5
5N
5PE
SP1 SP2...SP4
Status SP10VStandby
123
sample gas pump
Purge gas
Test gas
24V*
4
XD61
24V+
/1-X5
PE
INSTALLATION
2
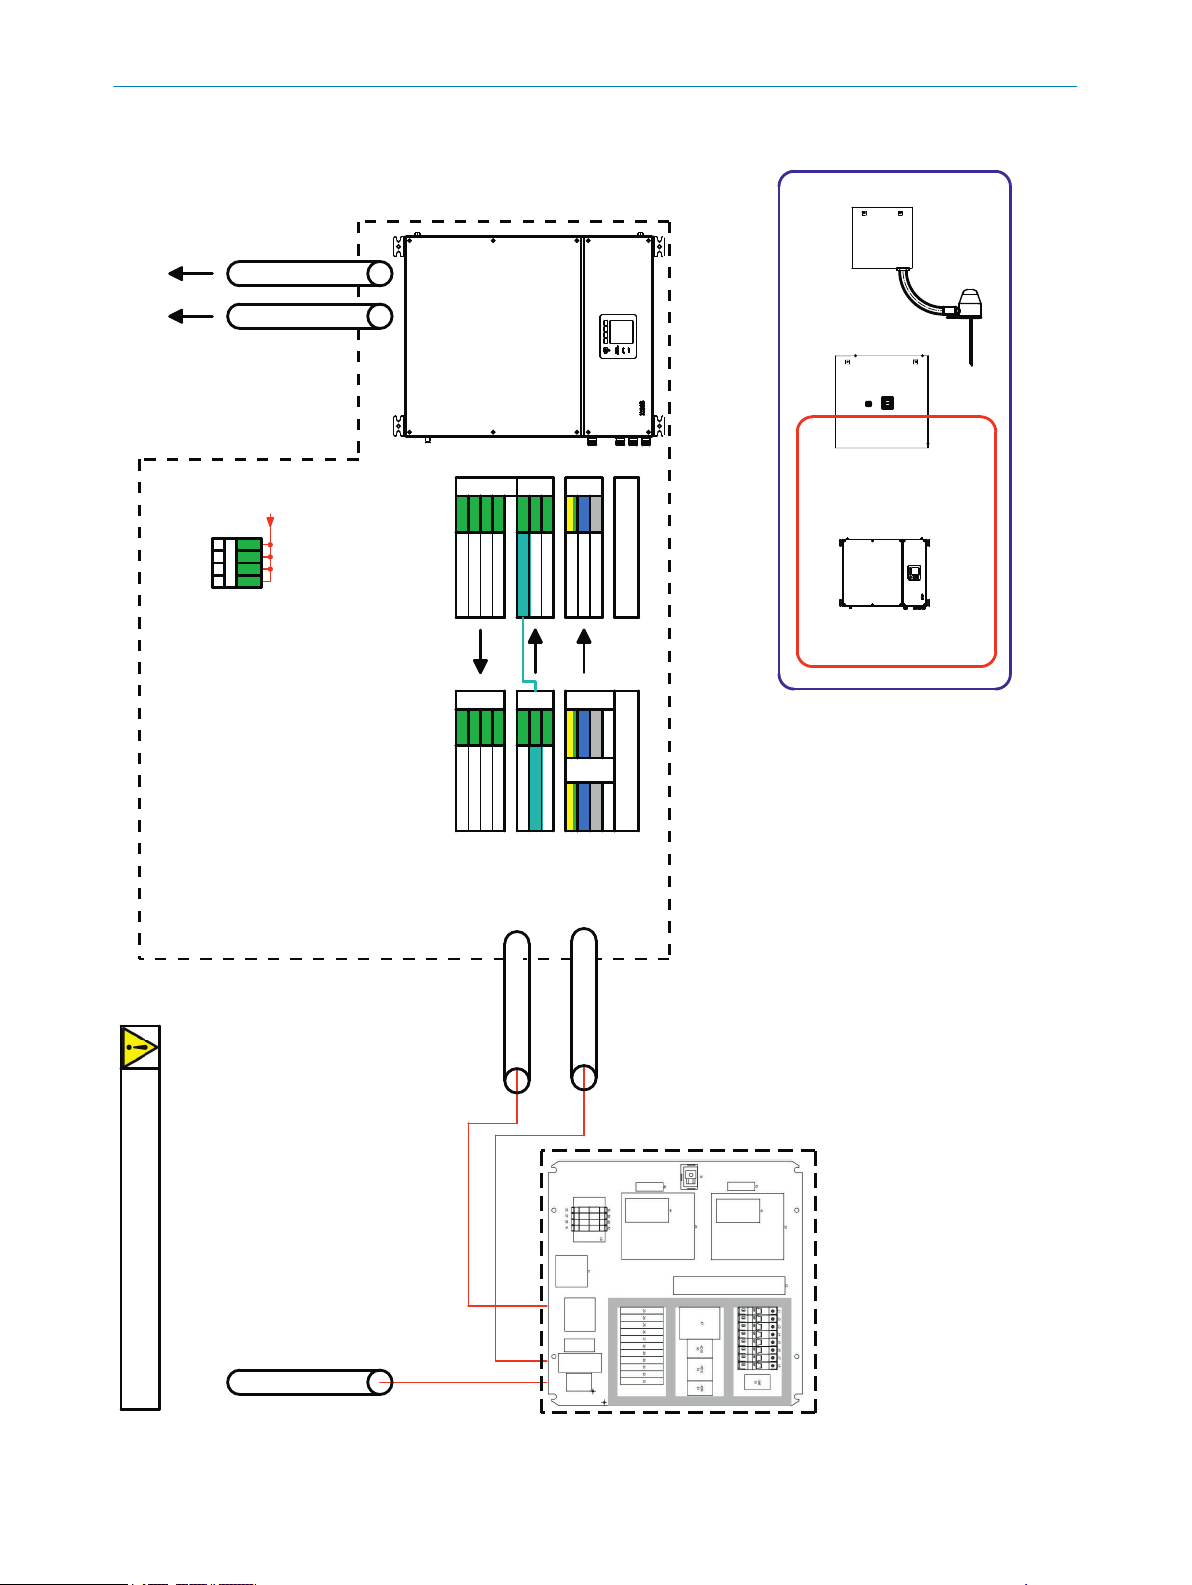
SINGLE version distribution unit for one measuring point
Figure 6: Wiring diagram
20
T EC H NI C AL IN F OR M AT I ON | MARSIC200 8017324/15A2/V6-0/2019-10 | SICK
Subject to change without notice
Page 21
min.70
10°
~
~30
INSTALLATION 2
NOTE
Pay attention to the function indicator of the terminals!
Example: 1-X3:9 “Standby” to XD62:2 “Standby”.
Line Connection
External power supply on distribution unit Distribution unit: see "Electrical installation of distribution
unit", page 31
Power supply from distribution unit to analyzer Distribution unit: see "Electrical installation of distribution
unit", page 31
Analyzer: see chapter 2.11.3
Status signals between analyzer and distribution unit Analyzer: see chapter 2.11.3
Distribution unit: see "Electrical installation of distribution
unit", page 31
External analog and digital signals, Ethernet to analyzer Analyzer: see chapter 2.11.3
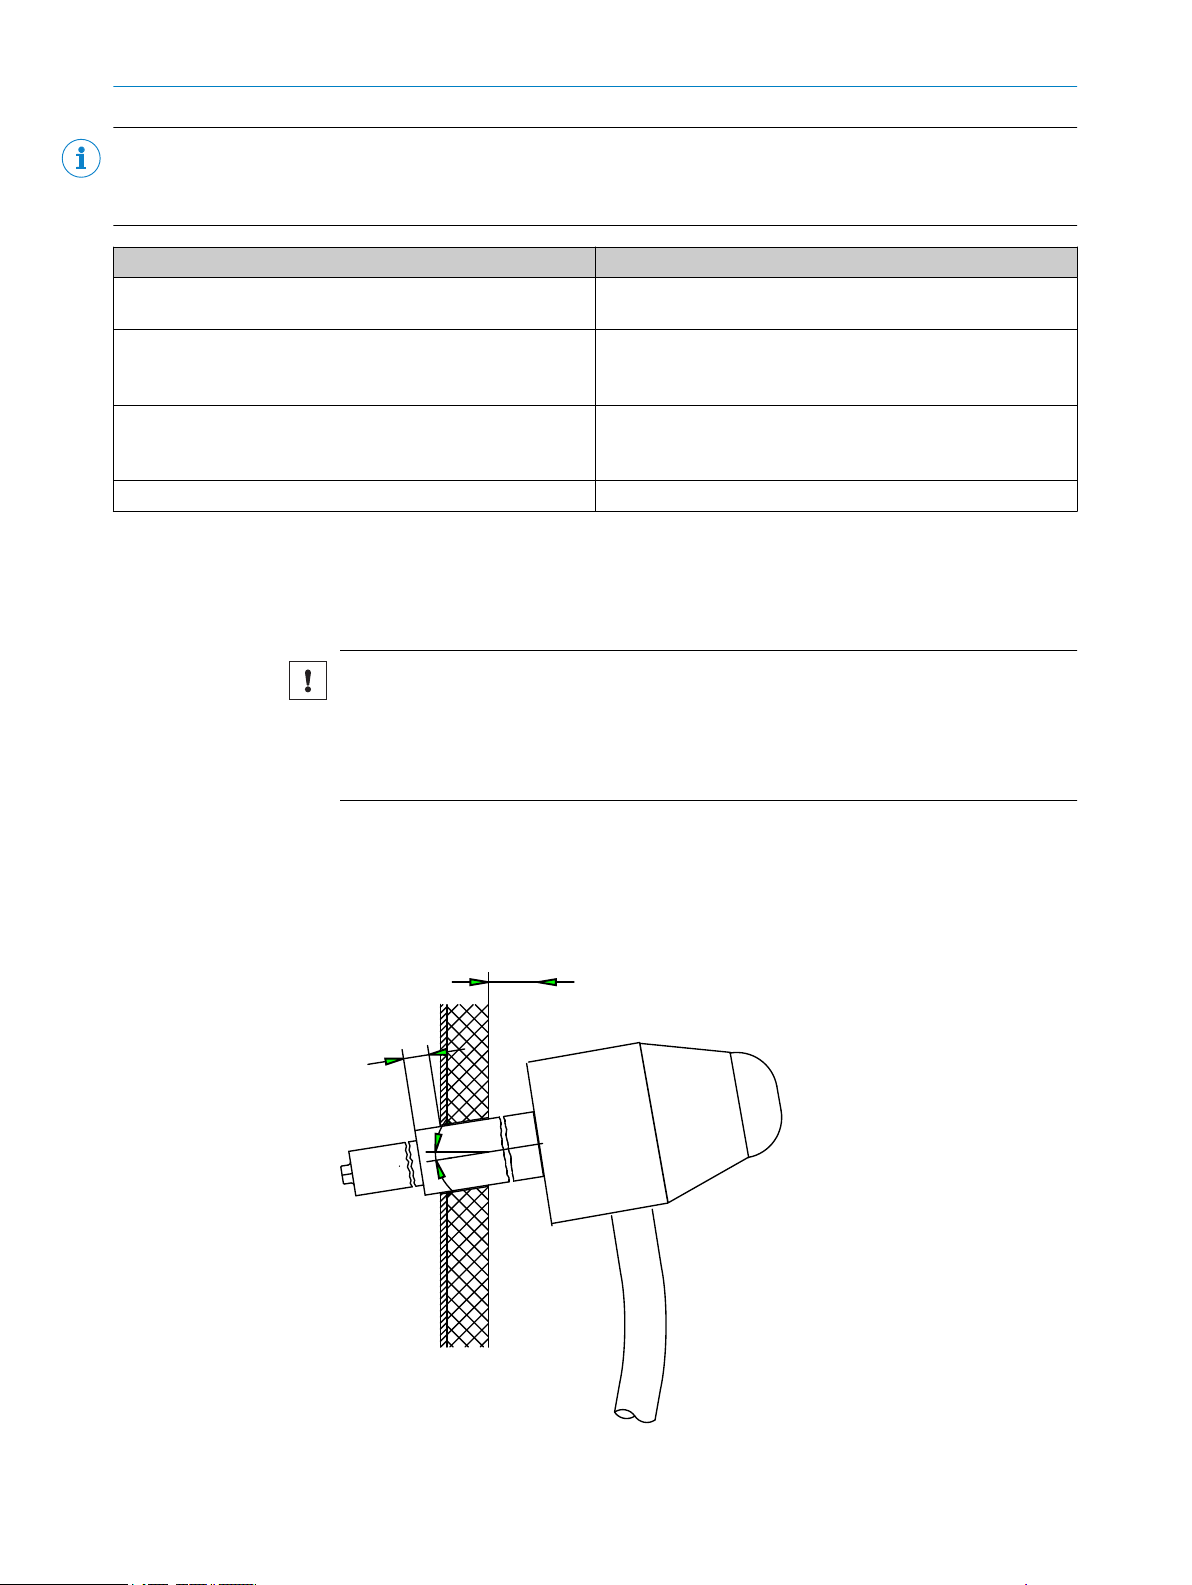
2.7 Installing the sampling probe
The sampling probe is system-specific: For information on the installation of the sam‐
pling probe, see the enclosed Operating Instructions of the sampling probe.
NOTICE
Risk of soiling the measuring system
First install the gas sampling system on the exhaust duct just before the analyzer
b
is switched on.
Switch the instrument air feed on immediately after installing the sampling tube.
b
Installation
Install the sampling probe in accordance with the specifications in the Operating
b
Instructions of the sampling probe.
w
Fit the sampling tube with the probe tip tilted down about 10°.
8017324/15A2/V6-0/2019-10 | SICK T EC H NI C AL IN F OR M AT I ON | MARSIC200
Subject to change without notice
21
Page 22

2 INSTALLATION
Gas connections
Connect the following gas connections:
b
Heated sample gas line
°
Avoid cold bridges
No cold bridges may occur on the sample gas line connection on the gas sampling
probe.
Line marked red: Sample gas line
•
Line marked blue: Instrument air
•
No cold bridges here, close flush or insu‐
1
late
Electrical connections
Connect the following electric lines:
b
Power supply from sample conditioning
°
“Heating” signal line to sample conditioning
°
2.8 Installing the sample gas line
Figure 7: Heated sample gas line
Installation
•
Lay the sample gas line, starting from the sample conditioning towards the sam‐
pling probe.
22
ATTENTION
Observe the laying instructions for the sample gas line (enclosed with the sample gas
line).
T EC H NI C AL IN F OR M AT I ON | MARSIC200 8017324/15A2/V6-0/2019-10 | SICK
Subject to change without notice
Page 23

INSTALLATION
Assembly on the sampling probe
ATTENTION
Do not damage the core of the sample gas line.
A hose cutter must be used to cut off the core.
b
Shorten the PTFE core of the heated sample gas line to the length of the cap nut
•
of the screw fitting.
Assembly on the sampling probe: see "Installing the sampling probe", page 21.
•
Assembly on the sample conditioning
1. Clamp the cable bushing on the corrugated hose approx. 10 cm behind the start
of the corrugated hose.
The groove on the cable bushing must point away from the hose end.
2
Corrugated hose
1
Cable bushing
2
Groove in cable bushing
3
2 clamping screws (from below or above)
4
4 frame screws
5
Frame
6
Groove in frame
7
2. Push the frame with 2 clamping screws over the cable bushing and fasten lightly.
The groove of the frame must point towards the hose end (in the direction of the
enclosure side).
3. Insert the line in the enclosure.
4. Preassemble the frame on the enclosure.
5. Align the sample gas line so that the electric line points upwards.
°
The line marked red (sample gas) must continually lead downwards (danger
of clogging by condensate).
6. Connect the lines:
w
The line marked red on the cooler inlet (cooler is system-specific).
w
The line marked blue on the solenoid valve KK10, connection “A”.
8017324/15A2/V6-0/2019-10 | SICK T EC H NI C AL IN F OR M AT I ON | MARSIC200
Subject to change without notice
23
Page 24

P
A
R
2 INSTALLATION
Sample gas cooler (system-specific)
1
Solenoid valve KK10 for feeding test gas to the sampling probe
2
Terminal box
3
R Instrument air connection
P Connection of span gas/test gas
A Connection to heated sample gas line
7. Screw the lines tight (see "Tube screw fitting", page 9).
8. Check the red mark (sample gas line) and the blue mark (instrument air line)
match the connections on the sample gas cooler (see Operating Instructions,
Chapter “Removing and fitting the sampling probe”).
9. Screw the frame tight (1.5 Nm).
10. Screw the clamping screws tight (1.5 Nm).
11. Electrical connection: See the wiring diagram on the inside of the terminal box
cover.
Core cross-section: 1.5 mm
°
Connections: BK 1, BK 2, GNYE: See identification rings on the crimp lead
°
end sleeves.
2.
2.9
Installing the sample conditioning
2.9.1 Fitting the sample conditioning
Figure 8: Sample conditioning (exterior view)
Enclosure duct for heated sample gas line
1
Sample gas cooler with hose pump
2
Cooler sample gas inlet (inlet of heated sample gas line)
3
Figure 9: Sample conditioning (interior view,
the sample gas cooler is system-specific)
24
T EC H NI C AL IN F OR M AT I ON | MARSIC200 8017324/15A2/V6-0/2019-10 | SICK
Subject to change without notice
Page 25

INSTALLATION 2
Sample gas outlet from cooler (outlet of unheated sample gas line)
4
Solenoid valve KK10 for feeding test gas to the sampling probe
5
Hose pump for draining the condensate
6
Acid condensate escapes from the condensate outlet.
Make sure the condensate is safely collected or drained off.
b
The hose end can end max. 10 m above the condensate outlet.
b
CAUTION
Risk of chemical burns by acid medium
Take appropriate protective measures for work (for example, by wearing a safety
b
mask, protective gloves and acid resistant clothes).
In case of contact with the eyes, rinse immediately with clear water and consult a
b
doctor.
Fasten the enclosure on a suitable panel using the mounting bracket provided.
b
Drilling plan: see "Dimensional drawings", page 55.
°
Fit the enclosure horizontal.
°
Observe the clearances for the heated sample gas line and the PTFE lines:
°
see "Dimensional drawings", page 55.
Observe the relevant ambient conditions: see "Technical data", page 55.
°
2.9.2 Gas connections on sample conditioning
Overview of connection positions
8017324/15A2/V6-0/2019-10 | SICK T EC H NI C AL IN F OR M AT I ON | MARSIC200
Subject to change without notice
25
Page 26

2 INSTALLATION
Connections
Cooler inlet (observe designation on
1
cooler)
Cooler outlet (observe designation on
2
cooler)
Solenoid valve KK10, always acti‐
3
vated during normal operation (LED
on)
1
2
Gas inlet
Gas outlet
Condensate inlet in hose pump
1
Condensate outlet from hose pump
2
Lay all PTFE tubes into the enclosure from the bottom.
b
Enclosure duct of heated sample gas line: see "Installing the sample gas line",
b
page 22.
Connect the lines.
b
Line Connect to:
Line marked red (sample gas line) from heated sam‐
ple gas line
Line marked blue (instrument air/span gas) from
heated sample gas line
PTFE line from external instrument air Solenoid valve KK10: Inlet “R”
PTFE line from external span gas (only possible for
measuring point 1)
PTFE line sample gas outlet to distribution unit Cooler: Gas outlet (see Figure above)
Condensate outlet Cooler: Condensate outlet of hose pump
Cooler: Gas inlet (see Figure above)
Solenoid valve KK10: Outlet “A”
Solenoid valve KK10: Inlet “P”
If span gas is not connected: Close off the inlet with
a dummy plug.
Cooler
The sample gas cooler is system-specific.
For further information concerning the sample gas cooler, see the Operating
b
Instructions of the sample gas cooler.
26
Condensate outlet
The condensate outlet is at the bottom of the cooler.
Acid condensate escapes from the condensate outlet.
T EC H NI C AL IN F OR M AT I ON | MARSIC200 8017324/15A2/V6-0/2019-10 | SICK
Subject to change without notice
Page 27

Make sure the condensate is safely collected or drained off.
b
The hose end can end max. 10 m above the condensate outlet.
b
2.9.3 Electrical installation of sample conditioning
Terminal box
1
Lay the electric lines through the enclosure openings.
b
Connect the electric lines.
b
For the circuit diagram, see the attached system documentation and inside
°
the cover of the terminal box.
INSTALLATION 2
Electric line Connect to:
Power supply from distribution unit
Power supply to sampling probe
Cooler and probe status on distribution unit
Control signals to sample conditioning from distribu‐
tion unit
“Heating” status from sampling probe
Enclosure grounding optional
2.10 Installing the distribution unit
View
MULTI version distribution unit for two to four measuring points (example)
See enclosed system documentation
Figure 10: Distribution unit (exterior view)
8017324/15A2/V6-0/2019-10 | SICK T EC H NI C AL IN F OR M AT I ON | MARSIC200
Subject to change without notice
Figure 11: Distribution unit (interior view sys‐
tem-specific)
27
Page 28

2 INSTALLATION
Main switch
1
ON: Voltage is on
OFF: Voltage is off
“Stand-by” switch
2
OFF: Regular operation
ON: Stand-by
Sample gas inlet from sam‐
3
ple conditioning(s)
Solenoid valve KK1, inlet
4
“R”
Connection: D/N 4/6
Solenoid valve KK1, inlet
“P”
Connection: D/N 4/6
Solenoid valve KK1, outlet
“A”
Connection: D/N 4/6
Sample gas pump For extraction of the respective active measuring point
5
Bypass pump For advance extraction of the sample gas for 2 ... 4 measur‐
6
Flow indicator with adjust‐
7
ment wheel
Sample gas fine filter Serves to filter the sample gas for all measuring points before
8
Water trap The water trap protects the analyzer against damp sample
9
Sample gas outlet to ana‐
ß
lyzer
Main switch set to “OFF”:
Sample conditioning voltage: “OFF”
•
Sampling probe voltage: “OFF”
•
The purge air valve is “open when no current is
°
applied”: The sampling tube is flushed with instrument
air
Sample gas line heating: “OFF”
•
Analyzer voltage: “OFF”
•
Main switch set to “ON”:
All voltages come on.
•
“Stand-by” switched to ON:
The maintenance signal on the analyzer becomes “active”
•
and the yellow LED lights
The measured values continue to “live”
•
A zero point validation is performed
•
The sample gas pump and the (optional) bypass pump go
•
off
The heaters remain switched on
•
The sampling tube is flushed with instrument air
•
“Stand-by” switched to OFF:
Sample gas pump and the (option) bypass pump are
•
switched on
The system goes into measuring operation: Only the green
•
LED lights on the analyzer
Sample gas inlet
For 1 measuring point: From sample conditioning
For 2 ... 4 measuring points: From measuring point switchover
in distribution unit
Test gas inlet
During test gas adjustment with gas feed on the distribution
unit, the test gas is passed directly to the analyzer.
Gas outlet to analyzer
ing points
Setpoint flow rate: Approx. 60 l/h.
The flow is displayed as measured value on the analyzer.
feeding to the analyzer.
The analyzer signals the flow is too low when the filter clogs
up.
gas.
The analyzer signals the flow is too low when the filter clogs
up.
28
T EC H NI C AL IN F OR M AT I ON | MARSIC200 8017324/15A2/V6-0/2019-10 | SICK
Subject to change without notice
Page 29

Fuse 1 24 V power supply unit
à
Fuse 2...5 1 fuse per measuring point (probe, line, sample conditioning)
Fuse 6 Sample gas pump
Fuse 7 Bypass pump (as from 2 measuring points)
Fuse 8 Analyzer
Measuring point switchover
á
2.10.1 Fitting the distribution unit
INSTALLATION 2
Figure 12: MULTI version distribution unit for
two to four measuring points (example)
Connection of PTFE line from sample
1
conditioning
Connection of PTFE line to analyzer
2
Valve KK1
3
Fasten the enclosure on a suitable panel using the mounting bracket provided.
b
Drilling plan: see "Dimensional drawings", page 55.
°
Fit the enclosure horizontal.
°
Observe the clearance for the PTFE line: see "Dimensional drawings",
°
page 55.
Observe the relevant ambient conditions: see "Technical data", page 55.
°
8017324/15A2/V6-0/2019-10 | SICK T EC H NI C AL IN F OR M AT I ON | MARSIC200
Subject to change without notice
29
Page 30

2 INSTALLATION
2.10.2 Gas connections on distribution unit
Figure 13: SINGLE version distribution unit for
one measuring point (example)
Gas inlet from sample conditioning(s)
1
Gas outlet to analyzer
2
Valve KK1
3
Lay all PTFE tubes into the enclosure from the bottom.
b
Connect the lines.
b
Line Connection of
SINGLE version
PTFE line from sample conditioning
Valve KK1, inlet “R” Measuring point
(sample gas inlet)
PTFE line to analyzer (sample gas out‐
Figure 14: MULTI version distribution unit for
two to four measuring points (example)
Connection of PTFE line from sample
1
conditioning
Connection of PTFE line to analyzer
2
Valve KK1
3
Connection of
MULTI version
switchover “P1-P4”
Sample gas outlet on the enclosure outside
let)
Test gas inlet (zero gas: nitrogen or
instrument air)
1
This gas is used as zero gas during automatic zero point adjustment. When the reference point is
adjusted via the distribution unit (not via the sampling probe), the span gas must be connected to this
inlet during the adjustment.
1
Valve KK1, inlet “P”
30
T EC H NI C AL IN F OR M AT I ON | MARSIC200 8017324/15A2/V6-0/2019-10 | SICK
Subject to change without notice
Page 31

2.10.3 Electrical installation of distribution unit
Figure 15: SINGLE version distribution unit for
one measuring point (example)
Terminal strips
1
Grounding
2
INSTALLATION 2
Lay the electric lines through the enclosure openings.
b
Connect the electric lines.
b
For the circuit diagram, see the attached system documentation and inside
°
the cover of the terminal box.
Electric line Signal Connect to:
External power supply See the wiring diagram in the system documentation
Power supply to sample conditioning See the wiring diagram in the system documentation
Power supply to analyzer See the wiring diagram in the system documentation
Status signals from sample conditioning DI Sampling probe and cooler
See the wiring diagram in the system documentation
Control signals to sample conditioning DO See the wiring diagram in the system documentation
Signal lines to/from analyzer DI See the wiring diagram in the system documentation
DO See the wiring diagram in the system documentation
AI See the wiring diagram in the system documentation
AO See the wiring diagram in the system documentation
Signal lines to/from external DI See the wiring diagram in the system documentation
Optional for stand-by operation
DO See the wiring diagram in the system documentation
Maintenance and status
AI See the wiring diagram in the system documentation
optional
AO See the wiring diagram in the system documentation
Meas. values
Enclosure grounding Inside, bottom right.
Install an external power disconnection unit which disconnects all connectors and
b
fuses near the analyzer. The power disconnection unit must have a unique mark‐
ing and be easily accessible.
Observe the max. power input of the complete system: see "Energy supply",
page 64.
8017324/15A2/V6-0/2019-10 | SICK T EC H NI C AL IN F OR M AT I ON | MARSIC200
Subject to change without notice
31
Page 32

INSTALLATION
2
The local power network for power supply to the system must be installed and
b
safeguarded in accordance with the relevant regulations.
A protective conductor must always be connected to PE.
b
2.10.4 Measuring point switchover
Measuring point switchover
For systems with 2 to 4 measuring points, a measuring point switchover with advance
extraction of the sample gas is installed.
Figure 16: Measuring pont
switchover for 4 measuring points
(example)
Measuring point
1
switchover
Advance extraction
2
Installation: see "Gas flow diagram", page 59.
b
Programming the measuring point switchover: see "Measuring points - automatic",
b
page 52.
32
T EC H NI C AL IN F OR M AT I ON | MARSIC200 8017324/15A2/V6-0/2019-10 | SICK
Subject to change without notice
Page 33

2.11 Installing the analyzer
Exterior view
INSTALLATION 2
Figure 17: Analyzer (exterior view)
Analyzer top part with electronics
1
Control unit
2
Analyzer bottom part with measurement technology
3
Sample gas inlet Screw fitting: DN4/6 stainless steel
4
Sample gas outlet Screw fitting: DN4/6 stainless steel
5
On/Off switch The On/Off switch switches the analyzer on/off.
6
Data interfaces Analog and digital inputs and outputs
7
Fuse Check the fuse
8
Measuring module CO2 (FINOR)
9
Measuring module O2 (OXOR E) optional
ß
Measuring module SO2/NOx (DEFOR)
à
Measuring module flow/humidity/pressure (gas
á
module)
Figure 18: Analyzer (interior view)
The digital outputs switch to “Zero”
•
The analog outputs switch to “Zero”
•
8017324/15A2/V6-0/2019-10 | SICK T EC H NI C AL IN F OR M AT I ON | MARSIC200
Subject to change without notice
33
Page 34

2 INSTALLATION
2.11.1 Fitting the analyzer
Figure 19: Clearance for PTFE lines
PTFE line (sample gas inlet)
1
PTFE line (sample gas outlet)
2
Fasten the analyzer on a suitable panel using the mounting bracket provided.
b
Drilling plan: see "Dimensional drawings", page 55.
°
Fit the enclosure horizontal.
°
Observe the clearance for the PTFE line: see "Dimensional drawings",
°
page 55.
Observe the relevant ambient conditions: see "Technical data", page 55.
°
2.11.2 Gas connections on analyzer
34
Sample gas inlet (seen from the front,
1
bottom left)
Sample gas outlet (seen from the front,
2
bottom right)
Lay all PTFE tubes into the enclosure from the bottom.
b
Connect the lines.
b
T EC H NI C AL IN F OR M AT I ON | MARSIC200 8017324/15A2/V6-0/2019-10 | SICK
Subject to change without notice
Page 35

Line Connect to:
PTFE line from distribution unit (sample gas
inlet)
PTFE line sample gas outlet Lower part of analyzer, to enclosure duct “Out‐
Sample gas outlet
Discharge the sample gas outlet in a suitable environment.
b
The sample gas output must be open against the ambient pressure.
b
WARNING
The exhaust gases are toxic
Dispose of the exhaust gases in a suitable manner.
b
2.11.3 Electrical installation of analyzer
INSTALLATION 2
Lower part of analyzer, to enclosure duct
“Inlet”
let”
Power voltage connection at terminal
1
strip
Signal connections (I/O)
2
Distributor board with Ethernet for MPR
3
(option), Modbus, service interface (LAN)
Electric line Connect to:
Power supply from distribution unit Terminal strip near On/Off switch
Signal lines to/from distribution unit See attached circuit diagram
Analyzer grounding On the right of the enclosure outside
MPR for remote maintenance via Ethernet
(option)
PC with SOPAS ET (Ethernet) (option)
Modbus
In analyzer upper part on distribution board
RJ45 connection 0X5 “LAN”
NOTE
The green coiled network line in the analyzer bottom part serves as spare line and does
not have to be connected.
8017324/15A2/V6-0/2019-10 | SICK T EC H NI C AL IN F OR M AT I ON | MARSIC200
Subject to change without notice
35
Page 36

Back Enter
See logbook
1 1
2 2
3 3
4 4
Meas.point (MPi) .5.10.1.1
./Parameter/Special fct.
On
On
On
On
INITIAL START-UP
3
3 Initial start-up
3.1 Initial start-up
NOTE
Prerequisite: The system has been fully installed and connected
1. Check installation is correct.
2. Instrument air must be available on the sample conditioning and zero gas on the
3. Remove the red protective foil from the control unit on the analyzer.
4. Switch on all fuses in the distribution unit.
✓
5. Set the Stand-by switch on the distribution unit to OFF (normal operation).
6. Set the number of available measuring points.
distribution unit.
The LEDs on the control unit are on, the measured values blink.
Four measuring points are activated upon delivery
°
Set the available number of measuring points:
Login as “Service” on the operator panel in menu Login.
b
Call up menu Parameter/Special fct./Meas.point autom./Meas.point
b
(MPi).
Activate each measuring point desired (set to “On”).
b
7. Set the date and time in menu Parameter/Date-Time.
8. Wait until the system has warmed up (approx. 2 hours).
9. The system performs an automatic zero point adjustment.
10. The green LED goes on, the measured values do not blink and MEASURE is shown
on the screen
11. Check the flow rate on the flowmeter (in the distribution unit): Approx. 60 l/h. Set
on the flowmeter when necessary.
12. Check that only the green LED lights on the control unit.
When the yellow or red LED is on: Press the “DIAG” button and/or check in
°
the logbook.
13. Check the time. Set the time, if required: Menu: Parameter/Date-Time.
14. Configure the test gas concentration in the respective menu on the control unit:
See “Operating Instructions MARSIC200”.
15. Perform manual test gas adjustment: See “Operating Instructions MARSIC200”.
16. Check measured values for plausibility.
17. Perform the leak tightness check: See “Operating Instructions MARSIC200”.
✓
The system is in operation.
36
T EC H NI C AL IN F OR M AT I ON | MARSIC200 8017324/15A2/V6-0/2019-10 | SICK
Subject to change without notice
Page 37

INITIAL START-UP 3
NOTICE
If you change parameters in the control unit (BCU) as required by the operating com‐
pany:
Save the BCU settings in a suitable manner (for example on a USB stick) and keep
b
this backup.
To do this, connect the analyzer to a PC and use the SICK SOPAS-ET software (see
"Backup of settings", page 53).
8017324/15A2/V6-0/2019-10 | SICK T EC H NI C AL IN F OR M AT I ON | MARSIC200
Subject to change without notice
37
Page 38

4 CONFIGURATION SOFTWARE
4 Configuration software
4.1 Software SOPAS ET
The MARSIC200 can be easily configured on a PC with SOPAS ET.
SOPAS ET runs on an external PC connected to the MARSIC200 via the Ethernet inter‐
face.
You can download SOPAS ET free of charge from the SICK website.
Install SOPAS ET on a laptop.
•
Connect the laptop to the MARSIC200 analyzer (Ethernet cable): see "Electrical
•
installation of analyzer", page 35.
Open SOPAS ET.
•
In SOPAS ET: Click “Device search”.
•
The MARSIC200 modules are displayed:
•
Gas module (measuring module for flow, moisture and pressure of the sam‐
°
ple gas in the analyzer)
DEFOR (measuring module for NO, NO2 and SO2 of the sample gas in the
°
analyzer)
FINOR (measuring module for CO2 of the sample gas in the analyzer)
°
OXOR (measuring module for O2 of the sample gas in the analyzer (optional)
°
Mark all modules and drag and drop them into the left window (Project).
•
Save the project.
•
Login to configure the modules (click “Login”).
•
Enter the password, see "Passwords", page 38.
To configure: Double-click on the module window.
•
4.2 Passwords
NOTE
See “Technical Information BCU” for menus based on SOPAS ET.
There are three user levels each with an own password.
The passwords are the same for operation using the analyzer control unit and for using
SOPAS ET.
User level Password (case-sensitive)
MARSIC EMI
Authorized operator HIDE
Service hidden
38
T EC H NI C AL IN F OR M AT I ON | MARSIC200 8017324/15A2/V6-0/2019-10 | SICK
Subject to change without notice
Page 39

5 Adjustment functions
5.1 Configuring test gases (Test Gas Table)
Function
The Test Gas Table serves as basis for adjustments. 12 different test gas settings can
be programmed. Each test gas setting can be used for up to 8 components. The test
gas settings can also be used for validation measurements.
NOTE
The same real test gas can be used in several test gas settings. This means a cer‐
•
tain test gas can be used for different adjustment procedures.
Recommendation: Only program one adjustment or validation function for each
•
test gas.
Suitable test gas settings are normally preprogrammed at the factory.
•
Procedure
1. Call up BCU/Parameter/Test gas table.
ADJUSTMENT FUNCTIONS 5
Figure 20: Menu “Test gas table” – Table (example)
2. Deactivate Live view.
3. Select the desired Table rows.
4. Select Edit.
8017324/15A2/V6-0/2019-10 | SICK T EC H NI C AL IN F OR M AT I ON | MARSIC200
Subject to change without notice
39
Page 40

5 ADJUSTMENT FUNCTIONS
Figure 21: Menu “Test gas Table” – Edit (example)
1
2
3
4
5
6
7
8
9
ß
Test gas number (cannot be changed).
= this test gas can be used for adjustments/validations.
Test gas name (free text field, max. 20 characters).
Boolean variable to control this test gas (cannot be changed).
= the sample gas pump is switched off automatically when this test gas is
used.
= this test gas can be used for the specified component.
Tag of the component for which this test gas is to be used.
Component name in the Sensor module (cannot be changed).
Setpoint value of the test gas in the physical unit of the measuring component.
▸ Use the decimal point (.) for numerical values.
Wait time after switching to the test gas. The measurement for the adjust‐
ment/validation first starts after the flush time/wait time.
à
á
Cuvette: Concentration of the adjustment cuvette
= the test gas is used for zeo point validations.
Simultaneous use for reference point validations is not possible.
â
= the test gas is used for reference point validations..
Simultaneous use for zero point validations or reference point validations with
adjustment cuvette is not possible.
ã
= the test gas is used for zero point adjustments.
Simultaneous use for reference point adjustments is not possible.
ä
= the test gas is used for reference point adjustments.
Simultaneous use for zero point validations or reference point validations with
adjustment cuvette is not possible.
1
2
40
T EC H NI C AL IN F OR M AT I ON | MARSIC200 8017324/15A2/V6-0/2019-10 | SICK
Subject to change without notice
Page 41

ADJUSTMENT FUNCTIONS 5
å
= the test gas is used for reference point validations with adjustment
cuvette.
Simultaneous use for reference point validations is not possible.
æ
= the test gas is used for reference point adjustments with adjustment
cuvette.
Simultaneous use for reference point adjustments is not possible.
ç
= the test gas is used for linearity adjustments.
Simultaneous use for other adjustments is not possible.
1
Tag format: SiMVj (i = Sensor module number, j = measured value number in the Sensor module)
2
The longest flush time is effective when the test gas is used simultaneously for several components.
NOTE
The settings are first effective after Save has been selected.
5.2 Performing a manual adjustment
Function
“Manual adjustment” means a single adjustment or validation procedure is selected
and manually started.
NOTE
The standard setting with checkbox “Automatic” selected (see figure 23, page 43)
means the test gas is fed automatically via solenoid valves controlled by the MAR‐
SIC200 digital outputs. The controlling output is defined in the respective test gas set‐
ting (“Action on start” see "Configuring test gases (Test Gas Table)", page 39). The test
gas can also be fed manually.
Procedure
Inform connected locations on the impending interruption in measuring operation.
b
1. Call up BCU/Maintenance/Manual adjust.
2. Select the measuring component for which the procedure is to be applicable
([ << ] [ >> ]).
3. Select the desired function ([ << ] [ >> ]).
✓
The Start button is displayed when a suitable test gas setting exists for the mea‐
suring component and function combination.
4. Select Start.
With manual test gas feed With automatic test gas feed
✓
Actual state = Test gas
5 Feed the suitable test gas into the sam‐
ple gas inlet of the MARSIC200.
6 Wait until Sample gas is displayed as
actual state.
7 Now feed sample gas into the sample
inlet again.
1
8 Wait until Stop is displayed as actual
state.
✓
The manual adjustment has com‐
✓
The automatic procedure starts.
Actual state = part of the procedure
currently running (see table 5,
page 42)
5 Wait until Stop is displayed as actual
state.
✓
The manual adjustment has com‐
pleted.
pleted.
1
Alternative (when a further manual adjustment is to follow): The test gas for the next manual adjust
8017324/15A2/V6-0/2019-10 | SICK T EC H NI C AL IN F OR M AT I ON | MARSIC200
Subject to change without notice
41
Page 42

5 ADJUSTMENT FUNCTIONS
Table 5: Procedure phases during manual adjustment
Actual state Internal function
Stop Function idle
Test gas Wait for flush time to elapse (after switching to test gas)
Measuring Determine measured values with the test gas
Calculate Calculate mean value from measuring time, calculate devia‐
Sample gas Wait for flush time to elapse (after switching to sample gas)
Table 6: Information in menu Manual adjustment during the procedure
Identifier Significance
Actual state Part of the procedure running (see table 5, page 42)
Meas. value Current measured value of component
Actual countdown timer (SCCDGi) Name of countdown timer running
Remaining time Remaining time of countdown timer running
tion from setpoint, adapt adjustment
42
T EC H NI C AL IN F OR M AT I ON | MARSIC200 8017324/15A2/V6-0/2019-10 | SICK
Subject to change without notice
Page 43

ADJUSTMENT FUNCTIONS 5
Figure 22: Menu Manual adjust (example)
1
2
3
4
5
6
7
8
9
ß
à
á
â
Name of the measured values to be calculated from this sensor component
Measuring component for which this manual adjust is applicable
Number of the Sensor module to measure the measuring component
Number of sensor component in the Sensor module
= standard setting: Adjustment runs with preset time sequences.
= adjustment steps are started singly by the user (manual test gas feed).
Select measured value(s)
Adjustment or validation to be performed
Select function
Name of test gas to be used
Setpoint value of the test gas / concentration of the adjustment cuvette
Wait time after switching to the test gas; then measurement starts
Defines how long the measured values of the test gas are measured
Internal interval for computation of the values measured
1
2
8017324/15A2/V6-0/2019-10 | SICK T EC H NI C AL IN F OR M AT I ON | MARSIC200
Subject to change without notice
43
Page 44

5 ADJUSTMENT FUNCTIONS
ã
Wait time after switching to sample gas, then the manual adjustment is
regarded as completed
ä
1
2
Start the selected manual adjustment
Empty field: No suitable test gas setting programmed for the selected function
Actual value for the adjustment = mean value of measured values within the measuring time
Result
Figure 23: Menu Manual adjust with result (example)
1
2
3
Cancel the running manual adjust
Error shown when no result available. Erroneous sequence or drift overrun.
The actual measured value measured
5.3 Automatic adjustments/validations
44
T EC H NI C AL IN F OR M AT I ON | MARSIC200 8017324/15A2/V6-0/2019-10 | SICK
Subject to change without notice
Page 45

5.3.1 Function of automatic adjustments/validations
8 adjustment or validation procedures that can run fully automatically can be pro‐
grammed. Each procedure uses one of the test gases configured in the Test Gas Table
(see "Configuring test gases (Test Gas Table)", page 39).
Programming defines which measuring component is to be adjusted or validated with
the procedure and which adjustment or validation function is to be used. Several com‐
ponents can be adjusted in one function.
5.3.2 Start options
Manual start:
•
Use menu Operator commands (see "Start options", page 45).
Automatic start (in regular intervals):
•
Use a long-term timer in the start conditions (see “Technical Information BCU”).
Remote-controlled start:
•
Control the value of a Boolean variable (VBVi) with a digital input (see “Technical
Information BCU”).
Programmed start conditions:
•
Calculate the value of a Boolean variable (BVIi) with a formula (see “Technical
Information BCU”).
For representation of the adjustment and validation results (see “Technical Information
BCU”).
ADJUSTMENT FUNCTIONS
5
5.3.3 Programming automatic adjustments/validations
1. Menu: Call up BCU/Parameter/Adjustment/Validation.
Figure 24: Menu Adjustment / Validation – Table (example)
1
2
3
4
5
6
7
Index number of the adjustment or validation procedure
Programmed name
= automatic starts activated
Start time of next automatic function
Start date of next automatic function
Component X that will be addressed by the respective function
Number of the next function to start automatically (only when procedures are
chained)
2. Deactivate Live view.
3. Select the desired Table rows.
4. Select Edit.
8017324/15A2/V6-0/2019-10 | SICK T EC H NI C AL IN F OR M AT I ON | MARSIC200
Subject to change without notice
45
Page 46

5 ADJUSTMENT FUNCTIONS
Figure 25: Menu Adjustment / Validation – Edit (example)
1
2
Index number of the adjustment or validation procedure
Procedure name (freely selectable text)
Settings for automatic start of this procedure:
3
4
5
Time of first start of this procedure (format: hh:mm = Hours:Minutes)
Date of first start of this procedure (format: yyj-mm-dd = Year-Month-Day)
Time interval in which this procedure regularly starts automatically (hours,
days or weeks).
6
7
= starts are activated (time-controlled starts).
The fields below start time and start date show the next start.
Component X (up to 8 components can be processed by one procedure):
8
9
ß
à
á
â
ã
ä
å
æ
ç
1
2
3
4
5
6
Tag of component
Name of component in Sensor module
Function selected for this component
Flush time set from the test gas settings (information)
Name of test gas from the test gas settings (information)
Sequence for procedure execution
Test gas flush time for this adjustment/validation procedure
Duration of measurements (seconds)
Internal processing duration (drift calculation, data storage)
Flush time with sample gas after the adjustment (seconds)
If required: Index number of the procedure to be started automatically after
this procedure.
When the same function is selected for all components and the same test gas is planned, the function is
executed simultaneously for all components during the procedure. Otherwise the functions are executed
sequentially during the procedure.
Functions with identical execution position run at the same time.
When the same test gas is used for all functions: The longest of the individual test gas flush times (used
automatically by the procedure). Otherwise: “0” (= the individual test gas flush times are valid).
The mean value of measured values during the measuring time is used as actual value of the measure‐
ment.
The procedure first has the status completed after this flush time.
Starts immediately after the end of this procedure.
1
2
3
4
5
6
46
T EC H NI C AL IN F OR M AT I ON | MARSIC200 8017324/15A2/V6-0/2019-10 | SICK
Subject to change without notice
Page 47

6 Tests and settings
6.1 Information
NOTE
SOPAS ET is required for the tests and settings: see "Software SOPAS ET", page 38.
6.2 Setting the time
Date and time setting is synchronized to that of the PC.
Open SOPAS ET and connect to the MARSIC200.
b
Menu: Parameter/Device.
b
Click “Time XX:XX” to transfer the time setting of the PC to MARSIC200.
b
TESTS AND SETTINGS 6
6.3 Interfaces (I/O)
1
2
3
For 2 “Signal connections”: See the wiring diagram in the system documentation for
the terminal plan.
Ref. 3 “Modbus”: Setting the IP address, see “Operating Instructions BCU” and “Tech‐
nical Information BCU”.
6.3.1 Digital inputs
Menu: Parameter/I/O/Digital input
Figure 26: BCU: Internal clock
Power voltage connection at terminal
strip
Signal connections (I/O)
Distributor board with Ethernet for MPR
(option), Modbus, service interface (LAN)
Select the digital output to be tested and click “Test”. A LED (green) is on when the
selected digital input is active.
8017324/15A2/V6-0/2019-10 | SICK T EC H NI C AL IN F OR M AT I ON | MARSIC200
Subject to change without notice
47
Page 48

TESTS AND SETTINGS
6
6.3.2 Digital outputs
Figure 27: Test digital inputs
Significance
Number of selected input.
1
Topographic addressing.
2
[State]
3
Computed value of [Source] (“Inverted” is taken into consideration).
[Source]
4
LED is off: Physical contact open.
LED is on: Physical contact closed.
Menu: Parameter/I/O/Digital output
Select the digital output to be tested and click “Test”.
The digital output can be activated or deactivated for the function check using the
checkmark (see “Test value” in the Figure below).
Figure 28: Test of digital outputs
Significance
Number of selected output.
1
Topographic addressing.
2
No checkmark: Physical contact should be open.
3
Checkmark: Physical contact should be closed.
[State]
4
LED is off: Relay energized.
LED is on: Relay de-energized.
[Source]
5
LED is off: Program specification: Physical contact should be open.
LED is on: Program specification: Physical contact should be closed.
48
Set the checkmark next to the Test value checkbox.
The status of the LEDs changes.
Use an ohmmeter to check the status of the relay outputs on X4 (DO 1-4) and X5 (DO
5-8).
If relay outputs do not function, the I/O modules must be exchanged because they can‐
not be repaired onsite.
T EC H NI C AL IN F OR M AT I ON | MARSIC200 8017324/15A2/V6-0/2019-10 | SICK
Subject to change without notice
Page 49

6.3.3 Analog outputs
Menu: Parameter/I/O/Analog output
This menu checks the analog outputs.
Select the analog output to be tested and click “Test”.
Figure 29: Test of analog outputs
Significance
Number of selected output.
1
Topographic addressing.
2
Test value.
3
Input: Nominal value of the current to be output.
Actual value of the current output.
4
Output value converted to the physical unit.
5
TESTS AND SETTINGS 6
Select the analog output to be tested and click “Test”. The current test current is
b
shown in the menu.
To change the test current on the analog output, modify the value “Test value
b
[phys. unit]”. The test value [phys. unit] always refers to the active output range of
the analog output. To check the settings for the analog outputs, go to: “BCU/Para‐
meter/I/O/Analog outputs”.
Use an ammeter to check the analog output values directly on plug X7.
b
Example (with 2 measuring ranges set):
Range 1 = 0 - 200 ppm
Range 2 = 0 - 400 ppm
LiveZero = 4 mA
Test value [phys. unit] Test current on analog output
0 ppm 4 mA
100 ppm 12 mA
200 ppm 20 mA
300 ppm 16 mA
400 ppm 20 mA
6.4 Adapting the hardware
NOTE
You have to perform this work when deviations of the analog signal are detected during
the hardware check. Analog inputs and/or analog outputs must then be adapted.
Tools required
Ammeter
Constant current source or analog output
8017324/15A2/V6-0/2019-10 | SICK T EC H NI C AL IN F OR M AT I ON | MARSIC200
Subject to change without notice
49
Page 50

6 TESTS AND SETTINGS
6.4.1 Setting analog interfaces
1. Connect the I/O module.
2. Login as “Service” on the control unit.
3. Measuring screen “8” starts.
4. Configure the analog displays with “AI01I” and “AI02I”.
5. Select menu Parameter/Variables and functions/Real values (Rvi).
6. If “Live view” is activated at the top left: Click checkmark off.
7. Mark “RV1” and then select “Edit”.
8. Enter “15” as start value.
9. “Save” the input.
10. Select menu Parameter/IO/ Analog outputs.
(Selecting this action sends the setpoint value 15 mA on the analog outputs of the
I/O module).
°
°
°
°
°
°
11. “Save” the configuration.
12. Select menu Diagnosis/IO module.
°
°
°
°
13. Select Menu Maintenance/Tests/Adjustment IO-module 1.
w
14. Measure the current on pin 5 and pin 6 on X7.
Setpoint: 15 mA.
°
°
15. Repeat this procedure with pin 7 / pin 8 on X7 and test value “AO2”.
16. Repeat this procedure with pin 9 / pin 10 on X7 and test value “AO3”.
17. Repeat this procedure with pin 11 / pin 12 on X11 and test value “AO4”.
18. Fit jumpers on X7:
w
w
w
w
°
°
°
°
°
This completes the adjustment of the analog inputs and outputs.
Select and edit the 4 defined analog outputs
Source = RV1
Null/Zero = 0 mA
Measuring range 1 active = yes
Measuring range 1: Start value = 0
Measuring range 1: End value = 20
Activate “Configuration view”.
Activate “Reset adjustment value”.
Wait until the green LED goes on.
Reset “Live view” again.
(This action resets all parameters in the I/O module to start values).
Mark index 1 to index 6 and then select Test.
Enter the measured value as “AO1”.
The measured value must now be 15 mA.
Enter “0” as test value.
This saves the input value as final value.
Attention! Only “0” must remain as test value when leaving the menu.
From pin 12 to pin 4
From pin 11 to pin 2
From pin 10 to pin 3
From pin 9 to pin 1
Measured values appear on the display in both analog inputs.
Enter value “15” for “AI1” in the input menu.
The display must now show the value 15 mA.
Set the test value for AI1 to 0 again.
Repeat the procedure for the 2nd analog input with “AI2”.
6.5 Configuring measured values
Procedure
1. Menu: Call up BCU/Parameter/Measured values (MVi).
50
T EC H NI C AL IN F OR M AT I ON | MARSIC200 8017324/15A2/V6-0/2019-10 | SICK
Subject to change without notice
Page 51

Figure 30: Menu “Measured values (MVi)” - Table (example)
2. Deactivate Live view.
3. Select the desired Table rows.
4. Select Edit.
TESTS AND SETTINGS 6
Figure 31: Menu “Measured values (MVi)” - Edit (example)
1
2
3
Consecutive number (1 = MV1, 2 = MV2 etc.)
= the measured value is displayed and output
= the measured value is not shown on the display (all other usage options
remain available)
4
5
= an own “measured value” is created for each measuring point
Configuration of the measured value (MVi) relative to name, unit and mea‐
sured value fare as the source (sensor measured value)
6
7
8
9
ß
à
8017324/15A2/V6-0/2019-10 | SICK T EC H NI C AL IN F OR M AT I ON | MARSIC200
Subject to change without notice
Programmed name of the measured value
Start value of physical measuring range
End value of physical measuring range
Programmed physical unit for the measured value
Formula for assignment or calculation of the measured value
Limit value
51
Page 52

6 TESTS AND SETTINGS
á
â
ã
ä
å
æ
ç
è
5. Make the desired entries.
6. Select Save.
Off: Limit value not active
•
Overflow (+): The limit value message is active when the measured value is
•
larger than the limit value.
Underflow (–): The limit value message is active when the measured value
•
is smaller than the limit value.
Hysteresis
This flag is activated for the measured value (“-” in flag means no flag activa‐
tion) when the measured value is beyond the limit value.
Programmed time limit value for an internal failure of the measuring signal or
the source value for this measured value.
Activated flag when the time limit value is overflown.
Start value for using the measured value mask. Is also the output value in the
measured value mask range.
Effective range of the measured value mask. Valid as from the start value; pos‐
itive or negative value possible.
Number of decimal places.
6.6 Measuring points - automatic
6.6.1 Function of the measuring points automatic
Measuring point switchover
Measuring points are extraction points for sample gas. The “measuring points auto‐
matic” allows the BCU to control automatically up to 8 measuring points.
Hold function for analog outputs
When the measuring point automatic is activated for a measured value, the measured
values of the measuring points (MViMPj) are also provided internally as well as the
measured value (MVi). These measured values of the measuring points can be output
via the analog outputs. During the measuring time of the measuring point (see "Mea‐
suring points - automatic", page 52), the current measured value measured by MAR‐
SIC200 is output as measured value. During the remaining times, the last measured
value measured with this measuring point is output as a constant value.
NOTE
When the measuring point automatic is activated, an identifier of the current measuring
point is shown on the Measuring Screens and on the BCU display.
6.6.2 Criteria for measuring point automatic
One digital output exists for each measuring point in the MARSIC200. The digital
•
output is configured for the measuring point (see “Technical Information BCU”).
A device is installed outside the MARSIC200 that switches the sample gas path to
•
the measuring point (e.g., a solenoid value). The associated digital output controls
this device.
At least two measuring points are configured and switched to “active” (see "Config‐
•
uring measuring point automatic", page 53).
52
NOTE
Digital outputs for measuring points automatic are controlled using tag MPiS (see
“Technical Information BCU”).
T EC H NI C AL IN F OR M AT I ON | MARSIC200 8017324/15A2/V6-0/2019-10 | SICK
Subject to change without notice
Page 53

6.6.3 Configuring measuring point automatic
Procedure
1. Menu: Call up BCU/Parameter/“Measuring point automatic”.
Figure 32: Menu “Measuring point automatic” – Table (example)
2. Deactivate Live view.
3. Select the desired Table rows.
4. Select Edit.
TESTS AND SETTINGS 6
Figure 33: Menu “Measuring point automatic” – Edit (example)
1
2
3
4
5
1
2
3
4
Consecutive number (1 = MP1, 2 = MP2 etc.)
= this measuring point is used by measuring point automatic
Name of the measuring point
Wait time after switching to this measuring point
Measuring time with the sample gas from this measuring point3
Defines the sequence of the measuring points during switchover.
Criterion: Response time + T
Select as required.
Flush time + measuring time = activation time of the digital output = total time for this measuring point.
90 %
.
1
2
5. Make the desired entries.
6. Select Save.
6.7
Backup of settings
Current parameter settings can be stored in internal storage.
Backup files can be created in the device at any time. Each module has its own backup.
A maximum of two backups are stored on the sensor modules and the BCU. The first
backup is overwritten when the third backup is created. This means only the last two
backups are saved.
8017324/15A2/V6-0/2019-10 | SICK T EC H NI C AL IN F OR M AT I ON | MARSIC200
Subject to change without notice
4
53
Page 54

6 TESTS AND SETTINGS
The saved data are marked with the date and time.
Displaying the data of the new backup can take up to one minute.
Creating a backup copy
b
b
Go to menu BCU/Maintenance/User settings.
Click “Save”.
Figure 34: Backup
Restoring the SW
Only data marked with the time and date of the backup can be restored. Either the last
or the second last backup can be chosen to load the device data. After the data have
been loaded, the module carries out a restart (warm start) automatically so the loaded
data are then used during processing. The means the operating data existing before the
restore are irretrievably deleted.
Go to menu BCU/Maintenance/User settings (Maintenance/Backup/Restore).
b
Menu, see above.
Restoring factory settings
The factory settings can be restored.
Go to menu BCU/Maintenance/User settings (Maintenance/Backup-Restore) and
b
click “Restore” (production settings).
Backup on the PC
Module parameters can be saved and then restored later using SOPAS ET.
Select the module in the SOPAS ET project tree.
b
Export the device data to the PC with “Project/Export device”.
b
It is recommended to integrate the module type, device and date in the file names to
simplify later identification. For example: MARSIC_11018001_2014-12.sdv.
54
A *.sdv file is created.
Restoring data from the PC
Only parameters configured at Service level are overwritten.
Restore the *.sdv files with “Edit/Load device data ...”.
b
Search for *.sdv files and click “Continue”.
b
Select a user level and enter the associated password.
b
All parameters that can be modified with the selected user level are overwritten.
T EC H NI C AL IN F OR M AT I ON | MARSIC200 8017324/15A2/V6-0/2019-10 | SICK
Subject to change without notice
Page 55

7 Technical data
500
560
500
210
534
442
Ø 10
NOTE
The technical data depend to some extent on the individual equipment of your device.
See the enclosed System Description for the configuration of your device.
b
7.1 Dimensional drawings
7.1.1 Dimensional drawing of sample conditioning
TECHNICAL DATA 7
NOTICE
Observe clearances:
Bottom: 20 cm
•
Right: 30 cm
•
8017324/15A2/V6-0/2019-10 | SICK T EC H NI C AL IN F OR M AT I ON | MARSIC200
Subject to change without notice
55
Page 56

660
600
634
Ø 10
542600
210
7 TECHNICAL DATA
7.1.2 Dimensional drawing of distribution unit
NOTICE
Observe clearance:
Bottom: 20 cm
•
56
T EC H NI C AL IN F OR M AT I ON | MARSIC200 8017324/15A2/V6-0/2019-10 | SICK
Subject to change without notice
Page 57

7.1.3 Dimensional drawing of analyzer
849
550
405
D
ø 10
35
68,5
491
740
714
680
484
191
167
90
55
20
319
658570
60
63
TECHNICAL DATA 7
NOTICE
Observe clearance:
Right: 10 cm
•
Bottom: 20 cm
•
8017324/15A2/V6-0/2019-10 | SICK T EC H NI C AL IN F OR M AT I ON | MARSIC200
Subject to change without notice
57
Page 58

7 TECHNICAL DATA
7.1.4 Dimensional drawing of sampling probe
Probe tube length Part number
400 5329476
600 5329477
800 5329478
7.1.5 Sample gas line, heated
Figure 35: Technical drawing - heated sample gas line
58
T EC H NI C AL IN F OR M AT I ON | MARSIC200 8017324/15A2/V6-0/2019-10 | SICK
Subject to change without notice
Page 59

7.2 Gas flow diagram
-HQ1
0,1 µm
OUT IN
-EB2
120 °C
-EB1
COND
IN OUT
-EC1
+UM1/4.6
A R
-KK10
+UM5/8.2
C/T
P
OPTION
Reference gas CO2/SO2/O2
and/or N2 for O2 zero,
manual application
Test gas
Zero gas
! Note backpressure !
reed manual for details.
Instrument air
Reference gas manual
-QN1
[max.0,5 bar(ü)]
HP LP
OUT
IN
-BQ1
SO2
CO2O2(NO)
(NO2)
-GQ1
+UM5/7.4
E A
-RM1
cracking pressure
0,2 bar
-PG1
10...100 Nl/h
(60 Nl/h)
flow meter
-HS1
acid absorber
filling cotton
R A
-KK1
+BQ1/6.5
C/T
P
OUT
KOND
-01
-XL9
-XL10
-XL50
+UM1
+UM5
+STACK
-XL1
-XL10
-XL2
Referenzgas manual
-QN1
[max.0,5 bar(ü)]
HP LP
rd
bu
rd
bu
SINGLE version distribution unit for one measuring point
TECHNICAL DATA
7
Figure 36: Gas flow diagram
8017324/15A2/V6-0/2019-10 | SICK T EC H NI C AL IN F OR M AT I ON | MARSIC200
Subject to change without notice
59
Page 60

-HQ1
0,1 µm
OUT IN
-EB2
120 °C
-EB1
-EB3
-EB4
120 °C
-EB5
-EB6
120 °C
-EB7
-EB8
120 °C
P A
-KK11
+UM5/13.2
NC
P A
-KK21
+UM5/13.3
NC
P A
-KK31
+UM5/13.4
NC
P A
-KK41
+UM5/13.5
NC
P A
-KK30
+UM5/12.4
NC
P A
-KK20
+UM5/12.3
NC
P A
-KK10
+UM5/12.2
NC
P A
-KK40
+UM5/12.5
NC
A R
-KK10
+UM5/14.1
P
A R
-KK10
+UM5/14.8
P
A R
-KK10
+UM5/14.6
P
A R
-KK10
+UM5/14.4
P
! Note backpressure !
reed manual for details.
OPTION
Reference gas CO2/SO2/O2
and/or N2 for O2 zero,
manual application
Reference gas manual
Zero gas
*
Test gas (OPTION)
Reference gas CO2/SO2/O2
and/or N2 for O2 zero,
manual application only
via Probe at measuring point 1
COND
IN OUT
-EC1
+UM1/4.6
-QN1
[max. 0,5 bar(ü)]
HP LP
OUT
IN
-BQ1
SO2
CO2O2(NO)
(NO2)
-GQ1
+UM5/10.4
E A
-RM1
cracking pressure
0,2 bar
-PG1
10...100 Nl/h
(60 Nl/h)
-HS1
acid absorber
filling cotton
R A
-KK1
+BQ1/6.5
C/T
P
OUT
KOND
-XL9
-XL10
-XL50
Instrument air
+UM1
+STACK
-XL2
Referenzgas manual
COND
IN OUT
-EC1
+UM2/4.6
-01
-XL9
-XL10
+UM2
COND
IN OUT
-EC1
+UM3/4.6
-01
-XL9
-XL10
+UM3
COND
IN OUT
-EC1
+UM4/4.6
-01
-XL9
-XL10
+UM4
KOND
KOND
KOND
GQ2
+UM5/11.4
E A
-PG2
10...100 Nl/h
(100 Nl/h)
-RM2
cracking pressure
0,3 bar
OUT
-XL3
A1
A2
-XL10
P1
P2
P3
P4
-XL20
-XL30
-XL40
+UM5
-XL1
-XL50
Instrument air
-XL50
Instrument air
-XL50
Instrument air
Test gas (OPTION)*
-01
bu
rd
bu
rd
bu
rd
bu
rd
bu
rd
bu
rd
bu
rd
bu
rd
TECHNICAL DATA
7
MULTI version distribution unit for two to four measuring points
Figure 37: Gas flow diagram
60
T EC H NI C AL IN F OR M AT I ON | MARSIC200 8017324/15A2/V6-0/2019-10 | SICK
Subject to change without notice
Page 61

7.3 Measuring parameters
Variant Components
DeSO
x
Full configuration SO2, CO2, NO, NO2, optional O
Number of measured variables
Number of measured variables Max. 5
Measuring method
Measuring method Cold-extractive
Sample volume
Sample volume 60 ... 100 l/h
Spectral range
Spectral range UV, VIS
Component Measuring ranges
SO
2
CO
2
O
2
NO 0 ... 300 ppm; 0 ... 1500 ppm
NO
2
SO2, CO2, optional O
2
0 ... 100 ppm; 0 ... 500 ppm
0 ... 25% by volume
0 ... 21%volume
0 ... 200 ppm; 0 ... 500 ppm
TECHNICAL DATA 7
2
Measuring point switchover
Measuring point switchover Max. 4 measuring points
Measured value characteristics
Measuring precision < 1% of the respective full scale value
Detection limit < 0.5% of the respective full scale value
Sensitivity drift < 2% of the respective full scale value per week
Zero drift < 2% of the respective full scale value per week
Span drift < 2% of the respective full scale value per week
Setting time t
7.4 Ambient conditions
Ambient conditions in operation
Installation location Below deck
Ambient temperature +5 ... +45 °C
Relative humidity < 90% (without condensate)
Air pressure 900 ... 1100 hPa
Degree of protection IP 54
90
15 ... 30 s, total active measuring path as from sampling
(With advance extraction with several measuring points)
8017324/15A2/V6-0/2019-10 | SICK T EC H NI C AL IN F OR M AT I ON | MARSIC200
Subject to change without notice
61
Page 62

7 TECHNICAL DATA
Ambient conditions in storage
Ambient temperature -20 ... +70 °C
Relative humidity < 90% (without condensate)
7.5 Sample gas conditions
Sample gas at the measuring point Characteristics
Process temperature 10 ... 550 °C
Sample gas temperature 200°C
Process pressure –90 ... +200 hPa relative
Dust load < 200 mg/m
7.6 Design as wall enclosure
Sampling probe
Ambient temperature -25 ... 65 °C
Working temperature +180 °C, self-regulating
Filter element Fine filter 0.1 µm
Power supply 115 V / 230 V
Power consumption Start: 400 VA, operation: 100 VA
Degree of protection IP 54
Weight Approx. 7.5 kg
Dimensions see "Dimensional drawing of sampling probe", page 58
3
Design as wall enclosure
Design 3 x wall enclosure
Sample conditioning
•
Distribution unit
•
Analyzer
•
Material, general Steel plate according to EN 10130
Dimensions see "Dimensional drawings", page 55
Installation Wall fitting
Weight
Materials with media contact
Degree of protection
Sample conditioning: Approx. 27 kg
•
Distribution unit: Approx. 30 kg
•
Analyzer: Approx. 37 kg
•
PTFE
•
Viton B
•
PVDF
•
Stainless steel 1.4571
•
Platinum, nickel
•
Aluminum
•
CaF
2
•
Sample conditioning: IP54
•
Distribution unit: IP54
•
Analyzer: IP54
•
62
T EC H NI C AL IN F OR M AT I ON | MARSIC200 8017324/15A2/V6-0/2019-10 | SICK
Subject to change without notice
Page 63

7.7 Sample gas line, heated
Sample gas line
Ambient temperature –20 ... 80 °C
Working temperature +120°C
Heating Self-regulating parallel heater line
Power supply 115 V / 230 V
Power consumption 60 W/m at 10 °C
Dimensions see "Sample gas line, heated", page 58
Degree of protection IP 54
Protection class I
7.8 Interfaces and protocols
Operation and interfaces
Operation Via LC-Display or SOPAS ET software, several operating
Display and input Black-and-white foiled screen with function buttons
Remote control Ethernet (TCP/IP):
Remote maintenance SICK MPR (optional)
PC operation SOPAS ET via Ethernet
levels, password-protected
Status LEDs:
“Power”
•
“Malfunction”
•
“Maintenance request”
•
Connector: RJ 45
•
Type: TCP/IP Peer-to-Peer.
•
Method: 10 MBit half-duplex
•
Modbus
TECHNICAL DATA 7
Analog outputs
Number 8
Reference potential Potential-free (electrically isolated)
Signal range 0 … 24 mA
Residual ripple 0.02 mA
Resolution/precision 0.1% (20 μA)
Accuracy 0.25% of full-scale value
Maximum load 500 Ω
Maximum output voltage 15 V
Start or error state Adjustable
Analog inputs
Number 2
Reference potential GND
Input signal 0 … 20 mA
Highest allowable input signal 30 mA
Overcurrent protective device ±1000 mA
8017324/15A2/V6-0/2019-10 | SICK T EC H NI C AL IN F OR M AT I ON | MARSIC200
Subject to change without notice
63
Page 64

7 TECHNICAL DATA
Analog inputs
Input load 50 Ω
Transducer precision 0,5 %
Digital inputs
Design Optical coupler
Number 8
Switching range 18 … 42 V
Highest allowable voltage ±50 V DC
Digital outputs
Number 16
Contact type: 1-pole changeover switch, 3 connections
Contact load: See Table below
Highest allowable voltage ±50 V DC
Table 7: Maximum load per relay switching contact
Application area AC voltage DC voltage Current
Standard: Max. 30 VAC Max. 48 VAC Max. 500 mA
CSA Either Max. 30 VAC Max. 48 VAC Max. 50 mA
or Max. 15 VAC Max. 24 VAC Max. 200 mA
or Max. 12 VAC Max. 18 VAC Max. 500 mA
NOTICE
Only use discharging diodes to connect inductive loads (e.g., relays, solenoid valves) to
the switching outputs.
•
•
7.9 Energy supply
Power supply
Supply voltage 115/230 VAC, 50/60 Hz
Current 8 A (with 230 V)
Power consumption
•
•
•
•
•
Power input, complete system (max. for each 5 m sample gas line)
Number of measuring
points
1 1400 VA 6 A 12 A
2 2300 VA 10 A 20 A
3 3200 VA 14 A 28 A
For inductive loads: Check that discharging diodes are fitted.
If this is not the case: Install external discharging diodes.
Deviating power supply via upstream transformer
Power consumption
Sampling probe
Sample gas line
Sample conditioning
Distribution unit
Analyzer
Power consumption Current (230 VAC) Current (115 VAC)
400 VA
•
60 VA/m
•
150 VA
•
200 VA (1 MPI), 300 VA (2 ... 4 MPI)
•
300 VA
•
64
T EC H NI C AL IN F OR M AT I ON | MARSIC200 8017324/15A2/V6-0/2019-10 | SICK
Subject to change without notice
Page 65

TECHNICAL DATA 7
Power input, complete system (max. for each 5 m sample gas line)
4 4000 VA 17 A 35 A
Connections
Connections, analyzer
Distribution unit
Sample conditioning
Sample gas line
Sampling probe
Signal cable, 7-wire, 1.5 mm2, shielded, e.g., Marine‐
•
line (Sick Part No. 6056230)
Power cable, 3-wire, min. 1.5 mm², e.g., Marineline
•
(Sick Part No. 6056215)
Signal cable, 7-wire, 1.5 mm2, shielded, e.g., Marine‐
•
line (Sick Part No. 6056230)
Signal cable, 4-wire, 0.75 mm2, shielded, e.g.,
•
Marineline (Sick Part No. 6056229)
Power cable, 3-wire, min. 1.5 mm², e.g., Marineline
•
(Sick Part No. 6056215)
Signal cable, 4-wire, 0.75 mm2, shielded, e.g.,
•
Marineline (Sick Part No. 6056229)
Power cable, 3-wire, min. 1.5 mm², e.g., Marineline
•
(Sick Part No. 6056215)
Power cable, 3-wire, 1.5 mm²
•
Signal cable, 4-wire, 0.75 mm2, shielded, e.g.,
•
Marineline (Sick Part No. 6056229)
Power cable, 3-wire, min. 1.5 mm², e.g., Marineline
•
(Sick Part No. 6056215)
7.10 Emissions
Emissions
Condensate For water vapour-saturated exhaust gas (e.g., after
7.11 Torques for screw fittings
A medium total friction coefficient of µ=0.12 is assumed in the specification of torques.
This means that the screws are installed lightly oiled.
Analyzer Property class Torque
Analyzer door screw fitting A2-50 3 Nm
Analyzer enclosure 4 screws M8
bolts
and bracket on analyzer enclosure
FINOR 3 screws base plate 4 Nm
Ground screw FINOR 3 Nm
Ground screw analyzer 3 Nm
Gas module 4 screws base plate 3 Nm
Complete analyzer module, 7 black
screws
exhaust gas washer): Approx. 2 liters of condensate per
week
8.8 23.1 Nm
10.9 34 Nm
12.9 39.6 Nm
A2/4-50 7.1 Nm
A2/4-70 16 Nm
A2/4-80:9 22 Nm
9 Nm
8017324/15A2/V6-0/2019-10 | SICK T EC H NI C AL IN F OR M AT I ON | MARSIC200
Subject to change without notice
65
Page 66

7 TECHNICAL DATA
Sample conditioning and distribu‐
tion unit
Insertion of sample gas line 2 clamp‐
ing screws
Insertion of sample gas line 4 frame
screws
Solenoid valve M4 2 Nm
Cover of solenoid valve M2.5 0.35 Nm
Pump M4 2 Nm
Sample gas cooler M6 6 Nm
Enclosure, complete See above ”Analyzer“
7.12 Tube connections
Connection Dimension
Sample gas connections Swagelok DN 4/6
Instrument air Hose coupling DN 4/6
Test gas Hose coupling DN 4/6
7.13 Sample gas conditions
Torque
1.5 Nm
1.5 Nm
NOTICE
Risk of contamination of analyzer
Observe the specified quality of the instrument air
b
If required, provide for instrument air conditioning
b
Gas Quality Inlet pressure Flow rate
Instrument air Particle size max. 1 μm
Oil content max. 0.1 mg/m
Zero point gas Nitrogen 5.0 Max. +300 hPa Typically 60 l/h
Span gas External span gas
Precision: ± 2 %
Concentration: 80% ... 100%
of measuring range
The span gas must comply
with the specifications of the
standards to be applied (e.g.,
MARPOL Annex VI)
Max. +300 hPa Typically 60 l/h
3
Max. +300 hPa Typically 60 l/h
66
T EC H NI C AL IN F OR M AT I ON | MARSIC200 8017324/15A2/V6-0/2019-10 | SICK
Subject to change without notice
Page 67

TECHNICAL DATA 7
8017324/15A2/V6-0/2019-10 | SICK T EC H NI C AL IN F OR M AT I ON | MARSIC200
Subject to change without notice
67
Page 68

Detailed addresses and further locations at www.sick.com
Australia
Phone +61 (3) 9457 0600
1800 33 48 02 – tollfree
E-Mail sales@sick.com.au
Austria
Phone +43 (0) 2236 62288-0
E-Mail office@sick.at
Belgium/Luxembourg
Phone +32 (0) 2 466 55 66
E-Mail info@sick.be
Brazil
Phone +55 11 3215-4900
E-Mail comercial@sick.com.br
Canada
Phone +1 905.771.1444
E-Mail cs.canada@sick.com
Czech Republic
Phone +420 234 719 500
E-Mail sick@sick.cz
Chile
Phone +56 (2) 2274 7430
E-Mail chile@sick.com
China
Phone +86 20 2882 3600
E-Mail info.china@sick.net.cn
Denmark
Phone +45 45 82 64 00
E-Mail sick@sick.dk
Finland
Phone +358-9-25 15 800
E-Mail sick@sick.fi
France
Phone +33 1 64 62 35 00
E-Mail info@sick.fr
Germany
Phone +49 (0) 2 11 53 010
E-Mail info@sick.de
Greece
Phone +30 210 6825100
E-Mail office@sick.com.gr
Hong Kong
Phone +852 2153 6300
E-Mail ghk@sick.com.hk
Hungary
Phone +36 1 371 2680
E-Mail ertekesites@sick.hu
India
Phone +91-22-6119 8900
E-Mail info@sick-india.com
Israel
Phone +972 97110 11
E-Mail info@sick-sensors.com
Italy
Phone +39 02 27 43 41
E-Mail info@sick.it
Japan
Phone +81 3 5309 2112
E-Mail support@sick.jp
Malaysia
Phone +603-8080 7425
E-Mail enquiry.my@sick.com
Mexico
Phone +52 (472) 748 9451
E-Mail mexico@sick.com
Netherlands
Phone +31 (0) 30 229 25 44
E-Mail info@sick.nl
New Zealand
Phone +64 9 415 0459
0800 222 278 – tollfree
E-Mail sales@sick.co.nz
Norway
Phone +47 67 81 50 00
E-Mail sick@sick.no
Poland
Phone +48 22 539 41 00
E-Mail info@sick.pl
Romania
Phone +40 356-17 11 20
E-Mail office@sick.ro
Russia
Phone +7 495 283 09 90
E-Mail info@sick.ru
Singapore
Phone +65 6744 3732
E-Mail sales.gsg@sick.com
Slovakia
Phone +421 482 901 201
E-Mail mail@sick-sk.sk
Slovenia
Phone +386 591 78849
E-Mail office@sick.si
South Africa
Phone +27 10 060 0550
E-Mail info@sickautomation.co.za
South Korea
Phone +82 2 786 6321/4
E-Mail infokorea@sick.com
Spain
Phone +34 93 480 31 00
E-Mail info@sick.es
Sweden
Phone +46 10 110 10 00
E-Mail info@sick.se
Switzerland
Phone +41 41 619 29 39
E-Mail contact@sick.ch
Taiwan
Phone +886-2-2375-6288
E-Mail sales@sick.com.tw
Thailand
Phone +66 2 645 0009
E-Mail marcom.th@sick.com
Turkey
Phone +90 (216) 528 50 00
E-Mail info@sick.com.tr
United Arab Emirates
Phone +971 (0) 4 88 65 878
E-Mail contact@sick.ae
United Kingdom
Phone +44 (0)17278 31121
E-Mail info@sick.co.uk
USA
Phone +1 800.325.7425
E-Mail info@sick.com
Vietnam
Phone +65 6744 3732
E-Mail sales
.gsg@sick.com
8017324/15A2/V6-0/2019-10/en
SICK AG | Waldkirch | Germany | www.sick.com
 Loading...