

Page 1
Application Programming
IVC-2D
R EFERENCE M ANUAL
Page 2

ISM Radio Frequency Classification - EN55011 –
Group1, Class A
Warning:Class A equipment is intended for use in an industrial environment. There may be potential difficulties in
ensuring electromagnetic compatibility in other environments, due to conducted as well as radiated disturbances.
Explanations:
Group1 – ISM equipment (ISM = Industrial, Scientific and Medical)
Group 1 contains all ISM equipment in which there is intentionally generated and/or used conductively coupled
radio-frequency energy which is necessary for the internal functioning of the equipment itself.
Class A equipment
connected to a low voltage power supply network which supplies buildings used for domestic purposes.
Class A equipment
Note:
may allow, with whatever additional measures are necessary, the installation and use of class A ISM equipment in
a domestic establishment or in an establishment connected directly to domestic electricity power supplies.
German versions of the Operating Instructions and Reference manual are available on the CD.
Eine deutsche Version der Bedienungsanleitung und des Referenzhandbuchs finden Sie auf der
beigelegten CD.
is equipment suitable for use in all establishments other than domestic and those directly
shall meet class A limits.
Although class A limits have been derived for industrial and commercial establishments, administrations
© SICK AG 2013-09-09
All rights reserved
Subject to change without prior notice.
Page 3

Reference Manual
IVC-2D
Contents
Contents
1 Functional Overview.......................................................................................................................................7
The Camera ..........................................................................................................................................................7
1.1
1.2 IVC Studio ..............................................................................................................................................................8
1.3 Handling Multiple Products .......................................................................................................................... 10
Getting Started ............................................................................................................................................. 11
2
2.1
Creating a product...........................................................................................................................................11
2.2 About Writing Programs ................................................................................................................................14
2.3 Adding Program Steps................................................................................................................................... 16
2.4 Setting Parameter Values ............................................................................................................................17
2.5 Testing and Running the Program.............................................................................................................23
2.6 Saving the Program ........................................................................................................................................24
2.7 What’s Next?.....................................................................................................................................................25
Using IVC Studio ..........................................................................................................................................27
3
Handling Devices.............................................................................................................................................27
3.1
3.2 Handling the Emulator ...................................................................................................................................30
3.3 Handling Products ...........................................................................................................................................33
3.4 Handling Programs.......................................................................................................................................... 35
3.5 Handling Tables................................................................................................................................................ 37
3.6 Handling Images ..............................................................................................................................................38
3.7 IVC Studio Settings .........................................................................................................................................39
3.8 Programming ..................................................................................................................................................... 39
3.9 Efficient Programming....................................................................................................................................45
Tools ................................................................................................................................................................. 47
4
4.1
Image....................................................................................................................................................................48
Grab Setup .................................................................................................................................................48
Start Snapshot .......................................................................................................................................... 49
Grab...............................................................................................................................................................50
Ping-Pong Grab .........................................................................................................................................51
Copy Image Bank.....................................................................................................................................52
Image Bank Operation ........................................................................................................................... 53
Add Text.......................................................................................................................................................55
Draw Line ....................................................................................................................................................56
Draw ROI......................................................................................................................................................57
Reset Image Banks.................................................................................................................................58
Display..........................................................................................................................................................59
Mirror Image...............................................................................................................................................60
Rotate Image ............................................................................................................................................. 61
4.2 Region of Interest (ROI).................................................................................................................................62
ROI Rectangle............................................................................................................................................62
ROI Rotated Rectangle...........................................................................................................................63
ROI Circle.....................................................................................................................................................65
ROI Ellipse ...................................................................................................................................................66
ROI Perimeter ............................................................................................................................................67
ROI Union.....................................................................................................................................................68
ROI Intersection ........................................................................................................................................69
ROI Difference ........................................................................................................................................... 70
4.3 Filter ......................................................................................................................................................................71
©SICK AG • Advanced Industrial Sensors • www.sick.com • All rights reserved 3
Page 4

Contents
Dilate.............................................................................................................................................................71
Erode.............................................................................................................................................................72
Filter............................................................................................................................................................... 73
Stretch Gray ...............................................................................................................................................74
Detail Extraction........................................................................................................................................76
Binarize.........................................................................................................................................................78
4.4 Edge......................................................................................................................................................................79
Find Row Edge...........................................................................................................................................79
Find Column Edge....................................................................................................................................80
Find Row ......................................................................................................................................................81
Find Column ...............................................................................................................................................83
Find Line Edge...........................................................................................................................................85
Find Subpixel Edge ..................................................................................................................................88
Find Multiple Edges .................................................................................................................................89
Find Mean of Edges................................................................................................................................92
Find Circle Edges......................................................................................................................................94
4.5 Measure ..............................................................................................................................................................97
Centroid .......................................................................................................................................................97
Area ............................................................................................................................................................... 98
Single Blob Analysis ................................................................................................................................99
Perimeter..................................................................................................................................................100
Mean Intensity........................................................................................................................................ 101
Line Intersection....................................................................................................................................102
Distance and Angle ..............................................................................................................................103
Blob Finder...............................................................................................................................................104
Blob Analyzer ..........................................................................................................................................106
4.6 Matching...........................................................................................................................................................109
Shape Locator........................................................................................................................................109
Add Shape Runtime .............................................................................................................................112
Get Shape................................................................................................................................................113
Transform Image...................................................................................................................................114
Transform ROI.........................................................................................................................................116
Teach Rotation.......................................................................................................................................118
Match Rotation....................................................................................................................................... 119
Teach Pattern .........................................................................................................................................120
Inspect Pattern....................................................................................................................................... 122
4.7 Circular..............................................................................................................................................................128
External Perimeter ................................................................................................................................128
Internal Perimeter .................................................................................................................................130
Circular Perimeter ROI.........................................................................................................................132
Circular Analysis..................................................................................................................................... 133
Check Circular Surface........................................................................................................................134
Check Circular Shape..........................................................................................................................135
4.8 Calculation.......................................................................................................................................................136
Mathematical Operation.....................................................................................................................136
Mathematical Expression...................................................................................................................137
In Range.................................................................................................................................................... 138
Polar to Cartesian Coordinates........................................................................................................139
Fit Circle ....................................................................................................................................................140
Fit Ellipse...................................................................................................................................................141
Sort .............................................................................................................................................................142
Update Statistics ................................................................................................................................... 143
Reference Manual
IVC-2D
4 ©SICK AG • Advanced Industrial Sensors • www.sick.com • All rights reserved
Page 5

Reference Manual
Contents
IVC-2D
Reset Statistics...................................................................................................................................... 144
Coordinate Alignment..........................................................................................................................145
Get Calibrated Point.............................................................................................................................146
4.9 Program............................................................................................................................................................147
Goto............................................................................................................................................................147
If Then Goto.............................................................................................................................................148
If Error Goto............................................................................................................................................. 149
If in Range Goto.....................................................................................................................................150
If All in Range Goto............................................................................................................................... 151
If................................................................................................................................................................... 152
Else............................................................................................................................................................. 153
For...............................................................................................................................................................154
While...........................................................................................................................................................155
Subroutine Start ....................................................................................................................................156
End.............................................................................................................................................................. 157
Run Flash Program ............................................................................................................................... 158
Program Protection...............................................................................................................................159
4.10 System..............................................................................................................................................................160
Get Timer..................................................................................................................................................160
Wait............................................................................................................................................................. 161
Read from Table.................................................................................................................................... 162
Write to Table .........................................................................................................................................163
Fill Table....................................................................................................................................................164
Load Data Block from Flash .............................................................................................................165
Save Data Block to Flash...................................................................................................................166
Load Image from Flash....................................................................................................................... 167
Save Image to Flash............................................................................................................................ 168
Write Table To Flash ............................................................................................................................170
Read Table From Flash....................................................................................................................... 171
Web Status Page ..................................................................................................................................172
4.11 Communication .............................................................................................................................................174
Setup RS485.......................................................................................................................................... 174
Read RS485 Values ............................................................................................................................175
Write RS485 Values ............................................................................................................................176
Read RS485 String ..............................................................................................................................177
Write RS485 String ..............................................................................................................................178
Enable Ethernet ..................................................................................................................................... 179
Open Ethernet Raw .............................................................................................................................. 180
Close Ethernet Raw.............................................................................................................................. 182
Read Ethernet Bytes............................................................................................................................ 183
Read Ethernet Bytes Formatted .....................................................................................................184
Read Ethernet String ........................................................................................................................... 186
Write Ethernet Bytes............................................................................................................................ 187
Write Ethernet Bytes Formatted .....................................................................................................188
Write Ethernet String............................................................................................................................190
Communication Setup.........................................................................................................................191
Communication Read/Write..............................................................................................................192
Send to FTP............................................................................................................................................. 193
Get from FTP........................................................................................................................................... 196
Get SNTP Time.......................................................................................................................................198
4.12 Input/Output ................................................................................................................................................... 199
Read Input ...............................................................................................................................................199
©SICK AG • Advanced Industrial Sensors • www.sick.com • All rights reserved 5
Page 6

Reference Manual
Contents
IVC-2D
Set Output................................................................................................................................................ 200
Set All Outputs........................................................................................................................................201
Set Timed Output..................................................................................................................................202
Set LED .....................................................................................................................................................204
4.13 Reader...............................................................................................................................................................205
Read Barcode.........................................................................................................................................205
2D Code ...................................................................................................................................................207
5 Interactive Setups .....................................................................................................................................209
Shape Locator Interactive Setup........................................................................................................................209
Add/Edit Shape Interactive Setup...................................................................................................................... 212
Locating Shapes (tips and tricks).......................................................................................................................214
Find Line Edge............................................................................................................................................................218
Coordinate Alignment..............................................................................................................................................220
Communication Setup ............................................................................................................................................223
2D Code .......................................................................................................................................................................228
Detail Extraction Setup ........................................................................................................................................... 232
Binarize Setup ............................................................................................................................................................ 234
Blob Finder Setup .....................................................................................................................................................235
Blob Analyzer Setup................................................................................................................................................. 238
6 Troubleshooting .........................................................................................................................................240
6.1 Connecting to Devices................................................................................................................................240
6.2 Saving to Flash ..............................................................................................................................................242
6.3 Running IVC Studio.......................................................................................................................................243
6.4 Debugging Step Programs........................................................................................................................243
6.5 IVC Emulator...................................................................................................................................................243
6.6 Trouble report ................................................................................................................................................244
Appendix ................................................................................................................................................................245
A Mathematical Expressions........................................................................................................................245
B Setting Device Parameters....................................................................................................................... 249
6 ©SICK AG • Advanced Industrial Sensors • www.sick.com • All rights reserved
Page 7
Reference Manual Chapter 1
The Camera
IVC-2D
1 Functional Overview
1.1 The Camera
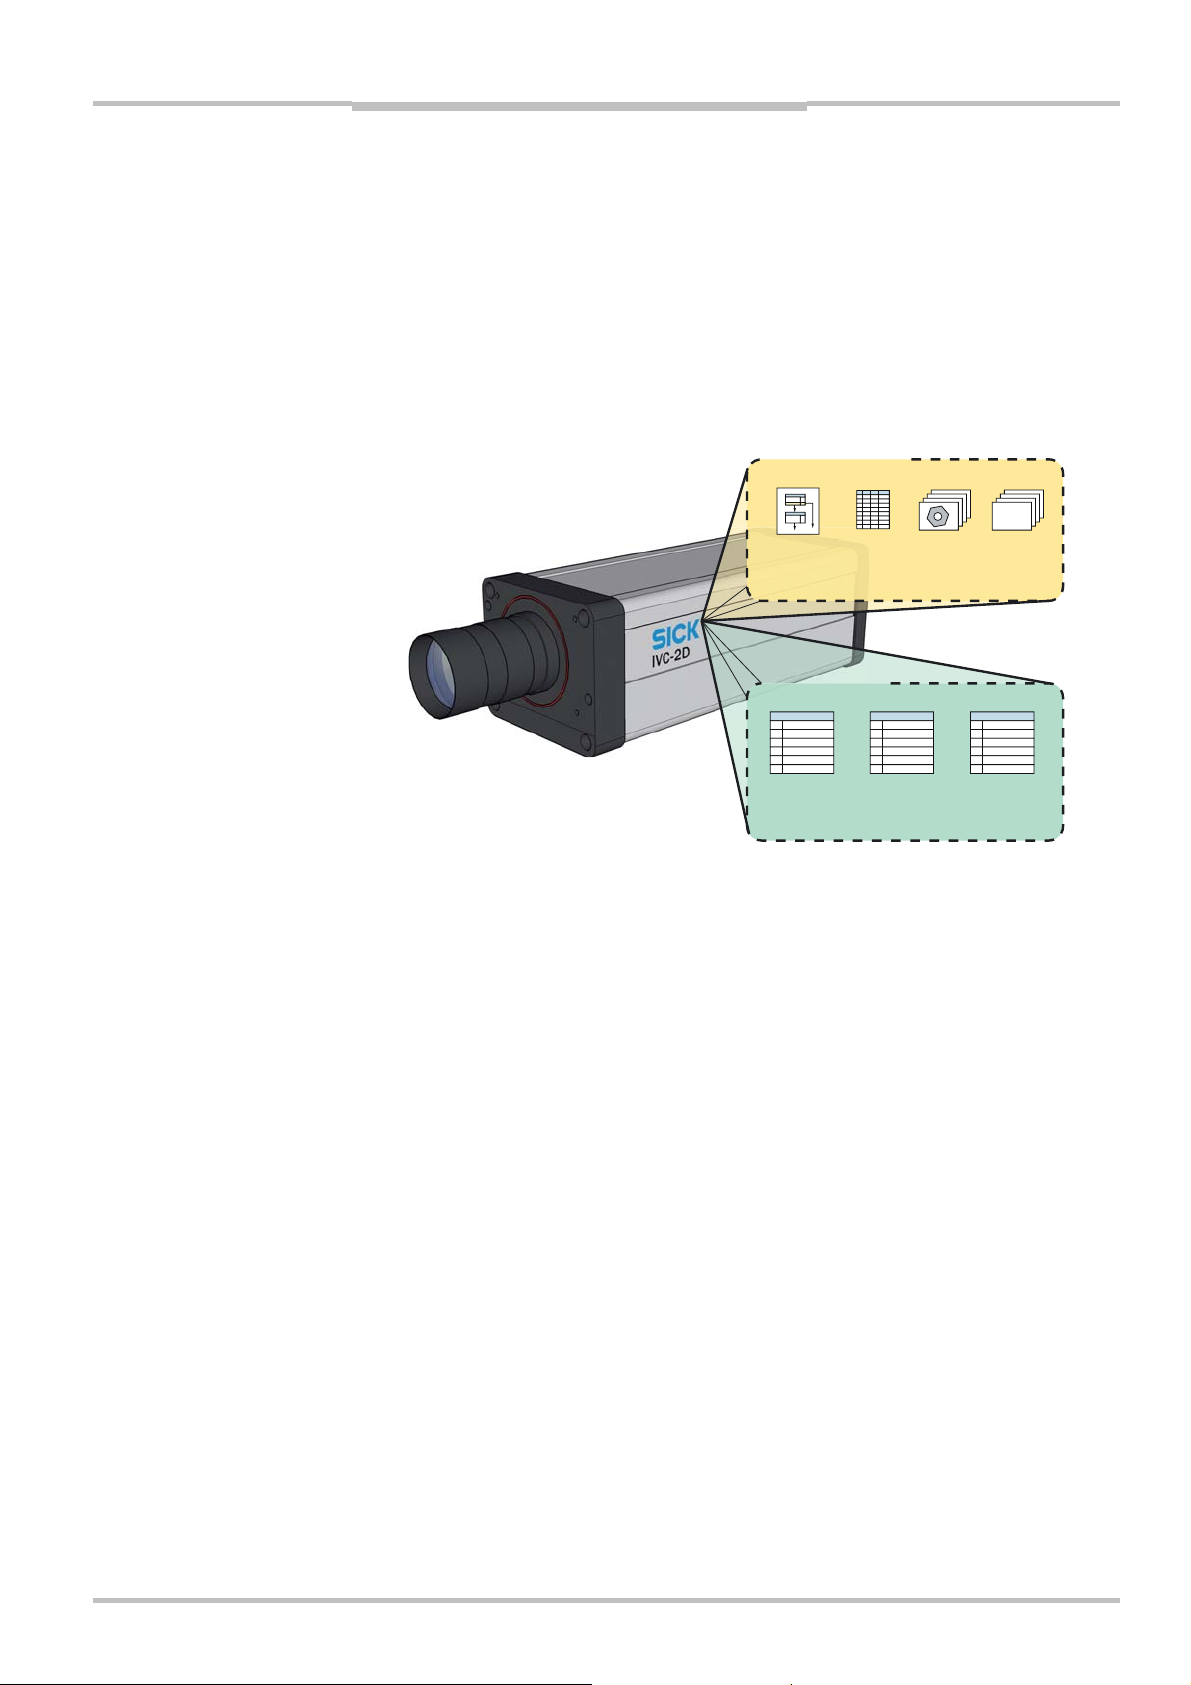
The camera contains a powerful microprocessor that is tailored for image analysis. The
processor can perform a number of commands – or tools – that are used for example for
capturing an image, finding an edge in an image or setting one of the camera’s output
signals.
Working Memory
x1=1.273
y1=9.742
z1=6.37
...
Active
Program
Active
Table
Image
Banks
Data
Blocks
Flash Memory
1
2
3
4
5
...
Program
Banks
1
2
3
4
5
...
Saved
Images
1
2
3
4
5
...
Saved
Data Blocks
The camera also has a working memory, which contains the following:
Active program, which is a sequence of commands that are used for analyzing the
images.
Active table, which is used for reading and storing values that are used during the
analysis.
A number of image banks, which each contains an image captured and processed by
the camera.
Data blocks, which are used by some tools for storing or reading additional data. For
example, some pattern recognition tools (Teach tools) create and save data in a data
block, which can later be used by other tools (Match tools).
In addition, the camera has a flash memory, which is used for additional storage. The flash
memory contains the following:
Program banks, which are used for storing programs and tables that can be loaded into
the camera’s working memory. A program bank always contains both one program and
one table.
Saved images, which can be used for example as a basis when teaching the camera
patterns to recognize.
Saved data blocks, containing for example pattern recognition data to be used by
Match tools, so that the pattern does not have to be taught before running a program.
©SICK AG • Advanced Industrial Sensors • www.sick.com • All rights reserved 7
Page 8
Chapter 1 Reference Manual
Functional Overview
IVC-2D
1.2 IVC Studio
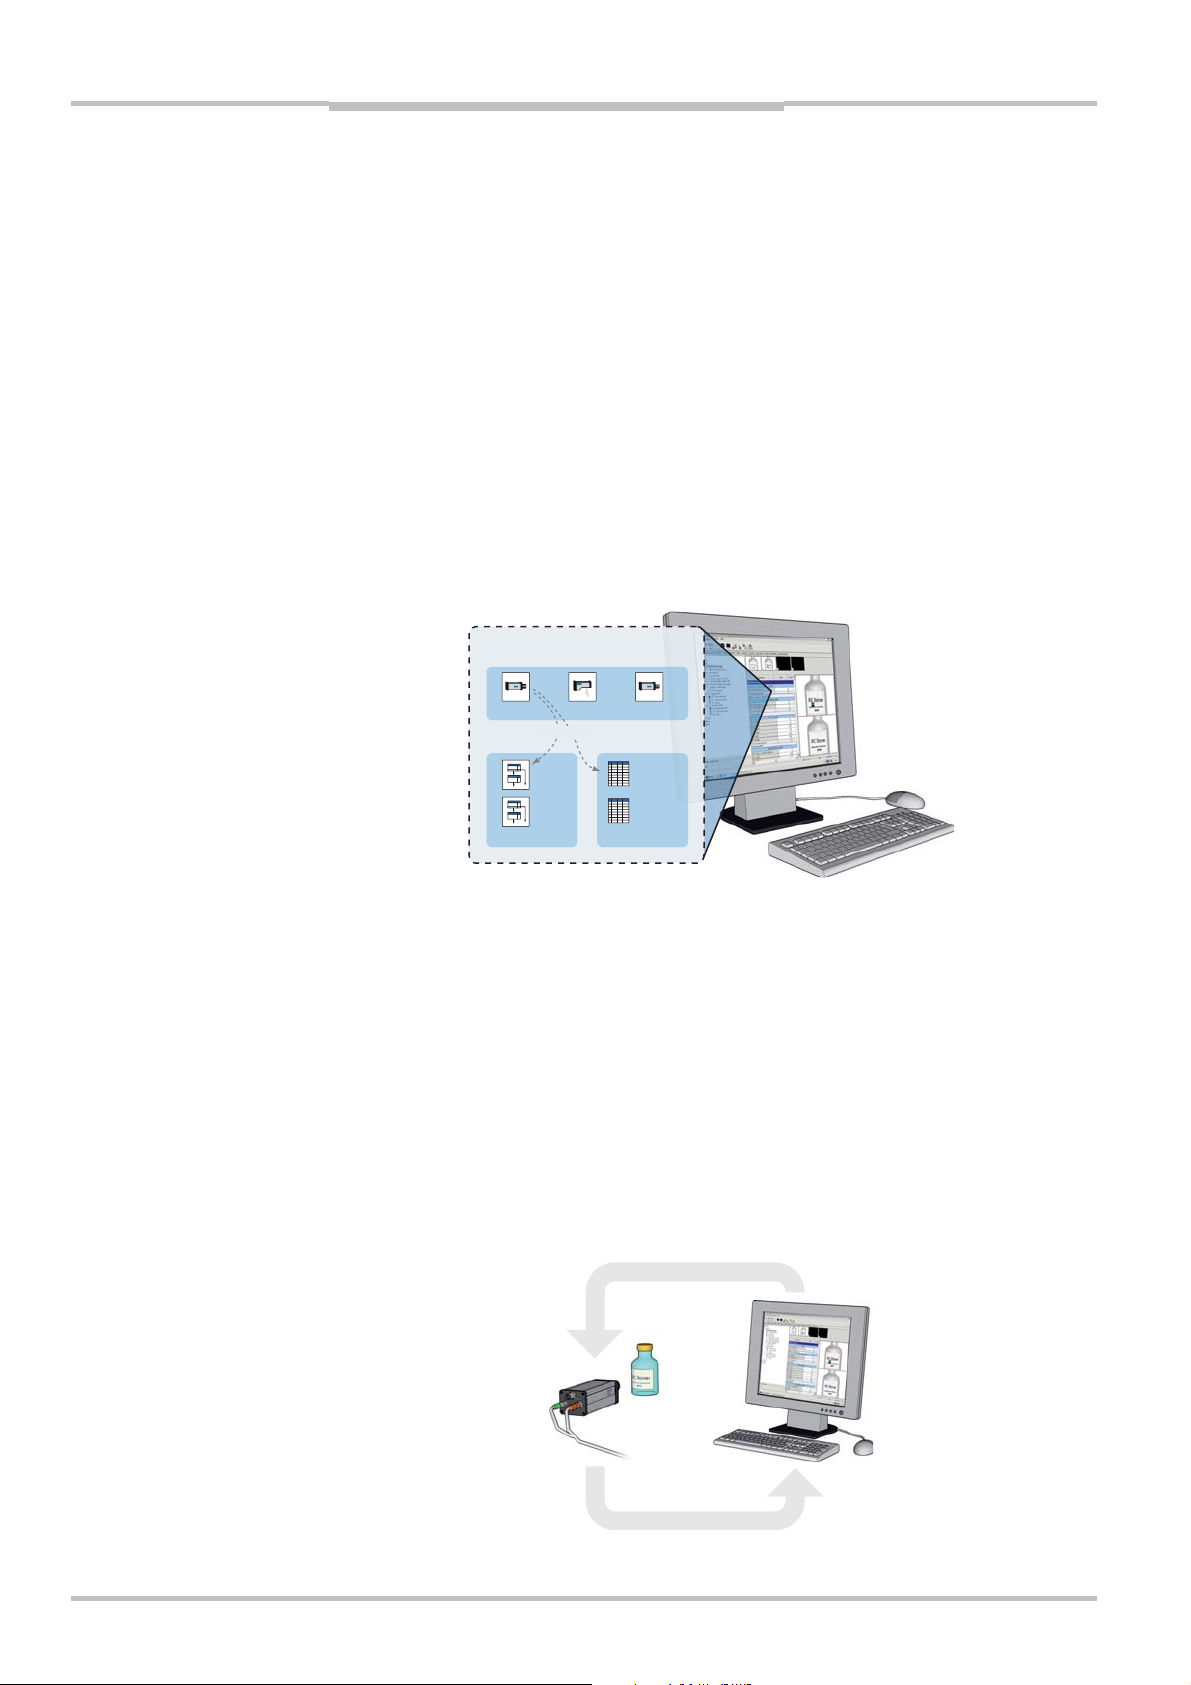
IVC Studio is used for developing the programs that are used by the cameras when performing inspections – that is, analyzing images. IVC Studio can handle both 2D and 3D
cameras.
When you develop a program in IVC Studio, you work with a product. A product in IVC
Studio is a great help for handling all the devices (usually cameras), programs and tables
that are needed for a certain inspection.
The product contains a list of the used devices, and copies of all programs and tables that
are used by the devices. Normally, each device has one program and one table associated
to it, which is also the program and table that are currently in the working memory.
To be able to work with a program in IVC Studio, it must be associated with a device. The
device can be either a hardware camera or the Emulator, see below. A program is always
executed on a device – and never on the computer. The computer is mainly used for
building and modifying the programs on the devices, and to display the results sent from
the devices.
Product
Devices
Camera1
Programs Tables
Camera2 Emulator
<< uses >>
Label LabelTable
FillLevel FillTable
1.2.1 IVC Emulator
The Emulator is a software behaving like an IVC camera, and can be used instead of an
IVC camera. The Emulator is available in the IVC Studio development environment, and it
makes it possible to develop programs when there is no IVC camera available. The Emulator can emulate both 2D and 3D cameras. The main difference between the Emulator and
a camera is that the former uses a pre-recorded set of images stored in an image folder
on the PC, whereas the latter views live images.
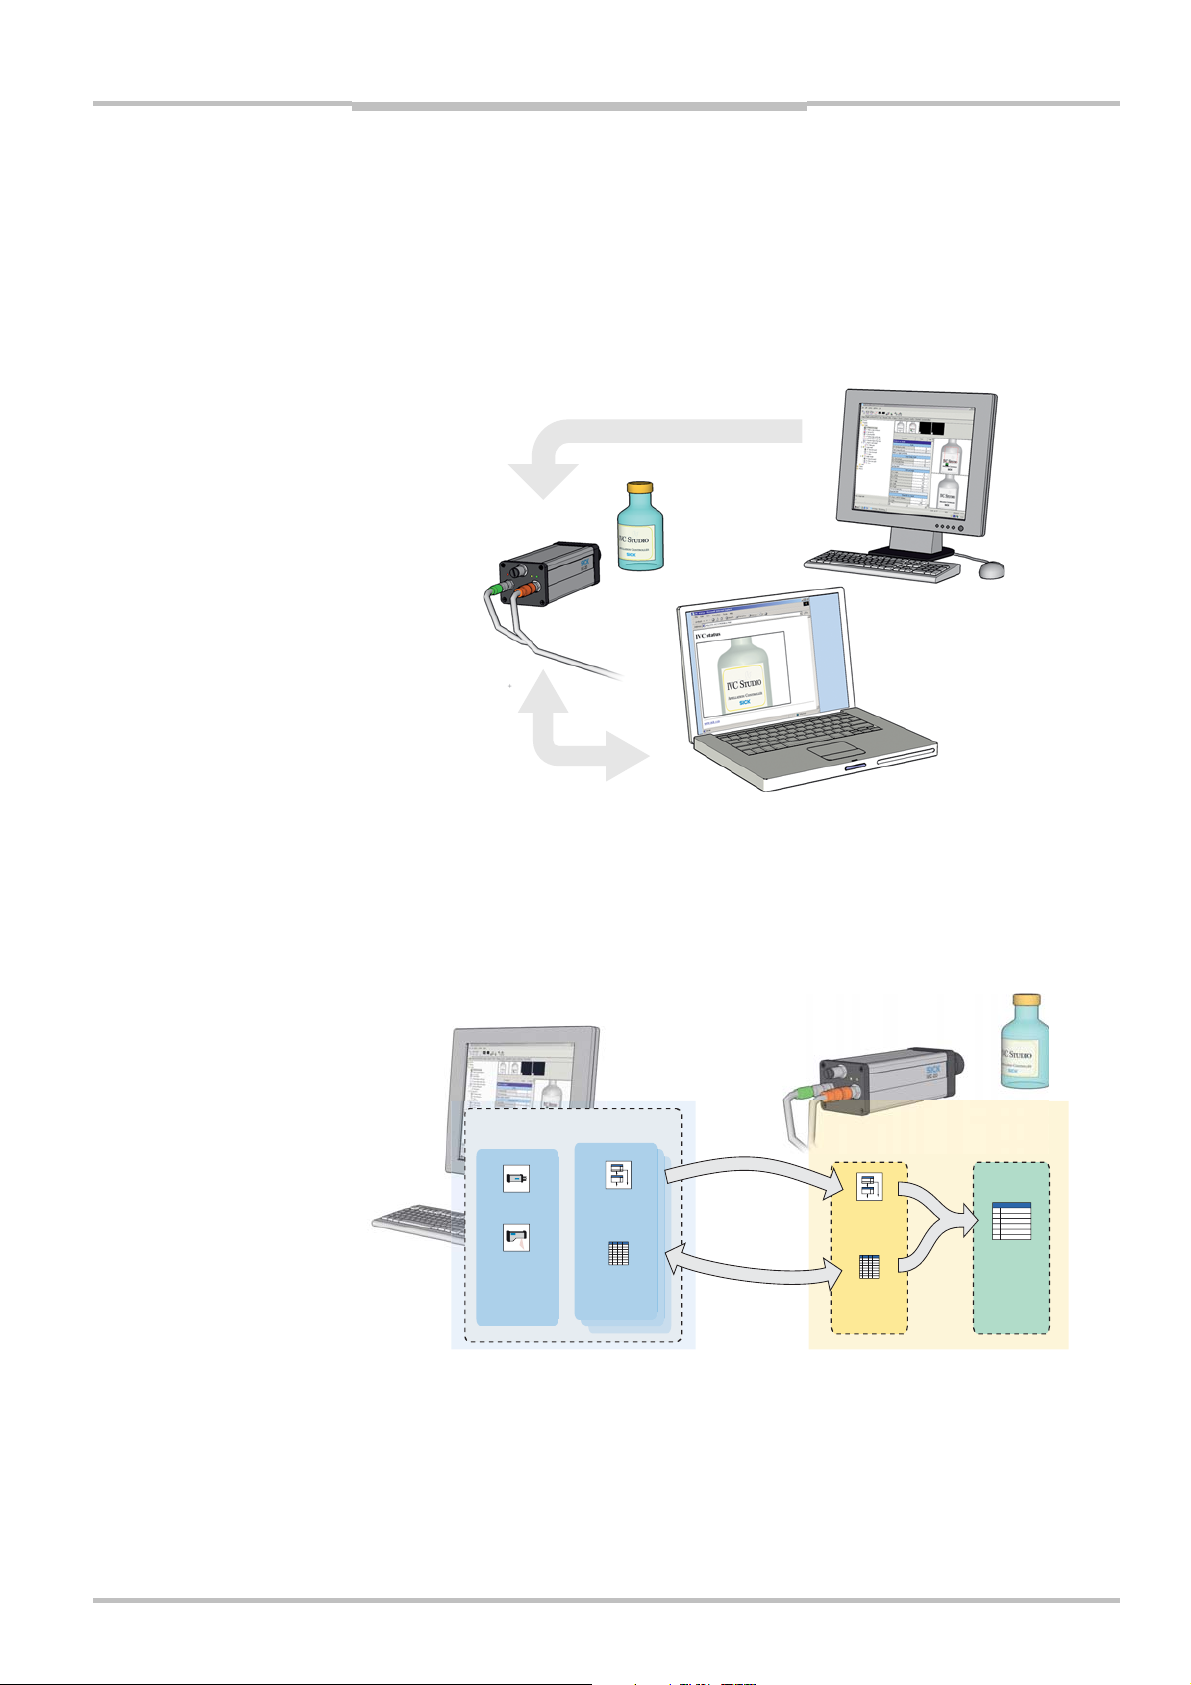
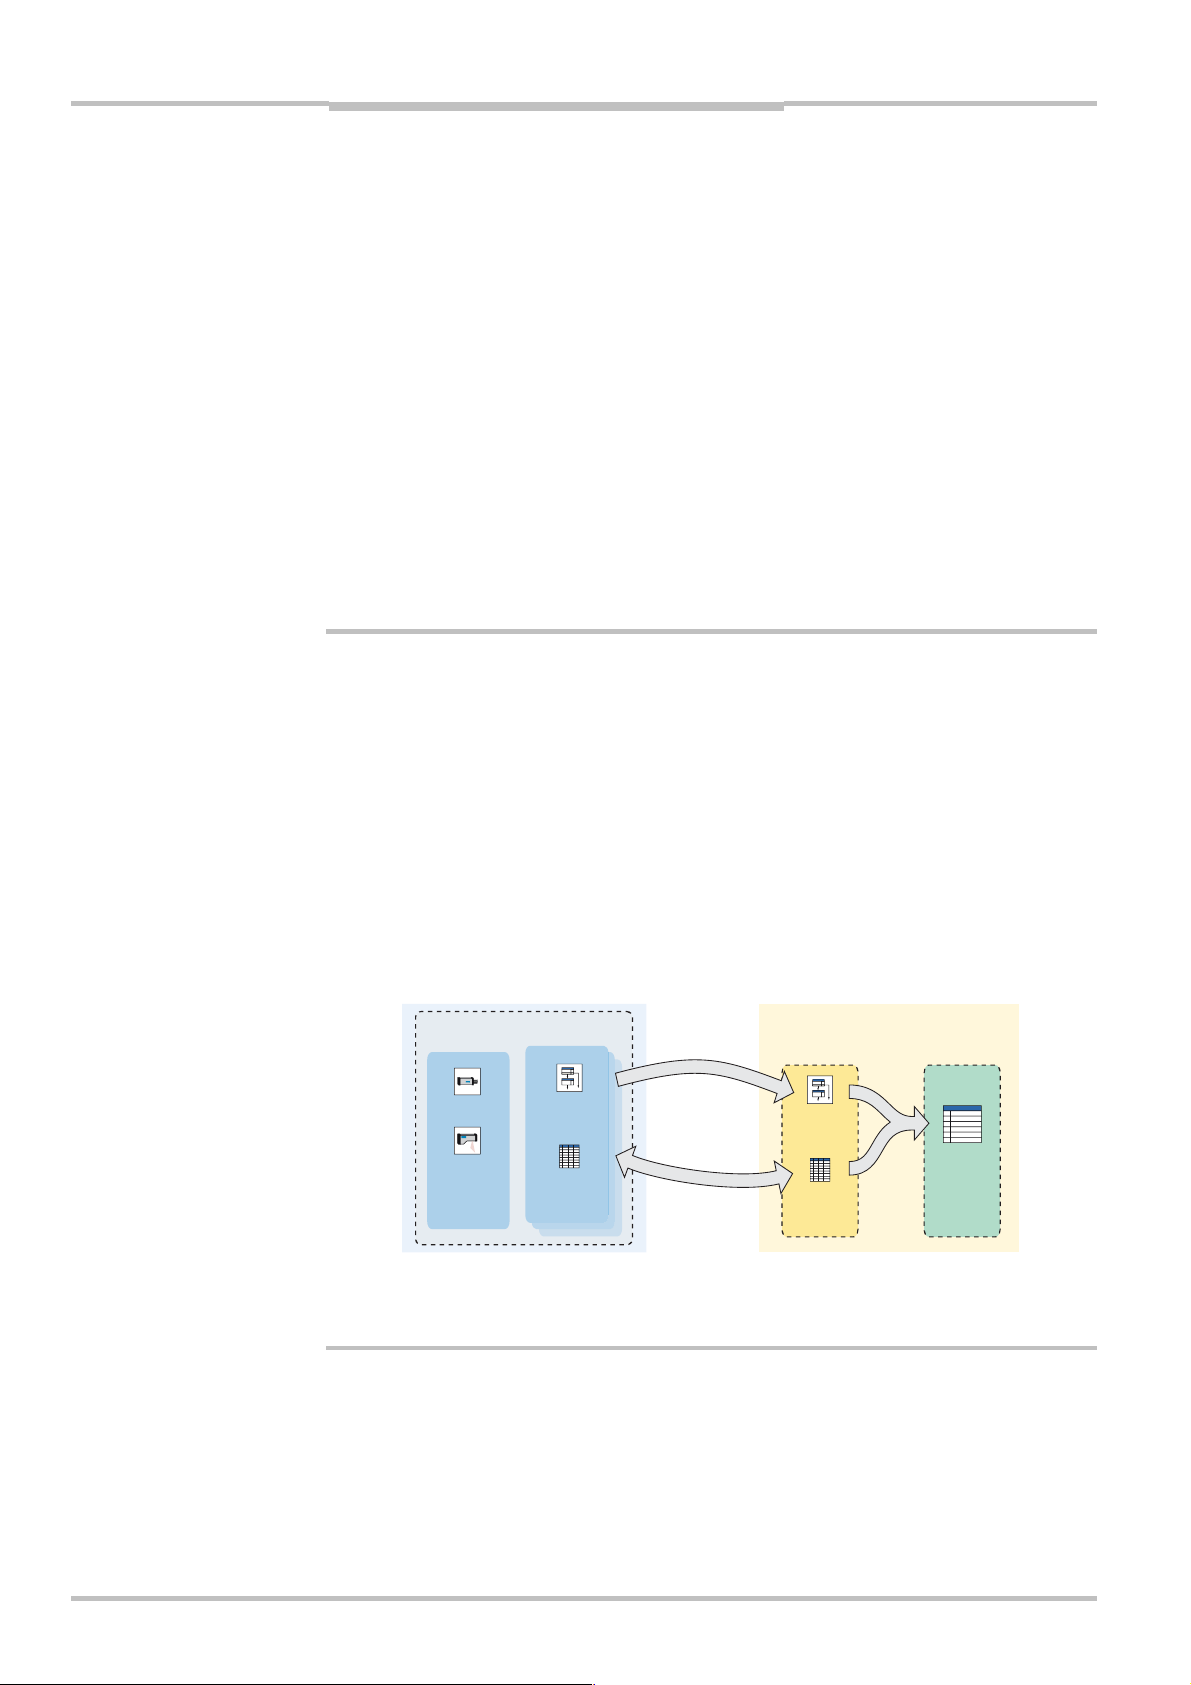
1.2.2 Programs in Development and Production
During development, you build the program in IVC Studio but the program is automatically
downloaded to the associated device.
When a program (or program step) is executed it is executed in the camera, and the
results are sent back to IVC Studio where they are displayed.
Program steps
Table values
Images
Result values
8 ©SICK AG • Advanced Industrial Sensors • www.sick.com • All rights reserved
Page 9
Reference Manual Chapter 1
IVC Studio
IVC-2D
When the development of a program is finished and it is ready to be used, the program
(and table) is downloaded to the device and started.
After this it is not necessary to use IVC Studio any more. It may be used to display the
results from the program, for example to signal when faults occur. But the device can also
be used as a stand-alone unit, where other equipment is used for controlling the device
and displaying the output. For example, you could set up a web page on the camera and
then monitor the camera from a web browser on any computer on the network.
Programs
Tables
Input
Output
1.2.3 Saving Programs
When you save a product in IVC Studio, the included programs and tables are saved with
the product on the computer. Nothing is saved on the device when you save the product.
This is not a problem since the program associated with the device is automatically loaded
into the device as soon as the program is started or edited in IVC Studio.
Product
Devices
Camera 1
Camera 2
Associated
Program
Associated
Table
Copied
automatically
Copy values
manually
Working
Memory
Active
Program
Active
Table
Save in
lash
F
Flash
Memory
1
2
3
4
5
...
Program
Banks
The programs and tables may be stored manually on the device as well. The flash memory
in the device contains a number of program banks, each of which can contain a program
and a table.
When you store a program in the flash memory, you always store the active program and
table, which are currently in the working memory of the device.
A program stored in program bank 0 will automatically be started when the device is
powered up.
©SICK AG • Advanced Industrial Sensors • www.sick.com • All rights reserved 9
Page 10
Chapter 1 Reference Manual
Functional Overview
IVC-2D
1.3 Handling Multiple Products
A device may be used in several products, using different programs and tables depending
on the product. This makes it easy to use the same camera for performing different inspections. Just create one product for each inspection, and in each product associate the
program and table to be used for the specific inspection.
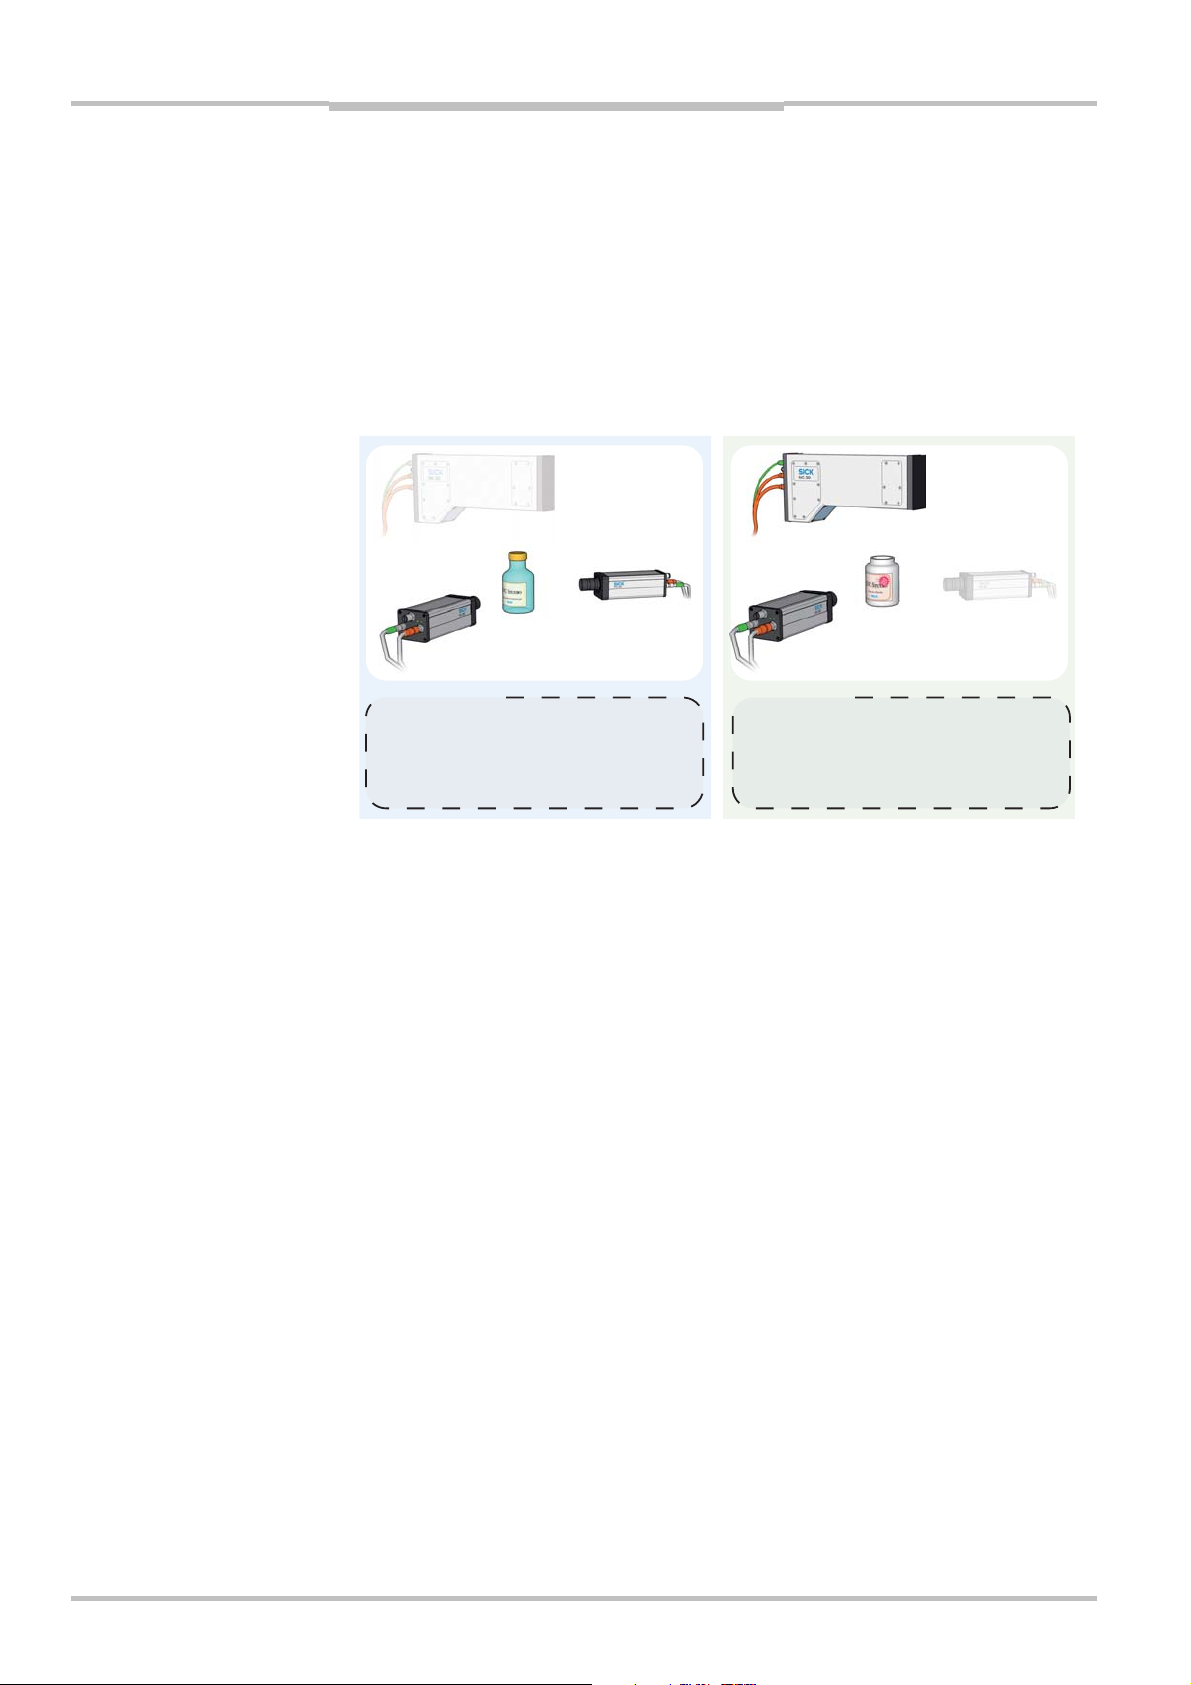
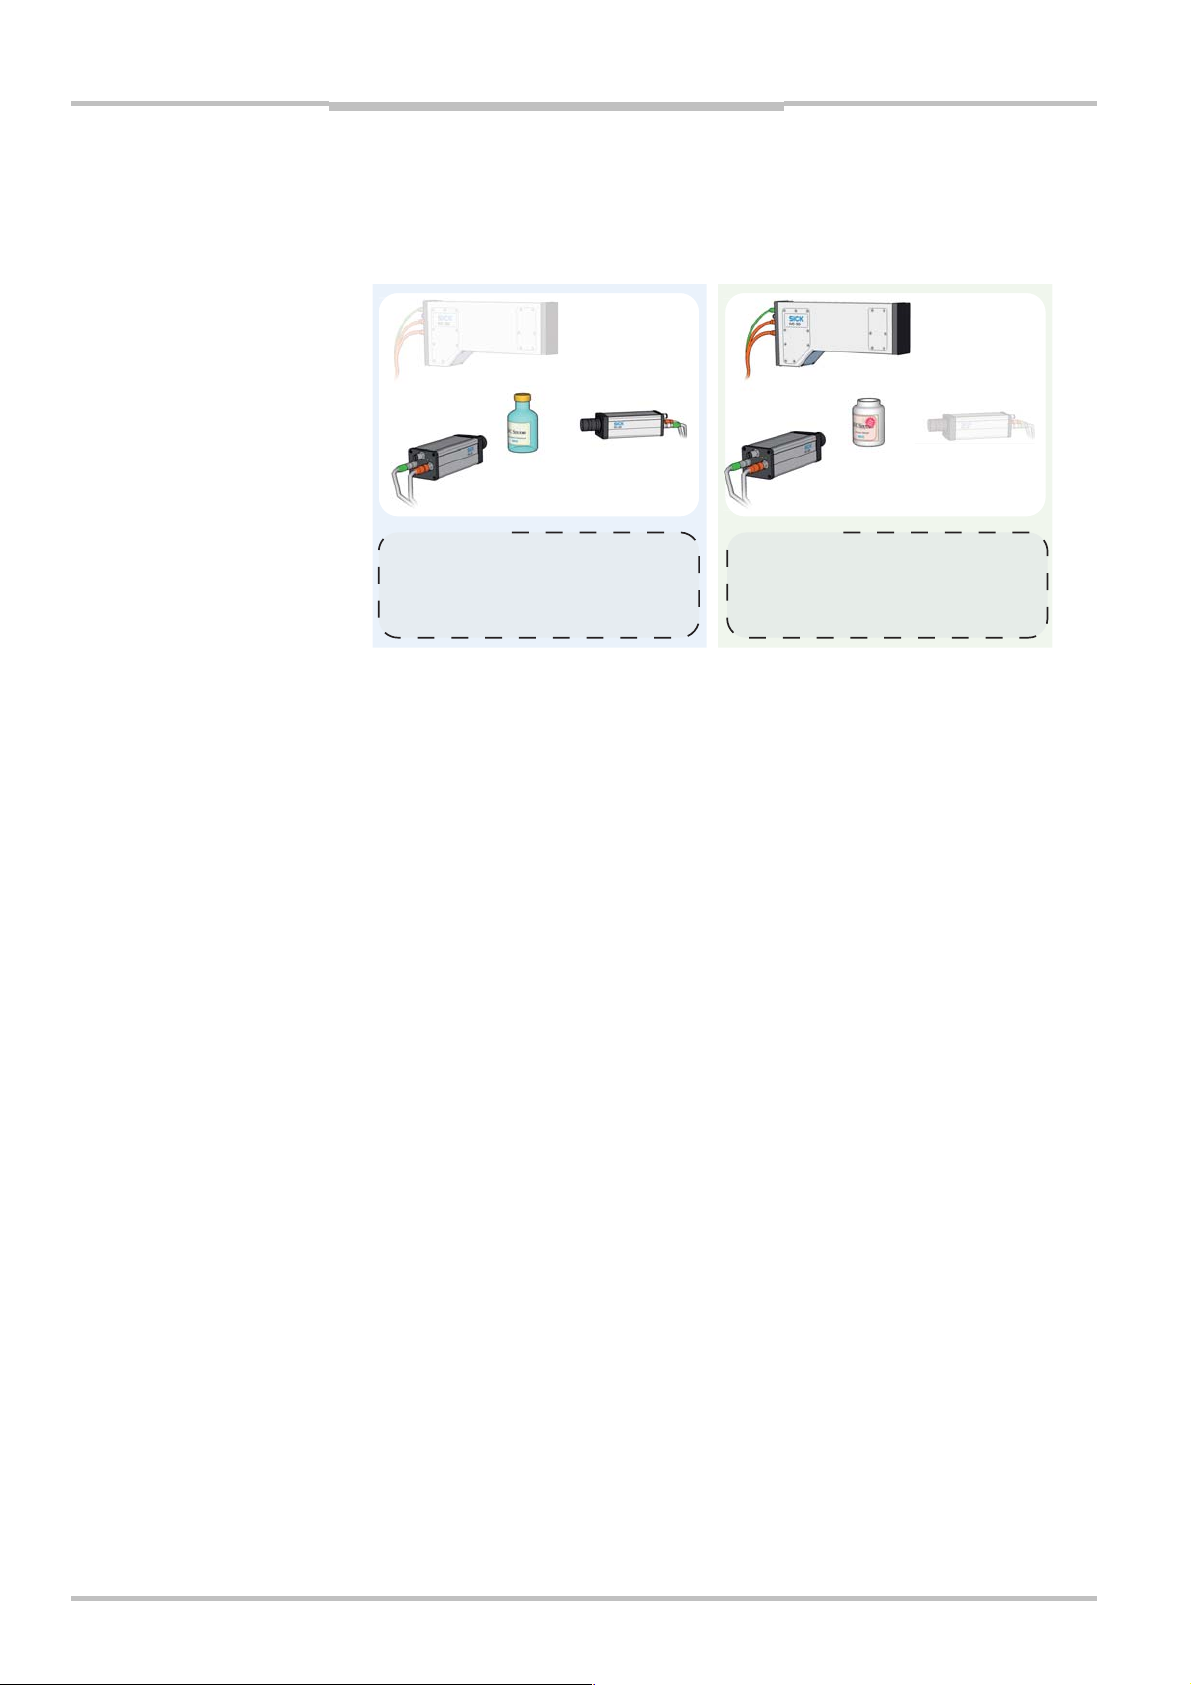
For example, there are three cameras set up by a production line, and we are producing
two different items on this production line – a transparent bottle and an opaque jar. For the
bottle we can use IVC-2D cameras to inspect both the label on the front and the fill level,
but for the jar we need to use an IVC-3D camera to inspect the fill level.
Device 3
Device 2
Device 1
Product: Bottle
Dev Program Table
1 Label Bottle_Label_Table
2 Bottle_FillLevel Bottle_FillLevel_Table
Device 1
Product: Jar
Dev Program Table
1 Label Jar_Label_Table
3 Jar_FillLevel Jar_FillLevel_Table
To achieve this we create two products in IVC Studio with the following contents:
Product: Bottle
Device Program Table
1 Label Bottle_Label_Table
2 Bottle_FillLevel Bottle_FillLevel_Table
Product: Jar
Device Program Table
1 Label Jar_Label_Table
3 Jar_FillLevel Jar_FillLevel_Table
When switching between producing the two products, we can simply open the product in
IVC Studio to load the corresponding programs and tables into the devices. If we would
change the design of the label for the bottle, we can just change the values in the table
Bottle_Label_Table to suit the new design. If necessary we could also make a copy of the
program Label, modify it, and associate the modified program with device 1.
10 ©SICK AG • Advanced Industrial Sensors • www.sick.com • All rights reserved
Page 11
Reference Manual Chapter 2
IVC-2D
Creating a product
2 Getting Started
In this chapter we will introduce the basics in IVC Studio, and learn how to:
Set up IVC Studio to write a program
How to write the program - that is adding program steps and setting parameters
How to test and debug the program
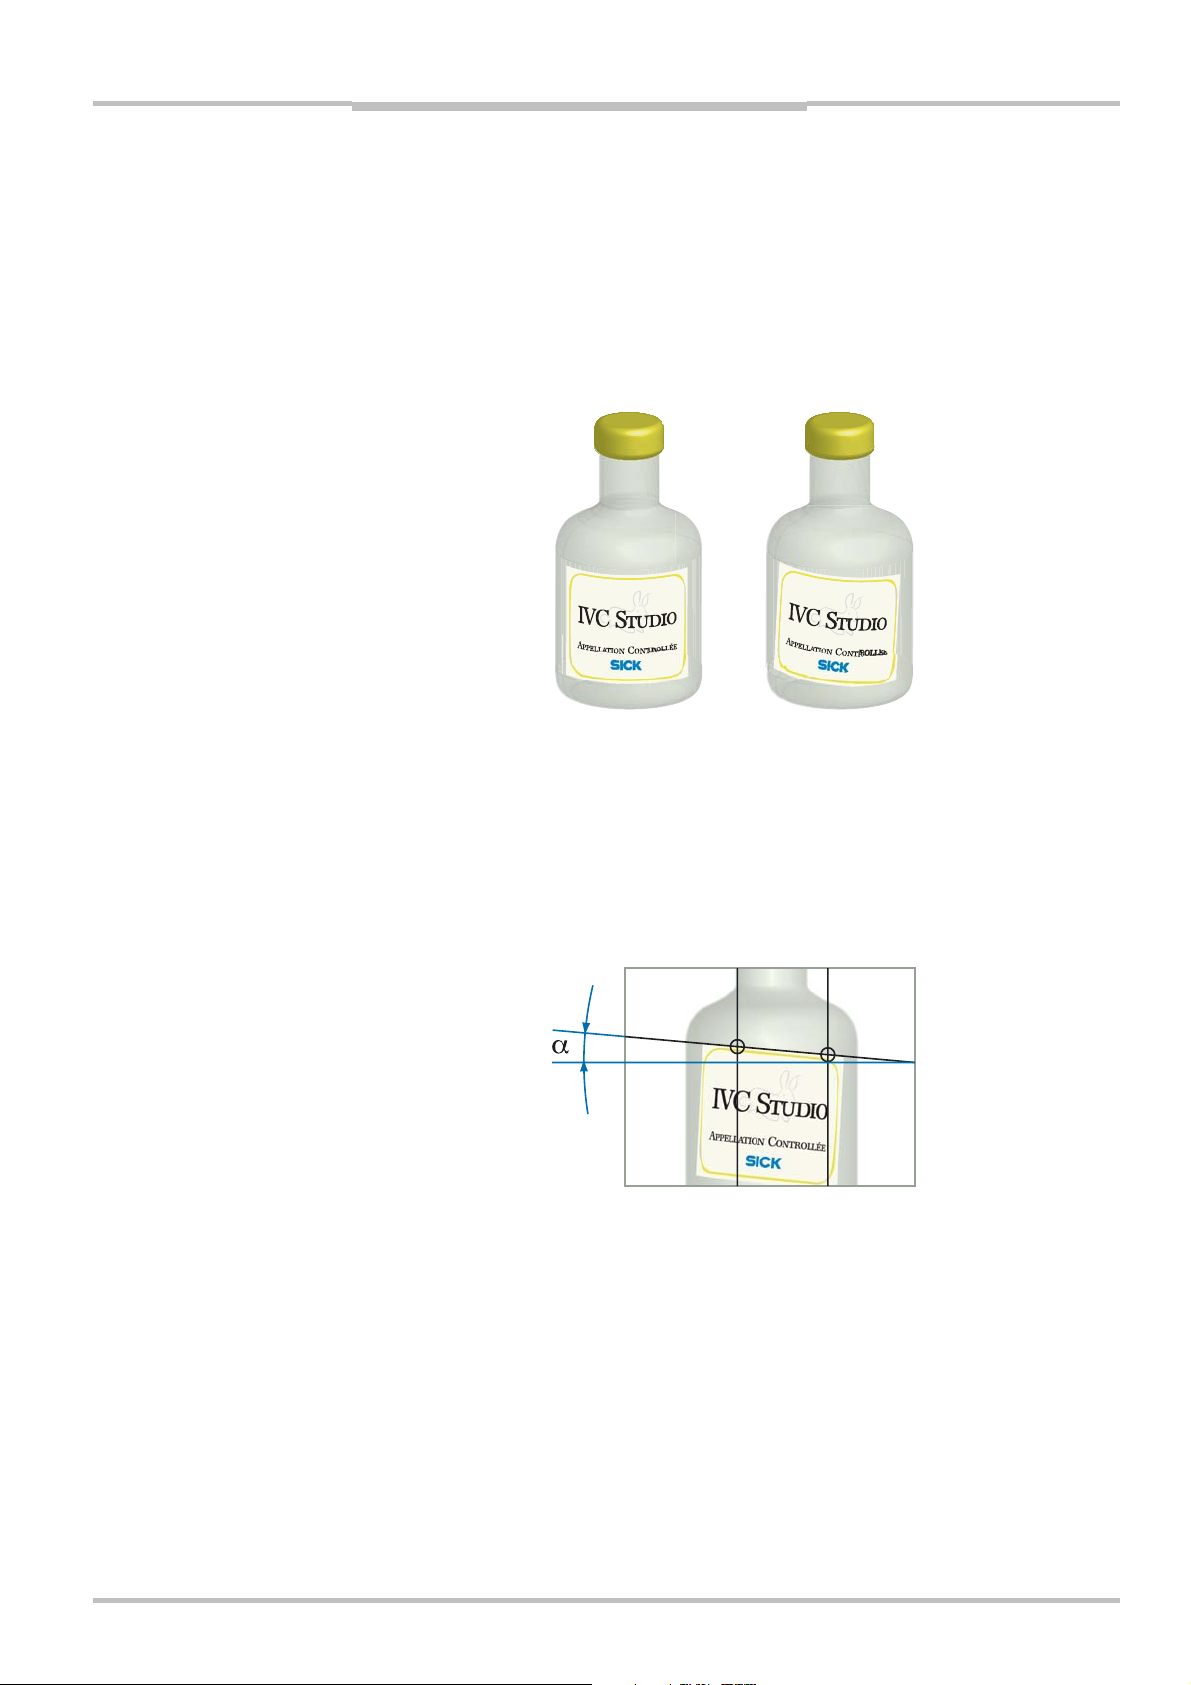
As an example we will build a simple program that checks whether or not a label has been
placed correctly on a bottle, that is if it is tilted or not.
OK Fail
A simple way of checking this is to:
Capture an image of the bottle
Search the image along two lines to find the edge of the label in two locations
Calculate the angle between the two locations
If this angle is too large then the label is tilted, and the program changes the state of an
output. In a real application this output could for example control a lever that pushes the
faulty bottle to the side.
When writing a program in IVC Studio you can use either a hardware camera or, if no such
is available, the Emulator.
In the following sections it is assumed that a hardware camera is used, and that both the
camera and IVC Studio are installed and are working properly. How to install the camera
and IVC Studio is described in the installation instruction.
How to use the Emulator is described in section Using IVC Studio in the IVC-2D Reference
Manual.
2.1 Creating a product
Before starting to write the program that performs the inspection, you need the following:
A product to work in
A device to use in the product (in this case a camera)
A program written for the device
©SICK AG • Advanced Industrial Sensors • www.sick.com • All rights reserved 11
Page 12
Chapter 2 Reference Manual
Getting Started
IVC-2D
A table used for the program in the device
A product in IVC Studio is a collection of devices (usually cameras) that are used for per-
forming an inspection, for example of bottles on a production line. Each device contains
one or more programs that instruct the device how to perform the inspection.
A program is a list of commands, or tools, that the device executes one by one, in order to
capture images, analyze them and draw conclusions from. To its help, the program has a
table that it can read values from and store results to.
Product
Devices
2.1.1 Create a
Camera1
Programs Tables
Product
Camera2 Emulator
<<
uses
>>
Label LabelTable
FillLevel FillTable
The first step is to create the product to work in:
1. Start IVC Studio and log in.
If you just installed IVC Studio, the default user and password can be found in the
installation instruction.
2. Choose File
Æ New Product from the IVC Studio menu bar.
A new empty product named New Product is opened.
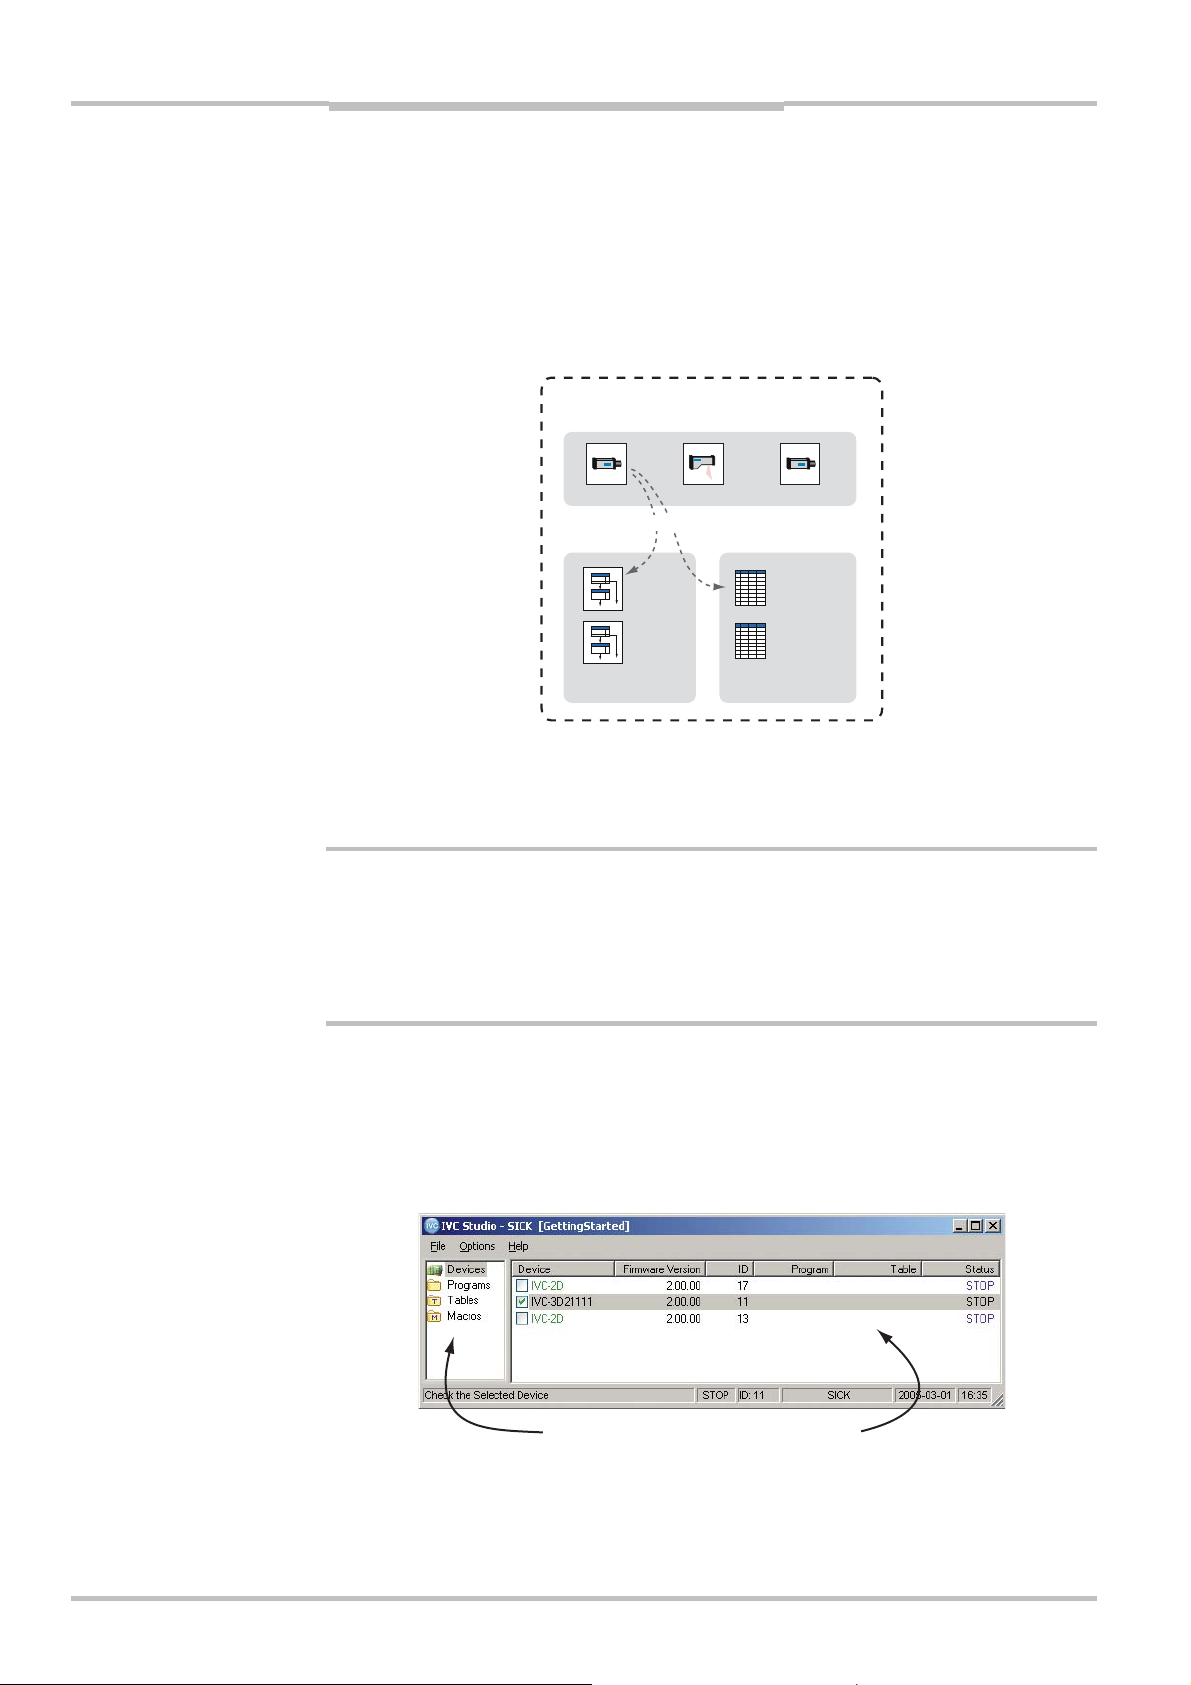
The main window shows the contents of the currently open product. The left pane shows
the different types of objects that the product may contain, that is; devices, programs and
tables.
Clicking on one of the categories will display the objects contained in the product. Since
the product was just created, all the categories are empty, with the exception of Devices,
which displays all available devices.
Left pane Right pane
12 ©SICK AG • Advanced Industrial Sensors • www.sick.com • All rights reserved
Page 13

Reference Manual Chapter 2
IVC-2D
Creating a product
There is also a fourth type that we haven’t mentioned yet - macros. Macros are basically
small programs that you can call from within regular programs. They can be useful for
reusing blocks of program steps when writing advanced programs.
2.1.2 Select a Device
The next step is to select the device used for the inspection:
3. Click Devices in the left pane of the main window.
The camera is displayed in the right pane. If there are more devices that can be used
by IVC Studio in your network, those will also be displayed in the right pane.
4. Select a device by clicking in the checkbox in front of it in the right pane.
You should always select the devices that you intend to use in your product. IVC Studio
periodically updates the information in the device list by polling the devices that are selected in the list.
If no device is selected in the list, IVC Studio will poll every device it can find for information.
This slows down IVC Studio may affect the performance of devices used by other users.
2.1.3 Create a Program
Now we are ready to create the program that we intend to build and associate it with a
device.
The reason for associating the program with a device before building it is that the program
is always run in a device and not on the computer. What you see in IVC Studio when
running a program are just the results, which are sent from the device. If you didn’t associate the program with a device, you would not be able to see any result of the program or
even test the program.
5. Right-click Programs in the left pane in the main window, and choose New Program
from the pop-up menu.
6. Fill in a name for the program in the dialog box, and click OK.
7. Click Devices in the left pane of the main window.
8. Right-click the device in the right pane that is selected for the product, and choose
Select Program from the pop-up menu.
9. Select the program in the list in the dialog box, and click OK.
2.1.4 Create a Table
There must also be a table associated with the device, so before starting to build the
program we must create a table and associate it with the device:
10. Right-click Tables in the left pane in the main window, and choose New Table from the
pop-up menu
11. Fill in a name for the table in the dialog box, and click OK.
12. Click Devices in the left pane of the main window.
13. Right-click the device in the right pane that is selected for the product and chose
Select Table from the pop-up menu.
14. Select the table in the list in the dialog box, and click OK.
15. Finally, save your changes to the product on the PC by choosing File
©SICK AG • Advanced Industrial Sensors • www.sick.com • All rights reserved 13
Æ Save Product.
Page 14
Chapter 2 Reference Manual
Getting Started
IVC-2D
2.2 About Writing Programs
Before starting to write the program, we will take a look at what a program consists of and
the programming environment.
2.2.1 Tools
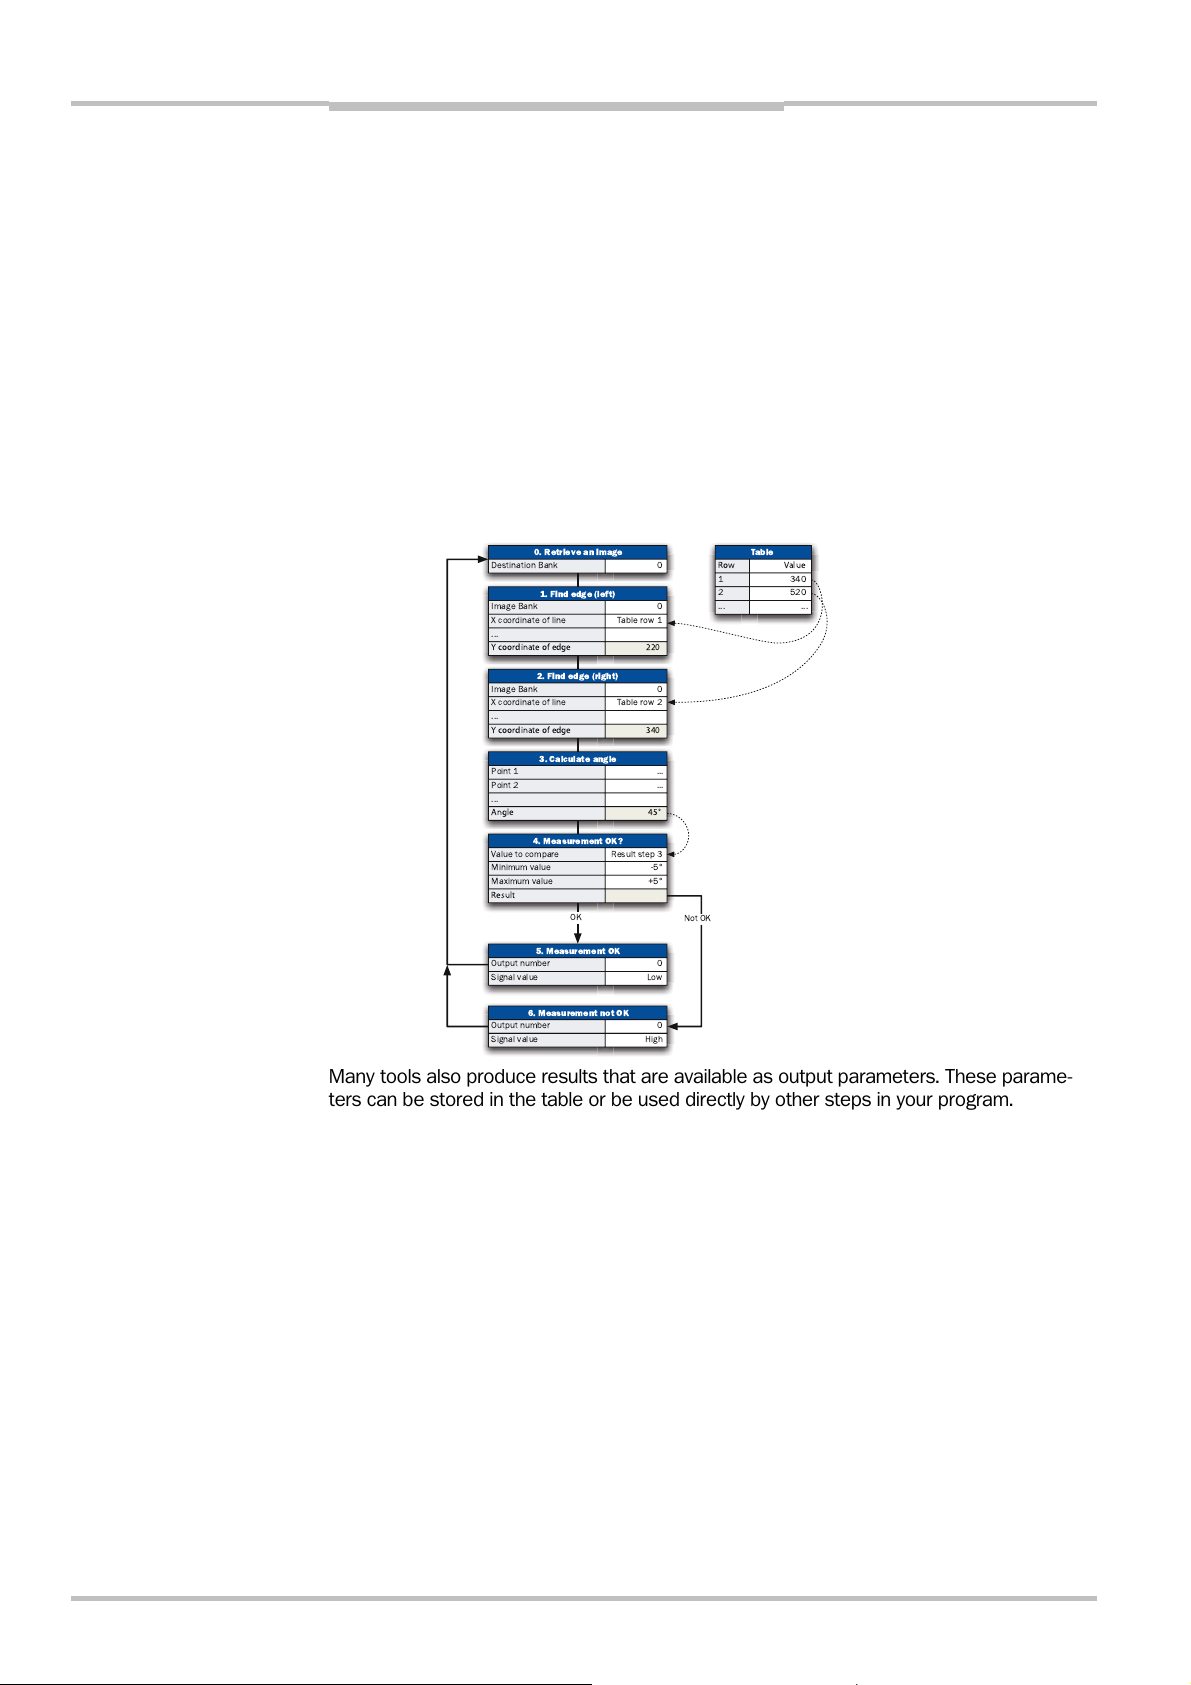
A program is a list of commands – or tools – that are performed by the camera. When the
program runs, the commands are carried out one by one in the order that they appear in
the program list. So when you build a program in IVC Studio, you work with this list of
commands.
Most of the tools have a number of input parameters that can be set. For example when
starting to take a snapshot from a camera, you may specify the exposure time and which
input that should trigger the capture.
0. Retrieve an image
1. Find edge (left)
Y coordinate of edge 220
2. Find edge (right)
Y coordinate of edge 340
3. Calculate angle
Angle
4. Measurement OK?
!
Result
5. Measurement OK
(
)
" #
(-
45¡
$%&
'%&
. (-
*
Table
Row
Value
#/
%
6. Measurement not OK
(
)
+,
Many tools also produce results that are available as output parameters. These parameters can be stored in the table or be used directly by other steps in your program.
14 ©SICK AG • Advanced Industrial Sensors • www.sick.com • All rights reserved
Page 15
Reference Manual Chapter 2
About Writing Programs
IVC-2D
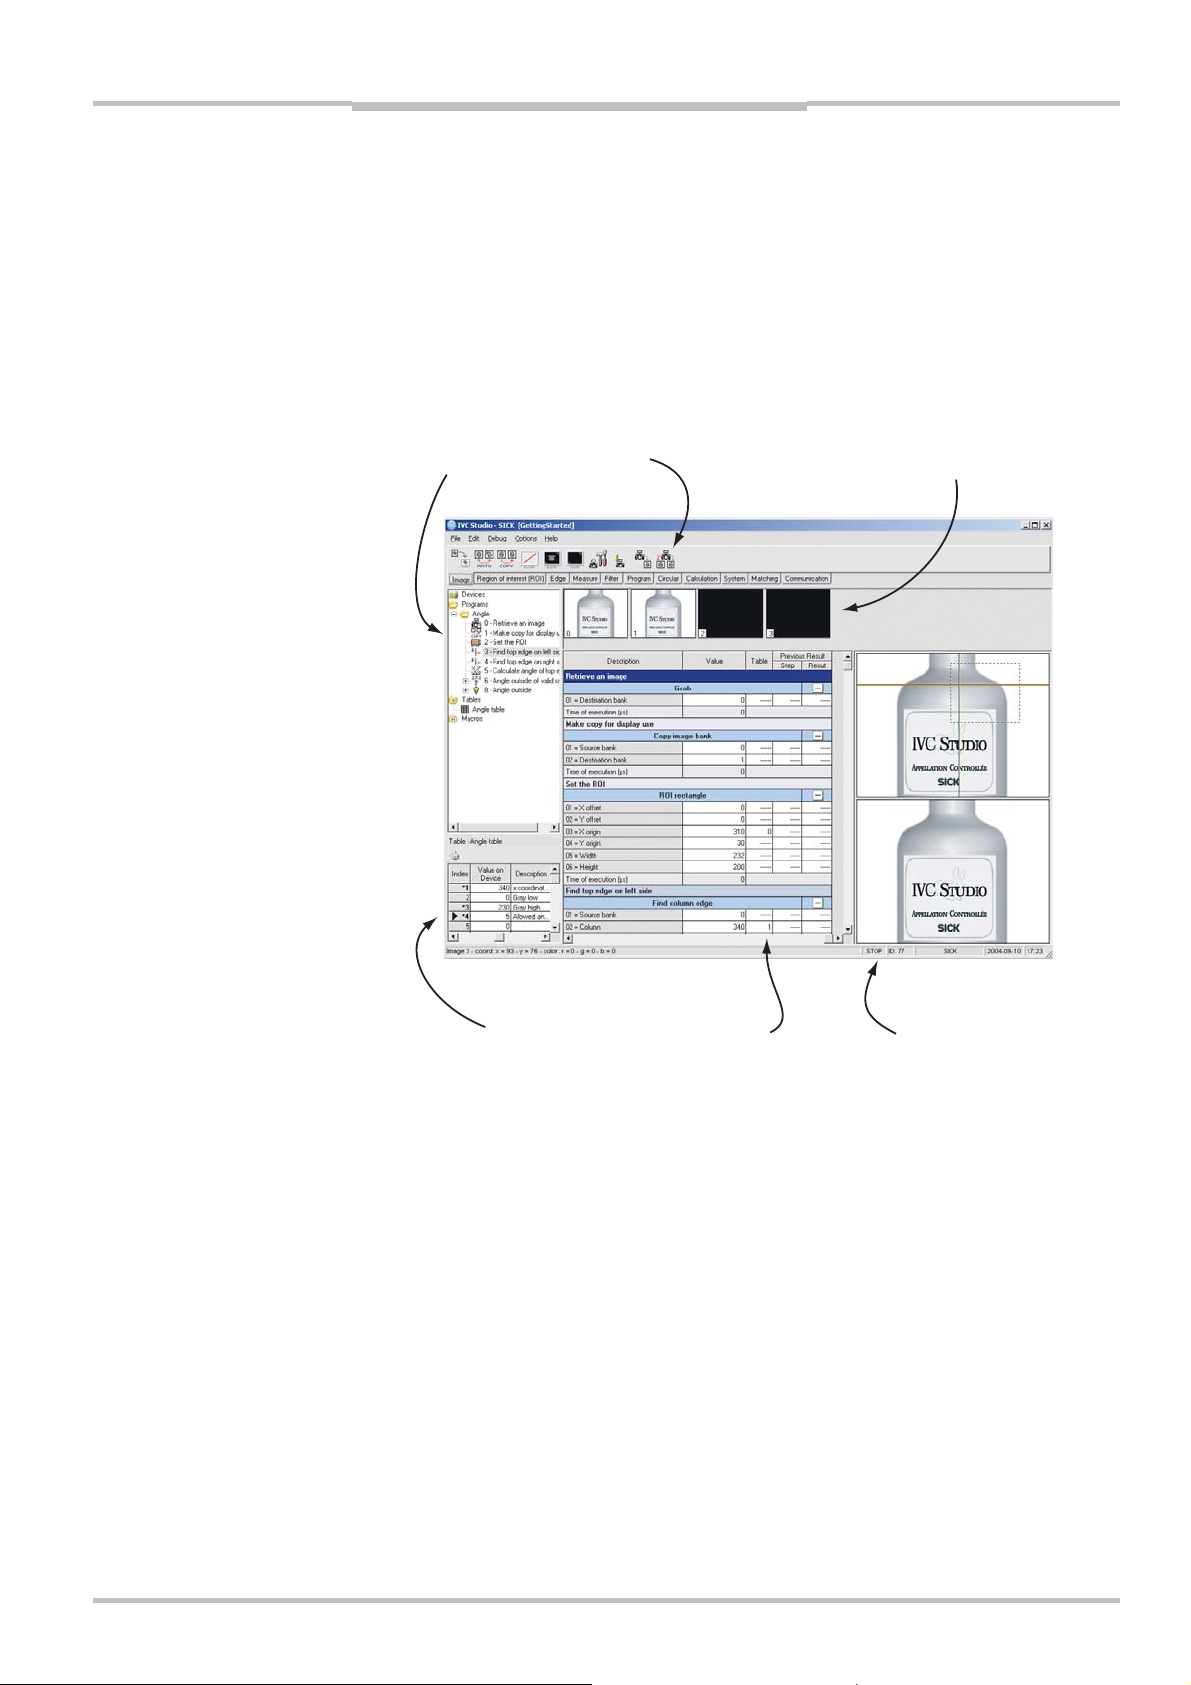
2.2.2 Programming Window
When you write a program, the main window contains a few additional parts:
Toolbar – contains the tools that can be used with the device.
Program List – shows the tools used in the program and the parameters for each tool.
Table – shows the contents of the device’s table
Image Banks – shows thumbnails of the images currently in the image banks of the
device (if any)
Preview – shows the result of the program step when applied to an image.
ToolbarTree View
Image Banks
PreviewTable Program Steps
The toolbar actually contains several toolbars on which the tools are grouped into categories. You switch between the categories by clicking the tabs at the bottom of the toolbar.
The program list shows each step in the programs as a table. Each step contains:
The input parameters that can be set for the tool
The execution time for the tool when executed
The result (return values) from the tool
There are four columns in the program list, which are used for specifying parameter values;
Value, Table, Step and Result. Which column to use depends on what type of parameter
value you want to use; constant values, values stored in the table, or results from previous
steps.
Image banks are used for storing images, just like the table is used for storing values. This
can be very useful, for example if you want to modify the image, but need to use the
original image later on in the program. Note that the images are stored in the camera, and
that the images in the image banks remain there until they are removed or overwritten by
other images.
The preview window is used by some tools to visualize the result of the tool. This preview is
useful when you develop your program, but is not generated when the program is running.
The preview window may also be used for setting parameters for certain tools. This is
further described later on in this chapter.
©SICK AG • Advanced Industrial Sensors • www.sick.com • All rights reserved 15
Page 16
Chapter 2 Reference Manual
Getting Started
IVC-2D
2.3 Adding Program Steps
Now we are ready to start writing our program for inspecting the label on the bottles.
Start by adding the first program step to the program, which should grab an image from
the camera:
1. Click on the name of your program in the left pane in the main window.
A toolbar is displayed at the top of the window, which contains a number of tools that
can be used with the device. Below the toolbar there is a row of tabs, which are used
for switching between different categories.
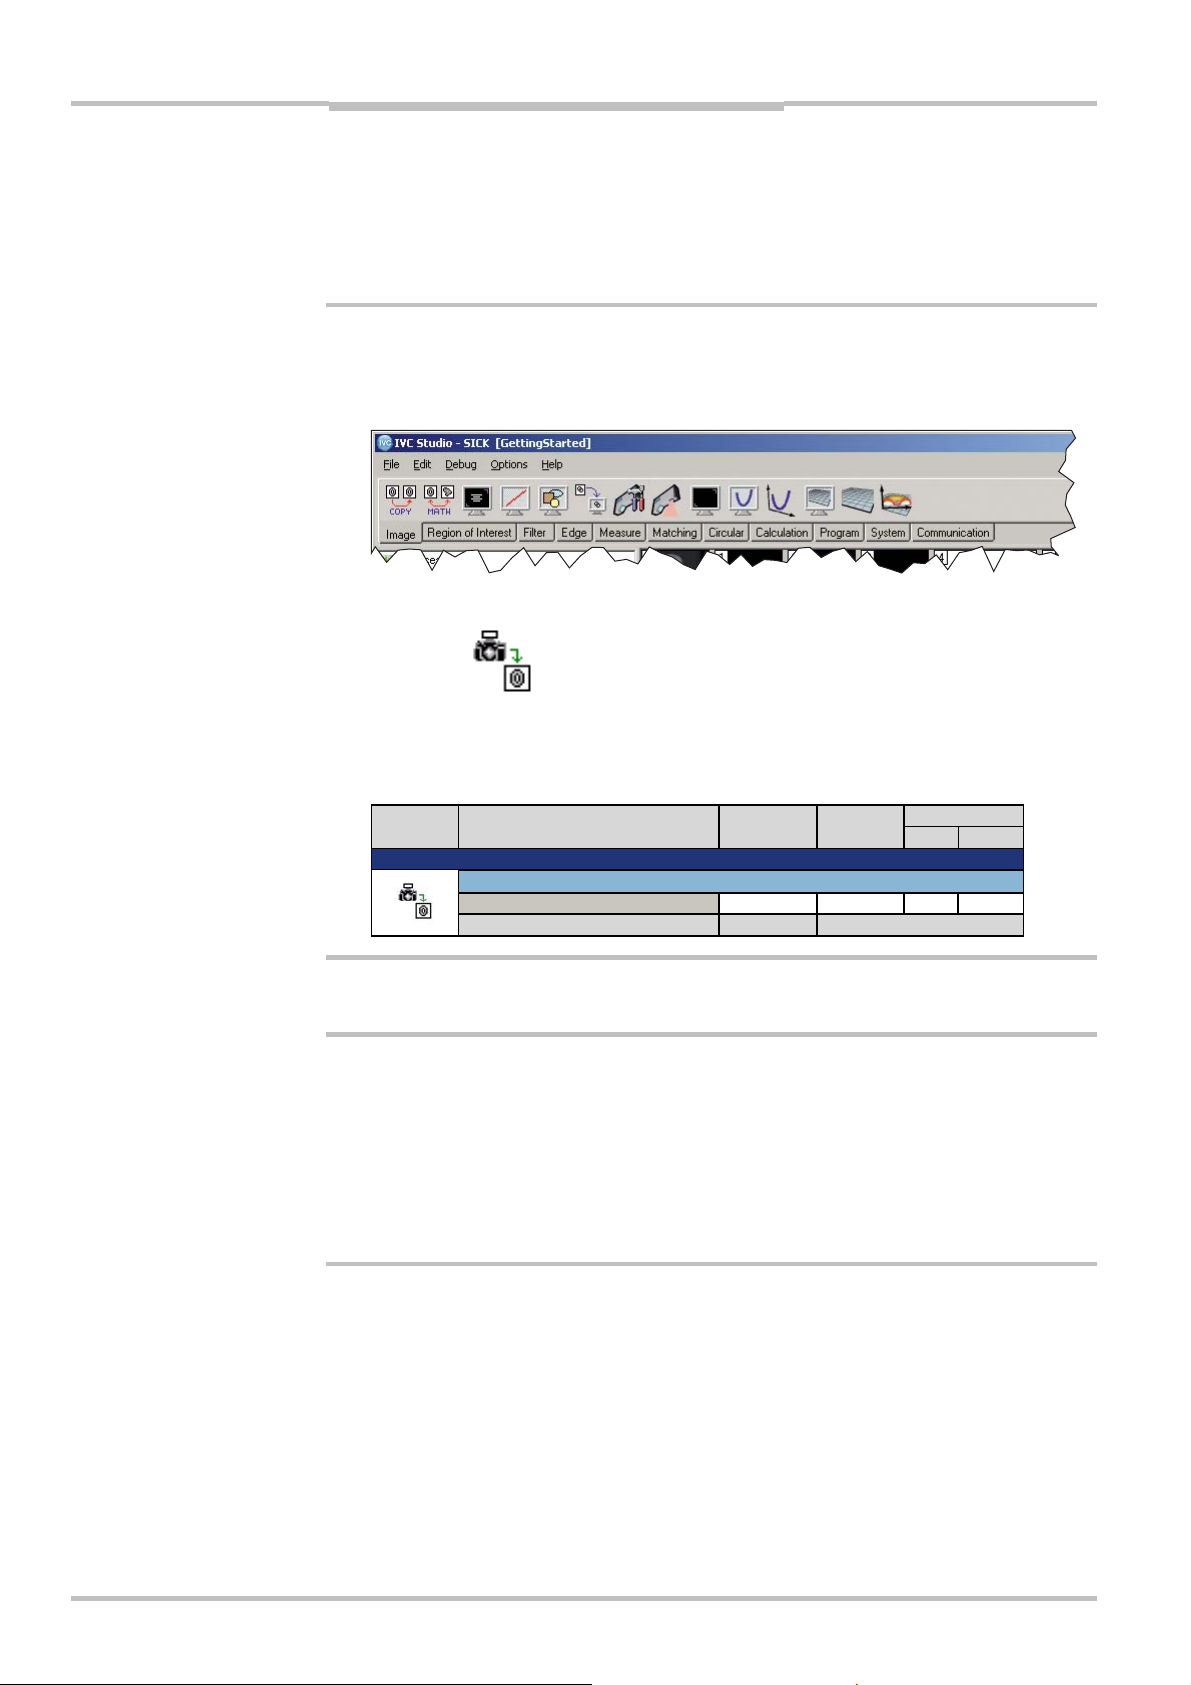
2. Click the Grab tool in the Image category on the toolbar to add the first step to the
program.
The Grab tool is added to the program’s folder in the left pane, and the Image Banks,
Program List and Previews are displayed in the right pane.
3. Double-click the blue field at the top of the program step, and type a description for
the step, for example “Retrieve an image”.
Description Value Table
Retrieve an image
0 - Grab
01 - Destination bank 0 ------ ------ ------
Time of execution (µs) 0
Previous result
Step Result
The command is now added to our program, but in order to see the effect of the command, it has to be executed by the camera.
4. Click the Grab step in the program list to select the step.
5. Press F1 to open up the Reference manual for the Grab step.
6. Close the manual again and remember to use the F1 button whenever you want to
learn more about a tool.
7. Choose Debug
Æ Execute Step from the IVC Studio menu, or press the F5 key on the
keyboard.
An image is now retrieved from the camera and stored in image bank 0.
16 ©SICK AG • Advanced Industrial Sensors • www.sick.com • All rights reserved
Page 17
Reference Manual Chapter 2
Setting Parameter Values
IVC-2D
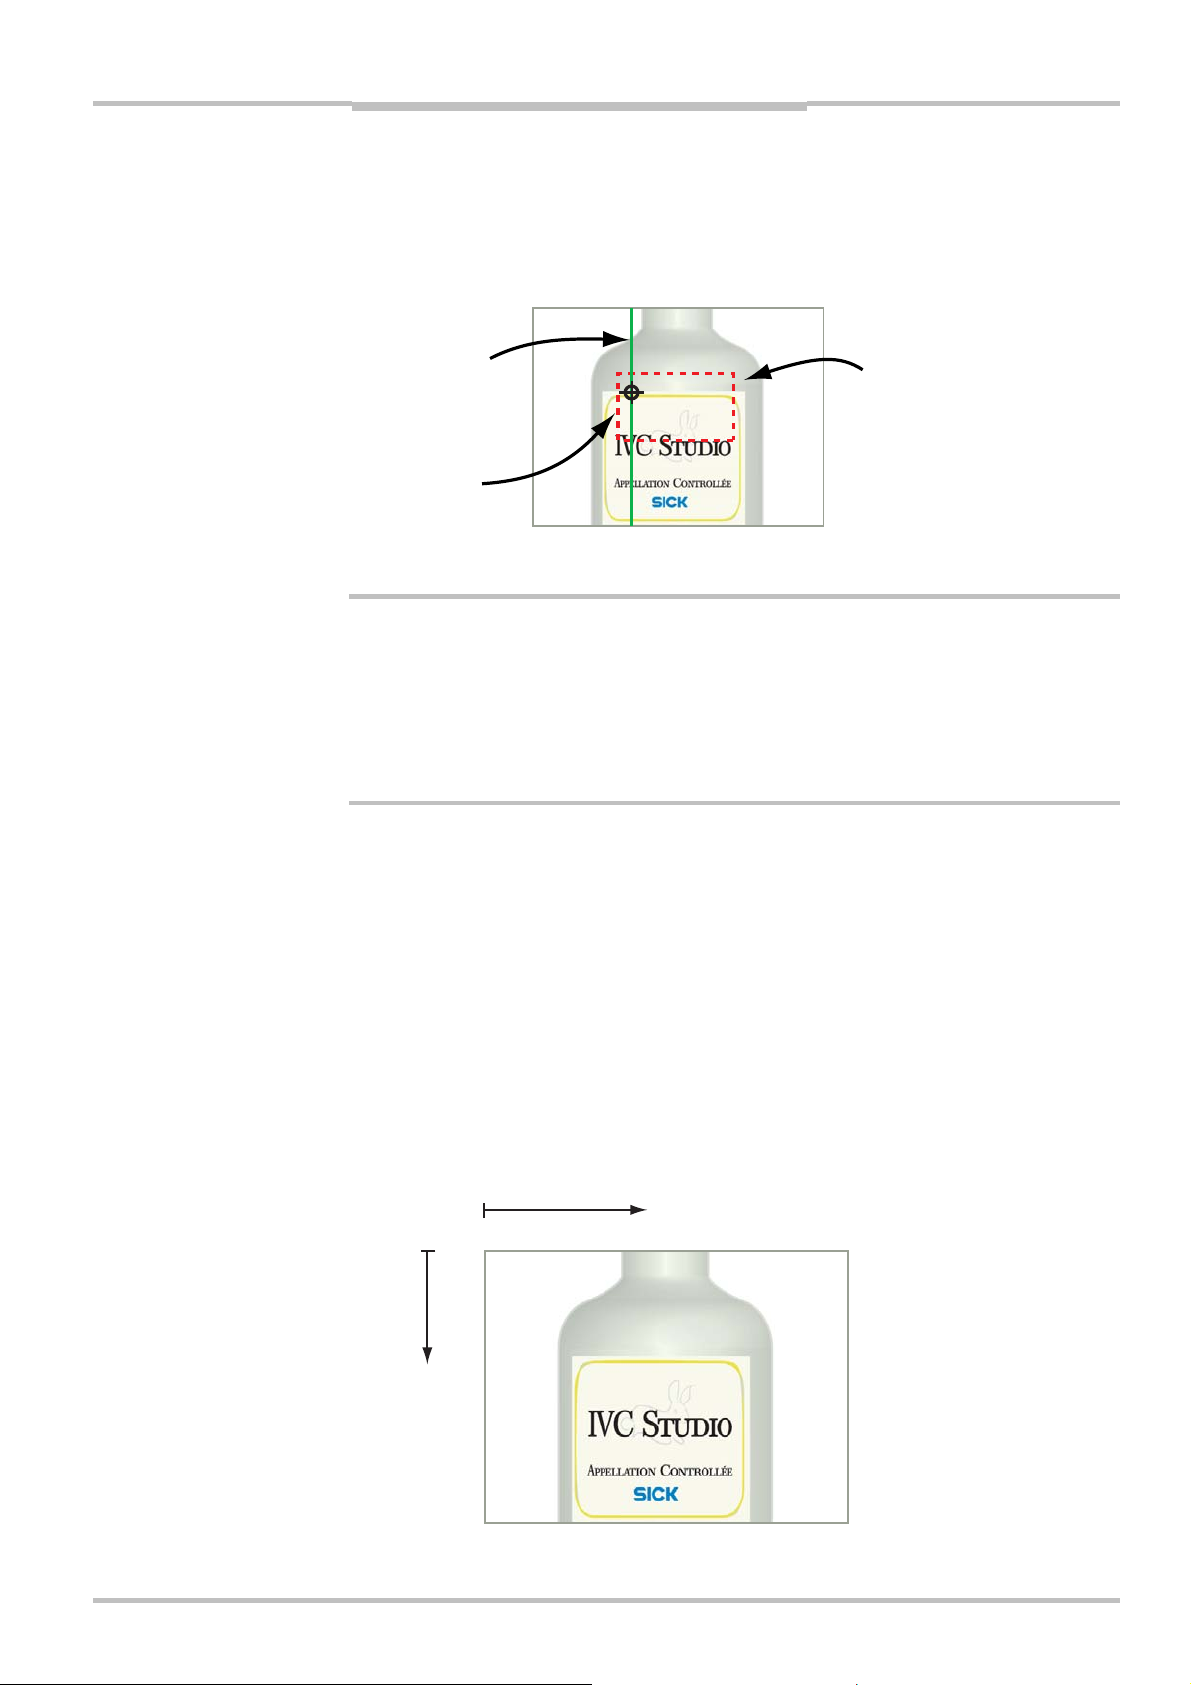
To search the image for the edge we need two tools:
A ROI Rectangle that creates a Region of Interest, which defines where in the image we
expect to find the edge of the label.
A Find Column Edge that looks for the upper edge of the label on the left side of the
image.
Scan line
Left point
Region of interest
(ROI)
We also need a step that finds the upper edge on the right side, but we will add that step
after we have set the necessary parameters.
8. Click the ROI rectangle tool on the ROI toolbar.
9. In the dialog box that is displayed, choose ...after current step and click OK.
The ROI Rectangle step is added to the program list.
10. Add a description to the step, such as “Set ROI to the top of the label”
11. In a similar manner, add a Find column edge tool (from the Edge toolbar) to the
program and give it the description “Find left edge”.
2.4 Setting Parameter Values
The input parameters can be set in a number of different ways:
By manually entering a constant value
By using interactive setup to set constant values
By retrieving a value from the table
By using the result from a previous step
By writing an expression that may combine the methods above
In this section we will look at different ways of setting constant parameter values. Using
tables, results from previous steps and expressions will be shown in the following sections.
One important thing when specifying coordinates in images – coordinates are always
measured from the top, left corner of the image.
X coordinate
Y coordinate
©SICK AG • Advanced Industrial Sensors • www.sick.com • All rights reserved 17
Page 18

Chapter 2 Reference Manual
IVC-2D
Getting Started
2.4.1 Setting Constant Parameter Values
Both the ROI rectangle and the Find column edge tools need a number of parameters to be
set:
ROI rectangle • The rectangle that is our region of interest.
Find column edge • An image bank containing the image to scan.
• A Region of Interest (ROI), which is specified by entering the number
of the program step in which we defined the ROI that we want to use.
• The line along which the image should be scanned and the direction
to scan in. Since this tool always scans along vertical lines, the line
can be specified by entering the x coordinate for the line.
• The range of grayscale values in which we expect to find the edge
that we are searching for.
To set a constant value manually is really straight-forward – just enter the value in the Value
column for the parameter:
12. Select the Find column edge step.
13. Double-click the Value column for the parameter 06=ROI definition step, and enter the
program step in which you specified the ROI.
14. Set the scan direction by double-clicking the Value column for the parameter
03=Analysis direction, and choose Up
ÆDown from the menu.
Interactive setup windows are also used for entering constant values, but in this case
captured images are used to provide feedback for the settings. Parameters can be set
interactively in three different ways:
In the Preview window
By clicking the button with three dots (
double-clicked
By double-clicking the Setup field that is displayed at the bottom left corner of certain
program steps
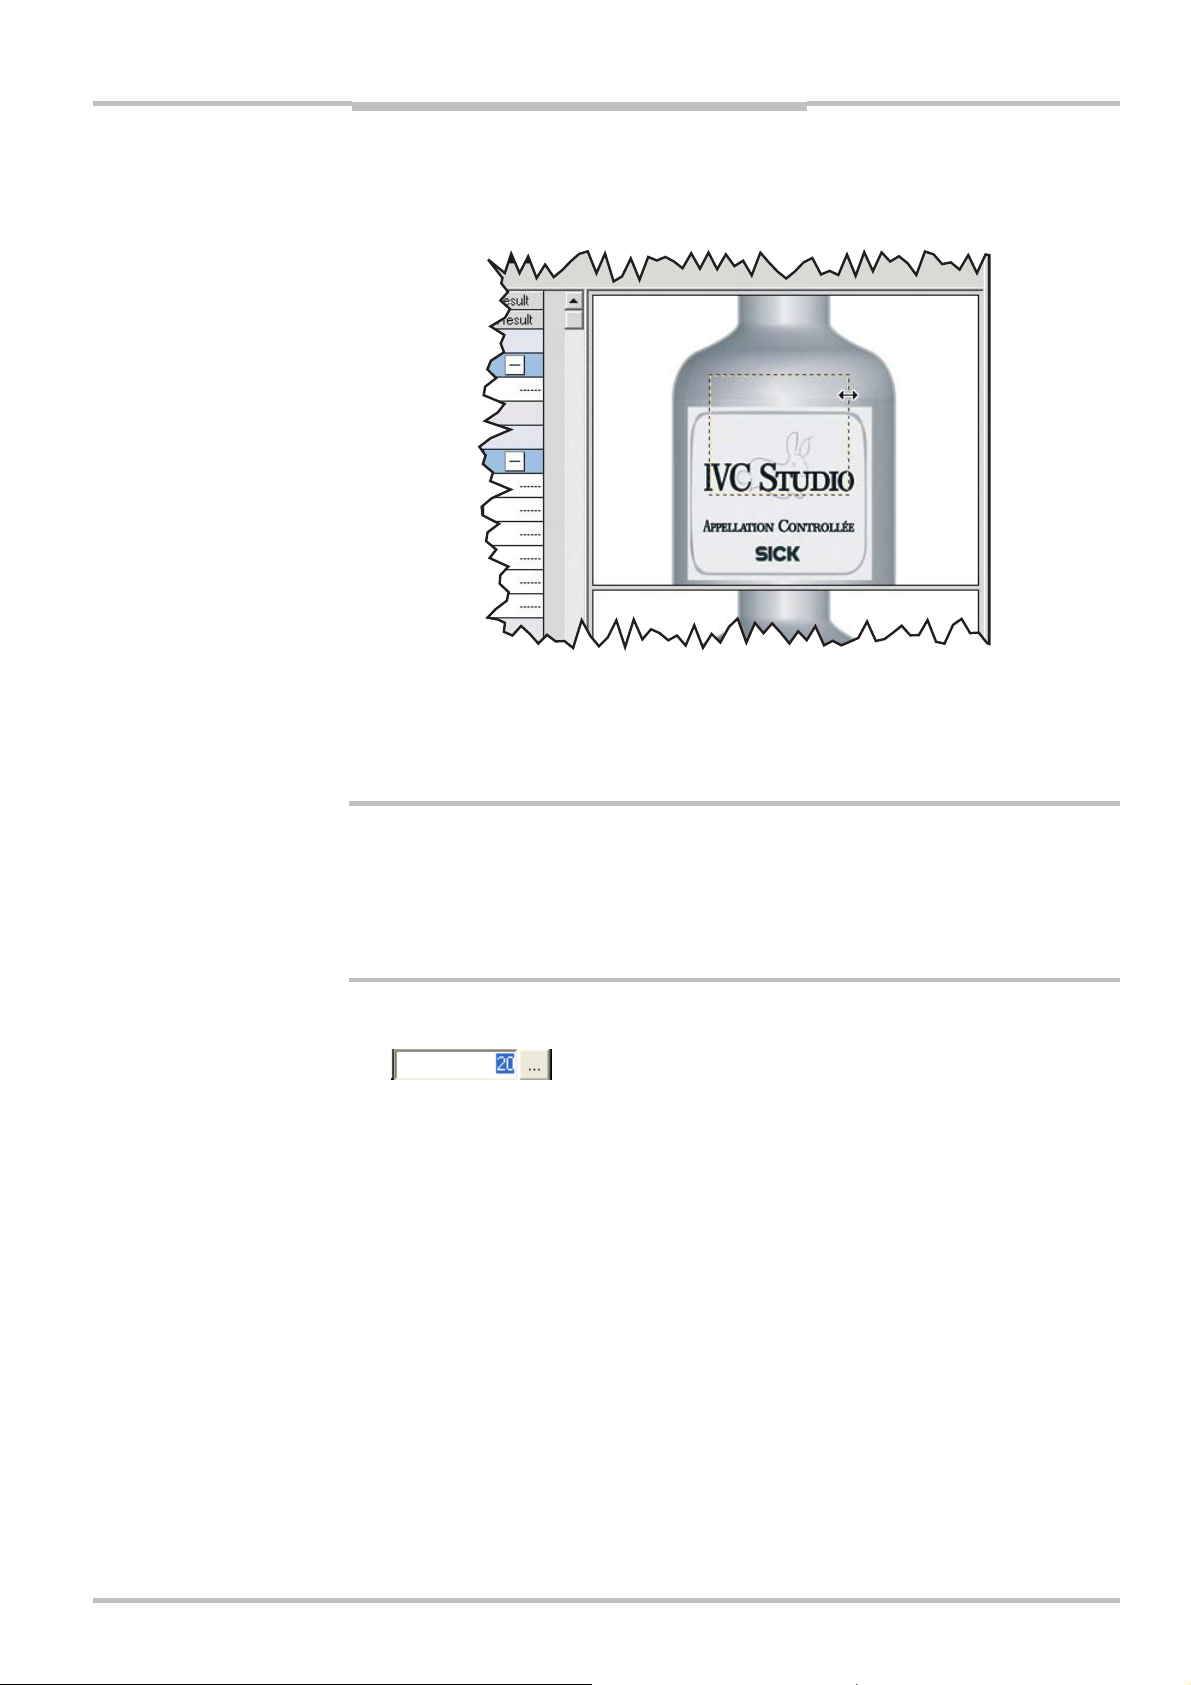
For example, when defining a ROI it is usually much easier to mark it directly in the image in
a preview window than entering coordinates for the rectangle in the Value column:
15. Select the ROI rectangle step.
A rectangle is shown in the upper preview window. This is the default ROI that is set
for a new ROI rectangle.
), that is displayed when a parameter is
18 ©SICK AG • Advanced Industrial Sensors • www.sick.com • All rights reserved
Page 19
Reference Manual Chapter 2
IVC-2D
Setting Parameter Values
16. Move and resize the rectangle in the preview, so that it marks the area where you can
see a part of the upper edge of the label.
17. Select the Find column edge step
18. Set the line to scan along by moving it in the preview window.
The line must be inside the ROI, which is also displayed in the preview window. By
default, the line is placed at the left edge of the preview window.
If you need a larger window to work in, you can double-click a preview to open it in a
separate window. In this window you can fine-tune the parameters settings, for example if
there are small details in the image.
Some parameters can be set in special interactive setup windows. These windows are
similar to the preview windows, but contain additional controls that are used for setting the
parameter values.
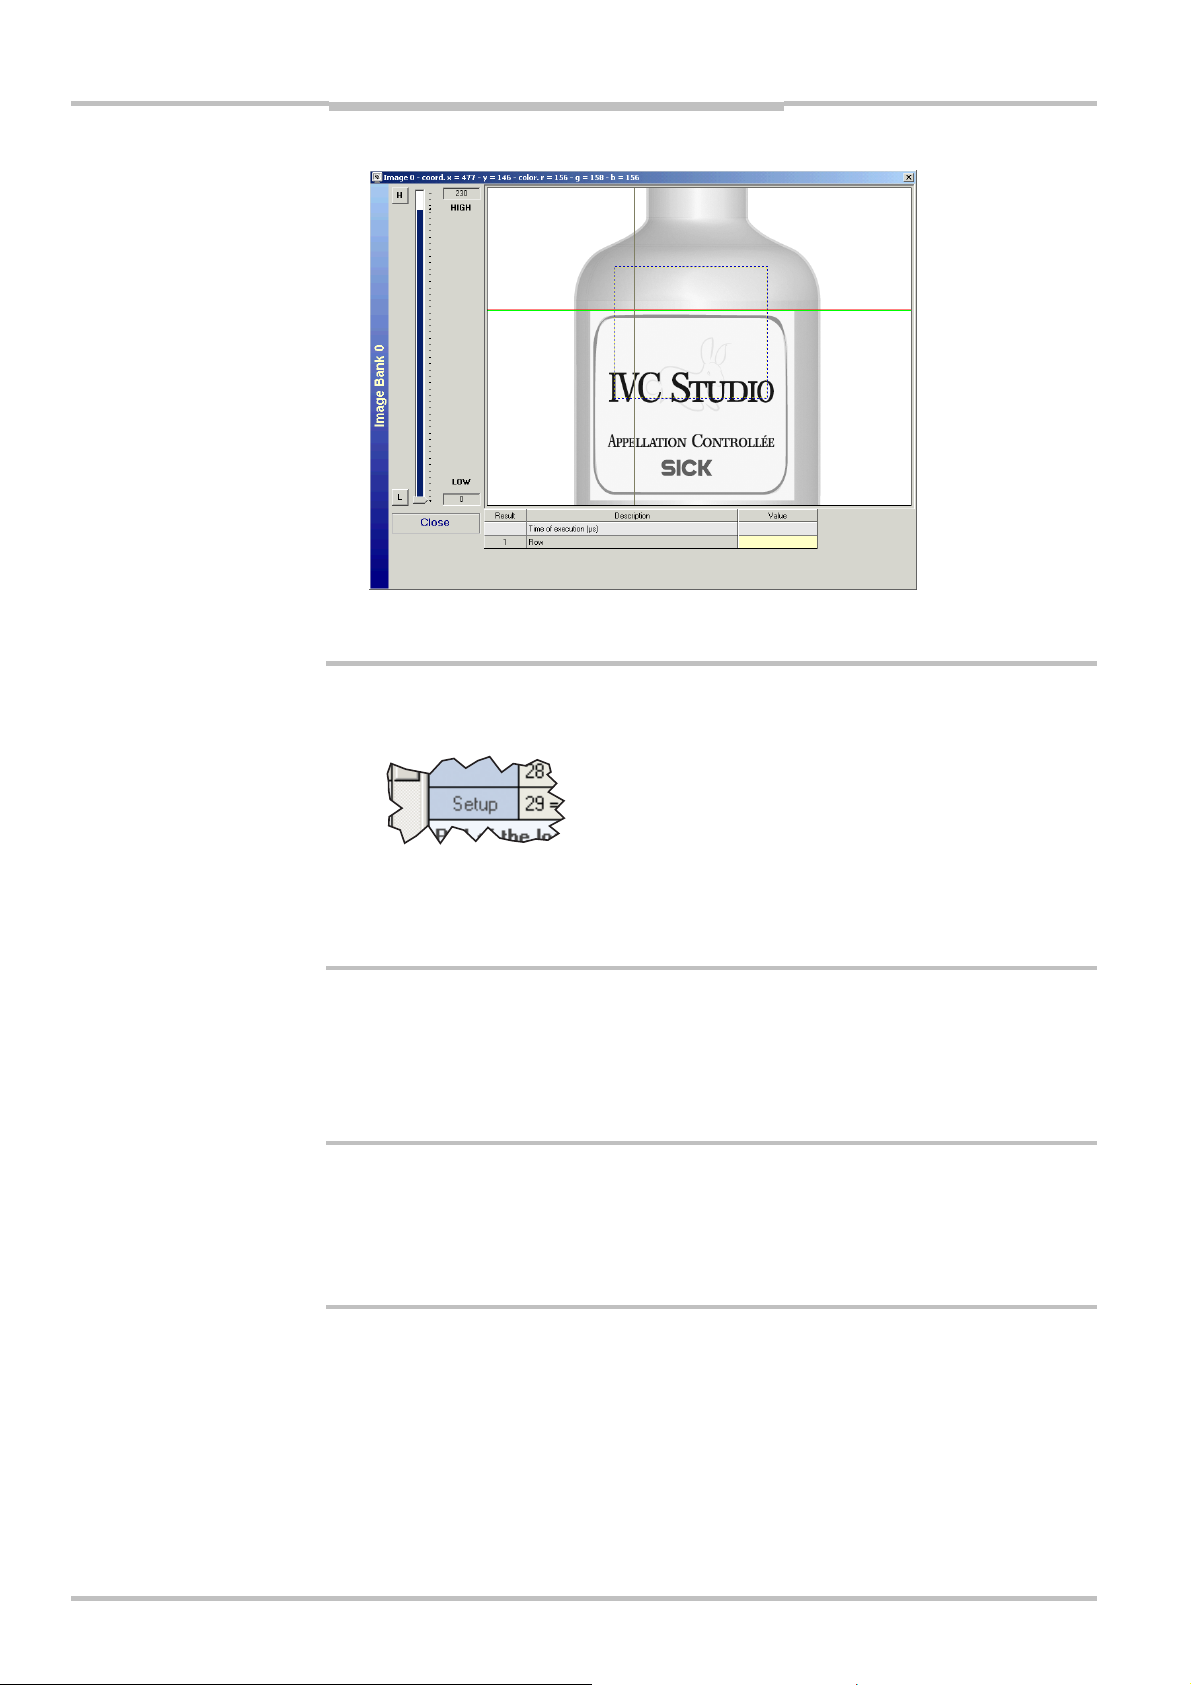
19. Double-click the Value column for the parameter 04=Gray low, and click the button with
the three dots.
A preview of the image is displayed in a separate window, which also shows the ROI,
the line along which the image is searched (yellow), and the edge that is detected
using the current parameter values (red/green).
©SICK AG • Advanced Industrial Sensors • www.sick.com • All rights reserved 19
Page 20
Chapter 2 Reference Manual
IVC-2D
Getting Started
20. Click on the H (Gray High) or L (Gray Low) button, and adjust the upper or lower gray
value with the slider, so that the edge of the label is clearly visible within the ROI.
Certain tools have interactive setup windows in which you can set all parameters. These
tools have a Setup field in the bottom left corner of the program step in the program list. To
open the setup window, double-click the Setup field.
When all parameters have been set for the Find Column Edge step, we can duplicate the
step and use the copy to find the edge on the right side – just change the line to search
along.
21. Select the Find column edge and choose Edit Æ Copy from the main menu.
22. Choose Edit
23. Set the line to scan along in the new Find column edge step by moving it in the preview
window.
24. Change the description of the program step to “Find right edge”.
2.4.2 Using Tables and Results from Other Steps
We will need the x coordinates for the lines when we calculate the angle of the top edge of
the label. Therefore it is useful to store these values in the table instead of having to set
them manually for each step in which they are used:
Æ Paste.
25. Select the “Find left edge” step, and copy the value of the parameter 02=Column.
This value is the x coordinate for the left point of the label.
26. Paste the value into an empty row in the Value on Device column in the table.
The row is now highlighted in the table, indicating that the value on the device differs
from the value in the database.
You may also enter a description for the row, describing what the value is used for.
20 ©SICK AG • Advanced Industrial Sensors • www.sick.com • All rights reserved
Page 21
Reference Manual Chapter 2
IVC-2D
Setting Parameter Values
27. In the table, right-click the value in the Value on Device column, and choose Copy
Device Value to DB to synchronize the value on the PC with the value in the device.
28. Select the “Find left edge” step again, and double-click in the Table column for the
parameter 02=Column.
29. Fill in the number of the table row in which you pasted the value of the x coordinate.
30. In a similar way, copy the value of the parameter 02=Column in the “Find right edge”
step to the table, and replace the value in the program step with a reference to the
table row.
Now we are ready to add a step that calculates the angle of the top edge of the label.
The tool we are going to add takes the x and y coordinates of two points as parameters.
We just stored the x coordinates in the table, and the y coordinates are the results (output
parameters) of the two Find Column Edge steps in the program.
31. Add a Distance and angle tool (from the Measure toolbar) to the program.
32. Set the parameters 01=Start point X and 03=End point X to refer to the table rows
where you stored the x coordinates of the left and the right point on the label edge.
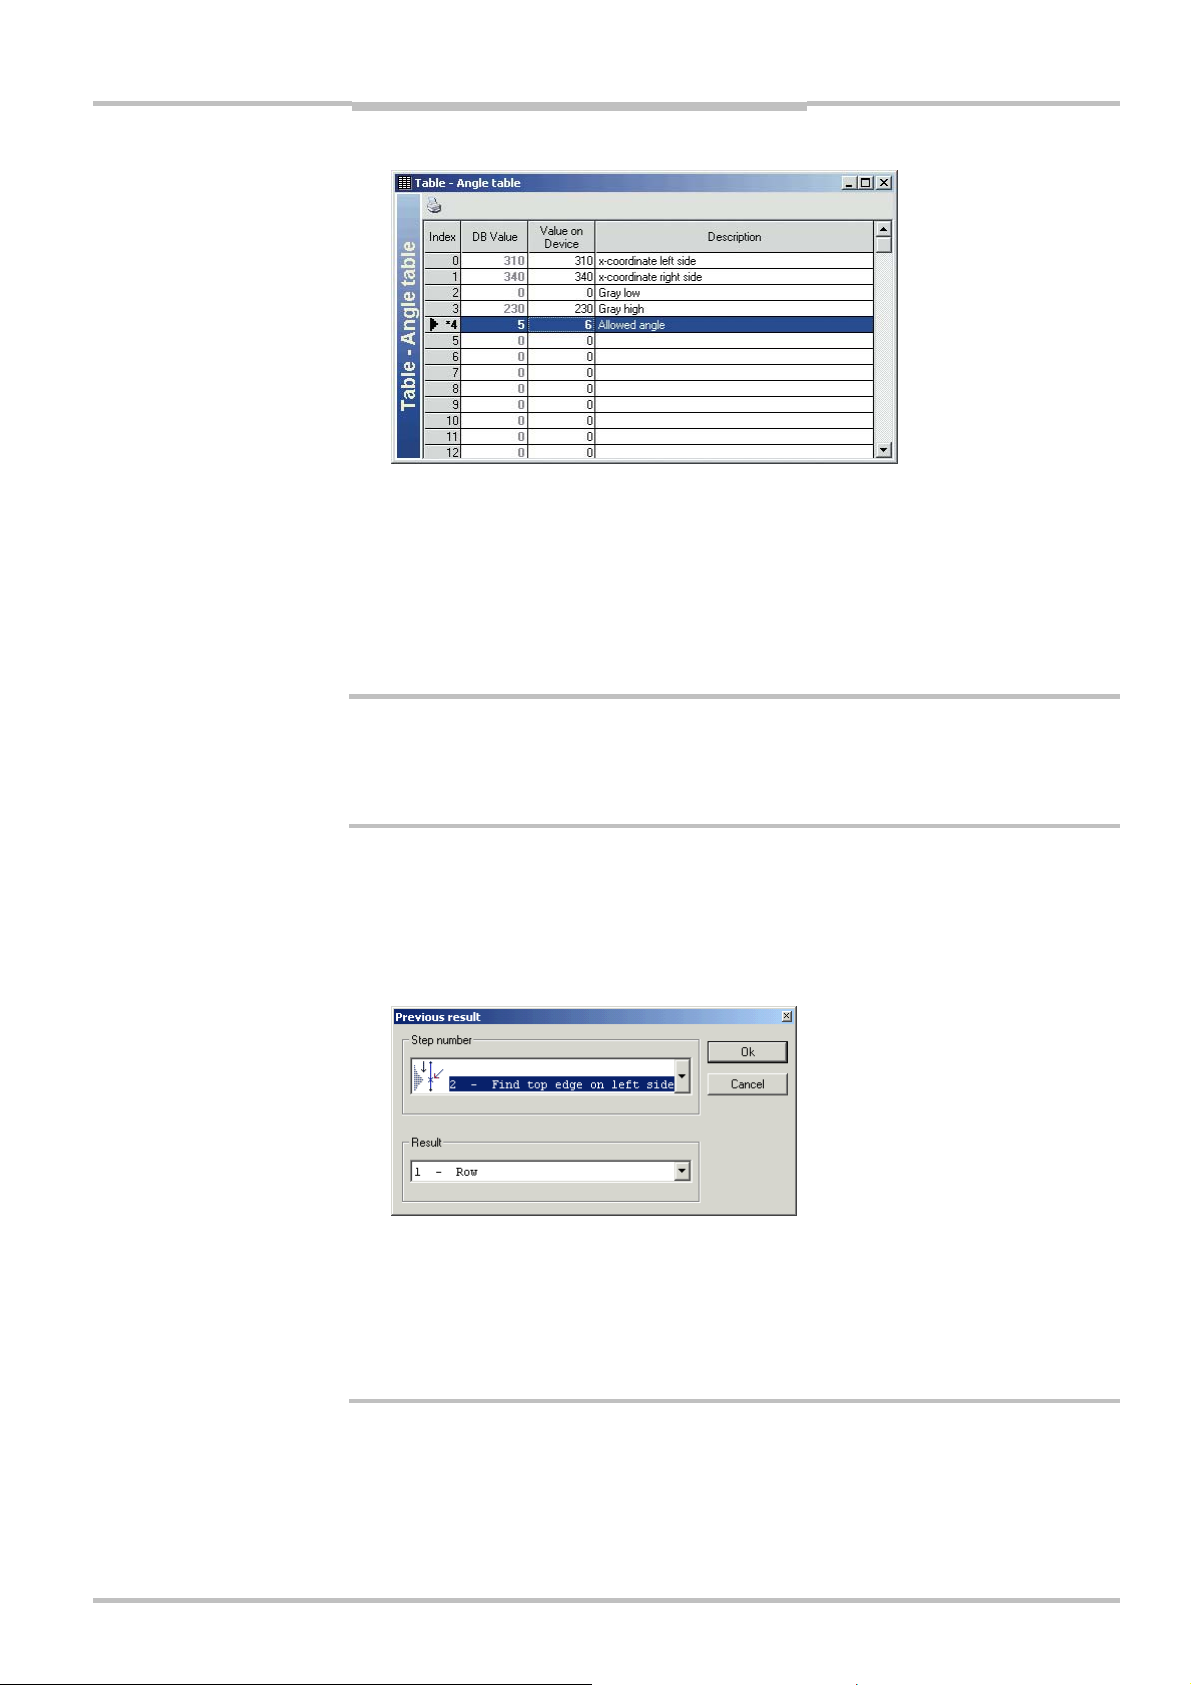
33. Double-click the Step column of the parameter 02=Start point Y.
A Previous result dialog box is displayed, in which you can select which result from
which program step number to use as parameter value.
34. Choose the step number of the first Find column edge step and then the first result
from that step (there is only one result to choose from), and click OK.
The numbers of the step and the result are entered in the Step and Result columns of
the 02=Start point Y parameter and the current value is displayed in the Value column.
35. In a similar way, set the parameter 04=End point Y to the result of the second Find
Column Edge step.
2.4.3 Using Conditions and Jumps
The angle of the label should now be tested to see whether or not it falls within the valid
range of angles, and accept or reject the bottle according to the result. This is done by
adding the following steps:
©SICK AG • Advanced Industrial Sensors • www.sick.com • All rights reserved 21
Page 22
Chapter 2 Reference Manual
IVC-2D
Getting Started
In range, which tests if a value lies within a range specified by the upper and lower limit
of the range, and returns 1 if the value is within the range or 0 if it is not within the range.
If then goto, which jumps to a specified program step if a value is not zero.
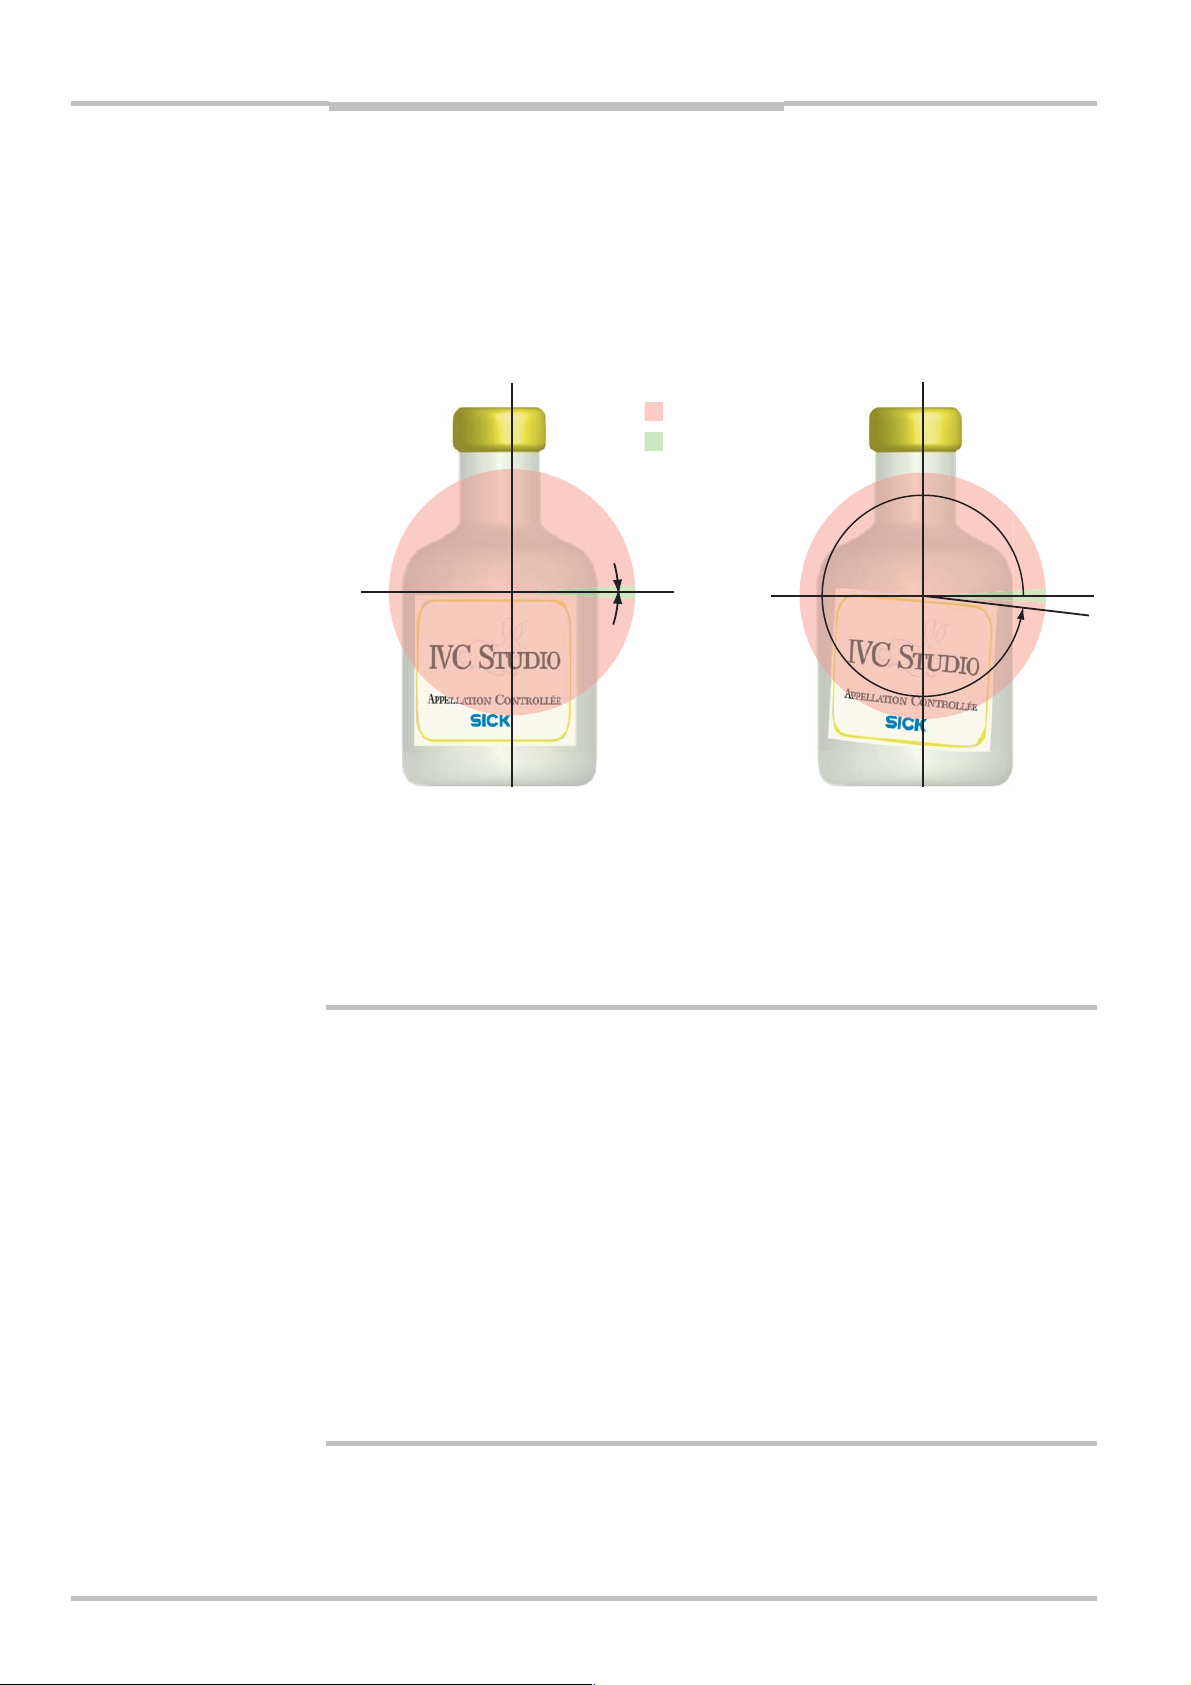
The Distance and angle tool returns an angle between 0 and 360 degrees, but we would
like to specify an angle between for example -5 to +5 degrees as being a valid angle. One
way to get around this is to state that angles between 5 and 355 degrees are not accepted, and any other angle is accepted.
90°
Angle Out of Range
Angle In Range
90°
α
0°
180°
0°
α
270°
• Angle is not OK
• The test if the angle is
within “Out of Range” returns 1, and the program
jumps
180°
270°
• Angle of the label is OK
• The test if the angle is
within “Out of Range”
returns 0, and no jump is
made
To make it even more flexible, we will store the highest angle that is accepted in the table,
and calculate the range directly in the program step.
36. Add an In range tool (from the Calculation toolbar).
37. Set the parameter 01=Value to the angle that was calculated by the previous step by
referring to the result of that step.
38. Enter the highest acceptable angle, for example 5 degrees, in a row in the table.
39. Set the parameter 02=Min value allowed to refer to the table row in which the angle is
stored.
40. Set the parameter 03=Max value allowed to the following value:
=360-V<table row>
where <table row> is replaced with the number of the row where the angle is
stored.
41. Add an If then goto tool (from the Program toolbar).
42. Set the parameter 01=Control expression to the result of the In range step.
Do not set the parameter 02=Goto step yet, since we are going to jump to a program
step that we have not added to the program.
22 ©SICK AG • Advanced Industrial Sensors • www.sick.com • All rights reserved
Page 23

Reference Manual Chapter 2
IVC-2D
Testing and Running the Program
The value of the parameter 03=Max value allowed is an expression that calculates a value
each time this step is performed. An expression always begins with an equal sign (=), and
may contain:
Constant values 360, 4/7, etc.
Table values Vn for the value in row n
Results from other steps SmRn for result n of step m
Parameters (arguments) in other steps SmAn input parameter n of step m
Functions sin(), abs(), etc.
Instead of writing an expression, we could have used a Ma the matical oper ation tool. Which
to choose depends on the complexity of the calculation – the more complex a calculation
the more efficient is the Mathematical Expression.
Finally, we add program steps that set one of the outputs of the camera to high or low,
depending on the result of the analysis. This can be used for example to control a lever
that pushes the faulty bottle to the side.
43. Add a Set output tool (from the Communication toolbar), and set the following
parameters:
01=0utput number 0
02=Signal value Low
Name the step “Angle within range”
44. Add a Goto tool (from the Program toolbar) and set the parameters so that this step
jumps to step 0.
45. Add another Set output tool, and set the following parameters:
01=0utput number 0
02= Signal value High
Name the step “Angle out of range”
46. Add a Goto tool and make sure that this step jumps to step 0.
47. Select the If then goto step, and set the parameter 02=Goto step to the step number of
the “Angle out of range” step.
It is not necessary to add the last Goto step, since the program automatically jumps to
step 0 when it comes to the end. It is however a good practice to make sure that the
program jumps to the right place at the end. For example, you may add steps at the
beginning of the program that initialize the program, and that we only intend to run when
the program starts.
2.5 Testing and Running the Program
Now the program is written, but how do we know that it is working properly?
One way is to step through the program using Debug
Step. The result of each step is shown in the preview window and the Value column of each
parameter.
48. Use Debug Æ Execute Step and Debug Æ Step by Step to step through the program and
make sure that it gives the correct result. Move the bottle (or what you are using) to
get both accepted and rejected labels.
Another way is to add some program steps that show the result of the analysis, and run
the program.
49. Add a Copy image bank tool after the first Grab step.
Æ Execute Step and Debug Æ Step by
©SICK AG • Advanced Industrial Sensors • www.sick.com • All rights reserved 23
Page 24
Chapter 2 Reference Manual
Getting Started
IVC-2D
We add this step in order to have a copy of the image to draw in. If we draw in the
original image the analysis is affected by our drawings.
50. Add a Draw ROI tool after the ROI rectangle step.
This step draws the region of interest in the image. Make sure to draw in the image
bank with the copy of the image.
51. Add a Add text tool after the “Angle within range” step. Set the following parameters:
04=String ‘OK
06=String color Choose a green color
08=Size 2
You should also specify the location of the text to be displayed with the parameters
01=X origin and 02=Y origin. Make sure to draw in the correct image bank.
52. Add a Display tool after the Add text step, and set the parameter so that it displays
image bank 1.
53. Copy the Add text and the Display steps to after the “Angle within range” step. Change
the text to be displayed to ”Failed” and coloured red.
54. Choose Debug
Æ Run and watch the result in the Display window.
2.6 Saving the Program
To save the program we have written, use File Æ Save Product. This will save the program
on the PC (along with all other programs and tables in the product), but not on the device.
The program is present on the device as well, since it is downloaded to the device as you
build it.
But if the power to the device is cut, your program will be lost from the device and has to
be downloaded again from the PC. To prevent this from happening, you may save the
program in the flash memory on the device.
IVC Studio Device
Product
Devices
Camera 1
Camera 2
Associated
Program
Associated
Table
Copied
automatically
Copy values
manually
Working
Memory
Active
Program
Active
Table
Save in
lash
F
To download a program to a device without saving it in the flash memory:
Flash
Memory
1
2
3
4
5
...
Program
Banks
1. Open the product containing the program.
2. Make sure the program is associated with the device, and that a table is associated
as well.
3. Right-click the device in the list of devices, and choose Start Program from the pop-up
menu.
The program is downloaded to the device and started. The status of the device is
changed from STOP to RUN.
24 ©SICK AG • Advanced Industrial Sensors • www.sick.com • All rights reserved
Page 25

Reference Manual Chapter 2
IVC-2D
What’s Next?
When you save the program in the flash memory on the device, you choose the program
bank in which the program is saved. You always save the program that is currently in the
working memory of the device, and the table that is active is also saved with the program.
To save the program on the flash memory of the device:
4. Right-click the device in the list of devices and choose Flash Æ Write Program in Flash.
5. Select the program bank in which to save the program, and click OK.
The program is now saved in the selected program bank.
If you save a program in program bank 0, this program will start when the device is powered up. If you want the device to run a different program, you can load that program using
a PC, either by using an existing product (containing the program to be used), or by downloading the program from the device’s flash memory.
2.7 What’s Next?
In this chapter we have looked at the basics of how to handle IVC Studio, such as setting
up a product and writing a simple program. However, there are many features in IVC Studio
and the camera that we have not looked at, and that makes it possible to write advanced
programs for inspections and automation of production. Some of the features are:
Using the camera as a stand-alone unit
Using several devices in a product
Using several programs on a single device
Using Cameras Stand-alone
Once the program is developed it can be downloaded to the device and started. Now the
program will run in the device until it is stopped, and it is no longer necessary to use IVC
Studio. If the program is also saved in program bank 0 on the flash memory, the program
will be started when the device is powered up.
If you want to interact with the device, you can write a program that for example communicates with other equipment via the RS485 port, or uses the inputs and outputs of the
device to communicate with a simple control panel.
©SICK AG • Advanced Industrial Sensors • www.sick.com • All rights reserved 25
Page 26
Chapter 2 Reference Manual
Getting Started
IVC-2D
Using Several Devices
A product may use several devices that each performs a certain inspection. It is also
possible to use the same device in several products, and running different programs in the
device depending on in which products it is used.
Device 3
Device 2
Device 1
Product: Bottle
Dev Program Table
1 Label Bottle_Label_Table
2 Bottle_FillLevel Bottle_FillLevel_Table
Device 1
Product: Jar
Dev Program Table
1 Label Jar_Label_Table
3 Jar_FillLevel Jar_FillLevel_Table
To use several devices in the product, simply select the devices by clicking the checkbox in
front of them in the main window.
When the development is finished you can easily download the programs and tables to all
included devices at once by right-clicking Devices in the left pane of the main window and
choosing Product Transmission. This will also start the programs in the devices.
Using Several Programs
While there can be only one program in the working memory, additional programs can be
stored in the flash memory of the device. These programs can either be loaded manually
into the working memory, or they can be called from the active program.
To load a program manually, use IVC Studio to associate the program with the device
and then start the program. This requires that the program is available in the product
that is open in IVC Studio.
If the program is not available on the PC, you can retrieve it from the device by right-
clicking the device in the list of devices, and choosing Flash
Æ Import Program from Flash.
To call a program stored in flash from the active program, please refer to the Tools
section of this manual for information on which tool to use.
Note that calling a program stored in flash will load both a program and a table into the
working memory of the device, replacing the previous program and table there.
26 ©SICK AG • Advanced Industrial Sensors • www.sick.com • All rights reserved
Page 27

Reference Manual Chapter 3
IVC-2D
Handling Devices
3 Using IVC Studio
3.1 Handling Devices
Note: Do not connect to, configure or view live images from a camera that is already
used through another PC. A camera can only be connected to one PC at a time.
IVC Studio will only detect an Emulator running on the same PC.
3.1.1 Installing and Configuring
Configuring Ethernet
The Ethernet configuration depends on how the device (camera) is connected to the PC.
To configure a
device
Viewing Live Image
To view a camera
image for IVC-2D
To view a camera
image for IVC-3D
Setting Number of Image Banks
Choose Options
A window containing a tree view is displayed.
Select Ethernet Devices in the tree view.
The Ethernet devices dialog is displayed in the right pane in the
window.
Click the Ethernet Device Configuration button.
The Ethernet Device Settings window is displayed, containing a list
of available devices.
Select a device from the list.
The current settings of that device are displayed in the right pane.
Double-click the IP number parameter value and change it.
Click Update.
Click Devices in the left pane.
The available cameras, devices, are listed in the right pane.
Double-click the device or right-click the device and choose Live
Device from the pop-up menu.
A live image is displayed in a pop-up window.
Clicking the handle of the drawer on the right of the image window
displays sliders for Shutter, Gain, and Strobe.
Select the program currently associated with the device, or create
a new program and associate it with the device.
Add a Grab Setup tool to the program by clicking on the Grab
Setup icon in the Image toolbar.
Double-click the Setup button at the bottom left corner of the
program step.
The Grab Setup window is displayed. A live image of the profile is
shown in side the white box in the right pane in the window.
Æ Configuration from the IVC Studio menu bar.
To change the
number of Image
Banks used by the
device
©SICK AG • Advanced Industrial Sensors • www.sick.com • All rights reserved 27
Choose Options
A window containing a tree view is displayed.
Select Ethernet Devices in the tree view.
Ethernet devices are displayed in the right pane in the window.
Click the Ethernet Device Configuration button.
The Ethernet Device Settings window is displayed containing a list
of available devices.
Select a device from the list.
The current settings of that device are displayed in the right pane.
Change the value of the parameter Image Banks.
For IVC-3D, change the value of the parameter Profile Banks.
Click Update.
Æ Configuration from the IVC Studio menu bar.
Page 28

Chapter 3 Reference Manual
Using IVC Studio
IVC-2D
Loading Device Firmware
Firmware contains information on the available tools and how they perform. You load new
firmware to upgrade IVC Studio with new tools.
To load device firmware
Choose File
Note:
Æ Load Device Firmware.
Do not interrupt the loading of firmware once it has started.
Do not disconnect the power or the network connection to
the device until the device is shown again in the list of devices in the IVC Studio main window (that is listed with the
status RUNNING or STOP)
3.1.2 Starting, Stopping, and Resetting Devices
The device can be in one of three states:
run
stop
error
Resetting the device restarts the processor in the camera. This may be necessary if the
device is stalled.
To start running a
program in a device
Right-click the device and choose Start Program from the popup menu, or press F6. The program keeps running until it is
stopped.
To view the result when using an IVC-2D, right-click the
device and choose Live Device from the pop-up menu.
To stop a program
Right-click the device and choose Stop Program from the pop-
up menu.
To reset a device
Choose Options
Æ Configuration from the IVC Studio menu
bar.
A pop-up window containing a tree view appears.
Select Ethernet Devices in the tree view.
Ethernet devices appear in the right panel of the pop-up
window.
Click the Ethernet Device Configuration button.
The Ethernet Device Settings window appears containing
available devices.
Right-click the device and choose Reset Device from the pop-
up menu.
3.1.3 Handling Memory in Camera
Saving camera memory is useful for backup purposes. The camera contains image banks,
a data block memory and a Flash memory. For more information on the Flash memory see
section Handling Programs on the Camera.
Image banks and data block memory are used for storage during program execution.
When starting to develop a new program, it may be useful to refresh the memory in order
to make sure that no old data affects the new program. The contents of the image banks
can also be saved to disk.
To save the data block
memory from the
Right-click the device and choose Device Management
Save Data Block to File from the pop-up menu.
Æ
camera to a PC file
To save an image bank
to disk
Right-click image bank in the active program window and
choose Save Image Bank to Disk from the pop-up menu. See
section Handling Images for more information on handling
image banks.
28 ©SICK AG • Advanced Industrial Sensors • www.sick.com • All rights reserved
Page 29

Reference Manual Chapter 3
Handling Devices
IVC-2D
To reset data block
memory
To reset image banks
Right-click the device and choose Device Management
Data Block from the pop-up menu.
Right-click the device and choose Device Management
Æ Reset
Æ
Reset Banks from the pop-up menu. It is also possible to
reset the image banks one by one when a program is open.
See chapter Handling Images for more information.
To restore data block
memory from a PC file
Right-click the device and choose Device Management
Load Data Block from File from the pop-up menu.
Æ
3.1.4 Viewing Device Information
Information is available on the status of devices and errors that have occurred. The information can be refreshed on one or all devices.
To view device information
Right-click the device and choose Device management
Information from the pop-up menu.
Æ Device
This window contains detailed information about the device,
such as hardware and software versions, Ethernet information
and the status of the device.
To view the status of
running program,
inputs and outputs
Right-click the device and choose Device management
Status from the pop-up menu.
This window shows the status of inputs and outputs of the
Æ Signal
device. If a program is running you can also see which program
steps that are performed at the moment
To refresh displayed
information on a
checked device
To refresh and display information on
all devices
Choose Options
press F5.
Choose Options
press Ctrl F5.
Æ Refresh from the IVC Studio menu bar or
Æ Update All from the IVC Studio menu bar or
©SICK AG • Advanced Industrial Sensors • www.sick.com • All rights reserved 29
Page 30
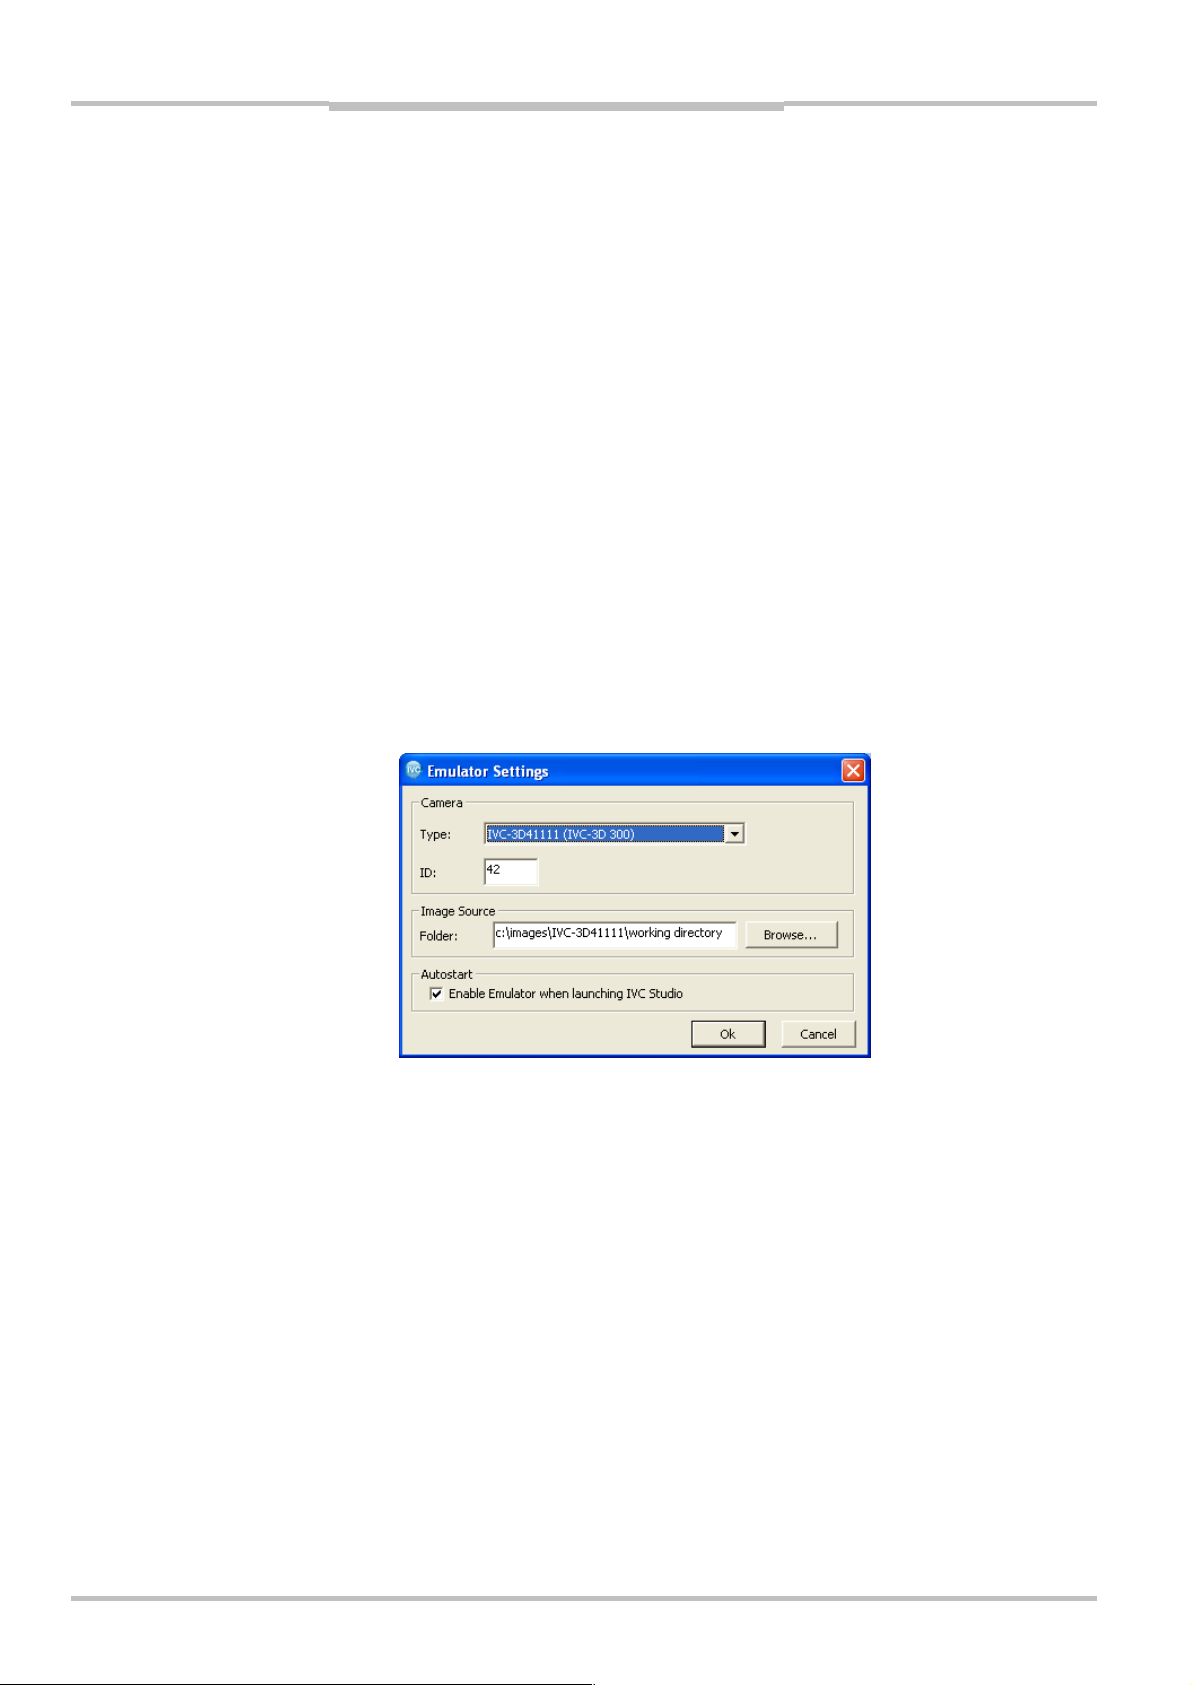
Chapter 3 Reference Manual
IVC-2D
Using IVC Studio
3.2 Handling the Emulator
The Emulator is a software program in IVC Studio that behaves like a hardware camera. It
makes it possible to write or update programs when there is no hardware camera available. The Emulator can behave as (emulate) both 2D and 3D cameras. Each product in
IVC Studio can contain several devices, but only one emulated camera.
The main difference between the Emulator and a camera is that the former uses a predefined set of images stored in a dedicated image folder on the PC, whereas the latter views
live images. Not all tools are emulated by the Emulator; these tools are marked with [Not
emulated] in the user interface. Interactive setups are not available for non-emulated tools.
The Grab tool functions differently when the Emulator is used. This is described in section
Using the Grab and the Grab Setup Tools below.
The execution time of a tool when using the emulator depends on the performance of the
PC. This time is not the same as the execution time when the tool is executed on a hardware camera. This means that the field “Time of execution (us)” in the step program view
cannot be used in a calculation of the expected cycle time for the application when the
emulator is used.
From the Emulator menu in the menu bar you can enable and disable the Emulator, and
change its settings. In the Emulator settings dialog you can choose which camera type to
emulate, select which folder to capture pre-recorded images from, and choose to enable
the Emulator automatically when starting IVC Studio.
3.2.1 Preparing images for the Emulator
Instead of viewing live images, the Emulator captures pre-recorded images. Before starting
the Emulator it is thus necessary to prepare images. This is done by recording images that
are captured by a real camera. The images must be saved in the raw format (.raw or .img)
for IVC-3D and IVC-2D, or bitmap (.bmp) for IVC-2D, in a version of IVC Studio that supports the Emulator. When saving an image, the Grab Setup parameters are stored in the
image file and can be read by the Emulator.
To record images
To use recorded
images in the
30 ©SICK AG • Advanced Industrial Sensors • www.sick.com • All rights reserved
Use a camera of the same type that you will emulate.
Select or write a program containing a Grab Setup tool defining
how to captures images, a Grab tool to capture the images, and a
Send to FTP tool to store the images in raw format in a selected
folder. The PC receiving the images must have an FTP server
running.
Choose Emulator
The Emulator settings dialog box is opened.
Æ Settings… from the IVC Studio menu bar.
Page 31

Reference Manual Chapter 3
Handling the Emulator
IVC-2D
Emulator
3.2.2 Basics
To enable the
Emulator
To disable the
Emulator
To enable the
Emulator automatically
Click Browse… and select a folder containing recorded images.
The Emulator camera type must be of the same type that was
used when recording the images.
Click OK.
Choose Emulator
Æ Enable… from the IVC Studio menu bar.
The Emulator settings dialog box is opened.
Select which camera type to emulate from the drop-down list.
Enter a numeric camera ID. The ID must be unique within the
Product. Maximum length is 9 digits.
Click Browse… and select a folder containing pre-recorded
images. The Emulator camera type must be of the same type
that was used when recording the images.
Click OK.
Choose Emulator
Æ Disable from the IVC Studio menu bar.
The Emulator disappears from the list of Devices.
Choose Emulator
Æ Settings… from the IVC Studio menu bar.
The Emulator settings dialog box is opened.
Tick Enable Emulator when launching IVC Studio and click OK.
The Emulator is now automatically enabled when starting IVC
Studio.
To change the
Emulator settings
Choose Emulator
Æ Settings… from the IVC Studio menu bar.
If Type, ID, Number of image banks or Number of profile banks
is changed, the Emulator will be restarted.
To access the flash
disk of the Emulator
The flash disk of the Emulator is found on the PC under My
Documents (Documents in Vista) for the current user. The default
path to the Emulator flash is:
My Documents\SICKIVP\SmartCameras\IVC Studio x.x\ Emulator\flash
3.2.3 Using the Grab and the Grab Setup Tools
Each time the Grab tool is executed a new image is read from the image source. The
name of this image file is displayed as a result parameter of the Grab step, and the Grab
Setup parameters saved in the image file are used to update the image banks.
The program thus works as if a Grab Setup step with these settings were executed.
3.2.4 Using Old Images in an Emulated 3D Camera
It is possible to use images that are captured with a version of IVC Studio that does not
support the Emulator. The Grab Setup tool then needs to be executed with the same
settings as were used when capturing the images, since the images do not contain any
setup information.
To use old images
in an emulated 3D
camera
Choose Emulator
select the desired image source folder, and click OK.
Configure a Grab Setup step with the same settings that were
Æ Settings… from the IVC Studio menu bar,
used when the images were captured.
©SICK AG • Advanced Industrial Sensors • www.sick.com • All rights reserved 31
Page 32

Chapter 3 Reference Manual
IVC-2D
Using IVC Studio
Execute the Grab Setup step.
Execute the Grab step.
3.2.5 Using a Non-Emulated Tool in the Emulator
Some tools are not emulated by the Emulator. When executed in the Emulator, they return
the default values of all parameters. Interactive setups are not available for non-emulated
tools.
32 ©SICK AG • Advanced Industrial Sensors • www.sick.com • All rights reserved
Page 33

Reference Manual Chapter 3
Handling Products
IVC-2D
3.3 Handling Products
A product in IVC Studio is a collection of devices, programs and tables. A device can be
either a hardware camera or an Emulator.
Product
Devices
Camera1
Programs Tables
3.3.1 Basics
To create a new
product
To open a product
To save a product
Camera2 Emulator
<<
uses
>>
Label LabelTable
FillLevel FillTable
Choose File
Æ New Product from the IVC Studio menu bar.
An empty product named New Product is opened.
Choose File
Æ Open Product… from the IVC Studio menu bar.
Select a product in the dialog box and click OK.
Choose File
Æ Save Product from the IVC Studio menu bar.
If you try to open another product or to close IVC Studio without
saving the presently active product a dialog box appears prompting you to do so.
If the product has not yet been saved, a dialog box is displayed.
Type the name of the product and click OK.
To make a copy of
the current product
To revert to the last
Choose File
Type the name of the new product and click OK.
Choose File
Æ Save Product As… from the IVC Studio menu bar.
Æ Revert… from the IVC Studio menu bar.
saved version of
the current product
The product files can be stored in two formats; the standard .prd and a new extended
format (.prc) that also contains a checksum. The checksum is used to verify the integrity of
the product file to ensure that the contents have not been altered, e.g. by a problem in a
zip/unzip-procedure.
The new format is not compatible with IVC Studio versions prior to 3.1 SR1. The old format
is still supported, and existing files can easily be converted to the new format by using
“Save As” in IVC Studio 3.1 SR1 or higher.
©SICK AG • Advanced Industrial Sensors • www.sick.com • All rights reserved 33
Page 34

Chapter 3 Reference Manual
IVC-2D
Using IVC Studio
3.3.2 Managing Devices Used in a Product
You should always check the devices you are using in order to decrease the execution
time. IVC Studio continuously updates the information about the status of all devices in the
device list, but if you check the devices you currently use, the list is only updated with
information about these, which saves time.
To check/uncheck a
device
To uncheck all
devices
3.3.3 Associating Programs and Tables with a Device
Both a program and a table have to be associated with the device in order for the program
to be able to run.
To associate a
program to a device
To associate a table
To import a program
from another product
3.3.4 Handling Products
To start all devices
in a product
To stop all devices
in a product
Select Devices in the left pane and click on the checkbox in
front of the device.
Select Devices in the left pane. Right-click a device in the right
pane and choose Uncheck All Devices from the pop-up menu.
Right-click the device and choose Select Program from the popup menu. Select a program from the pop-up dialog and click OK
to associate it with the device.
Right-click the device and choose Select Table from the pop-up
menu. Select a table from the pop-up dialog and click OK.
Right-click Programs in the tree view and choose Import Program
from the pop-up menu.
Right-click Devices in the left pane and choose Product Trans-
mission from the pop-up menu.
Right-click Devices in the left pane and choose Stop Product
from the pop-up menu.
34 ©SICK AG • Advanced Industrial Sensors • www.sick.com • All rights reserved
Page 35

Reference Manual Chapter 3
Handling Programs
IVC-2D
3.4 Handling Programs
Programs are developed on a PC. During development a copy of the program is maintained in the device. Programs are always run in the camera, even during development. A
camera can contain several programs, but after a shutdown it always runs the one in
program bank zero in the Flash memory.
If you don’t want to start from scratch when building a program, you may instead import a
program used in another product or retrieve a program that is stored in a device. To import
a program from another product, the program must first be exported to a file on the computer.
IVC Studio Device
Product
Devices
Copied
automatically
Working
Memory
Flash
Memory
Camera 1
Camera 2
Associated
Program
Associated
Table
3.4.1 Handling Programs on PC
Basics
To create a new
program
To delete a program
Right-click Programs in the tree view and choose New Program
from the pop-up menu.
Right-click the program in the tree view and choose Delete
Program from the pop-up menu.
To rename a program
Right-click the program in the tree view and choose Rename
Program from the pop-up menu. Write the new name in the
dialog box that is displayed.
To print a program
Right-click the program in the tree view and choose Print
Program from the pop-up menu.
To view program
information
Right-click program in the tree view and choose Program
Information from the pop-up menu.
A pop up window displays information such as program name
and dates of creation and last change and who made the
latest changes to the program.
Copy values
manually
Active
Program
Active
Table
Save in
lash
F
1
2
3
4
5
...
Program
Banks
©SICK AG • Advanced Industrial Sensors • www.sick.com • All rights reserved 35
Page 36

Chapter 3 Reference Manual
Using IVC Studio
IVC-2D
Copying, Importing, and Exporting Programs
To make a copy of a
program
Right-click the program in the tree view and choose Copy
Program from the pop-up menu. Click YES to confirm and
name the new program.
To import a program
from a file on the PC
Right-click Programs or one of the programs in the tree view in
the left pane and choose Import Program from the pop-up
menu.
To export a program to
a file on the PC
Right-click the program in the tree view and choose Export
Program from the pop-up menu.
3.4.2 Handling Programs on the Camera Flash
To write product in
flash
Right-click Devices in the left pane and choose Write Product in
Flash from the pop-up menu. The currently associated pro-
duct and table is stored on the camera flash in position 0 for
each of the devices in the Device list. No action is performed
if the device is not associated with a program in the current
product.
To store a program in
flash memory on the
device
Right-click the device and choose Device Management
Æ Write Program in Flash from the pop-up menu. Select a
memory position in the dialog window and click Save. The
table is automatically stored with the program.
To delete programs
stored in flash
Right-click the device and choose Device Management
Æ Delete Stored Program in Flash from the pop-up menu. This
deletes the program in the selected position in the flash
memory. It is also possible to delete multiple programs by
selecting more than one position.
Æ Flash
Æ Flash
To clear unused
memory on flash
When a program is deleted from flash, the flash blocks
occupied by the program is not immediately reused but
marked as unused (dead). The unused memory will not be
reused until there is no more free memory on the device. This
is done in order to minimize the wear of the flash memory.
To reuse a block of unused memory, it must first be cleared.
Clearing the memory takes some time and may affect the
performance of the device. To restore the performance, the
unused memory can be cleared manually.
To clear unused memory, right-click the device and choose
Device Management
Æ Flash Æ Clear unused memory from the
pop-up menu. In the dialog box that is displayed, click Start
and wait for the device to be finished.
To import programs
from flash program
bank to PC
Right-click the device and choose Device Management
Æ Import Program From Flash from the pop-up menu. Select a
program in the pop-up dialog window and click Save. The
Æ Flash
associated table is automatically imported with the program.
3.4.3 Handling the Camera Flash
The flash disk of the IVC camera can be used to store programs, images, data blocks and
tables. The disk is also used by the web server to store HTML files. The FTP server on the
camera allows for external access to the contents of the flash disk.
For details regarding the handling of the flash disk, please refer to in the section
Troubleshooting.
36 ©SICK AG • Advanced Industrial Sensors • www.sick.com • All rights reserved
Page 37

Reference Manual Chapter 3
IVC-2D
Handling Tables
3.5 Handling Tables
Tables are used to store parameters and other values that a program uses.
The index column shows a row number in the table.
The DB Value column shows the value that is currently stored on the PC.
The Value on Device column shows the current value stored on the device.
In the description column you can add descriptive names for the values in the table.
The values on the PC and the device are not automatically synchronized. Therefore the
values have to be copied manually between the two.
3.5.1 Basics
To create a new table
To show the contents of
a table
To rename a table
To delete a table
3.5.2 Copying, Importing, and Exporting Tables
To make a copy of a
table
To import a table
from a file on the PC
To export a table to a
file on the PC
To store a table in the flash memory on a device, store the program associated with the
table. To import a table from a device, import the associated program. When writing a table
to the flash memory on a device, the descriptions are not saved, and are therefore not
included when the table is imported from the device.
Right-click Tables in the tree view in the left pane and choose
New Table from the pop-up menu.
Right-click the table in the tree view and choose Show Table from
the pop-up menu.
Right-click the table in the tree view and choose Re name Table
from the pop-up menu.
Right-click the table in the tree view and choose Delete Table
from the pop-up menu.
Right-click the table in the tree view and choose C opy Tab le
from the pop-up menu. Click YES to confirm and name the new
table.
Right-click Tables or a table in the tree view and choose Import
Table from the pop-up menu.
Right-click the table in the tree view and choose Export Table
from the pop-up menu.
©SICK AG • Advanced Industrial Sensors • www.sick.com • All rights reserved 37
Page 38

Chapter 3 Reference Manual
IVC-2D
Using IVC Studio
3.5.3 Handling Table Values
To enter a parameter
value in the table
To copy a parameter
value from the PC to
the device
To set parameter
comment in the table
To save the table in
the flash memory
Right-click the table in the tree view in the left pane and choose
Show table, or double-click the table in the tree view. A separate
table window opens. Double-click the cell in the Value on Device
column and enter a value. Close the table window and click
YES to save the entered values.
Right-click the device and choose Show Table from the pop-up
menu. Right-click the row in the DB Value column and choose
Copy DB Value to the Device from the pop-up menu.
Right-click the table in the tree view in the left pane and choose
Show table, or double-click the table in the tree view. A separate
table window opens. Double-click the cell in the Description
column and enter a comment. Close the table window and click
YES to save the entered values.
Right-click the device and choose Device Management
Write Program in Flash from the pop-up menu. Select a memory
position in the pop-up dialog window and click Save. The table
is automatically stored with the program.
Æ Flash Æ
3.6 Handling Images
Images are saved in image banks during program execution. The image banks (and their
current contents) are displayed in the active program window at the top of the right pane.
Images that are saved to disk on the PC can be loaded back into an image bank. You can
also save some images to disk in another file format by choosing Export…, but such files
cannot be loaded to the device.
Note that when loading an image to an IVC-3D camera, the camera must have the same
settings for field-of-view (FOV) and length as when the image was saved.
To change size of the
image bank thumbnails or previews
To save an image
bank to disk
To load an image
bank from disk
To save an image
bank in a different
format (IVC-3D only)
To reset all banks
To reset a selected
bank
Place the cursor on border that surrounds the area where the
bank thumbnails or previews. The cursor will change to two
arrows.
Then click on the border and drag it to resize the thumbnails or
previews.
Right-click the image bank in the active program window and
choose Save Image Bank to Disk from the pop-up menu.
Right-click the image bank in the active program window and
choose Load Image Bank from Disk from the pop-up menu.
Right-click the image bank in the active program window and
choose Export Bitmap to disk or Export Raw to Disk from the pop-
up menu.
Right-click an image bank in the active program window and
choose Reset All Banks from the pop-up menu.
Right-click the image bank in the active program window and
choose Reset Bank from the pop-up menu.
38 ©SICK AG • Advanced Industrial Sensors • www.sick.com • All rights reserved
Page 39

Reference Manual Chapter 3
IVC-2D
Programming
3.7 IVC Studio Settings
If you are using IVC Studio as an administrator, you can specify whether or not users must
log in when starting IVC Studio. By default users do not have to log in.
User names and passwords can be found in the installation instruction.
To enable or disable
login when starting IVC
Studio
Choose Options
bar.
A pop-up window containing a tree view appears.
Select User Access in the tree view.
The User Access settings appear in the right panel of the
pop-up window.
Select the option to let the users to log in when starting IVC
Studio.
Deselect the option to let users use IVC Studio without
logging in.
Æ Configuration from the IVC Studio menu
3.8 Programming
3.8.1 Adding Program Steps
When a program is selected in the left pane, a toolbar is added to the window. This toolbar
contains the tools that are available when writing programs. The tools are organized in a
logical order that groups similar tools together. Switch between the groups by clicking on
the tabs at the bottom of the toolbar.
To add program steps
To cut or copy steps
To paste steps
To delete a program step
To add a program step click the icon for the tool.
Click the program step in either the right pane or in
the program list in the left pane and choose
ÆCut or EditÆCopy.
Edit
Note that cut does not remove the step from the
program list until it is pasted in its new location.
To select multiple program steps press the Ctrl key
as you select steps.
Click the program step in either the right pane or in
the program list in the left pane and choose
ÆPaste.
Edit
Click the program step in either the right pane or in
the program list in the right pane and choose Delete
Step from the pop-up menu.
©SICK AG • Advanced Industrial Sensors • www.sick.com • All rights reserved 39
Page 40

Chapter 3 Reference Manual
IVC-2D
Using IVC Studio
To increase/decrease tabulation
3.8.2 Setting Parameters
The input parameters can be set in a number of different ways:
By manually entering a fixed value
By retrieving a value from the table
By using the result from a previous step
By writing an expression that may combine the methods above
To enter parameter
value in a program
step
To enter a string as a
parameter value
To use parameter
values from the table
Select program step and double-click in the Value column of
the parameter. Enter the value and click anywhere outside the
changed cell.
Strings must begin with a single quotation mark.
Example: ‘String
Select the Table column in the program step. Enter the index
number of the desired value and click anywhere outside the
changed cell. The table value appears in the value column of
the program step.
Tabulation is only used to add readability to the
program. It has no effect on the performance or
execution of the program. To increase tabulation for
a program step right-click it and choose Increase
Tabulation from the pop-up menu. To decrease
tabulation for a program step right-click it and choo-
se Decrease Tabulation from the pop-up menu.
To use results from
previous program
steps
To use parameter
expressions
Using Interactive Set-up
Interactive set-up is a possibility to graphically change parameter values of tools.
Interactive setup may be done in three different ways.
In the u
Some parameter fields, for example the fields for setting threshold values in the Find
column edge tool, have a button with three dots following the space to fill in a value.
Some tools, for example Find line edge, have a setup button.
pper preview window
Select the Step column in the program step. Double-click and
choose the number of the previous step and the result you
want to use and click OK.
Type the expression in the Value column of the program step.
An expression always begins with = directly followed by the
expression. Use the following prefixes:
Vn – for table Value in position n.
SnRn – for output Result n from a previous Step.
SnAn – for input Argument from a previous Step.
Example: =V2+S3A2*S3R1 This means that the value of position
2 in the table is added to input parameter 2 in step 3, multiplied with the first output from step 3.
It is also possible to use mathematical functions such as sin
and cos. See Appendix A for more information.
It is usually slower to use expressions than using values directly
from the table.
40 ©SICK AG • Advanced Industrial Sensors • www.sick.com • All rights reserved
Page 41

Reference Manual Chapter 3
IVC-2D
Programming
Upper preview window
Can be used for most geometrical settings.
Preview
The dotted button
Setup button
Select a program step containing a
geometrical setting and execute it. The
top image in the pane to the far right in
the window now contains a figure representing the setting. It is possible to move
the circle and change the size of it directly in the preview window.
For fine-tuning, double-click the image to
display it in a separate window. Note how
the values in the parameter field in the
program step are updated as you change
the settings.
The size of the preview can be changed
by clicking and dragging the borders
around the previews..
Click the dotted button to open a window
enabling interactive setup.
Double-click the Setup button to open a
window enabling interactive setup.
3.8.3 Using Macros
Macros are used for operations that are performed frequently and are used by more than
one program. It makes programs more readable.
Macros are available from the Macros tab in the tab bar. As they are created the macros
are listed as available tools on the toolbar. Default name is Macro TOOL. Use the tool tip to
distinguish between the macros.
Note: The execution time of a macro includes the time it takes to run the two tools Start
Macro and End Macro. This means that the total execution time of the macro is slightly
larger than the sum of the steps in the macro. This difference is more apparent when
executing the macro in IVC Studio as then also the communication with the camera is
included in the execution time of the macro.
To create a new
macro
To delete a macro
To make a copy of a
macro
Right-click Macro in the tree view and choose New Macro from
the pop-up menu.
Right-click the macro and choose Delete Macro from the pop-up
menu.
Right-click the macro and choose Copy Macro from the pop-up
menu. Click YES to confirm and name the new macro.
To import a macro
To export a macro
To print a macro
©SICK AG • Advanced Industrial Sensors • www.sick.com • All rights reserved 41
Right-click Macro or a macro in the tree view and choose
Import Macro from the pop-up menu.
Right-click the macro in the tree view and choose Export Macro
from the pop-up menu.
Right-click the macro in the tree view and choose Print Macro
Page 42

Chapter 3 Reference Manual
IVC-2D
Using IVC Studio
from the pop-up menu.
To show information
on a macro
Right-click the macro in the tree view and choose Macro Information from the pop-up menu.
A pop up window displays information such as program name
and dates of creation and latest change and who made the
latest changes to the macro.
42 ©SICK AG • Advanced Industrial Sensors • www.sick.com • All rights reserved
Page 43

Reference Manual Chapter 3
IVC-2D
Programming
3.8.4 Changing Macro Properties
To change name and
description of a macro
To change a macro
icon
Right-click the macro in the tree view and choose Macro
Properties from the pop-up menu. This opens the Macro
Properties window. Enter macro name and a description in
the Name and Description fields and click OK.
You need an icon with file extension .ico consisting of two
images. One 16 x 16 pixels and one 32 x 32 pixels. The
smaller is used in the IVC Studio tree view, and the larger in
the IVC Studio toolbar.
Right-click the macro in the tree view and choose Macro
Properties from the pop-up menu. Enter the path to the icon
image in the Icon field, or use the browse button, and click OK.
To specify arguments
and results
Right-click the macro in the tree view and choose Macro
Properties from the pop-up menu. Select one of the tabs
Arguments or Results. Add arguments and results by using the
+! button.
©SICK AG • Advanced Industrial Sensors • www.sick.com • All rights reserved 43
Page 44

Chapter 3 Reference Manual
Using IVC Studio
IVC-2D
3.8.5 Running and Debugging Programs
You can run and test the program in two different ways:
Run the entire program over and over, and view results in the Run window.
Step through the program or run parts of it, and view the results directly in the Pro-
gramming window when the program is paused.
You can set breakpoints on program steps where you want the execution to pause, and
also disable program steps that you don’t want to be executed. Breakpoints are ignored
when running the entire program, - for example when the device is running stand-alone –
but disabled program steps will never be executed by the device – even if the device is
running without IVC Studio.
When running the entire program, use a ‘Display‘ tool in the program to display parameter
values and the contents of an image bank in the Run window. The information in the Run
window will be updated each time the ‘Display‘ tool is executed. For more information on
the ‘Display’ tool, see the Tools chapter.
To run the entire
program from the
Programming window
Choose Debug
The Run window is displayed, and the program will run over and
over until it is stopped. Any breakpoints in the program are
Æ Run or press F6.
ignored.
To execute a single
program step
Select a step and choose Debug
If Run debug or Run to cursor is chosen after executing a single
Æ Execute Step or press F5.
step, the program will continue with the selected step.
To execute a program
step by step
Select a step and choose Debug
Æ Step by Step or press F8. The
selected step is executed and IVC Studio selects the next step
as active.
If Run debug or Run to cursor is chosen after executing a step,
the program will continue with the selected step.
To continue the program up to a selected
step
To continue the pro-
Select the step to stop at and choose Debug
When choosing Run to Cursor, the program will stop at any
breakpoint that is encountered prior to the selected step.
Choose Debug
Æ Run Debug.
Æ Run to Cursor.
gram until the next
breakpoint
To remove a breakpoint
To continue the program from a certain
step
Select the step with a breakpoint in either the tree view or in the
program list, and choose Debug
Select the program step to start from and choose Debug
Æ Set Breakpoint.
Æ
Execute Step or press F5.
Then use Run debug or Run to cursor to continue running the
program from the last executed step.
Note: If the execution time of a step exceeds the IVC Studio communication timeout
(default 2500 ms), an ITF-2 error is displayed in IVC Studio, even though the camera is still
executing the step. By pressing F5 or F8 again, the connection to the camera is restored,
and the results from the step will be displayed in the step program view.
44 ©SICK AG • Advanced Industrial Sensors • www.sick.com • All rights reserved
Page 45

Reference Manual Chapter 3
IVC-2D
Efficient Programming
3.9 Efficient Programming
It is important for both efficiency and readability reasons that programs are well structured
and well documented. When writing programs in IVC Studio you should consider the tips in
this chapter for more efficient programming.
3.9.1 Organizing Programs for Readability and Maintenance
By following these rules your programs become more readable and easier to maintain:
Divide the program structure into two main parts. One initialization part and one cycle
part.
The initialization part contains everything that is only set once after power-up, for example grabbing parameters, static ROIs, load table from memory, and so on.
The cycle part is what is executed over and over again until the program is stopped.
Group sequences of steps to represent a higher-level function than the individual steps.
To perform this grouping, there are three standard ways:
1) tabulation in the program tree
2) subroutines
3) macros
Name step tools more specifically than the tool’s original name.
Example: Rename “Scan rows” to “Scan rows, find upper left edge” or “If go” to “If width
too small, go to fail”.
Name the first step in the sequence in accordance with the purpose of the entire high-
level function when a sequence of steps is grouped.
Example: If 12 steps are used to localize a blob and find its uppermost edge pixel, then
rename the first step to “Find top edge of blob” and indent the remaining 11 steps.
Add dummy steps with the only purpose to give a sequence of indented steps a good
name, and to retain the possibility to give a more specific name to the first image processing step of the sequence. For example, a ‘Goto‘ tool that only goes to the next step
can be used.
3.9.2 Making Debugging Easier
Display key values of your program/table, using the ‘Display‘ tool, to enable performan-
ce tests and fast debugging.
Display key parameters in different colors and sizes in the displayed bank by using the
‘Add Text‘ tool. For example in simple pass/fail applications you display Pass in green
letters or Fail in red letters.
For graphical feedback, add a ‘Draw ROI‘ step directly after the ROI creation to speed
up debugging when you use dynamic ROIs. Dynamic ROIs are ROIs that move around
depending on other results in the program.
©SICK AG • Advanced Industrial Sensors • www.sick.com • All rights reserved 45
Page 46

Chapter 3 Reference Manual
IVC-2D
Using IVC Studio
3.9.3 Organizing Error Handling
Without error handling a program stops if an error occur. Hence it is very important to
handle possible errors. Error handling is initiated by the ‘On error goto‘ tool in the Program
category. This step can either be added at the beginning of a small program or, for example, at the beginning of each part in a larger program.
3.9.4 Organizing Tables for Readability and Maintenance
Use a table for all parameters that you may want to change during the installation and
use of the application. Divide the table parameters into blocks: User settings, advanced
settings, Debug parameters and so on. It is practical to start filling the table with the
user settings, as these are visible immediately in the programming environment (no
need to scroll the table to find them). Preferably, place a few empty rows in the table
between each parameter block to make adjustments easier.
Give parameters in a table unique names that anyone familiar with IVC Studio and the
application can understand.
3.9.5 Optimizing Performance
Make ROIs as small as possible.
Use image processing filters only when necessary.
Avoid displaying results that are not necessary to see.
Place static ROI definitions outside of the program loops so that they are only executed
once. This is only a concern in very time-critical applications.
3.9.6 Providing Image Processing Robustness
Make sure to provide good lighting conditions.
Avoid dependence on 50 Hz lamps unless shutter times are very long.
Mount a band pass filter on the lens if only one color is of interest.
46 ©SICK AG • Advanced Industrial Sensors • www.sick.com • All rights reserved
Page 47

Reference Manual Chapter 4
IVC-2D
Efficient Programming
4 Tools
IVC Studio contains about 100 advanced image processing tools. These tools are available on the toolbar in the programming window, and are grouped into the following categories.
Image The image tool group contains tools that are used for taking a picture
to work with, adding graphics to the images and editing the image
banks, which is the image memory in the camera.
Region of Interest The region of interest (ROI) tools are used for defining an area in
which the other tools should work. These tools speed up the image
processing since the entire image is not treated.
Filter The filter tools can be applied to enhance features in the image.
Available tools are erode and dilate tools as well as binarize tools for
transforming grayscale images to binary.
Edge The edge tools are used to find object edges in the pictures and
thereby the coordinates of the objects. It is possible to scan the image from all different directions and also to find multiple edges on
one specific line.
Measure This category contains tools that measure area, center of mass, find
and measure blobs and measure distance and angle.
Matching The matching tools are used for teaching the camera to recognize an
object, and then using this for locating objects in images, counting
the number of objects, or for calculating the rotation of objects.
Circular The group of circular tool contains a specific set of tools. These tools
make it possible to check perimeters of objects, diameters, the surface and the outer shape of objects.
Calculation Calculation tools are used for example for determining whether or
not values are in correct ranges, or calculating the deviation of round
objects from circles.
Program The step programming tools are used for defining loops and condi-
tions in programs. Some of the available tools are: For, If, Else, If
then goto, If in range goto, Run program, and Subroutine.
The subroutine is a powerful tool when optimizing the program. It
increases the overview and readability of your program.
System The system group contains tools for inserting delays in the program,
saving values or results to a permanent flash memory, and writing
and reading result or parameter values to a memory separate from
the actual program (the Table).
Communication The communication tools are used for sending values over RS485
and Ethernet.
Input/Output The tools in the Input/Output group handle reading of digital inputs
and setting digital outputs.
Reader The reader tools are used for reading barcodes and DataMatrix 2D
codes in the images. These tools are only available in the Reader
version of IVC-2D.
©SICK AG • Advanced Industrial Sensors • www.sick.com • All rights reserved 47
Page 48

Chapter 4 Reference Manual
IVC-2D
Image
4.1 Image
Grab Setup
With Grab Setup the user can set properties on the device such as shutter and gain as
well as illumination properties and thereby control some parameters used for image
acquisition. Grab Setup is basically used to specify how to grab an image. Acquisition tools
such as ‘Grab’, ‘Start Snapshot’ and ‘Ping-Pong Grab’ specify when to grab images and
where the images should be placed.
Grab Setup is often used early on in a program, but can be used more than once if a
parameter has to vary during the program execution.
Input Parameters
01 = Exposure time (us)
02 = Gain
03 = External trigger
04 = Trigger slope
This parameter defines how many micro seconds the
shutter is open. Common values for this setting are
4000-25000.
This parameter sets the gain for the device. Common
values are 300-600 for this parameter.
This parameter defines whether the acquisition tools
should be synchronized with an external trigger signal.
If the External trigger parameter is set to true, this
parameter indicates if the synchronization should be on
a rising or falling flank of the external trigger signal.
05 = Strobe enable
06 = Strobe time (us)
Returned Values
None
If a trigged source of illumination is used, this parameter should be set true.
If the Strobe enable parameter is set true this parameter specifies the duration of each strobe flash in microseconds. Allowed values are 10–400.000 us.
48 ©SICK AG • Advanced Industrial Sensors • www.sick.com • All rights reserved
Page 49

Reference Manual Chapter 4
Image
IVC-2D
The Emulator does
not emulate this
tool. See section
Handling the
Emulator for more
information.
Start Snapshot
Start snapshot is to be used in combination with the ‘Grab’ tool for image acquisition in
applications where speed is of great importance. Start snapshot indicates the start of a
block of instructions executed in parallel with the image acquisition. The ‘Grab’ tool concludes the parallel processing and makes sure that both processes are completed before
execution of any step following ‘Grab’ starts. When using ‘Grab’ in combination with Start
snapshot, the Destination bank parameter is set in the Start snapshot tool and the pa-
rameter in the ‘Grab’ tool is simply ignored.
Note that the execution time of ‘Grab’ in run mode is longer than what is indicated in step
mode in the case where intermediate steps have shorter execution time than the time of
an image acquisition.
Input Parameters
01 = Destination bank
The image is placed in the image bank indicated by this
parameter sometime after the execution of Start snapshot
but before the execution of Grab has completed.
Returned Values
None
©SICK AG • Advanced Industrial Sensors • www.sick.com • All rights reserved 49
Page 50

Chapter 4 Reference Manual
IVC-2D
Image
Grab
Grab is the most common tool for image acquisition and has different functions depending
on how it is used, and depending on if the Emulator or a hardware camera is the selected
device. It can be used alone or in combination with the ‘Start Snapshot’ tool.
Using the Grab tool only
When used alone Grab acquires an image from the device and places it in the image bank
indicated by the parameter Destination bank. The step following Grab does not start
executing until this is completed.
Using Grab in combination with Start Snapshot
When used in combination with ‘Start snapshot’, the function instead is this: ‘Start Snapshot’ starts an image acquisition in parallel with the execution of steps following ‘Start
Snapshot’. When all the steps between ‘Start Snapshot’ and Grab has been executed,
Grab waits for the image acquisition to complete if not already completed before the step
following Grab can start executing. When using Grab in combination with ‘Start Snapshot’,
the Destination bank parameter is set in the ‘Start Snapshot’ tool and the parameter in the
Grab tool is simply ignored.
When the combination of ‘Start Snapshot’ and Grab is used the execution time of Grab in
run mode is longer than what is indicated in step mode for the case where intermediate
steps have shorter execution time than the time of an image acquisition.
Using the Emulator
When the Emulator is the selected device, images are captured from a predefined set of
image files. Executing a ‘Grab’ tool means that the next image in the dedicated image
folder is captured. For more information regarding the Emulator, see section Handling the
Emulator.
Input Parameters
01 = Destination bank
Returned Values
01 = File Name
Error Messages
Err. = 8605
Err. = 8606
When the Grab tool is used alone this parameter indicates in
which image bank the acquired image is placed.
The file name of the acquired image file.
A 3D image cannot be loaded into a 2D camera.
The image size is not correct.
50 ©SICK AG • Advanced Industrial Sensors • www.sick.com • All rights reserved
Page 51

Reference Manual Chapter 4
IVC-2D
Image
Ping-Pong Grab
Ping-pong grab is an important tool in applications where new images must be acquired
fast and often. The first time Ping-pong grab is executed in your step program, an image is
grabbed and placed in the image bank indicated by the parameter Destination bank A.
The result value is then set to the same value as that parameter to indicate that the image
in this bank is available to work with. Then an acquisition of a new image, which is placed in
the image bank indicated by the Destination bank B parameter, is initiated in parallel with
execution of steps following Ping-pong grab. After the first time a Ping-pong grab is executed in the program, the function is as follows.
Ping-pong grab waits for previously acquired images to be placed in an image bank if that
process is not yet completed. The result value states which bank that is and a new image
acquisition is initiated in parallel with steps following the Ping-pong grab step. The new
image should be placed in a different image bank indicated by one of the Destination bank
parameters. If n is a positive integer, the new image is placed in Destination bank A the
(2n)th time Ping-pong grab is executed and in Destination bank B the (2n+1)th time.
Note that the same Ping-pong step can be executed several times by using loops or jump
steps. The idea of this tool is that the execution time of the Ping-pong grab step is much
shorter than a regular image acquisition except the first time the tool is executed in a
program and in the case where intermediate steps have shorter execution time than the
time of an image acquisition. Also note that the execution time of Ping-pong grab in run
mode is longer than what is indicated in step mode for the latter case.
Input Parameters
01 = Destination bank A
02 = Destination bank B
Returned Values
01 = Result bank
Indicates the image bank in which an image is placed the
(2n)th time the tool is executed in the program.
Indicates the image bank in which an image is placed the
(2n+1)th time the tool is executed in the program.
Indicates which bank contains an image ready to work on.
©SICK AG • Advanced Industrial Sensors • www.sick.com • All rights reserved 51
Page 52

Chapter 4 Reference Manual
Image
IVC-2D
Copy Image Bank
This tool is used to make a copy of an image bank. The parameters Source bank and
Destination bank specify which bank to duplicate and where to place the new copy.
Note that the contents of the destination bank are replaced by the new copy. There is no
undo function. Replaced data in the destination bank is lost.
Input Parameters
01 = Source bank
02 = Destination bank
Returned Values
None
This parameter indicates the image bank number to copy
from.
This parameter indicates the image bank number where the
new copy is placed.
52 ©SICK AG • Advanced Industrial Sensors • www.sick.com • All rights reserved
Page 53

Reference Manual Chapter 4
Image
IVC-2D
Image Bank Operation
This tool is used for copying a region of an image to another image bank. In addition to
copying the pixels, you may also calculate new gray level values for each pixel, based on
the gray level values of the pixels in the image in the source bank and an image already in
the destination bank.
The parameters Source bank and Destination bank specify which banks to use for the
operation. The resulting image will be placed in the Destination bank.
Note that the image in the destination bank will be replaced by the merged image. There is
no undo function. Replaced data in the destination bank is lost.
Input Parameters
01=Source bank
02=ROI definition
step
The image bank containing the image to copy from.
The step number in your program, which holds the definition of
which region of interest in the image that the operation is performed for.
03=Mathematical
operation
Specifies which mathematical operation to perform when copying
pixels from the ROI of the source image to the destination bank.
Min
(and) The resulting image will contain the darkest of the
corresponding pair of pixels from the source and
the destination images.
For binary images the corresponding pixels in both
images must be white for the resulting pixel to be
white. This is equivalent to an AND operation.
(or) The resulting image will contain the brightest of the
Max
corresponding pair of pixels from the source and
the destination images.
For binary images the resulting pixel is white if
either the source or destination pixel is white. This
is equivalent to an OR operation.
(xor) The gray level of each resulting pixel is calculated
Diff
by:
absolute value of (gray level in source image -
gray level in destination image)
Two identical images results in a black image.
For binary images the resulting pixel is white if
either the source or destination images are white
but not both. This is equivalent to an XOR operation.
(not) The gray level of each resulting pixel is calculated
Inv
from:
(243 - gray level in source)
Colored pixels (gray level > 243) are simply copied
by this operation.
For binary images the resulting pixel in the target
bank will be white if the source image is black and
vice versa. This is equivalent to a NOT operation.
Copy Copies every pixel in the ROI of the source image
to the destination bank.
04=Destination
bank
The image bank in which the resulting image is placed. For most
of the operations the result is affected by any image that is
stored in this bank prior to executing this tool.
©SICK AG • Advanced Industrial Sensors • www.sick.com • All rights reserved 53
Page 54

Chapter 4 Reference Manual
IVC-2D
Image
Returned Values
None
Error Messages
Err. = 7704
Example
Source Destination
Min (and)
Max (or)
The region of interest has parts that are outside the source bank.
Diff (xor)
Inv (not)
Copy
54 ©SICK AG • Advanced Industrial Sensors • www.sick.com • All rights reserved
Page 55

Reference Manual Chapter 4
IVC-2D
Image
Add Text
This tool adds a text strip to an image bank. The text itself as well as the background strip
can be drawn in the color or gray scale value of your choice.
The text can consist of a text string, a number or both. If the String type parameter is set
to Text, the text string can of course hold numbers, but they will be static. If String type is
set to Text and variable or Variable, variable values can be part of the text strip.
When double clicking the values of String color or Background color parameters, the
respective colors can be specified as numbers or chosen from an interactive menu. Possible inputs are numbers between 0 and 255, where 0 through 243 are gray scale values
and 244 through 255 are various colors.
Input Parameters
01 = X coordinate
02 = Y coordinate
03 = String type
04 = Text
05 = Variable
The x-coordinate of the upper left corner of the text strip.
The y-coordinate of the upper left corner of the text strip.
This parameter specifies whether the text strip is a static
text, a variable value or a combination. For the latter case,
the variable value will follow the static string with a space
in between.
This parameter specifies the static text.
This parameter specifies the variable value. Note that the
value can be given as a constant value, evaluated by an
expression, a table value or be an argument or result from
a previous step.
06 = String color
07 = Background color
08 = Size
09 = Destination bank
Returned Values
01 = String length
02 = Character width
03 = Character height
The gray scale value or color code that specifies the color
of the text. Allowed values are 0 through 255.
The gray scale value or color code that specifies the color
of the strip behind the text. The value 254 is transparent.
This parameter specifies the size of the font where 1 is the
smallest and 8 is the largest font available.
The image bank in which to overlay the text.
Number of letters in the text strip. Note that the space
between the string and the number is included in the count
if String type is set to Text and variable.
The number of pixels each letter is wide.
The text strip height in pixels.
©SICK AG • Advanced Industrial Sensors • www.sick.com • All rights reserved 55
Page 56

Chapter 4 Reference Manual
IVC-2D
Image
Draw Line
This tool adds a line to an image bank. The line is 2 pixels wide and can be drawn in the
color or gray scale level of your choice. The line can for instance be used to separate
blobs, to enhance an edge between two known points or simply for visualization. When
double clicking the value of the Color parameter, the color of the line can be specified as a
number or chosen from an interactive menu. Possible inputs are numbers between 0 and
255, where 0 through 243 are gray scale values and 244 through 255 are various colors.
Input Parameters
01 = Start point X
02 = Start point Y
03 = End point X
04 = End point Y
05 = Color
06 = Destination bank
Returned Values
None
The x-coordinate of the first end point.
The y-coordinate of the first end point.
The x-coordinate of the second end point.
The y-coordinate of the second end point.
The gray scale value or color code that specifies the color of
the line. Allowed values are 0 through 255.
The image bank in which to overlay the line.
56 ©SICK AG • Advanced Industrial Sensors • www.sick.com • All rights reserved
Page 57

Reference Manual Chapter 4
IVC-2D
Image
Draw ROI
This tool draws a previously defined ROI in a selected image bank. It is possible to choose
if the interior area or the contour of the ROI should be colored. To color the contour set the
Filling parameter to False, to color the whole area set the Filling parameter to True.
Drawing a ROI in a bank is used for visualization of the current ROI and to control the
selected area for next coming processing steps.
Input Parameters
01 = ROI definition step
02 = Color
02 = Filling
03 = Destination bank
Returned Values
None
Number of the step with the ROI to show in the
selected image bank.
Select a color to mark the ROI. Double-click on the
input field to choose from a color palette.
True whole area of the ROI will be color with
selected color.
the
False only the contour of the ROI will be color.
Number of destination bank in which to draw the
selected ROI.
©SICK AG • Advanced Industrial Sensors • www.sick.com • All rights reserved 57
Page 58

Chapter 4 Reference Manual
IVC-2D
Image
Reset Image Banks
This tool sets all pixels in an image bank to a color or gray scale tone of your choice. If the
Number of banks to reset parameter is greater than one, multiple image banks are reset
from left to right starting with First bank to reset. When double clicking the value of the
Color parameter, the color can be specified as a number or chosen from an interactive
menu. Possible inputs are numbers between 0 and 255, where 0 through 243 are gray
scale values and 244 through 255 are various colors.
Input Parameters
01 = First bank to reset
02 = Number of banks to reset
03 = Color
Returned Values
None
This parameter specifies the number of the first
image bank to reset.
This specifies how many image banks to reset.
The gray scale value or color code that specifies
with which color the image banks should be filled.
Color values are 0 through 255.
58 ©SICK AG • Advanced Industrial Sensors • www.sick.com • All rights reserved
Page 59

Reference Manual Chapter 4
IVC-2D
Image
Display
The display tool is used for showing an image bank and a table with ten variable values in
a separate Run window when the program is running. The Run window is only displayed
when the program is running, and not when stepping through or debugging the program.
Each time the tool is executed, a new row is added to the table in the Run window, showing the current values of the variables. The table can display up to 150 values. For each
numerical variable, the mean value and deviation is calculated and displayed at the bottom
of the Run window.
If the variable refers to a value stored in the table, the description in the table for that row
is used as header of that variable’s column. When displaying a value from a previous
program step, the name of that result is used as the header. For any other type of variable
(numerical value, string or expression) the column has the parameter name (Variable 1 –
10) as header.
It is possible to export the values of the variables to file. If the “Export variable values”
checkbox is checked when closing the Run window, a save dialog is displayed allowing the
user to specify a file name and location. Up to 10.000 of the rows displayed in the Run
window are saved to the file. If more than 10.000 rows have been displayed, it is only the
10.000 latest rows that will be saved to file. N.B. variables that are longer than 100 characters will be truncated.
If the communication between PC and the device should be interrupted, for instance by
pulling the Ethernet cable from the PC, the execution in the device goes on but the updates by the Display tool will be stopped until the connection is re-established.
Input Parameters
01 = Source bank
02 = Binarized color
03 = Variable 1
04 = Variable 2
…
12 = Variable 10
Returned Values
None
The number of the image bank to display when the program is
running.
Specifies a color or gray level to mark out pixels that are ON in
an image returned by the 'Binarize' tool.
The parameters 03–12 specifies the values to be displayed
in the table
©SICK AG • Advanced Industrial Sensors • www.sick.com • All rights reserved 59
Page 60

Chapter 4 Reference Manual
IVC-2D
Image
Mirror Image
This tool mirrors an image by specifying the axis around which to mirror.
Input Parameters
01=Source bank
02=Destination
bank
03=Mirror around
axis
Returned Values
None
Image bank containing the image to be mirrored.
Image bank in which to display the mirrored image.
The axis around which to mirror:
Vertical Mirror around the Y axis.
Horizontal Mirror around the X axis.
60 ©SICK AG • Advanced Industrial Sensors • www.sick.com • All rights reserved
Page 61

Reference Manual Chapter 4
IVC-2D
Image
Rotate Image
This tool rotates an image by specifying the angle and the center of rotation.
The image can be rotated around its center or around a specified point. The center of
rotation is in the latter case specified by the parameters X center and Y center.
The image can also be moved after rotation, but before being copied to the destination
bank. The parameters X offset and Y offset specifies the distance to move.
The rotated image is displayed in the Destination image bank. Note that only the part if the
image that after the rotation is located within the ROI will be displayed in the destination
bank.
The parameter Interpolation method controls how the pixel values are calculated in the
destination image. It is possible to choose between bilinear interpolation (gives higher
image quality) or nearest neighbor (gives faster execution time).
Input Parameters
01=Source bank
02=Destination bank
03=ROI definition step
04=Angle
05=Rotation around
center
06=X center
07=Y center
08=X offset
09=Y offset
10=Interpolation
method
Returned Values
Image bank containing the image to rotate.
Image bank in which to display the rotated image.
Step number where the ROI to use was created.
The counter-clockwire rotation angle, in degrees.
True The rotation point is in the centre of the ROI and
the following two parameters are ignored.
False The coordinates for the rotation point are set by
the following two parameters.
The X coordinates for the rotation point. X = 0 is on the left
side of the FOV.
The Y coordinates for the rotation point. Y = 0 is at the top
of the FOV.
The distance in pixels along the x axis to move the rotated
image.
The distance in pixels along the y axis to move the rotated
image.
The interpolation method to use when calculating the pixel
values in the destination image.
None
©SICK AG • Advanced Industrial Sensors • www.sick.com • All rights reserved 61
Page 62

Chapter 4 Reference Manual
IVC-2D
Region of Interest (ROI)
4.2 Region of Interest (ROI)
ROI Rectangle
This tool generates on every type of image a rectangular shaped ROI (Region Of Interest).
The ROI is used to define a rectangular limited working area to perform image processing
steps or other functions.
To set the position and dimension of the ROI it is possible to type the coordinates of the
top left corner of the rectangle and the size specifying the width and the height in pixels.
During the setup of the ROI it is also possible to set the size of the ROI and position in the
preview using the left mouse button. Double-clicking the image in the preview opens a
larger image to set the ROI with the mouse more precisely.
It is possible to define the position of the ROI relative to a previously generated result. This
is done by setting an offset of the top left corner of the ROI using the input parameters X
offset and Y offset. The values of the offset must come from a previous step result or from
the table.
The ROI is plotted in the current preview.
Input Parameters
01 = X offset
02 = Y offset
03 = X coordidate
Offset value of the upper left ROI corner in x direction. To set an
offset the value must come from the table or as a result from a
previously performed program step.
Like above but for Y direction.
X coordinate for the top left corner of the ROI.
04 = Y coordinate
05 = Width
06 = Height
Returned Values
None.
Error Messages
Err. = 148
Y coordinate for the top left corner of the ROI.
Width of the ROI (in X direction) in pixels.
Height of the ROI (in Y direction) in pixels.
Error in ROI means that parts of the ROI are out of the FOV.
Reduce size of ROI.
Check X and Y origin.
Check offset values.
Check Width and Height parameters.
62 ©SICK AG • Advanced Industrial Sensors • www.sick.com • All rights reserved
Page 63

Reference Manual Chapter 4
IVC-2D
Region of Interest (ROI)
ROI Rotated Rectangle
This tool generates a rectangular shaped ROI (Region Of Interest) that can be rotated. The
ROI is used for defining a rectangular limited working area in which to perform image
processing or other functions.
To set the position of the ROI the coordinates of the top left corner of the rectangle can be
used. It is also possible to define the position of the ROI relative to a previously generated
result. This is done by setting an offset of the top left corner of the ROI using the input
parameters X offset and Y offset. The values of the offset must come from a previous step
result or from the table.
The size is set in pixels by the parameters Width and Height.
During the setup of the ROI it is also possible to set the size of the ROI and position in the
preview using the left mouse button. Double-clicking the image in the preview opens a
larger image to set the ROI with the mouse more precisely.
It is possible to rotate the ROI with respect to the center of the ROI or with chosen coordinates of the rotation center. If the rotation center coordinates are equal to -1 the rotation
is done with respect to the center of the ROI. The coordinates of the rotation center could
also be outside of the ROI somewhere in the FOV. Note that it is necessary to execute the
ROI tool (keyboard key F5) to perform the rotation.
Input Parameters
01 = Source
bank
02 =X offset
03 = Y offset
04 = Rotation
around center
05 = Rotation
point X
06 = Rotation
point Y
07 = X coordinate
08 = Y coordinate
09 = Width
10 = Height
Copy the selected image bank to the preview bank
Offset value of the upper left ROI corner in x direction. To set an
offset the value must come from the table or as a result from a
previously performed program step.
Like above but for Y direction.
True means that the rotation point is in the centre of the ROI
and the following two parameters are ignored.
False means that the coordinates for the rotation point are set
by the following two parameters.
Set the X coordinates for the rotation point. X = 0 is on the left
side of the FOV.
Like above but for Y direction. Y = 0 is on the top of the FOV.
X coordinate for the top left corner of the ROI (before rotation).
Like above but for Y direction (before rotation).
Width of the ROI (in X direction) in pixels (before rotation).
Height of the ROI (in Y direction) in pixels (before rotation).
11 = Angle
12= Destination
bank
Returned Values
None
©SICK AG • Advanced Industrial Sensors • www.sick.com • All rights reserved 63
Rotation angle with respect to the rotation point. Input values are
the rotation angle in degrees.
Positive values mean counterclockwise rotation.
Negative values mean clockwise rotation.
Value = 0 means no rotation.
Number of destination bank (-1= no display of the ROI in the
preview window).
Page 64

Chapter 4 Reference Manual
IVC-2D
Region of Interest (ROI)
Error Messages
Err. = 107
points out of bank means that the rotation of the ROI
leads out of the FOV.
Reduce size of ROI.
Check offset values.
If using rotation point change coordinates of rotation point.
64 ©SICK AG • Advanced Industrial Sensors • www.sick.com • All rights reserved
Page 65

Reference Manual Chapter 4
IVC-2D
Region of Interest (ROI)
ROI Circle
This tool generates a circular shaped ROI (Region Of Interest). The ROI defines a circular
limited working area in which to perform image processing or other functions.
To set the position and dimension of the ROI it is possible to type the coordinates of the
center of the circle and radius length in pixels. During the setup of the ROI it is also possible to set the size of the ROI and position in the preview using the left mouse button.
Double-clicking the image in the preview opens a larger image to set the ROI with the
mouse more precisely.
It is also possible to define the position of the ROI relative to a previously generated result.
This is done by setting an offset to the top left corner of the bounding box of the circle
using the input parameters X offset and Y offset. The values of the offset must come from
a previous step result or from the table.
Input Parameters
01 = X offset
02 = Y offset
03 = X center
04 = Y center
05 = Radius
Offset value of the upper left corner of the bounding box in X
direction. To set an offset the value must come from the table or
as a result from a previously performed program step.
Like above but for Y direction.
X coordinate of the center of the circle.
Like above but for Y direction.
Length of the circle radius in pixels.
Returned Values
None
Error Messages
Err. = 148
Error in ROI means that a part of the ROI is out of the FOV.
Reduce circle radius.
Check offset and center parameters.
©SICK AG • Advanced Industrial Sensors • www.sick.com • All rights reserved 65
Page 66

Chapter 4 Reference Manual
IVC-2D
Region of Interest (ROI)
ROI Ellipse
This tool generates on every type of image an elliptical shaped ROI (Region Of Interest).
The ROI is used to define an elliptic limited working area to perform image processing
steps or other functions.
The position and dimension of the ROI can be set by specifying the coordinates in pixels of
the center of the ellipse (X center and Y center) and radius of the axes in X and Y direction
(X radius and Y radius). The ROI can also be set by adjusting the position and dimension in
the Preview of the program step. Double-clicking on the preview image opens a larger
window with the image to work in.
It is also possible to define the position of the ROI relative to a previously generated result.
This is done by setting an offset of the top left corner of the bounding box of the ellipse
using the input parameters X offset and Y offset. The values of the offset must come from
a previous step result or from the table.
Input Parameters
01 = X offset
02 = Y offset
03 = X center
Offset value of the upper left corner of the bounding box in X
direction. To set an offset the value must come from the table or
as a result from a previous program step.
Offset value of the upper left corner of the bounding box in Y
direction. This value must come from the table or be a result from
a previous step.
X coordinate of the centre of the ellipse.
04 = Y center
05 = X radius
06 = Y radius
Returned Values
None
Error Messages
Err. = 148
Y coordinate of the centre of the ellipse
Radius of the axes in X direction in pixels.
Radius of the axes in Y direction in pixels.
Error in ROI means that a part of the ellipse is out of the
FOV.
Check radius parameters.
Check center and offset coordinates.
66 ©SICK AG • Advanced Industrial Sensors • www.sick.com • All rights reserved
Page 67

Reference Manual Chapter 4
IVC-2D
Region of Interest (ROI)
ROI Perimeter
ROI perimeter generates a ROI which shape, position and size is defined by the found
contour pixels from the ’Perimeter’ tool. The ’Perimeter’ tool traces the contour of an object
and returns the pixels which are found along the contour and this is used as input. The
’Perimeter’ tool is found in the Measure category.
Note: The ROI perimeter tool can only be used after the ’Perimeter’ tool is executed in a
previous program step.
With the Margin parameter it is possible to expand or shrink the ROI with respect to the
original shape. A positive margin value will expand the ROI in each direction by the typed
value in pixels. A negative margin will shrink the ROI. If a positive margin value is used
make sure that the resulting ROI is not larger than the total FOV of the camera. If a negative margin value is used make sure that the typed value will not produce negative results
for the size of the ROI.
The parameter Filling controls if the area inside the ROI is colored red (internal) or if only
the contour of the ROI (external) is colored red.
Input Parameters
01 = Perimeter definition
step
02 = Margin
03 = Filling
Number of the step with the ’Perimeter’ tool which
provides the contour pixels to process the ROI.
Positive or negative values to expand or shrink the size
of the ROI.
0=internal whole area of the ROI will color red.
1=external only the contour of the ROI is color
red.
04 = Destination bank
Returned Values
None
Error Messages
Err. = 152
Number of destination bank to display the ROI.
-1= no display of the ROI.
Error in ROI from perimeter
Check Margin values and make sure that the result will
not produce negative results or lead outside of the
FOV.
©SICK AG • Advanced Industrial Sensors • www.sick.com • All rights reserved 67
Page 68

Chapter 4 Reference Manual
IVC-2D
Region of Interest (ROI)
ROI Union
This tool unifies two different ROIs from previous program steps to one single ROI.
The two ROIs to be unified are named ROI A and ROI B. The resulting single ROI is the
addition of ROI A and ROI B. If it is necessary to display the unified ROI use the ‘Draw ROI’
tool in the Image category.
Input Parameters
01 = ROI A definition step
02 = ROI B definition step
Returned Values
None
Reference to program step to select ROI A
Reference to program step to select ROI B
68 ©SICK AG • Advanced Industrial Sensors • www.sick.com • All rights reserved
Page 69

Reference Manual Chapter 4
IVC-2D
Region of Interest (ROI)
ROI Intersection
This tool generates a new ROI from the intersection of two different ROIs.
The resulting single ROI is the intersection of ROI A and ROI B. If it is necessary to display
the unified ROI use the ‘Draw ROI’ tool in the Image category.
Note that if the selected ROI A and ROI B have no intersection at all this tool will not generate a new ROI. In that case this could be the cause for error messages if input parameter
ROI definition from a different tool refers to the result of this tool.
Input Parameters
01 = ROI A definition step
02 = ROI B definition step
Returned Values
None
Reference to program step to select ROI A
Reference to program step to select ROI B
©SICK AG • Advanced Industrial Sensors • www.sick.com • All rights reserved 69
Page 70

Chapter 4 Reference Manual
IVC-2D
Region of Interest (ROI)
ROI Difference
This tool performs a subtraction between two different ROIs and generates as result a new
ROI. The subtraction will be executed as follows:
Resulting ROI = ROI A – ROI B.
If it is necessary to display the unified ROI use the ‘Draw ROI’ tool in the Image category.
Note that if the selected ROI A and ROI B are identical this tool will not generate a new ROI.
In that case this could be the cause for error messages if input parameter ROI definition
from a different tool refers to the result of this tool.
Input Parameters
01 = ROI A definition step
02 = ROI B definition step
Returned Values
None
Reference to program step to select ROI A
Reference to program step to select ROI B
70 ©SICK AG • Advanced Industrial Sensors • www.sick.com • All rights reserved
Page 71

Reference Manual Chapter 4
pplying
pplying
IVC-2D
Filter
4.3 Filter
Dilate
This tool shifts a 3 by 3 matrix over the image and replaces the value of the center matrix
element with highest value out of the surrounding matrix elements. In general this tool
erodes dark pixels and can be used to reduce image artifacts due to single dark pixels.
Sometimes it is necessary to repeat this step several times until the desired result is
achieved.
Figure – The value of the center matrix element is changed to the highest value out of the
Input Parameters
01 = Source bank
02 = ROI definition step
03 = Destination bank
110 110110
250 80140
250 8080
Center matrix element
before a
surrounding matrix elements.
function
Image bank containing the image to dilate.
Step number where the ROI to use was created.
Image bank in which to display the dilated image.
110 110 110
250 80 250
250 80 80
Center matrix element
after a
function
Returned Values
None
©SICK AG • Advanced Industrial Sensors • www.sick.com • All rights reserved 71
Page 72

Chapter 4 Reference Manual
pplying
pplying
IVC-2D
Filter
Erode
This tool shifts a 3 by 3 matrix over the image and replaces the value of the center matrix
element with lowest value out of the surrounding matrix elements. In general this tool
erodes pixels with high values (bright or high) and can be used to reduce image artifacts
due to single white pixels.
Sometimes it is necessary to repeat this step several times until the desired result is
achieved.
Figure – The value of the center matrix element is changed to the lowest value out of the
Input Parameters
110 110110
250 80140
250 8080
Center matrix element
before a
surrounding matrix elements.
function
110 110 110
250 80 80
250 80 80
Center matrix element
after a
function
01 = Source bank
02 = ROI definition step
03 = Destination bank
Returned Values
None
Image bank containing the image to erode.
Step number where the ROI to use was created.
Image bank in which to display the eroded image.
72 ©SICK AG • Advanced Industrial Sensors • www.sick.com • All rights reserved
Page 73

Reference Manual Chapter 4
pplying
g
IVC-2D
Filter
Filter
This tool offers the following three filter types:
1. Smooth
2. Edge
3. Median
Smooth
The Smooth filter shifts a 3 by 3 matrix over the image. The value in the matrix center will
be replaced by the mean value out of the surrounding 8 matrix elements, as shown in the
following figure:
100 100100
100 50140
50 5050
Center matrix element
before a
Figure – The value of the center matrix element will be replaced by the mean value out of
the surrounding 8 matrix elements.
smooth filter
100 100 100
100 50 75
50 50 50
Center matrix element
after smooth filterin
Edge
The Edge filter is based on a sobel filter in x and y direction and detects edges in the
image.
Median
The Median filter is similar to the Smooth filter, but the value in the matrix center is replaced by the median value of the surrounding elements, instead of the mean value.
The result of the median filter is an image where noise and small details (single pixels) are
removed but edges are preserved.
Note that the both filter types operate only inside the selected ROI. The results are
displayed in a user defined image bank.
Input Parameters
01 = Source bank
02 = ROI definition step
03 = Filter type
04 = Destination bank
Image bank containing the image to be filtered.
Step number where the ROI to use was created.
Smooth Smooth the part of the image inside the ROI.
Edge Detects edges of the image part inside the
ROI.
Median Smooth the part of the image inside the ROI.
The image bank in which to display the filtered image.
Returned Values
None
©SICK AG • Advanced Industrial Sensors • www.sick.com • All rights reserved 73
Page 74

Chapter 4 Reference Manual
IVC-2D
Filter
Stretch Gray
This tool rescales the distribution of gray values in the image. All pixels in the image with a
gray value below a lower threshold are set to gray value 0. All pixels with gray values above
an upper threshold are set to gray value 255. Gray values between the two thresholds are
rescaled. The lower threshold defines gray value 1 and the upper threshold gray value
244. In general the histogram is cut at both ends and the cut-out stretched between gray
value 1 and 254.
In a second step it is possible to adapt the thresholds to the particular distribution of the
gray values. For example the total amount of pixels between the thresholds is 10.000 and
the parameter Pixel percentage is set to 10 %. The tool cuts off 10.000 • 0.1 = 1.000
pixels on each side of the re-scaled histogram. See figure for further explanation.
The upper and lower thresholds can be set in an interactive setup by clicking button that is
displayed when double-click the parameters’ value field. This new window allows setting
the upper and lower thresholds for the gray values with a slider. All gray values of pixels
with gray values within the two thresholds are rescaled. Pixels above and below thresholds
are set to 255 and 0 respectively.
This tool is useful for adjusting the gray values in the image for specific program steps.
gray value = 255gray value = 0
a)
lower threshold
b)
1.000 pixels
c)
gray value =1
Figure – a) Original histogram of the image. All gray values below the lower threshold are set
to gray value 0 and gray values above the upper threshold to 255.
b) The original histogram between the thresholds is stretched out from gray level
value 1 to gray level value 254. The example mentioned in the text cuts off 1.000
pixels (up to the dashed line) on each side of the re-scaled histogram. Depending
on the shape of the histogram two new thresholds are calculated.
c) Same procedure as from a) to b) the histogram between the dashed lines is
stretched from gray value 1 to gray value 2.
upper threshold
gray value =254
74 ©SICK AG • Advanced Industrial Sensors • www.sick.com • All rights reserved
Page 75

Reference Manual Chapter 4
IVC-2D
Filter
Input Parameters
01 = Source bank
02 = Gray low
03 = Gray high
04 = Pixel percentage
05 = Destination bank
Returned Values
01 = Gray low
02 = Gray high
Error Messages
Err. 162
Image bank that contains the image to be processed.
Threshold for lower gray value.
Threshold for upper gray value.
Amount of pixels to cut beginning from lower and upper
threshold. Value in percent.
A value of 9.6 means that the brightest 9.6 % and the
darkest 9.6 % of the pixels are set to 255 and 0 respectively, and the remaining 80,8% will be redistributed.
Image bank in which to store the resulting image.
Calculated new lower threshold (depends on the parameter Pixel percentage).
Calculated new upper threshold (depends on the parameter Pixel percentage).
Error in percentage threshold
Check the parameter Pixel percentage. The current setting
may have caused the returned values Gray low to be
higher than Gray high.
©SICK AG • Advanced Industrial Sensors • www.sick.com • All rights reserved 75
Page 76

Chapter 4 Reference Manual
IVC-2D
Filter
Detail Extraction
The Detail Extraction tool finds image details that “stick out” from the background. In 2D
images details that are in contrast with the background are enhanced, such as dark text on
bright background, bright text on dark background, spots, misprints or other defects on
surfaces.
It is recommended to use the interactive setup to customize the parameters. Double-click
on the Setup button to open the interactive setup window. For more information on the
interactive setup, see Detail Extraction Setup on page 232.
The result from the tool is a new image where only two intensity values are represented –
bright for details and dark for background.
Original image
Filtered with Detail
Extraction
Note:
Thresholded image
Figure –Filtering an image with the Detail Extraction tool, compared with thresholding the
image.
In the Operator Type parameter you set how the deviation search should be carried out.
Pixels near the edges of the ROI are affected by pixels outside the ROI.
Input Parameters
01 = Source Bank
02 = ROI Definition Step
03 = Operator Type
04 = Threshold
Image bank containing the image to be filtered
Previous program step defining the ROI to be used by
this tool
Defines which set of neighbouring points to consider
when locating deviating points:
Horizontal Compare the current point to
the horizontal neighbours.
Vertical Compare the current point to
the vertical neighbours.
Four points Compare the current point to
the horizontal and vertical
neighbours.
Eight points Compare the current point to
the horizontal, the vertical and
the diagonal neighbours.
Full Region(slow) All pixels inside the operator
radius are considered
The minimum difference in gray value between a pixel
and the background that is allowed to consider the
pixel a detail.
76 ©SICK AG • Advanced Industrial Sensors • www.sick.com • All rights reserved
Page 77

Reference Manual Chapter 4
IVC-2D
Filter
05 = Operator Radius
06 = Destination Bank
07 = Deviation Type
Returned Values
01 = Number of Detail Pixels
The radius in which the Operator Type will operate
within. This determines how far from the current point
the considered neighbour points should be.
Image bank in which to store the filtered image
Specifies whether the details to look for are brighter
(Bright), darker (Darker) or both brighter and
darker (Bright + Dark) than the background.
Note: If the Operator Type parameter is set to Full
region, the Bright + Dark option is not available.
The total number of detail pixels found.
©SICK AG • Advanced Industrial Sensors • www.sick.com • All rights reserved 77
Page 78

Chapter 4 Reference Manual
IVC-2D
Filter
Binarize
This tool creates a binary image based on the image in Source Bank. All pixels inside the
ROI that have gray scale values between a lower and an upper threshold are set to a ‘high’
value. All other pixels are set to a ‘low’ value. Return values are the total number of pixels
in the ROI that are in range (within the threshold bounds) and the number of pixels that are
out of range (outside the threshold bounds). The resulting binary image is written to the
image bank pointed out by the Destination Bank parameter.
This tool is suitable as a pre-processing step to further image processing.
It is recommended to use the interactive setup to customize the parameters. Double-click
on the Setup button to open the interactive setup window. For more information on the
interactive setup, see Binarize Setupon page 234.
Input Parameters
01 = Source bank
02 = ROI definition step
03 = Gray low
04 = Gray high
05 = Destination bank
06 = Threshold mode
07 = Output level
Image bank containing the image to binarize.
Step number where the ROI to use was created.
Lower threshold for gray value.
Upper threshold for gray value.
Image bank in which to display the binarized image.
Available options are:
Manual
Set the upper and lower thresholds yourself.
Automatic
Automatically sets the thresholds. Pixels within the
range become white, and the pixels outside the
range become black.
Automatic inverted
Automatically sets the thresholds, but with inverted
colors compared to the Automatic mode.
Defines which gray value to use for pixels within the
specified range. Allowed values are 0-255, where 0-
243 represent gray values and 244-255 represent
display colors.
Returned Values
01 = Pixels in range
02 = Pixel out of range
03 = Low Threshold
04 = High Threshold
78 ©SICK AG • Advanced Industrial Sensors • www.sick.com • All rights reserved
Total number of found pixels between the lower and
the upper threshold.
Total number of found pixels outside the lower and the
upper threshold.
Low threshold value
High threshold value
Page 79

Reference Manual Chapter 4
IVC-2D
Edge
4.4 Edge
Find Row Edge
This tool scans a defined row and outputs the first found pixel with a gray value that is
within the defined gray value thresholds. The return value is the column number of the first
found pixel. This column number is the x-coordinate of the found pixel and the y-coordinate
is the row number set with the input parameter Row.
This tool requires a non-rotated rectangle ROI from a previous step. Note that only ROIs
that are generated by the 'ROI rectangle' tool can be used. Do not use ROIs created by any
other ROI tool.
Only the pixels along the row inside the ROI will be considered.
The Row parameter can be set in the preview image by using the left mouse button and
drop the line from the top border of the FOV to the desired position.
It is possible to select scan direction along the row by the parameter Analysis direction. If
you select analysis direction from left to right (Left –> Right) the found column corresponds to the first found pixel from the left side of the ROI.
The gray value thresholds are set by the parameters Gray low and Gray high. To set the
thresholds with a slider, double-click the input field for the gray value threshold and click
the appearing button. This opens a larger image. Use the left mouse button to move the
slider.
All pixels inside the ROI with gray values within the two thresholds are colored blue.
Input Parameters
01 = Source bank
02 = Row
03 = Analysis direction
04 = Gray low
05 = Gray high
06 = ROI definition step
Image bank containing the image to be processed.
Row number for the row to be scanned. 0 = top of FOV
Scan direction.
Left –> Right beginning from the left side of the
ROI.
Right –> Left beginning from the right side of the
ROI.
Low gray value threshold.
High gray value threshold.
Step number where the ROI to use was created.
Note that only ROIs generated by the 'ROI rectangle' tool
can be used.
Returned Values
01= Column
Error Messages
Err. = 107
Err. = 108
©SICK AG • Advanced Industrial Sensors • www.sick.com • All rights reserved 79
Returns the number of the column where the found pixel is
located. This could be used as the X-coordinate of the
found pixel.
Error: points out of bank
Check if the specified ROI is generated by a 'ROI rectangle'
tool.
Error in Find row edge
Check if selected row is inside the ROI.
Page 80

Chapter 4 Reference Manual
IVC-2D
Edge
Find Column Edge
This tool scans a defined column and outputs the first found pixel with a gray value that is
within the defined gray value thresholds. The return value is the number of the corresponding row of the first found pixel. This row number is the y-coordinate of the found pixel and
the x-coordinate is the column number set with the input parameter Column.
This tool requires a non-rotated rectangular ROI from a previous step. Note that only ROIs
that are generated by the 'ROI Rectangle' tool can be used. Do not use ROIs created by
any other ROI tool.
Only the pixels along the row inside the ROI are considered.
The Column parameter can be set in the preview window by using the left mouse button
and drop the line from the top border of the FOV to the desired position.
It is possible to define Analysis direction to have either the column at the bottom of the
ROI as starting point (Down -> up) or the top column (Up -> down). Selecting Analysis
direction Down -> up outputs the row of the first found pixel beginning from the bottom
of the ROI.
The gray value thresholds are set by the parameters Gray low and Gray high. To set the
thresholds with a slider, double-click the input field for the gray value threshold and click
again on an appearing button that opens a larger image. Use the left mouse button to
move the slider. It is also possible to adjust the column position in this window.
All pixels inside the ROI with gray values within the two thresholds are colored blue.
Input Parameters
01 = Source bank
02 = Column
03 = Analysis direction
04 = Gray low
05 = Gray high
06 = ROI definition step
Returned Values
01 = Row
Error Messages
Err. = 104
Image bank containing the image to be processed.
Column number for the row which will be considered.
0 = left border of FOV
Direction of the analysis.
Down -> up beginning from the bottom of the ROI
Up -> down beginning from the top of the ROI.
Low gray value threshold.
High gray value threshold.
Step number where the ROI to use was created.
Note that ONLY ROIs generated by the 'ROI rectangle' tool
can be used.
Returns the number of the row where the found pixel is
located. This could be used as the Y-coordinate of the
found pixel.
Error: points out of bank
Check if the specified ROI is generated by a 'ROI rectangle'
tool.
Check if the specified column is inside the ROI.
80 ©SICK AG • Advanced Industrial Sensors • www.sick.com • All rights reserved
Page 81

Reference Manual Chapter 4
Edge
IVC-2D
Find Row
This tool scans an image along a horizontal line to find a row that contains pixels with gray
level values that are in a specified range. Only the part of the image that is inside a ROI is
scanned.
The returned value is the y-coordinate of the found row. In the preview window, the found
row is marked with a yellow line.
The tool will “find” a row (and stop scanning the image) when the row contains a certain
amount of pixels with gray levels within the range. This amount is specified by the parameter Level, and can be used for making the tool less sensitive for noise in the image.
Amount of matching
pixels along the line
0510 15 20 25 30
Line along which
the pixels are counted
Analysis
Direction
Row returned
by the tool
Level
ROI
Pixels with gray level
between Gray low
and Gray high
The parameter Type of transition is used for choosing whether the tool should stop scanning when the amount of matching pixels in the line rises above the amount set in Level
(pixels > level), or when it sinks below the amount set in Level (pixels < level).
The lower and upper limits of the range of gray levels are set by the parameters Gray low
and Gray high.. These parameters can be set in an interactive setup window, which is
opened by clicking the button that is displayed when double-clicking the Value field of the
parameters. In the interactive setup window, all pixels inside the ROI with gray values within
the range are colored blue.
The image is scanned either from the top of the ROI to the bottom, or from the bottom to
the top depending on the setting of the parameter Analysis direction.
This tool requires a non-rotated rectangular ROI. The parameter ROI definition step points
out the program step in which the ROI is created. Note that only ROIs created with the 'ROI
Rectangle' tool are allowed. Do not use a ROI created by another ROI tool.
For some applications it is useful to combine this tool with the 'Find Column' tool to detect
the column as well. In some cases the column and the row could be used to establish the
x- and y-coordinates of the found pixel.
©SICK AG • Advanced Industrial Sensors • www.sick.com • All rights reserved 81
Page 82

Chapter 4 Reference Manual
Edge
IVC-2D
Input Parameters
01 = Source bank
02 = Analysis direction
03 = Gray low
04 = Gray high
05 = Level
06 = Type of transition
07 = ROI definition step
Returned Values
01 = Row
Image bank containing the image to analyze.
Direction of the analysis.
Down→up beginning from the bottom of the ROI.
Up→down beginning from the top of the ROI.
Lower gray value threshold.
Upper gray value threshold.
Amount of pixels with gray values in between Gray low and
Gray high.
Default setting = 2
Pixels
> level Stop when the amount of matching
pixels in the line rises above Level.
Pixels
< level Stop when the amount of matching
pixels in the line sinks below Level.
Selected ROI from a previous program step.
Note that only ROIs created with the 'ROI rectangle' tool
are allowed.
Y-coordinate of the found row.
Error Messages
Err. 107
Error: points out of bank
Check that the ROI is generated by the 'ROI rectangle' tool
and not by a different ROI tool.
82 ©SICK AG • Advanced Industrial Sensors • www.sick.com • All rights reserved
Page 83

Reference Manual Chapter 4
Edge
IVC-2D
Find Column
This tool scans an image along a vertical line to find a column that contains pixels with gray
level values that are in a specified range. Only the part of the image that is inside a ROI is
scanned.
The returned value is the x-coordinate of the found column. In the preview window, the
found column is marked with a yellow line.
The tool will “find” a column (and stop scanning the image) when the column contains a
certain amount of pixels with gray level values within the range. This amount is specified by
the parameter Level, and can be used for making the tool less sensitive for noise in the
image.
Column returned
by the tool
Analysis
Direction
Line along which
the pixels are counted
Pixels with gray
level between
Gray low and
Gray high
ROI
Amount of matching
pixels along the line
30
25
20
15
10
5
0
Level
The parameter Type of transition is used for choosing whether the tool should stop scanning when the amount of matching pixels in the column rises above the amount set in
Level (pixels > level), or when it sinks below the amount set in Level (pixels < level).
The lower and upper limits of the range of gray level values are set by the parameters
Gray low and Gray high. These parameters can be set in an interactive setup window,
which is opened by clicking the button that is displayed when double-clicking the Value field
of the parameters. In the interactive setup window, all pixels inside the ROI with gray values
within the range are colored blue.
The image is scanned either from the left edge of the ROI to the right, or from the right to
the left depending on the setting of the parameter Analysis direction.
This tool requires a non-rotated rectangular ROI. The parameter ROI definition step points
out the program step in which the ROI is created. Note that only ROIs created with the 'ROI
Rectangle' tool are allowed. Do not use a ROI created by another ROI tool.
For some applications it is useful to combine this tool with the 'Find Row' tool to detect the
row as well. In some cases the column and the row could be used to establish the x- and
y-coordinates of the found pixel.
©SICK AG • Advanced Industrial Sensors • www.sick.com • All rights reserved 83
Page 84

Chapter 4 Reference Manual
Edge
IVC-2D
Input Parameters
01 = Source bank
02 = Analysis direction
03 = Gray low
04 = Gray high
05 = Level
06 = Type of transition
07 = ROI definition step
Returned Values
01 = Column
Image bank containing the image to analyze.
Direction of the analysis.
L – R beginning from the left side of the ROI.
R – L beginning from the right side of the ROI.
Lower gray value threshold.
Upper gray value threshold.
Amount of pixels with gray values in between Gray low and
Gray high.
Default setting: 2
Pixels
> level Stop when the amount of matching
pixels in the column rises above Level.
Pixels
< level Stop when the amount of matching
pixels in the column sinks below Level.
Selected ROI from a previously program step. Note that
only ROIs generated by the 'ROI rectangle' tool can be
used.
X-coordinate of the found column.
Error Messages
Err. 107
Error: points out of bank
Check that the ROI is generated by the 'ROI rectangle' tool
and not by a different ROI tool.
84 ©SICK AG • Advanced Industrial Sensors • www.sick.com • All rights reserved
Page 85

Reference Manual Chapter 4
A
IVC-2D
Edge
Find Line Edge
This tool finds edges on a user defined straight line by evaluating how the gray scale
changes along the line. There is an interactive setup and it is recommended to use it to set
the parameters. Double-click the Setup button to open the interactive setup. For more
information on the interactive setup, see on page 218.
There are two evaluation methods to detect transitions/changes of the gray scale.
Evaluation Method 1: Detect Relative Change of Gray Scale
Beginning at the starting point of the line this method detects the first change in the gray
scale that is above the user defined value. The evaluation is based on the derivation of the
histogram along the line. If the first absolute value of the derivation, average out of 4 pixels,
is greater or equal to the user defined threshold the function terminates. In that case the
function returns the coordinates of the first found pixel (X transition, Y transition).
Direction of evaluation
Gray value along the line
User defined threshold of the minimal
required change of gray scale
bsolute derivative of the gray levels (shows
amount of gray scale changes along the
Figure – Evaluation method 1: Detect relative change of gray scale
The figure above shows an example of evaluation method 1. The pixel with the first absolute relative change of gray scale (in direction of evaluation) that is greater or equal to the
threshold is detected. In this case the amount of the last change is ≥ than the threshold.
The red circle indicates the detected point on the blue line. This point corresponds to the
location of the returned X and Y pixel coordinates. Red circle displayed in this example
only.
Evaluation Method 2: Detect Absolute Change of Gray Scale
Beginning at the starting point of the line this method detects if the gray scale enters a
user defined region of gray scale values. The evaluation is based on the absolute values in
the histogram along the line. The region of gray scale values is defined by upper and lower
thresholds. In this mode the function returns each transition into the region of gray scale
values. Note following convention: If the value of the gray scale the starting point of the line
is already in the region of gray scale the starting point itself is a detected point as well. In
this mode the function writes the found pixel coordinates of detected transitions into the
table.
The figure below shows an example of evaluation method 2. The red circles indicate the
detected points in the histogram (green line). Note that only one transition of the gray
scale into the selected region of gray scale is detected. This is due to the fact that the
location of the detected points depends on the direction of evaluation. The red circles
correspond to the location of the returned X and Y coordinates. Red circles displayed in
this example only.
©SICK AG • Advanced Industrial Sensors • www.sick.com • All rights reserved 85
Page 86

Chapter 4 Reference Manual
IVC-2D
Edge
Gray value along the line
User defined upper and lower
threshold
Direction of evaluation
Figure – Evaluation method 2: Detect absolute change of gray scale
The evaluation method and the geometrical definition of the line parameters are selected
by the input parameter Type. The following types are available:
Type
Single &
Cartesian
Single &
Interval
Single &
Polar
Multiple &
Cartesian
Multiple &
Interval
Multiple &
Polar
To reduce the influence of noise the input parameter Average pixels can be set to make
an average of the gray values in up to 10 pixels in line direction. This avoids faulty results
due to the influence on single pixels. This option is available with evaluation method 2:
Detect an absolute change of gray scale values only.
Evaluation
method
1 Cartesian coordinates for start and end point of line.
1 Cartesian coordinates for start point and relative values
1 Cartesian coordinates for start point and distance and
2 Cartesian coordinates for start and end point of line.
2 Cartesian coordinates for start point and relative values
2 Cartesian coordinates for start point and distance and
Line parameters
delta X and delta Y for end point of line.
angle (anti clockwise with respect to x-axes) for end point
of line.
delta X and delta Y for end point of line.
angle (anti clockwise with respect to x-axes) for end point
of line.
86 ©SICK AG • Advanced Industrial Sensors • www.sick.com • All rights reserved
Page 87

Reference Manual Chapter 4
IVC-2D
Edge
Input Parameters
01 = Source bank
02 = Type
03 = Start point X
04 = Start point Y
05 = End point X, width, L
06 = End point Y, height, angle
07 = Gray low
08 = Gray high
09 = Average pixels
10 = Table index
11 = Max stored transitions
12 = Destination bank
Selected image bank for the processing of this
function.
Selects evaluation method and
geometric definition of line parameters (see table
above).
X coordinate for start point of line.
Y coordinate for start point of line.
If Type is Cartesian:
X coordinate for end point of line.
If Type is Interval:
Relative distance delta X to end point of line.
If Type is Polar:
Absolute distance to end point of line.
If Type is Cartesian:
Y coordinate for end point of line.
If Type is Interval:
Relative distance delta Y to end point of line.
If Type is Polar:
Angle with respect to x-axes.
Lower gray value threshold (method 2). Derivative
threshold (method 1).
Upper gray value threshold (method 2). Derivative
threshold (method 1).
Available with evaluation method 2 only.
Allows to average over up to 10 pixels in the line
direction.
Works only for evaluation method 2.
Start index in table to write the found pixel coordina-
tes of transitions in the table.
Works only for evaluation method 2.
Upper limit for stored transitions in the table.
Counts from first found pixel.
Number of the destination bank in which to display
source bank, line and found points. Make sure that
Destination bank is different from Source bank.
Returned Values
01 = Found transitions
02 = X transition
03 = Y transition
Error Messages
Err. = 10
©SICK AG • Advanced Industrial Sensors • www.sick.com • All rights reserved 87
Total number of found transitions.
X coordinate of the first found pixel.
Set to 0 if no transitions were found.
Y coordinate of the first found pixel.
Set to 0 if no transitions were found.
Error in Parameter 10.
Value has to be less than 11.
Page 88

Chapter 4 Reference Manual
IVC-2D
Edge
Find Subpixel Edge
This tool scans the gray values along a user defined line and detects a change of gray
values that is at least of the amount of a user defined threshold. Evaluation begins at the
start point of line and returns the coordinates of the first found edge with subpixel resolution. All evaluation types use a relative threshold and Cartesian coordinates for start and
end point of the line.
Double-clicking on the input field for Threshold and double-clicking again on the button that
appears opens a larger image. In this new window you can set the threshold for the required relative changes of gray values by using a slider on the left side. The first found edge
along the line is marked with a green dot in the image.
Input Parameters
01 = Source bank
02 = Type
03 = Start point X
04 = Start point Y
05 = End point X,
width, L
06 = End point Y,
height, angle
07 = Threshold
08 = Destination Bank
Image bank containing the image to be processed.
Always set to Cartesian.
X coordinate for start point of line.
Y coordinate for start point of line.
X coordinate for end point of line, delta X, distance.
Y coordinate for end point of line, delta Y, angle.
Threshold for required relative change of gray value to
detect an edge.
Image bank in which to draw the line that was searched
along, and lines for the returned X and Y coordinates.
Returned Values
01 = X transition
02 = Y transition
X coordinate of the found edge with subpixel resolution.
Y coordinate of the found edge with subpixel resolution.
88 ©SICK AG • Advanced Industrial Sensors • www.sick.com • All rights reserved
Page 89

Reference Manual Chapter 4
IVC-2D
Edge
Find Multiple Edges
This tool evaluates the variation of gray values and detects edges along a user defined
line. In general two evaluation types are available.
Relative Detects pixels with a gray value variation above a relative gray value
threshold. Additional it’s possible to select the type of transition to detect
only transitions from bright to dark pixels, from dark to bright pixels or any
transition.
Absolute Detects pixels with a gray value variation above or below two absolute
gray value thresholds.
For each evaluation type there exist specific input parameters to optimize the edge detection. The definition of these input parameters is shown in the figures below.
The evaluation starts at start point of line and continues along the line to end point of line.
The tool writes the X and Y coordinates of the detected pixels into a user defined row in
the table. Additionally the tool returns the total number of found transitions along the line.
Double-click the input field for the gray value thresholds and click the button to set the
upper and lower thresholds for the gray values with a slider. Additionally it is possible to set
length and position of the line with the left mouse button. All found edges along the line
with transitions from dark to bright pixels are marked with a blue cross and transitions from
bright to dark pixels with a red cross.
Scan interval:
Distance of pixels that
Scan interval
will be compared.
1 234
Min edge distance:
Number of pixels that
will be skipped if one
edge is found.
Figure – Edge finding with evaluation type Relative, which detects a relative change of gray
values. Note that the Min edge distance value should be greater than the Scan interval value to avoid misplaced results.
Average pixels:
Value 2 means gray values
will be averaged out
of two pixels.
©SICK AG • Advanced Industrial Sensors • www.sick.com • All rights reserved 89
Page 90

Chapter 4 Reference Manual
IVC-2D
Edge
Figure – Edge finding with evaluation type Absolute, which detects an absolute change of
gray values.
Number of consecutive pixels
with values that must be in-
between selected thresholds
Min width:
Scan interval:
Distance of pixels that
will be compared.
1 2
Average pixels:
Value 2 means gray values
will be averaged out
of two pixels.
Input Parameters
01 = Source bank
02 = Type
03 = Start point X
04 = Start point Y
05 = End point X
06 = End point Y
07 = Gray low
08 = Gray high
Image bank containing the image to be processed.
Selected type of threshold and transition type:
Bright -> dark
Relative threshold and only transitions from
bright to dark pixels will be detected.
Dark –> bright
Relative threshold and only transitions from
dark to bright pixels will be detected.
Any relative transition
Relative threshold and any transition will be
detected
Absolute
Absolute threshold and any transitions above
or below the two thresholds will be detected.
X coordinate for start point of line.
Y coordinate for start point of line.
X coordinate for end point of line.
Y coordinate for end point of line.
Lower gray value threshold.
Using any evaluation type with relative thresh-
old this value is the required changes in gray
values.
Upper gray value threshold.
Available only with evaluation type absolute
threshold.
Note that this value will be ignored when using
evaluation type relative threshold.
90 ©SICK AG • Advanced Industrial Sensors • www.sick.com • All rights reserved
Page 91

Reference Manual Chapter 4
IVC-2D
Edge
09 = Average pixels
10 = Min edge distance / Min width Min edge distance
11 = Scan interval
12 = Table index
13 = Max stored transitions
14 = Destination bank
Number of averaged pixels for gray value.
Number of pixels that will be skipped if a
transition is found.
Used with evaluation type relative threshold.
Min width
Number of consecutive pixels that must have
gray values between lower and upper threshold.
Used with evaluation type absolute threshold.
Distance of compared pixels (in pixels).
Start index in table to write the found coordi-
nates.
Upper limit for number of stored transition
coordinates in table.
Note that only transitions up to this number will
be marked with a cross in the image bank. If
Max stored transitions = 0 no found transition
will be marked in the image.
Number of the image bank in which to display
the circle (ellipse) with red marked crosses to
indicate found transitions.
Returned Values
01 = Found transitions
Error Messages
Error 135
Error 136
Total number of found edges.
The line is too short.
The line is too long.
©SICK AG • Advanced Industrial Sensors • www.sick.com • All rights reserved 91
Page 92

Chapter 4 Reference Manual
IVC-2D
Edge
Find Mean of Edges
This tool performs a linear fit on certain pixels in the image. Return values are the mean
position on the fitted line and the deviation from the line of the found pixels.
The pixels for the fit are generated by a gray value evaluation either along selected columns or selected rows. Beginning at the starting point of the column or row the first pixel
showing a change of the gray values that is at least of the amount of a user defined value
is indicated. In general the direction of evaluation is either along the columns or the rows
and is selected by an input parameter.
This tool requires a rectangular non-rotated ROI from a previously performed step. Note
that only ROIs generated by the ‘ROI Rectangle’ tool can be used. Do not use ROIs from
any other ROI tool. Only the columns or rows inside the ROI are considered.
To speed up processing time it is possible to select how many columns or rows inside the
ROI that should be evaluated. The input parameter Scan interval in pixel defines the
equidistant gap between each column or row in pixels. The precision of the linear fit is
increased with the number of columns or rows.
After the gray value evaluation is performed further conditions select the pixels that are
considered for the linear fit. To ignore a single outlier it is possible to allow a maximum
distance from the next found neighbor pixel. To ignore connected pixels it is possible to
define a cluster build with a minimum number of connected pixels. Clusters of this size and
a distance of more than the allowed maximum distance to the next cluster are ignored for
the fit.
Double clicking the input field for the Threshold parameter and double clicking an appearing button opens a larger image. This new window allows setting of the Threshold parameter and displays the found pixels and the fitted line in the image.
The tool returns the coefficients of the equation for the line that represents the edge. The
equation is on the form y = kx+m.
Input Parameters
01 = Source bank
02 = ROI definition step
03 = Analysis direction
04 = Scan interval
05 = Threshold
06 = Pixel distance
07 = Average pixels
08 = Min connected transitions
09 = Destination bank
Image bank containing the image to be processed.
Step number where the ROI to use was created.
Note that only ROIs generated by the 'ROI rectangle'
tool can be used.
Direction of the evaluation to generate pixels for the fit.
The choices are:
Left -> right
Down -> up
Right -> left
Up -> down
Define gap between equidistant spaced columns or
rows in pixels.
To evaluate each column (row) type in 0.
Amount of the minimum required change of gray
values.
Maximum allowed distance in pixel from next found
neighbor pixel.
Allows to average gray values over up to 16 pixels
along the scan direction.
Defines minimum required number of connected pixels
with the allowed distance from next neighbor pixel
(combination with the input parameter Pixel distance).
Number of the destination bank in which to display
source bank, selected pixels and fitted line. Make sure
that Destination bank is different from Source bank.
92 ©SICK AG • Advanced Industrial Sensors • www.sick.com • All rights reserved
Page 93

Reference Manual Chapter 4
IVC-2D
Edge
Returned Values
01 = Mean of transition
02 = Max derivation of regression
03 = Points out of tolerance (%)
04 = Lines without transition (%)
05 = Slope
06 = Y-intercept
Example
The figure below shows an example to Find mean line and margin. Note that red circles are
ignored and are not considered for the linear fit. Chosen input parameters: Tolerance in
pixel = 5 and Filter in steps on isolated points = 3. Due to the fact that all pixels with a
distance of more than 5 pixels to the next found neighbor pixel are ignored (indicated with
A in the figure). Additionally all clusters with less than 4 connected pixels and a distance of
more than 5 pixels to the next found neighbor pixel are ignored as well (indicated with B in
the figure).
Returns the mean X respectively Y
coordinate of all fitted pixels (depends
on the evaluation direction).
Maximum distance from the fitted line
in pixel (depends on the evaluation
direction).
Percentage of the found pixels which
will not be considered for the linear fit
Percentage of evaluated columns
(rows) without the required transitions
in gray values.
This is the slope of the line, i.e. the
value of k in the line equation.
Indicates where the line crosses the
Y-axis, i.e. the value of m in the line
equation.
A
B
Figure – Evaluation direction is from top to bottom. Dashed yellow box indicates selected
ROI. Blue circles: found pixels which will be considered for the linear fit, red circles: found
pixels but ignored and not considered for the linear fit, green circles: fitted mean line. The
table below the image shows the result parameters.
©SICK AG • Advanced Industrial Sensors • www.sick.com • All rights reserved 93
Page 94

Chapter 4 Reference Manual
IVC-2D
Edge
Find Circle Edges
This tool evaluates the variation of gray values and detects edges along the circumference
of a circle or ellipse. In general two evaluation types are available.
Relative evaluation: This type detects pixels with a gray value variation above a
relative gray value threshold.
Absolute evaluation: This type detects pixels with a gray value variation above or
below two absolute gray value thresholds.
Each evaluation type has specific input parameters to optimize the edge detection. The
definition of these input parameters is shown in the figures below.
The evaluation starts at the horizontal axis of the circle (ellipse) and continues counter
clockwise along the circumference.
The tool writes the X and Y coordinates of the detected pixels into a user defined row in
the table. Additionally the tool returns the total number of indicated pixels and sets an error
flag to control the correct execution.
To set the thresholds with a slider, double-click the input field for the gray value threshold
and click the appearing button that opens a larger image. Use the left mouse button to
move the slider. It is also possible to set the shape and position of the circle (ellipse) with
the left mouse button in this window. All found edges on the circumference are marked
with red crosses.
Scan interval:
Distance of pixels that
Scan interval
will be compared.
1 234
Min edge distance:
Number of pixels that
will skipped if one edge
was found.
Figure – Edge finding using relative evaluation.
A relative change of gray values is detected. Note that the Min edge distance value should
be greater than the Scan interval value to avoid misplaced results.
Average pixels:
Value 2 means gray values
will be averaged out
of two pixels.
94 ©SICK AG • Advanced Industrial Sensors • www.sick.com • All rights reserved
Page 95

Reference Manual Chapter 4
IVC-2D
Edge
Scan interval:
Distance of pixels that
will be compared.
1 2
Min width:
Number of consecutive pixels
with values that must be in-
between selected thresholds
Figure – Edge finding using Absolute evaluation.
Input Parameters
01 = Source bank
02 = Type
03 = X center
04 = Y center
05 = X radius
06 = Y radius
07 = Gray low
08 = Gray high
09 = Type of transition
10 = Scan interval
11 = Average pixels
12 = Min edge distance
Selected image bank for the processing of this
function
Selected type of threshold
Absolute sensitive to absolute variations of gray
values.
Relative sensitive to relative variations of gray
values (Input parameter Gray high will
be ignored)
X coordinate of the circle or ellipse center.
Y coordinate of the circle or ellipse center.
Value of the radius in X direction.
Value of the radius in Y direction.
Lower gray value threshold.
When using evaluation type Relative, this value
is the required change in gray values.
Upper gray value threshold.
Note that this value will be ignored when using
evaluation type Relative threshold.
Only available with evaluation type Relative. Note
that this value will be ignored when using evaluation
type absolute threshold.
Defines direction of evaluated gray value transitions.
1 = transitions from dark to bright.
–1 = transitions from bright to dark.
0 = transitions in both directions.
Distance of compared pixels (in pixels).
Number of averaged pixels for gray value.
Only available with evaluation type Relative. Note
that this value will be ignored when using evaluation
type Absolute.
Number of pixels that will be skipped if a transition
is found.
Average pixels:
Value 2 means gray values
will be averaged out
of two pixels.
©SICK AG • Advanced Industrial Sensors • www.sick.com • All rights reserved 95
Page 96

Chapter 4 Reference Manual
IVC-2D
Edge
13 = Min width
14 = Table Index
15 = Max stored transitions
16 = Destination bank
Returned Values
01 = Error flag
02 = Found edges
Only available with evaluation type Absolute. Note
that this value will be ignored when using evaluation
type Relative.
Number of consecutive pixels that must have gray
values between lower and upper threshold.
Start index in table to write the found coordinates.
Upper limit for number of stored transition coordi-
nates in table.
Number of image bank to display the circle (ellipse)
with red marked crosses to indicate found transitions.
Flag = 0 if the function was executed correctly.
Total number of found transitions.
96 ©SICK AG • Advanced Industrial Sensors • www.sick.com • All rights reserved
Page 97

Reference Manual Chapter 4
IVC-2D
Measure
4.5 Measure
Note:
Centroid
This tool finds all pixels inside a ROI with gray values between a lower and an upper threshold. The tool returns the coordinates of the center of gravity (centroid) of the found pixels
area.
Double-click the input field for lower and upper threshold and double-click the appearing
button. This opens an interactive window. This new window allows setting lower and upper
threshold with a slider and shows the image with the found pixels colored.
If no pixels with gray values between Gray low and Gray high are found inside the ROI, the
resulting coordinates of the centroid are (0,0).
Input Parameters
01 = Source bank
02 = ROI definition step
03 = Gray low
04 = Gray high
05 = Destination bank
Returned Values
Selected image bank for the processing of
this tool.
Select ROI from a previously program step.
Threshold for lower gray value.
Threshold for upper gray value.
Number of the image bank in which to
show the image with colored pixels and
calculated centroid.
01 = X center
02 = Y center
X coordinate of calculated center of gravity.
Y coordinate of calculated center of gravity.
©SICK AG • Advanced Industrial Sensors • www.sick.com • All rights reserved 97
Page 98

Chapter 4 Reference Manual
IVC-2D
Measure
Area
This tool calculates how many pixels inside a ROI that have a gray value between a lower
and an upper threshold. All found pixels inside the lower and upper threshold are defined
as “pixels in range” and all pixels outside this region of gray values are defined as “pixels
out of range”. Return values are the total number of pixels in range (within the region of
gray values) and pixels out of range (outside the region of gray values).
Double-click the input field for Gray high and Gray low and click the appearing button to
set the gray values with a slider. All pixels inside the ROI with gray values in between the
two thresholds are colored according to the parameter Color for marking pixels in range
and the pixels outside the thresholds are not affected.
Input Parameters
01 = Source bank
02 = ROI definition step
03 = Gray low
04 = Gray high
05 = Color for marking pixels
in range
Returned Values
01 = Pixels in range
02 = Pixels out of range
Selected image bank for the processing of this
tool
Select ROI from a previous program step.
Threshold for lower gray value.
Threshold for upper gray value.
The pixels inside the ROI that are between the
two thresholds are marked with this color
Total number of found pixels between the
lower and upper threshold.
Total number of found pixels outside the lower
and upper threshold.
98 ©SICK AG • Advanced Industrial Sensors • www.sick.com • All rights reserved
Page 99

Reference Manual Chapter 4
IVC-2D
Measure
Note:
Single Blob Analysis
This tool counts all connected pixels with gray values between a lower and an upper
threshold beginning at a defined starting point in the image. It is possible to mark all found
pixels with a color. Return values are the total number of found pixels and the centroid
coordinates of the found pixels.
The lower and upper threshold for the gray values can be set with a slider in an interactive
setup window, which also shows the image with the found pixels marked with the selected
color. To open the interactive window, double-click on the input field for lower or upper
threshold and double-click again on the button that is displayed by the field.
If the starting point is at a place at which the gray value is not in between Gray low and
Gray high, the resulting centroid is (0,0) and the number of counted pixels is of course 0.
Input Parameters
01 = Source bank
02 = Start point X
03 = Start point Y
04 = Gray low
05 = Gray high
06 = Color
07 = Destination bank
Image bank containing the image to analyze.
X coordinate to start evaluation of gray values.
Y coordinate to start evaluation of gray values.
Threshold for lower gray value.
Threshold for upper gray value.
Select color to mark found pixels. Double-clicking
opens a color table.
Number of image bank to show image with colored
pixels and calculated centroid.
Returned Values
01 = Found pixels
02 = X center
03 = Y center
Example
Starting point
Total number of found pixels between lower and
upper threshold.
X coordinate of calculated centroid.
Y coordinate of calculated centroid.
Gray High = 243
Gray Low = 74
Gray High = 200
Gray Low = 74
©SICK AG • Advanced Industrial Sensors • www.sick.com • All rights reserved 99
Page 100

Chapter 4 Reference Manual
IVC-2D
Measure
Notes:
Perimeter
This tool traces the contour of a blob. It requires an input starting point which should be
located inside or to the left of the blob. The contour of the blob must be completely inside
the image. The coordinates of the input starting point are usually a result from a previously
executed step, for example of the Edge category. Beginning at the starting point this tool
starts searching from left to right for the nearest edge on the horizontal line through this
point. The search is done in a binarized image which set by the thresholds Gray low and
Gray high.. When the edge is found the perimeter is traced along the object.
Double-click on the input field for the gray value thresholds and double-click again on the
appearing button. This opens an interactive window. This new window allows setting the
upper and lower thresholds for the gray values with a slider. The found contour pixels are
displayed in red color in the image.
This tool is useful for generating object specific ROIs in combination with the 'ROI perimeter' tool.
1. The input starting point is not necessarily on the found contour (see examples below).
2. If the input starting point is outside of the blob, this tool finds white blobs best if the
starting point is at the left of the blob and black blobs best, if the starting point is on the
right of the blob. However, it is strongly recommended not to use any starting point outside of the contour.
Input Parameters
01 = Source bank
02 = Start point X
03 = Start point Y
04 = Gray low
05 = Gray high. Threshold for upper gray value of allowed contour pixels.
06 = Destination bank
Selected image bank for the processing of this tool.
X coordinate of starting point to trace contour. Normally
this value is a result value form a previously executed step
of the Edge category.
Y coordinate of starting point to trace contour. Normally
this value is a result value form a previously executed step
of the Edge category.
Threshold for lower gray value of allowed contour pixels.
Number of image bank to plot the found contour pixels.
Returned Values
01 = Error flag
02 = Perimeter length
Error Messages
Err. = 119
Err. = 118
Examples
input starting point
contour starting point
Flag = 0 if the tool was executed correctly
Flag = -1 if no contour was found or in case of an error.
Total number of pixels along the perimeter of the traced
contour. The upper limit is 2500 pixels.
Parts of the contour are out of the FOV or no start point to
trace the contour was found. Check thresholds for gray
values.
Number of found contour pixels is less then 20. Check
thresholds for gray values.
100 ©SICK AG • Advanced Industrial Sensors • www.sick.com • All rights reserved
 Loading...