

Page 1
(English)
User's Manual
UM-SCL0A-005
SHIMANO CONNECT Lab
User's Manual
Check our website for the latest manuals.
https://si.shimano.com
Page 2

Contents
Introduction..................................................................................................... 4
About this manual ...............................................................................................4
Recommended Web browser ..............................................................................5
About SHIMANO CONNECT Lab..................................................................... 6
Registering a SHIMANO ID ..................................................................................6
• Using a social network account ............................................................................................................... 6
• Registering with an email address .......................................................................................................... 7
Logging in / logging out......................................................................................9
• Logging in ................................................................................................................................................. 9
• Logging out .............................................................................................................................................. 9
Screen composition....................................................................................... 10
Screen layout......................................................................................................10
Header ................................................................................................................11
Menu...................................................................................................................12
Loading activity............................................................................................. 13
Checking activity........................................................................................... 15
Viewing the dashboard .....................................................................................15
• Activity screen display ............................................................................................................................15
Checking the statistics and power curve ..........................................................17
• Statistics window .................................................................................................................................... 17
• Power curve window ............................................................................................................................. 18
Displaying activity in the calendar format .......................................................20
• Activity view ........................................................................................................................................... 20
Displaying the activity list..................................................................................22
• Filtering the displayed activity list ........................................................................................................ 23
Analyzing activity ......................................................................................... 24
About the activity analysis screen.....................................................................24
About the common area ...................................................................................26
General ...............................................................................................................27
Performance .......................................................................................................29
2
Page 3

• Power curve ............................................................................................................................................ 30
• Histogram ............................................................................................................................................... 31
Pedaling skill ......................................................................................................33
• Force vector / pedaling graph per rotation .......................................................................................... 34
• Histogram ............................................................................................................................................... 35
• Scatter chart ........................................................................................................................................... 35
• Average of pedaling skill .......................................................................................................................36
Shifting ...............................................................................................................37
• Scatter chart ........................................................................................................................................... 38
Interval area .......................................................................................................39
• Interval selection .................................................................................................................................... 39
• Lap ........................................................................................................................................................... 39
• Highlights ............................................................................................................................................... 40
Changing settings......................................................................................... 43
About settings....................................................................................................43
Setting user information ...................................................................................44
Setting the display preferences.........................................................................46
Setting a private location ..................................................................................47
Setting the view of the dashboard ...................................................................49
Setting a parameter group................................................................................50
Setting the items to display in the activity list .................................................51
Importing activity data ......................................................................................52
Exporting activity data ......................................................................................53
Resetting the password for SGX-CA600 or Cyclo-Sphere Control...................54
Glossary ......................................................................................................... 55
FAQ ................................................................................................................ 60
About this document.................................................................................... 61
Registered trademarks and trademarks...................................................... 62
3
Page 4
Introduction
About this manual
Introduction
About this manual
This user's manual describes how to use SHIMANO CONNECT Lab.
Make sure to read the entire manual before use, so that you can make the most of the functions.
This manual uses examples of screens displayed in a Web browser on a computer.
The screen display differs on a smartphone.
4
Page 5
Introduction
Recommended Web browser
Recommended Web browser
This service uses JavaScript. If JavaScript is disabled in the Web browser settings, the application may not
be displayed or operate correctly. Enable JavaScript in the Web browser settings.
Windows
Latest version of Google Chrome
Latest version of Mozilla Firefox
Mac OS
Latest version of Google Chrome
Latest version of Apple Safari
Android
Latest version of Google Chrome
iOS
Latest version of Apple Safari
®
5
Page 6
About SHIMANO CONNECT Lab
Registering a SHIMANO ID
About SHIMANO CONNECT Lab
Registering a SHIMANO ID
A SHIMANO ID must be registered to use the service.
Using a social network account
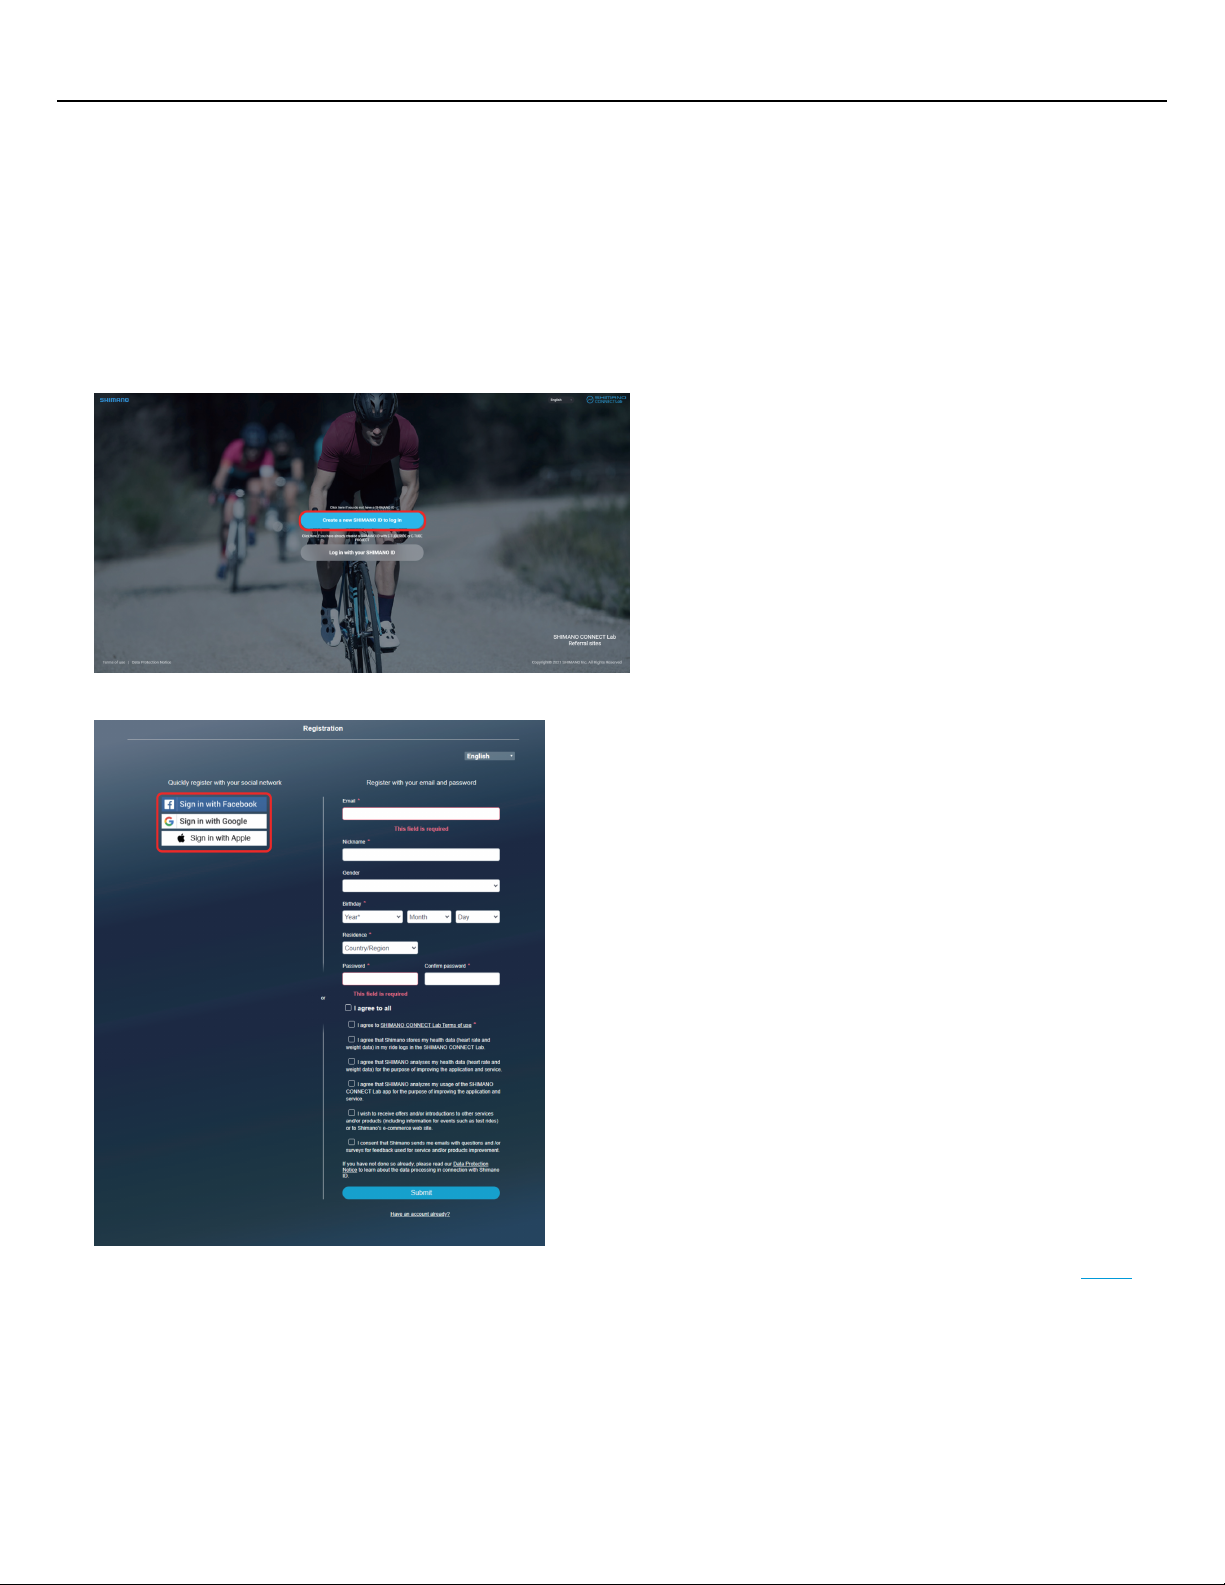
Select [Create a new SHIMANO ID to log in] on the title page of SHIMANO CONNECT Lab.1.
Select the social network to use.
2.
The function for logging in via Twitter account is no longer available as of the end of July, 2023. See here for
details.
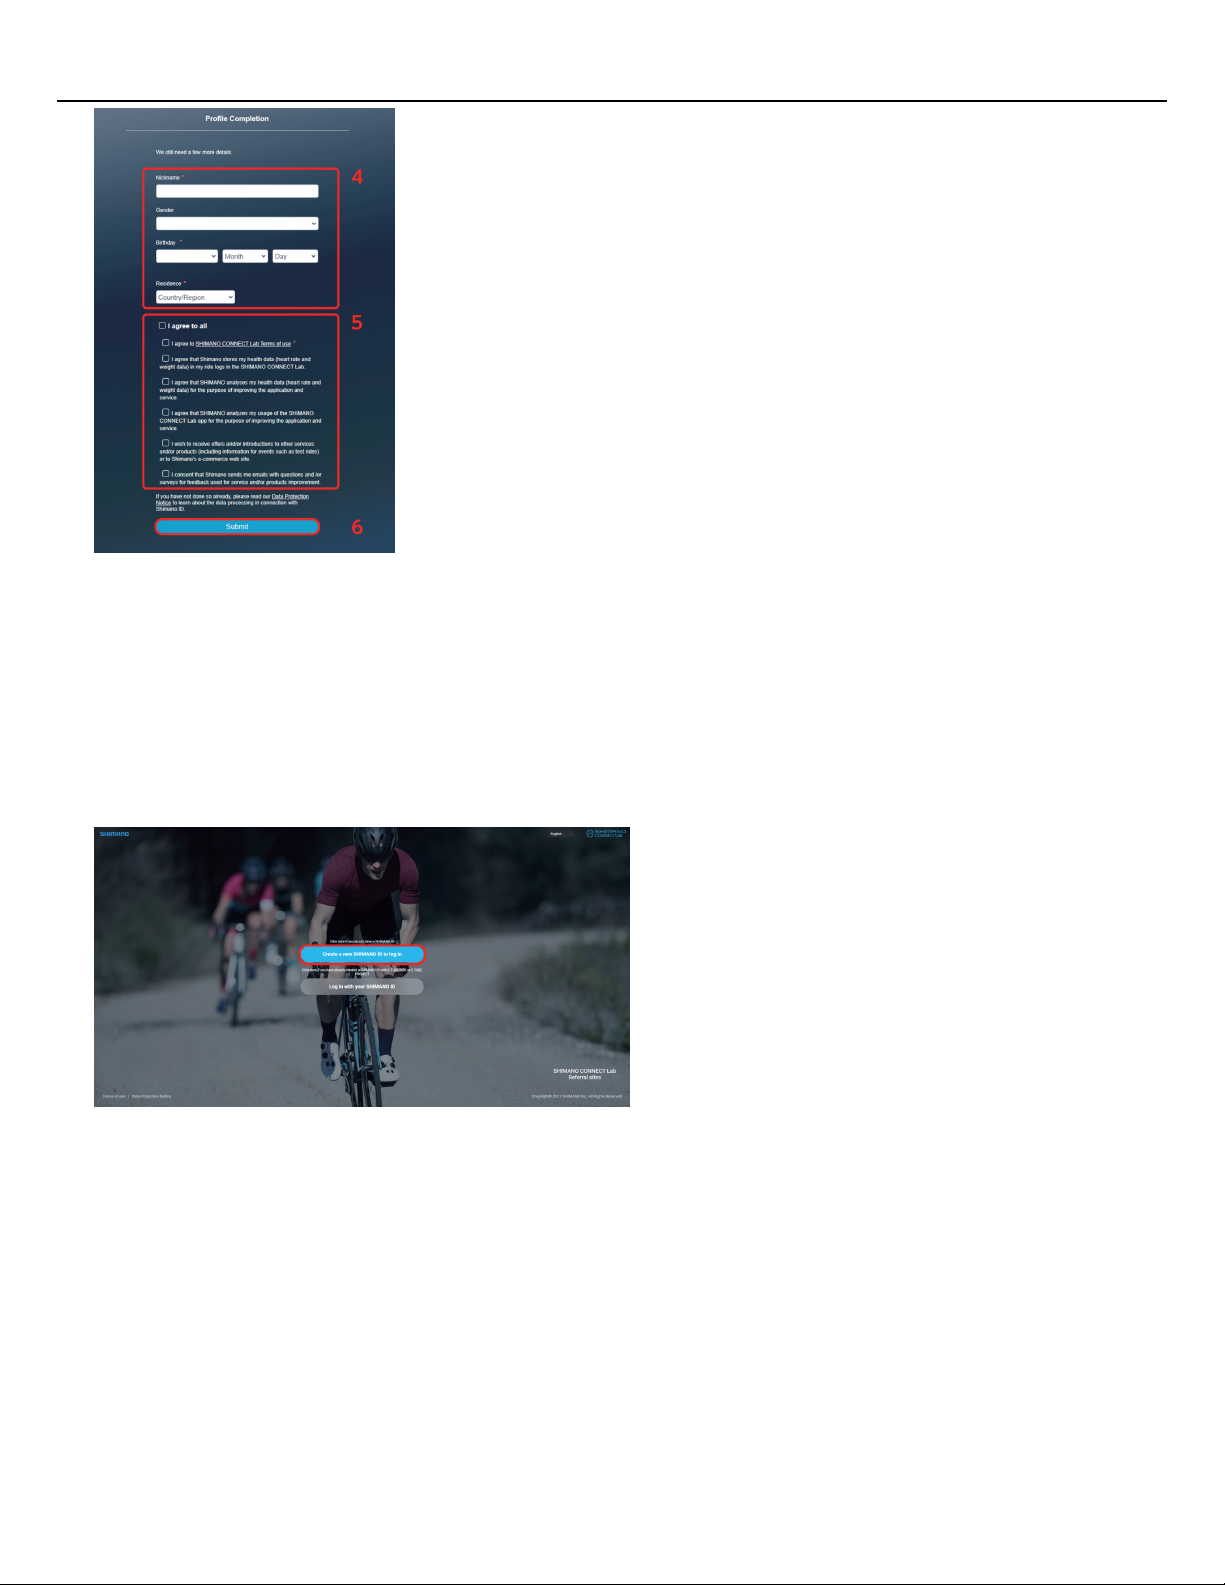
Log in to the social network.3.
Enter the various items.
4.
Items indicated with an asterisk [*] are required.
6
Page 7
About SHIMANO CONNECT Lab
Registering a SHIMANO ID
Confirm the items on the screen, such as the usage conditions, and select the check box if you agree.5.
Select [Submit].6.
Select [OK].
7.
SHIMANO CONNECT Lab links with the selected social network, and you can log in with a social network
account.
Registering with an email address
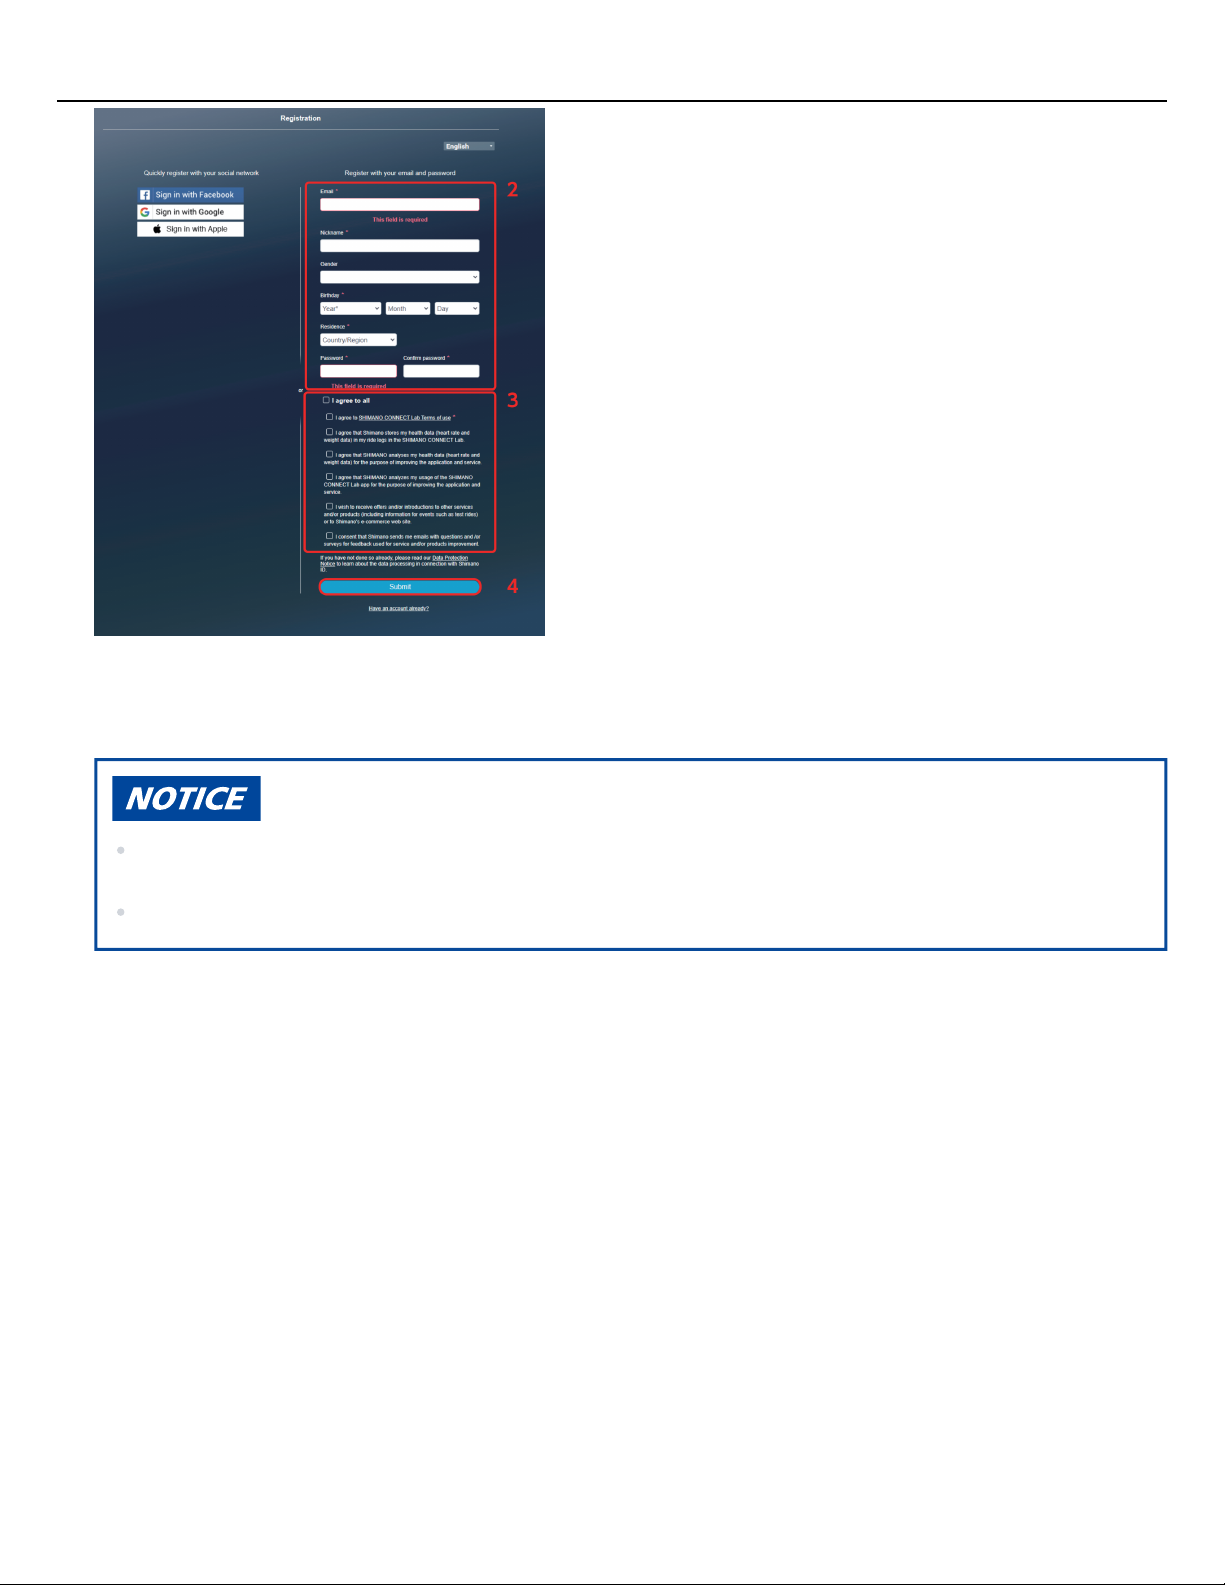
Select [Create a new SHIMANO ID to log in] on the title page of SHIMANO CONNECT Lab.1.
Enter the various items.
2.
Items indicated with an asterisk [*] are required.
7
Page 8
About SHIMANO CONNECT Lab
Registering a SHIMANO ID
Confirm the items on the screen, such as the usage conditions, and select the check box if you agree.3.
Select [Submit].
4.
An email for confirming the email address is sent to the specified email address.
Perform the email address authorization procedure within 24 hours. If 24 hours have elapsed, perform
user registration again.
If the e-mail does not arrive, check your inbox settings, spam folder, etc.
Select the link or URL in the email.5.
The email address authentication screen is displayed, and you will be logged in to SHIMANO CONNECT Lab.6.
8
Page 9
About SHIMANO CONNECT Lab
Logging in / logging out
Logging in / logging out
Logging in
A SHIMANO ID must be registered in advance.
Make sure to log out when you are signed in from a public computer, such as a computer at an internet
cafe.
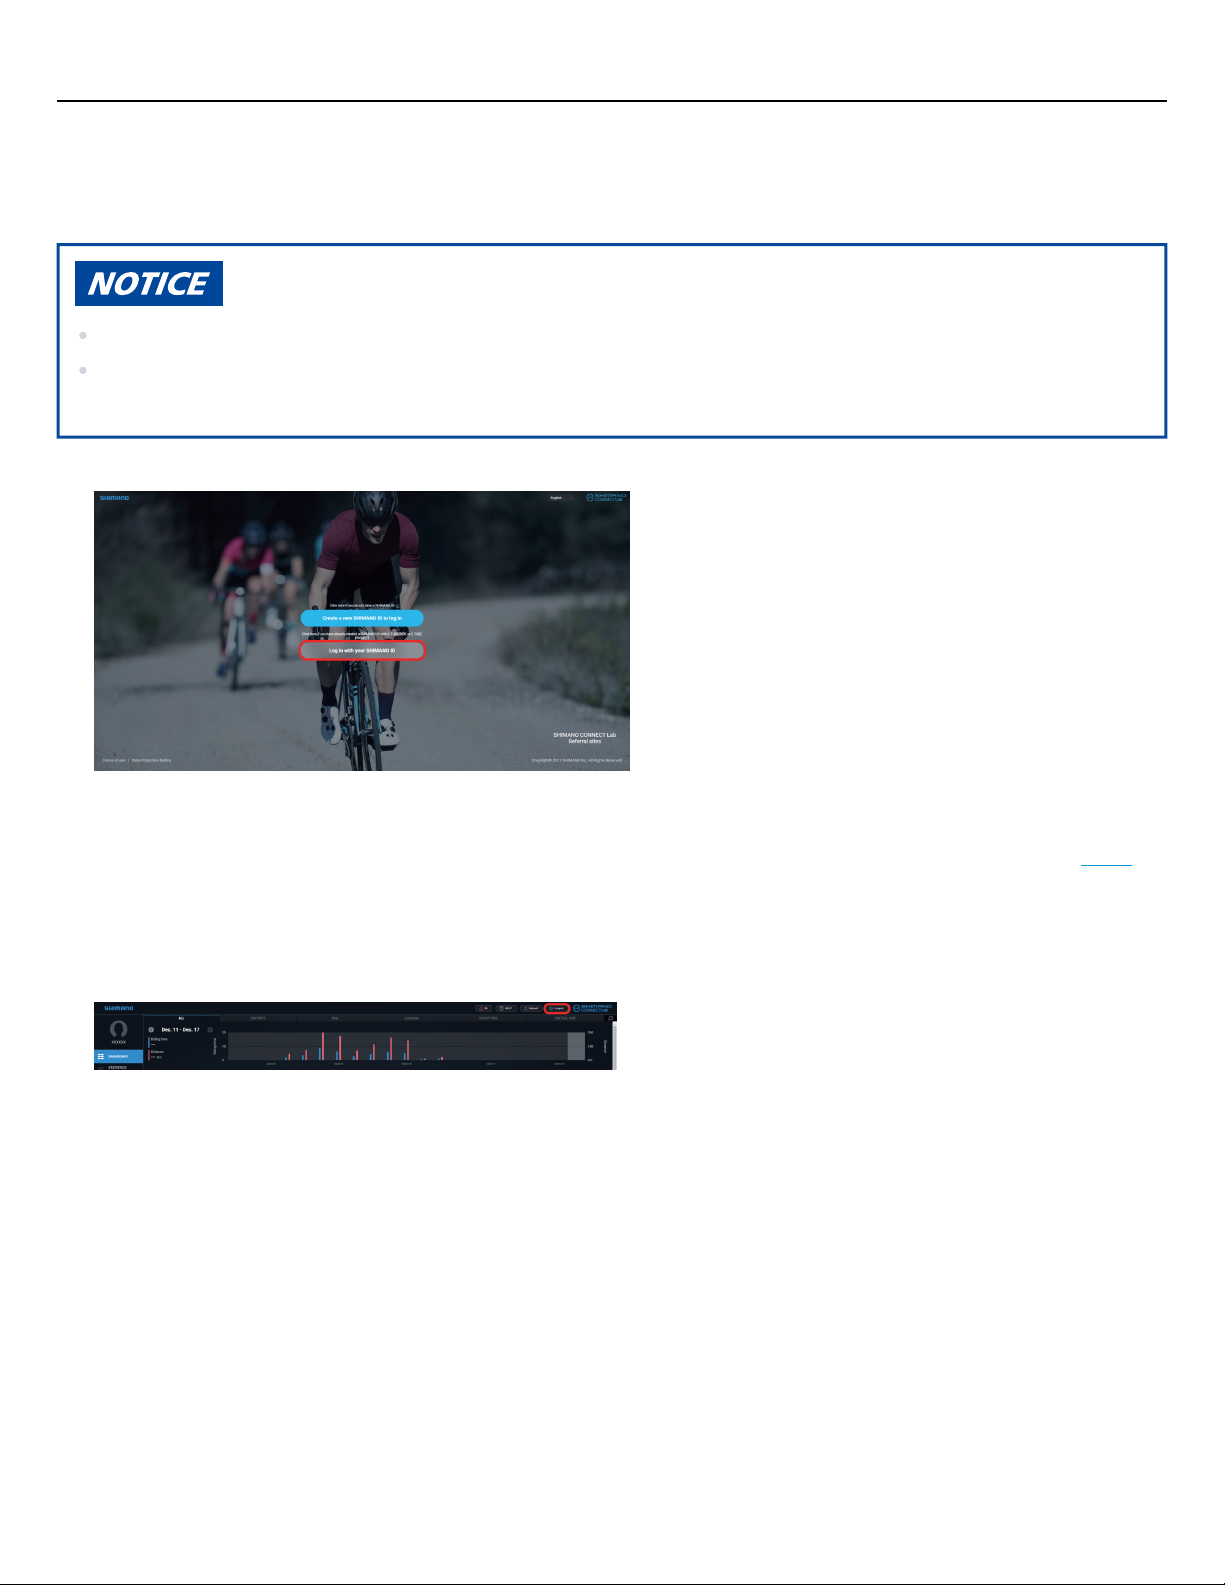
Select [Log in with your SHIMANO ID] on the title page of SHIMANO CONNECT Lab.1.
Select the social network to use for logging in or enter your email address and password, then select
2.
[Submit].
The function for logging in via Twitter account is no longer available as of the end of July, 2023. See here for
details.
Logging out
Select [Logout] on the top right of the screen.1.
Select [OK].2.
9
Page 10
Screen composition
Screen layout
Screen composition
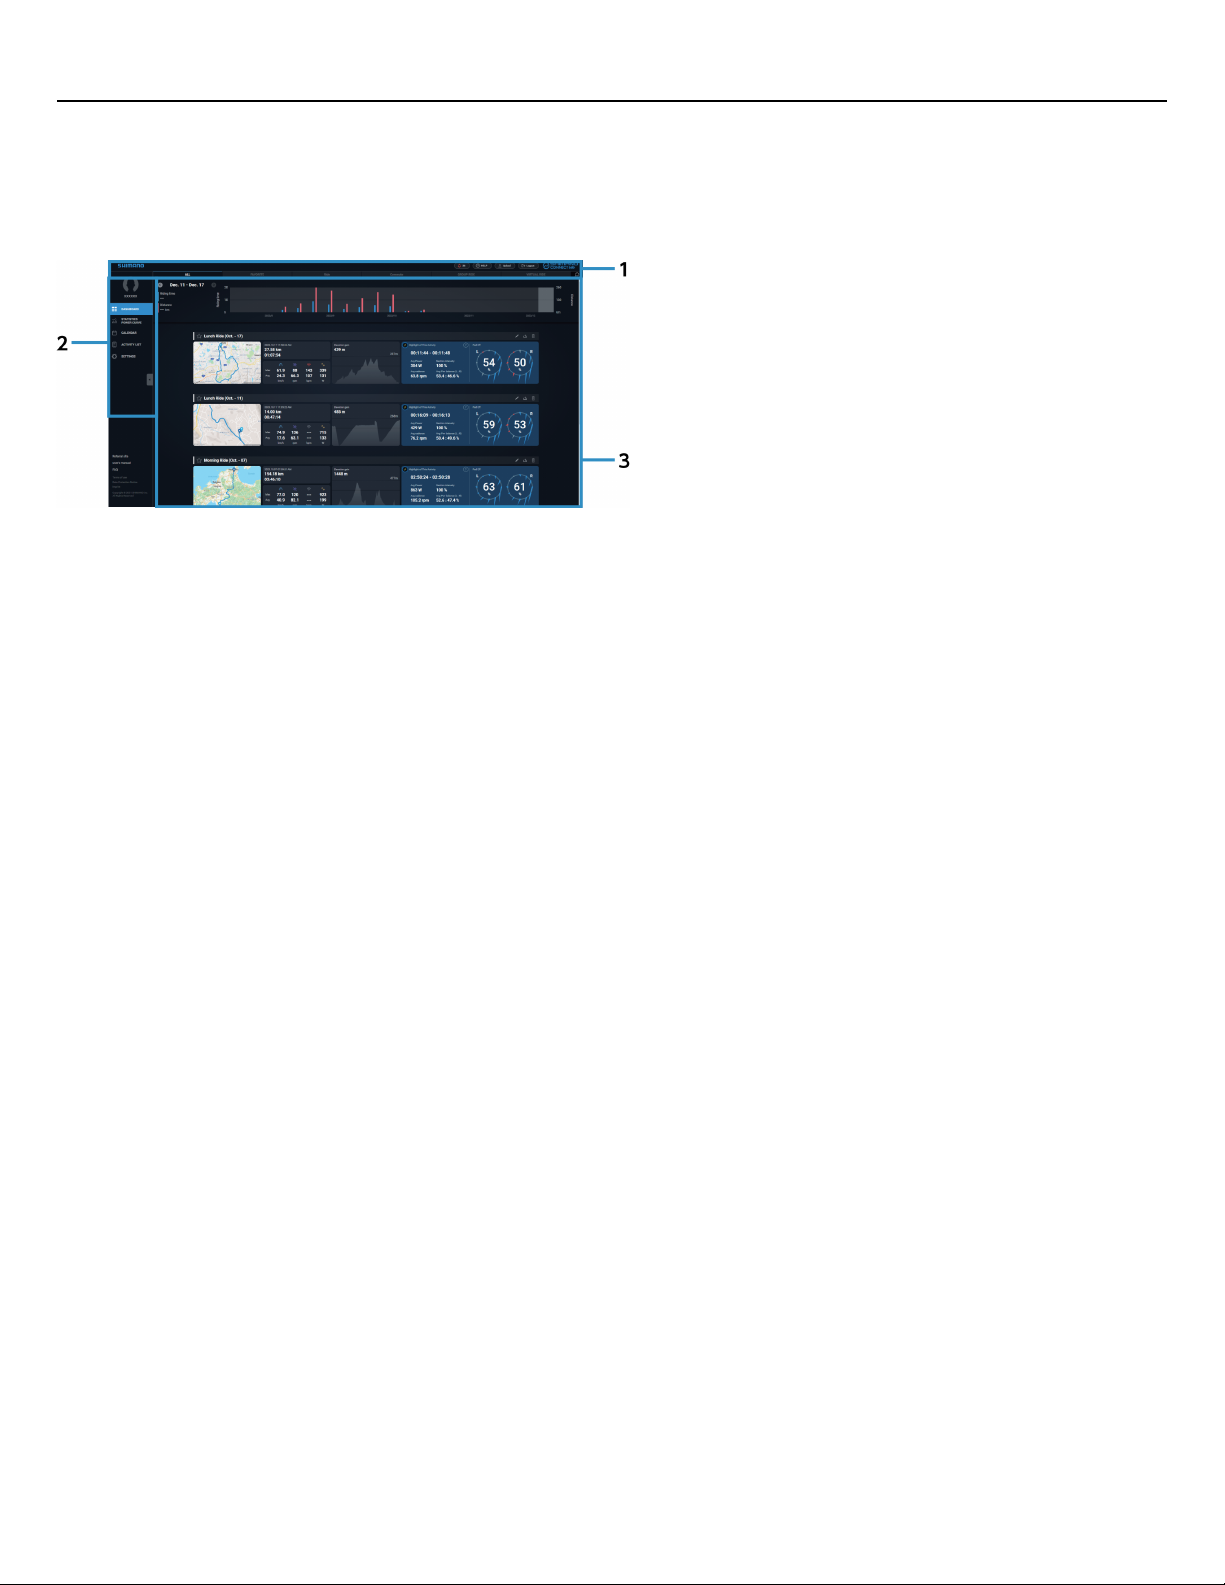
Screen layout
Header(1)
Menu(2)
Content area
(3)
Displays the content selected in the menu.
10
Page 11
Screen composition
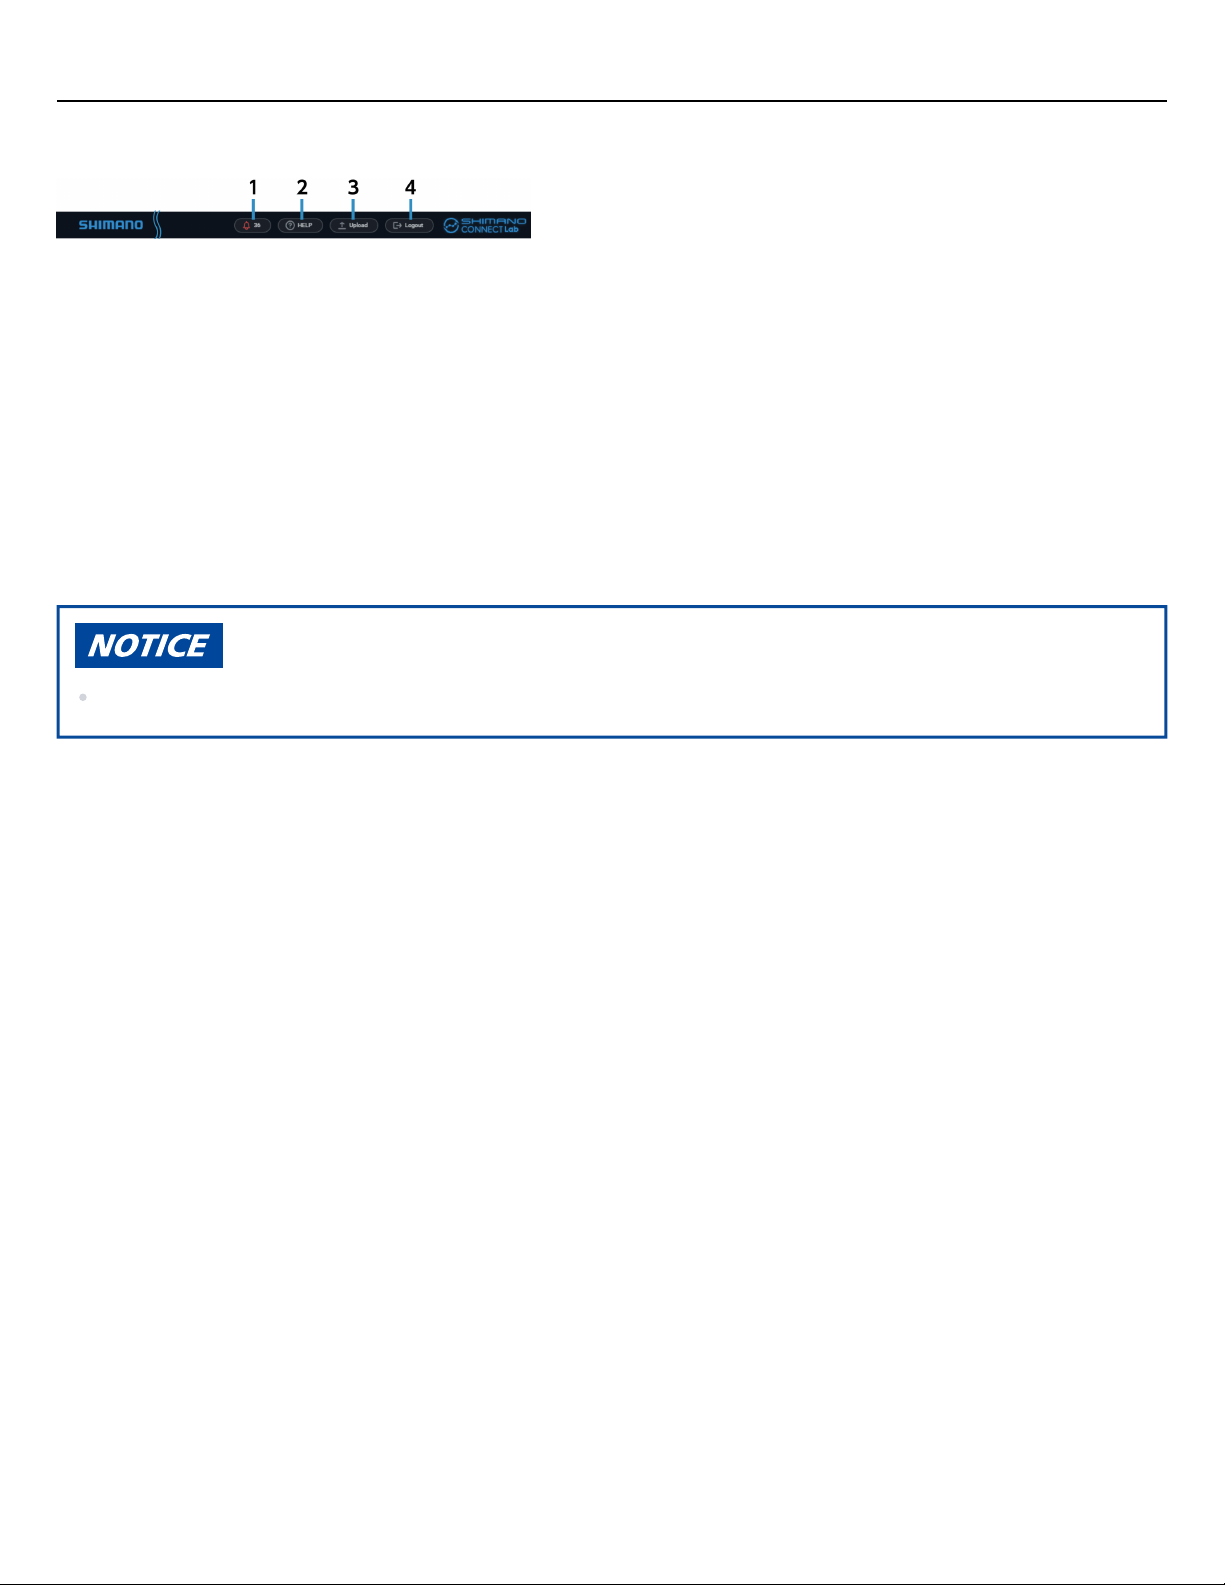
Header
Header
Notifications
(1)
Displays the number of notifications received.
Select to display the content of the notifications.
Help
(2)
The user's manual is displayed.
Upload
(3)
Uploads activity data to SHIMANO CONNECT Lab.
The data can also be forwarded to a linked Web service at the same time.
Logout
(4)
Logs out.
On a smartphone, activity data cannot be uploaded and help cannot be displayed.
11
Page 12
Screen composition
Menu
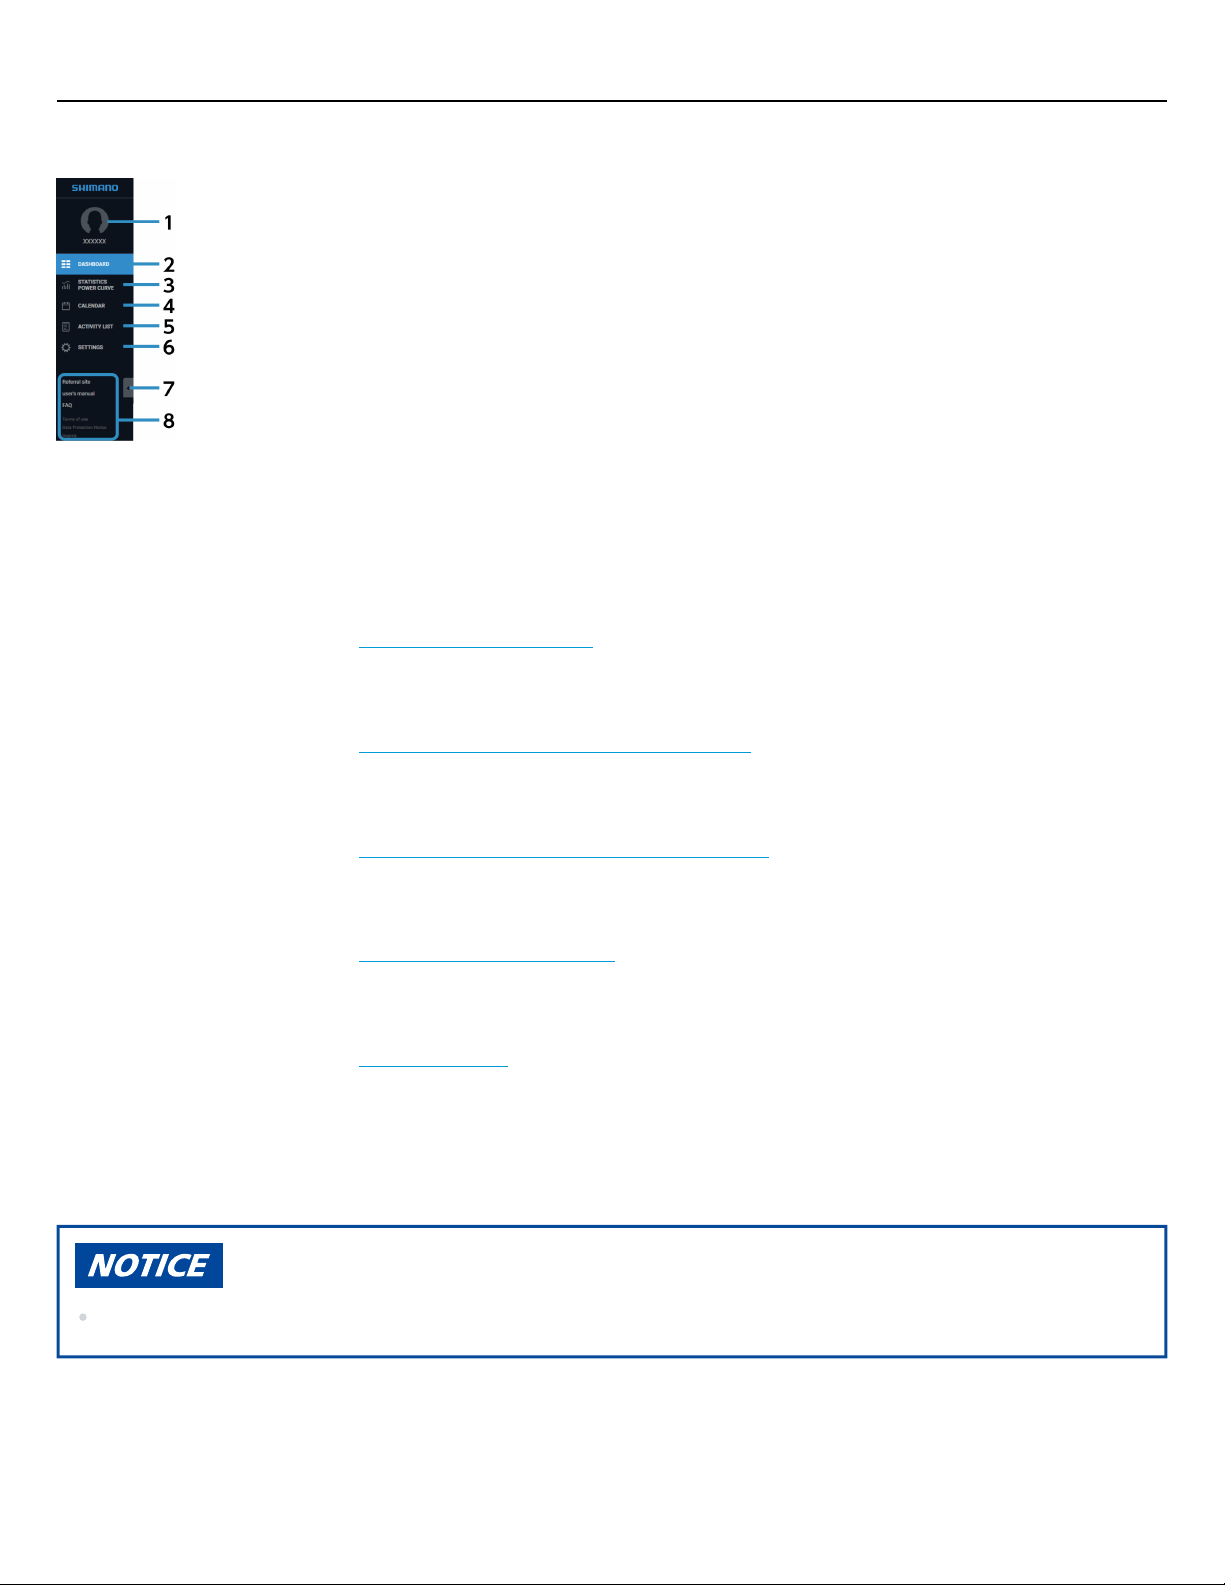
Menu
Profile picture/username
(1)
Displays the profile picture and username set on the setting screen.
Select to display the setting screen.
Dashboard
(2)
Displays recent statistics and activity information.
For details, refer to the “ Viewing the dashboard ” section.
Statistics / Power Curve
(3)
Displays statistics and the power curve.
For details, refer to the “ Checking the statistics and power curve ” section.
Calendar
(4)
Enables you to check activity in the calendar format.
For details, refer to the “ Displaying activity in the calendar format ” section.
Activity list
(5)
Searches activity with various conditions and displays the results in a list.
For details, refer to the “ Displaying the activity list ” section.
Settings
(6)
You can configure user settings, screen display settings, and the Web link service.
For details, refer to the “ About settings ” section.
Minimize menu
(7)
Hides the menu text and expands the content area.
Link
(8)
Links to the official website, manual, FAQ, and other information for SHIMANO CONNECT Lab.
If you are using a smartphone, the activity list is not displayed.
12
Page 13
Loading activity
Loading activity
By loading activity data (ride logs saved as a file by a cycle computer or other recording device) to SHIMANO
CONNECT Lab, you can display graphs of information such as the speed, cadence, and power included in the
activity, and display travel paths on the map.
First, use one of the following methods to load the activity before using SHIMANO CONNECT Lab:
Importing activity data from other companies services
Uploading activity data output from a cycle computer
Importing activity data from other companies services
If you are using one of the following Web services from other companies, you can automatically import activity
data that has been uploaded to the service to SHIMANO CONNECT Lab.
Garmin Connect
Wahoo Fitness
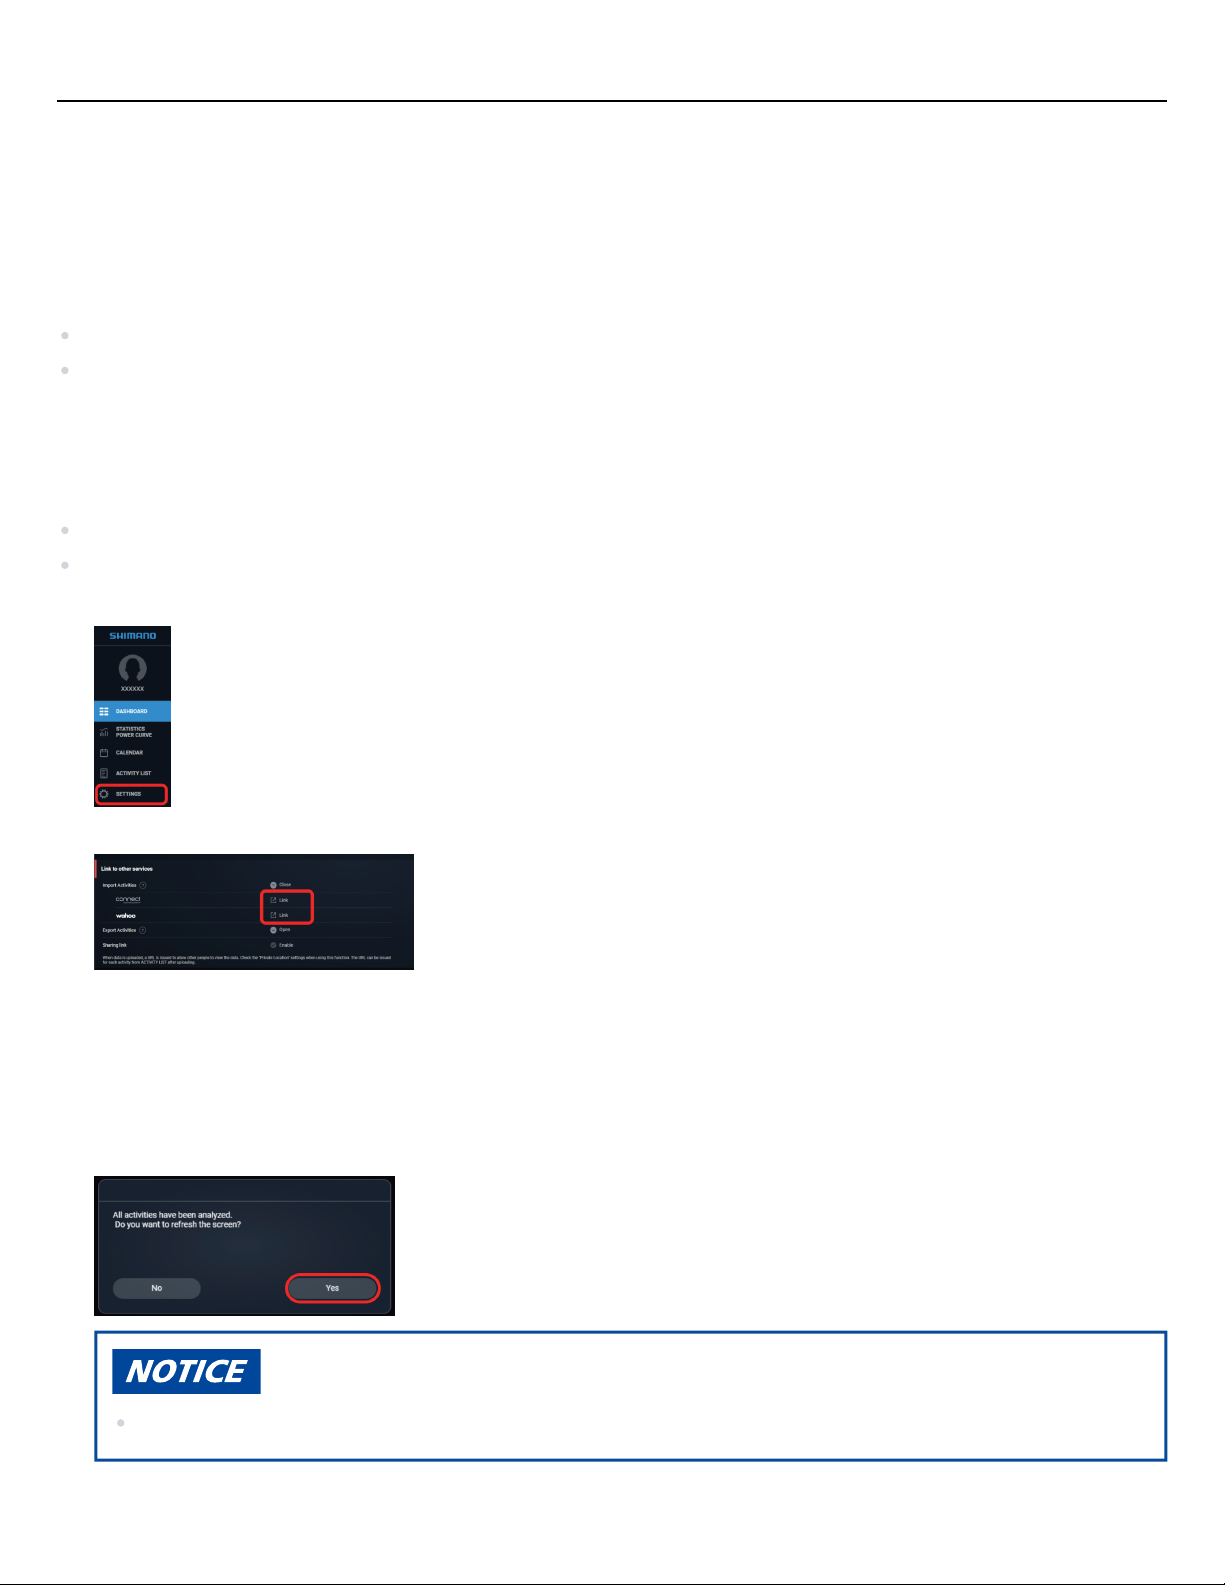
Select [SETTINGS] in the menu.1.
™
Select [Link] for the Web service you are using from [Import Activities] in [Link to other services].2.
Log in to the service, then follow the instructions on the screen to share the activity data with SHIMANO
3.
CONNECT Lab.
When the link settings are complete, return to the screen for SHIMANO CONNECT Lab.
Data analysis starts when importing of the activity data is complete.
4.
The situations of analysis are displayed in the header notifications. Select [Yes] in the dialog indicating that
analysis of all activities is complete.
Activity analysis may take some time.
13
Page 14
Loading activity
Uploading activity data
You can upload activity data output from a cycle computer.
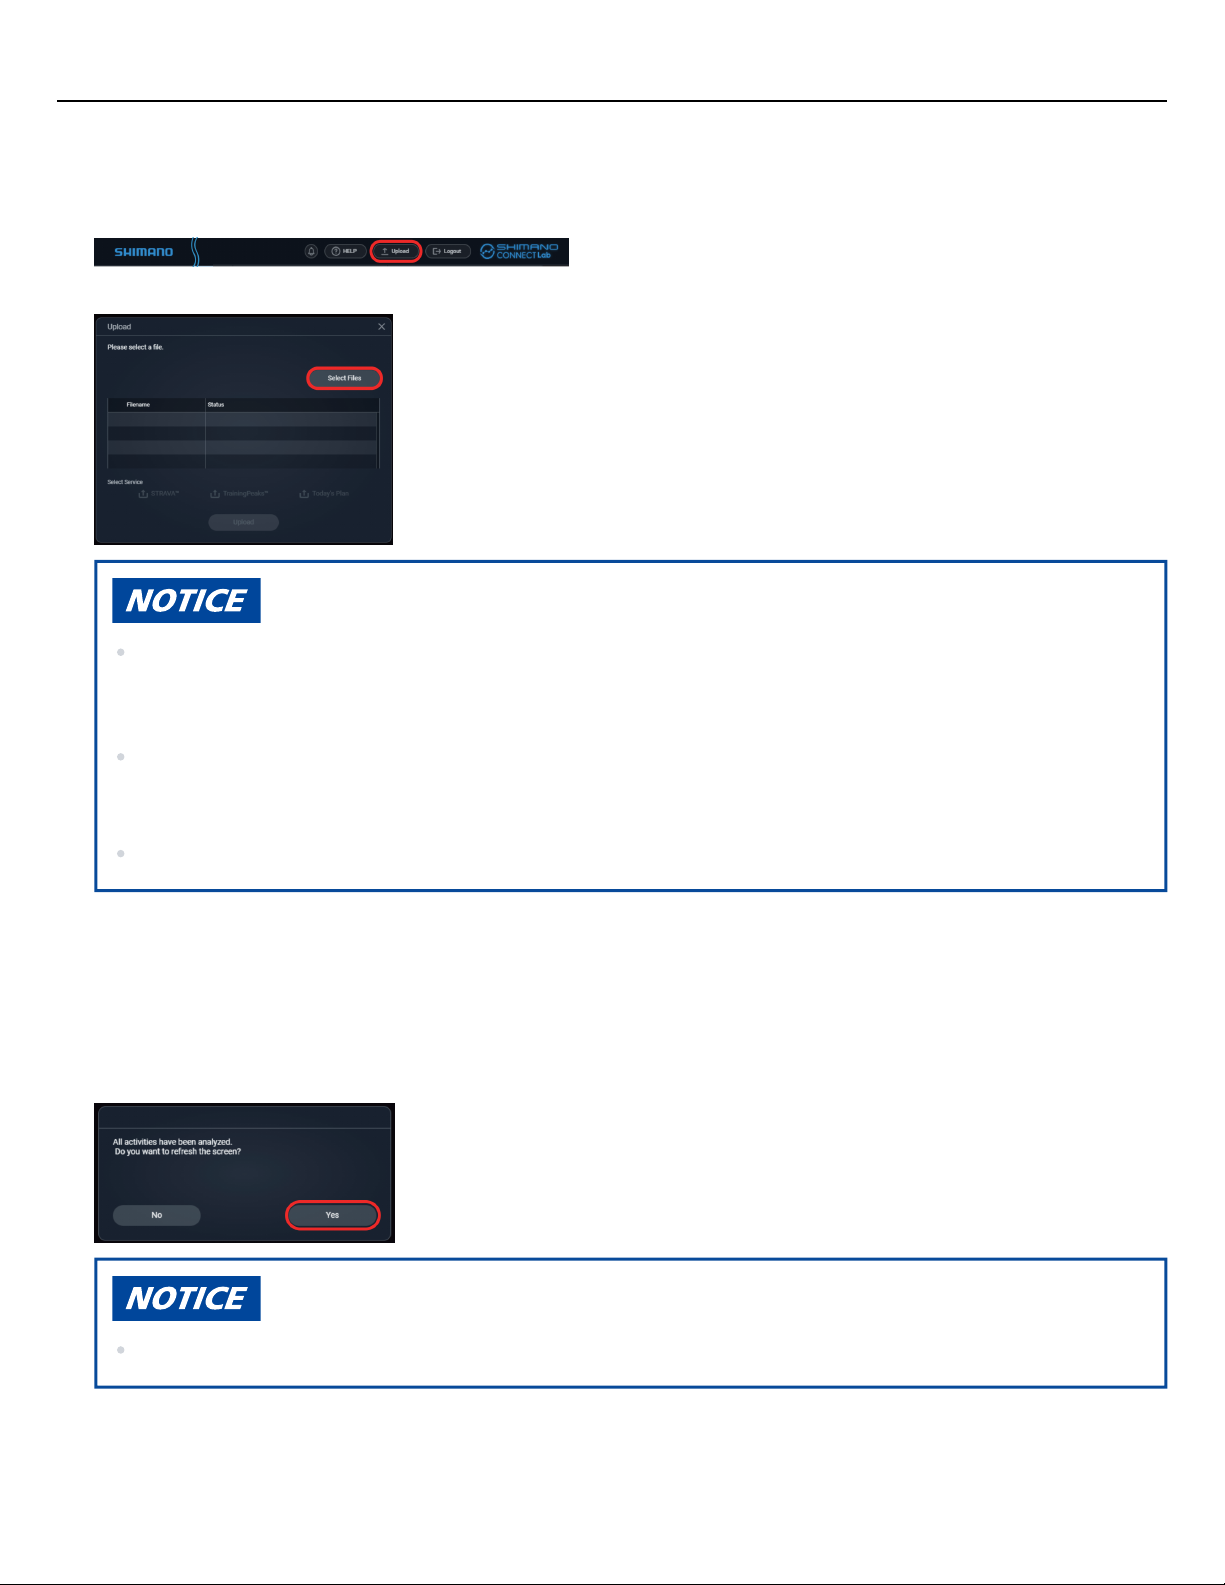
Select [Upload] displayed in the header.1.
Select [Select Files] in the displayed dialog, then select the activity data to upload.
2.
Activity data in the FIT format can be uploaded.
Files in the FIT format, which is a common log file format used for cycle computers, can be uploaded.
Log files in the .db format from the Pioneer SGX-CA600 can also be uploaded.
The activity data can be forwarded to a Web service at the same time.
Select the Web service in [Select Service] after configuring the Web service link on the activity export
setting screen in advance. It is automatically selected if automatic forwarding is set.
To post activity data, select the check box of the corresponding Web service.
Select [Upload].
3.
When [Upload complete. Close the dialog box and wait for analysis to be completed.] is displayed, close the
dialog.
Data analysis starts when uploading of the activity data is complete.
4.
The situations of analysis are displayed in the header notifications. Select [Yes] in the dialog indicating that
analysis of all activities is complete.
Activity analysis may take some time.
14
Page 15
Checking activity
Viewing the dashboard
Checking activity
Viewing the dashboard
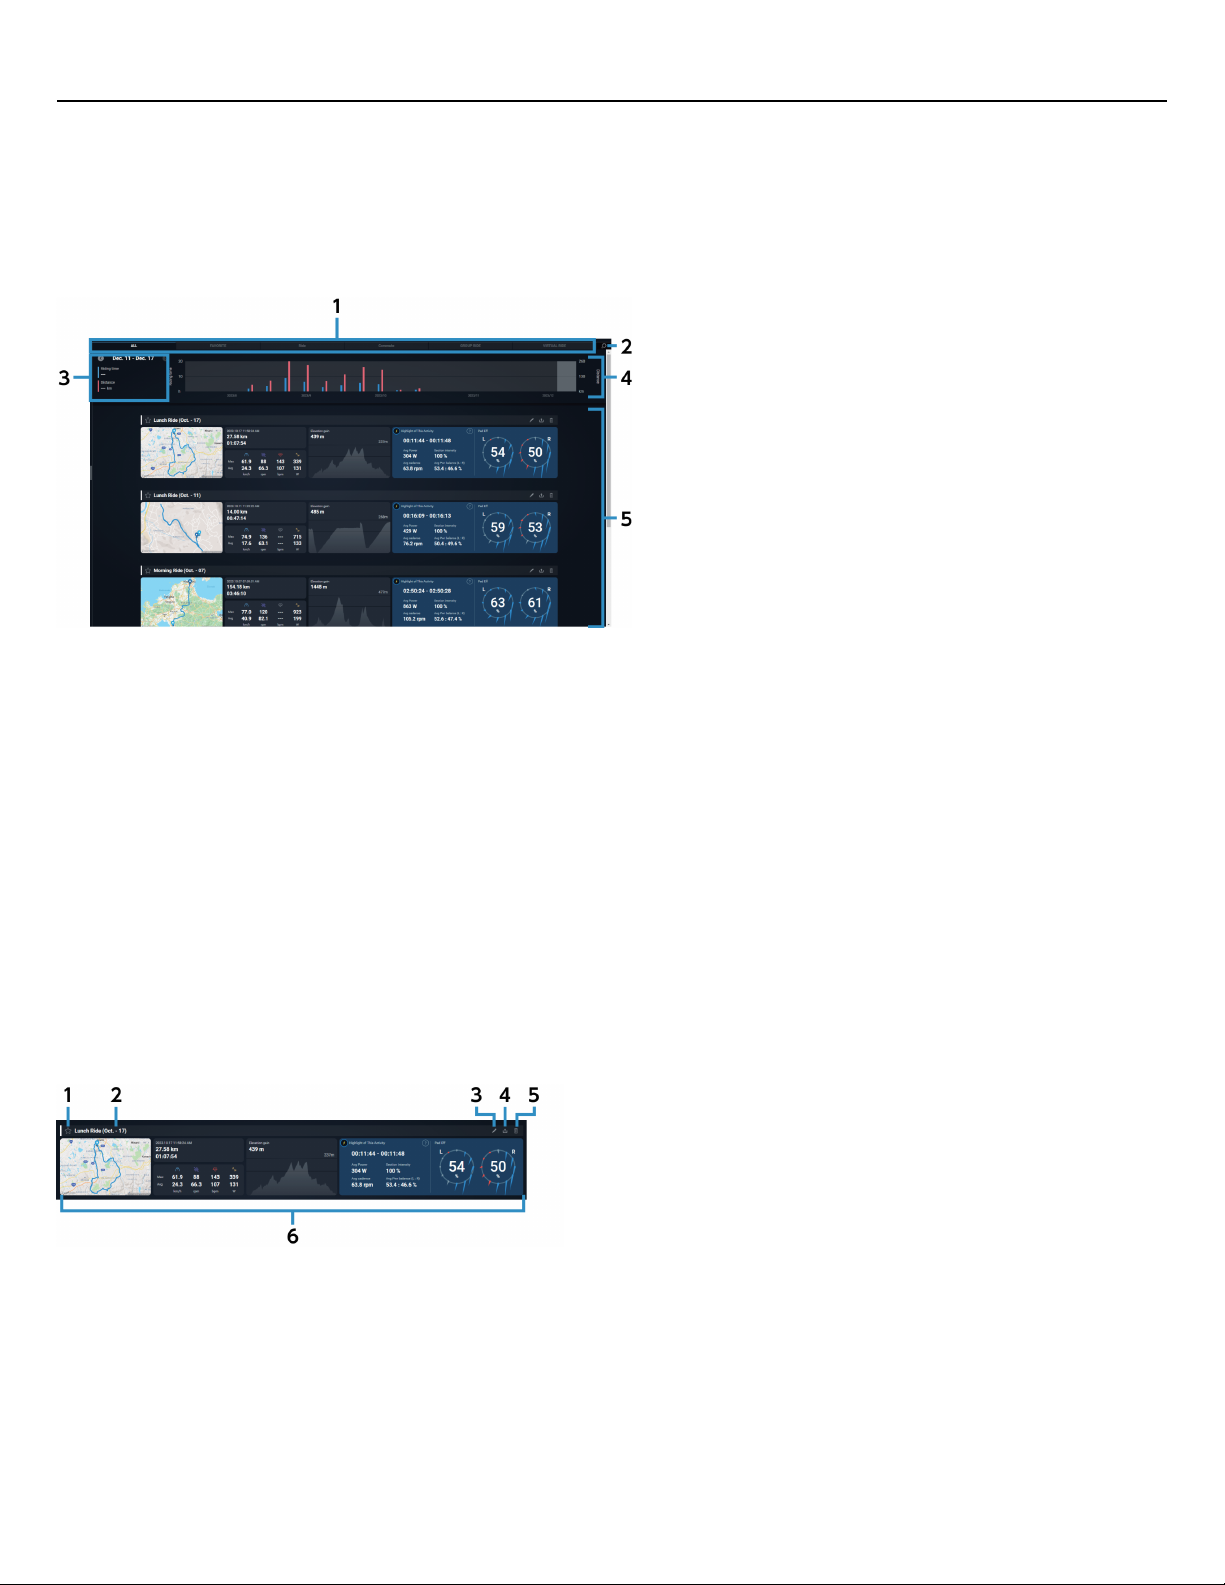
The dashboard displays the statistics and activity information for a certain period.
Tabs
(1)
Switches between all, favorites, and the activity data for each category.
The categories to display can be changed in [Tab settings] on the dashboard setting screen.
Settings
(2)
Displays the dashboard setting screen.
Graph details
(3)
Select one of the graphs in the statistics section to display the details.
Statistics
(4)
Displays the statistics for the parameters set in [Graph] on the dashboard setting screen.
Activity list
(5)
Displays the activities included in the selected tab.
Activity screen display
Register/cancel favorites
(1)
Select to register or cancel favorites.
Registered favorites can be checked on the [FAVORITE] tab.
Activity name(2)
Edit
(3)
Displays the edit dialog for the selected activity.
15
Page 16
Checking activity
Viewing the dashboard
You can edit the activity name and category.
Post
(4)
Displays the activity post dialog for the selected activity.
You can forward activity to the following Web services:
STRAVA
TrainingPeaks
You can also display a URL for sharing the activity from the [Sharing link] tab.
Delete
(5)
Deletes the selected activities.
Activity details
(6)
Displays part of the activity data.
™
™
Cycling route map
Ride measurement values
Elevation gain
Highlights
Pedaling efficiency
Select this to display the activity analysis screen.
Some items may not be displayed, depending on the recorded activity.
When the width of the browser is narrow, the layout will be changed and some items may not be
displayed.
16
Page 17
Checking activity
Checking the statistics and power curve
Checking the statistics and power curve
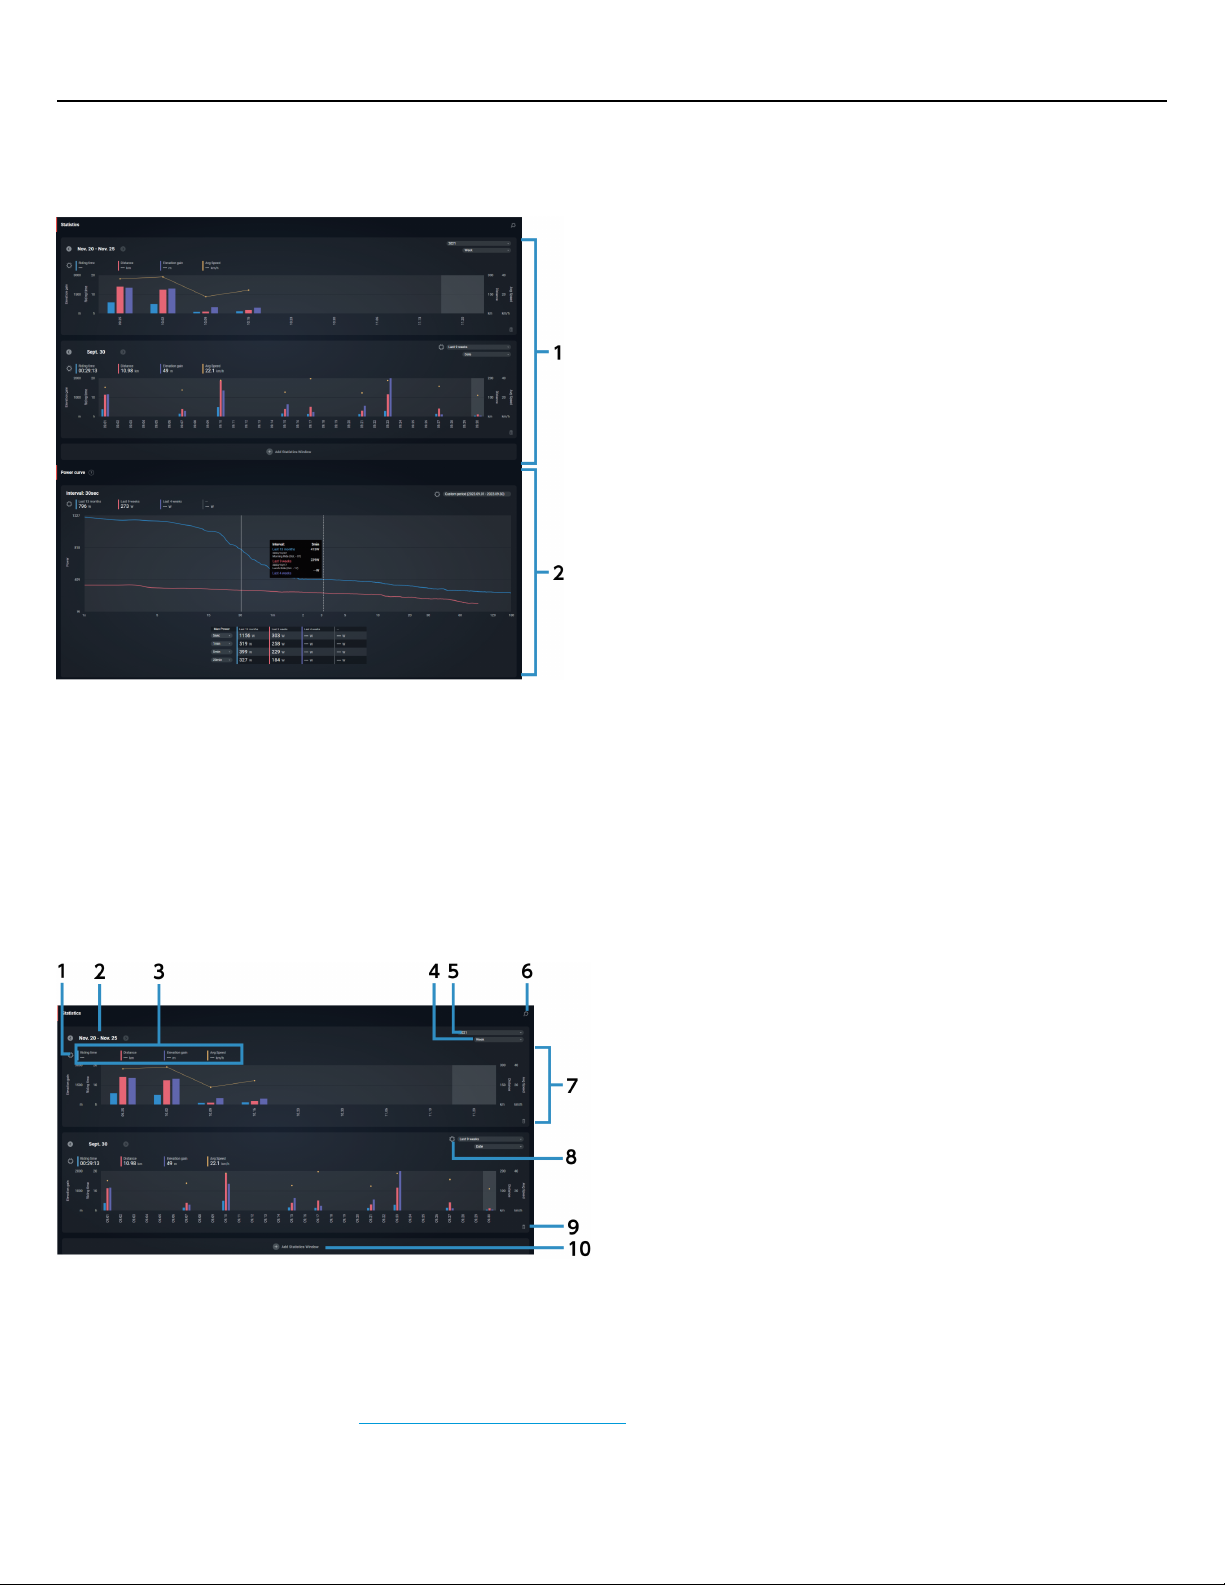
You can display the statistics and power curve for the uploaded activity data.
Statistics window
(1)
Displays the statistics graph of the activity data.
Power curve window
(2)
Displays the average maximum power curve per hour.
Power curve graphs for a maximum of four periods can be displayed at the same time and compared.
The horizontal axis displays the time interval and the vertical axis displays the power.
Statistics window
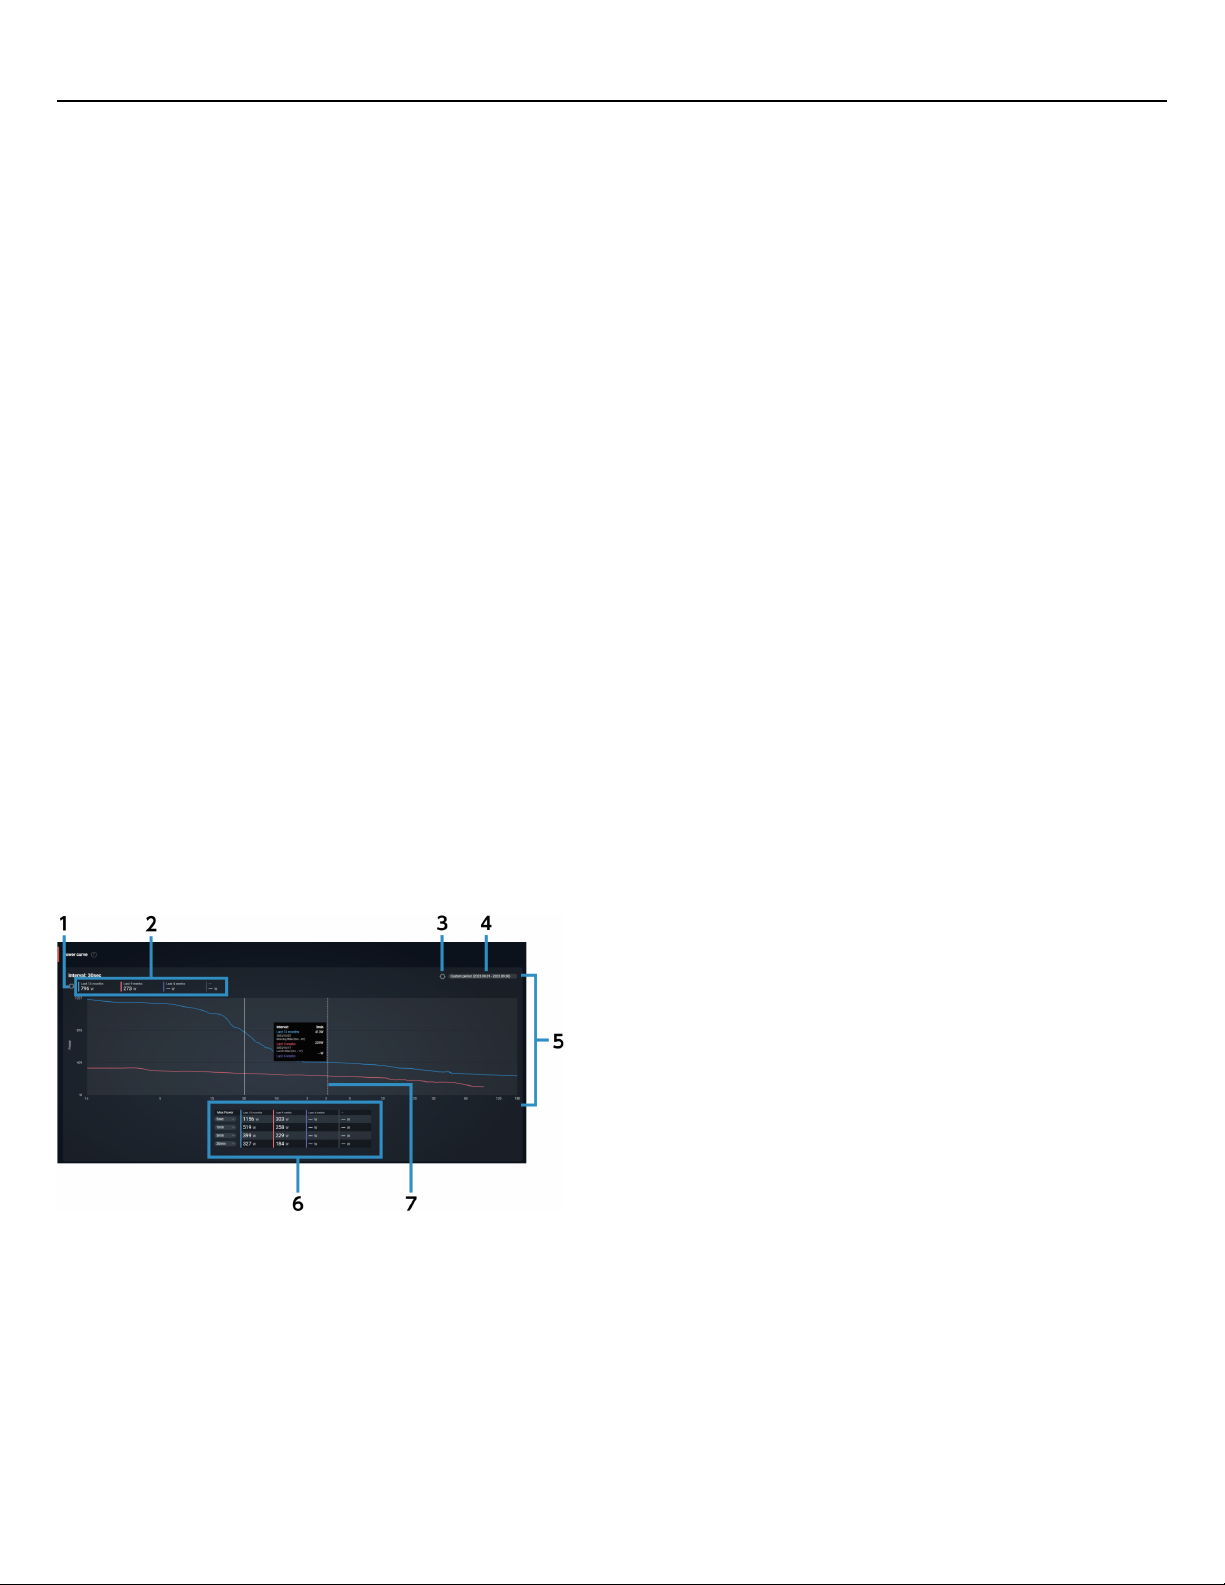
Parameter group settings
(1)
Select the parameter group to create a graph.
Combinations of parameters can be set on the statistics/power curve setting screen. Up to four parameters
can be set for a single group.
For details, refer to the “ Setting a parameter group ” section.
Data display interval(2)
17
Page 18
Checking activity
Checking the statistics and power curve
Select the interval to display in the statistics window.
Parameter display area
(3)
Displays the parameter markers and parameter statistics values corresponding to the graph.
Horizontal axis interval settings
(4)
Select the interval that is displayed on the horizontal axis.
Example: If you set the display interval to [Last {0} weeks] and set the display unit to [Week], the most
recent nine weeks are separated by week.
Activity view interval settings
(5)
Select the interval to display in the statistics window.
Settings
(6)
Displays the statistics/power curve setting screen.
Statistics
(7)
Displays the statistics for the set conditions.
Select the graph to see the parameter values.
Custom period settings
(8)
Enables you to set a custom period to display. In the displayed dialog, set the starting and ending date/time
of the period or set the period to be from the starting date/time to the current date/time, then click
[UPDATE].
Delete statistics window
(9)
Deletes the corresponding statistics window when multiple statistics windows are displayed.
Add statistics window
(10)
Enables up to three statistics windows to be displayed.
Power curve window
Period displayed settings
(1)
Displays the dialog for period displayed settings.
Parameter display area
(2)
Displays the parameter markers and numeric values corresponding to the graph.
Custom period
(3)
Enables you to set a custom period to display. In the displayed dialog, set the starting and ending date/time
of the period or set the period to be from the starting date/time to the current date/time, then click
[UPDATE].
18
Page 19

Checking activity
Checking the statistics and power curve
Custom period view(4)
Power curve graph
(5)
A maximum of four plots can be displayed at the same time.
Power interval table
(6)
Displays the power for each interval of the power curve graphs in the table format. You can select the
interval to display.
Average maximum power curve per hour
(7)
Dotted line
Place the mouse pointer over a graph to display a dotted line and a popup indicating the power value of
that interval.
Solid line
Select on the graph to display the interval time and power value on the graph and switch the dotted line to
a solid line.
19
Page 20
Checking activity
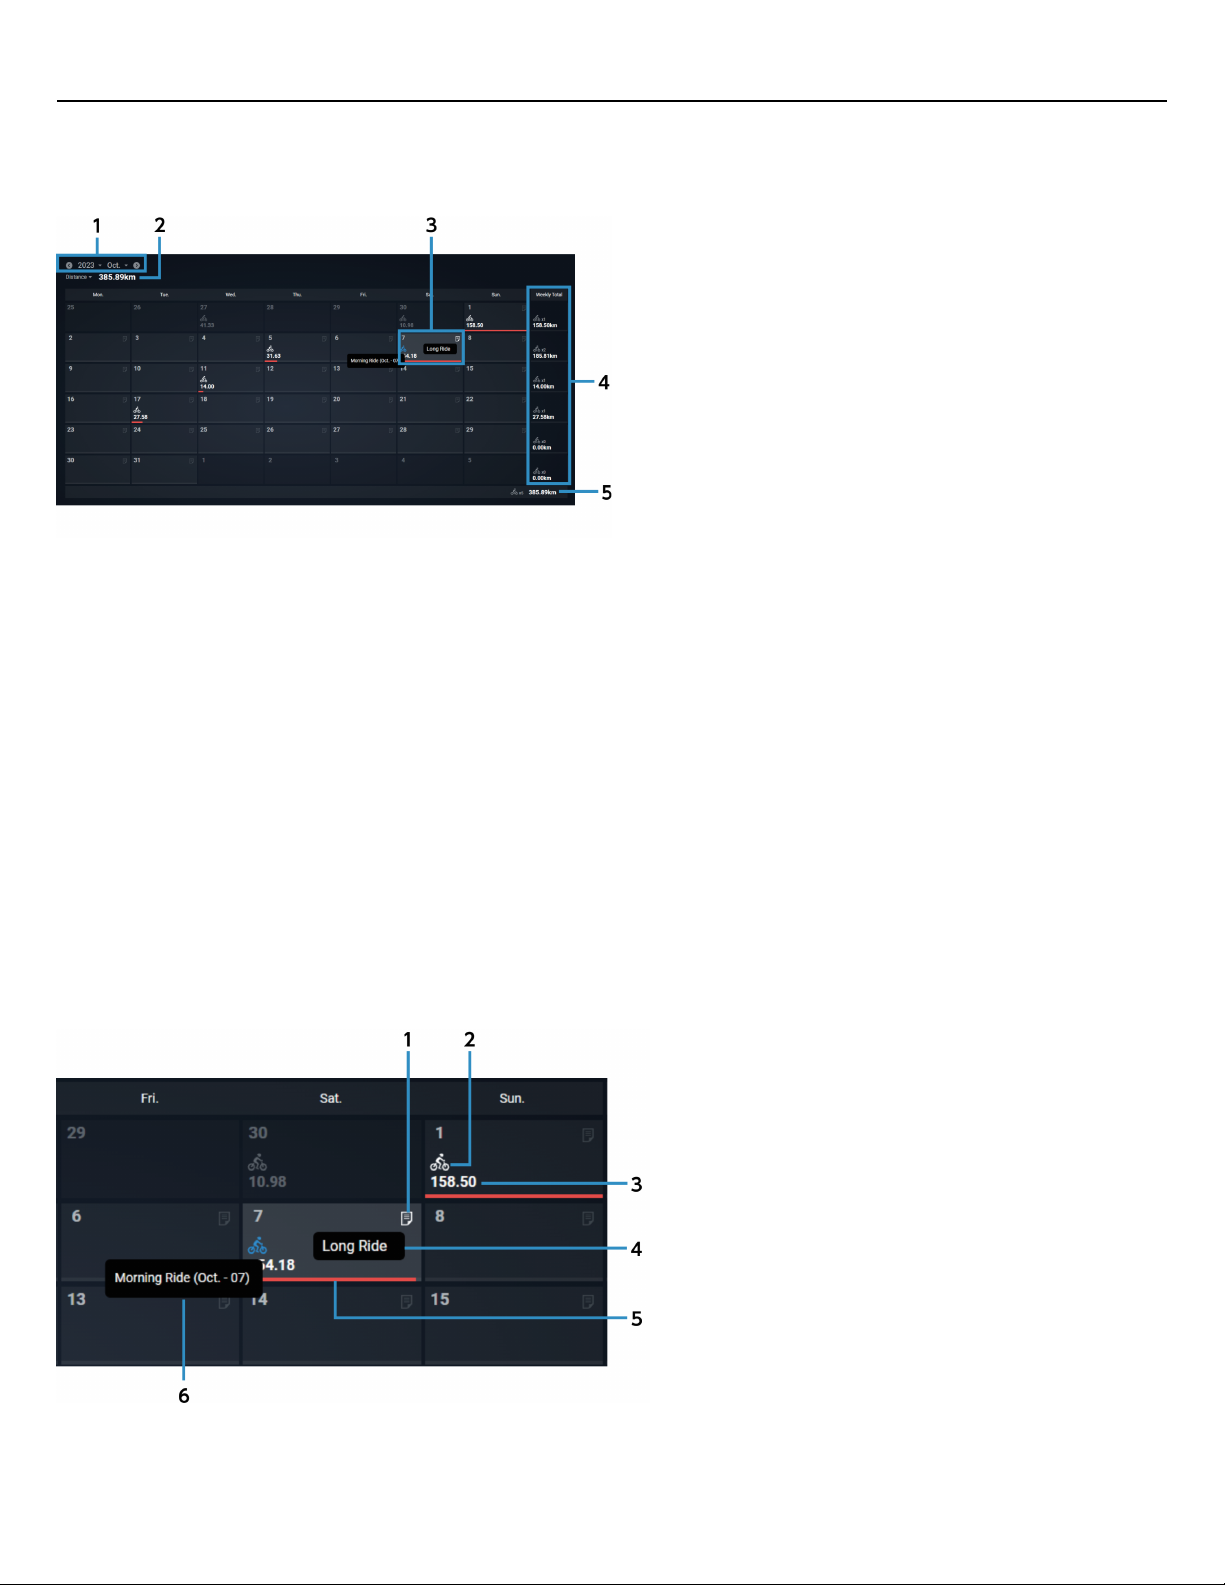
Displaying activity in the calendar format
Displaying activity in the calendar format
Displays activity in the calendar format.
Display month
(1)
Select the year and month to display in the calendar.
Total parameter
(2)
Select a parameter to display the total value of the parameter for that month.
Activity view
(3)
Displays the activity information, etc. for that day.
Place the mouse pointer over an icon to display the comment and activity name.
You can enter a comment by selecting a date.
Weekly total
(4)
Displays the total values for the ride count and traveling distance per week.
Monthly total value
(5)
Displays the total values for the ride count and traveling distance for the month to display.
Activity view
Comment icon
(1)
The icon is displayed in white when a comment is registered. Select it to display the edit comment dialog.
20
Page 21

Checking activity
Displaying activity in the calendar format
Activity icon
(2)
The icon is displayed in white when activity data is registered. When there are multiple items of activity
data on the same day, the number of items is also displayed.
Parameter value
(3)
Displays the daily value of the parameter selected as the total parameter.
Comment pop-up view
(4)
Place the mouse pointer over the comment icon to display the comment in a pop-up.
Ratio view bar
(5)
If you are viewing a calendar from a previous month, the bar length will display the value of the chosen
parameter as a percentage of the maximum value for the month you are viewing.
If you are viewing a calendar of the current month, the bar length will display the value of the chosen
parameter as a percentage of either the current month or the previous month, whichever is larger.
Activity pop-up view
(6)
Place the mouse pointer over the activity icon to display the activity name or ride date/time in a pop-up.
21
Page 22
Checking activity
Displaying the activity list
Displaying the activity list
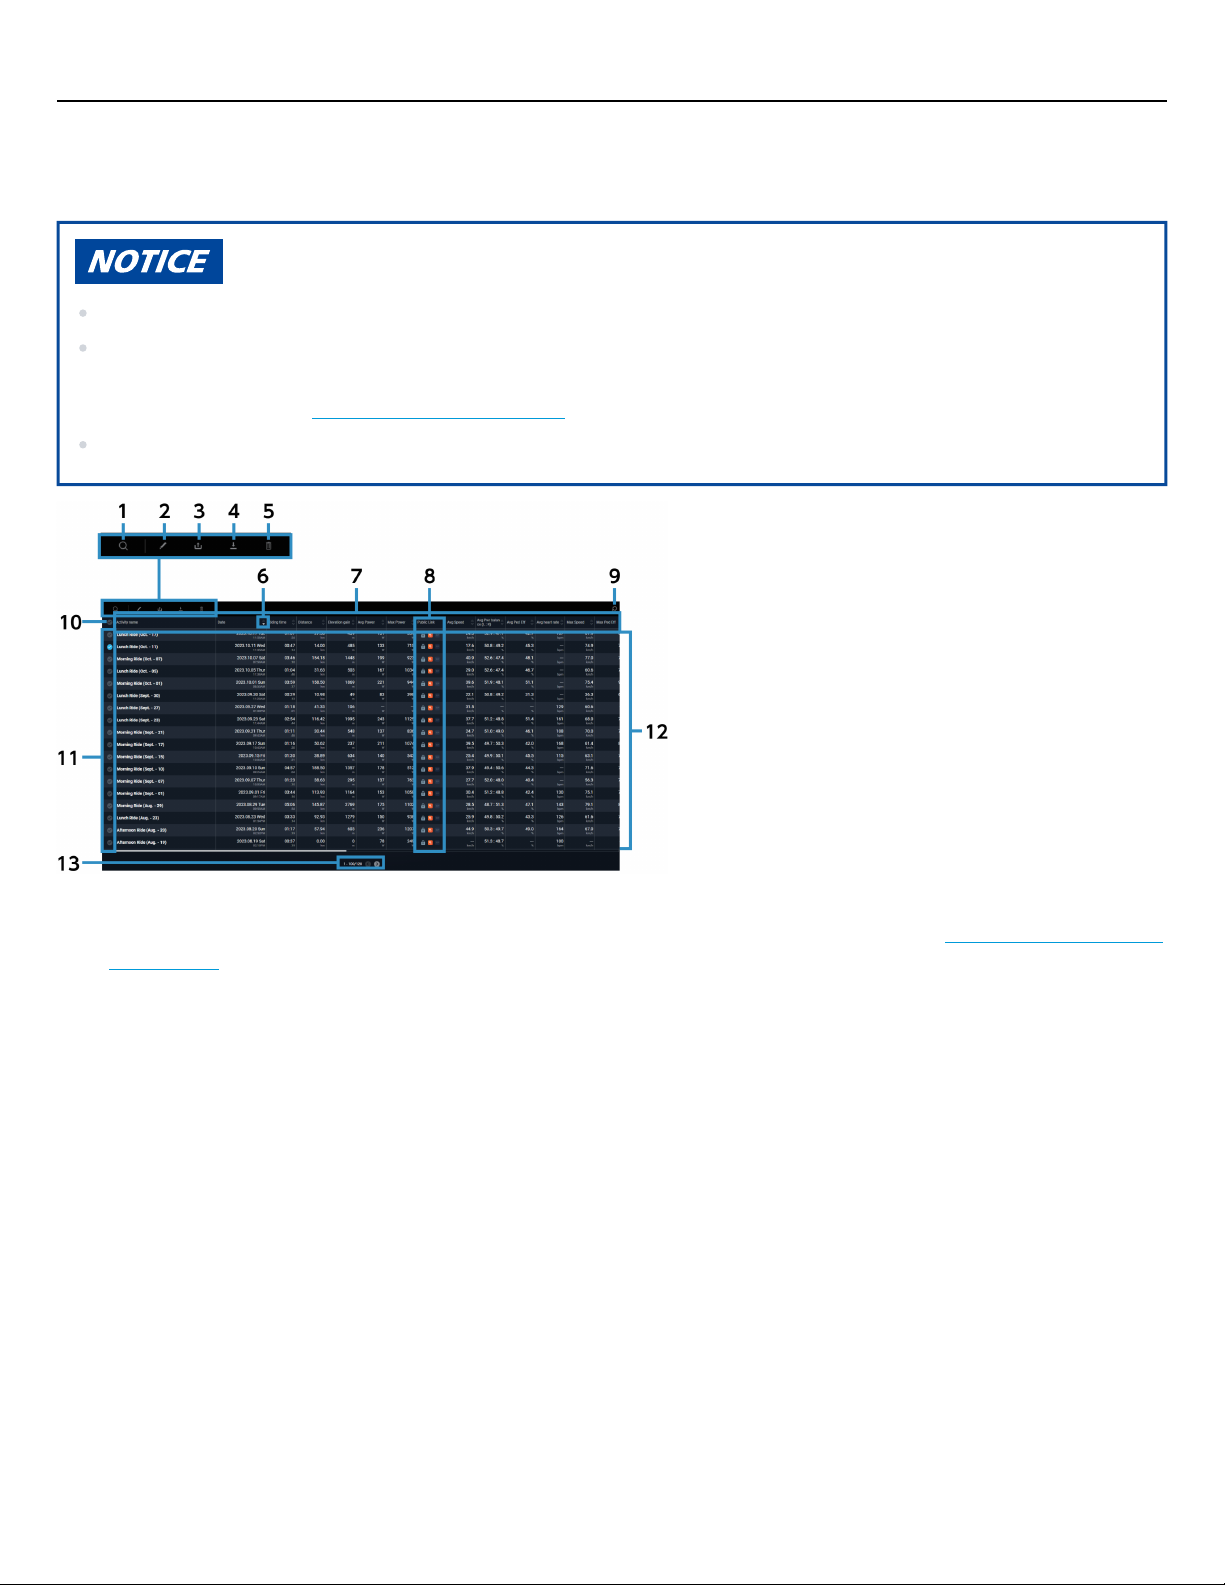
You can display a list of activities.
If you are using a smartphone, the activity list is not displayed.
When sharing activity data, make sure to set a private location so that the area near your home, etc.
cannot be determined.
For details, refer to “ Setting a private location ”.
When activity data is exported to a linked Web service, the private location settings are not applied.
Searching for activities
(1)
You can set search conditions to filter the displayed activity list. For details, refer to “ Filtering the displayed
activity list ”.
Edit
(2)
Displays the edit dialog for the selected activity.
You can edit the activity name and category. If you select multiple activities, you can only edit the category.
Post
(3)
Displays the activity post dialog for the selected activity.
You can post activity data to the following Web services:
STRAVA
TrainingPeaks
You can also display a URL for sharing the activity from the [Sharing link] tab.
Download
(4)
Enables you to download the data for the selected activities in the FIT format.
Delete
(5)
Deletes the selected activities.
Sort(6)
™
™
22
Page 23
Checking activity
Displaying the activity list
Sorts the items in the activity list in ascending or descending order.
Parameter items
(7)
Select the items to display the item list, which enables you to change the displayed items.
The activity name and date cannot be changed.
Public status
(8)
Displays the status of posting or sharing the activity.
Settings
(9)
Displays the activity list setting screen.
Enables you to change the parameters displayed in the search results and their order.
Select/deselect all
(10)
Selects or deselects all the displayed activities.
Check boxes
(11)
Selects or deselects the activities.
Activity list
(12)
Displays a list of the data for the activities.
You can perform a search to filter the displayed data.
Switch page
(13)
Switches the displayed page. (This is only displayed when there are more than 100 activities.)
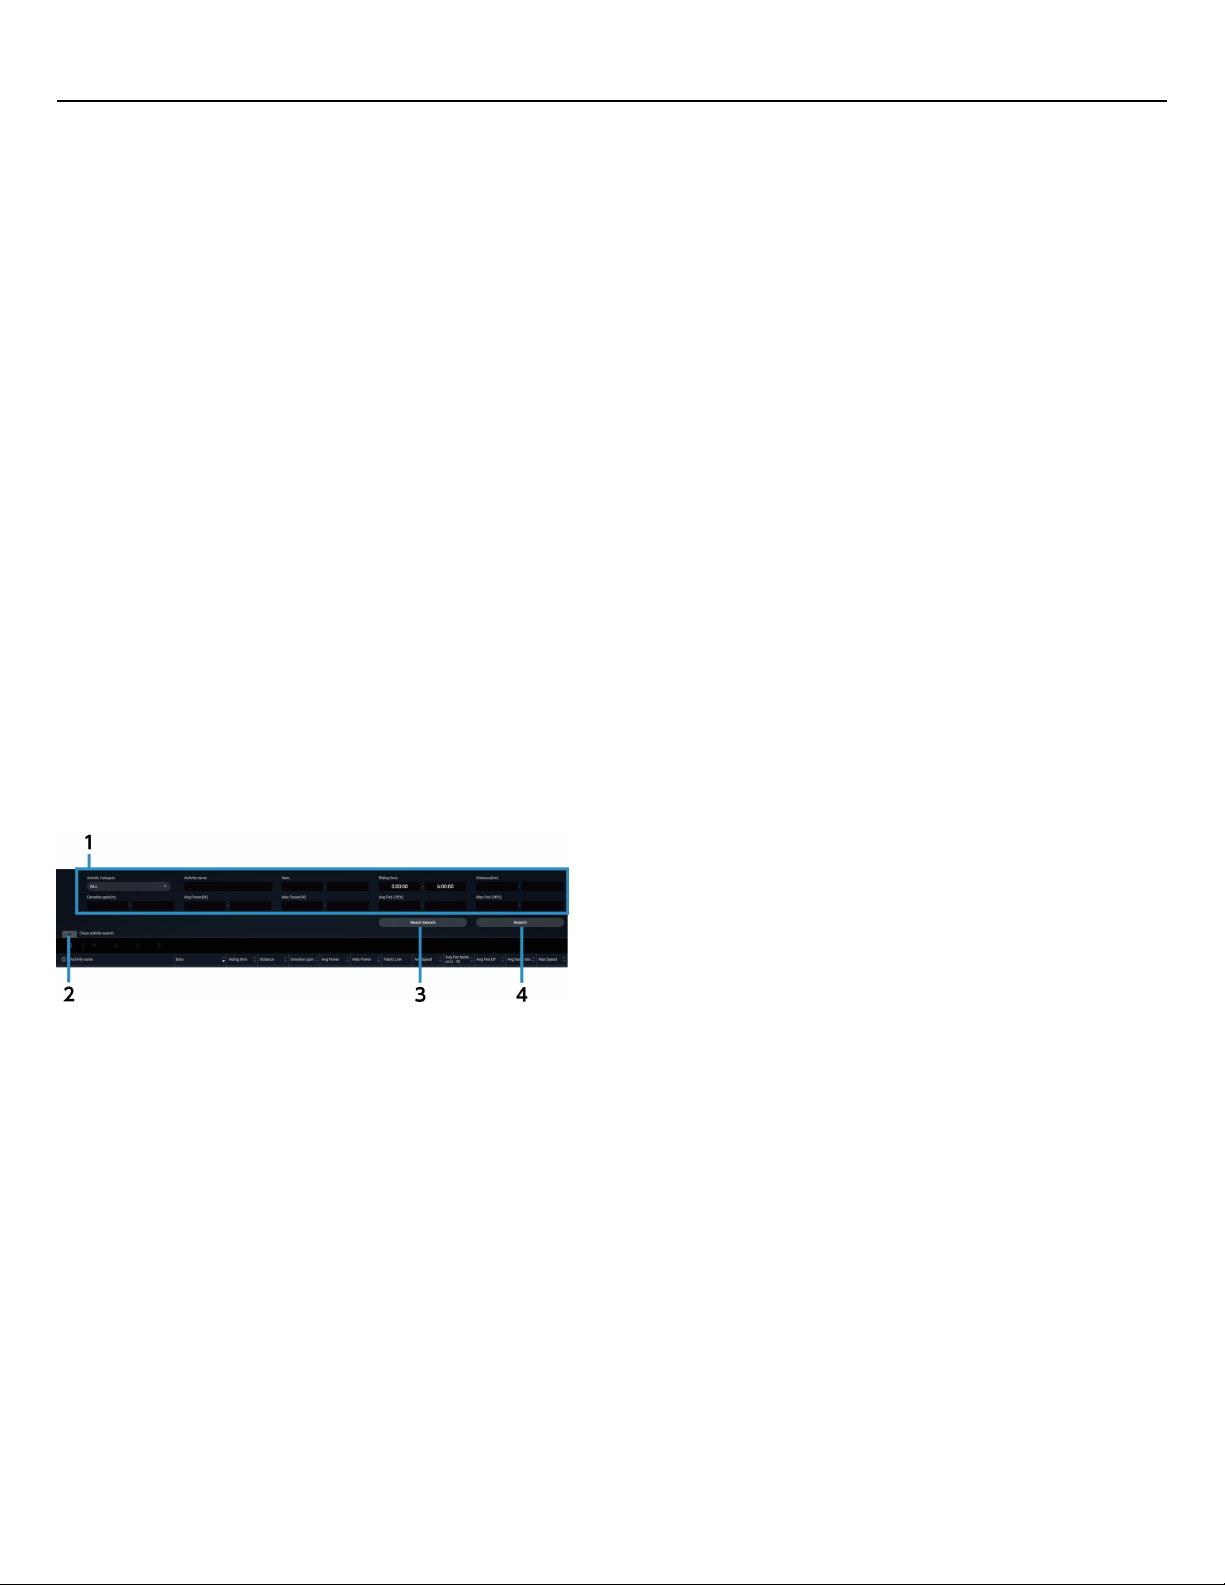
Filtering the displayed activity list
You can filter the displayed activity list according to search conditions.
Search conditions
(1)
Set the search conditions.
Hide search field
(2)
Hides the search field.
Reset search
(3)
Resets the set search conditions.
The activity list is updated after [Search] is selected.
Search
(4)
You can filter the displayed activity list according to the set search conditions.
23
Page 24
Analyzing activity
About the activity analysis screen
Analyzing activity
About the activity analysis screen
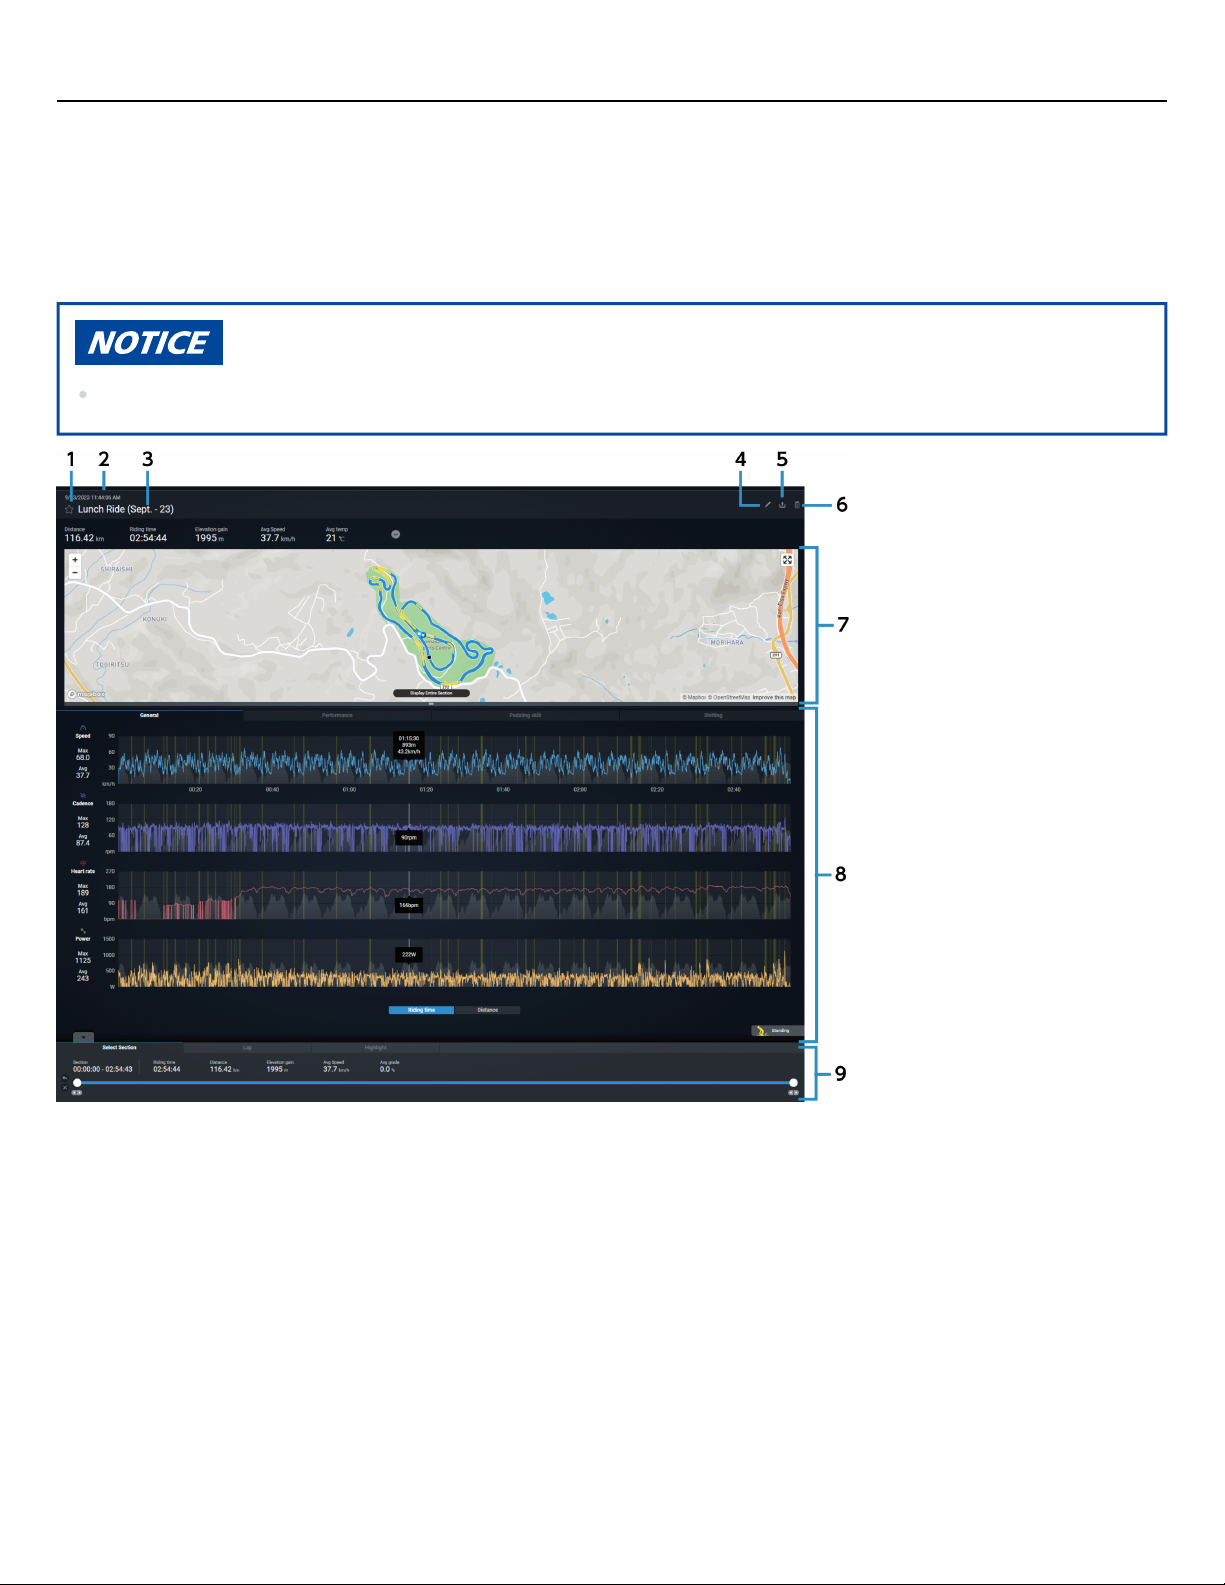
The analysis screen of the activity selected on the dashboard is displayed.
Some screen display and functions differ on a smartphone.
Register/cancel favorites
(1)
Select to register or cancel favorites.
Registered favorites can be checked on the [FAVORITE] tab.
Travel start date/time(2)
Activity name(3)
Edit
(4)
Displays the activity edit dialog for the displayed activities.
You can edit the activity name and category.
Post
(5)
Displays the activity post dialog for the selected activity.
24
Page 25

Analyzing activity
About the activity analysis screen
Enables you to post activity to the following Web services:
STRAVA
TrainingPeaks
You can also display a URL for sharing the activity from the [Sharing link] tab.
Delete
(6)
Deletes the activity.
Common area
(7)
Displays an overview and map of the activity data.
General/performance/pedaling skill/shifting view
(8)
Switch the tab to display each type of analysis data.
Interval area
(9)
Selects the interval, lap, or highlight to display the analysis data for.
™
™
25
Page 26
Analyzing activity
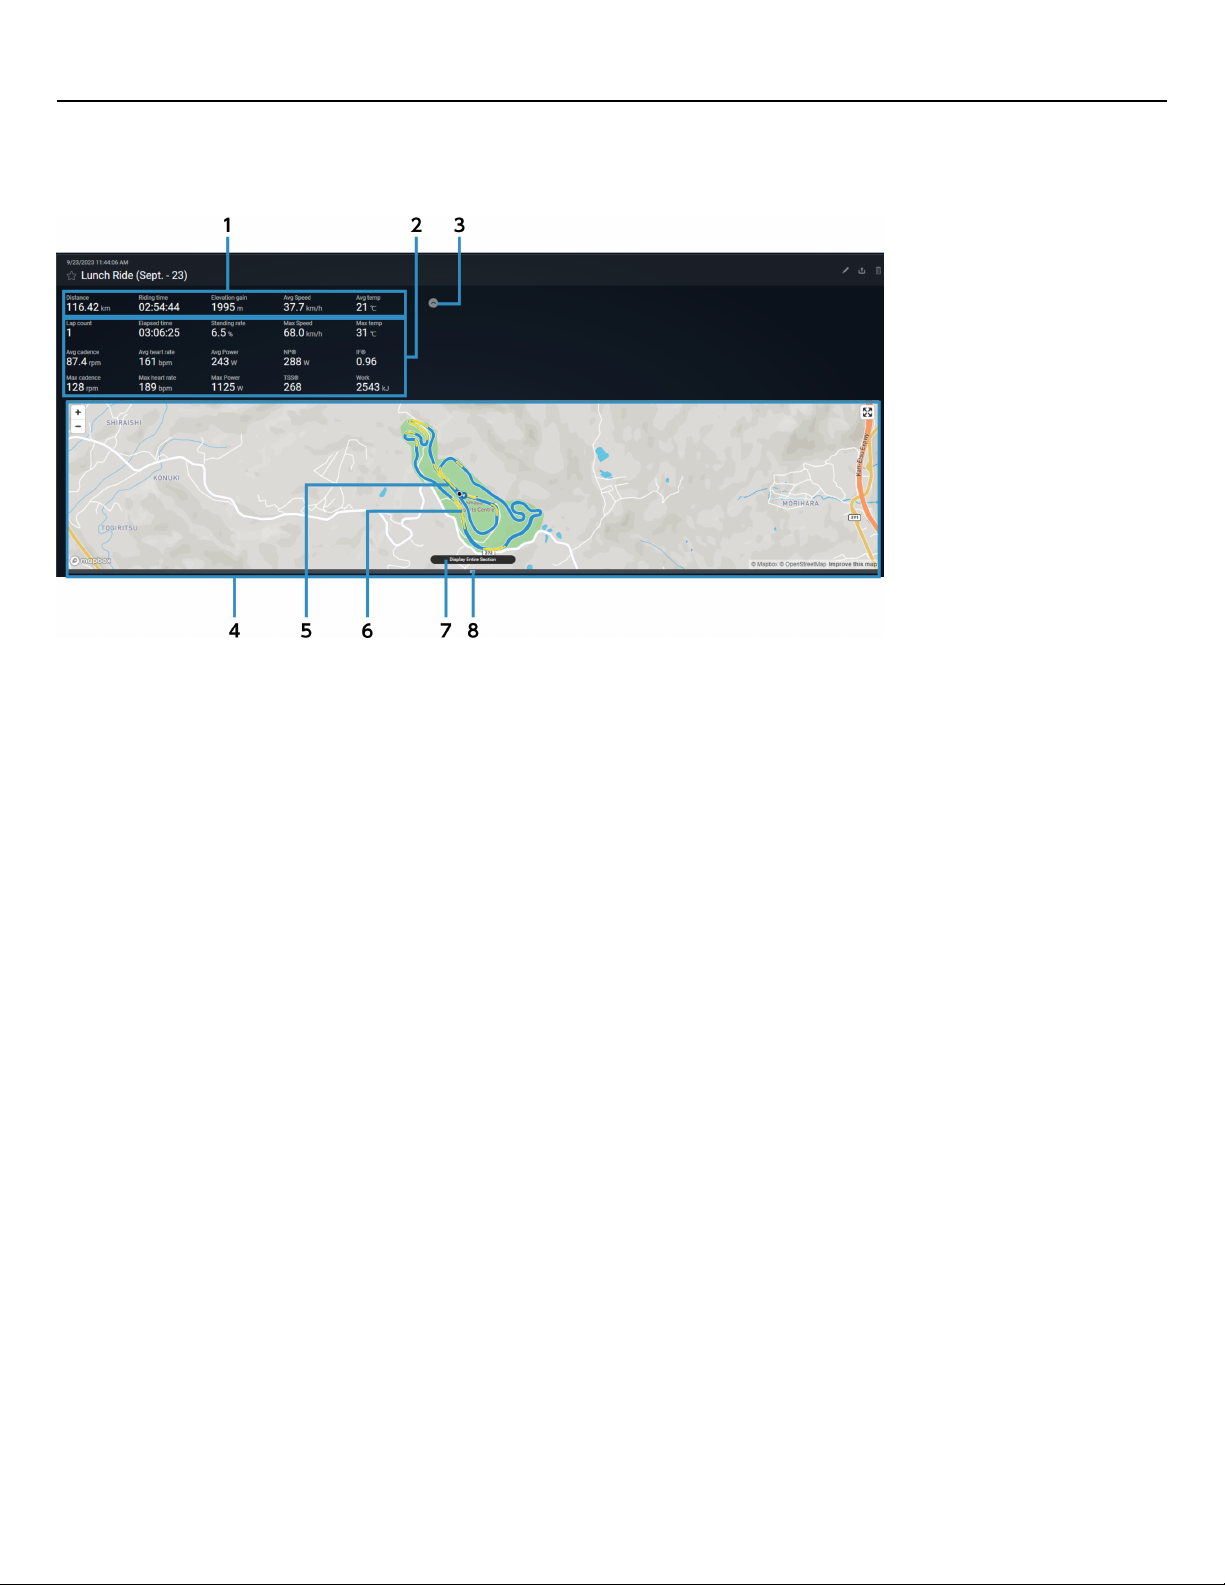
About the common area
About the common area
Displays an overview and ride route of the activity data.
Activity overview ride data
(1)
The basic activity data such as the traveling time and traveling distance are displayed.
Activity details data
(2)
Displays detailed activity data.
Display/hide detailed activity data
(3)
Displays or hides the detailed data.
Map view(4)
Current location(5)
Ride route
(6)
Blue : Selected interval
Yellow : Interval rode with standing
Gray : Deselected interval
Display entire section
(7)
Displays the entire ride route of the selected interval on the map.
Map view size change
(8)
Adjusts the map view size in the vertical direction. When the view is changed, the state of the displayed
map is reset.
26
Page 27
Analyzing activity
General
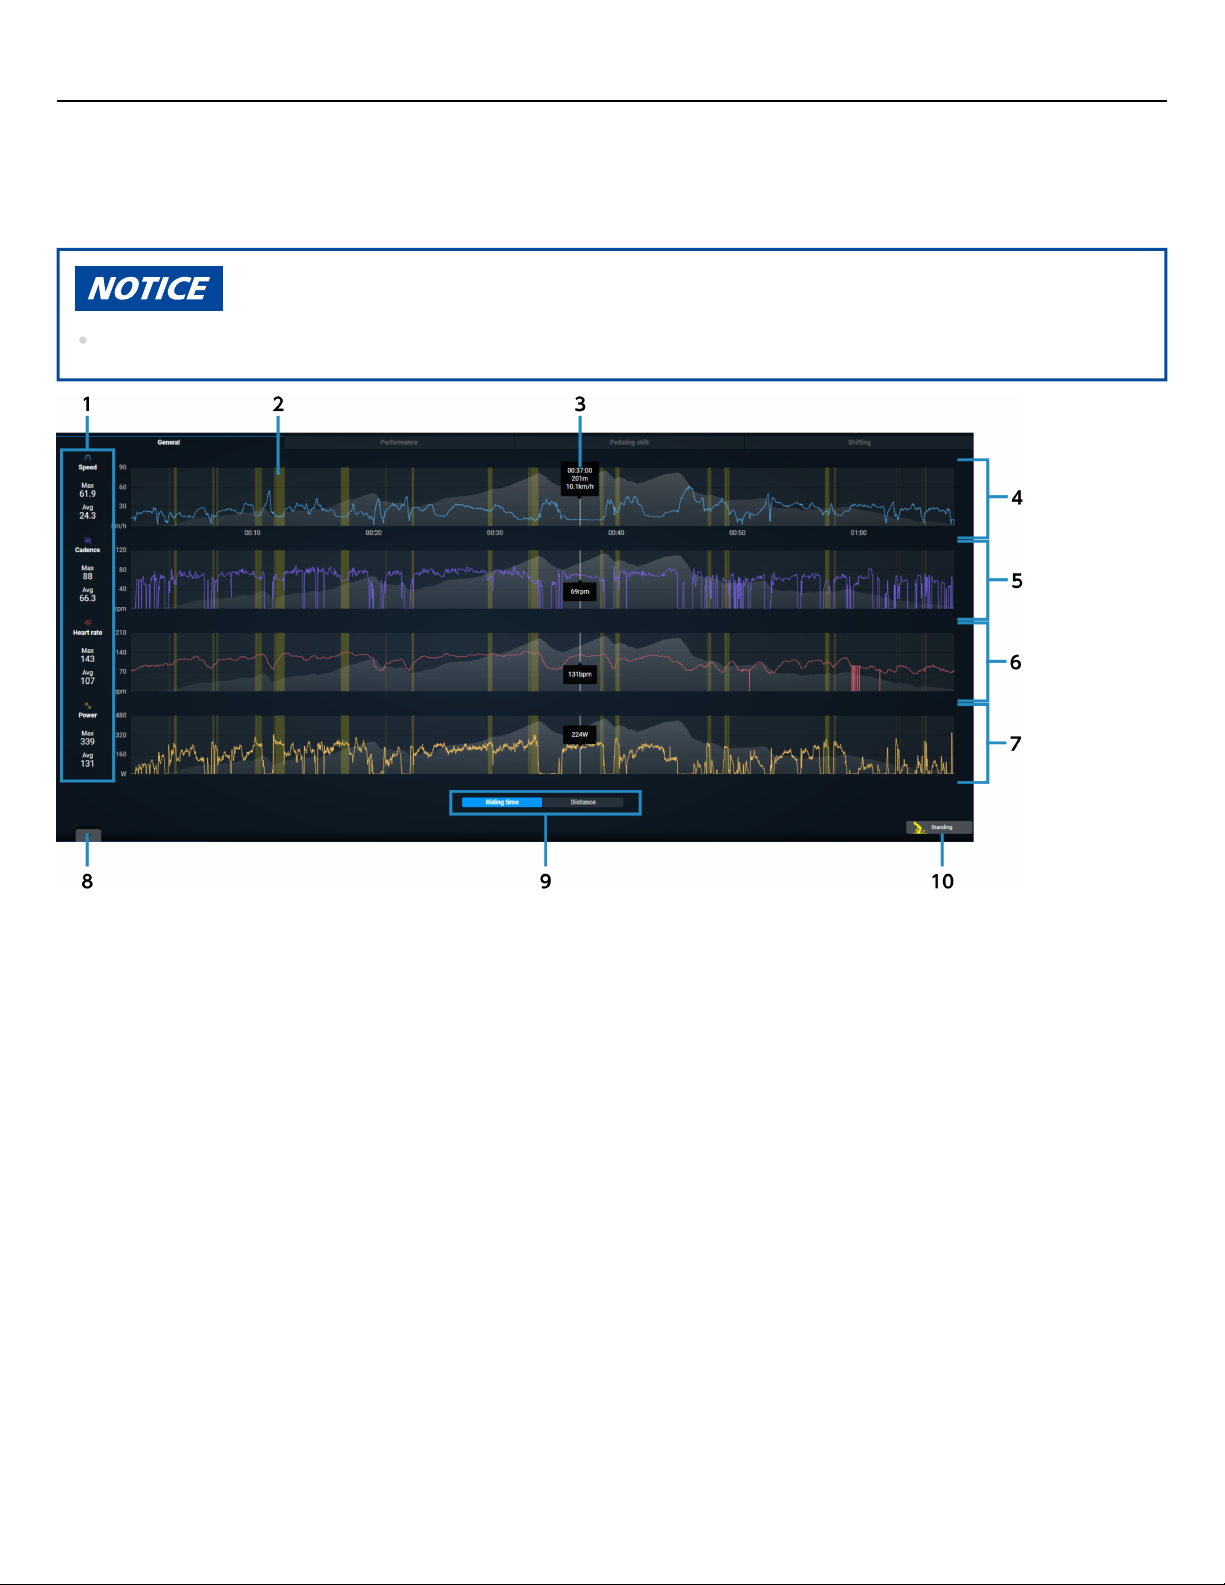
General
Displays the speed, cadence, heart rate, and power as a graph with the traveling time or traveling distance as the
horizontal axis.
Some parameters may not be displayed, depending on the recorded activity.
Maximum values/average values of parameters
(1)
Displays the maximum and average values of the interval displayed in the graph.
Standing interval(2)
Record
(3)
Displays in a popup the values of the parameters at the position (distance or time) where the mouse
pointer is placed.
The location where the values were recorded is also displayed on the map.
Speed graph
(4)
Displays the transition of speed as a line graph. The gray graph in the background indicates the elevation.
Cadence graph
(5)
Displays the transition of cadence as a line graph. The gray graph in the background indicates the
elevation.
Heart rate graph
(6)
Displays the transition of heart rate as a line graph. The gray graph in the background indicates the
elevation.
Power graph
(7)
Displays the transition of power as a line graph. The gray graph in the background indicates the elevation.
27
Page 28

Analyzing activity
General
Switch interval area view(8)
Switch horizontal axis parameter
(9)
Switches the horizontal axis of the graph to traveling time or traveling distance.
Standing
(10)
Displays/hides the standing interval.
28
Page 29
Analyzing activity
Performance
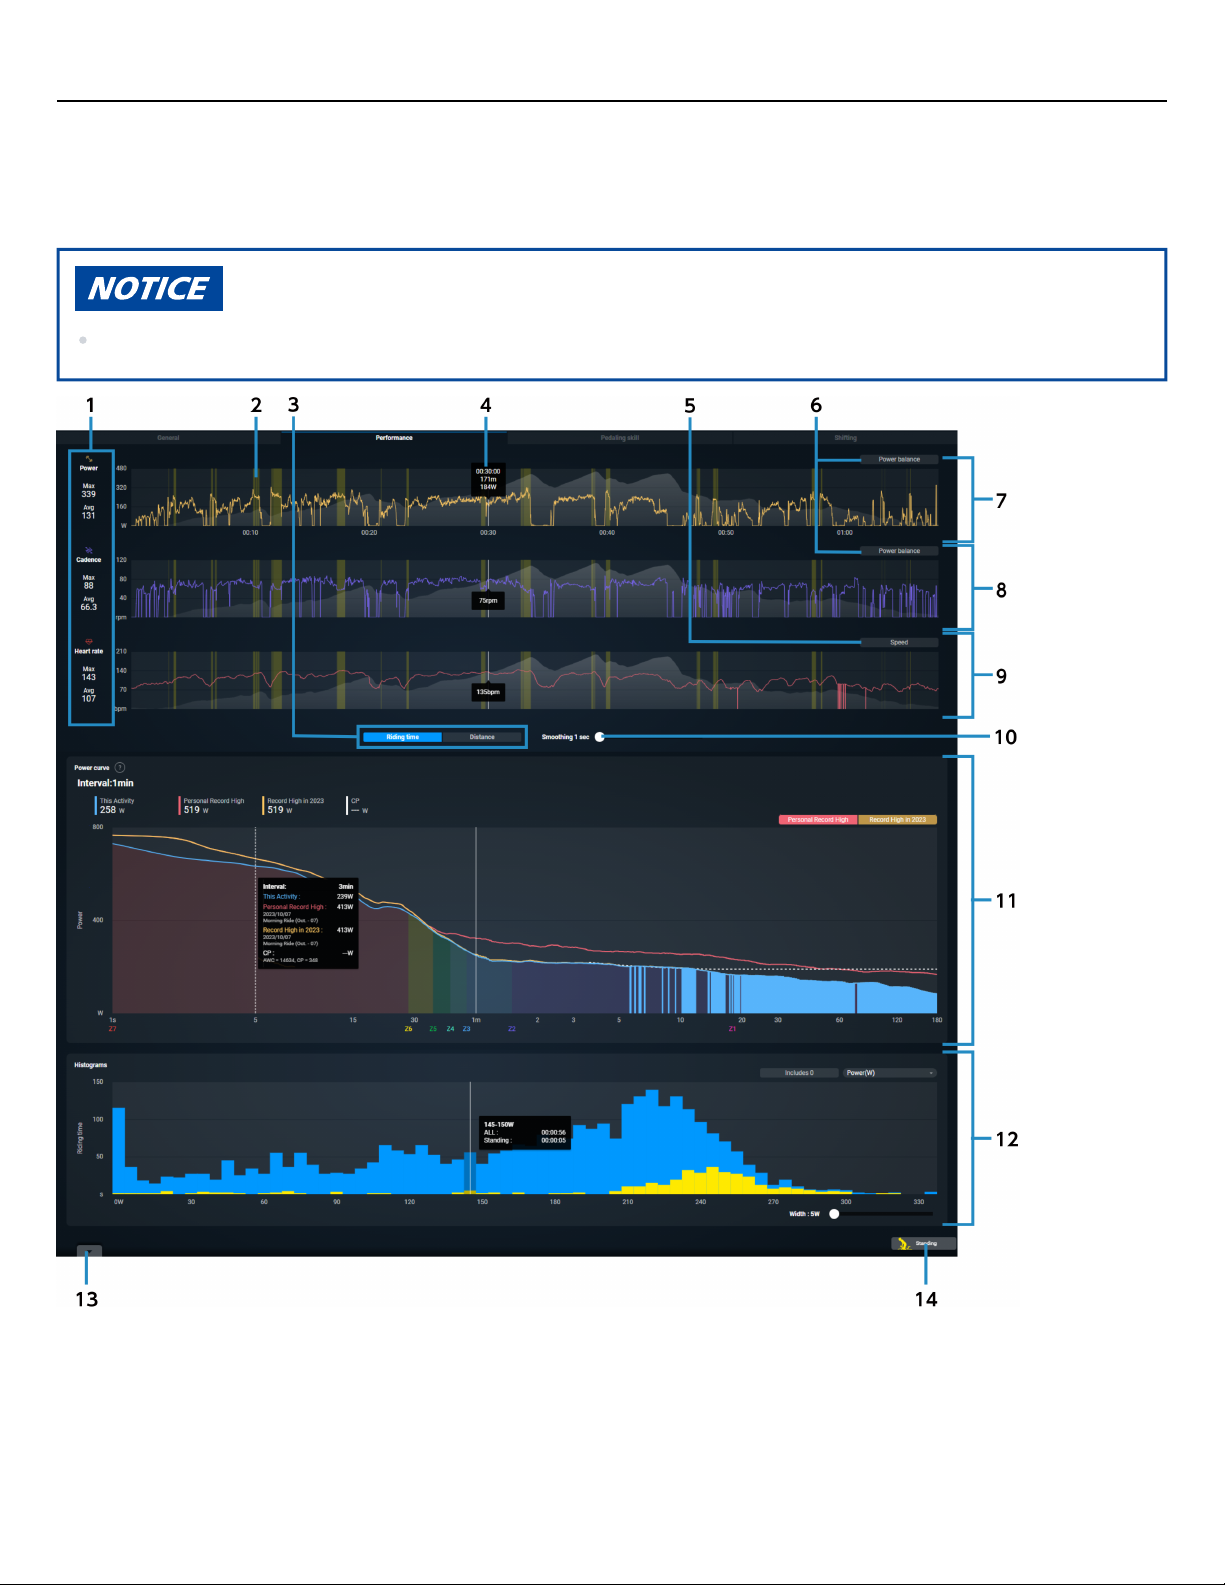
Performance
Displays the speed, cadence, and heart rate as a graph with the traveling distance or traveling time as the
horizontal axis, as well as the power curve and histogram.
Some parameters may not be displayed, depending on the recorded activity.
Maximum values/average values of parameters(1)
Standing interval(2)
Switch horizontal axis parameter
(3)
Switches the horizontal axis of the graph to traveling time or traveling distance.
29
Page 30
Analyzing activity
Performance
Record
(4)
Displays in a popup the values of the parameters at the position (distance or time) where the mouse
pointer is placed.
The location where the values were recorded is also displayed on the map.
Speed
(5)
Overlays a line graph of the speed.
Power balance
(6)
Overlays a scatter graph of the power balance and a 50:50 center line.
Power graph
(7)
Displays the transition of power as a line graph. The gray graph in the background indicates the elevation.
Cadence graph
(8)
Displays the transition of cadence as a line graph. The gray graph in the background indicates the
elevation.
Heart rate graph
(9)
Displays the transition of heart rate as a line graph. The gray graph in the background indicates the
elevation.
Smoothing scroll
(10)
Enables you to display a graph with the average values for each set time or distance.
Power curve(11)
Histogram(12)
Switch interval area view(13)
Standing
(14)
Displays/hides the standing interval.
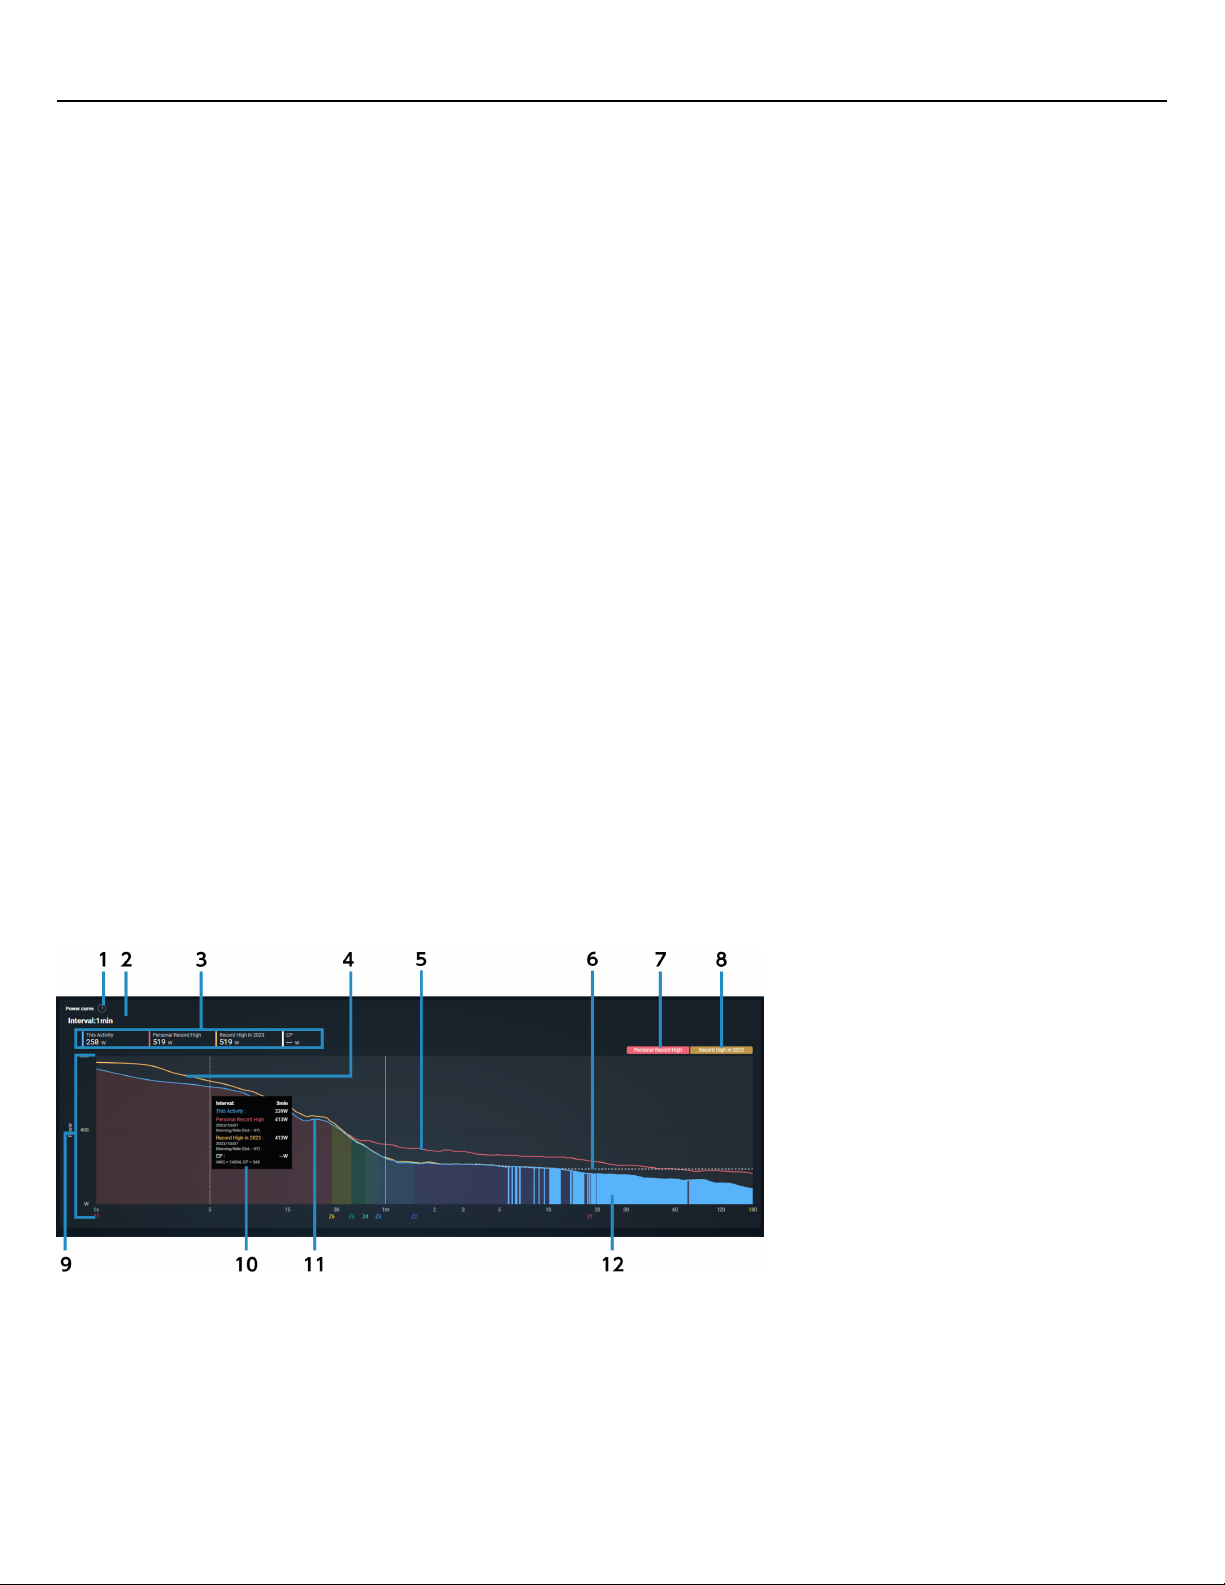
Power curve
Help
(1)
Displays the help dialog.
Interval(2)
Power
(3)
Displays the power of the interval selected in the graph.
30
Page 31
Analyzing activity
Performance
Seasonal best power curve
(4)
Displays the power curve with the highest values recorded in the year that the activity is displayed for.
Personal best power curve(5)
CP curve
(6)
Displays the approximation curve of critical power by interval.
The curve is based on the seasonal best power curve.
Personal best view switch
(7)
Displays/hides the view of the power curve (red).
Seasonal list view switch
(8)
Displays/hides the view of the power curve (yellow).
Power curve (background)
(9)
Categorizes the zone based on the power per hour (FTP).
Z7 151% of FTP or higher
Z6 121 to 150% of FTP
Z5 106 to 120% of FTP
Z4 91 to 105% of FTP
Z3 76 to 90% of FTP
Z2 56 to 75% of FTP
Z1 55% of FTP or less
Record
(10)
Displays in a popup the power at the position where the mouse pointer is placed.
The location where the values were recorded is also displayed on the map.
Power curve
(11)
Displays the curve created from the power information.
Updated highlights
(12)
Displays the records updated this season.
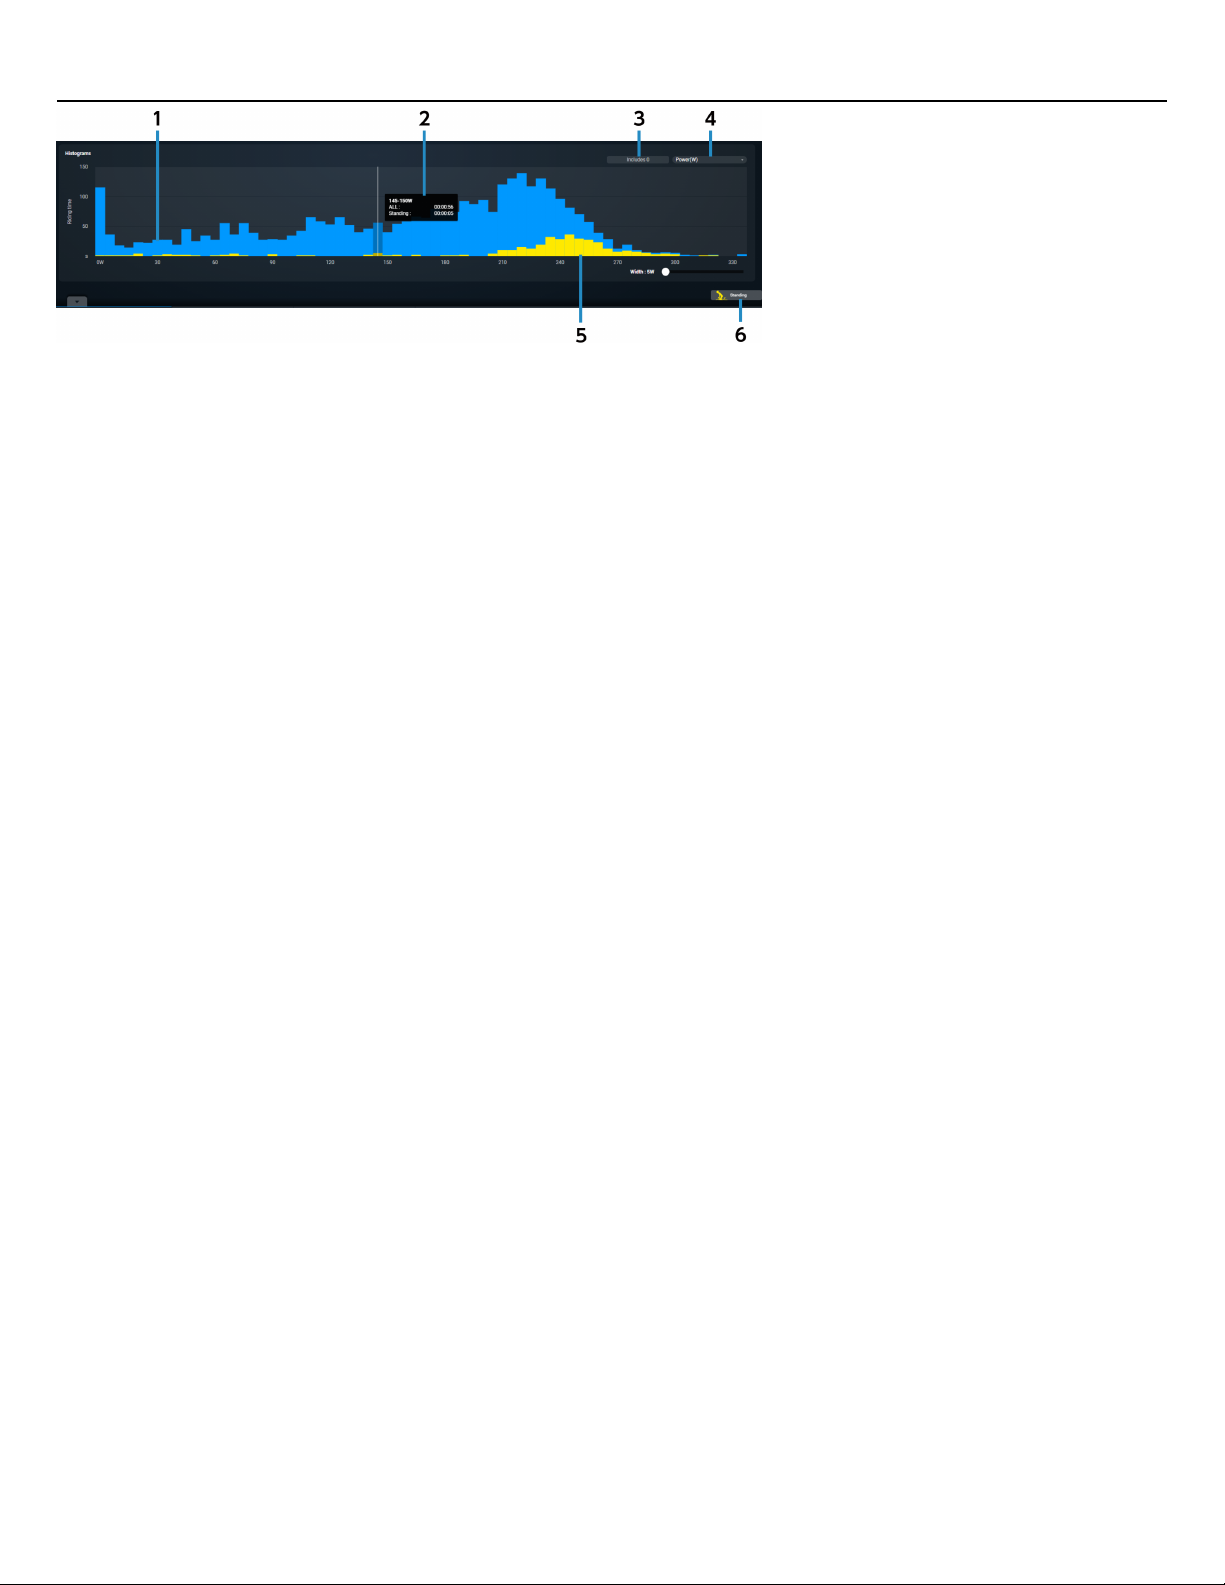
Histogram
Displays the record count, traveling time, or traveling distance histogram.
31
Page 32
Analyzing activity
Performance
Histogram bar graph
(1)
Displays the selected parameter as a graph.
Record
(2)
Displays in a popup the values of the parameters at the position where the mouse pointer is placed.
The location where the values were recorded is also displayed on the map.
Include zero
(3)
Switches whether to include 0 value data.
Parameters
(4)
Select the parameters to display.
Standing bar graph
(5)
Displays a graph of the standing record.
Horizontal axis width scroll
(6)
Changes the fineness of the horizontal axis.
32
Page 33
Analyzing activity
Pedaling skill
Pedaling skill
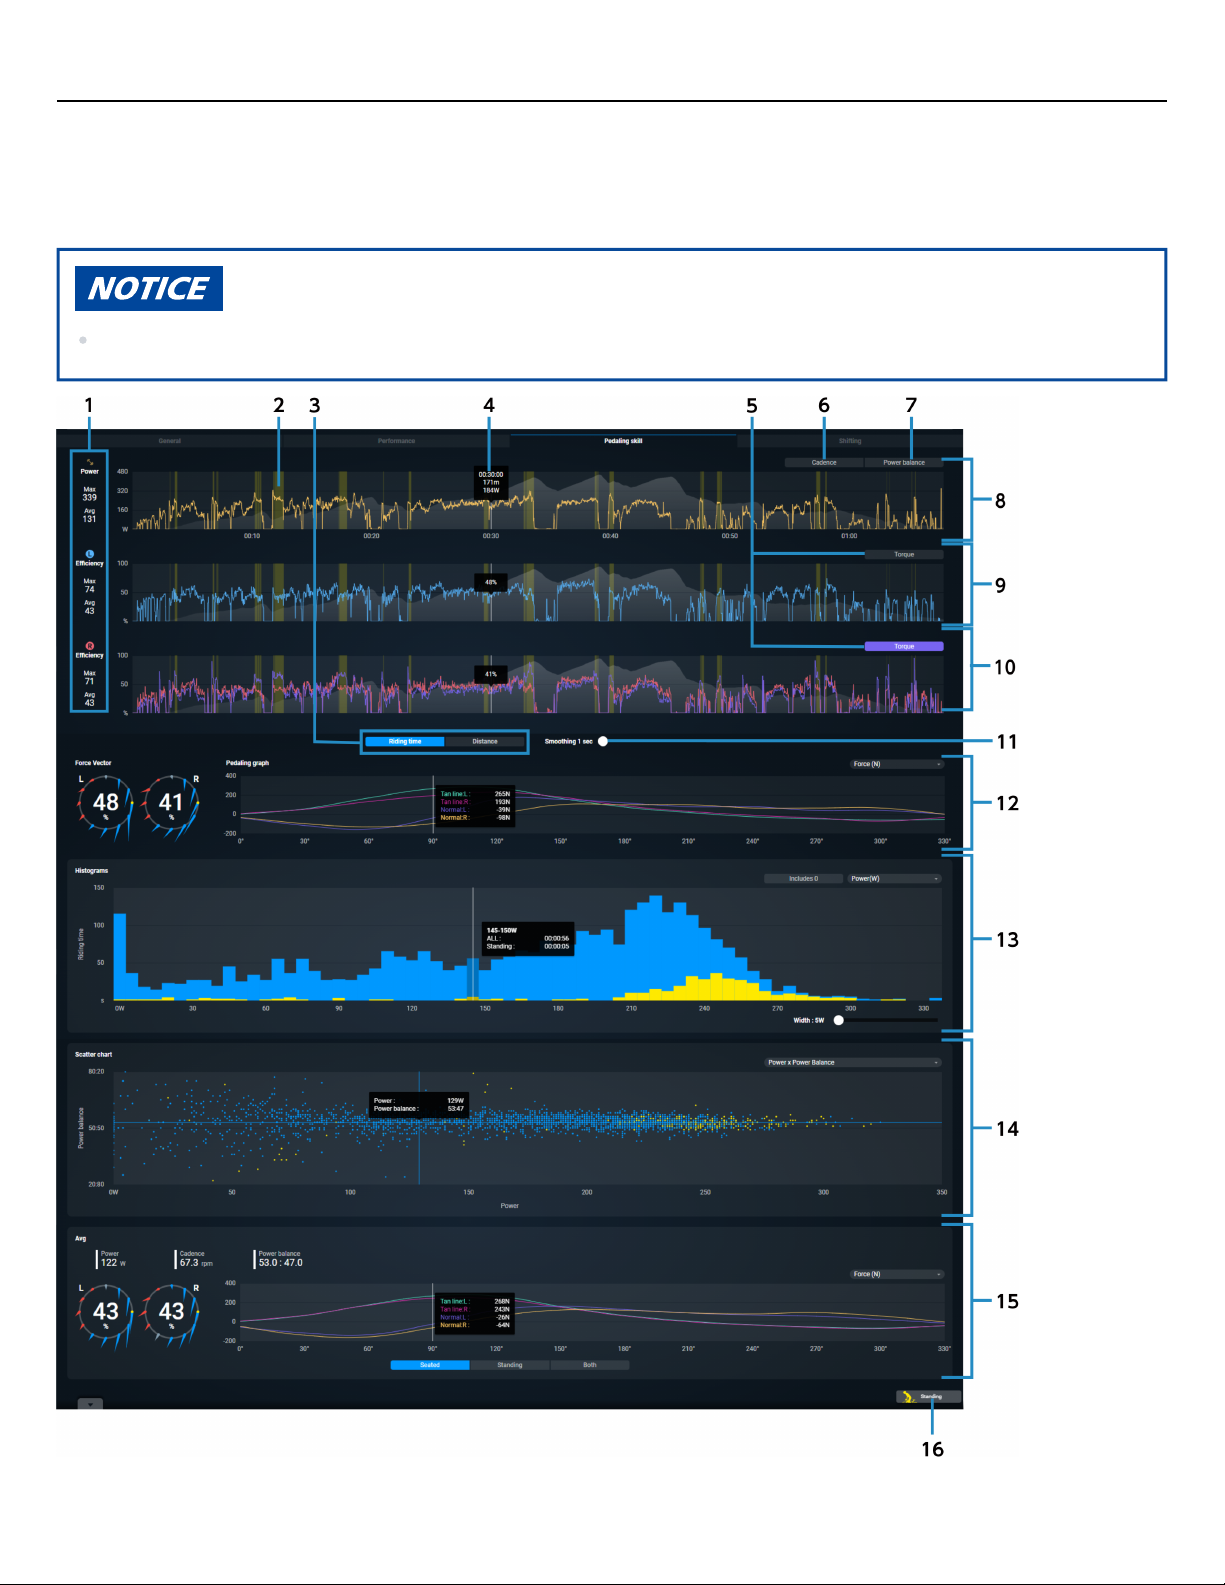
Displays the power and efficiency on the left and right as graphs with the traveling distance or traveling time as
the horizontal axis, as well as the force vector, pedaling graph, histogram, scatter chart, and average.
Some parameters may not be displayed, depending on the recorded activity.
33
Page 34

Analyzing activity
Pedaling skill
Maximum values/average values of parameters(1)
Standing interval(2)
Switch horizontal axis parameter
(3)
Switches the horizontal axis of the graph to traveling time or traveling distance.
Record
(4)
Displays in a popup the values of the parameters at the position (distance or time) where the mouse
pointer is placed.
The location where the values were recorded is also displayed on the map.
Torque
(5)
Overlays a line graph of the torque.
Cadence
(6)
Overlays a line graph of the cadence.
Power balance
(7)
Overlays a scatter graph of the power balance and a 50:50 center line.
Power graph
(8)
Displays the transition of power as a line graph. The gray graph in the background indicates the elevation.
Efficiency graph (left)
(9)
Displays the transition of efficiency on the left as a line graph. The gray graph in the background indicates
the elevation.
Efficiency graph (right)
(10)
Displays the transition of efficiency on the right as a line graph. The gray graph in the background indicates
the elevation.
Smoothing scroll
(11)
Enables you to display a graph with the average values for each set time or distance.
Force vector/pedaling graph per rotation
(12)
Displays the data at the position (distance or time) where the mouse pointer is placed.
Histogram(13)
Scatter chart
(14)
You can select the combination of data from the pull-down menu on the top right to switch the scatter
chart.
Average
(15)
Displays the interval average of the power, cadence, power balance, force vector, and pedaling graph.
Standing
(16)
Displays/hides the standing interval.
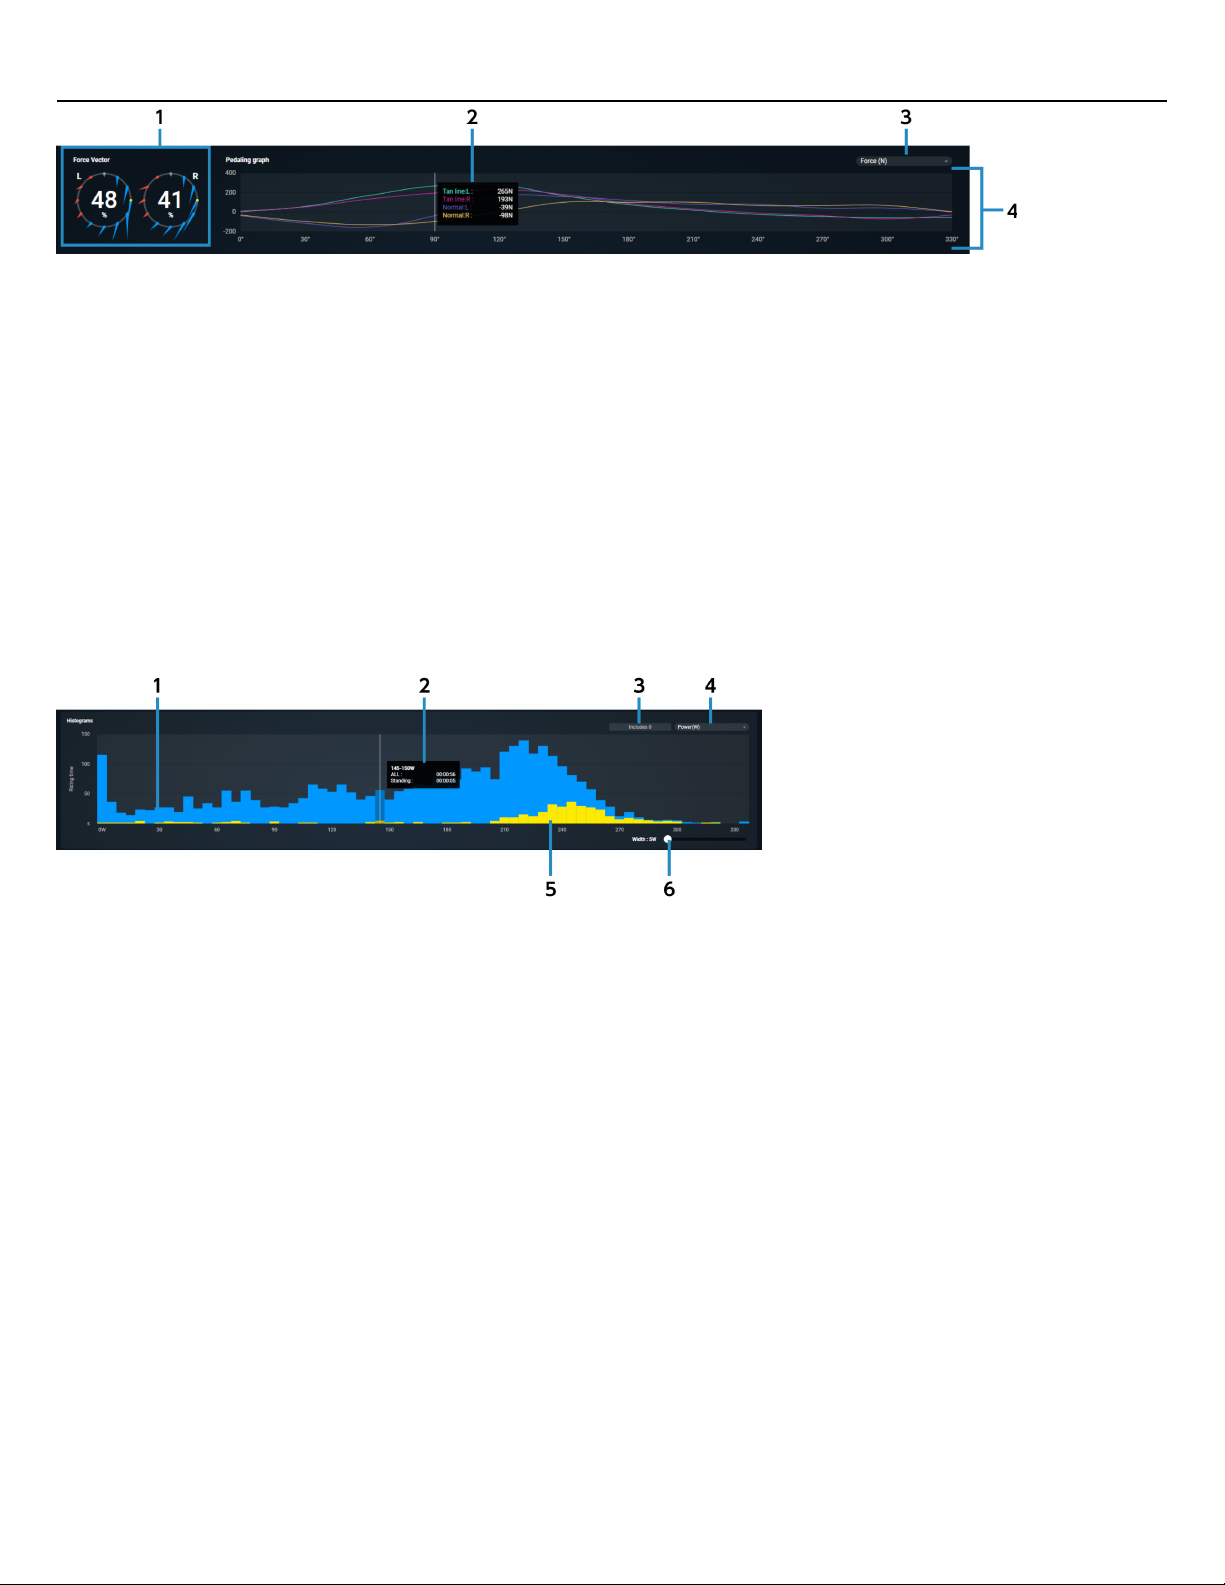
Force vector / pedaling graph per rotation
Displays information regarding pedaling at the time selected in the power graph and efficiency graph.
34
Page 35
Analyzing activity
Pedaling skill
Force vector
(1)
Displays the force applied to the pedal per 30 degrees.
The left and right pedaling efficiency is displayed in the center.
Record
(2)
Displays in a popup the load at the crank angle where the mouse pointer is placed.
Unit switch
(3)
Select [Force (N)] or [Torque (N·m)] as the units for the vertical axis.
Pedaling graph
(4)
Displays a graph with the crank angle as the horizontal axis.
Histogram
Displays the record count, traveling time, or traveling distance histogram.
Histogram bar graph
(1)
Displays the selected parameter as a graph.
Record
(2)
Displays in a popup the values of the parameters at the position where the mouse pointer is placed.
The location where the values were recorded is also displayed on the map.
Include zero
(3)
Switches whether to include 0 value data.
Parameters
(4)
Select the parameters to display.
Standing bar graph
(5)
Displays a graph of the standing record.
Horizontal axis width scroll
(6)
Changes the fineness of the horizontal axis.
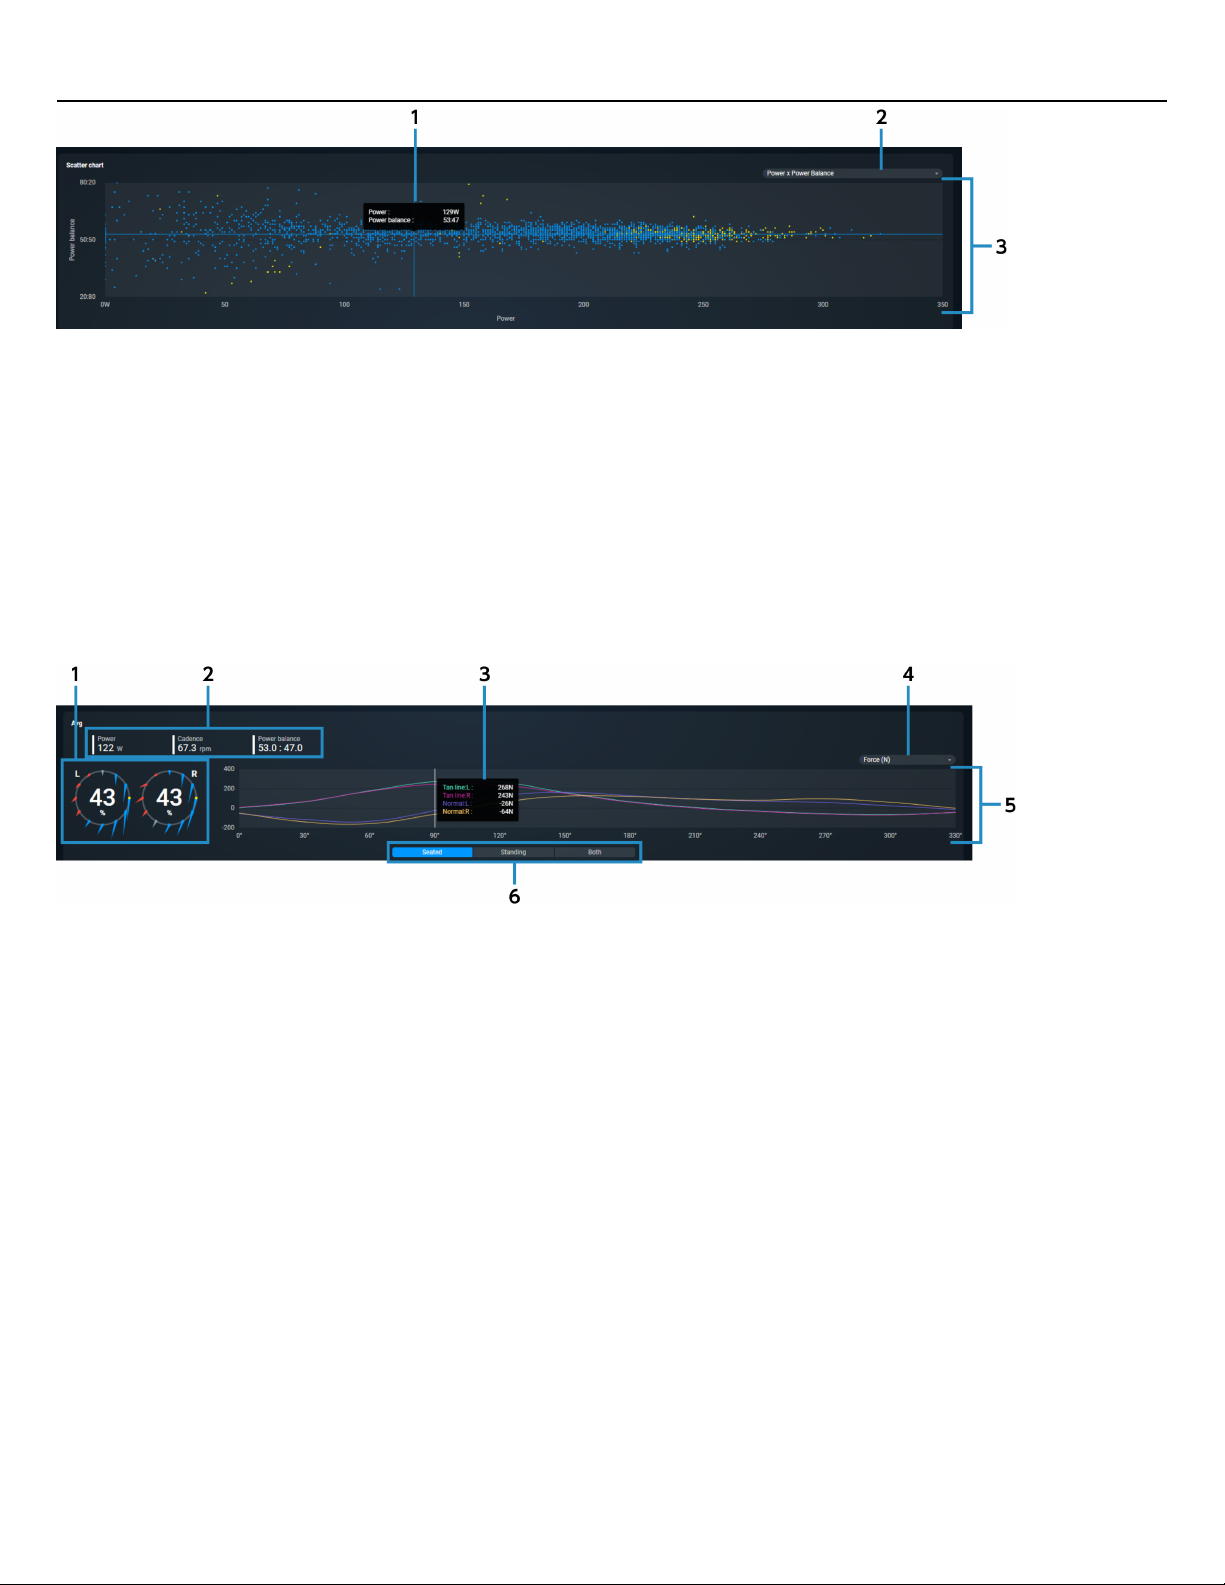
Scatter chart
Displays a scatter chart with different data for the horizontal axis and vertical axis.
35
Page 36
Analyzing activity
Pedaling skill
Record
(1)
Displays in a popup the values of the parameters at the position (such as distance or time) where the mouse
pointer is placed.
Scatter chart selection
(2)
Selects the combination of horizontal axis and vertical axis for the scatter chart.
Scatter chart(3)
Average of pedaling skill
Displays the average of the displayed interval for the power, cadence, power balance, force vector, and pedaling
graph.
Force vector
(1)
Displays the average of the force applied to the pedal per 30 degrees.
The average of the left and right pedaling efficiency is displayed in the center.
Average values of the power, cadence, and power balance(2)
Record
(3)
Displays in a popup the load at the crank angle where the mouse pointer is placed.
Unit switch
(4)
Select [Force (N)] or [Torque (N·m)] as the units for the vertical axis.
Pedaling graph
(5)
Displays a graph with the crank angle as the horizontal axis.
Seated/standing/both
(6)
Displays the average of the data by position when pedaling.
36
Page 37
Analyzing activity
Shifting
Shifting
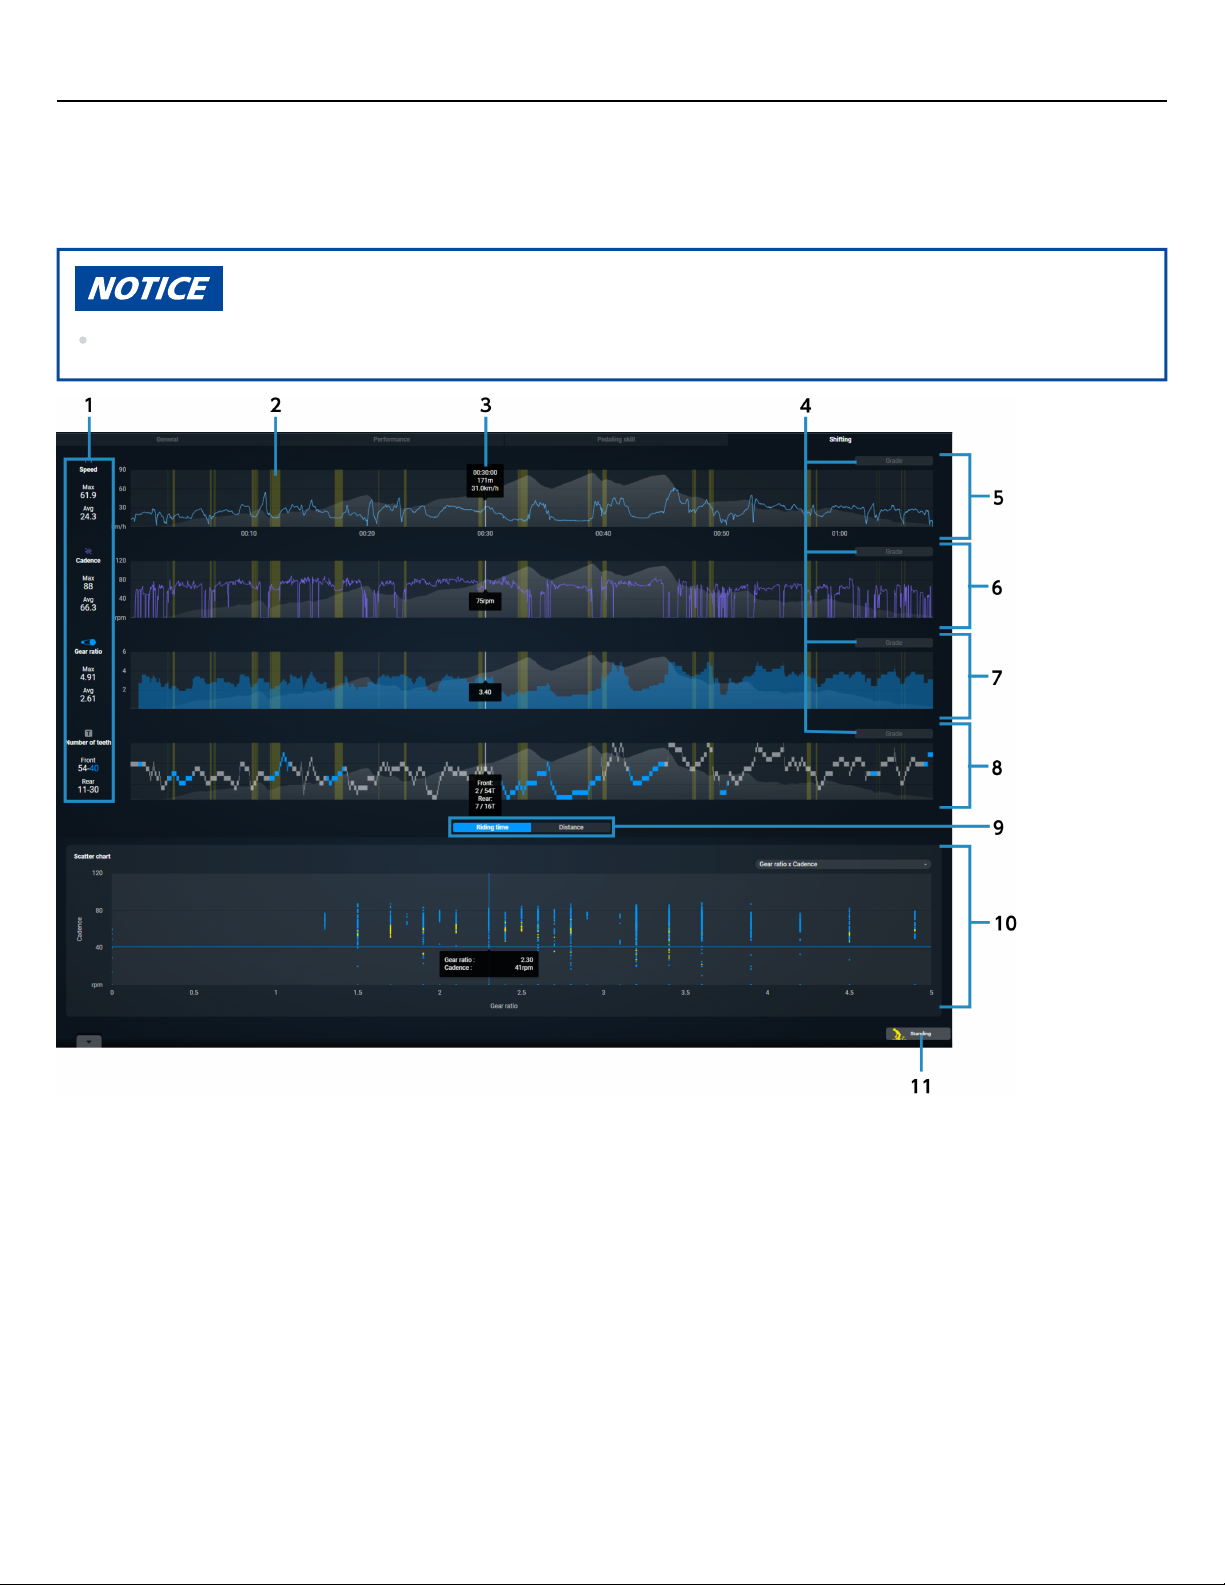
Displays the speed, cadence, gear ratio, and number of teeth as a graph with the traveling distance or traveling
time as the horizontal axis, as well as a scatter chart.
Some parameters may not be displayed, depending on the recorded activity.
Maximum values/average values of parameters
(1)
The number of teeth at the rear and front is displayed for the number of teeth.
Standing interval(2)
Record
(3)
Displays in a popup the values of the parameters at the position (distance or time) where the mouse
pointer is placed.
The location where the values were recorded is also displayed on the map.
Grade
(4)
Overlays a graph of the grade.
Speed graph
(5)
Displays the transition of speed as a line graph. The gray graph in the background indicates the elevation.
37
Page 38
Analyzing activity
Shifting
Cadence graph
(6)
Displays the transition of cadence as a line graph. The gray graph in the background indicates the
elevation.
Gear ratio graph
(7)
Displays the transition of the gear ratio as a line graph. The gray graph in the background indicates the
elevation.
Number of teeth graph
(8)
Displays the transition of the number of teeth as a line graph. The gray graph in the background indicates
the elevation.
Switch horizontal axis parameter
(9)
Switches the horizontal axis of the graph to traveling time or traveling distance.
Scatter chart
(10)
You can select the combination of data from the pull-down menu on the top right to switch the scatter
chart.
Standing
(11)
Displays/hides the standing interval.
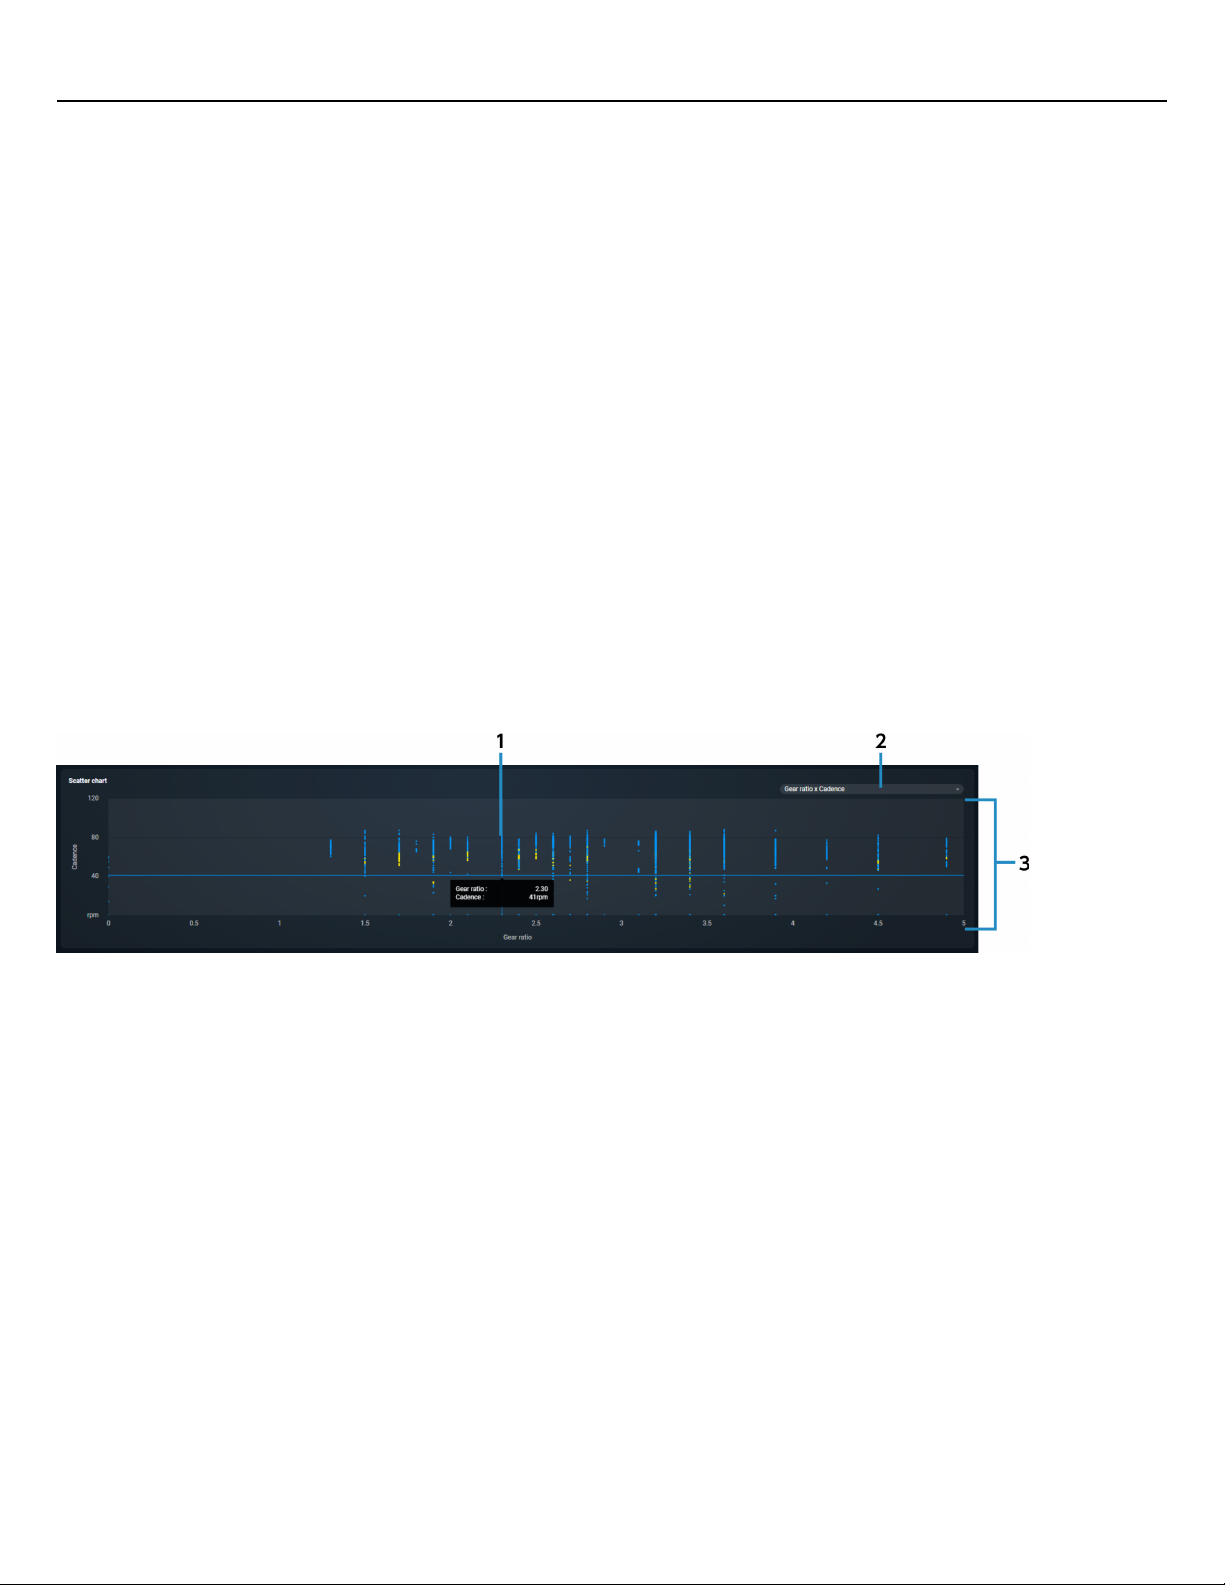
Scatter chart
Displays a scatter chart with different data for the horizontal axis and vertical axis.
Record
(1)
Displays in a popup the values of the parameters at the position (such as distance or time) where the mouse
pointer is placed.
Scatter chart selection
(2)
Selects the combination of horizontal axis and vertical axis for the scatter chart.
Scatter chart(3)
38
Page 39
Analyzing activity
Interval area
Interval area
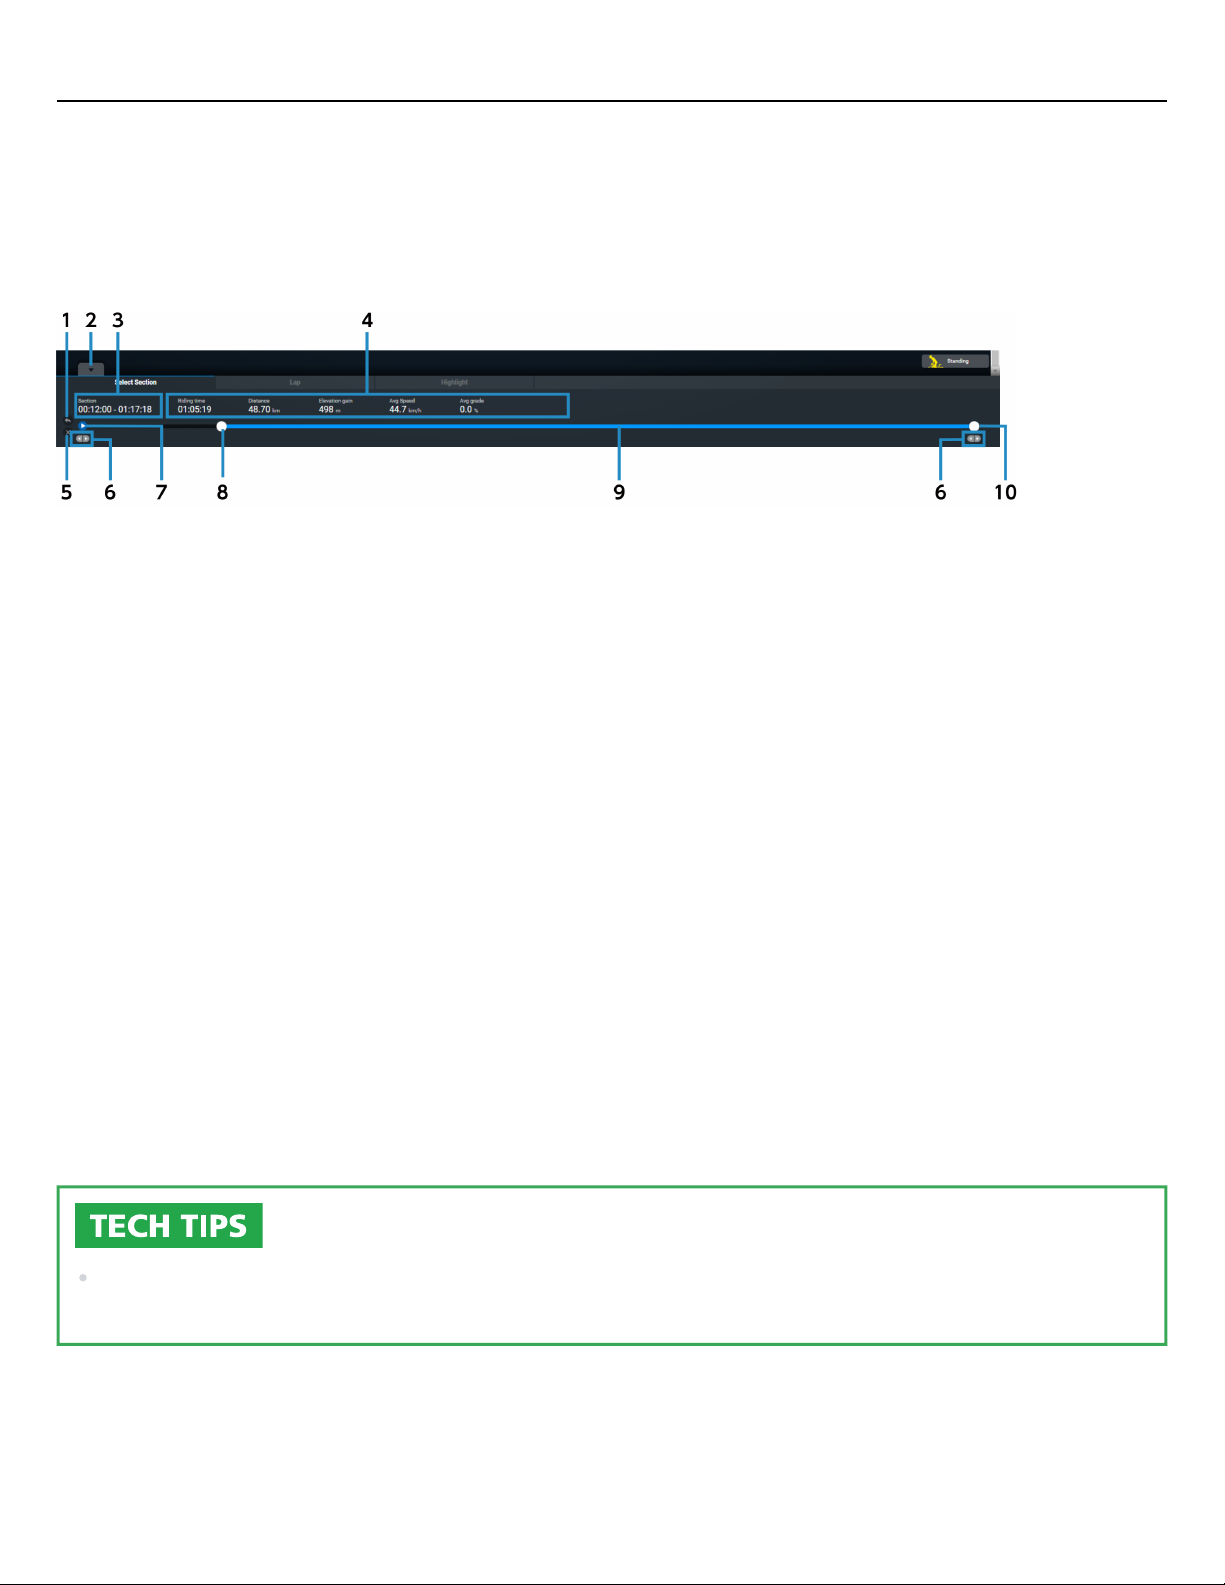
Selects the interval, lap, or highlight to display the analysis data for.
Interval selection
Enables you to check the data by selecting a custom range, etc.
Restore selected interval
(1)
Restores the view of the previously selected interval.
Switch interval area view
(2)
Displays/hides the interval area.
Selected interval view
(3)
Displays the selected traveling time or traveling position.
Summary view
(4)
Displays an overview of the activity data for the selected interval.
Reset selected interval
(5)
Resets the selected traveling time or traveling position.
Next record/previous record
(6)
Enables you to adjust the start and end positions of the interval by record.
Activity start area icon(7)
Interval start position
(8)
Enables you to adjust the interval by moving it left or right.
Selected interval
(9)
The selected interval. The corresponding interval is displayed in blue on the map.
Interval end position
(10)
Enables you to adjust the interval by moving it left or right.
You can also drag the mouse inside the displayed graph to select the interval. Double-clicking clears the
selected interval.
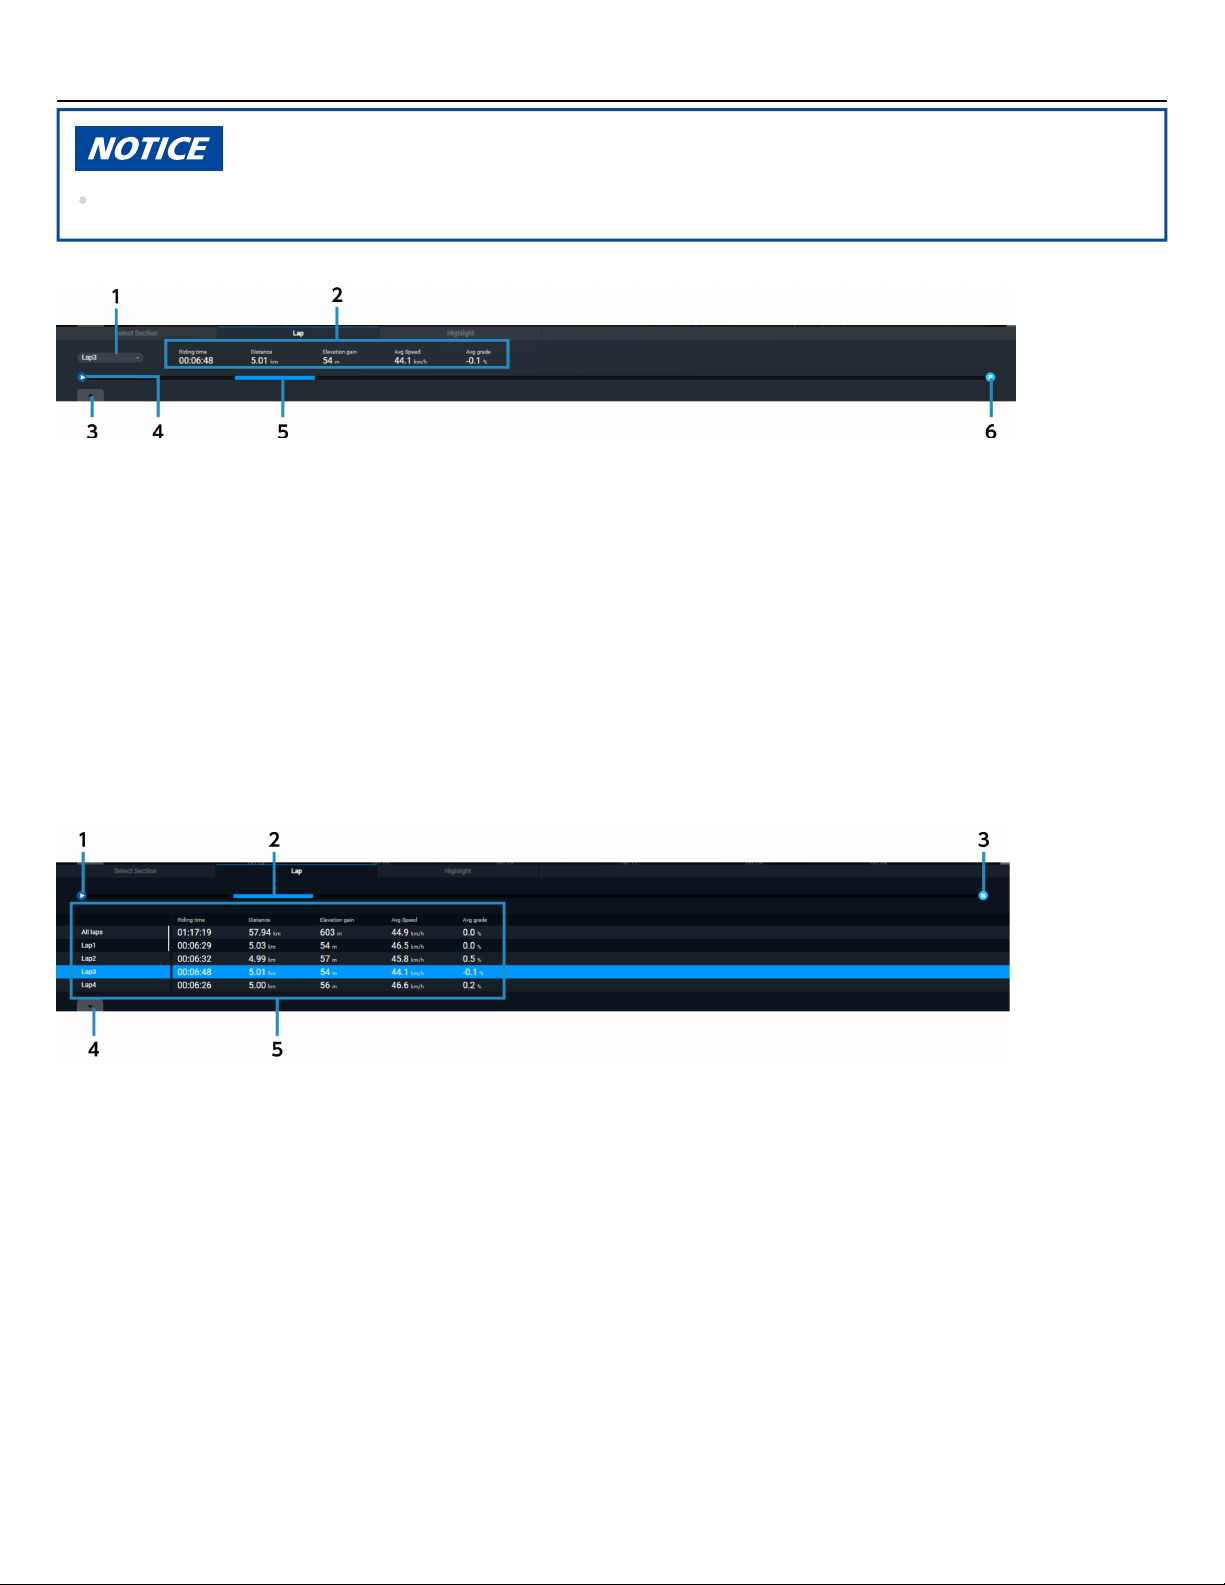
Lap
Performing lap operations on a cycle computer, etc. enables you to compare summaries by lap.
39
Page 40
Analyzing activity
Interval area
Laps are not displayed unless lap information is recorded using a cycle computer, etc.
Normal view
Lap selection
(1)
Select the lap to display from the pull-down menu.
Summary view
(2)
Displays an overview of the activity data for the selected lap.
List view
(3)
Select this to display the lap list screen.
Activity start area icon(4)
Lap position
(5)
Displays the interval of the selected lap within the entire activity.
Activity end area icon(6)
Lap list
Activity start area icon(1)
Lap position
(2)
Displays the interval of the selected lap within the entire activity.
Activity end area icon(3)
Normal view
(4)
Select this to return the view to the normal view screen.
Summary view
(5)
Displays an overview of the activity and each lap.
Highlights
Enables you to check the data with a focus on intervals within the activity with a particularly high intensity of
motion.
40
Page 41
Analyzing activity
Interval area
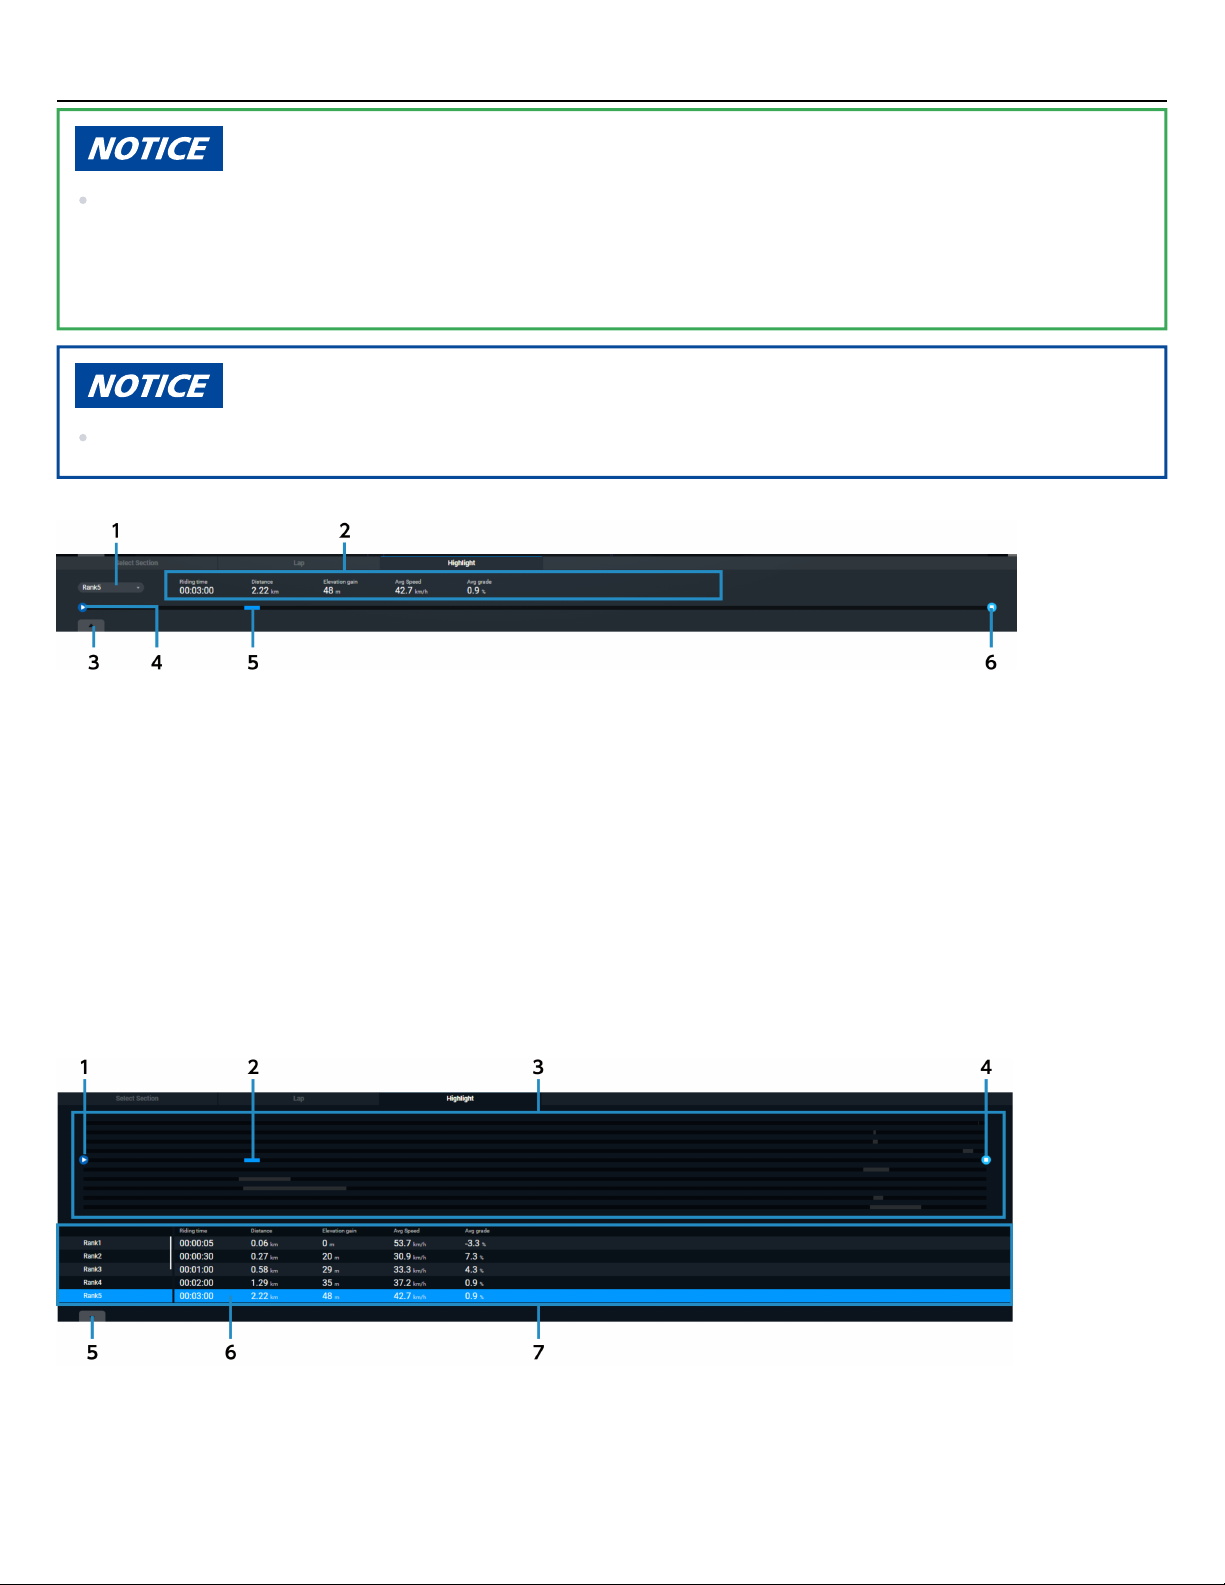
Intervals with a relatively high intensity of motion are automatically extracted and displayed in order from
rank 1 to a maximum of rank 10 with the seasonal best power curve as the reference value.
The interval target is 5 seconds, 30 seconds, 1 minute, 2 minutes, 3 minutes, 5 minutes, 10 minutes, and 20
minutes.
Highlights are not displayed unless power data is recorded.
Normal view
Highlight selection
(1)
Select the highlight to display from the pull-down menu.
Summary view
(2)
Displays an overview of the activity data for the selected highlight.
List view
(3)
Select this to display the highlight list screen.
Activity start area icon(4)
Highlight position
(5)
Displays the interval of the selected highlight within the entire activity.
Activity end area icon(6)
Highlight list
Activity start area icon(1)
Selected highlight position
(2)
Displays the interval of the selected highlight within the entire activity.
41
Page 42

Analyzing activity
Interval area
Highlight position
(3)
Displays a list of highlight positions.
Activity end area icon(4)
Normal view
(5)
Select this to return the view to the normal view screen.
Selected highlight summary view(6)
Summary view
(7)
Displays the summary list of the highlight.
42
Page 43
Changing settings
About settings
Changing settings
About settings
You can configure user settings, screen display settings, and the Web link service.
Setting user information
Setting the display preferences
Setting a private location
Setting the view of the dashboard
Setting a parameter group
Setting the items to display in the activity list
Importing activity data
Exporting activity data
Resetting the password for SGX-CA600 or Cyclo-Sphere Control
The setting method and displayed information differ on a smartphone.
43
Page 44
Changing settings
Setting user information
Setting user information
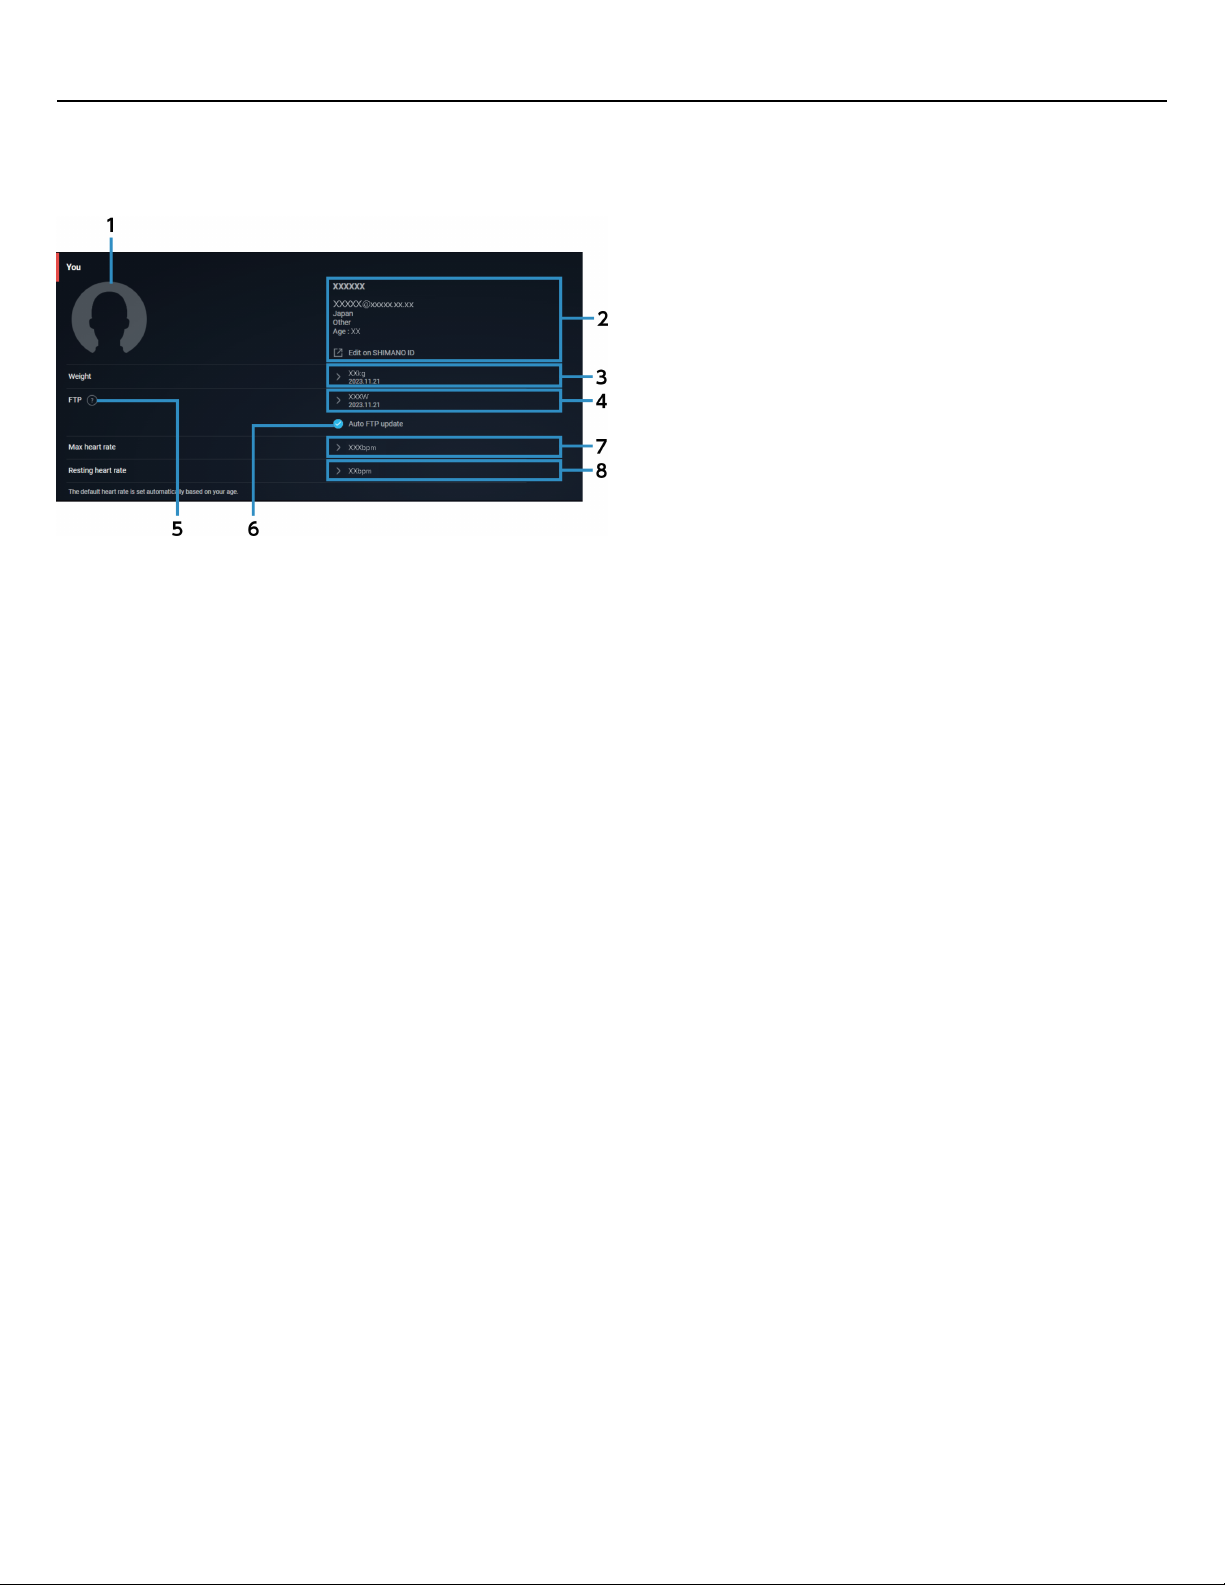
You can set items related to the user, such as the username, profile picture, and FTP values.
Profile picture
(1)
Displays the profile picture setting dialog.
User information
(2)
Displays the user information registered in SHIMANO ID PORTAL. Select it to display the personal page of
SHIMANO ID PORTAL.
Weight
(3)
Displays the most recent weight that was registered. Select it to display the weight setting dialog, which
displays a graph indicating weight changes over time. You can also add, edit, and delete data on weights
and measurement dates.
FTP
(4)
Displays the most recent FTP that was registered. Select it to display the FTP setting dialog, which displays a
graph indicating FTP changes over time. You can also add, edit, and delete data on FTP and measurement
dates.
FTP help
(5)
Displays the FTP help dialog.
Auto FTP update
(6)
Sets whether to automatically update the FTP.
If this setting is enabled, when the activities for the most recent nine weeks are uploaded, the FTP is
automatically calculated and that FTP value is automatically registered if an increase has been detected. If
the FTP has not increased over the most recent nine weeks, an FTP value lower than the value currently set
may be registered.
Maximum heart rate
(7)
Displays the maximum heart rate that is registered. Select this to display the maximum heart rate setting
dialog, which enables you to update the maximum heart rate.
Heart rate at rest
(8)
Displays the resting heart rate that is registered. Select it to display the resting heart rate setting dialog,
which enables you to update the heart rate at rest.
44
Page 45
Changing settings
Setting user information
The default heart rate is automatically set based on the birth year registered for the SHIMANO ID.
The weight and heart rate can only be entered if you consent to the handling of health data in SHIMANO
ID PORTAL.
45
Page 46
Changing settings
Setting the display preferences
Setting the display preferences
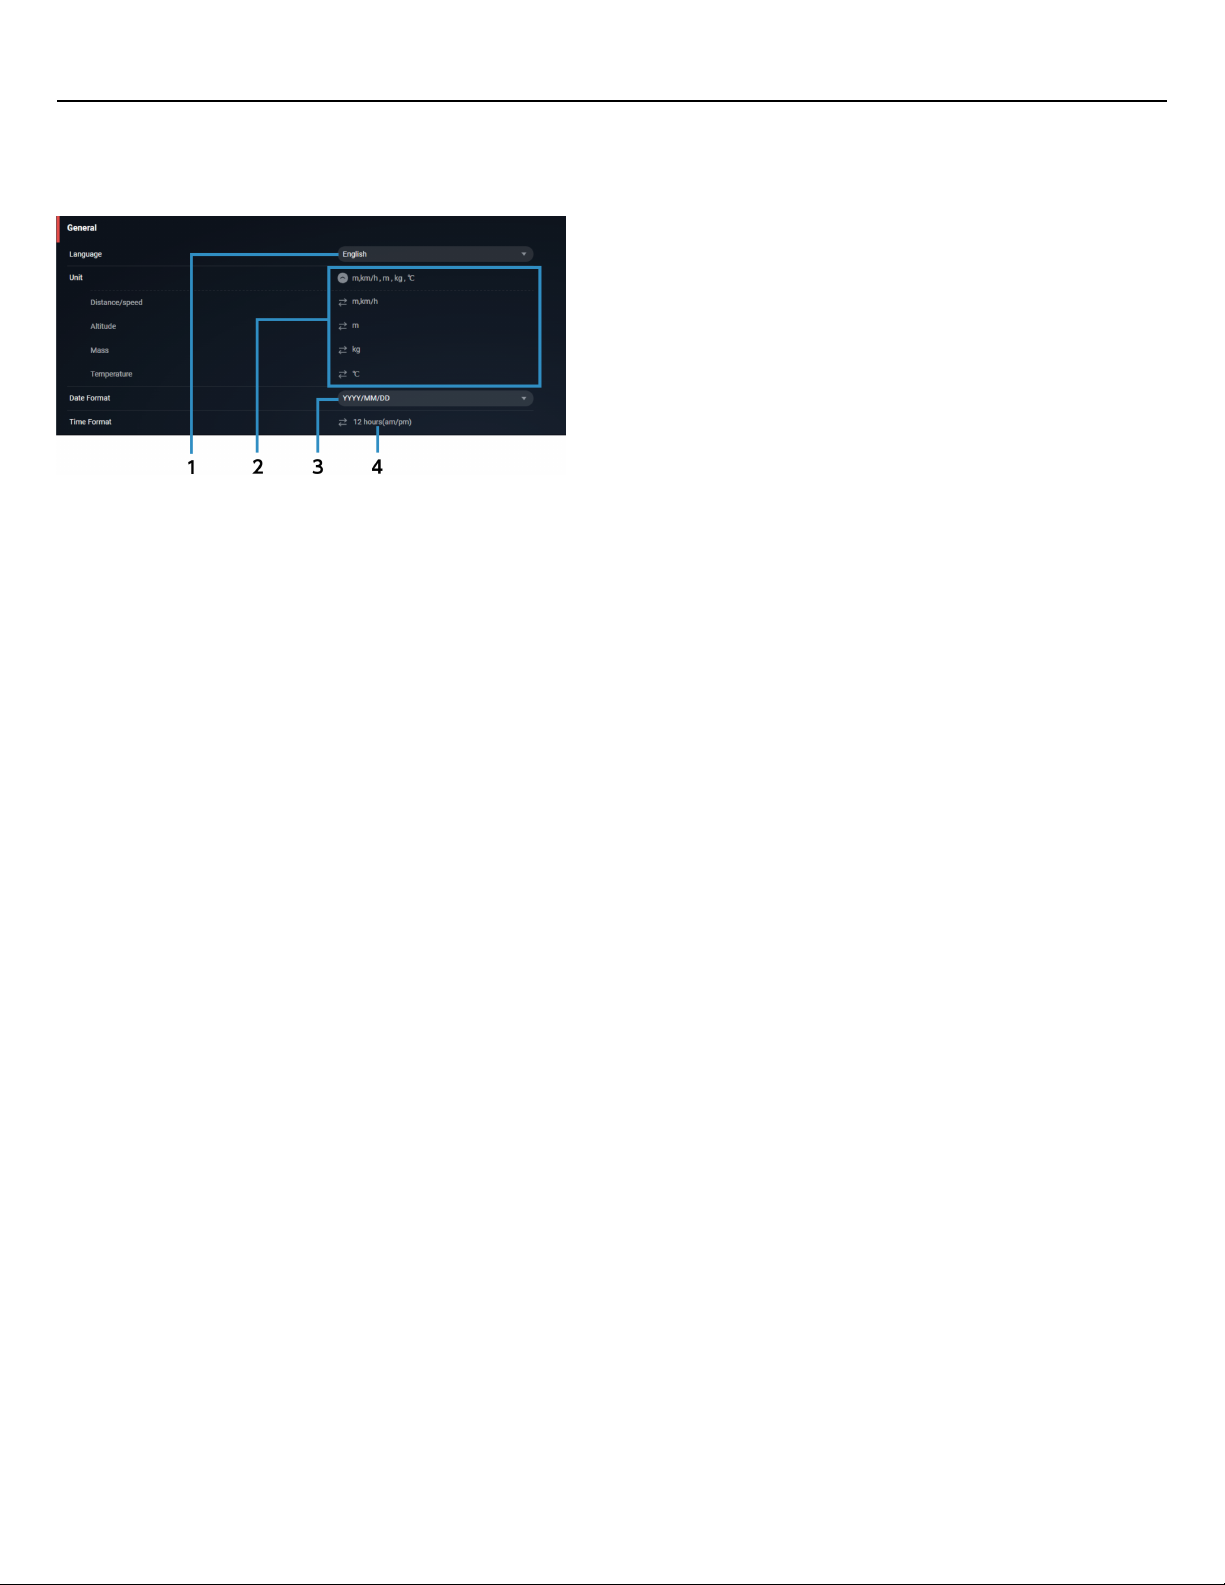
You can set the display preferences, such as the language and displayed units.
Language
(1)
Select the language to display from the pull-down menu.
Unit
(2)
Select the units of data to display.
Date format
(3)
Select the display format for dates from the pull-down menu.
Time format
(4)
Switches between the 12-hour format and 24-hour format.
46
Page 47
Changing settings
Setting a private location
Setting a private location
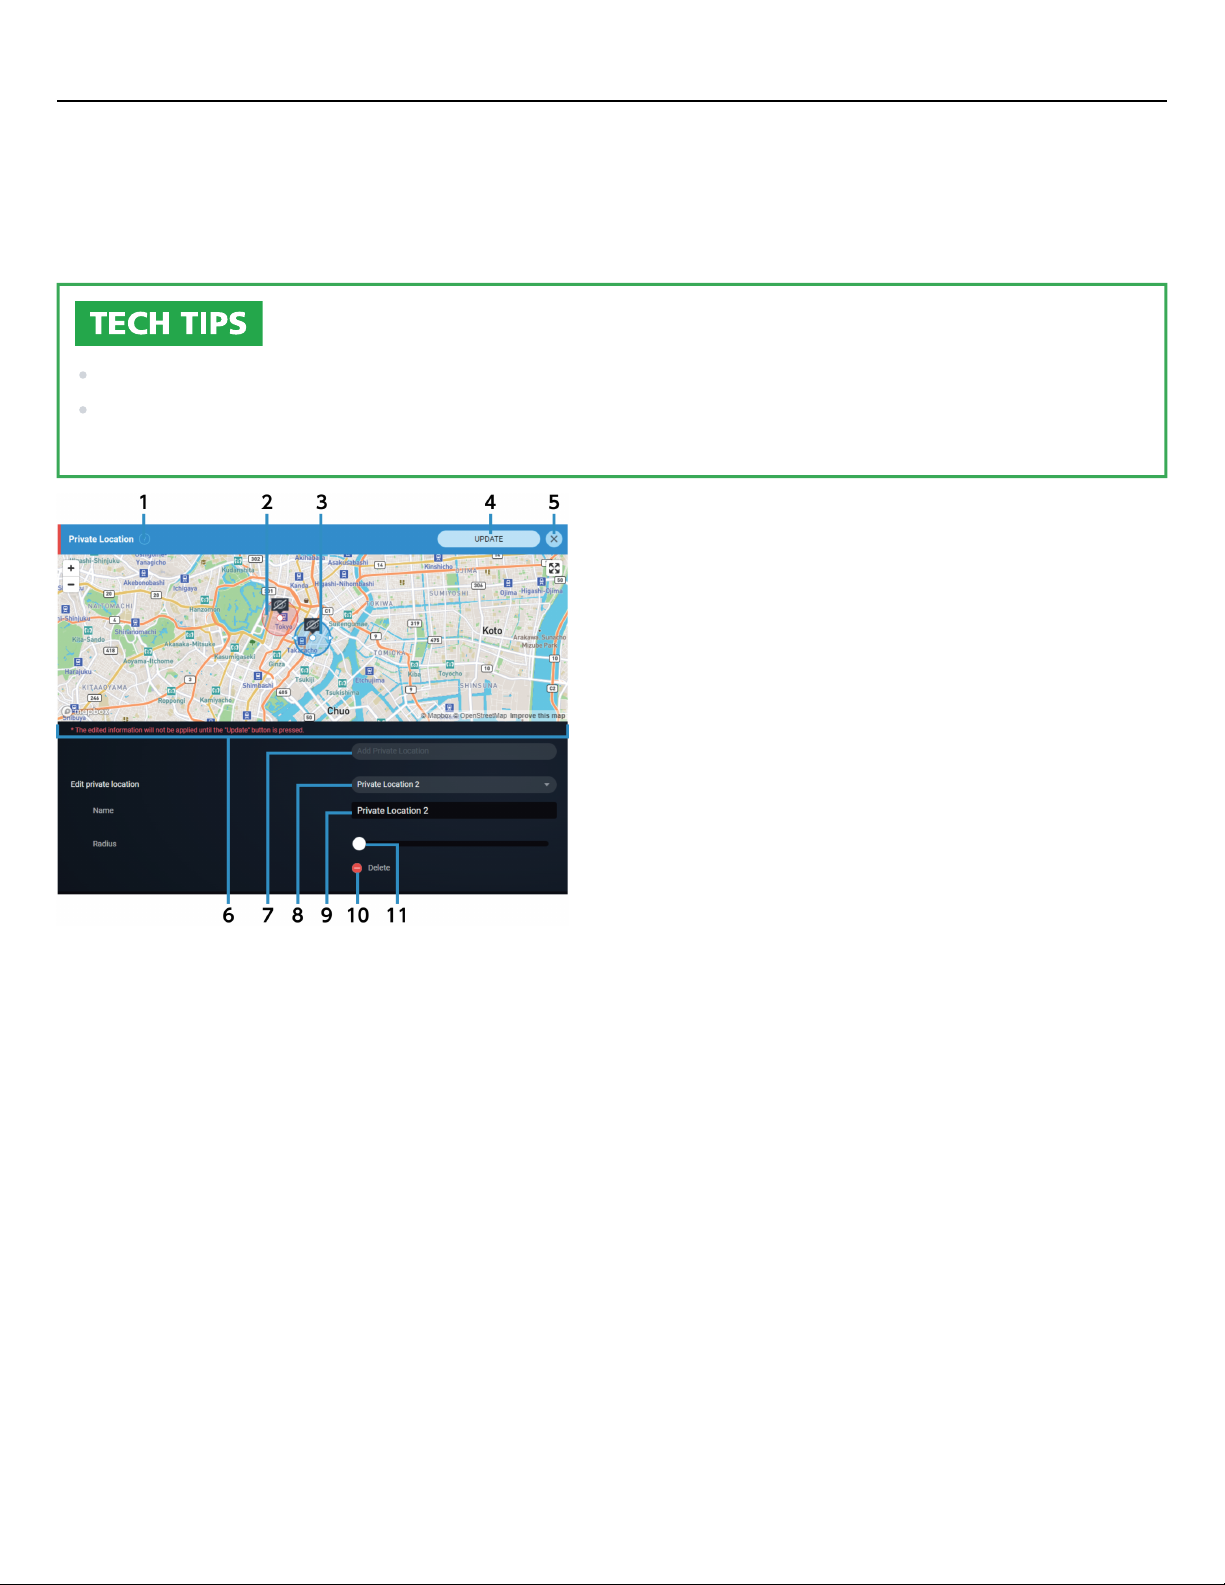
When sharing activities with SHIMANO CONNECT Lab, you can specify an area that you do not want to disclose,
such as near your home.
Travel paths are not displayed for the ranges set as private locations.
If the setting screen is not displayed, select [Not set].
When setting a private location for the first time, select [Add Private Location] to display the setting
screen.
Tutorial
(1)
Displays the tutorial dialog for private locations.
Private location being edited(2)
Registered private location(3)
Update
(4)
Registers the edited private location.
Cancel
(5)
Discards the changes.
Map view
(6)
Displays the set private location. The private location that is currently selected is displayed in blue.
Drag the center to move it or the four points around the circumference to change the radius.
Add private location
(7)
Sets a new private location.
Select private location to edit(8)
Name(9)
47
Page 48
Changing settings
Setting a private location
Edits the name of the private location.
Delete
(10)
Deletes the private location being edited.
Private location radius
(11)
Adjusts the radius using the slider.
When sharing activity data, make sure to set a private location so that the area near your home, etc.
cannot be determined.
When activity data is exported to a linked Web service, the private location settings are not applied.
48
Page 49
Changing settings
Setting the view of the dashboard
Setting the view of the dashboard
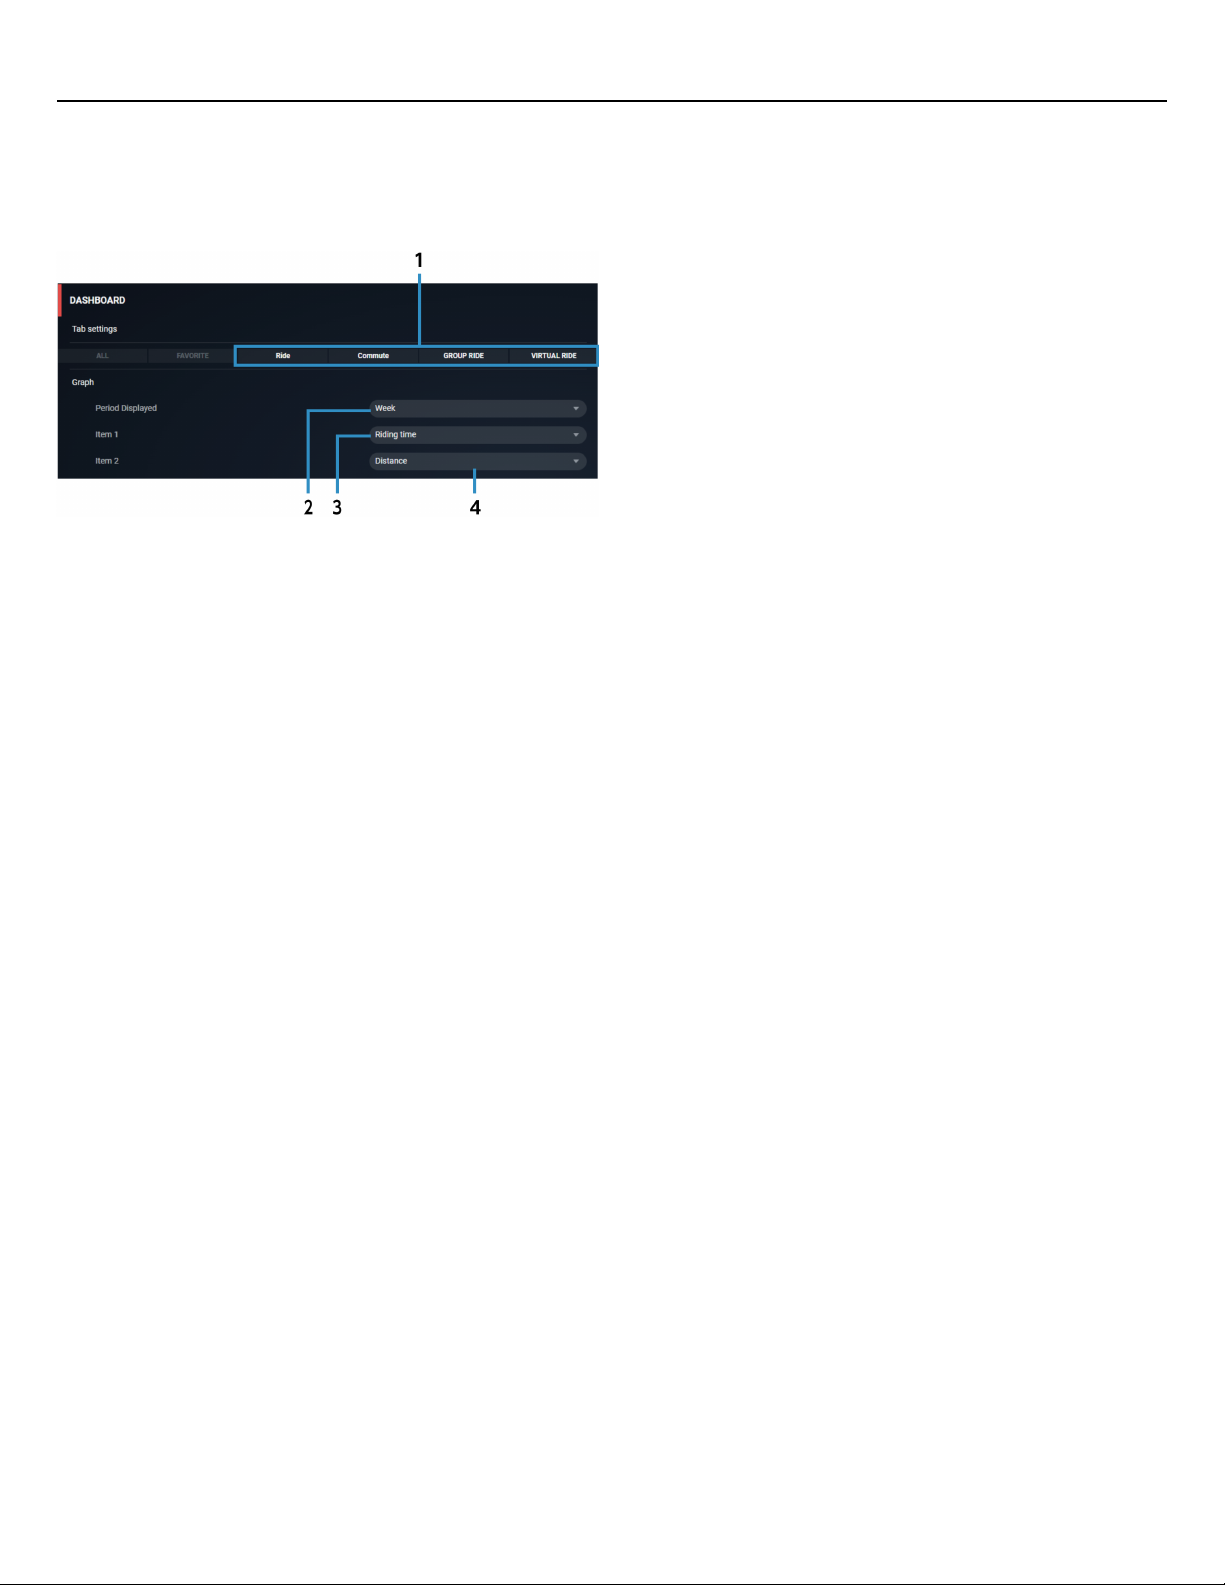
Select the activity category to display on the dashboard.
Set the interval and items to display in the statistics (graph).
Tab settings
(1)
Select the activity category to display on the dashboard from the pull-down menu.
Period to display
(2)
Set to display the statistics per week or display the statistics per month.
Item 1
(3)
Set the item of statistics from the pull-down menu.
Item 2
(4)
Set the item of statistics from the pull-down menu.
49
Page 50
Changing settings
Setting a parameter group
Setting a parameter group
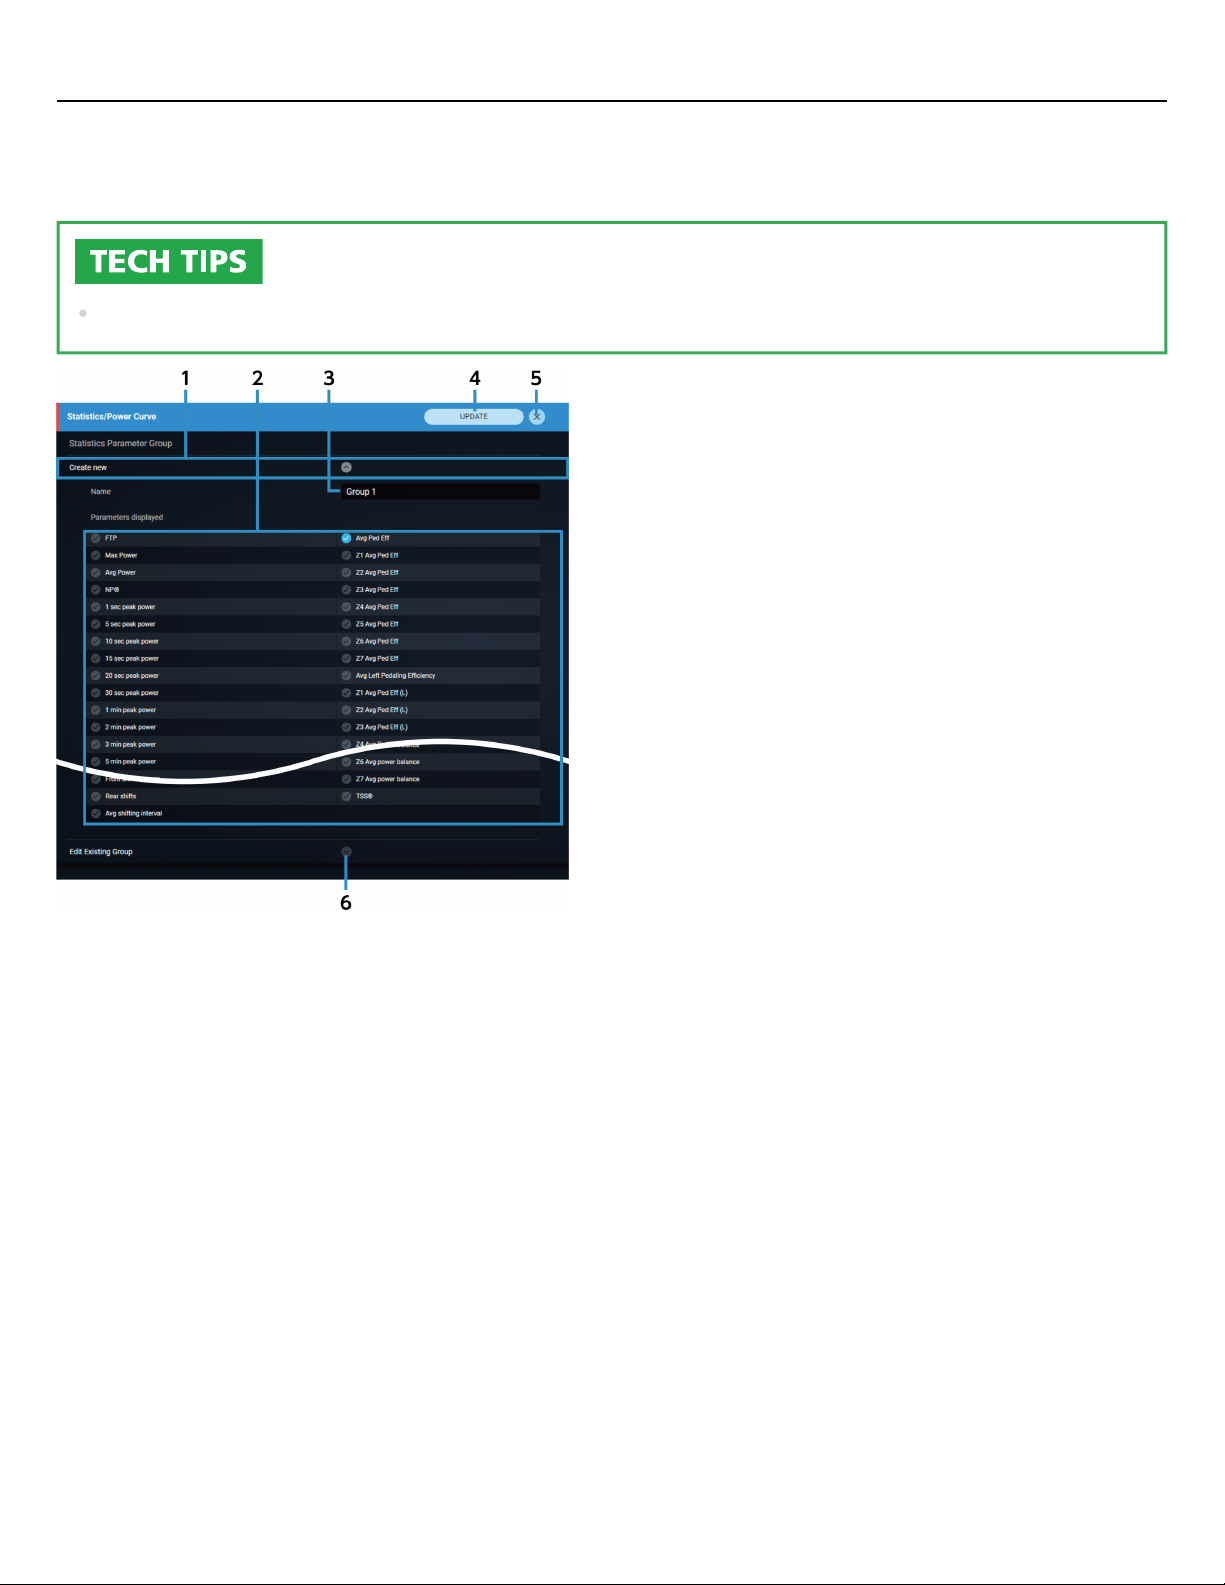
You can group parameter items to display in the statistics.
If the setting screen is not displayed, select [Open].
Create new
(1)
Creates a new statistics parameter group.
Select up to four items of data to display, enter the group name, then select [UPDATE].
Parameter to display
(2)
Select the item to display.
Group name
(3)
Edit the group name.
Update
(4)
Registers the edited parameter group.
Cancel
(5)
Discards the changes.
Edit created group
(6)
Select the group that you created, re-select the parameters to display, edit the group name, and select
[UPDATE].
To delete a group, select the group and select [Delete].
50
Page 51
Changing settings
Setting the items to display in the activity list
Setting the items to display in the activity list
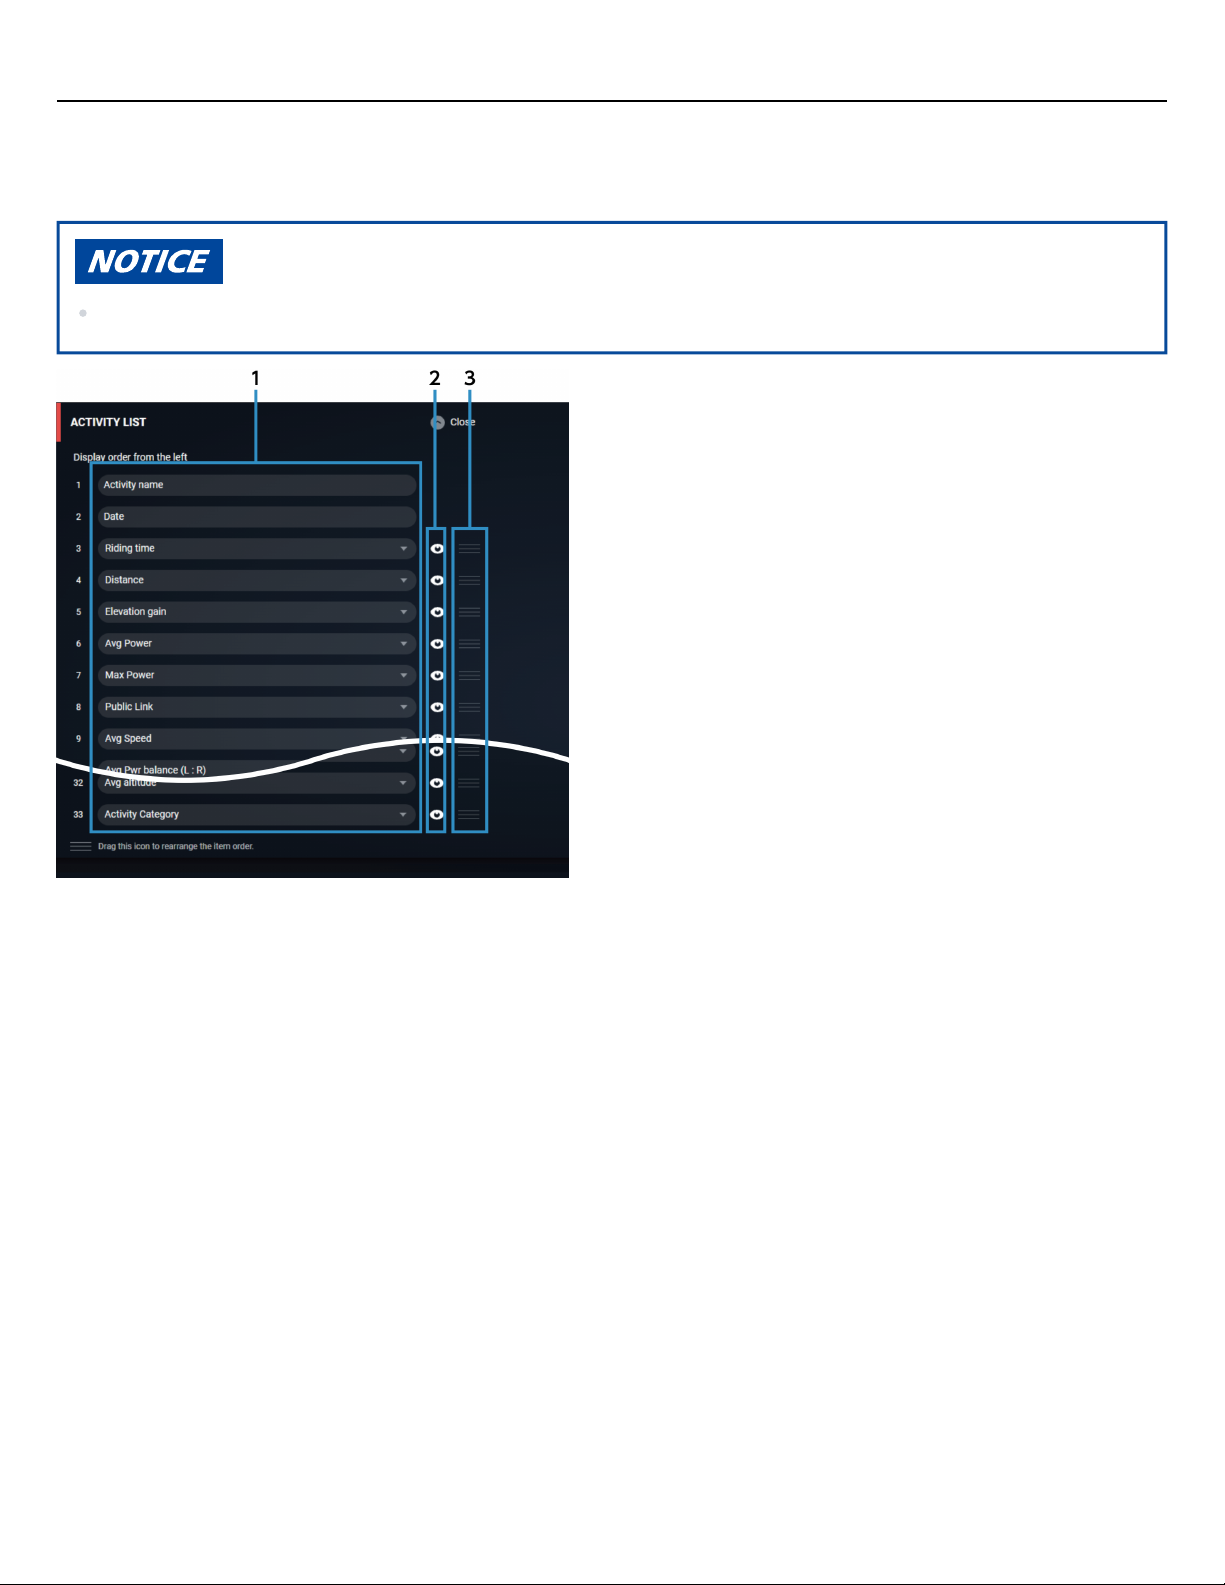
Set the order of the parameters to display in the activity list.
If you are using a smartphone, the activity list is not displayed.
Parameter items
(1)
The items are sorted when displayed.
Select the item to change the order from the menu displayed when you select this.
The activity name and date order cannot be changed.
Switch view
(2)
Select this to switch between displaying and hiding.
Sort
(3)
Enables you to change the order of the items with drag operations.
51
Page 52
Changing settings
Importing activity data
Importing activity data
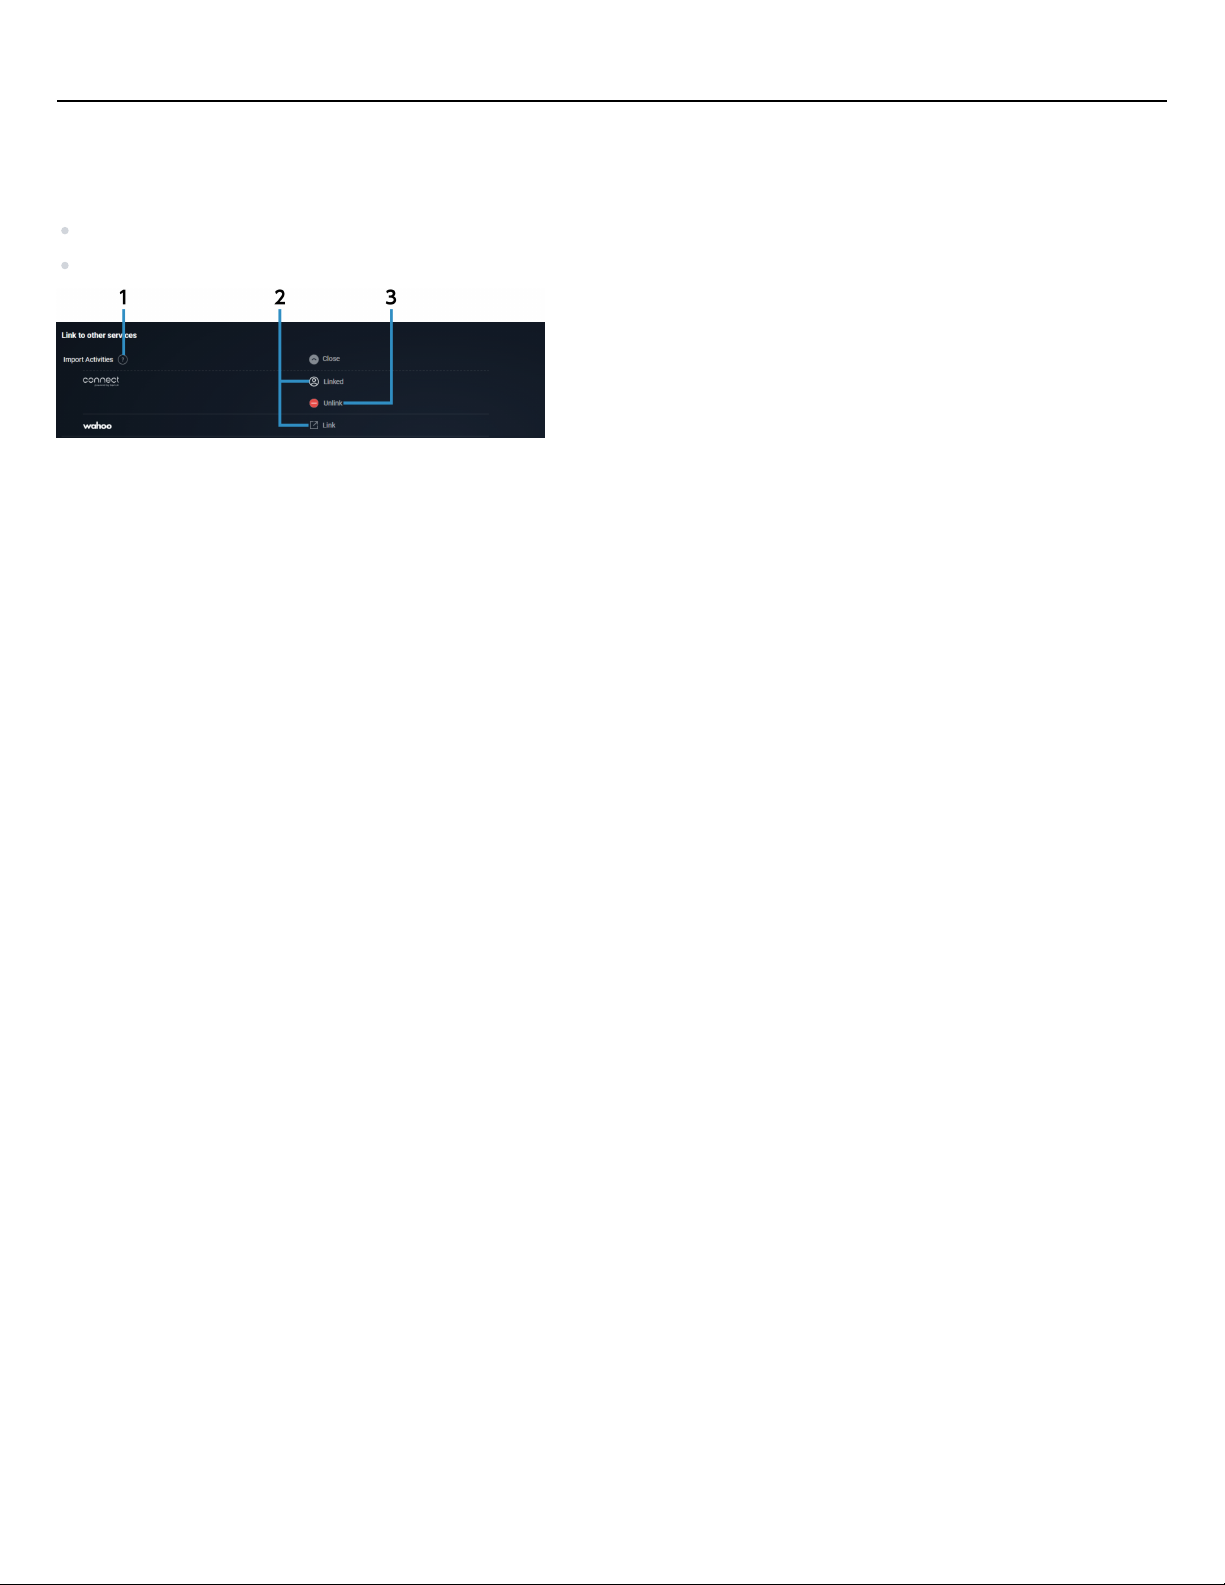
You can set whether to import activity data from the following Web services:
Garmin Connect
Wahoo Fitness
Help
(1)
Displays the import help dialog.
Link
(2)
To import activity data from a Web service, select [Link], log in to the target service, and confirm the terms
of use.
™
If you have already configured the settings for linking with the Web service, [Linked] or the user name is
displayed.
Unlink
(3)
Cancels the settings for linking with the Web service.
52
Page 53
Changing settings
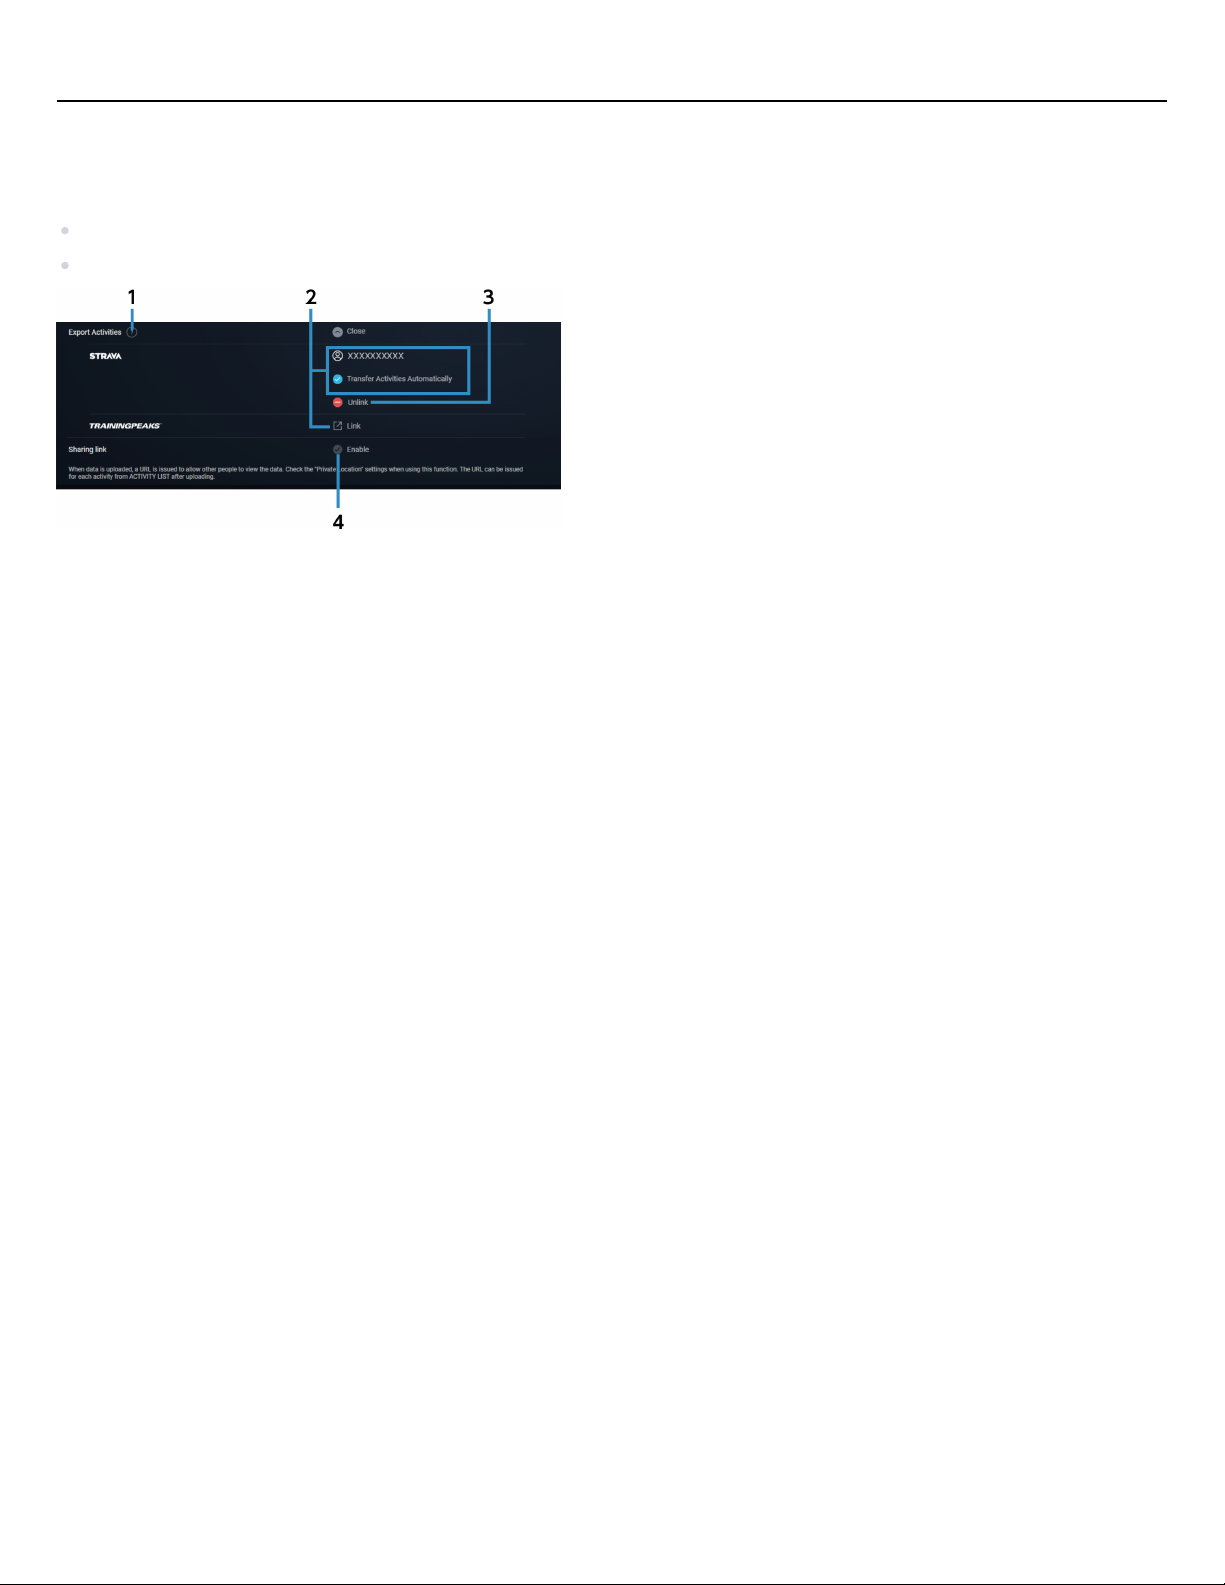
Exporting activity data
Exporting activity data
You can set whether to export activity data to the following Web services:
STRAVA
TrainingPeaks
(1)
™
™
Help
Displays the export help dialog.
Link
(2)
To forward activity data to the Web service, select [Link] and proceed to enter a contract with the Web
service and perform registration from the link.
If you have already configured the settings for linking with the Web service, the user name is displayed.
If you select [Transfer Activities Automatically], when activity data is uploaded to SHIMANO CONNECT Lab,
the data is forwarded to the Web service at the same time.
Unlink
(3)
Cancels the settings for linking with the Web service.
Sharing link
(4)
If the sharing link is enabled, a URL for sharing the corresponding activity analysis screen is issued when the
data is uploaded.
53
Page 54
Changing settings
Resetting the password for SGX-CA600 or Cyclo-Sphere Control
Resetting the password for SGX-CA600 or CycloSphere Control
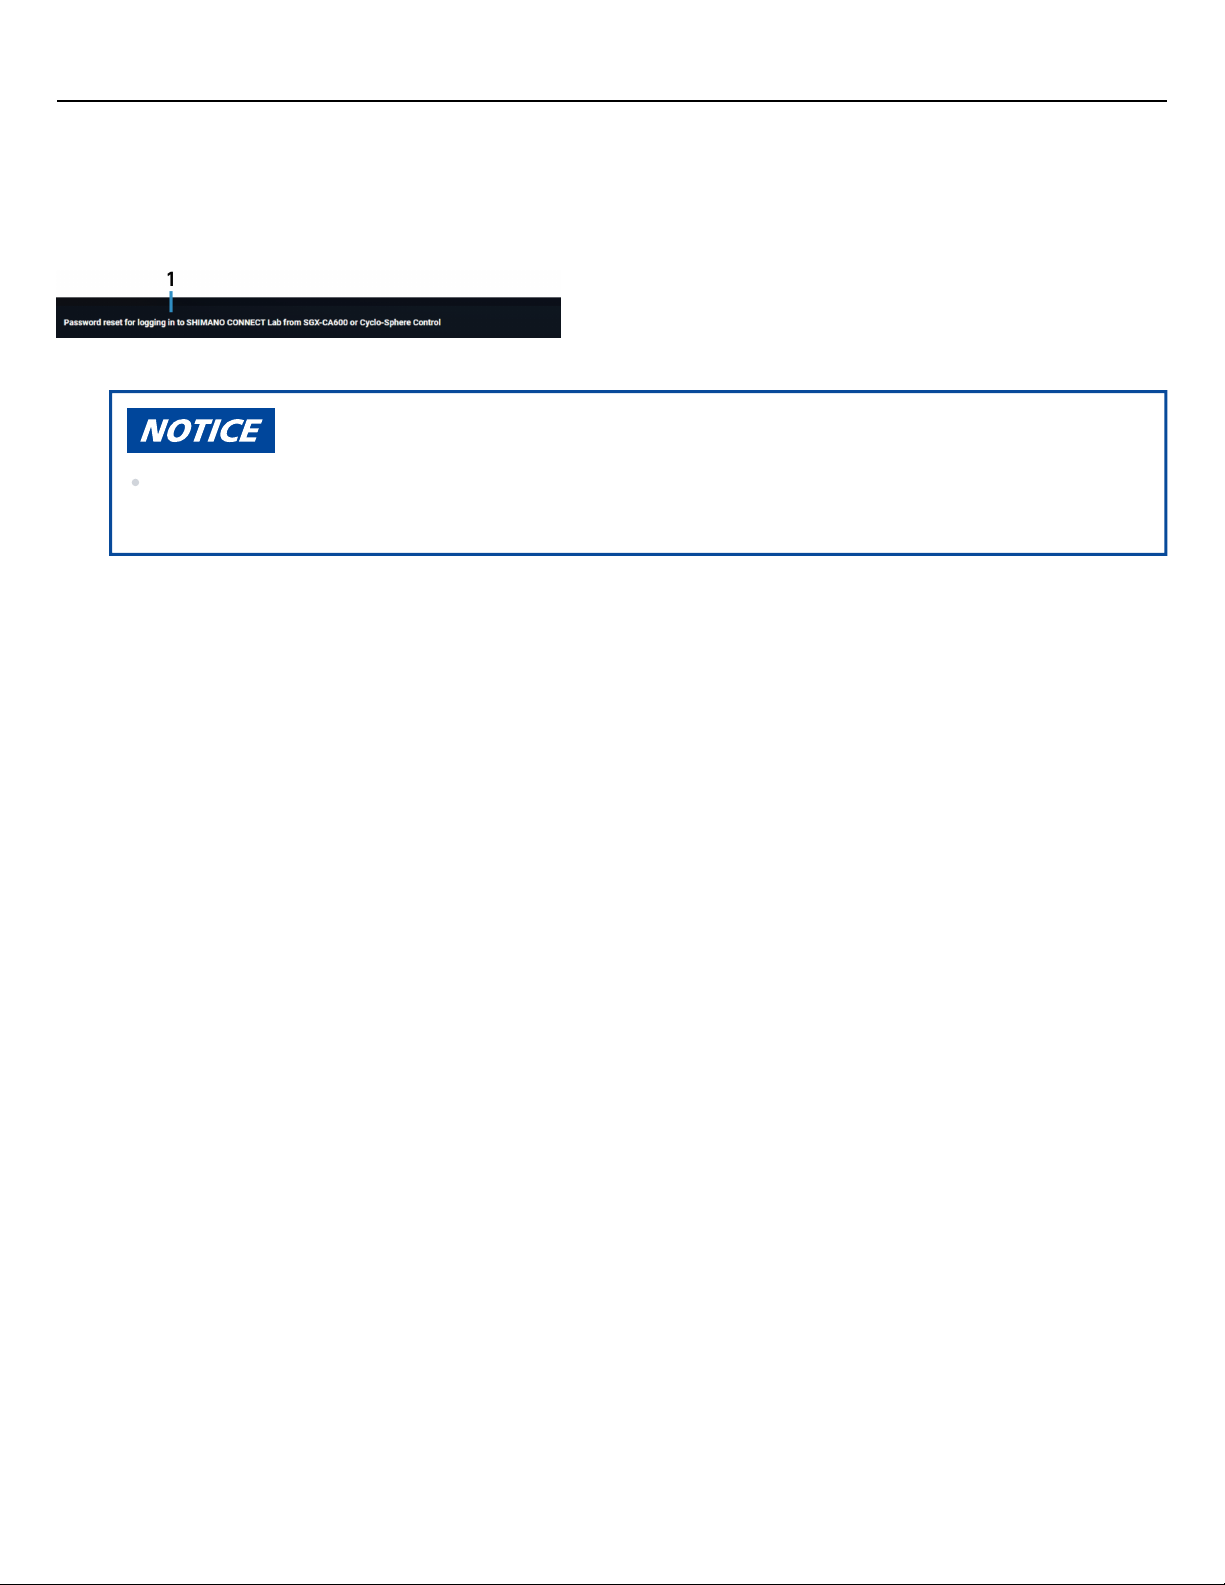
You can reset the password to log in to SHIMANO CONNECT Lab from SGX-CA600 or Cyclo-Sphere Control.
Displays the password reset screen.
(1)
The password reset screen resets the password to enter on SGX-CA600, etc.
Note that it is not the same as the password for the SHIMANO ID.
54
Page 55
Glossary
Glossary
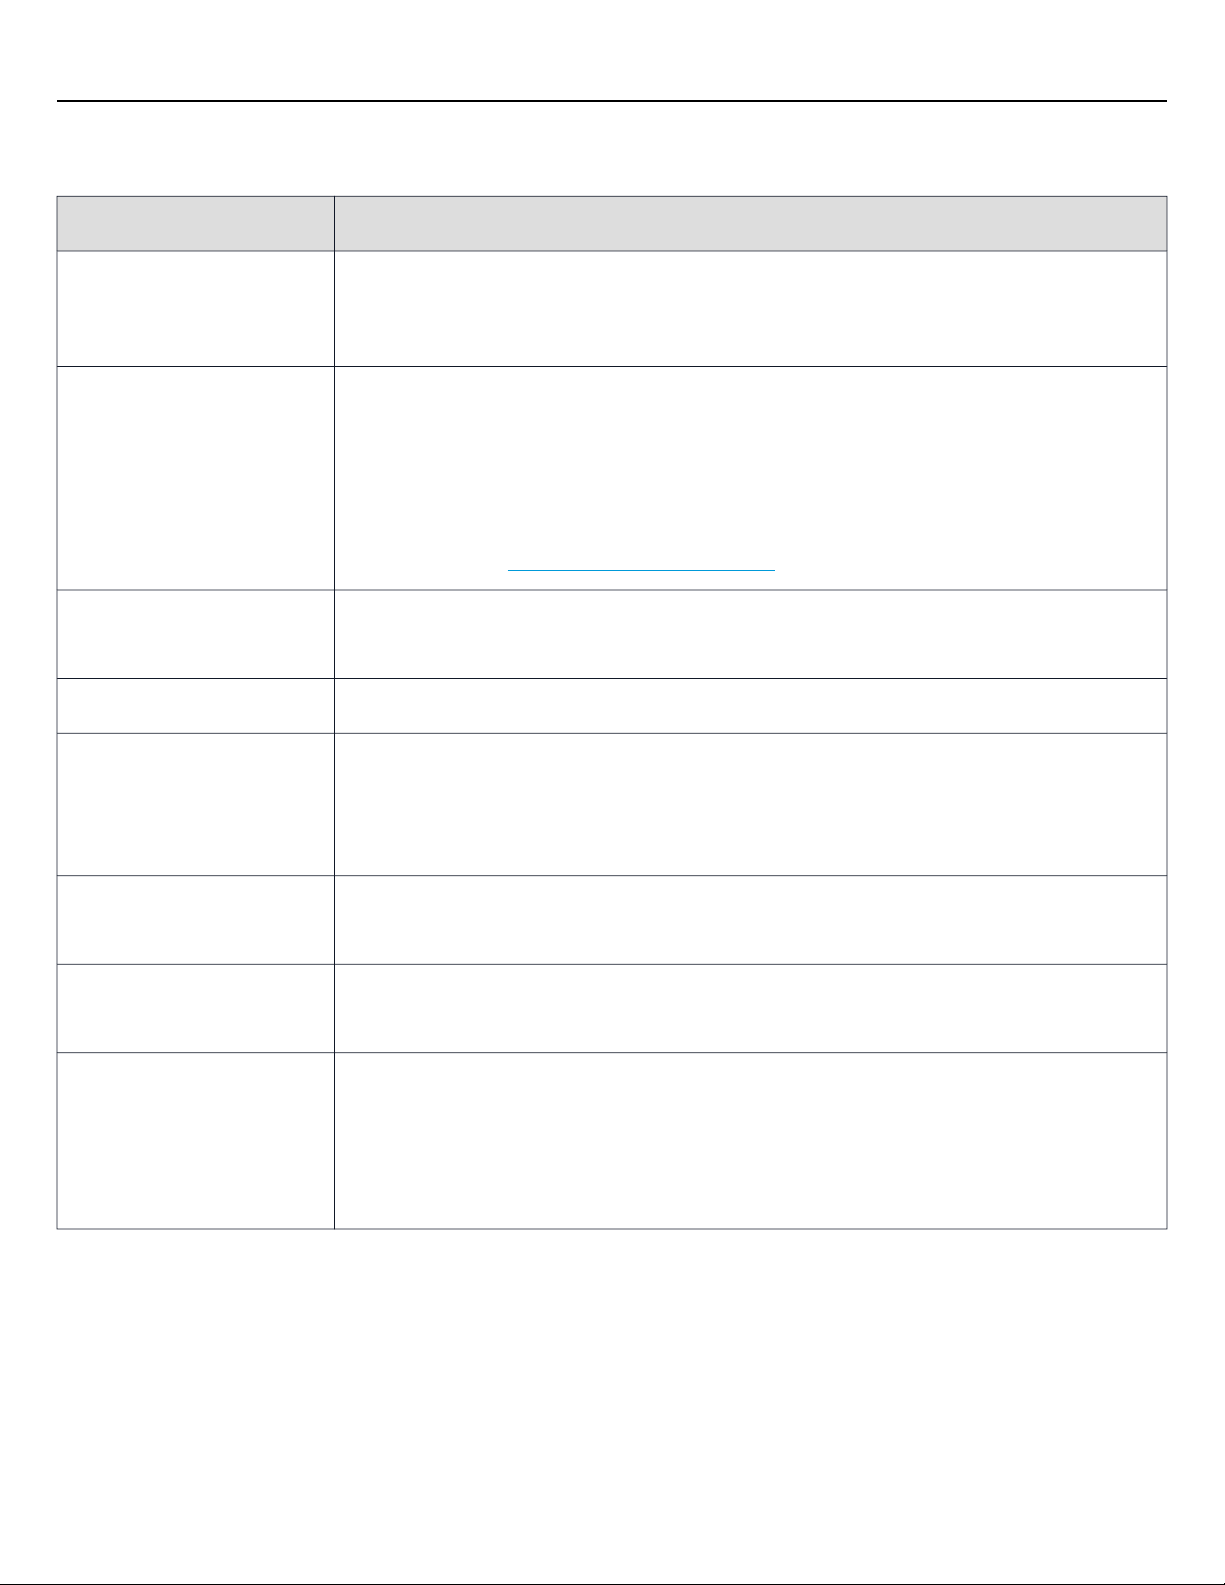
Term Explanation
Activity From the start of logging to the end.
A travel log saved as a single file by a cycle computer or another recording device is deemed to
be one activity.
IF®(intensity factor) The NP®ratio of FTP.
Indicates the intensity of motion to the ability of each cyclist.
If the NP®is 200 and FTP is 250, this value is 0.8.
If the riding time is short, this value may be 1.0 or higher.
Intensity Factor®is a registered trademark of TrainingPeaks LLC and is used with permission.
For details, refer to https://www.trainingpeaks.com .
FTP Indicates the maximum average power that can be sustained per hour.
Required for displaying the parameters such as the power zone and TSS®.
Start time The start time of the activity, lap, or selected user-defined interval.
Elevation gain The total value of the elevation increase in the activity, lap, or selection range.
The elevation uses the average value calculated from the recorded values of the past 30 seconds
for each recorded value, and is only added if there is an increase of 1 m or more compared to the
average value of the elevation used last time.
Gear ratio Calculated from the number of teeth of the front gear and the number of teeth of the rear gear.
Gear ratio = number of teeth of the front gear/number of teeth of the rear gear
Distance The total distance covered over the course of the activity.
Does not include times not recorded to the log, such as when logging is stopped or paused.
Interval intensity The ratio of the target power value to the past maximum power value per hour.
Expresses the intensity of motion corresponding to the seasonal best value of the displayed
activity.
When the riding time is 30 minutes, the average power value of that interval is 200 W, and the
value of the seasonal power curve for that year at 30 minutes is 250 W, this value is 80%.
55
Page 56
Glossary
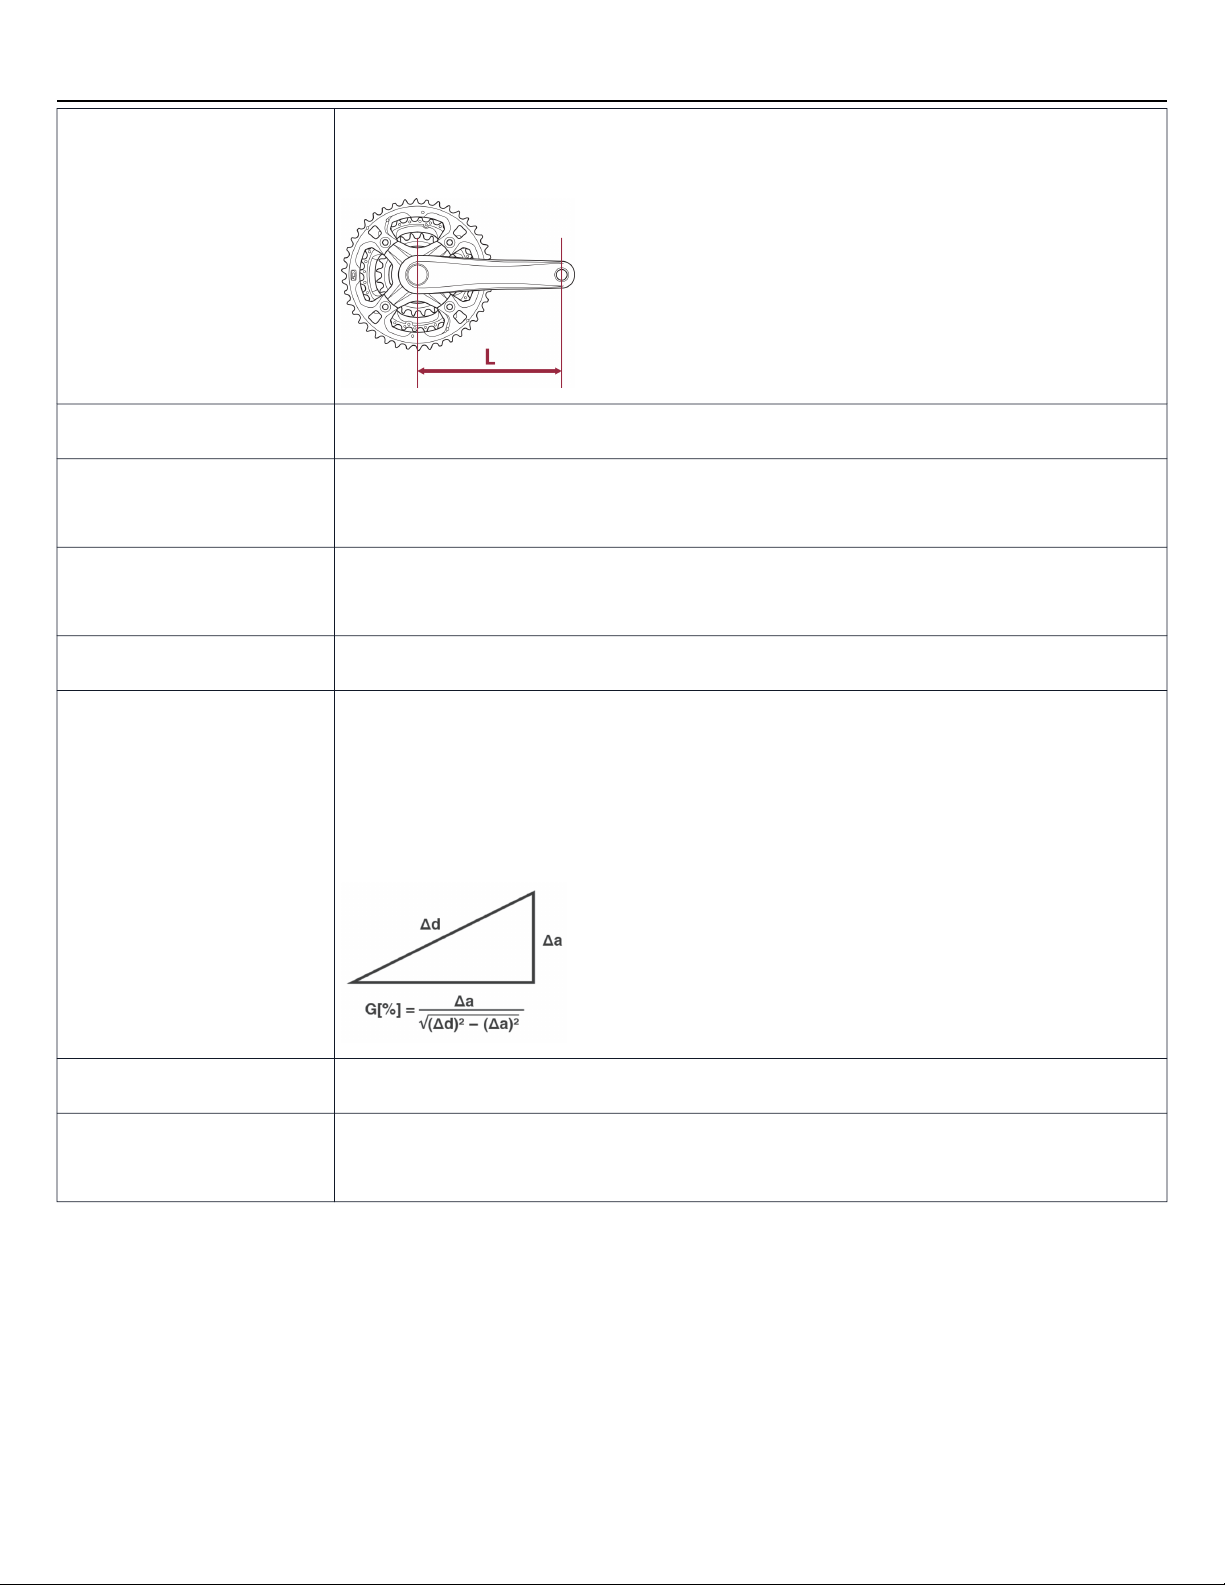
Crank length The distance between the center of the crank axle and the center of the pedal axle.
The length of L in the figure.
Critical power The average maximum power per hour that can be continuously output.
Elapsed time The time that has elapsed from the travel start time to the end time of the ride.
Includes times not recorded to the log, such as when logging is stopped or paused.
Cadence The crank rotation speed per minute.
The unit is rpm (rpm: rotations per minute/revolutions per minute).
Public/private Displays whether the activity is set to be public or private.
Grade The level of tilt of a slope.
Calculated from the difference between the distance and altitude.
G: Grade
⊿ d: The difference in distance
⊿ a: The difference in altitude
End time The end time of the activity, lap, or selected user-defined interval.
Heart rate The number of times that a heart beats per minute.
The unit is bpm (bpm: beats per minute).
56
Page 57
Glossary
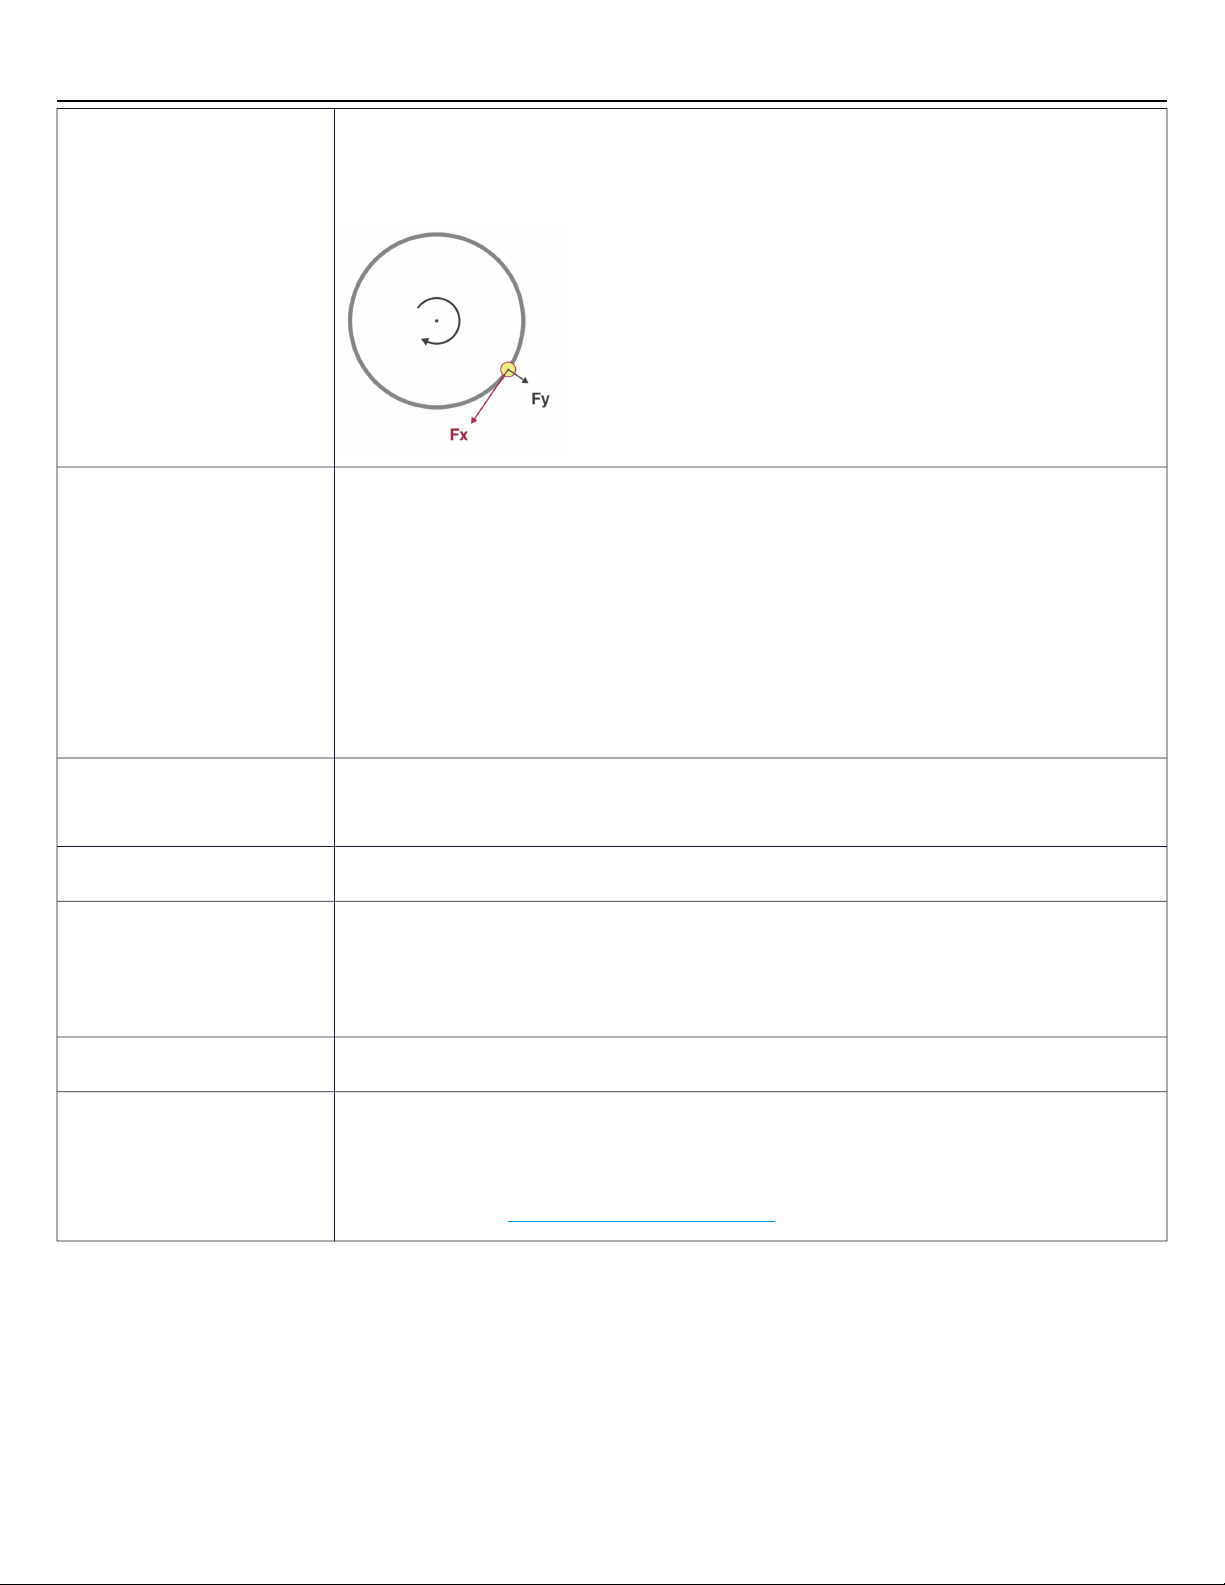
Tangential direction force The force in the tangential direction to the crank rotation axle, which is the force that rotates
the crank.
The part indicated by Fx in the figure.
Z1/Z2/Z3/Z4/Z5/Z6/Z7 The level of power. Categorized by the ratio to the FTP value.
Z1: Up to 55%
Z2: 56% - 75%
Z3: 76% - 90%
Z4: 91% - 105%
Z5: 106% - 120%
Z6: 121% - 150%
Z7: From 151%
Riding time The time recorded to the log of the time that has elapsed from the start time to the end time.
Does not include times not recorded to the log, such as when logging is stopped or paused.
Total shifts The total number of gear shifts executed during the activity, or specified interval.
Elevation loss The total value of the elevation decrease in the activity, lap, or selection range. The elevation
uses the average value calculated from the recorded values of the past 30 seconds for each
recorded value, and is only added if there is a decrease of 1 m or more compared to the average
value of the elevation used last time.
Torque The force applied to a rotation axle. The unit is N·m (N·m: Newton meter).
TSS®(training stress score) A value that quantifies the stress of training.
Training Stress Score®is a registered trademark of TrainingPeaks LLC and is used with
permission.
For details, refer to https://www.trainingpeaks.com .
57
Page 58
Glossary
NP®(normalized power)
Highlights Extracts and displays high values recorded in the analysis data of the activity and intervals where
Power curve A graph that collects the maximum value of the average power for each interval, with the
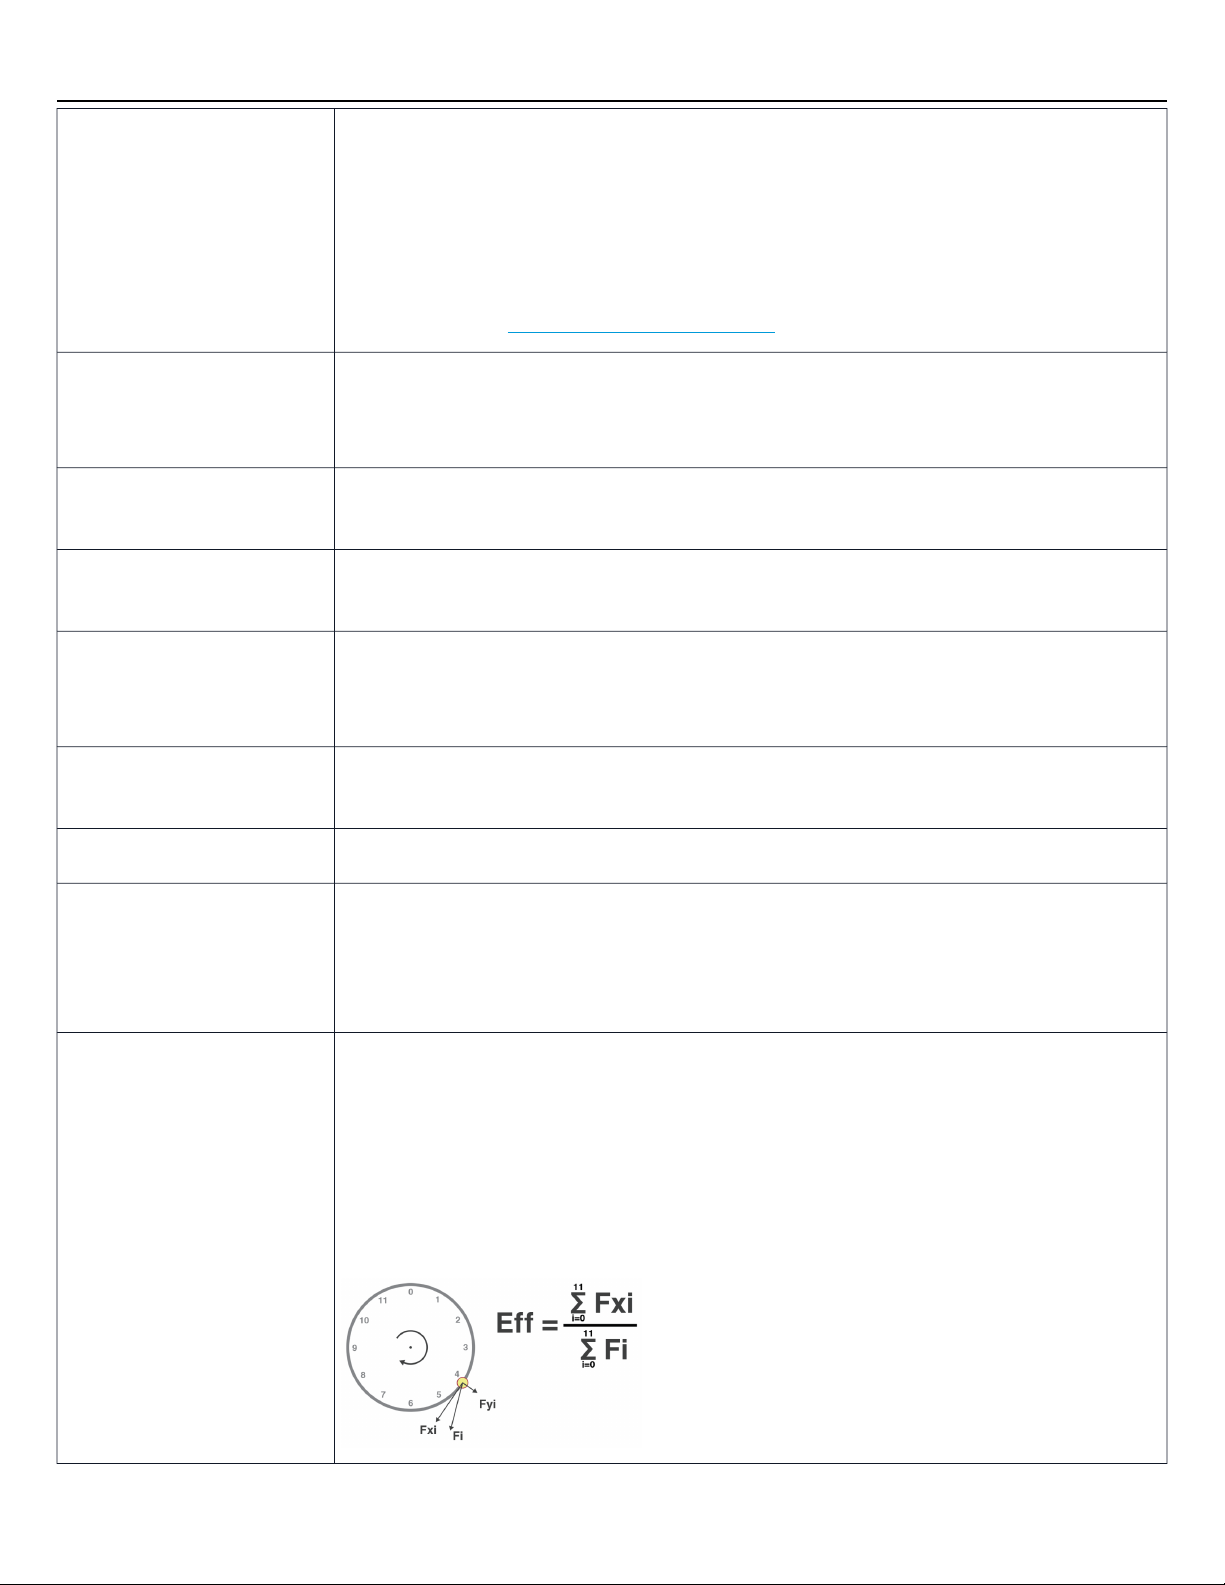
Force vector Divides one rotation of the crank into 12 equal 30 degrees segments, and measures the
Private location The area where the activity path is not displayed on the map when activity is hidden.
A value that indicates the load of motion in the travel interval.
When traveling, the power value goes up and down according to the time and location, such as
course undulations and wind.
NP®takes these changes into account and provides ride power that indicates the actual load on
the body, rather than simply taking an average of the power.
Normalized Power®is a registered trademark of TrainingPeaks LLC and is used with permission.
For details, refer to https://www.trainingpeaks.com .
values superior to past records were recorded.
The extracted intervals are ranked in order of the highest interval intensity in the activity.
interval increasing from a riding time of one second, to two seconds, then three seconds, etc.
tangential force and the normal force for each of the 12 segments.
When part of the activity path is inside a “private location”, the path in that area is not
displayed.
Smoothing Creating a smoothly joined series by setting the data for each point to the average value of the
data inside the interval (time/distance) specified with each point as the center.
Average power balance The balance between the average left power and average right power for an interval.
Average gear shifting interval The average time of the gear shifting interval. The unit is seconds.
Calculated from the total shifts (the sum of the front and rear gear shifting counts) and the
riding time.
Average gear shifting interval = riding time/total shifts
Pedaling efficiency The ratio of the force in the tangential direction to the total force in the tangential direction
and normal direction. The efficiency is for one rotation, which is discretely measured in 12
locations and integrates negative force.
Fi: The resultant vector of the force in the tangential direction and normal direction
Fxi: The force in the tangential direction
Fyi: The force in the normal direction
i: The 0 to 11 o'clock direction
58
Page 59
Glossary
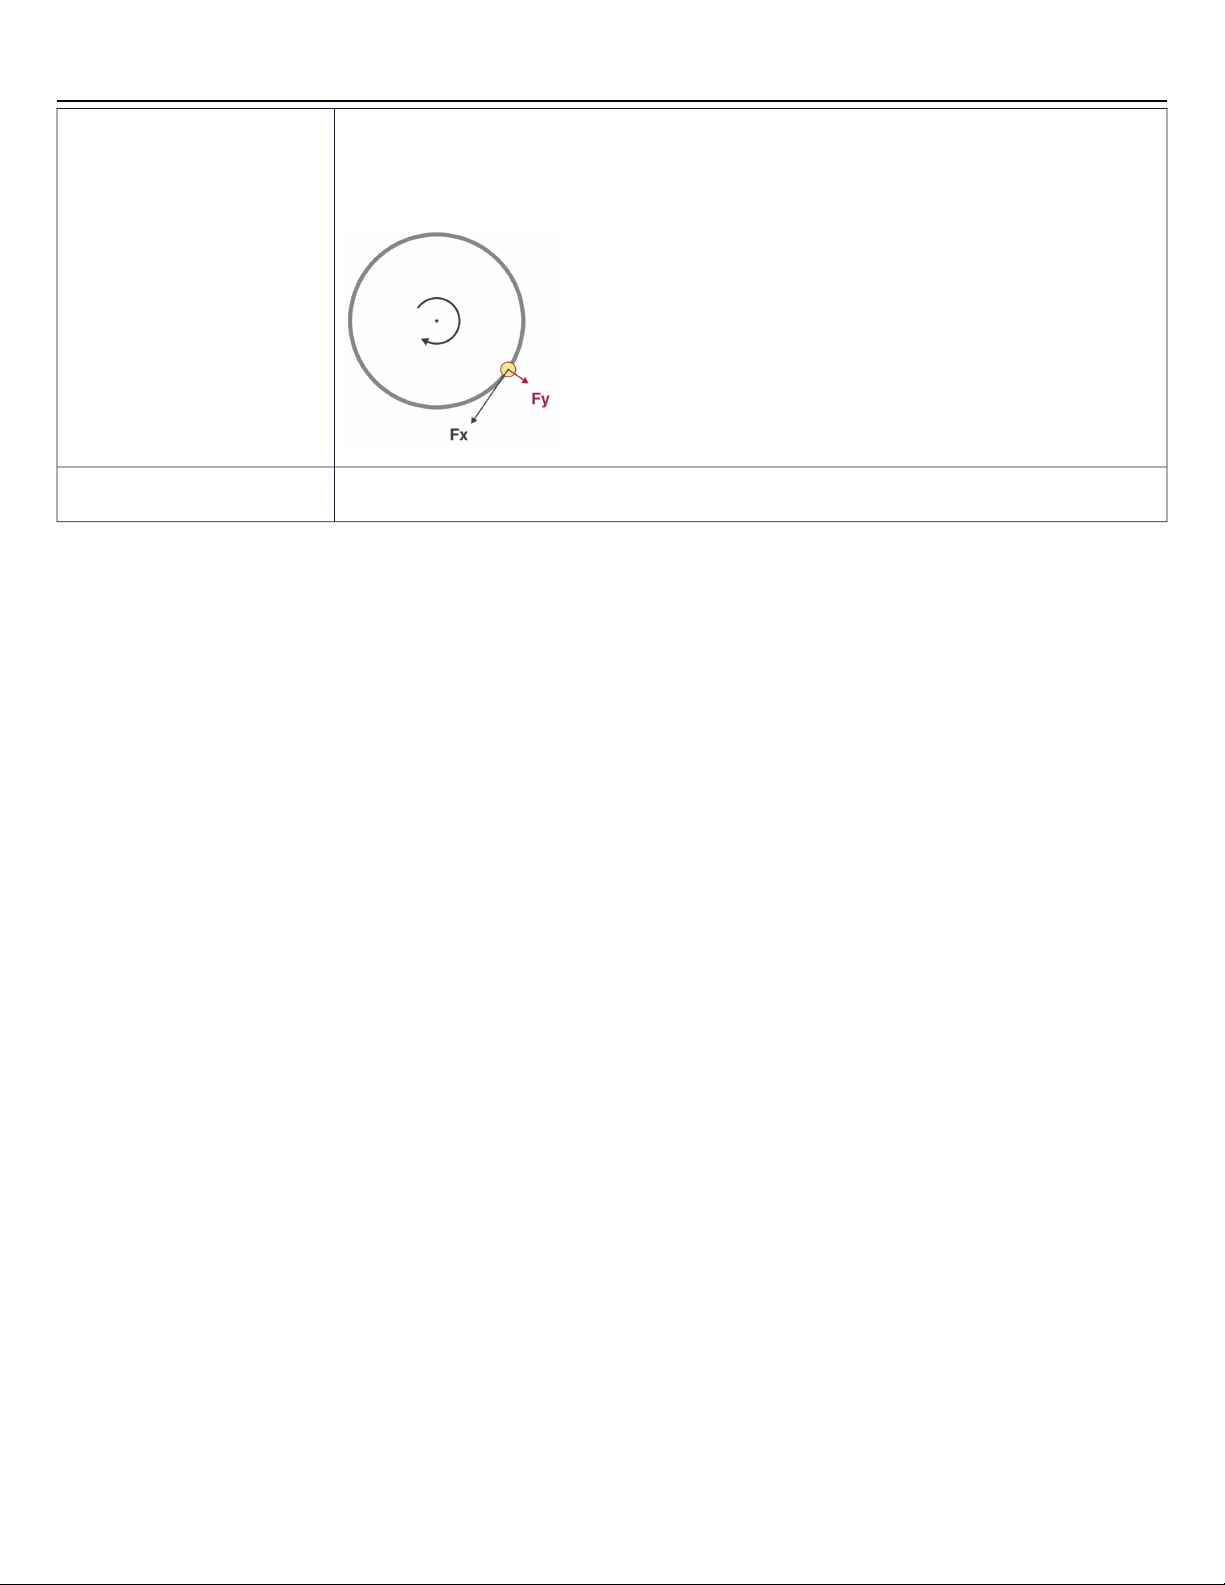
Normal direction force The force in the normal direction to the crank rotation axle, which does not contribute to
rotation.
The part indicated by Fy in the figure.
Lap A point marked in the activity.
59
Page 60

FAQ
FAQ
Check the latest version of the following for frequently asked questions:
https://bike.shimano.com/faq/SCL0A
60
Page 61

About this document
About this document
The contents of this document are subject to revision in the future without notice.
Reproducing or transmitting this document in whole or in part in any form or for any purpose whatsoever
without the express written permission of SHIMANO INC. is expressly forbidden. However, this is not to be taken
as a limit on the customer's rights under applicable copyright laws.
SHIMANO INC. may own the rights to any patents, patent applications, trademarks, copyrights and any other
intangible property rights contained in this document. Unless otherwise specified, the customer is not granted
rights to any patents, trademarks, copyrights or any other intangible intellectual property contained in this
document.
61
Page 62

Registered trademarks and trademarks
Registered trademarks and
trademarks
SHIMANO is a trademark or registered trademark of SHIMANO INC. in Japan and other countries.
is a trademark of SHIMANO INC. in Japan and other countries.
Windows®is a registered trademark or trademark of Microsoft Corporation in the United States of America
and other countries.
Google Chrome and Android are registered trademarks of Google Inc.
iPhone, Safari, and Mac OS are trademarks of Apple Inc. registered in the United States of America and other
countries.
Firefox is a registered trademark of the Mozilla Foundation in the United States of America and other
countries.
Wahoo Fitness is a trademark of Wahoo Fitness L.L.C.
Garmin Connect™is a trademark of Garmin Ltd. or its subsidiaries.
Strava™is a trademark of Strava, Inc. TrainingPeaks™is a trademark of Peaksware, Inc.
Intensity Factor®is a registered trademark of TrainingPeaks LLC and is used with permission.
For details, refer to https://www.trainingpeaks.com .
Training Stress Score®is a registered trademark of TrainingPeaks LLC and is used with permission.
For details, refer to https://www.trainingpeaks.com .
Normalized Power®is a registered trademark of TrainingPeaks LLC and is used with permission.
For details, refer to https://www.trainingpeaks.com .
62
Page 63

One Holl and, Irvine, California 92 618, U.S.A. Ph one: +1-949-9 51-5003
High Tec h Campus 92, 5656 AG Eindho ven, The Neth erlands Phone : +31-402-6122 22
3-77 Oim atsu-cho, Sak ai-ku, Sakai City, Osaka 59 0-8577, Japan
Please note: specifications are subject to change for improvement without notice. (English)
© Feb. 2024 by SHIMANO INC. ITP
 Loading...