


Handheld multifunctional oscilloscope
MS300 and MS500 serial
User Manual
Shenzhen Micsig Instruments Co., Ltd

1
To customer,
Micsig MS300 and MS500 serial handheld multi-functional oscilloscope includes oscilloscope,
multimeter and recorder functions, which contains the following features:
Complete electrical isolation between channels, with function of floating
measurement
Up to 190 k wfms/s waveform refresh rate (MS500 series)
5.7 inch TFT LCD screen, 640*480 resolution, 16 bit color depth
8 bit AD acquisition. Display and measurement are more precise.
Touch+Button+Scroll Wheel make handling better
Quick drag and zoom on touch screen, quick operating response speed
Serial bus trigger and decode(optional except MS510S, MS520S) support
UART(RS232/RS422/RS485) /SPI/I2C/CAN/LIN
Dynamic recording
HDTV trigger for PAL,NTSC,SECAM,720P,1080I,1080P
31 kind of automatic measurements
Support USB Host/Slave interface, which can plug U device or connect to the PC
Detachable Li-ion battery

2
Limited warranty and limitation of liability
All Micsig products are fully inspected before delivery and guarantee all comply with test
criterion. As for warranty, please refer to product warranty card.
we authorized resellers shall extend this warranty on new and unused products to end user
only but have no authority to extend a greater or different warranty on behalf of us.
Warranty support is available if product is purchased through an authorized sales outlet or
Buyer has paid the applicable international price. We reserve the right to invoice Buyer for
importation costs to repair/replacement parts when product purchased in one country is
submitted for repair in another country.
Micsig’s warranty obligation is limited, in Micsig’s opinion, to refund of the purchase price,
free of charge repair, or replacement of a defective product, which is returned to an
authorized service center within the warranty period.

3
To obtain warranty service, contact your nearest Micsig authorized service center or sent
the product, with a description of the difficulty, postage and insurance prepaid (FOB
destination), to the nearest authorized service center. Micsig assumes no risk for damage
in transit. Following warranty repair, the product will be returned to buyer, transportation
prepaid (FOB destination). If we determine that the failure was caused by misuse,
alteration, accident or abnormal condition of operating or handling, we will provide an
estimate of repair costs and obtain authorization before commencing the work. Following
repair, the product will be returned to the buyer transportation prepaid, the buyer will be
billed for the repair, and return transportation charges (FOB Shipping Point).
This warranty is Buyer's sole and exclusive remedy and is in lieu of all other warranties,
express or implied, including but not limited to any implied warranty of merchantability or
fitness for a particular purpose. We shall not be liable for any special, indirect, incidental or
consequential damages or losses, including loss of data, whether arising from breach of
warranty or scaled on contract, tort, reliance or any other theory.
Since some countries or states do not allow limitation of the term of an implied warranty, or

4
exclusion or limitation of incidental or consequential damages, the limitations and
exclusions of this warranty may not apply to every buyer. If any provision of this warranty is
held invalid or unenforceable by a court of competent jurisdiction, such holding will not
affect the validity or enforceability of any other provision

5
Preface
Dear customers,
Hello! Firstly thanks for buying our instrument and for your proper use of this instrument,
please read this manual before using it and particularly pay attention to "safety formation".
If you have finished readout this manual, we recommend you keep this manual for future
reference.

1
CONTENT
CONTENT ................................................................................................................................................................ 1
CHAPTER ONE SAFETY INFORMATION................................................................................................................... 1
1.1 SAFETY INFORMATION ........................................................................................................................................ 2
1.2 SAFETY NOTES AND SYMBOLS............................................................................................................................... 3
CHAPTER TWO OSCILLOSCOPE QUICK START GUIDE ............................................................................................ 6
2.1 GENERAL CHECK ................................................................................................................................................ 8
2.2 INTRODUCE THE NAMES OF INSTRUMENT’S PARTS ................................................................................................... 9
2.3 USE BRACKET .................................................................................................................................................. 12
2.4 INSTALL AND REPLACE BATTERY .......................................................................................................................... 13
2.5 KNOW THE BUTTONS AND THEIR FUNCTIONS ........................................................................................................ 17
2.6 TURN ON & TURN OFF ...................................................................................................................................... 22
2.7 TURN ON OSCILLOSCOPE ................................................................................................................................... 22
2.8 GENERAL KNOWLEDGE OF USERS' INTERFACE ........................................................................................................ 23
2.9 UNDERSTAND TOUCH SCREEN ............................................................................................................................ 28

2
2.10 FUNCTION TEST ............................................................................................................................................. 31
2.11 PROBE COMPENSATION .................................................................................................................................. 33
CHAPTER THREE USE OSCILLOSCOPE ................................................................................................................... 39
3.1 CHANNEL SELECTION ........................................................................................................................................ 42
3.2 SET CHANNEL COUPLING MODE .......................................................................................................................... 43
3.3 SET CHANNEL SAMPLING MODE.......................................................................................................................... 46
3.4 BANDWIDTH SELECTION .................................................................................................................................... 50
3.5 USE DELAY ..................................................................................................................................................... 51
3.6 SET CHANNEL POLARITY .................................................................................................................................... 53
3.7 SET CHANNEL ATTENUATION RATIO ..................................................................................................................... 55
3.8 AUTO-CALIBRATION ......................................................................................................................................... 57
3.9 SET AUTO MEASUREMENT TYPE .......................................................................................................................... 57
3.10 STORE/ RESTORE MENU .................................................................................................................................. 64
3.10.1 Save ................................................................................................................................................... 64
3.10.2 Restore .............................................................................................................................................. 66
3.10.3 Memory depth .................................................................................................................................. 68
3.10.4 Dynamic record ................................................................................................................................. 68
3.10.5 Store settings .................................................................................................................................... 74

3
3.10.6 Restore settings ................................................................................................................................ 74
3.11 CURSOR MEASUREMENT ................................................................................................................................. 75
3.12 SET DISPLAY MENU ........................................................................................................................................ 80
3.12.1 Waveform settings ............................................................................................................................ 80
3.12.2 Graticule set ...................................................................................................................................... 81
3.12.3 Persist adjustment ............................................................................................................................ 83
3.12.4 Time base .......................................................................................................................................... 84
3.12.5 Adjusting refresh rate ....................................................................................................................... 86
3.13 SET TRIGGER MENU........................................................................................................................................ 87
3.13.1 Edge trigger ....................................................................................................................................... 90
3.13.2 Pulse width trigger ............................................................................................................................ 95
3.13.3 Logic trigger ....................................................................................................................................... 98
3.13.4 Video trigger .................................................................................................................................... 103
3.13.5 Serial bus trigger.............................................................................................................................. 107
3.15 USE AUTO SET ............................................................................................................................................. 111
3.16 USE MATH MENU ........................................................................................................................................ 112
3.18 REFERENCE CHANNEL ................................................................................................................................... 120
3.19 USE 50% SHORTCUT .................................................................................................................................... 120

4
3.20 USE TOUCH SCREEN ZOOM WAVEFORM ........................................................................................................... 124
CHAPTER FOUR SERIAL BUS TRIGGER& DECODE .............................................................................................. 127
4.1 UART(RS232/RS422/RS485)BUS TRIGGER AND DECODE ........................................................................... 130
4.2 LIN BUS TRIGGER AND DECODE ........................................................................................................................ 142
4.3 CAN BUS TRIGGER AND DECODE ...................................................................................................................... 149
4.4 SPI BUS TRIGGER AND DECODE ........................................................................................................................ 159
4.5 I2C BUS TRIGGER AND DECODE ........................................................................................................................ 166
CHAPTER FIVE APPLICATION EXAMPLES ........................................................................................................... 176
5.1TAKING SIMPLE MEASUREMENT ........................................................................................................................ 178
5.2 CAPTURE SINGLE PULSE SIGNAL ........................................................................................................................ 183
5.3 ANALYZE THE SIGNAL DETAIL ............................................................................................................................ 186
5.4 TRIGGER ON VIDEO SIGNAL.............................................................................................................................. 190
5.5 USE MATH FFT ............................................................................................................................................. 192
CHAPTER SIX USE MULTIMETER......................................................................................................................... 194
6.1 MULTIMETER SAFETY INFORMATION ................................................................................................................. 196
6.2 START MULTIMETER ....................................................................................................................................... 197

5
6.3 MULTIMETER BUTTONS AND THEIR FUNCTIONS ................................................................................................... 197
6.4 USE MULTIMETER ......................................................................................................................................... 202
CHAPTER SEVEN USE RECORDER ....................................................................................................................... 205
7.1 START RECORDER ........................................................................................................................................... 207
7.2 RECORD ....................................................................................................................................................... 207
7.2.1 Multimeter record ............................................................................................................................. 208
7.2.2 Oscilloscope measurement record .................................................................................................... 215
7.2.3 Oscilloscope waveform record .......................................................................................................... 219
7.2.4 Store mode set .................................................................................................................................. 223
7.3 PLAYBACK .................................................................................................................................................... 225
7.3.1 Multimeter record playback .............................................................................................................. 225
7.3.2 Oscilloscope measurement record replay ......................................................................................... 229
7.3.3 Oscilloscope waveform replay ........................................................................................................... 231
7.3.4 The last record playback .................................................................................................................... 233
CHAPTER EIGHT USERS’ SECTION ...................................................................................................................... 234
CHAPTER NINE SCOPESUITE SOFTWARE ........................................................................................................... 248

6
CHAPTER TEN TROUBLESHOOTING ................................................................................................................... 250
CHAPTER ELEVEN SERVICES AND SUPPORT ...................................................................................................... 254
APPENDIX ........................................................................................................................................................... 258
APPENDIX A:TECHNICAL SPECIFICATIONS .............................................................................................................. 259
APPENDIX B:MAINTENANCE OF OSCILLOSCOPE...................................................................................................... 271
APPENDIX C:FACTORY DEFAULT ........................................................................................................................... 273
APPENDIX D:ATTACHMENT ................................................................................................................................ 282
INDEX .................................................................................................................................................................. 284

Chapter One Safety Information
Read First

2
1.1 Safety information
To avoid personal injury and prevent from damaging products or other related devices,
customer should read safety information and use this product in accordance with the
relevant provisions.
Please do not connect USD device when doing floating measurement
Only trained personnel can operate maintenance procedure
Avoid fire and personal injury
Properly connect instrument probes
View all terminal ratings. In order to avoid fire and excessive current impact, please refer all the
ratings and marks of the product specifications
Do not operate the instrument with the cover removed or the case opened.
Replace the battery in the specified method, choose the specified power adapter and
recommended battery for charging.

3
Oscilloscope quick start guide
Charge the battery properly. Please use the specified power adapter and recommended charging
period, assure adapter connected to the outlet before connected to instrument.
Avoid body contact with the exposed circuit directly
Store under the floating air
Do not use in damp or wet environment
Do not use in flammable and explosive environment
Keep the instrument’s surface dry and clean
1.2 Safety notes and symbols
Safety notes in this manual. Below safety notes and symbols will be seen throughout this manual.
Warning denotes a hazard. It calls attention to all conditions and actions may result in injury or loss of
life.

4
Oscilloscope quick start guide
Caution denotes a hazard. It calls attention to all conditions and actions may result in damage or
destruction of the instrument.
Safety notes on product
Danger means while you are in violation of the provisions of this tag may immediately cause damage to you
Warning means while you are in violation of the provisions of this tag may not immediately cause damage to
you.
Caution means cause damage to the product or others.
Symbols on products
Hazardous voltage Refer to the manual Protective earth terminal Chassis ground Test ground

5
Oscilloscope quick start guide
Please read the following safety information to avoid personal injury and prevent products
or damage related products. In order to avoid the possibility of danger, this product can be
used in the specified manner only.
Warning
To avoid electrical shock or fire if a product input is connected to more than 42Vpp (30 V
rms) or on the circuit of more than 4800VA:
Please use the pens and voltage probes provided by the instrument, or use the standard products in the
accessory description
Before using, inspect voltage probes , test pens and accessories from mechanical which may be
damaged, please choose new proper accessories
Remove all probes, test leads and accessories if you do not want to use them.

6
Oscilloscope quick start guide
Chapter Two Oscilloscope Quick Start Guide

7
Oscilloscope quick start guide
This chapter will guide you how to operate oscilloscope, it contains the following contents
General check
Introduce the names of the instrument’s parts
Use bracket
Install& replace battery
Introduce buttons and their functions
Turn on /off
Turn on oscilloscope
Basic knowledge of oscilloscope user interface
Understand touch screen
Function test
Probe compensation

8
General check
2.1 General check
When you receive your product, please check the instrument according to the following
instruction.
1. Check if damage caused by transportation.
Please keep the packaging until the whole instrument and accessories pass through
electronic performance and mechanical test.
2. Check the accessories
Each oscilloscope has a packing list. You can refer it to check if the attachment is
complete. If the attachment is missing or damaged, please contact Micsig’s agent or
local office.
3. Check the instruments
If situation happens like, broken of appearance of the oscilloscope, or failure to pass
the performance taste, please contact Micsig’s agent or local office which is
responsible for this business. If the instrument damaged by transportation, please

9
General check
refer to the packing case and contact with Transportation Company and our Agent,
we will arrange repair or replacement.
2.2 Introduce the names of instrument’s parts
Top components and connectors:From top view of the instrument, you can see the probe
input, multimeter test pen line input and two rope connection, see below picture 2-1; The
multimeter test pen line input also can apply to external source trigger and probe
compensation.
Picture 2-1 Top components and connectors

10
Introduce the names of instrument’s parts
Left components and connectors:The handle and power jack. Refer to picture2-2.
External power jack: by special adapter to convert the alternating current (AC) to direct
current (DC), then supply power for oscilloscope.
Picture 2-2 left components and connectors picture 2-3 right components
Right components: This includes a wheel and a USB port. Refer to picture 2-3.
Wheel: fast move oscilloscope trigger level, horizontal position, vertical position, the
Handle

11
Introduce the names of instrument’s parts
cursor and to quick a djust the brightness of oscilloscope waveform, the intensity of
graticule, afterglow and the trigger hold-off time. The usage of the wheel is shown in the
following chapters.
Front panel: It includes the keyboard, LCD and touch panel. Refer to picture 2-4
Picture 2-4 front panel

12
Use bracket
2.3 Use bracket
First flat front panel on the desktop and then use your both index fingers to dig it out from
stern notch on either side of the bracket with little upward force. Shown as picture2-5,
(circle zone indicts bracket stern north)
Picture2-5 open bracket

13
Install and replace battery
2.4 Install and replace battery
When using the battery, the upper right corner of the screen displays the battery icon
( ), which indicates the remaining battery power. When battery is in under -voltage
threshold, battery icon flashes which means it should be replaced, if continue use,
oscilloscope will automatic power off. At this moment user should use an external power
adapter. When battery is not full, please plug in power adapter, so the battery in charging
status, If battery is full or use power adapter only, the upper right corner of screen shows
power in-charging icon( ). Turn off channels that are not in use, lower the screen
background brightness and reduce the memory depth or refresh rate to lower power
consumption.
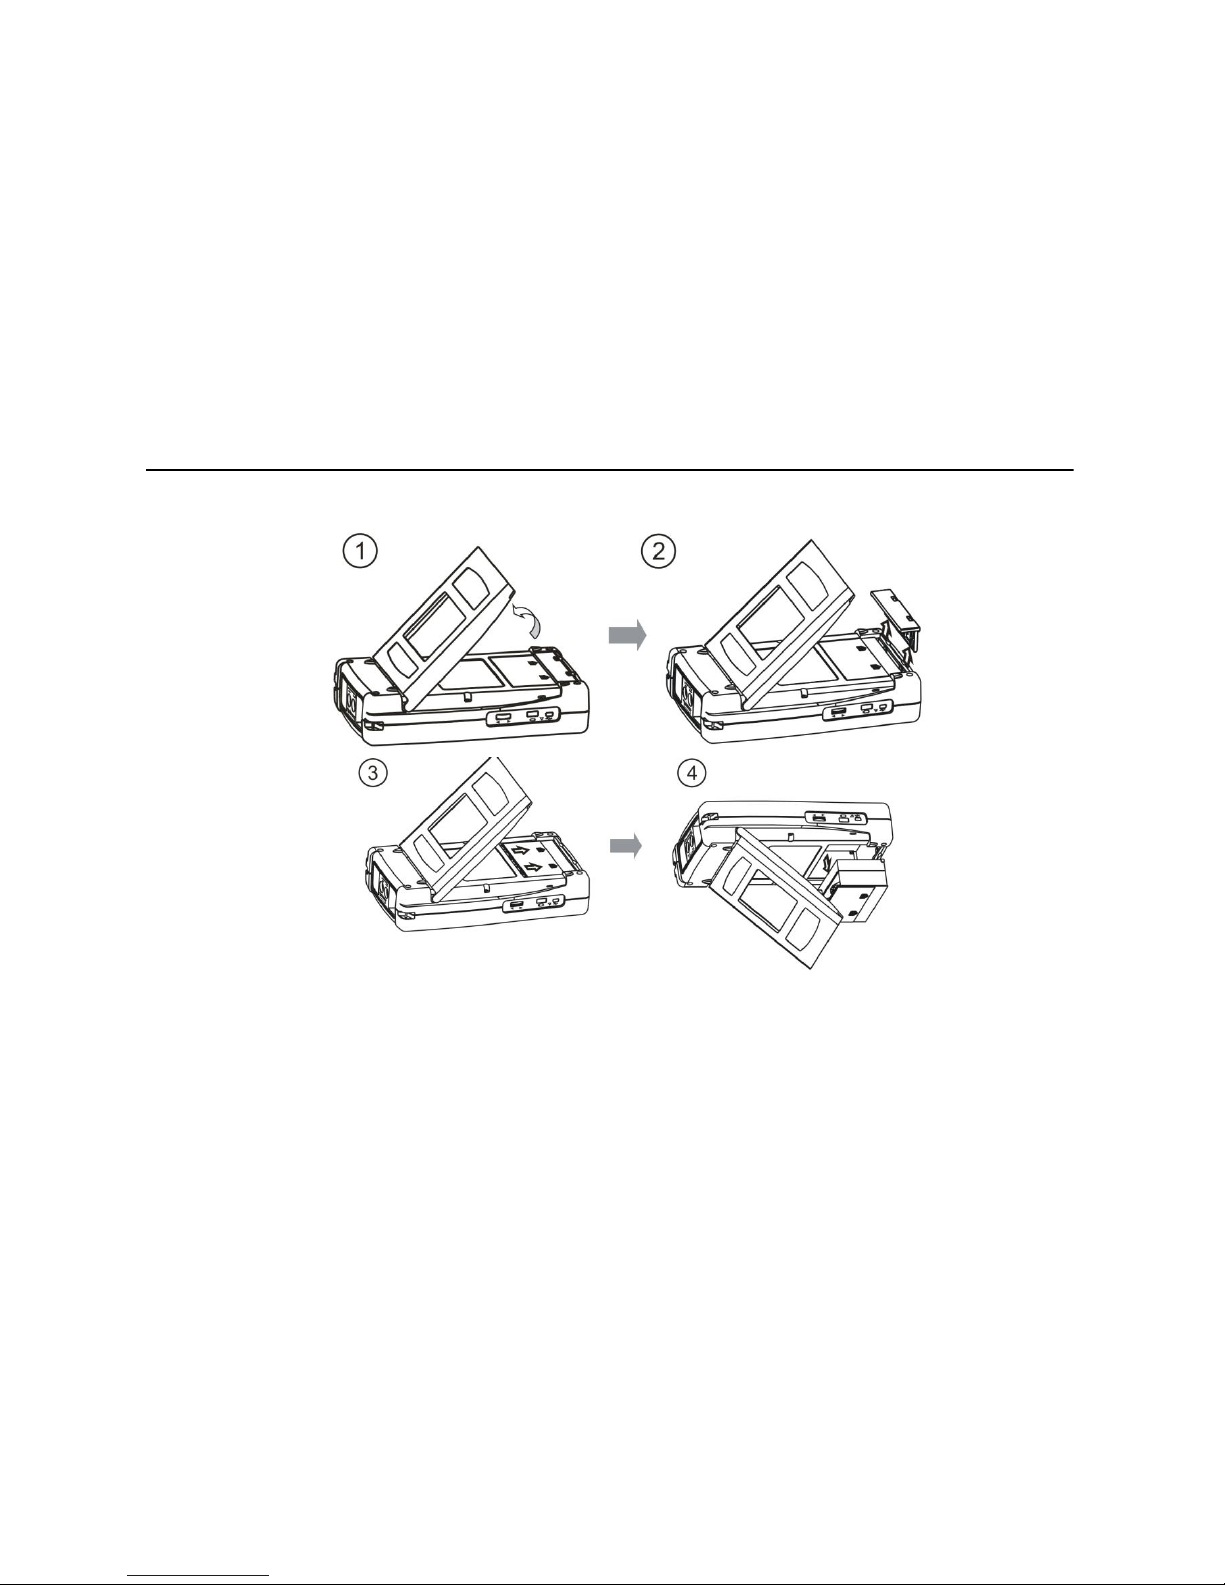
Steps for installing battery
1. Open the bracket, refer to picture 2-6①
2. Put the battery into the compartment and push the battery from bottom up until

14
Install and replace battery
the battery completely push to the top housing, refer to picture 2-6②
3. Insert the battery baffle, refer to pitcture 2-6③
4. Close the bracket, refer to picture 2-6④
Picture2-6 Steps for install battery

15
Install and replace battery
Steps for removing battery
1. Open bracket, refer to picture 2-7①
2. Use fingers to dig up the lock chip from each side with some strength to pull up
the battery baffle, refer to picture2-7②
3. Press the battery fingerprint parts down and pull the battery to the bottom of
the battery compartment, refer to picture 2-7③
4. Level up the rear panel and the battery automatically slides out under the
gravity, refer to picture2-7④
5.
16
Install and replace battery
Picture 2-7 Remove battery
Notes:For the first use or long time no use, users should charge the battery before using it.

17
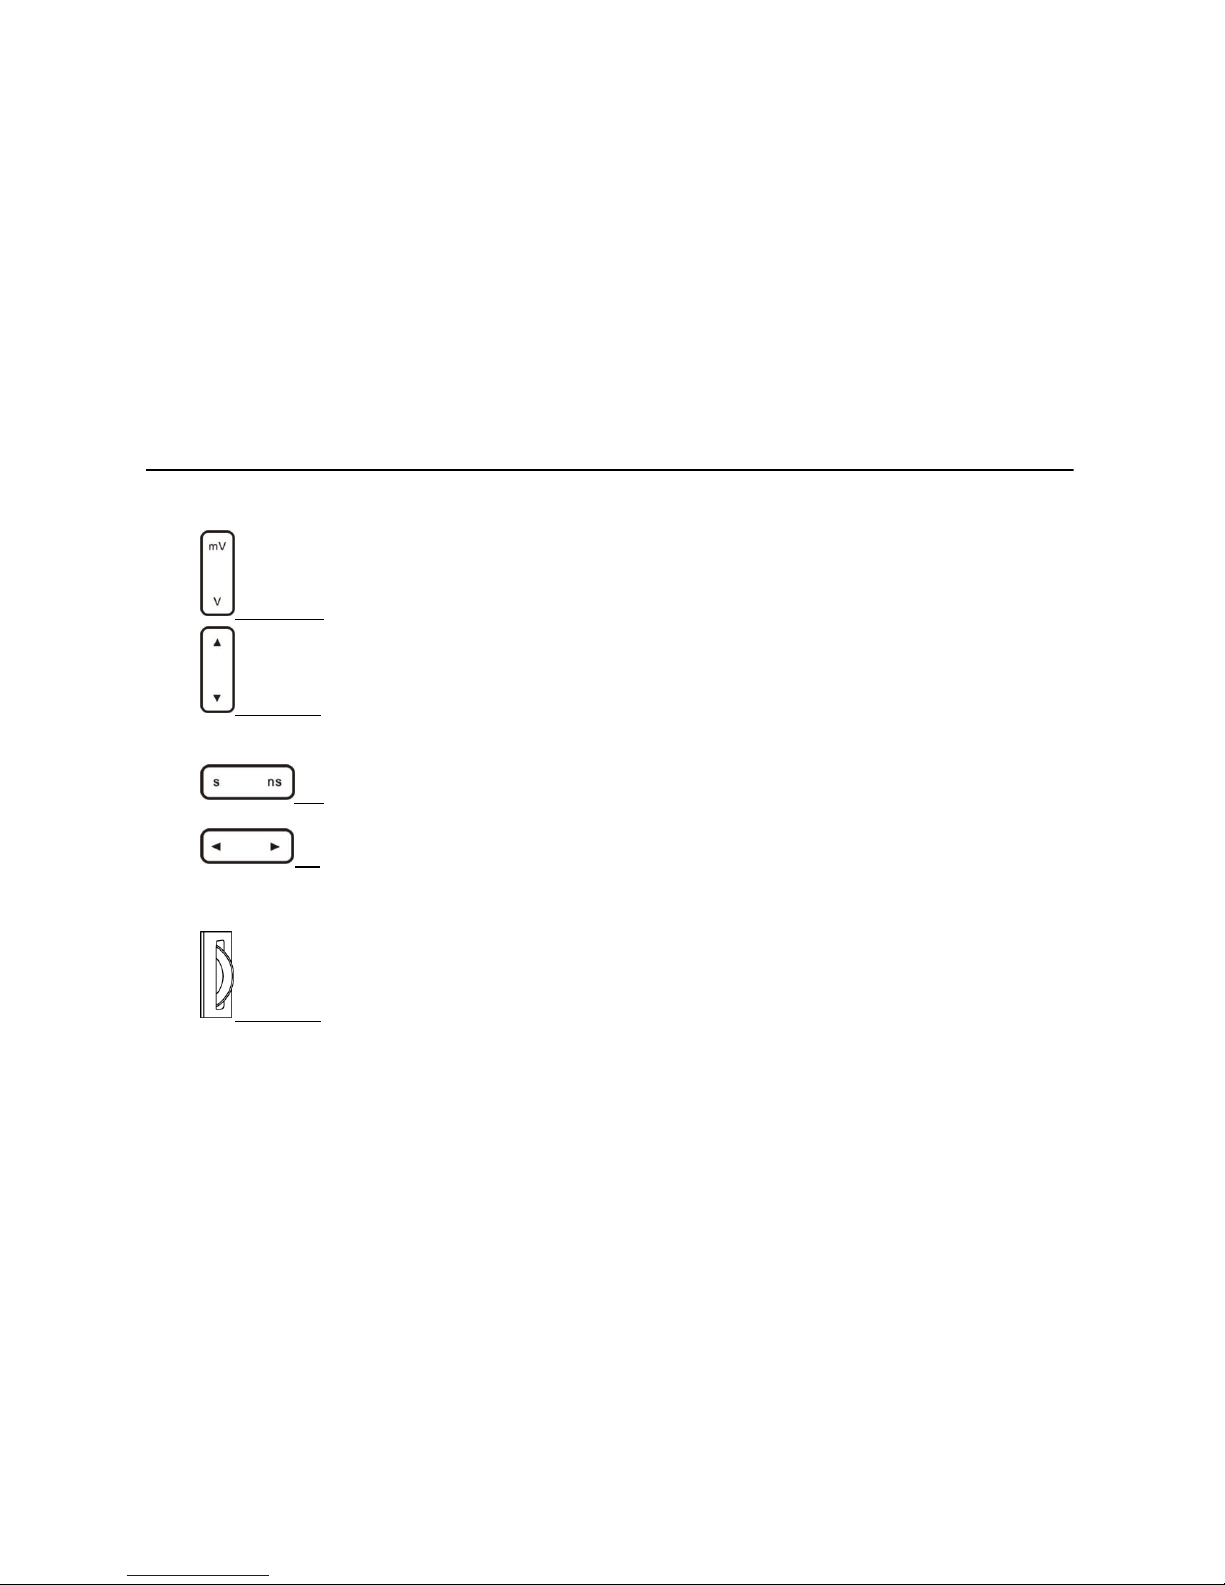
Know the buttons and their functions
2.5 Know the buttons and their functions
Turn on oscilloscope function and open menu under the oscilloscope
mode
Turn on multimeter function
Turn on recorder function
Function button menu, corresponding to the function shown in the
bottom screen
Function button menu, corresponding to the function shown in the
bottom screen
Functional button menu, corresponding to the function shown in the

18
Know the buttons and their functions
bottom screen
Functional button menu, corresponding to the function shown in the
bottom screen
Menu off or return on the menu
Adjust trigger level forward, adjust the parameters in the current menu
item or move the cursor etc.
Adjust trigger level backward, adjust the parameters of the menu
options and move the cursor etc.
System function button, for system configuration and etc.
Power button, turn on/off oscilloscope
Function button, open the auto-measurement menu

19
Know the buttons and their functions
Function button can turn on store& recall menu
Turn on cursor menu
Function button to open display menu
Function button to turn on trigger menu
Stop or restart the waveform capture, or lock screen in multimeter mode
Function button trigger and capture one single waveform then sop,
press button to escape this mode
Function button, which can automatically adjust the vertical scale,
vertical position and horizontal time base, making the waveform display as
the best effect.

20
Know the buttons and their functions
Function button, 50% shortcut button which can move the waveform to
the center of the screen, or make the trigger voltage to the center of the
waveform amplitude
Open / close the Ch1 or set Ch1 as current channel
Open / close the Ch2 or set Ch2 as current channel
Function button, open the reference menu and select the reference
waveform (user can choose four reference waveforms which displayed on
the screen at a time)
Function button, open or close the math channel, and set math channel as
current channel.
21
Know the buttons and their functions
Function button; adjust the vertical scale of the selected channel
Function button, vertical position adjustment button, move the vertical
position of the selected waveform
Function button, adjust the horizontal scale (horizontal time base)
Function button, horizontal position adjustment, waveform horizontal
movement
Wheel, quick adjust the trigger level, the cursor, or move waveform, or
used in parameter setting

22
Turn on &turn off
2.6 Turn on & turn off
Press power button to turn on instrument, repress this button to turn off, long press
this button for 3 seconds can forcedly shut off the instrument.
warning:Shut off this instrument may cause data loss.
2.7 Turn on oscilloscope
Turn on the instrument then enter the oscilloscope mode (as the default mode). If the
instrument is in multimeter or recorder mode, press key to switch to oscilloscopemode. When the instrument in scope work mode, the keyboards are all available and press
these buttons, you can open a menu or switch some sort of functions directly. For example,
under oscilloscope mode, press to open main menu.

23
General knowledge of users’ interface
2.8 General knowledge of users' interface
This section does a simple introduction and description to oscilloscope users’ interface.
After reading this section, you can be familiar with the oscilloscope display interface in a
short time. For the specific settings and adjustments, users can refer Chapter Three. The
screen items shown in the following picture may not appear on the same screen
simultaneously, the users’ interface is shown in figure 2-8.

24
General knowledge of users’ interface
Picture 2-8 Users’ interface

25
General knowledge of users’ interface
Users’ interface:
1. There are five kinds of wave capturing mode indicator:
Auto: in auto mode, according the input signal to automatically adjust the vertical scale, the
horizontal time scale, and the trigger mode to make the waveform displays as the best.
Run: Acquire waveform data
Stop: Stop acquiring waveform data
Waiting trigger: a transient state just before trigger event occur
Rolling: Acquire waveform data when scroll the touch screen
2. The probe calibration related square wave output indicator
3. The trigger position icon indicates the waveform trigger position
4. The cursor can be divided into vertical cursor and horizontal cursor, used for measuring
cursor
5. The extension position icon, the center point of the time base zooming out
6. Waveform position indicator, indicate the position of waveform on current screen
between the total sampling data.
7. Memory depth, the current channel memory depth is 120 k
8. Refresh rate, actual wfms/s at right value
9. USB connection icon, which means connect it to PC currently.

26
General knowledge of users’ interface
10. User can view the battery charge status in the following ways
Connected to external power
power capacity remaining battery full, battery under-voltage
11. Display Ch1 zero position, the point is solid, which indicates Ch1 as current channel, and
the pointer color is same as the waveform color.
12. Reference waveform icon: When the pointer is solid, indicating the reference waveform
is current waveform.
113. Ch2 zero position, when the pointer is hollow indicating Ch2 is not the current channel.
14. Math channel icon, when the pointer is solid indicating the math channel is the current
channel.
15. Ch1, reverse color of Ch1 means Ch1 is the current channel and the right reading 1.00 V
means vertical scale of Ch1
16. Math channel, reverse color of math channel means math channel as current channel
17. Math channel, the reading 50 mv means vertical scale of math channel
18. Coupling mode information, here indicates the Ch1 as AC coupling sample. Coupling
examples
Ac coupling sample ground

27
General knowledge of users’ interface
If there is no icon displayed in arrow 18, it is a DC coupling sample.
19. Ch2, here the underline means this channel inverted open, the reading 200 mV is
vertical scale of Ch2.
20. Current in FFT mode, frequency span per grid is 20Hz
21. The bandwidth limit icon that means Bandwidth is limited to 20MHz (3db), no icon if full
bandwidth
22. The value indicates the relative trigger position of current channel, the green arrow next
to the readout means the trigger position deviating from the center to the left or right
23. Screen lock/unlock, lock screen off the touch function, unlock the screen opening touch
function.
24. Horizontal scale (horizontal time base)
25. Trigger condition icons, rise trigger, fall trigger, dual edge trigger
26. Set trigger level value, on the left side of the Ch1 is current trigger source
27. Trigger level, cursor switch indicator
28. Trigger level position, when logic trigger happens there are two pointers, the yellow one
is Ch1 trigger level, and blue one is Ch2 trigger level.
29. Value of cursor measurement

28
Understand touch screen
2.9 Understand touch screen
1. The touch screen function menu
When the function menu opened, you can directly press the touch screen to select menu.
Set the "coupling" as GND, please follow these steps,
1) Press to open the main menu
2) Press “coupling”
3) Press touch screen to select coupling as GND; As shown in picture2-9
4) Press to close function menu then the set is finished.
Picture 2-9 Menus on touch screen

29
Understand touch screen
2. Five operating areas on the touch screen
Frames of the waveform display divide the touch screen into five areas, only the function
menu turned off, can operate these areas. See figure 2-10.
Touchable area description:
1. Horizontal drag area: From the upper waveform window to screen top. You can move
waveform horizontally in this area.
2. Vertical drag and the current channel selection area: where the waveform displays
from the left frame to the right frame. Press the channel icon switch to the current
channel, vertical drag only applies to the current channel.
3. Current channel switch area: press the frame corner at Ch1, Ch2, Math, or Ref and
users can switch one of them to the current channel.
4. Waveform zoom area: the whole waveform display area can be used as waveform
zoom in/out area.
5. Trigger level and drag the cursor area: the area between waveform window's right edge
and screen’s right edge where users can move the trigger level or drag the cursor.

30
Understand touch screen
Picture 2-10 touch area

31
Function test
2.10 Function test
Testing the instrument to make sure whether it is working normally. Please follow these
steps for simple function test
1) Connect the instrument to external power jack, press to turn on, to see
whether the top right corner of screen has a charging icon.
2) Put the probe slot to the Ch1 BNC jack, slightly insert and rotate the slots tighten
clockwise direction.
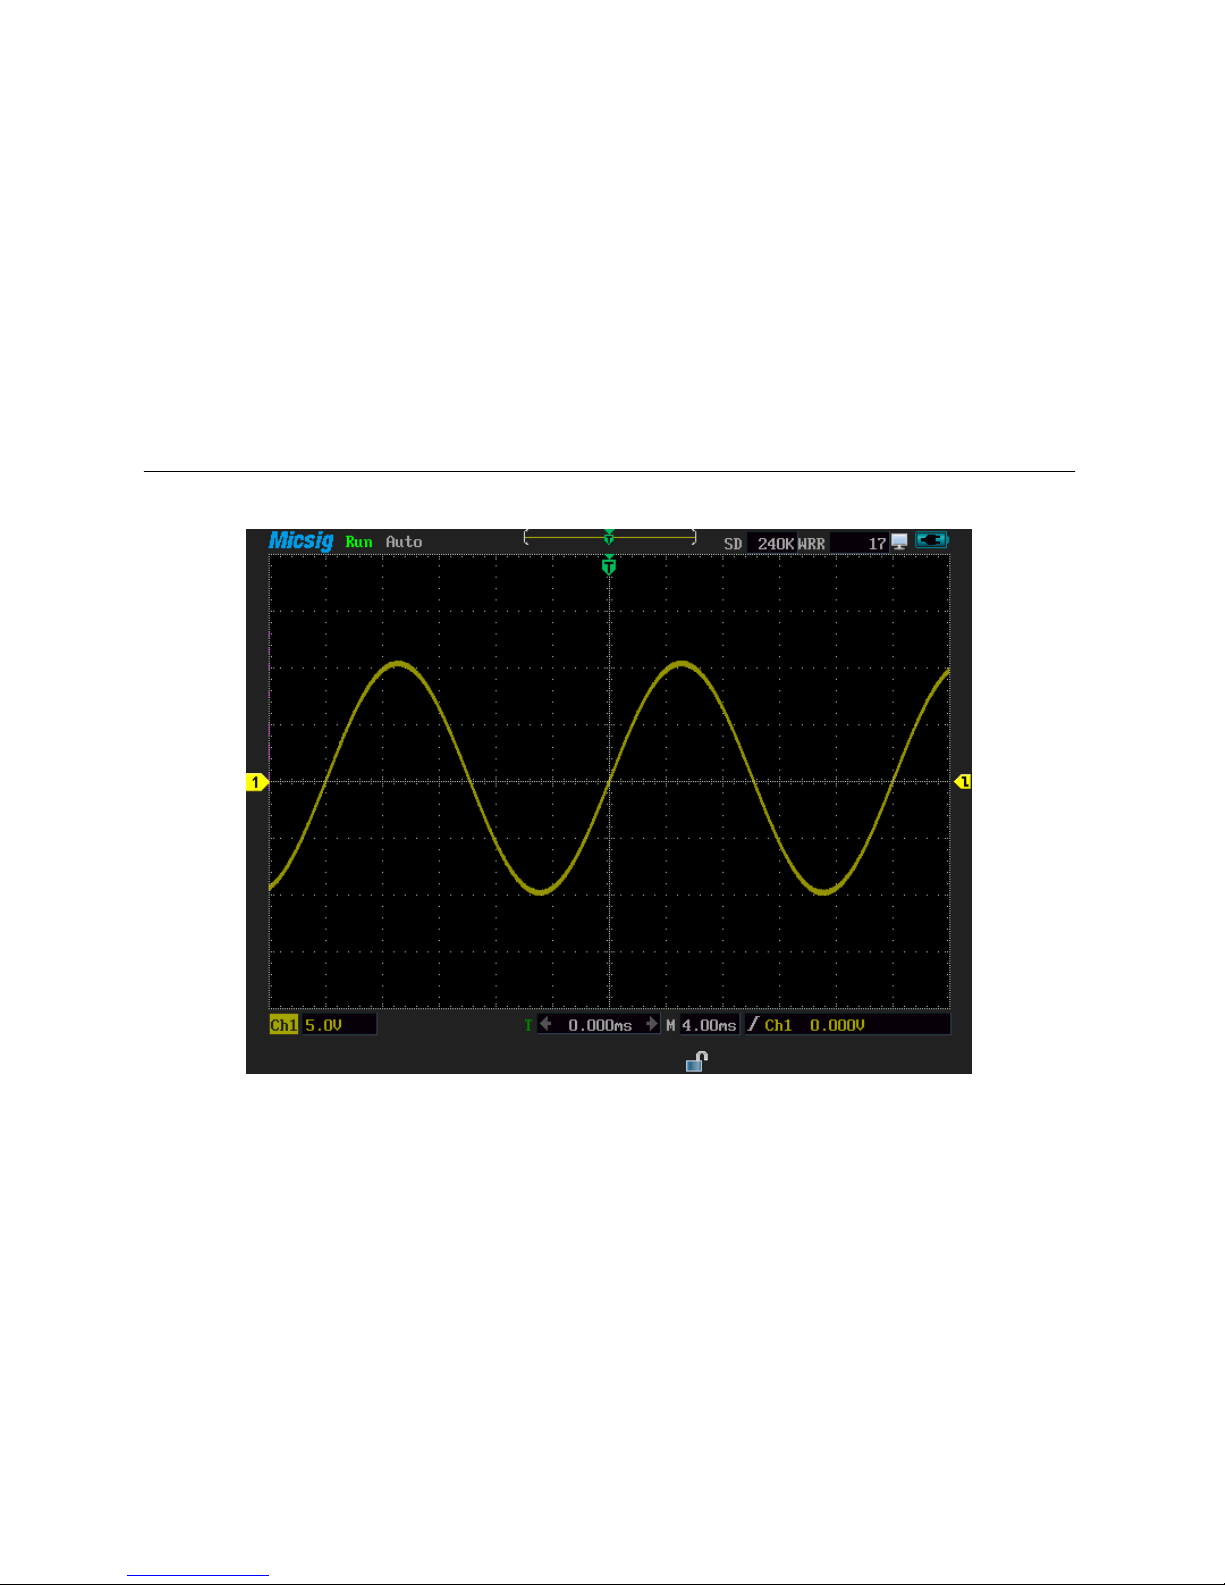
3) Connecting the (10 x) probe to the sine wave signal source (10V, 50 Hz)
4) Press to display signal waveform. View picture 2-11.
5) Switch to the Ch2, and connect the probe to the Ch2, and repeat the step3 and 4.
If find the waveform display abnormal during the function test, please refer to the
troubleshooting Chapter or contact with Micsig after-sales service center.
32
Function test
Picture 2-11 Sine waveform (10V, 50Hz)

33
Probe compensation
2.11 Probe compensation
Before connecting to any channels, users should make a probe compensation to insure the
probe match the input channel. The probe without compensation will lead to larger errors
or mistakes, and probe compensation optimizes the signal path and makes measurement
more precise. If the temperature is 10 degree centigrade or above, this progress must be
done to insure the accuracy of the measurement. See picture 2-12
Picture 2-12 Probe compensation menu
Procedures of probe compensation as follow
1) Connect the oscilloscope probe to Ch1. If you are using a hook head, users should
ensure the good connection with the probe.

34
Probe compensation
2) Press then then and , set the probe calibration signal output
as start , then at the top left corner the square wave screen icon is flashing, indicate square
wave signal is output, see figure 2 to 13;
Picture 2-13 signal output of probe compensation
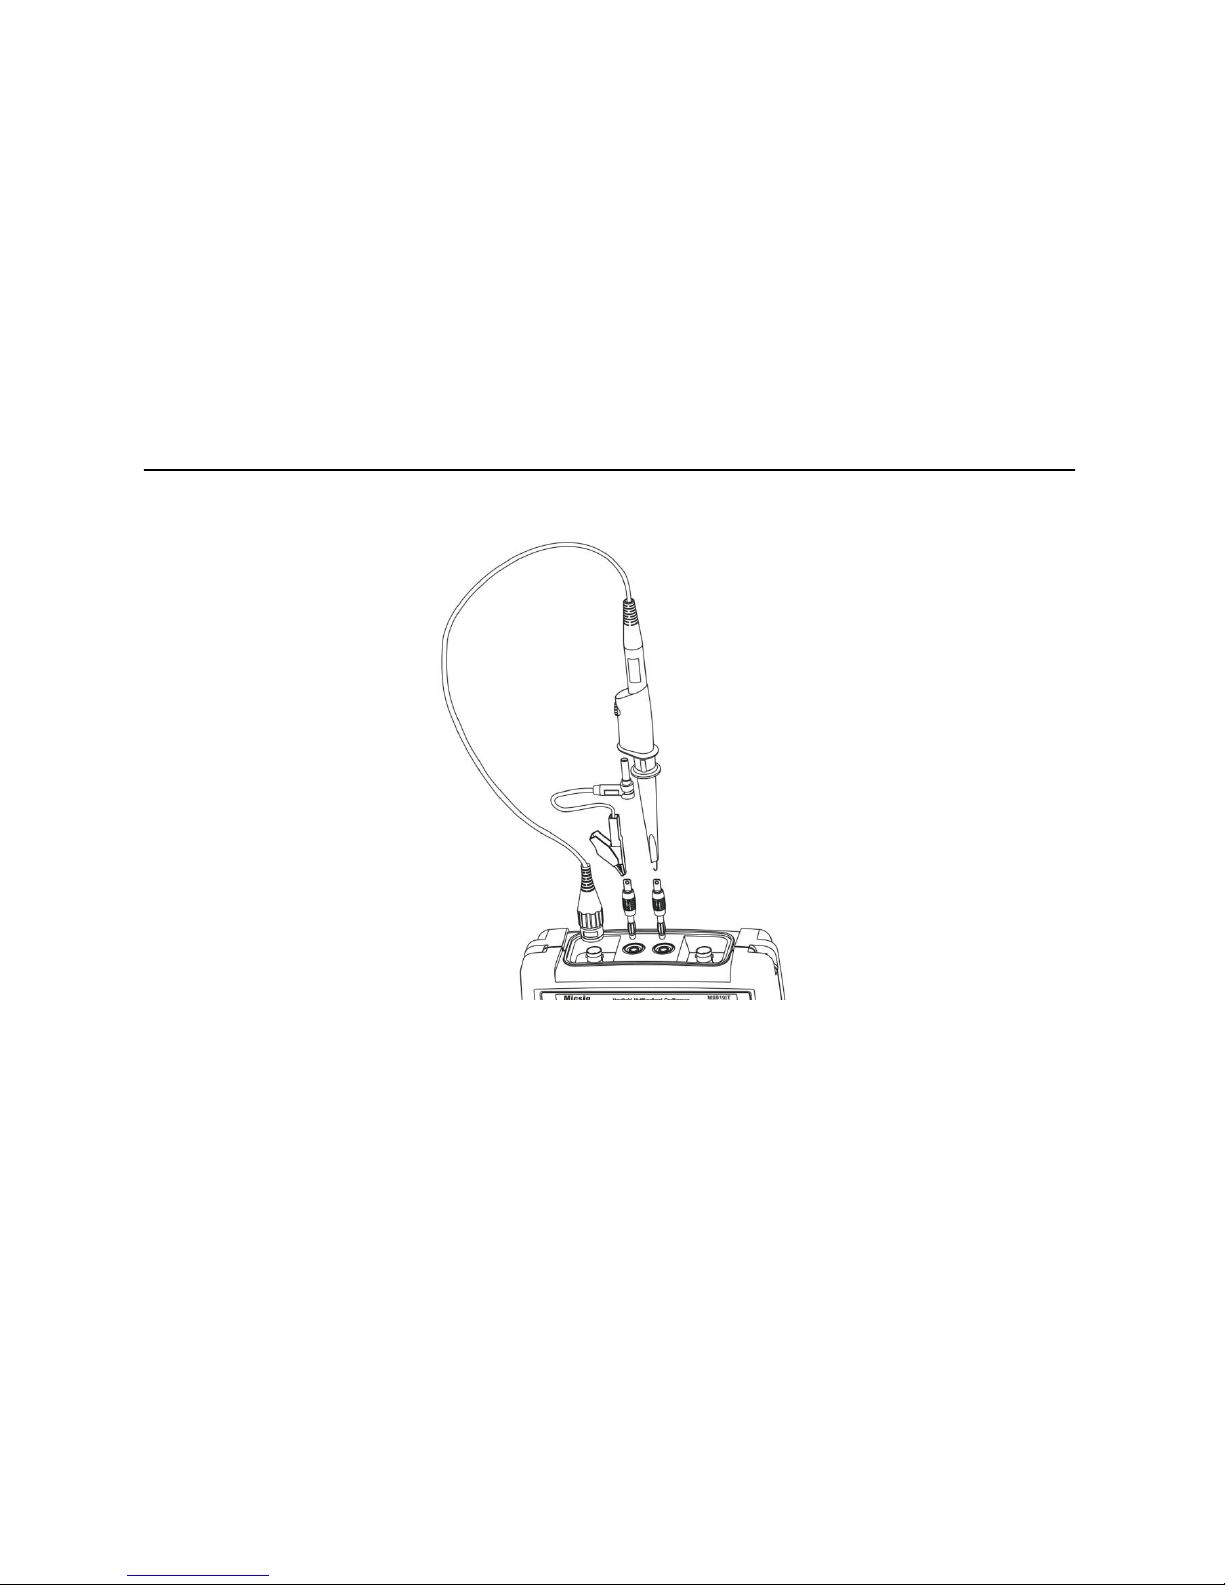
3) Put the banana plug into multimeter jack, and put the probe, which needs calibration
to the banana head. See picture 2-14, press to adjust the waveform display or
manual adjustment, if necessary, users can repeat the above steps and observe the
waveform, shown as picture 2-15, 2-16, 2-17.
35
Probe compensation
Picture 2-14 Probe compensation connection

36
Probe compensation
Picture 2-15 Under compensation
Picture 2-16 Correct compensation
Picture 2-17 Overcompensation
If the waveform on the screen is shown as under-compensation or over-compensation,
please adjust the probe until the waveform shown as correct-compensation.

37
Probe compensation
Picture 2-18 Probe adjustment

38
Probe compensation
Warning in any case using the probe should follow these steps
Ensure the wire insulation is good to avoid probe electric shock while measuring high
voltage;
Keep your fingers behind the probe security circle to prevent electric shock;
Do not touch metal parts of the probe-head to prevent electric shock;
Before the measurement, please correctly connect the probe ground end.

39
Chapter Three Use Oscilloscope

40
Using oscilloscope
This chapter contains the oscilloscope operating details. We recommend you read this
chapter carefully, in order to understand abundant functions and specific methods of this
instrument.
This chapter mainly includes the following contents
Channel selection
Set the channel coupling mode
Set the channel sampling mode
Bandwidth selection
Use delay
Set channel polarity
Set probe ratio
Auto-calibration
Set auto-measurement type
Set the save/restore menu
The cursor measurement
Set display menu
Set trigger menu
Use vertical and horizontal button

41
Using oscilloscope
Use auto-set
Use math menu
Run/stop button and single sequence
Reference channel
Use 50% shortcut button
Using touch screen zoom waveform

42
Channel selection
3.1 Channel selection
Current channel: oscilloscope can display multiple waveforms simultaneously, but there is
only one waveform can display on the top, which is called the current channel. The current
channel arrow is solid, otherwise the arrow is hollow, and the differences are shown in
figure 3-1.
Picture 3-1 The current channel in yellow and the non-current channel in blue
Use buttons: the two buttons and , corresponding to Ch1 and Ch2 at the
front panel
Press on these two buttons can achieve the following three functions respectively

43
Channel selection
(a) Open channel (b) Close channel (c) Set the channel as current channel
Taking Ch2 for example
If Ch2 is in open state, but not the current channel, press to set Ch2 as current
channel.
If Ch2 is in current channel state, press to close Ch2.
If Ch2 is in off state, press to start Ch2, then the Ch2 is set as the current channel.
Use the touch screen: the left side of the screen is vertical drag and current channel
selection area. Press the arrow-pointing channel or press the channel icon under the current
channel selection area can set the non-current channel to current channel. But user can’t
close the channel here.
3.2 Set channel coupling mode
Press to enter main menu, press to choose coupling mode as DC, AC or
GND, user can operate the steps on touch screen directly.

44
Set channel coupling mode
Tips:This setting applies only for the current channel, if need setting other channels, user
should switch to the current channel first, then press or to switch directly, no
need to exit the main menu
Ch1 connects to the DC bias of square wave signal; please follow these steps to set the DC
coupling sample
1) Press to enter main menu set
2) Press to set the coupling mode as DC, waveform is shown in figure 3 -2 DC.
DC AC GND
Picture 3-2 coupling

45
Set channel coupling mode
DC: DC coupling, the measured signal contains the DC and AC components both can
get through, as shown in figure 3-2 DC;
AC: AC coupling,the measured signal of DC signals are blocked, only allowing the AC
component get through, as shown in figure 3-2 AC;
GND: the measured signal is blocked, as shown in figure 3-2 GND.
Sample coupling mode in the left corner of screen, as shown in picture 3-3, CH1 is in
coupling GND, CH2 is in coupling AC, and if there is no arrow point means the channel is in
DC coupling.
Picture 3-3 Coupling icon

46
Set channel sampling mode
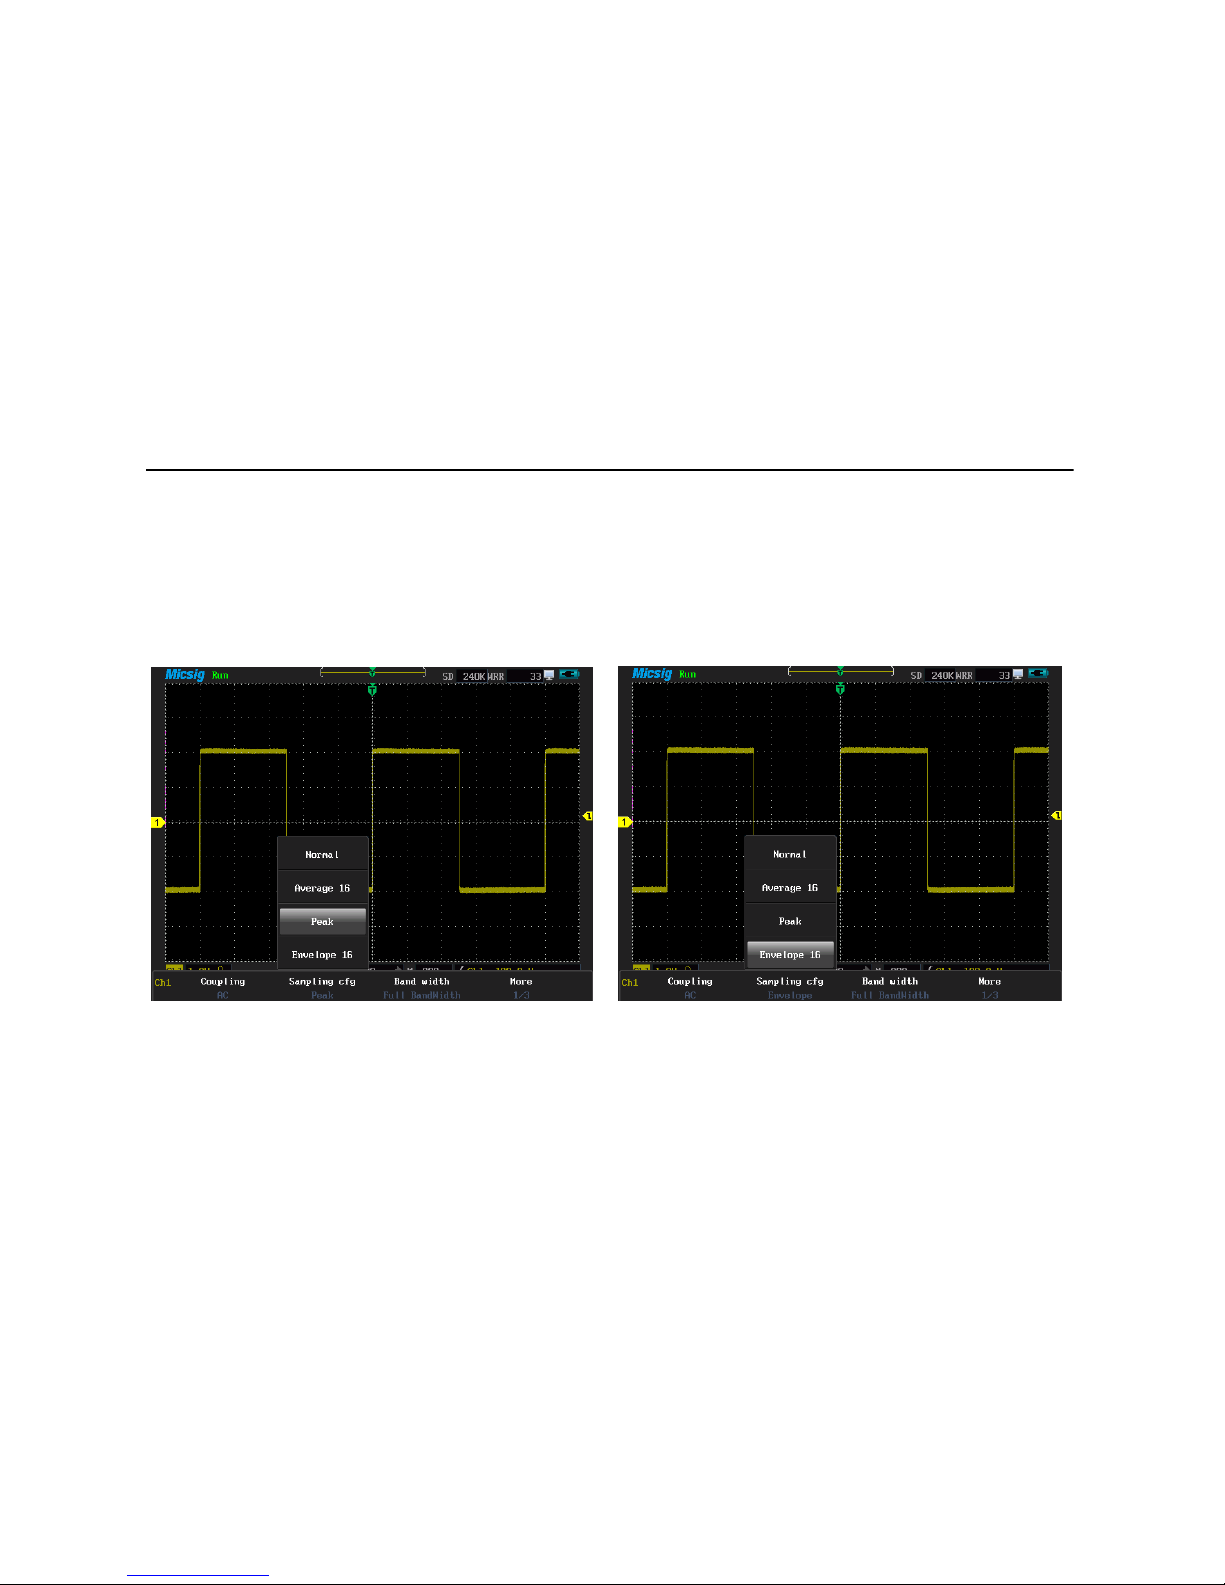
3.3 Set channel sampling mode
Press and to export sampling cfg menu, then press and you can
choose the sampling config (user can operate the steps on touch screen). The sampling
config menu is shown in picture 3-4.
Picture 3-4 Sampling config menu
Systems can support four kinds of sampling configs
1. Normal oscilloscope samples signal through equivalent time intervals to build waveform,

47
Set channel sampling mode
the default setting is normal mode. Waveform is shown in picture 3-5.
Picture 3-5 Normal sampling config Picture 3-6 Average 16 sampling config
2. Average: waveform does average processing from multiple sampling. You can use the
average functions to reject random or uncorrelated noise in the waveform without loss of
bandwidth. Press or roll the wheel to set the waveform average number,
selectable average number is 2, 4, 8, 16, 32, 64, 128, 256, and the waveform is shown in
48
Set channel sampling mode
figure 3-6.
3. Peak in this mode, using two continuous capture intervals (include the highest point and
the lowest point) can get the possible missing narrow pulses and can be used for burr
detection, however, the noise is much higher than normal. See the waveform in picture3-7.
Picture 3-7 peak sampling cfg Picture 3-8 envelope 16 waveform sampling cfg
4.Envelope:Here you can see the waveform rejection after several samplings. In the
specified N samplings, always display the Mini-Max values at the same acquisition positions.

49
Set channel sampling mode
Press or roll the wheel to set the number of waveform rejection, which can be set
to 2, 4, 8, 16, 32, 64, 128, 256, or infinite, waveform is shown in figure 3-8.

50
Bandwidth selection
3.4 Bandwidth selection
Press and to set the required bandwidth limit, the 20MHz bandwidth can only
keep low frequency component under 20MHz, and high frequency component above 20MHz
can attenuation effectively. The difference between full bandwidth and 20MHz can be
expressed by waveform. Full bandwidth is shown in picture 3-9; 20MHz bandwidth is shown
in picture 3-10.
Picture 3-9 Full Bandwidth picture 3-10 20 MHz Bandwidth
In picture 3-10, the arrow point indicates bandwidth(20MHz).

Use delay
51
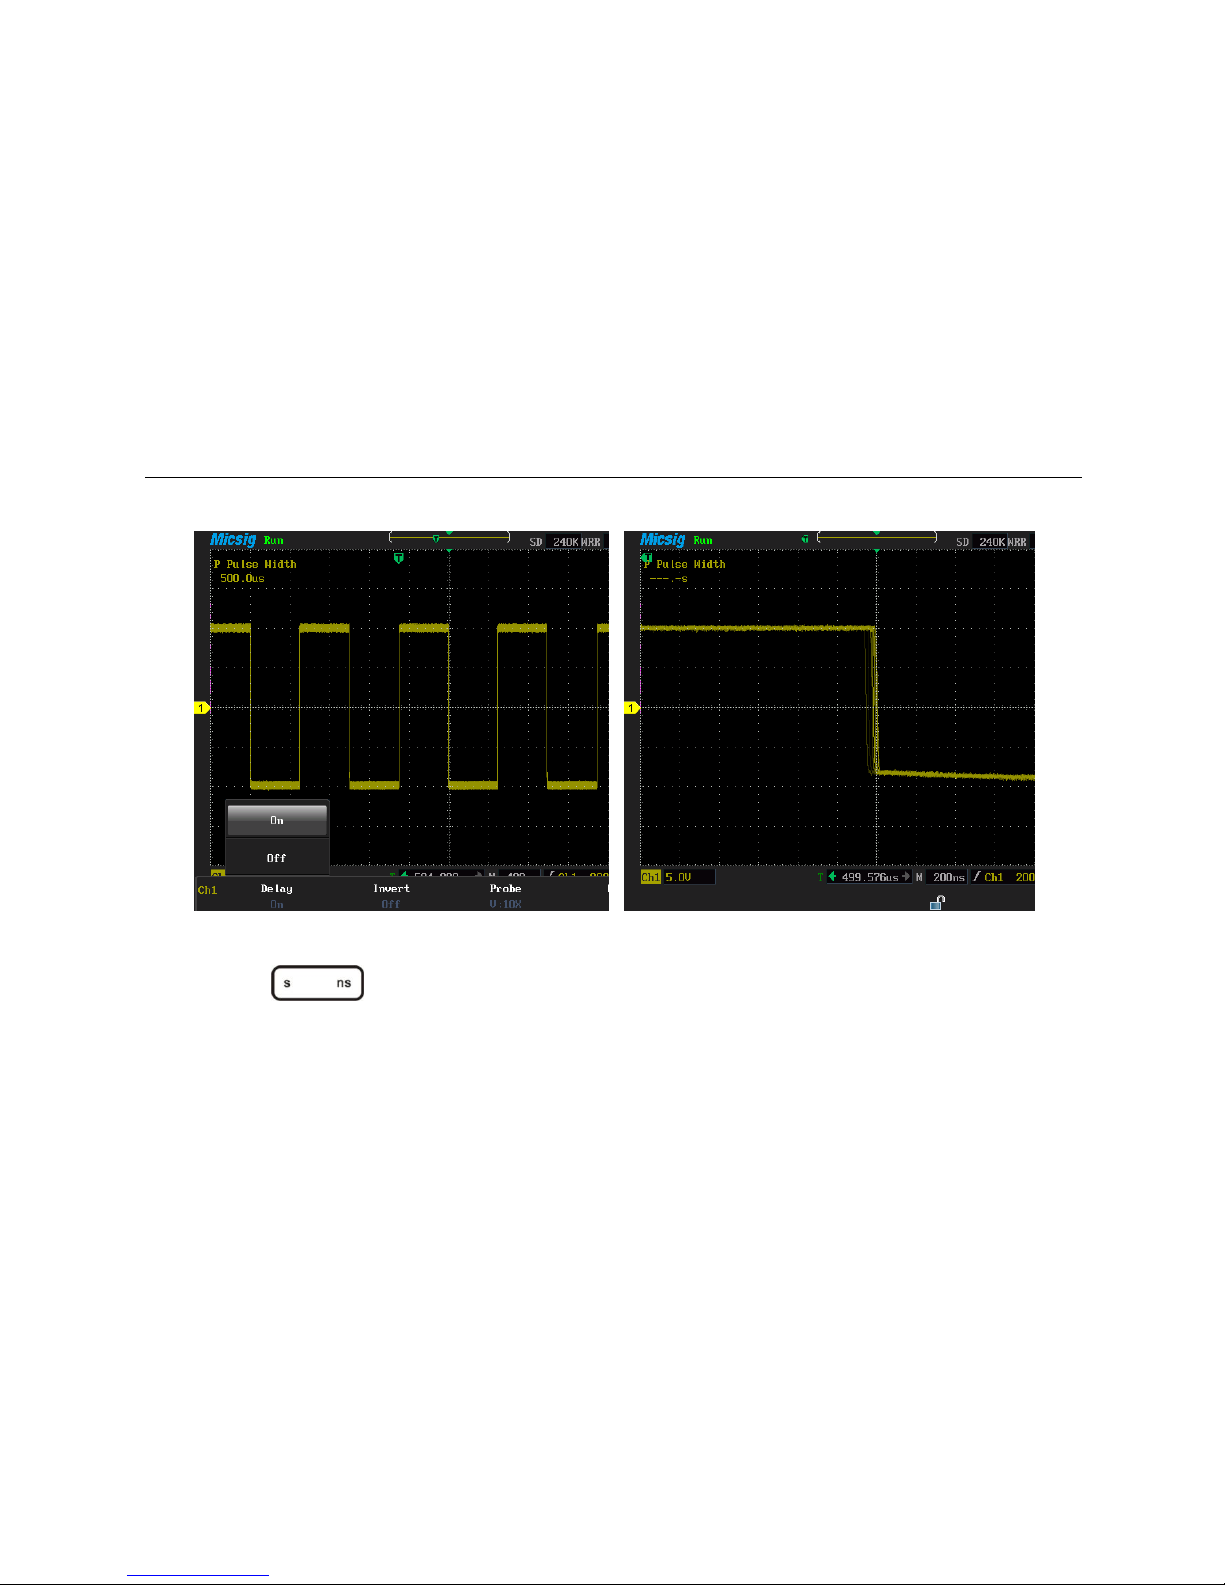
3.5 Use delay
Delay is to acquire data later than trigger happened.. When delay is on, the trigger can be
removed from the screen, and the horizontal extension point locates in the middle of the
screen, and adjusts the horizontal time scale can observe more details of the waveform.
Sometimes the measured value is not stable while measuring pulse width. This is called
pulse width jitter. In this case, turn on delay function and extend the time base; and does
delayed acquisition after rising trigger to observe the falling waveform jitter. For example,
1) Press then then to choose delay on
2) Move the waveform to the left, making the falling edge of waveform in the middle of
the screen, as shown in figure 3-11,
Use delay
52
Picture 3-11 On delay menu Picture 3-12 Delay state
3) Press to enlarge waveform until it jitters significantly, observe the jitter
effect shown as 3-12
When delay is on, the trigger readout under the bottom of the screen is time value; when
delay is off, the trigger readout is a percentage, the most left side screen is 0%, the most

Use delay
53
right side is 100%; two kind of displays as shown in figure 3-13, 3-14.
Picture 3-13 delay on and the trigger position picture 3-14 delay off and trigger position
Note: when the delay on, adjust the time scale, waveform zoom is based on center of
screen. When Delay off, adjust the time scale, waveform zoom is based on trigger position
3.6 Set channel polarity
The waveform polarity is relative to the zero level (ground), if the actual signal is positive
however in the instrument is negative, which called negative polarity or phase invert. By
setting the Ch1 and Ch2 channel’s polarity, users can make the two channels work
respectively in a phase invert or normal state. Follow the examples to set channel polarity.
Ch1 and Ch2 connected to the same rectangular pulse signal simultaneously and make the
Ch1 and Ch2 both on

Setting channel polarity
54
1) press then and ,
2) Set Ch1 as current channel, press to select invert on
3) Set Ch2 as current channel, press to select invert off, waveform is shown
in picture 3-15.
Picture 3-15 Invert polarity of the two waveforms

Set channel attenuation factor
55
3.7 Set channel attenuation ratio
To coincide with actual probe attenuation radio, it is necessary to adjust channel
attenuation factor under the channel menu. Such as probe attenuation radio of 1:1,
corresponding input channel attenuation factor set as 1 x.
When probe attenuation factor is changed, users need to enter this menu to set the
corresponding attenuation factor, only the set matches, can display waveform’s amplitude
rightly. Probe attenuation radios and attenuation factors are shown in the table below,
Probe attenuation radio
Attenuation radio menu
1:1
1X
10:1
10X
100:1
100X

Set channel attenuation factor
56
Press then then and to open channel attenuation factor menu,
and set the current channel factor, if need to set another channel, no need to exit,
users can switch the current channel to do so, as shown in picture 3-16.
Picture 3-16 Probe attenuation factor menu

57
Auto-calibration
3.8 Auto-calibration
According to the current environment, automatically calibrate each channel scale’s zero
position and parameter. In oscilloscope mode, press then then and
into auto-calibration mode. When auto-calibration function is active, the upper left
corner of the screen displays calibrating in red, after calibrating finished, the red calibrating
disappear. When the temperature changes largely, auto-calibration can make the
instrument maintain high accuracy of measurement
Auto-calibration should be done without probe
auto-calibration process takes about two minutes
if the temperature changes above 10℃, we recommended users perform the
auto-calibration
3.9 Set auto measurement type
Press can open auto-measurement menu and there are 31 kinds of

58
Set auto measurement type
auto-measurement types applied to Ch1, Ch2, math and reference channel. Before choosing
the measurement type, it must set the measured channel as current channel.
The instrument can display four measurements simultaneously. Types and specifications are
shown in the table.
Serial
Type
Instructions
1
Period
The time required to complete the first cycle in a waveform or gated region;
period is the reciprocal of frequency and is measured in seconds.
2
Rate
Reciprocal period time
3
Rise time
The time required for the leading edge of the first pulse in the waveform or
gated region to rise from the low reference value(default=10%)to the high
reference value(default=90%)of the final value
4
Fall time
The time required for the falling edge of the first pulse in the waveform or
gated region to rise from the low reference value(default=90%)to the high
reference value(default=10%)of the final value

59
Set automatic measurement type
5
P duty cycle
The ratio of the positive pulse width to the signal period expressed as a
percentage. the duty cycle is measured on the first cycle in the waveform or
gated region
6
N duty cycle
The ratio of the negative pulse width to the signal period expressed as a
percentage. the duty cycle is measured on the first cycle in the waveform or
gated region
7
Delay
The time between the mid reference(default 50%) amplitude point of two
different waveforms
8
P pulse width
The distance between the mid reference(default 50%)amplitude points of a
positive pulse. the measurement is made on the first pulse in the waveform
or gated region
9
N pulse width
The distance between the mid reference(default 50%)amplitude points of a
negative pulse. the measurement is made on the first pulse in the waveform
or gated region

60
Set automatic measurement type
10
Burst width
The duration of a burst(a series of transient events) and is measured over the
entire waveform or gated region
11
P overshoot
This is measured over the entire waveform or gated region and is expressed
as P overshoot = [(max– high)/amplitude] x 100%
12
N overshoot
This is measured over the entire waveform or gated region and is expressed
as N overshoot = [(low- mini)/amplitude] x 100%
13
Phase
The amount of time that one waveform leads or lags another waveform,
expressed in degrees where 360°comprises one waveform cycle.
14
Peak-peak
The absolute difference between the max. and min. amplitude in the entire
waveform or gated region
15
Amplitude
The high value less the low value measured over the entire waveform or
gated region
16
High
The value is used as 100% whenever high reference, it can be calculated using
either the min/max or histogram method.
17
Low
The value is used as 0% whenever high reference, it can be calculated using

61
Set automatic measurement type
either the min/max or histogram method.
18
Max
Typically the highest positive peak voltage which is measured over the entire
waveform or gated region
19
Mini
Typically the lowest negative peak voltage which is measured over the entire
waveform or gated region
20
Mean
The arithmetic mean over the entire waveform or gated region
21
Cycle mean
The arithmetic mean over the first cycle in the waveform or the first cycle in
the gated region
22
RMS
The true Root Mean Square voltage over the entire waveform or gated region
23
Cycle RMS
The arithmetic mean over the first cycle in the waveform or the first cycle in
the gated region
Use button: Use the wheel or touch screen to select measurement types and related
settings.
press to upward cycle, press to downward cycle,press to right

62
Set automatic measurement type
cycle, press or roll the wheel to left/ right, from top to bottom cycle, press
to confirm or cancel options. Press the touch screen to choose item or cancel this
measurement type directly.
Measure Ch1 frequency and Vpp, measure Ch2 rise time, Vmean, please follow these steps.
1) Plug probes to Ch1 and Ch2 respectively, and connect them to signal source;
2) Set Ch1 as current channel, press then the screen popup measurement
types, press on the touch screen, select Ch1 measurement type as the “Frequency”
and peak-peak; press to choose Ch2 as current channel, and set Ch2
measurement types as rise time and mean
3) Adjust the vertical scale and horizontal scale; make the waveform display At least
one entire cycle. Picture 3-17

63
Set auto measurement type
Picture 3-17 Measurement types
Introductions of measurement types on the screen: 1 Current channel
2 Measurement types menu
64
Set store/restore menu
3.10 Store/ restore menu
On this menu, users can do operations like, save/recall waveform, and adjust the memory
depth, dynamic waveform record/playback, save/recall settings, and screen snapshot
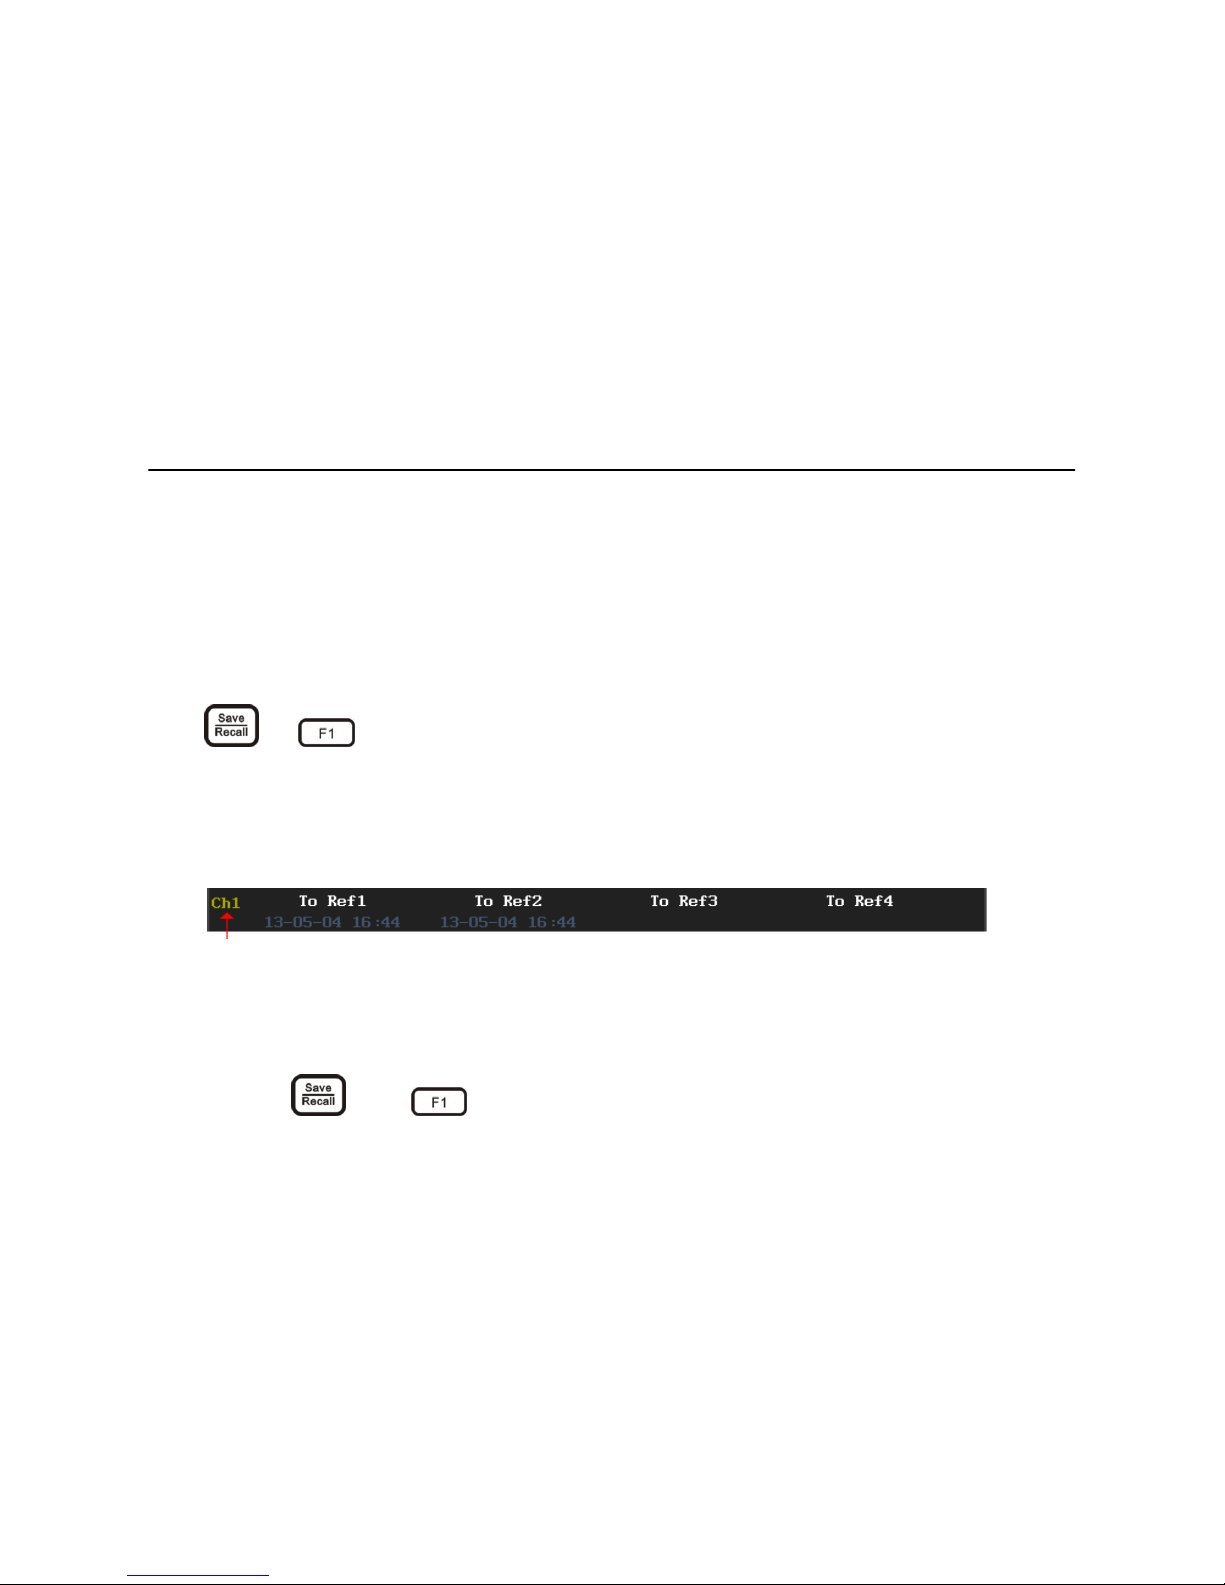
3.10.1 Save
Press and to enter the save waveform menu, to save Ch1/Ch2/math waveform
as reference waveform, which marked in color purple. Date and time displayed under the
To Ref R*means this memory has already saved waveforms, blank means no waveform
saved. Picture 3-18
Picture 3-18 The reference waveform
Please follow these steps to save Ch1 waveform to R1,
1) Connect probe to Ch1 and connect it to the signal source.
2) Press and to enter the save waveform menu.

65
Set store/restore menu
3) Press to store waveform to R1, shown in picture 3-19, yellow waveform is Ch1
waveform, purple one is the waveform after being saved. The two waveforms
overlap with each other.
Picture 3-19 Stored waveform to R1
It can save four reference waveforms (R1/ R2/ R3/ R4) at most. If continue repeat saving,

66
Set store/restore menu
the original waveform will be covered.
3.10.2 Restore
press and to enter the waveform recall menu,the recalled waveform is in
purple and the instrument can display four recalled waveforms simultaneously if waveform
recall menu displays in gray which means no waveform data. If marked “Refer R” illustrates
the waveform is selected.
Please follow the steps to recall waveform
1) Press and to enter the waveform recall menu;
2) Press to recall waveform Ref1 and then the Ref1 is the current waveform
3) Press then and to restore waveforms (R2/R3/ R4), please
refer to picture 3-20.

67
Set store/restore menu
Picture 3-20 restore waveform

68
Set store/restore menu
3.10.3 Memory depth
Memory depth means the oscilloscope’s capacity of storing sample points. For example, the
store depth is 120K, and it says it can store 120k sample points.
Press and to enter the adjustment menu of store depth, if it is a single
channel, it can be set to2.4K, 24k, 240k, and a dual channel can be set to1.2k,12K, 120k,and
press to adjust the value of store depth.
3.10.4 Dynamic record
Note: MS300 serial need to be updated to get this function; MS500 serial have this function
Dynamic record can easily record the waveform and memory operation steps. Only after
identifying the USB device can start dynamic record. U device icon will be displayed at
upper right corner if U device is connected and ‘Dynamic record’ turn white(grey
previously)(note: system divides U device into four store area automatically, based on the
need to store the four different information into separate areas. if the record area has
69
Set store/restore menu
stored waveform, the record will overlap the last record)
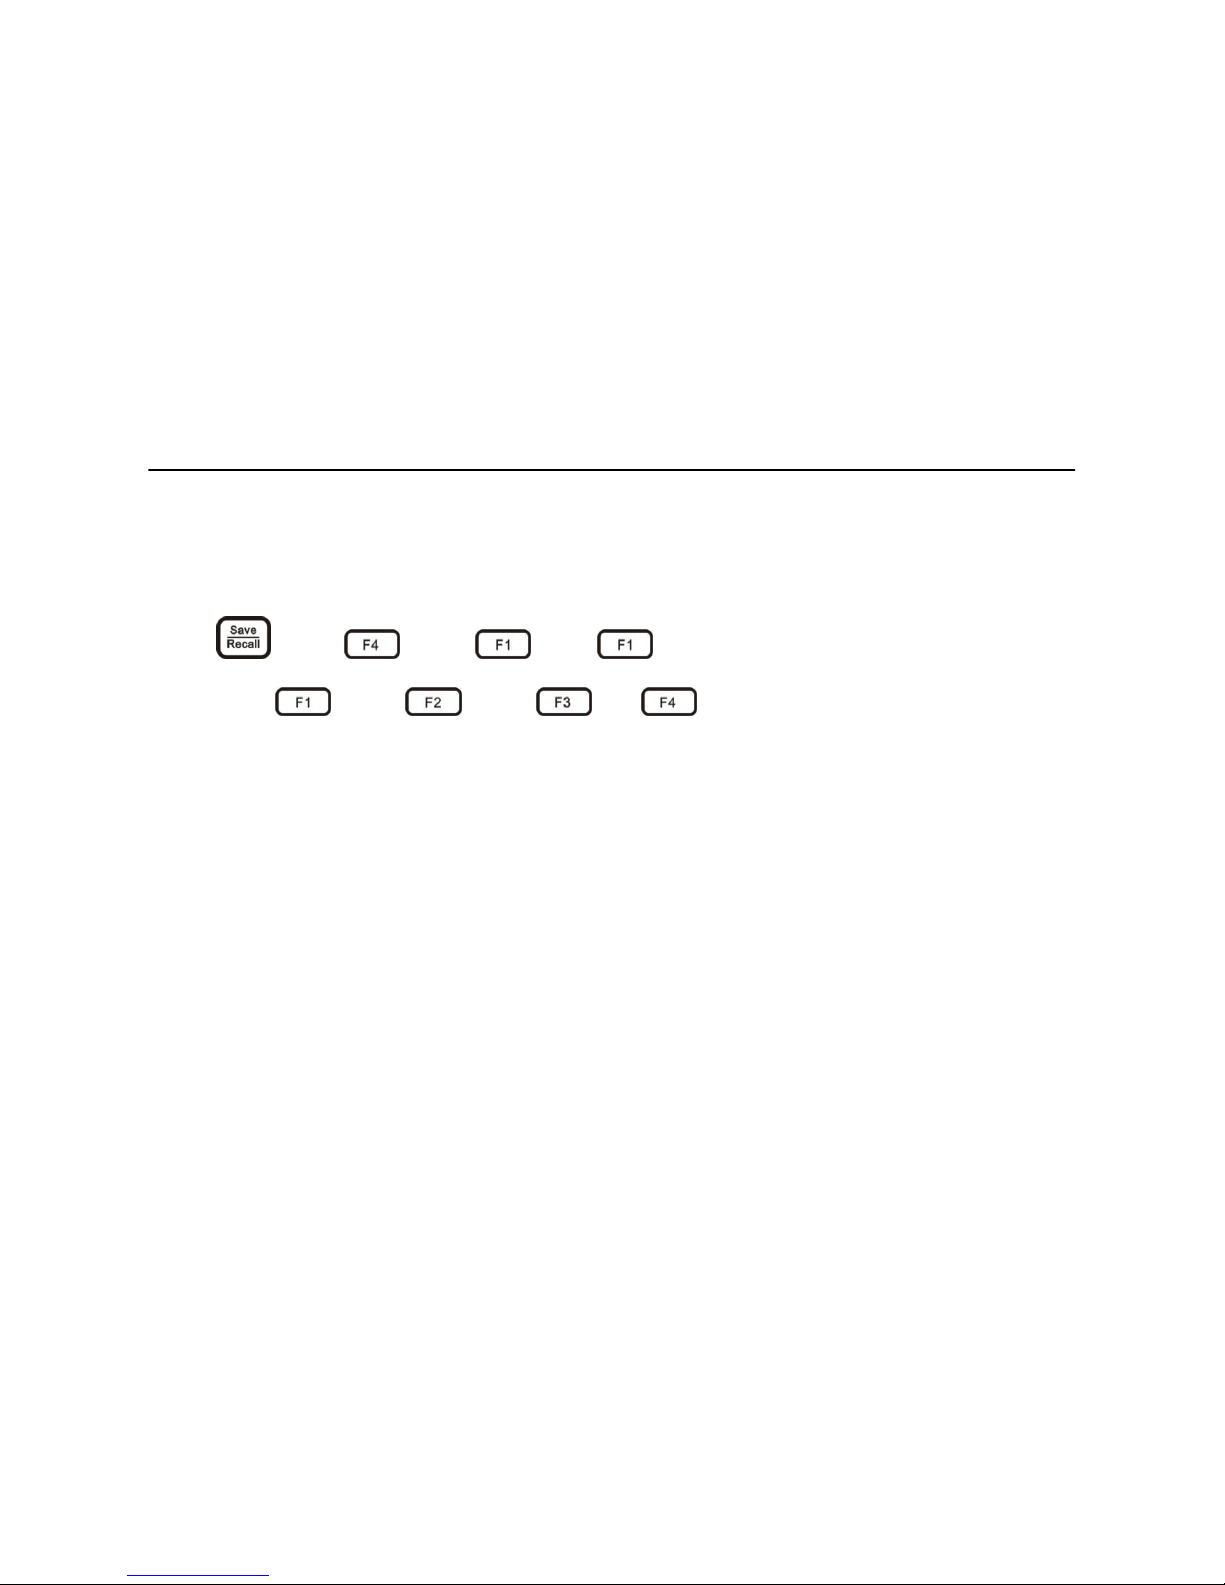
Waveform record
Press then then and to enter the waveform record menu,
then press then then or to select the corresponding store
area and start waveform record, as shown in picture 3-21.

70
Set store/restore menu
Picture 3-21 Waveform record
Interface descriptions of waveform record
1. Recording icon, the icon flashes while recording
2. Dynamic record mode, being record

71
Set store/restore menu
3. Frame number for the current record
4. Stop , press to record waveform and return to the previous menu
Playback waveform data
Press then then and to enter the waveform playback menu;
Then press then then or to select corresponding store area and press
to start the waveform playback. See picture 3-22.

72
Set store/restore menu
Picture 3-22 waveform data playback

73
Set store/restore menu
Interface descriptions of waveform playback
1. Run ,timeout ,stop , the current state is running.
2. Dynamic record mode, being playback mode
3. External USB device icon
4. Total frames
5. Current playback frame number
6. Stop , press to stop waveform playback and return to the previous menu
7. Forward
8. Back
9. Play stop , press to operation
Tips: Press can speed forward or backward, each press can forward/back10
frames, and long pressing this button means quick forward/backward

74
Set store/restore menu
3.10.5 Store settings
To store current setting, press then and to enter store settings menu,
press the function menu to select one store slot(Up to 9 storage slots is available).
3.10.6 Restore settings
Restoring a setting from this instrument, users should press then and to
restore settings menu, press to restore the default setting. Details of restore settings
are shown as appendix C. Choose other menu item can restore corresponding saved setting.
3.10.7 Screen snapshot
Note: MS300 serial need to be update to get this function; MS500 serial have this
function.
After identifying the U device, the menu color of the “screen shot” changes from grey to
white, then the screen shot function is active. Screen shot will format the current screen to

75
Set store/restore menu
BMP image and save it to U device. Press then and to complete screen
shot
3.11 Cursor measurement
Press to enter cursor menu. There are vertical and horizontal cursors, horizontal
cursor measures vertical direction value, and vertical cursor can measure both horizontal
and vertical direction values. Using the horizontal cursor and vertical cursor to open cursor,
close the cursor and switch the horizontal or vertical cursor.
Take the vertical cursor for example
When the vertical cursor is off, press “vertical cursor”, correspondingly press to
open vertical cursor. Then vertical cursor is current cursor. Which is marked as .

76
Cursor measurement
When the vertical cursor is open, but not the current cursor, then press to set
the vertical cursor as the current cursor.
If vertical cursor is the current cursor, then press to shut down vertical cursor.
Instructions about activate/move the cursor:press to open the cursor menu and
select the current cursor, then press to activate the cursor(activated cursor is in
solid line and others as hidden line), press or roll the wheel to move the active
cursor; press to open the tracking mode and activate the two cursor simultaneously,
then press or roll the wheel to move the two cursors simultaneously. The results
are shown in the upper-right of the screen. See picture 3-23.

77
Cursor measurement
Picture 3-23 H Cursor and V Cursor
Interface descriptions of horizontal and vertical cursor
1: Current cursor
2: Activated cursor
3 @:(1)when only horizontal cursor is opened, it indicates the activated horizontal cursor is

78
Cursor measurement
relative to the voltage difference value which is at the zero level.
(2) When only open vertical cursor, it indicates the activated vertical cursor and the
waveform intersection point are relative to the zero level of voltage difference value.
(3) When horizontal and vertical cursor are opened simultaneously, it indicates the last
activated horizontal cursor is relative to the zero level of voltage difference value.
4 △:(1)when horizontal cursor is opened, it indicates voltage difference value between two
horizontal cursors (2)when vertical cursor opened alone, it indicates the voltage
difference value between two vertical cursors and waveform intersection point.
5 @: The last activated vertical cursor is relative to the time difference value of the trigger
point
6 △: Time different value between two vertical cursors
7 S: equal to horizontal cursor△(voltage difference)/the vertical cursor(time difference),
that is the slope of the four cursors intersection

79
Cursor measurement
Instructions of the cursor or trigger level switch operation:After opening the cursor menu,
press to close the menu, the bottom right corner of the screen displays Level and
Cursor, then press or press the touch screen to switch. When the Level is active,
press or roll the wheel can adjust trigger level, see picture 3-24, while the Cursor is
lighted on, the operator is the cursor, see picture 3-25.
Picture 3-24 Trigger level operation
Picture 3-25 Operate the cursor
80
Set display menu
3.12 Set display menu
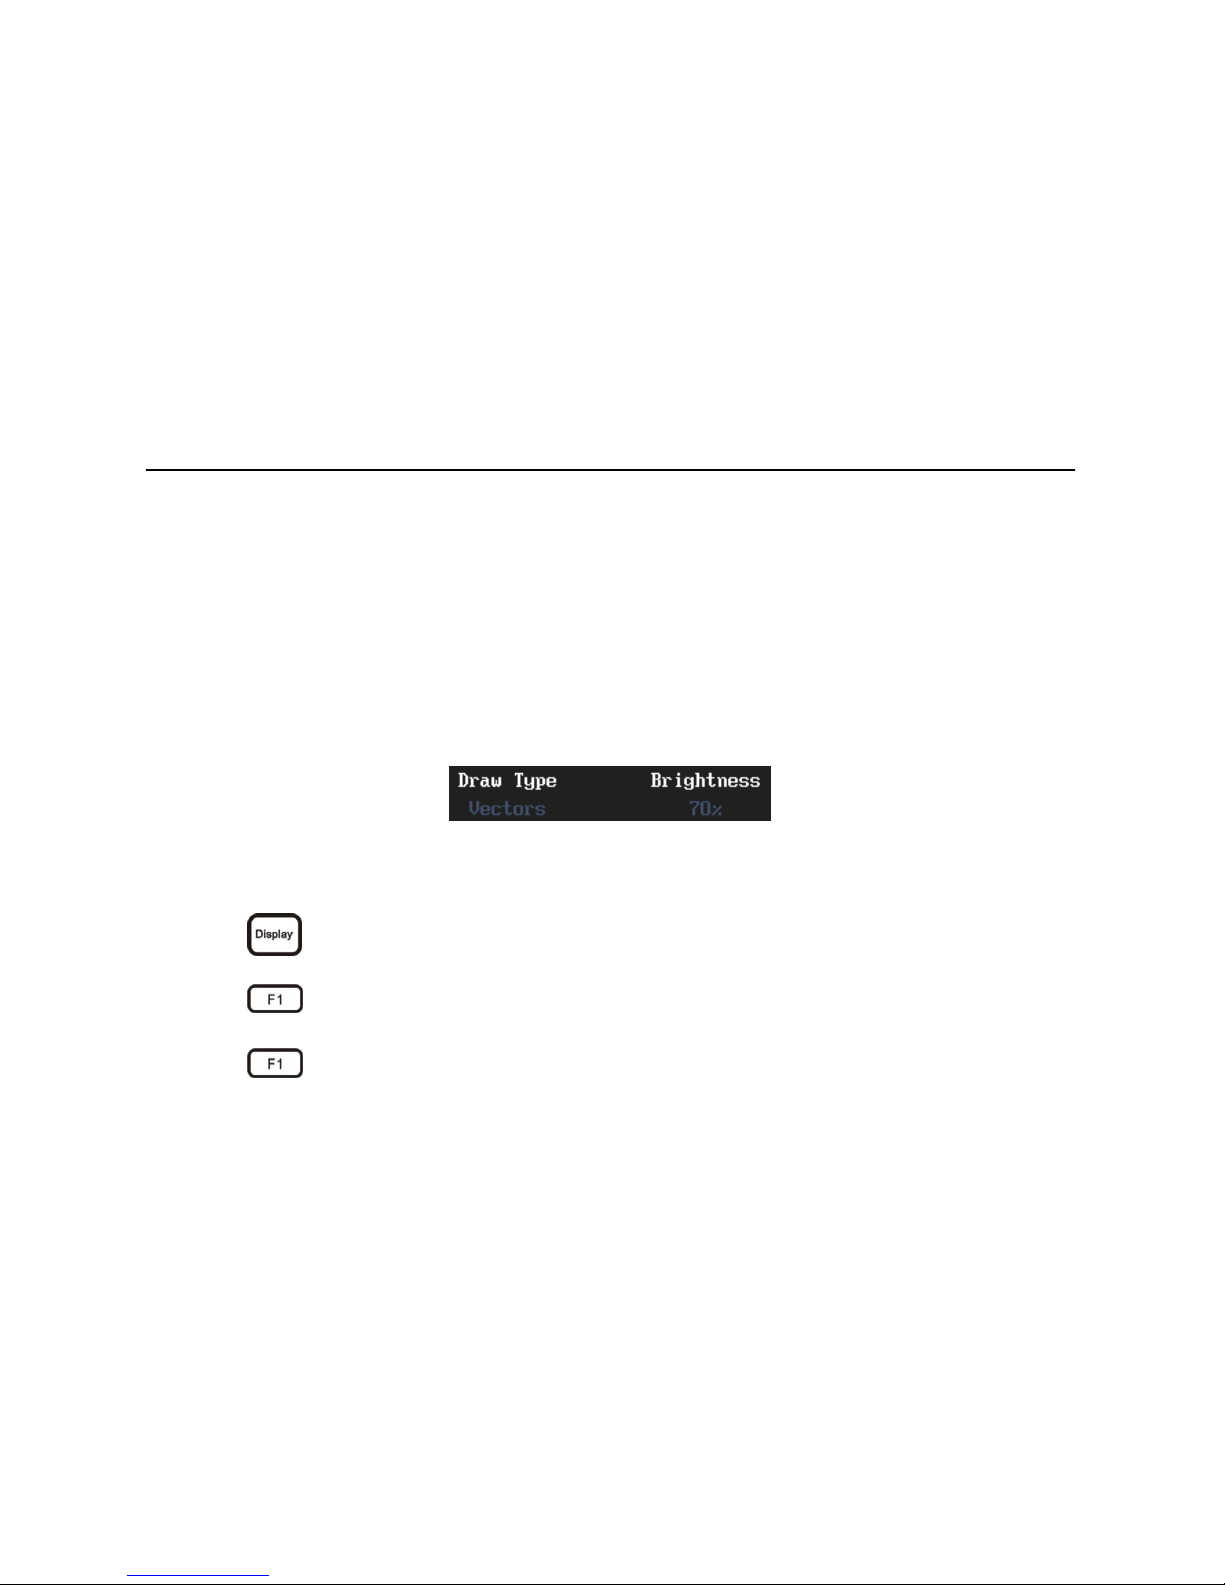
In this menu, you can set waveform as Draw Type, Brightness, Graticule, and Graticule
Intensity, Persist , Time base and Refresh Rate
3.12.1 Waveform settings
Set waveform draw type mode and waveform brightness. Waveform display mode shows as
sampling dots and vectors, the waveform brightness displays in percentage. See picture 3-26
Picture 3-26 Waveform set menu
a) Following the below steps to set waveform as sampling dots.
1) Press to enter the display menu;
2) Press to enter waveform setting;
3) Press to enter draw type set;

81
Set display menu
4) Press to choose skeleton pattern as Dots. See picture 3-27.
Picture 3-27 point display
b) Following the below steps to set waveform brightness
1) Press to choose brightness set
2) Press or roll the wheel to adjust the waveform brightness.
3.12.2 Graticule set
To set the graticule type and intensity, the type includes full, grid, cross hair and frame.

82
Set display menu
Graticule set menu as shown in picture 3-28
Picture 3-28 Graticule set menu
Following the below steps to set graticule
1) press and to enter “graticule” setting
2) press to set graticule type, view picture 3-29 and the frame type shows the
border
3) Press and select the graticule intensity and then press or roll the wheel
to adjust graticule intensity.

83
Set display menu
Full Crossing line Grid
Picture 3-29 Graticule type
3.12.3 Persist adjustment
Active persist to delay waveform illumination’s attenuation, the Time can be set as
100ms-10s, ∞, or auto. Keep all the waveform illumination spots, until toggle the control
setting to remove persist display.
Tips for adjusting afterglow time:Singly press or for precise adjustment and long
press or for rough adjustment
Following these steps for persistence settings
1) Press to enter persist set;

84
Set display menu
2) Press to persistence set and press or roll track-wheel to adjust the
persistence time; press to auto persist; Press to erase persist.
Persist time is ∞ shown in picture 3-30, persist time is 200ms shown in picture 3-31.
Picture 3-30 persist time ∞ picture 3-31 persist time 200ms
3.12.4 Time base
In the Time base menu, you can set the waveform display as YT or XY mode( MS300 serial
need to be updated). YT model shows the relative relationships between vertical voltage and
horizontal time; if XY mode, horizontal axis shows as Ch1 and vertical axis shows as Ch2.
1) The following functions are invalid in XY display:

85
Set display menu
Reference& math waveform
Cursor
Trigger control
Auto (Waveform display mode switch to YT mode automatically)
2) Following the steps to choose time base:
Press to enter display menu;
Press and to select time base as XY, waveform is shown in picture 3-32.

86
Set display menu
Picture 3-32 XY timescale
3.12.5 Adjusting refresh rate
High refresh rate of the oscilloscope will provide more signal character, and can greatly
increase the probability of the oscilloscope to capture instantaneous abnormality, such as
jitter, stunt pulse, low frequency disturbance and instantaneous error.
Please follow the steps for setting refresh rate

87
Set display menu
Press then and to adjust the refresh rate, high refresh, and normal refresh
which are shown in picture 3-33.
High refresh rate Normal refresh rate
Picture 3-33 Refresh rate
3.13 Set trigger menu
Press and to enter the trigger type choice menu, there are five kinds of

88
Set trigger menu
trigger types available
1. Edge trigger: When the edge trigger signal reaches a certain given trigger level,
then trigger happens.
2. Pulse width trigger: When signal of the pulse width reaches a certain given
trigger condition and the signal voltage reaches the given trigger level, then
trigger happens.
3. Logic trigger: When two channel levels meet a certain logic operation result,
then trigger happens.
4. Video trigger: Trigger for PAL, NTSC, SECAM, 720P, 1080I, 1080P
5. Serial bus trigger: Serial decode and trigger for UART(RS232/RS422/RS485)
/SPI/I2C/CAN/LIN.
Trigger level: Trigger level is the signal’s voltage value which trigger event occurs, shown as
. press or roll the wheel to adjust trigger level, the screen will temporarily display
a horizontal line to show the level position. See the trigger level at picture3-34(arrow shows
the trigger level is horizontal line).
 Loading...