

Page 1
Graphing Calculator
EL-9900
Handbook Vol. 2
Programmes
For Advanced Levels For Basic Levels
Page 2

Contents
1. Heron's Formula 1
2. Calculating Tension 2
3. Involute (Inverse Involute) 4
4. Calculating Illuminance and Luminous Intensity 6
5. Calculating Simple Harmonic Oscillation 8
6. Electric Power Consumed on an AC Circuit 10
7. Angle of Vector 12
8. Linear Transformation 14
9. Moving Average 16
10. Creating a Graph of Experimental Data 18
○○○○○○○○○○○○○○○○○○○○○○○○○○○○○○○○○○○○○○○○○○○
○○○○○○○○○○○○○○○○○○○○○○○○○○○○○○○○○○○○○○○○○○
○○○○○○○○○○○○○○○○○○○○○○○○○○○○○○○○○○○○○
○○○○○○○○○○○○○○○○○○○○○○○
○○○○○○○○○○○○○○○○○○○○○○○○○○○○
○○○○○○○○○○○○○○○○○○○○○○○○○○
○○○○○○○○○○○○○○○○○○○○○○○○○○○○○○○○○○○○○○○○○○○○
○○○○○○○○○○○○○○○○○○○○○○○○○○○○○○○○○○○○○○○
○○○○○○○○○○○○○○○○○○○○○○○○○○○○○○○○○○○○○○○○○○○○
○○○○○○○○○○○○○○○○○○○○○○○○○○○
11. Ordinary Differ ential Equations 20
12. Analysing with One-way Layout Method 22
13. Calculating Parabolic Motion 25
○○○○○○○○○○○○○○○○○○○○○○○○○○○○○○○○
○○○○○○○○○○○○○○○○○○○○○○○○○○○
○○○○○○○○○○○○○○○○○○○○○○○○○○○○○○○○○○
Page 3
Read this first
This handbook was produced for practical application of the SHARP EL-9900 Graphing Calculator. This
calculator includes a highly convenient programming function, which enables automatic processing of
both simple and complex calculations any number of times.
1. Entering and Editing a Programme (Advanced keyboard mode only):
Programmes can be entered and edited either by pressing the calculator keys or by downloading from a PC.
To download programmes from a PC, you will need the CE-LK2 PC link software (sold separately).
In this handbook, we use the symbol “
division. Please follow this convention when entering and editing programmes via the PC-Link software.
When entering programmes directly through the EL-9900’s keypad, meanwhile, please use the
keys.
÷
” to represent multiplication, and the symbol “/” to represent
*
X
and
A. Using calculator keys
●
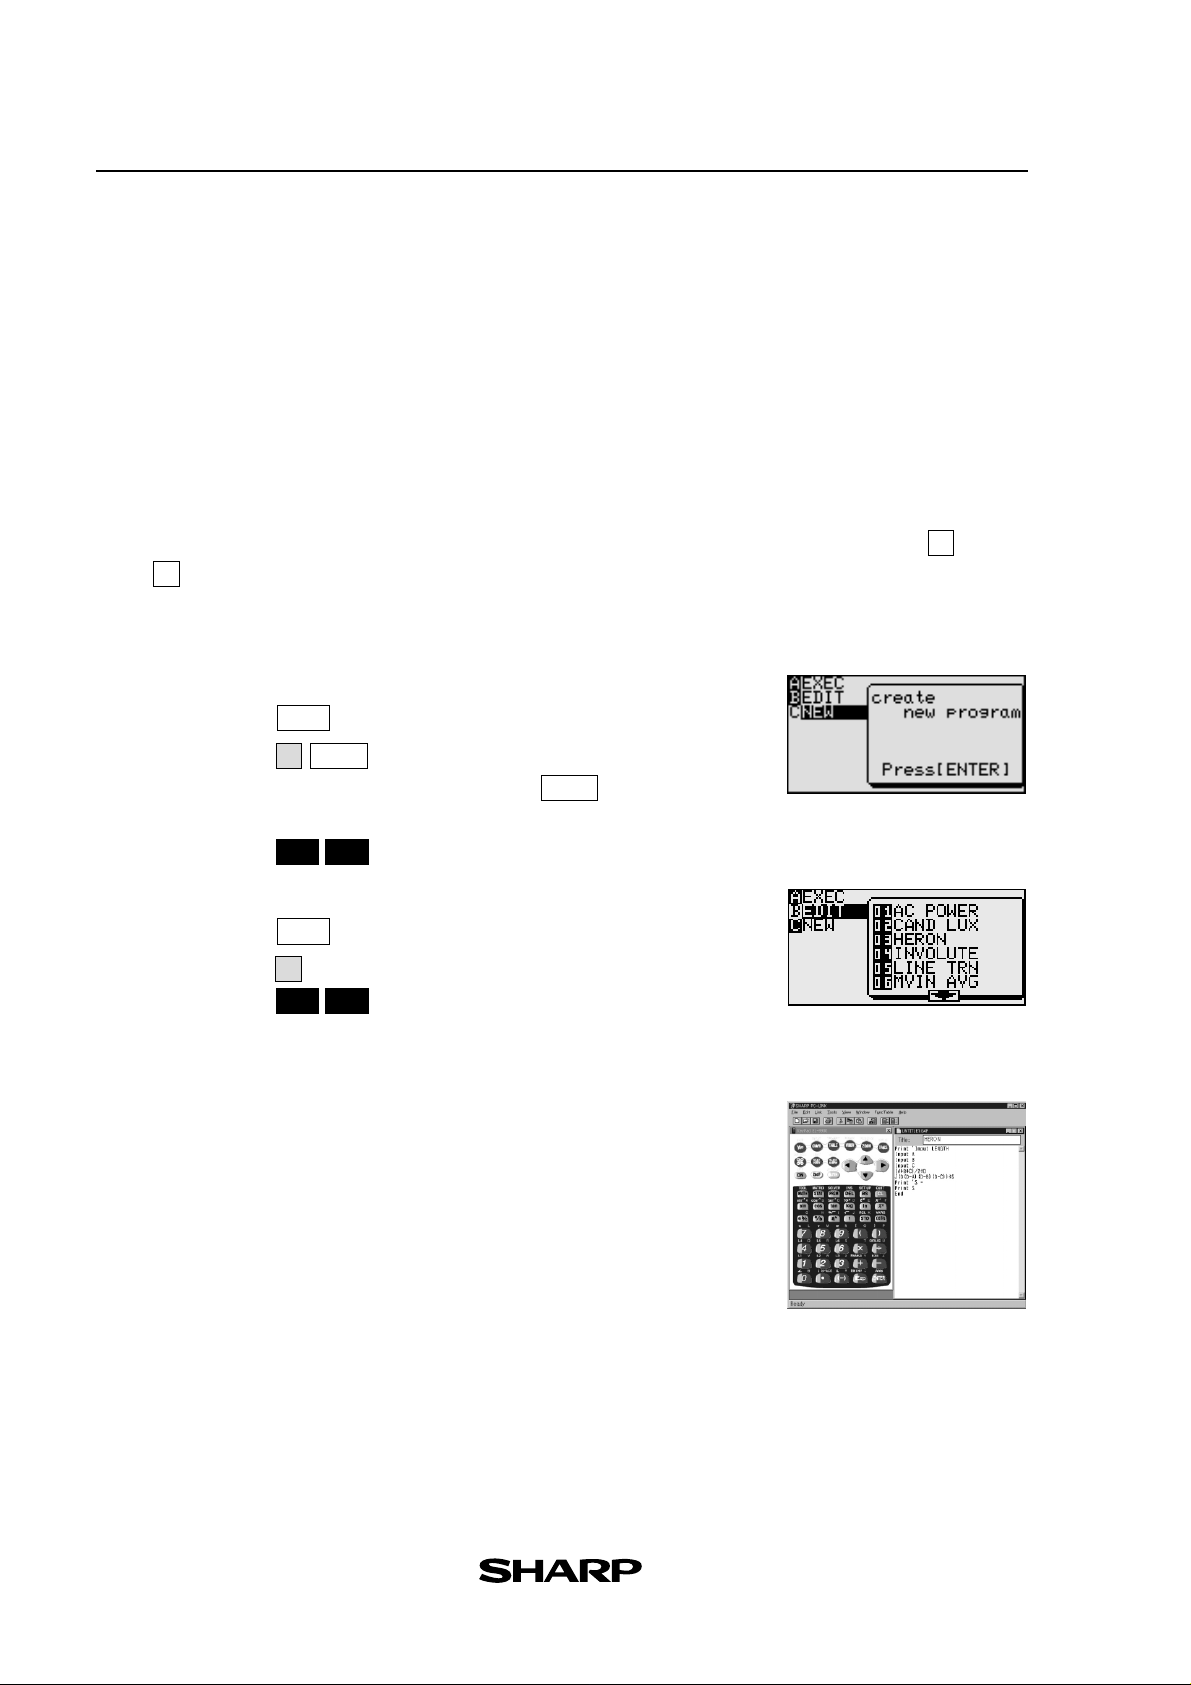
Creating a new programme:
1. Press
2. Press
3. Enter the programme title, then press
to display the programme menu.
PRGM
to select the new programme menu. (See right)
ENTER
C
.
ENTER
4. Enter the programme.
5. Press
●
Editing a programme:
1. Press
2. Press and choose the number of the programme you wish to edit.
3. Press
to finish programming.
2nd F
QUIT
to display the programme menu.
PRGM
B
to finish editing.
2nd F QUIT
(See right)
B. Downloading from PC
●
Creating a new programme:
1. Using the CE-LK2, select New from the File menu.
2. Enter a programme name in Title:.
3. Enter a programme. (For details on entering a programme, refer to
the operation manual.) (See right)
●
Programmes can also be downloaded from Sharp’s website at
http://sharp-world.com/products/calculator/education/program/index.html
instead of creating a new programme.
Page 4
●
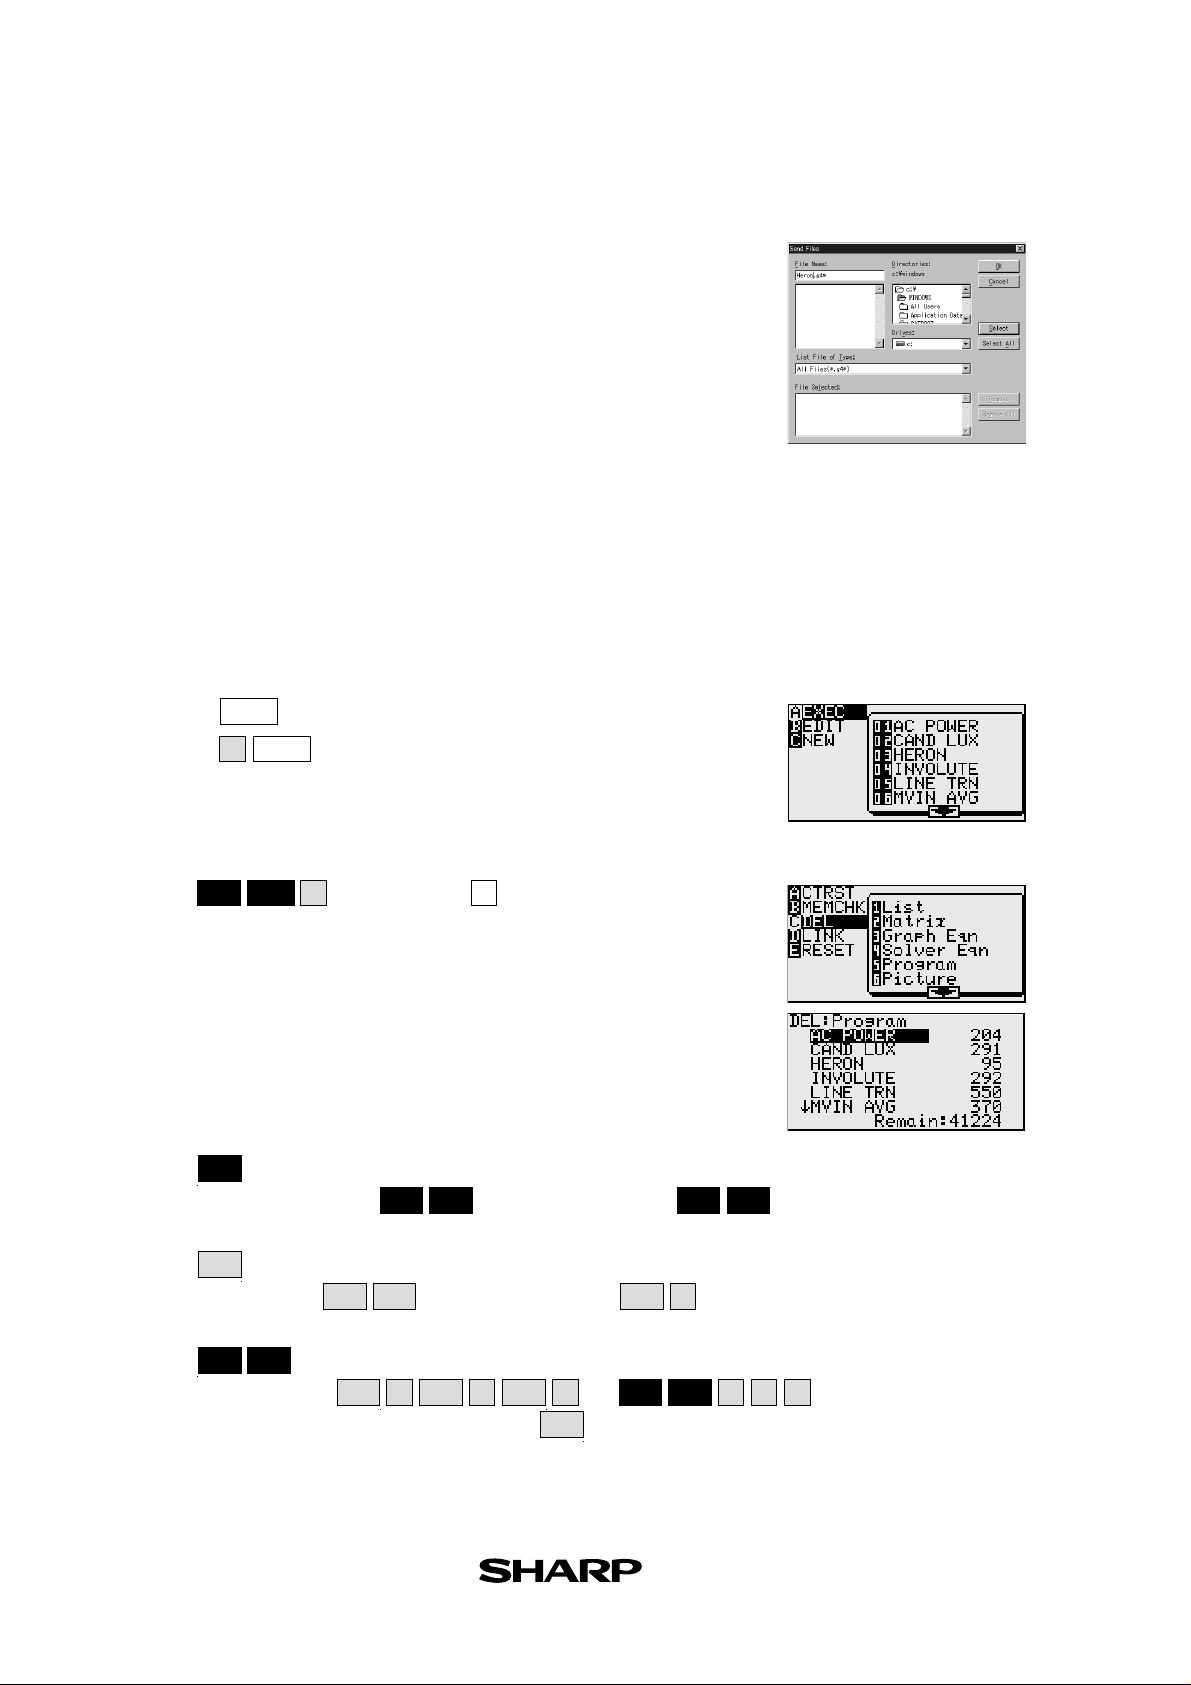
Sending programmes from a PC:
1. Using the CE-LK2, select the Communication Port from
the Link menu and click on the port to be used.
2. Turn off the EL-9900 and connect it to the PC.
3. Turn on the EL-9900
4. Select Send… from the Link menu of the CE-LK2
5. Specify the kind of drive, folder, and file, then select the file
to be sent from the file list, and click on the Select button.
6. Click on the OK button.
Note : For further details refer to the manual.
2. Executing a programme:
(See right)
1. Press to display the execute menu.
2. Press and choose the number of the programme you wish to
PRGM
A
ENTER
execute.
3. Follow the instructions.
3. Deleting a programme:
Press and then choose to select the programme to
2nd F
OPTION
C
5
be deleted.
Note: Do not try to erase a programme by resetting all memories to the initial condition as
programme data to be stored will also be deleted. Also, it is advised to use the CELK2 PC link software to back up any programmes not to be erased.
4. Using the keys:
Press to use secondary functions (in yellow).
2nd F
To select “
Press to use the alphabet keys (in violet).
ALPHA
To select F:
-1
x
”: ➔ Displayed as follows:
➔ Displayed as follows:
ALPHA
2nd F
F
2
x
-1
x
2
x
ALPHA
(See right)
-1
x
2nd F
F
Press to continue input of violet letters.
2nd F
A-LOCK
To input ABC:
(To return to the normal function, press again.)
or
ALPHA
ALPHA ALPHA
A
B
C
ALPHA
2nd F
A-LOCK
ABC
Page 5

5. Troubleshooting:
Following is a list of error codes and error messages.
When errors occur, refer to pages 233 and 234 of the manual.
Error
code
Error message
01 Syntax Syntax error found in equation/programme.
02 Calculate Calculation-related error found (division by 0, calculation beyond range, etc.).
03 Nesting Cannot nest more than 14 numerical values, or 32 functions during execution.
04 Invalid Matrix definition error or entering an invalid value.
05 Dimension Matrix dimension, or STAT list dimension, inconsistent.
07 Invalid DIM Size of list/matrix exceeds calculation range.
08 Argument Inconsistency found in argument of the structured function.
09 Data Type Invalid data type used in calculation.
10 No Sign Change Financial calculation error found.
11 No define Undefined list/matrix used in calculation.
12 Domain Argument definition outside of domain.
13 Increment Increment error found.
16 Irr Calc More than two inflection points for Irr calculation.
17 Stat Med Med-Med law (statistic) error found.
20 No Argument Argument missing.
21 Not pair ∫ dx ∫ and dx are not used in a pair.
22 Not pair [ ] Brackets are not used in a pair.
23 Not pair ( ) Parentheses are not used in a pair.
24 Not pair { } Braces are not used in a pair.
25 Line over Line is over the capacity.
26 Not delete Unable to delete a selected item.
27 Buffer over Input/equation exceeds buffer capability.
30 Edit type Invalid editor type found.*
31 Continue = “ = ” exists in equation that has been recalled (RCL).
32 No data Data does not exist.
33 Graph Type Graph type setting incorrect.
34 Too many var. Too many variables assigned in the SOLVER.
35 No variable No variable specified in the SOLVER.
36 No solution No solution found.
37 No title No title entered.
38 Too many obj More than 30 objects selected.
Error content
Page 6

Error
code
Error message
40 Lbl duplicate Labels with identical name found in programme.
41 Lbl undefined Goto/Gosub encountered with no defined label.
42 Lbl over More than 50 labels found in programme.
43 Gosub stack Nesting of more than 10 subroutines found.
44 Line too long Line contains more than 160 characters.
45 Can’t return Return used without jumping from subroutine.
46 Storage full Cannot create more than 99 files.
47 Coord type Invalid coordinate system for command.
48 Without For For is missing corresponding to the Next command.
49 Without WEnd WEnd is missing corresponding to the While command.
50 Without While While is missing corresponding to the WEnd command.
51 Without Then Then is missing corresponding to the If command.
52 Without EndIf EndIf is missing corresponding to the If command.
53 Without If If is missing corresponding to the EndIf command.
70 I/O device Communication error found among devices.
71 Wrong Mode Wrong communication mode set.
90 Memory over Memory is full; cannot store data as requested.
99 System error System error found; user memory space is insecure.
Low battery Operation interr upted due to low batter y power.
BREAK!! Operation break specified.
Error content
* The following operations may cause Editor type error. Correct the Editor type to continue.
•Recall the SOLVER equations (EQTN) or Graph data (G_DATA) stored in a different EDITOR mode
than currently in use.
•Receive the Graph equation (Y1 and others) entered in a different EDITOR mode than currently in use.
Page 7
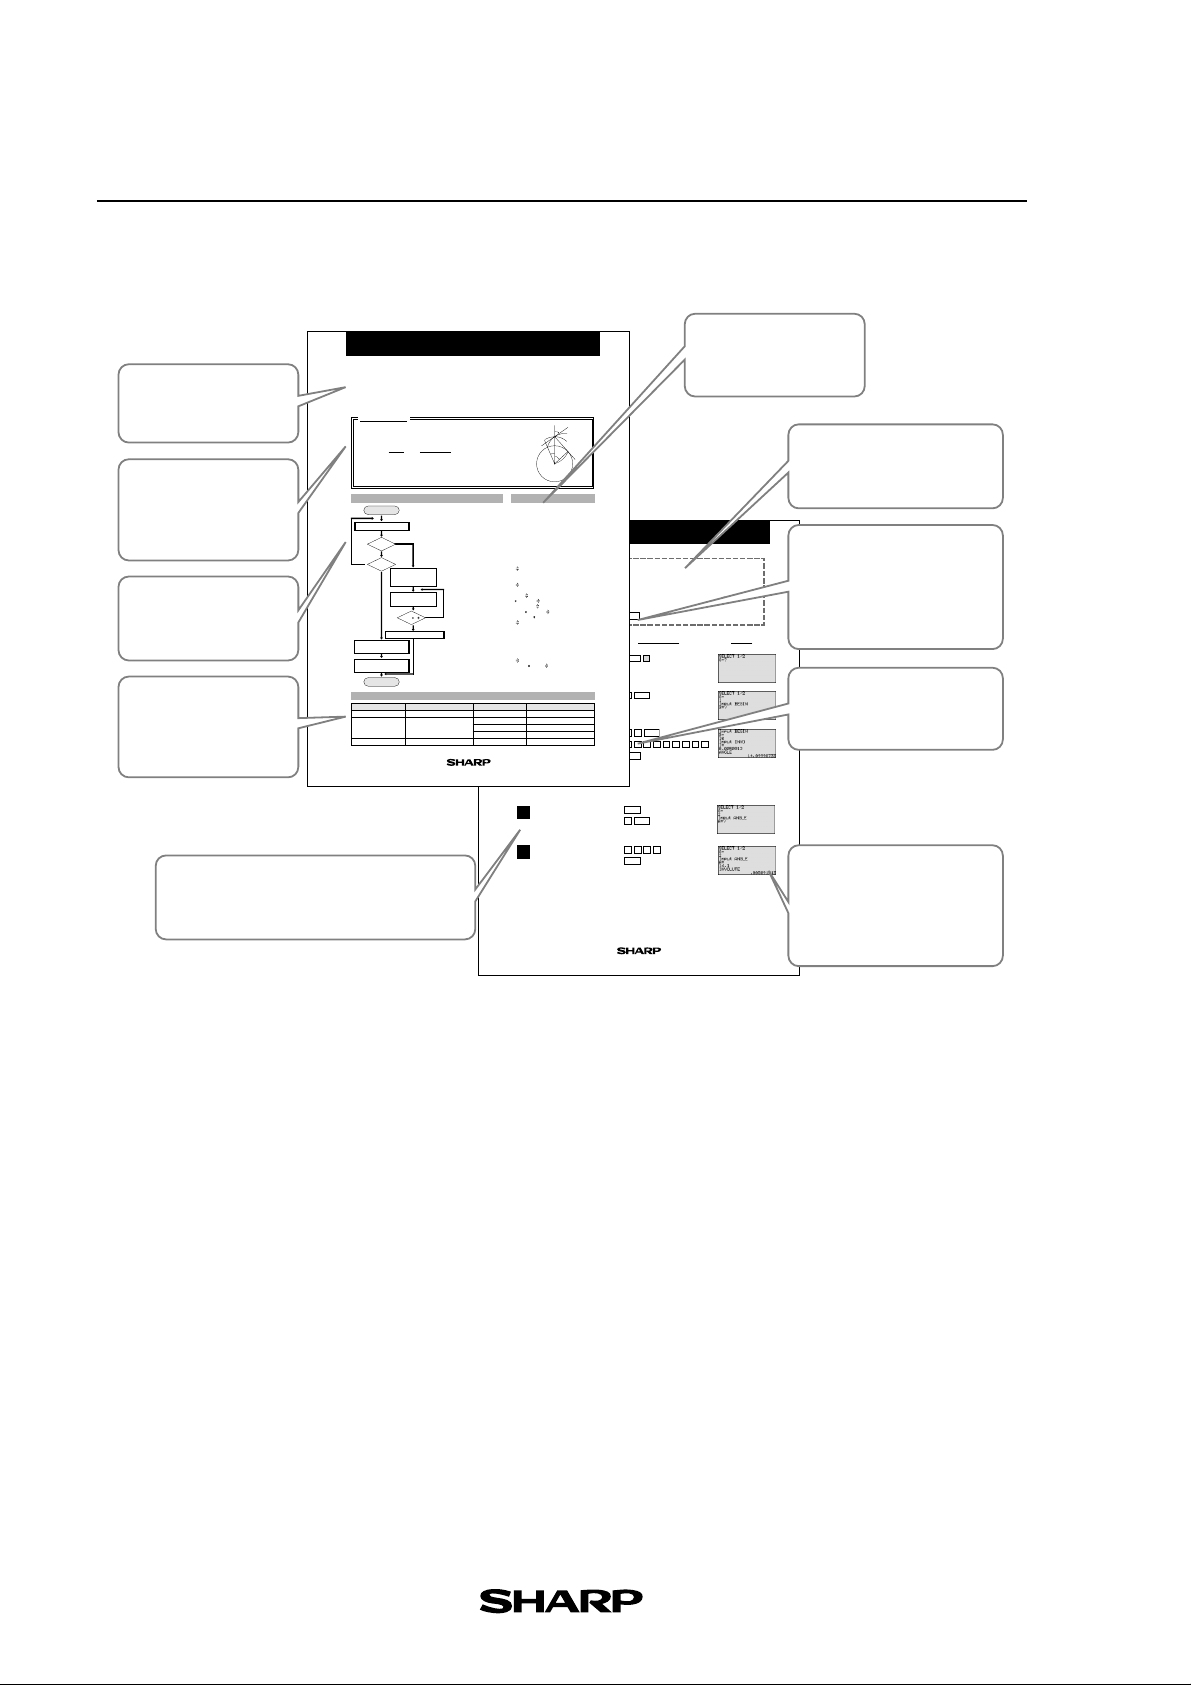
6. Page Layout
Introduction
Brief explanation and
purpose of the section
Calculation
The formula to be used
in calculation and
definition of terms
Flowchart
Summary of steps from
start to end
Parameters
Definition of the
parameters used in the
programme
Involute
Use the involute function for calculating gears etc. to find the angle of obliquity
from the initial value and involute value.
Calculation
Involute function : inv θ = tan θ - θ[rad]
Use Newton's method to find the inverse involute:
θ
f (θ) = a - inv
Selection of type
N
INVO
Calculation of involute
Name of parameter
D, R, T, J
S
Z
4
f'(θ)
i +1 = θi -= θi -
f(θi)
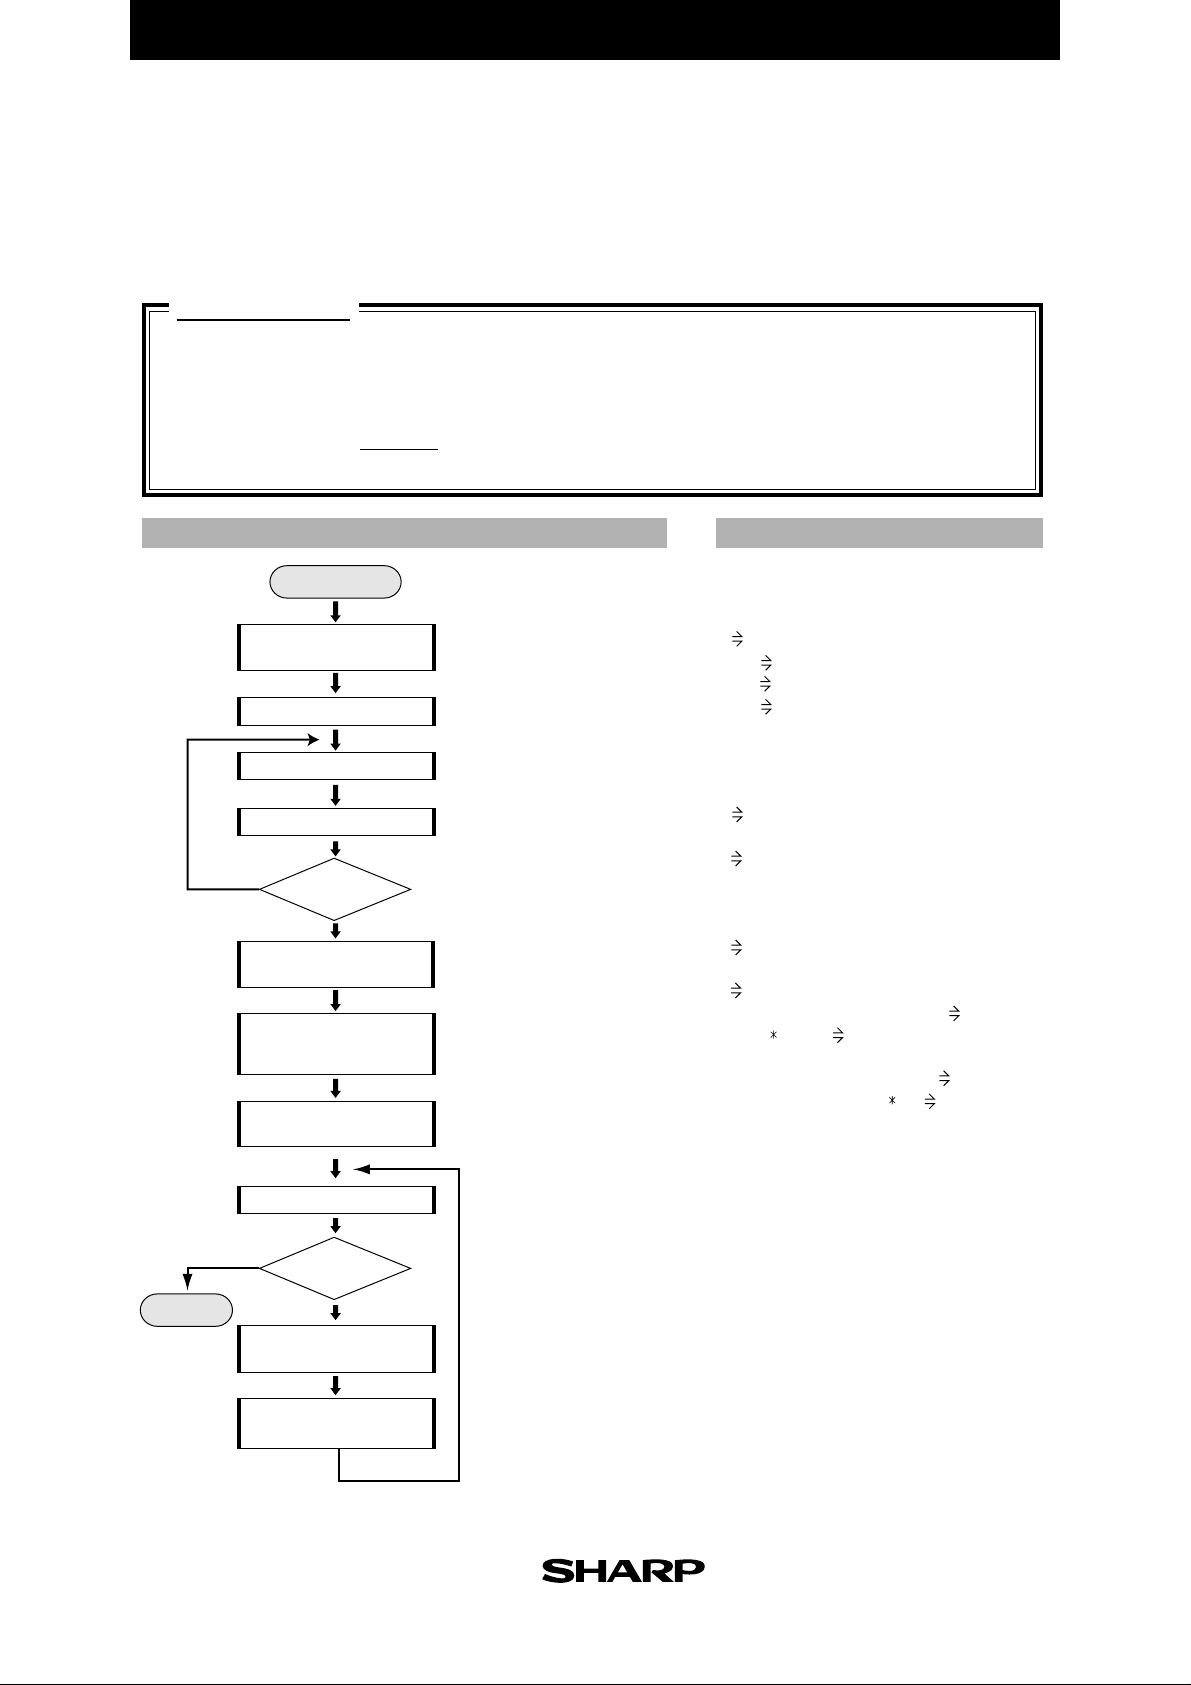
θ
Start
S = 1
N
S = 2
Entry of initial
Y
involute value
CALPRESS
Calculation of
angle of obliquity
Display of angle of obliquity
Entry of angle
of obliquity
value (display)
End
(Inverse Involute)
tanθ
i - θi -a
tan2 θ
SP : involute curve
S : involute starting point
θ : angle of obliquity of point P
FLOWCHART
start
Y
ANGLE
value and
Y
8
int(10
D) 0
N
Content
working variable for calculating
selecting calculation type
(S=1: involute calculation)
(S=2: inverse involute calculation)
initial value, angle of obliquity
Step
A step-by-step guide to solving the problems
and an explanation of the display
i
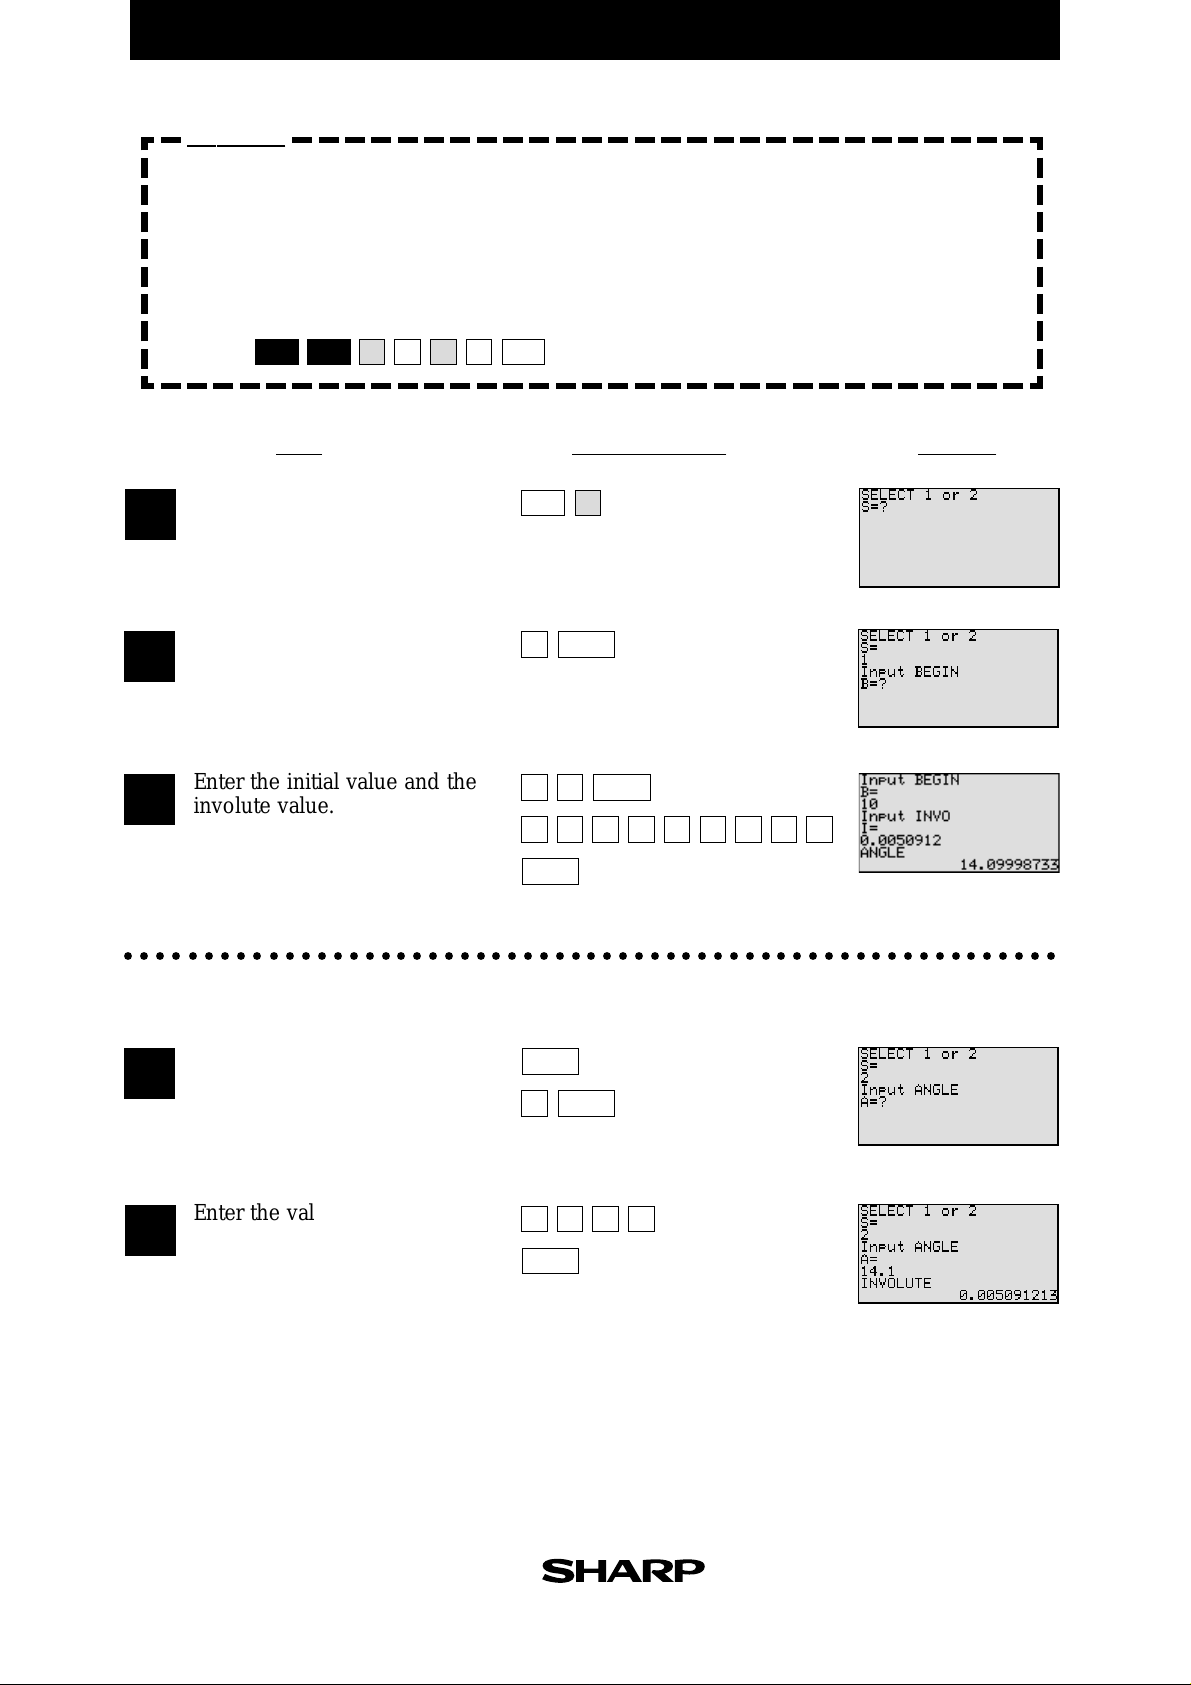
Enter 1 or 2.
To calculation of involute.
To inverse involute calculation
Returns to START if entry
neither 1 nor 2.
Calculation of involute.
Enter initial value and
involute value.
Angle of obliquity
calculated.
Judgment on repetition
of calculation of angle
of obliquity.
Calculation of inverse
involute. Enter angle
of obliquity.
Involute value calculated.
Involute value displayed.
PARAMETERS
Name of parameter
θ
I
A
B
EL-9900 Graphing Calculator
θ
P
q
S
a
θ
Rg
0
PROGRAMME LIST
(REAL MODE)
Title : INVOLUTE
Label START
ClrT
Print "SELECT 1/2
Input S
If S=1 Goto ANGLE
If S=2 Goto INVO
Goto START
Label ANGLE
Exercise
Print "Input BEGIN
Input B
B Z
(1) Find the angle of obliquity when the involute value is 0.0050912 and the initial
Print "Input INVO
value is 10.
Input I
I J
(2) Find the involute value when the angle of obliquity is 14.1.
Label CALPRESS
tan Z T
Set up condition: angle unit in Deg Mode and decimal point in
π Z/180.0 R
2
Float Pt Mode.
(T-R-J)/T
D
180.0 (R-D)/π Z
SET UP
10
8 D)≠0 Goto CALPRESS
If int (
Z A
Print "ANGLE
Print A
End
Label INVO
Print "Input ANGLE
Input A
Specify the program mode.
A θ
1
Select the title INVOLUTE.
tanθ -π θ/180 I
Print "INVOLUTE
Print I
End
Select involute calculation.
2
Content
angle of obliquity
involute value
input and output of angle
Enter the initial value and the
input of initial value
3
involute value.
(Display of angle of obliquity)
Select inverse involute
4
calculation.
Enter the value of the angel
5
of obliquity.
(Display of involute value)
2nd F
1C
1B
CL
PRGM
A
ENTER
1
ENTER
01
0005091•
ENTER
ENTER
ENTER
2
14 1•
ENTER
EL-9900 Graphing Calculator
Programme List
Procedure of data to
be entered
Exercise
Example of problem to be
solved in the section
Set Up Condition
Important set up condition
before starting the exercise
in order to obtain correct
DisplayStep Key Operation
answers
Key Operation
Illustration of the keys to be
2
operated
Display
Illustration of the calculator
screen as it should appear
if each step is carried out
5
correctly
Page 8
EL-9900 Graphing Calculator
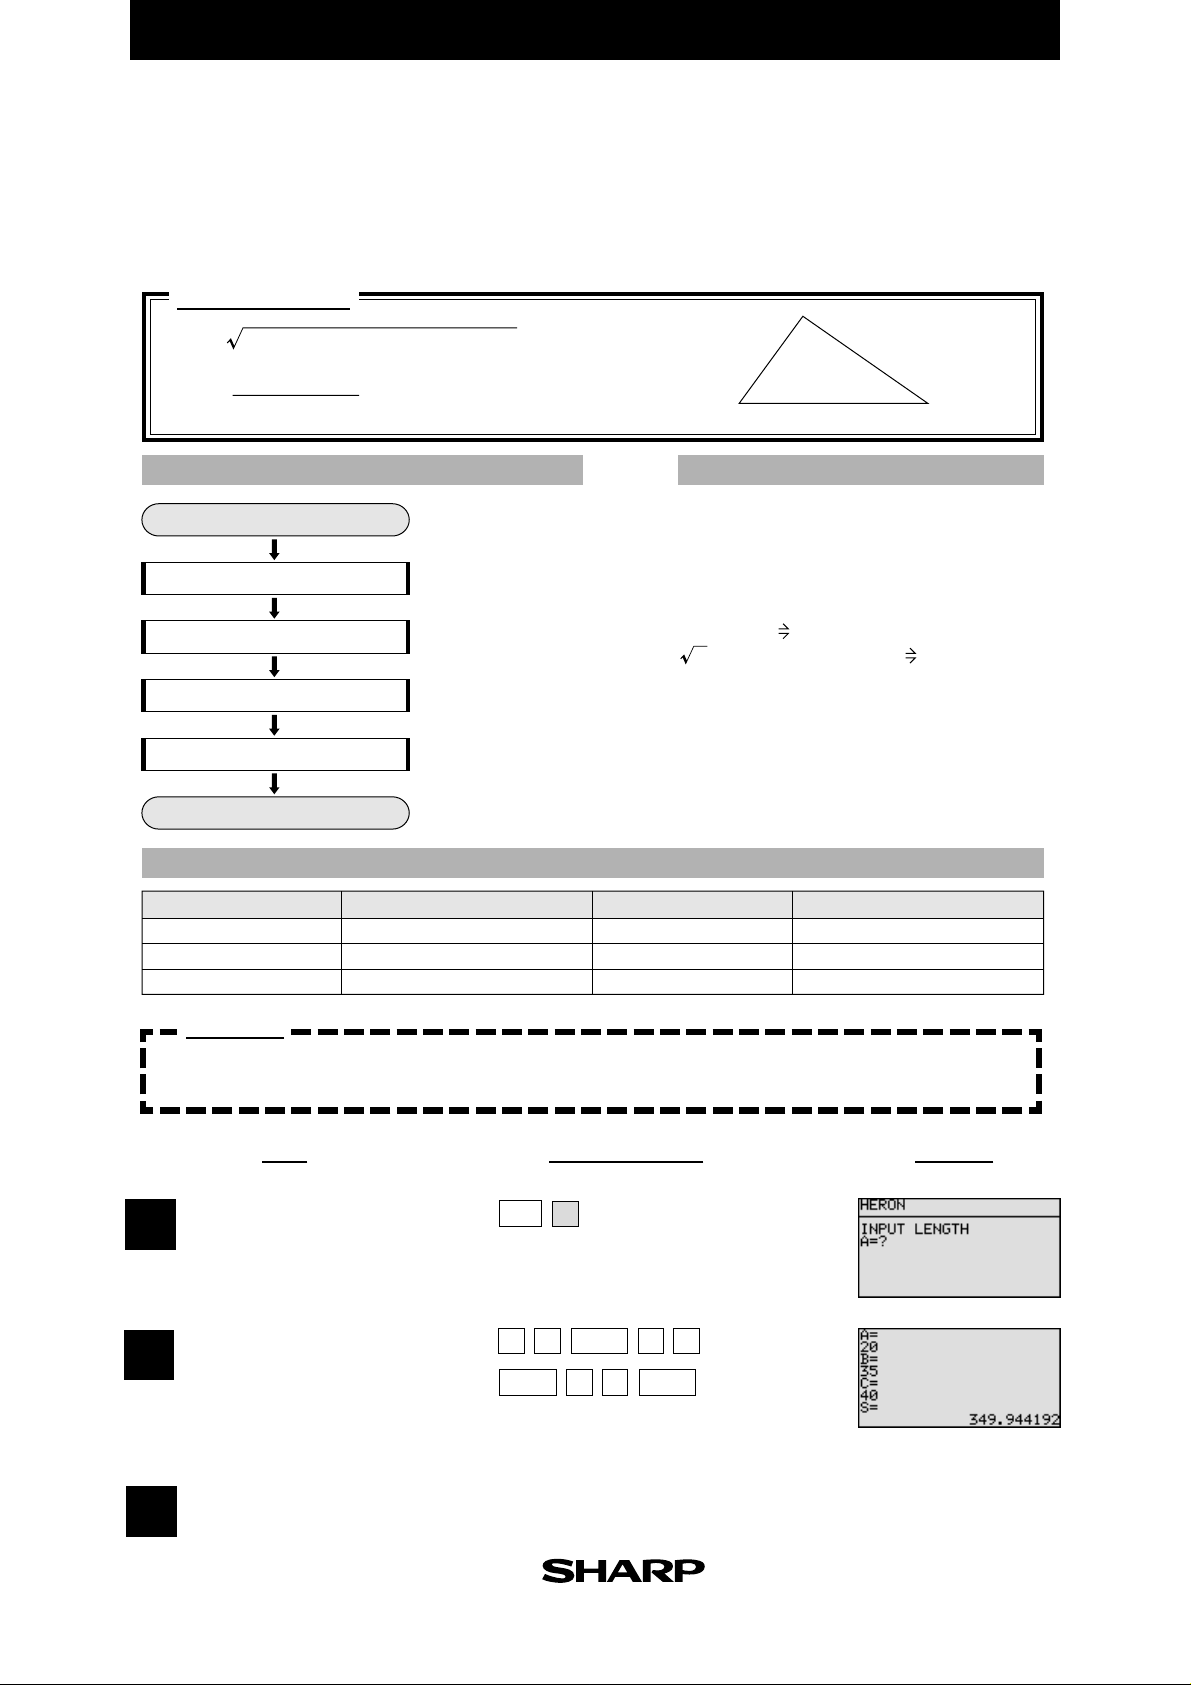
Heron's Formula
Use Heron's formula to find the area of a triangle when the sides (A,B,C) of the
triangle are known.
Calculation
S = D (D - A) (D - B) (D - C)
(A + B + C)
D =
2
FLOWCHART
Start
Entry of sides
Calculation of D
Calculation of area
Display of area
End
Name of parameter
A
B
C
Content
value of side A
value of side B
value of side C
Enter sides A, B and C.
Value of D calculated.
Area S calculated.
Area of triangle
displayed.
PARAMETERS
Name of parameter
D
S
A
C
B
PROGRAMME LIST
Title : HERON
Print "Input LENGTH
Input A
Input B
Input C
(A+B+C)/2 D
(D (D-A) (D-B) (D-C) ) S
Print "S =
Print S
End
Content
value of D
area
(REAL MODE)
Exercise
Find the area of a triangle when sides A, B and C are 20, 35 and 40cm respectively.
Specify the programme
1
mode.
Select the title HERON.
Enter the values A, B and C.
Key OperationStep
PRGM
A
2
ENTER
035
Display
2
(Display of area)
The area is approximately
3
350cm
2
.
ENTER ENTER
40
1
Page 9
EL-9900 Graphing Calculator
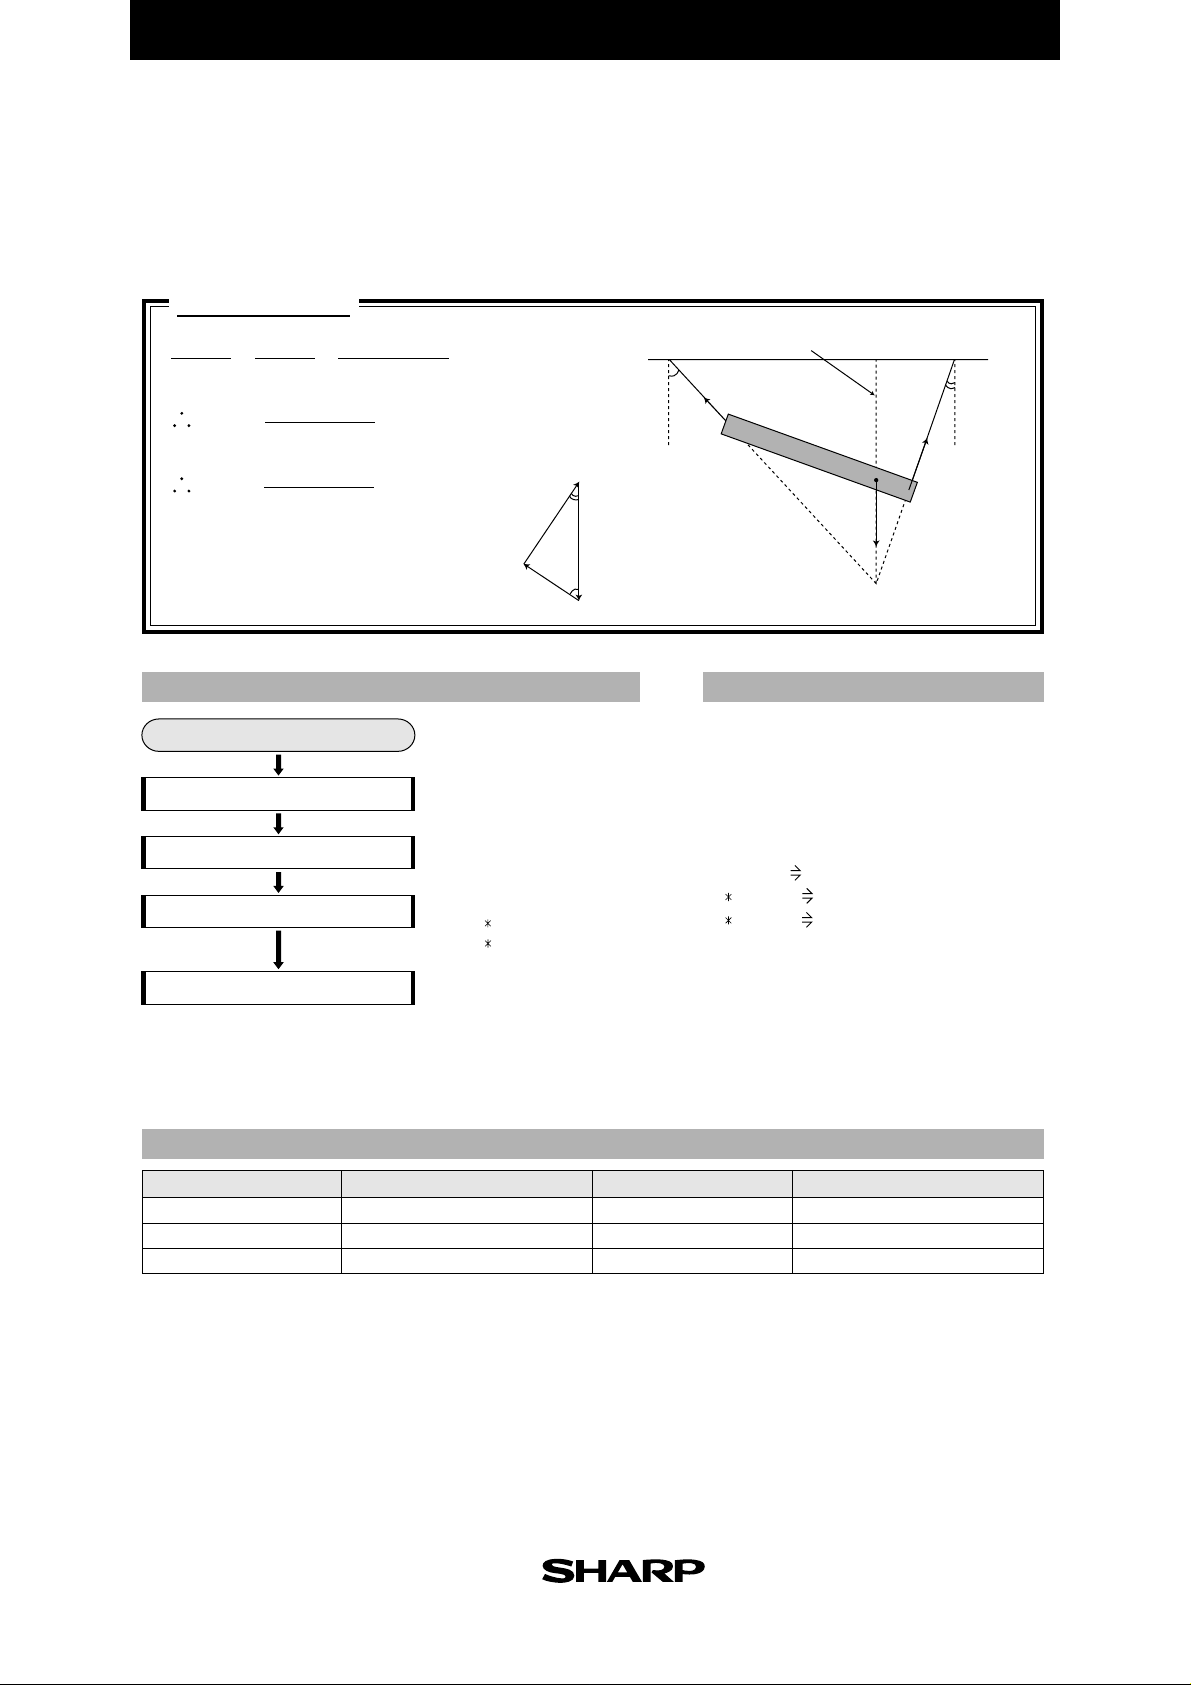
Calculating Tension
Use the law of sines to find the tension when a pole of weight W is suspended with
two strings, and the strings are balanced with the angles from the vertical line A and B.
Calculation
T
vertical line
W
B
S
G
T
sin B
T = W
S = W
T, S : tension W : weight
A, B : angles (6 sexagesimal numbers)
=
sin A
sin (A+B)
sin (A+B)
S
sin B
sin A
=
sin (A+B)
W
A
B
S
W
A
T
FLOWCHART
Start
Entry
Calculation of denominator
Calculation of tensions
Display of tensions
Name of parameter
A
B
C
Content
angle A
angle B
sin(A+B)
Enter angles and weight
A, B and W.
Denominator in law of sines
calculated. C= sin (A + B)
Tensions T and S calculated.
T = W sin B/C
T = W sin A/C
Tensions T and S displayed.
PARAMETERS
Name of parameter
S
T
W
PROGRAMME LIST
Title : TENSION
Print "Input ANGLE
Input A
Input B
Print "Input WEIGHT
Input W
sin (A+B) C
W sin B/C T
W sin A/C S
Print "TENSION
Print "T=
Print T
Print "S=
Print S
End
Content
tension S
tension T
weight
(REAL MODE)
2
Page 10
EL-9900 Graphing Calculator
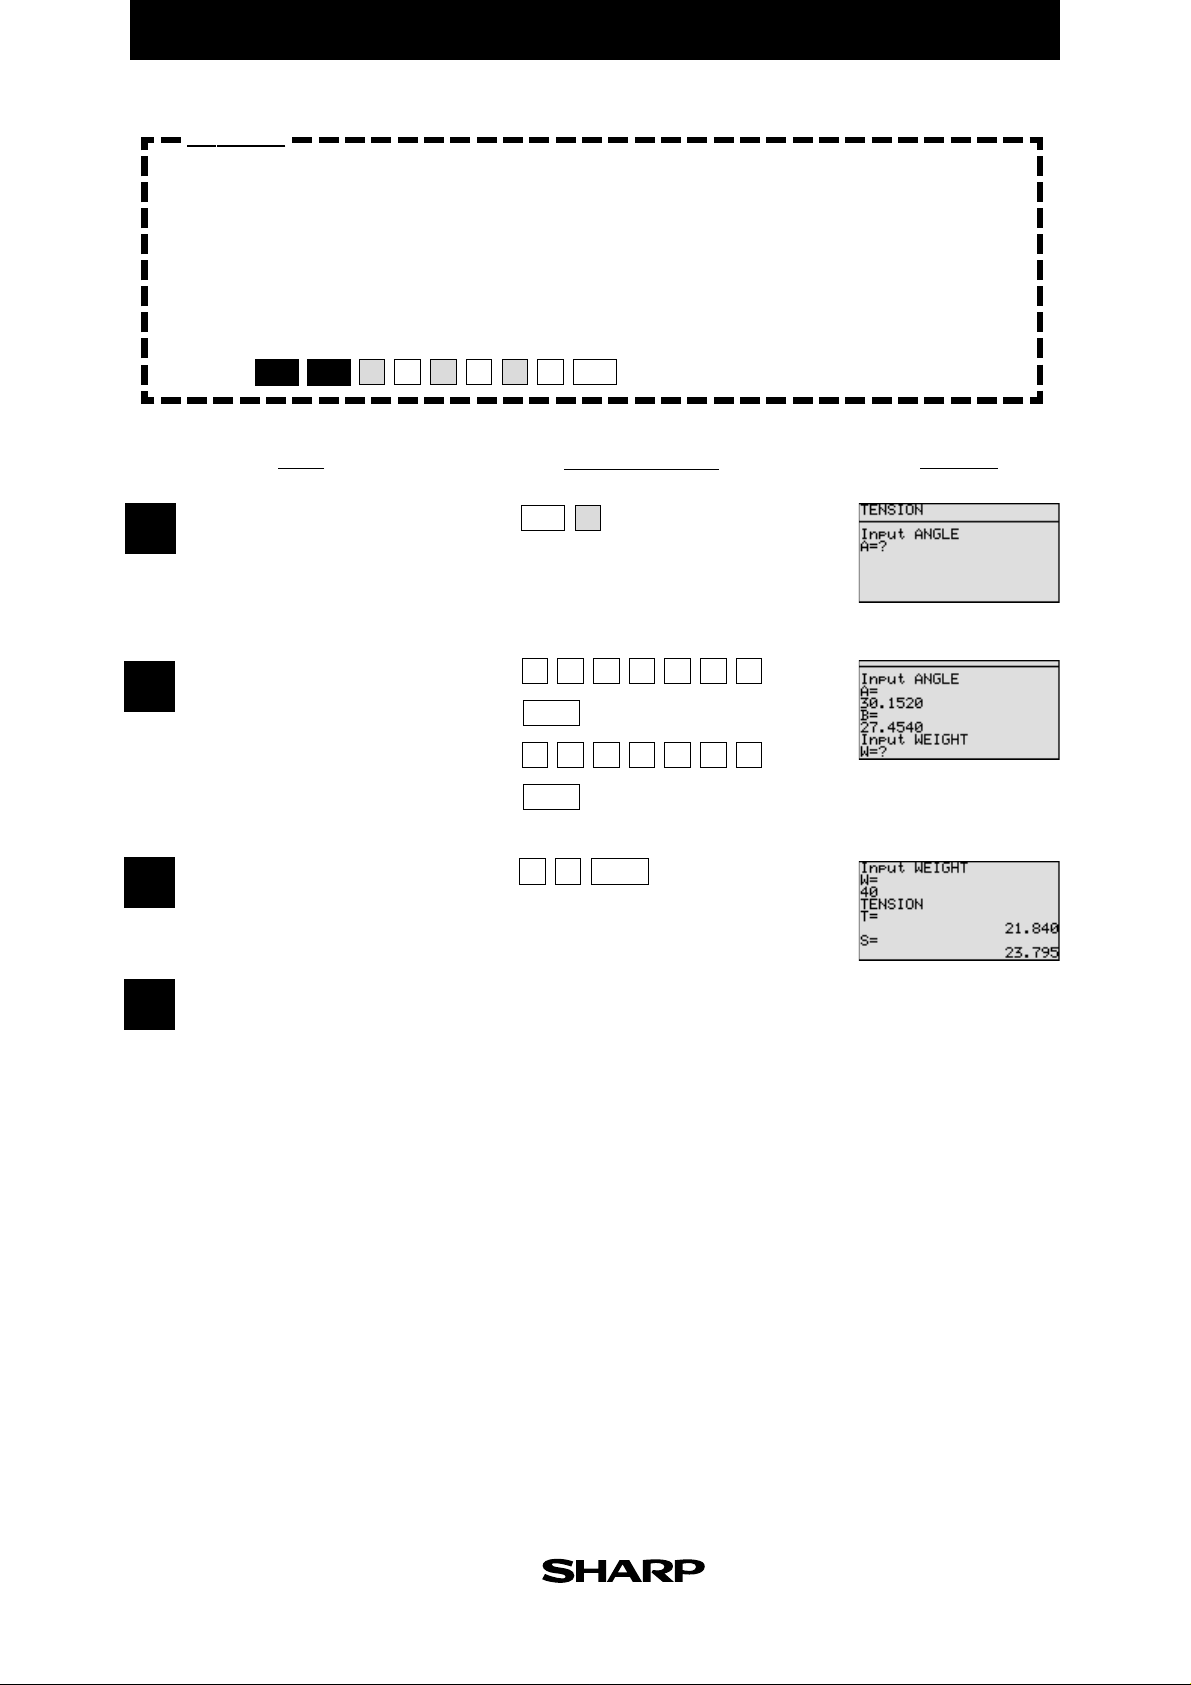
Exercise
Calculate the tension assuming weight=40kg, angle A=30˚ 15' 20", and angle
B=27˚ 45' 40". Enter the angles with sexagesimal numbers.
Set up condition: decimal point digit number in TAB 3 Mode, decimal
point in Fix Mode, and angle unit in Deg Mode.
2nd F
SET UP
3D
Specify the programme mode.
1
Select the title TENSION.
Enter the values of angles
2
A and B.
Enter the value of weight.
3
CL2C
1B
Key Operation
PRGM
A
3
ENTER
2
ENTER
4
•
0152
7
0
•
ENTER
4
54
DisplayStep
0
0
Tension T is 21.840kg and
4
S is 23.795kg.
3
Page 11
EL-9900 Graphing Calculator
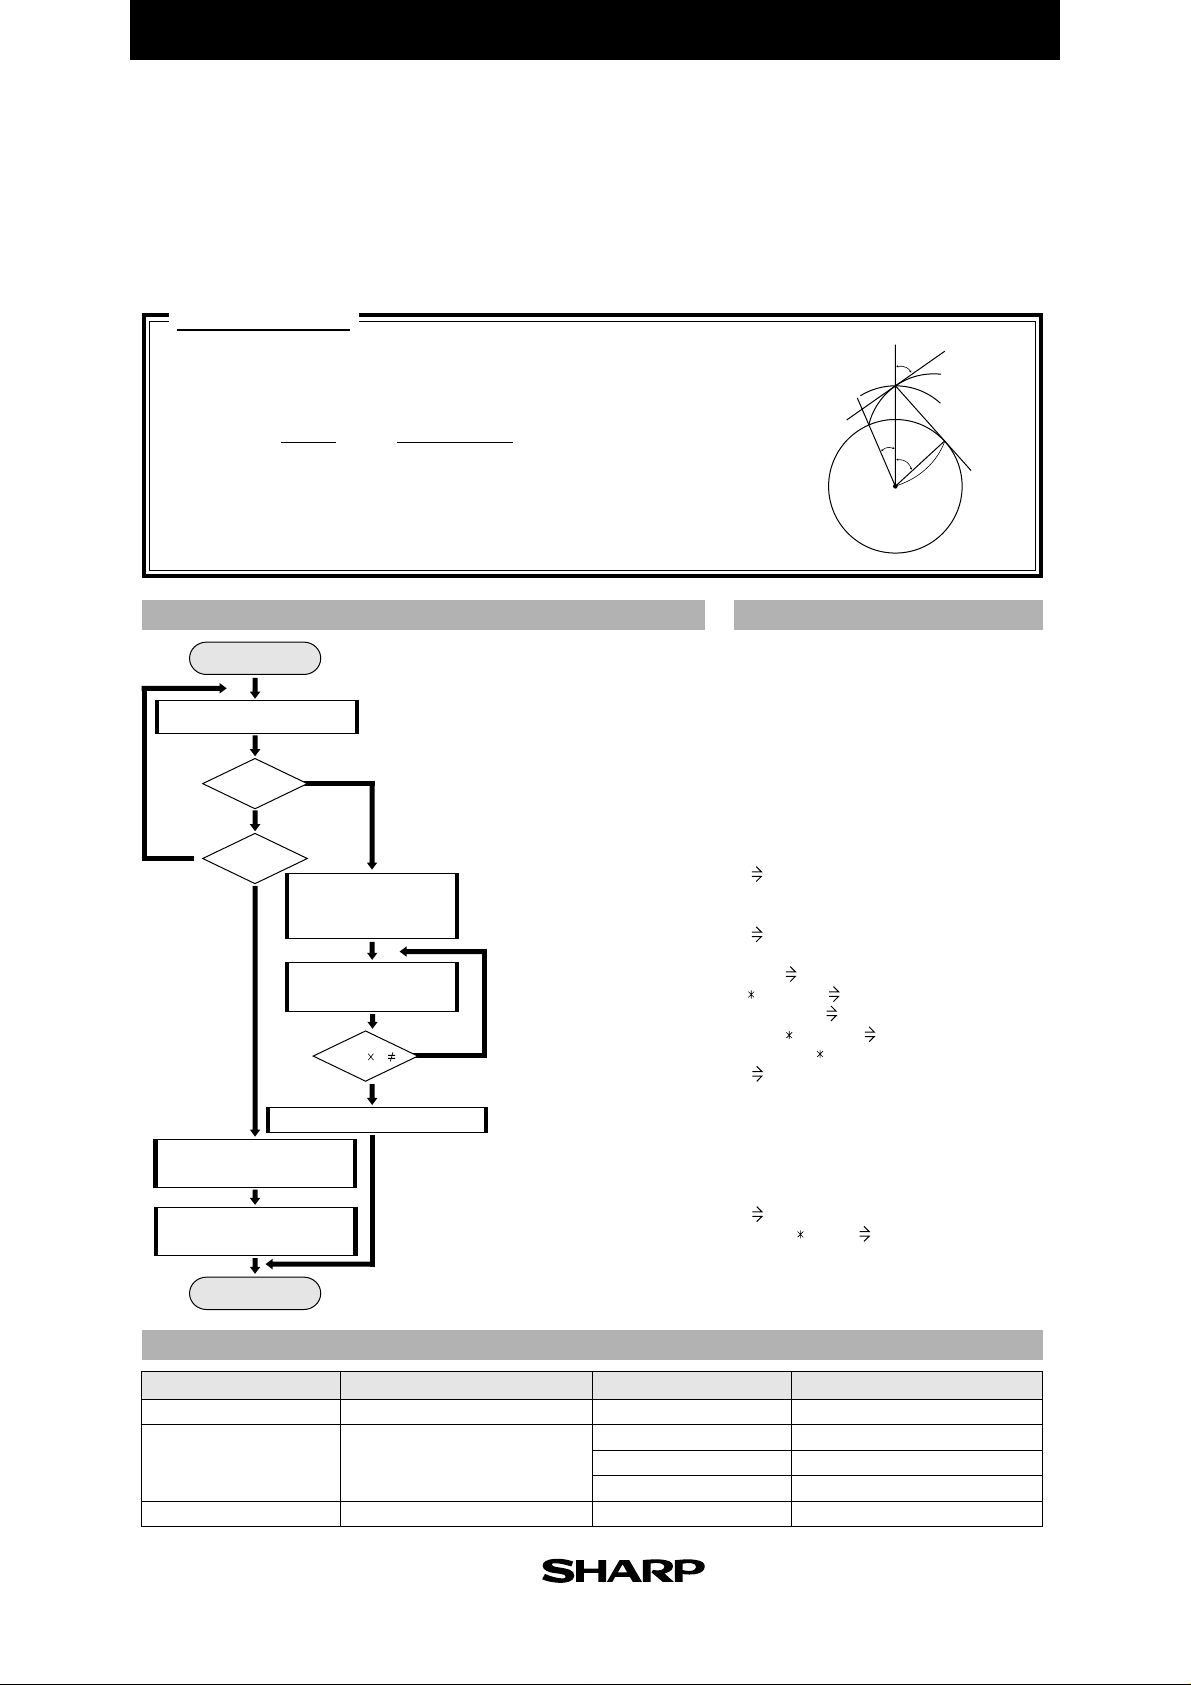
Involute(Inverse Involute)
Use the involute function for calculating gears etc. to find the angle of obliquity
from the initial value and involute value.
Conversely, calculate the involute value from the angle of obliquity.
Calculation
Involute function : inv θ = tan θ - θ[rad]
Use Newton's method to find the inverse involute:
θ
i +1
= θi -=
f'(θ)
f(θi)
f (θ) = a - inv
Start
Selection of type
S = 1
N
S = 2
Y
INVO
Entry of angle
of obliquity
Calculation of involute
value (display)
θ
N
CALPRESS
angle of obliquity
Display of angle of obliquity
End
FLOWCHART
start
Y
Entry of initial
value and
involute value
Calculation of
int(10
tanθ
i
θi
-
- θi -a
tan2 θ
i
SP: involute curve
S : involute starting point
θ : angle of obliquity of point P
Enter 1 or 2.
To calculation of involute.
To inverse involute calculation
Returns to START if entry
neither 1 nor 2.
Calculation of involute.
Enter initial value and
involute value.
Angle of obliquity
calculated.
Judgment on repetition
of calculation of angle
of obliquity.
Calculation of inverse
involute. Enter angle
of obliquity.
Involute value calculated.
Involute value displayed.
8
D) 0
N
ANGLE
Y
θ
P
S
a
PROGRAMME LIST
q
θ
Rg
0
(REAL MODE)
Title : INVOLUTE
Label START
ClrT
Print "SELECT 1 or 2
Input S
If S=1 Goto ANGLE
If S=2 Goto INVO
Goto START
Label ANGLE
Print "Input BEGIN
Input B
B Z
Print "Input INVO
Input I
I J
Label CALPRESS
tan Z T
π Z/180.0 R
(T-R-J)/T
2
D
180.0 (R-D)/π Z
If int (10ˆ8 D)≠0 Goto CALPRESS
Z A
Print "ANGLE
Print A
End
Label INVO
Print "Input ANGLE
Input A
A θ
tanθ -π θ/180 I
Print "INVOLUTE
Print I
End
Name of parameter
D, R, T, J
S
Z
4
PARAMETERS
Content
working variable for calculating
selecting calculation type
(S=1: involute calculation)
(S=2: inverse involute calculation)
initial value, angle of obliquity
Name of parameter
θ
I
A
B
Content
angle of obliquity
involute value
input and output of angle
input of initial value
Page 12
EL-9900 Graphing Calculator
Exercise
(1) Find the angle of obliquity when the involute value is 0.0050912 and the initial
value is 10.
(2) Find the involute value when the angle of obliquity is 14.1.
Set up condition: angle unit in Deg Mode and decimal point in
Float Pt Mode.
2nd F
SET UP
1B
CL
1C
motomoto
DisplayStep Key Operation
Specify the programme mode.
1
Select the title INVOLUTE.
Select involute calculation.
2
Enter the initial value and the
3
involute value.
(Display of angle of obliquity)
○○○○○○○○○○○○○○○○○○○○○○○○○○○○○○○○○○○○○○○○○○○○○○○○○○○○○○○○○○○
Select inverse involute
4
calculation.
PRGM
A
ENTER
1
ENTER
01
0
ENTER
ENTER
2
005091•2
ENTER
Enter the value of the angle
5
of obliquity.
(Display of involute value)
14 1
ENTER
•
5
Page 13

EL-9900 Graphing Calculator
Calculating Illuminance and Luminous Intensity
Enter the luminous intensity of the luminous source, the distance, and the angle between
the perpendicular line and light ray, to find the illuminance of the illuminated side.
Conversely, find the luminous intensity of the source from the illuminance of the
illuminated side.
Calculation
2
r
i
cos θ
i =
l cos θ
2
r
l =
l : luminous intensity [candela] i : illuminance [lux]
r : distance [m] θ: angle [˚ ]
FLOWCHART
Start
A
Selection of type
Y
S = 1
S = 2
CANDELA
To subroutine To subroutine
Entry of
illuminance
Calculation of
luminous intensity
Display of
luminous intensity
Subroutine
Entry of distance and angle
Return
start
N
A
Entry of
luminous intensity
Calculation of
illuminance
Display of
illuminance
End
DISTANCE
LUX
Enter 1 or 2.
To calculation of
luminous intensity.
To calculation of
illuminance.
Jumps to subroutine
DISTANCE.
Enter illuminance or
luminous intensity.
Illuminance or luminous
intensity calculated.
Illuminance or luminous
intensity displayed.
Subroutine for entry of
distance and angle.
Entry.
Returns to calling program.
Luminous Intensity l
θ
r
Illuminance i
PROGRAMME LIST(REAL MODE)
Title : CAND LUX
Deg
Label START
ClrT
Print "CANDELA=1 LUX=2
Print "SELECT 1 or 2
Input S
If S=1 Goto CANDELA
If S=2 Goto LUX
Goto START
Label CANDELA
Gosub DISTANCE
Print "Input LUX
Input L
L I
2
R
I/cos θ C
Print "CANDELA
Print C
End
Label LUX
Gosub DISTANCE
Print "Input CANDELA
Input C
C K
K cos θ /R
Print "LUX
Print L
End
Label DISTANCE
Print "Input DISTANCE
Input D
D R
Print "Input ANGLE
Input A
A θ
Return
2
L
Name of parameter
I
K
R
S
6
PARAMETERS
Content
illuminance of illuminated side
luminous intensity of luminous source
distance
selecting calculation type
calculation of luminous intensity
(S=1:
(S=2: calculation of illuminance)
)
Name of parameter
θ
A
L
D
C
Content
angle
input of angle
input and calculating luminous intensity
input of distance
input and calculating illuminance
Page 14

EL-9900 Graphing Calculator
Exercise
(1) Find the luminous intensity of the luminous source of distance 10m, angle 60˚
and illuminance 20 lux.
(2) Find the illuminance of the illuminated side of distance 10m, angle 60˚ and
luminous intensity 4000 candela.
Set up condition: decimal point in Float Pt Mode.
2nd F
SET UP
CL
1C
Specify the programme mode.
1
Select the title CAND LUX.
Select calculation of luminous
2
intensity.
Enter the values of distance,
3
angle, and illuminance.
(Display of luminous intensity)
Key Operation
A
PRGM
ENTER
1
10
2
0
ENTER
ENTER
60
DisplayStep
ENTER
Select calculation of illuminance.
4
Enter the values of distance,
angle, and luminous intensity.
(Display of illuminance)
ENTER ENTER
10
6
4
2
ENTER
ENTER
0
000
ENTER
7
Page 15

EL-9900 Graphing Calculator
Calculating Simple Harmonic Oscillation
Enter period, amplitude and time to calculate displacement at specified time,
acceleration, angular velocity, and velocity. Also, display the changes during the
entered time period on a graph.
Calculation
angular velocity : ω =
acceleration : a = -ω
A : amplitude
t : time [sec]
T : period [sec]
ω : angular velocity [rad/sec]
FLOWCHART
Start
Entry of period
and amplitude
CALC
Entry of time
Calculation of
angular velocity, etc.
Display of
calculation result.
Calculation of
range and scale
Graph display
Display clear
2π
T
2
x velocity : v = A ω cos (ω t)
+
displacement : x = A sin (ω t)
0
+
Ax
2π
ωt
+
+
A
PROGRAMME LIST
Title : OSCILLAT
Rad
Print "Input PERIOD
Input P
P F
Print "Input AMPLITUDE
Input A
A D
Label CALC
Angular velocity, displacement,
acceleration and velocity
calculated.
W = angular velocity
H = displacement
B = acceleration,
V = velocity
Calculation result of angular
velocity, displacement,
acceleration and velocity
displayed.
Range set and graph displayed.
Function: Y = D sin (W X)
X is time increase.
...
Xmin
0, Xmax
...
Ymin
-D, Ymax
Text and graph display cleared.
...
E, Xscl
...
D, Yscl
...
E/10
...
D/5
Print "Input TIME
Input T
T E
2 π/F W
D sin (W E) H
-(W2) H B
D W cos (W E) V
Print "ANGULAR VELOCITY
Print W
Print "MAGNITUDE
Print H
Print "ACCELERATION
Print B
Print "VELOCITY
Print V
Wait
E/10 X scl
D/5 Y scl
0 Xmin:E Xmax
-D Ymin:D Ymax
Draw D sin (W X)
Wait
ClrT
ClrG
Goto CALC
ωt
v
0
v
ax
(REAL MODE)
8
Page 16

PARAMETERS
EL-9900 Graphing Calculator
Name of parameter
B
E
V
W
H
Xscl
Yscl
Content
acceleration
time
velocity
angle of velocity (ω)
displacement
x-axis scale
y-axis scale
Name of parameter
A
P
T
D
F
X
Exercise
Calculate angular velocity, etc., using period
ππ
π, amplitude 1 and time 3 seconds and
ππ
display the changes on a graph.
Set up condition: decimal point in Float Pt Mode.
Specify the programme mode.
1
Select the title OSCILLAT.
2nd F
SET UP
E
1
C
CL
1
Key Operation
PRGM
A
Content
input of amplitude
input of period
input of time
amplitude
period
time increase
DisplayStep
Enter the values of period,
2
amplitude, and time.
3
(Display of angular velocity)
(Display of displacement)
(Display of acceleration)
(Display of velocity)
4
(Display of graph of simple
harmonic oscillation)
5
2nd F
ENTER
ENTER
ENTER
π
ENTER
1
ENTER
3
9
Page 17

EL-9900 Graphing Calculator
Electric Power Consumed on an AC Circuit
Enter the voltage effective value, frequency and resistance value to find the power
value of the circuit with resistance R. Draw a graph of the changes in power over a
period of time.
Calculation
P : power consumption I : effective value of current
V : effective value of voltage
R
•
•
I0 = N
sin ω
t V0 = M
•
sin ω
•
t P0 = l0
•
V0
P0 : change in amount of power with time
I
0 : change in amount of current with time
0: change in amount of voltage with time
V
N: maximum value of current M: maximum value of voltage
ω: angular velocity (2 π S) t : time S : frequency
V
I
FLOWCHART
Start
Data entry
Calculation of power
Calculation of range
Display of power
Display of graph
End
Enter data (resistance, voltage and
frequency).
Power calculated.
W = angular velocity
M = maximum voltage
N = maximum current
I = effective value of current
Z = power
Range for graph calculated.
Xmax, Xscl, Ymax, Yscl
Power displayed. (value of Z)
Function: Y = N M (sin (W X))
2
PROGRAMME LIST
Title : AC POWER
Rad
Print "Input RESISTANCE
Input R
Print "Input VOLTAGE
Input V
Print "Input FREQUENCY
Input F
R T
V D
F S
2 π S W
D √2 M
M/T N
N/√2 I
D I Z
1/S Xmax
Xmax/10 Xscl
N M Ymax
Ymax/10 Yscl
Print "WATT=
Print Z
Wait
0 Xmin
0 Ymin
Draw N M (sin (W X))
End
2
(REAL MODE)
Name of parameter
S
I
T
D
W
N
M
Xmax
10
PARAMETERS
Content
frequency
effective value of current
resistance value
effective value of voltage
angular velocity
maximum value of current
maximum value of voltage
maximum value of x-axis
Name of parameter
Xscl
Ymax
Yscl
V
R
F
Z
Content
scale of x-axis
maximum value of y-axis
scale of y-axis
input of voltage
input of resistance value
input of frequency
value of power
Page 18

EL-9900 Graphing Calculator
Exercise
Find the power value of an A C cir cuit with r esistance value 150 Ω, voltage effective
value 100V and frequency 50Hz and display on a graph the changes in power over
a period of time.
Set up condition: decimal point in Float Pt Mode.
SET UP
2nd F
1
C
1
E
CL
Specify the programme mode.
1
Select the title AC POWER.
Enter the resistance value,
2
voltage effective value, and
frequency.
(Display of value power)
3
(Display of graph)
Key Operation
PRGM
A
15
10
0
5
ENTER
ENTER
0
0
ENTER
ENTER
DisplayStep
11
Page 19
A
EL-9900 Graphing Calculator
ngle of Vector
Use the matrix operation feature to find the angle θ which forms the standard vector
and vector. The angle can be calculated at one time against the multiple vectors.
Calculation
←
Calculating vector inner product a• b = | a | | b | cos θ
Use the above expression to derive the following expression
←←
a• b
θ = cos
-1
←←
| a | | b |
←←←
End
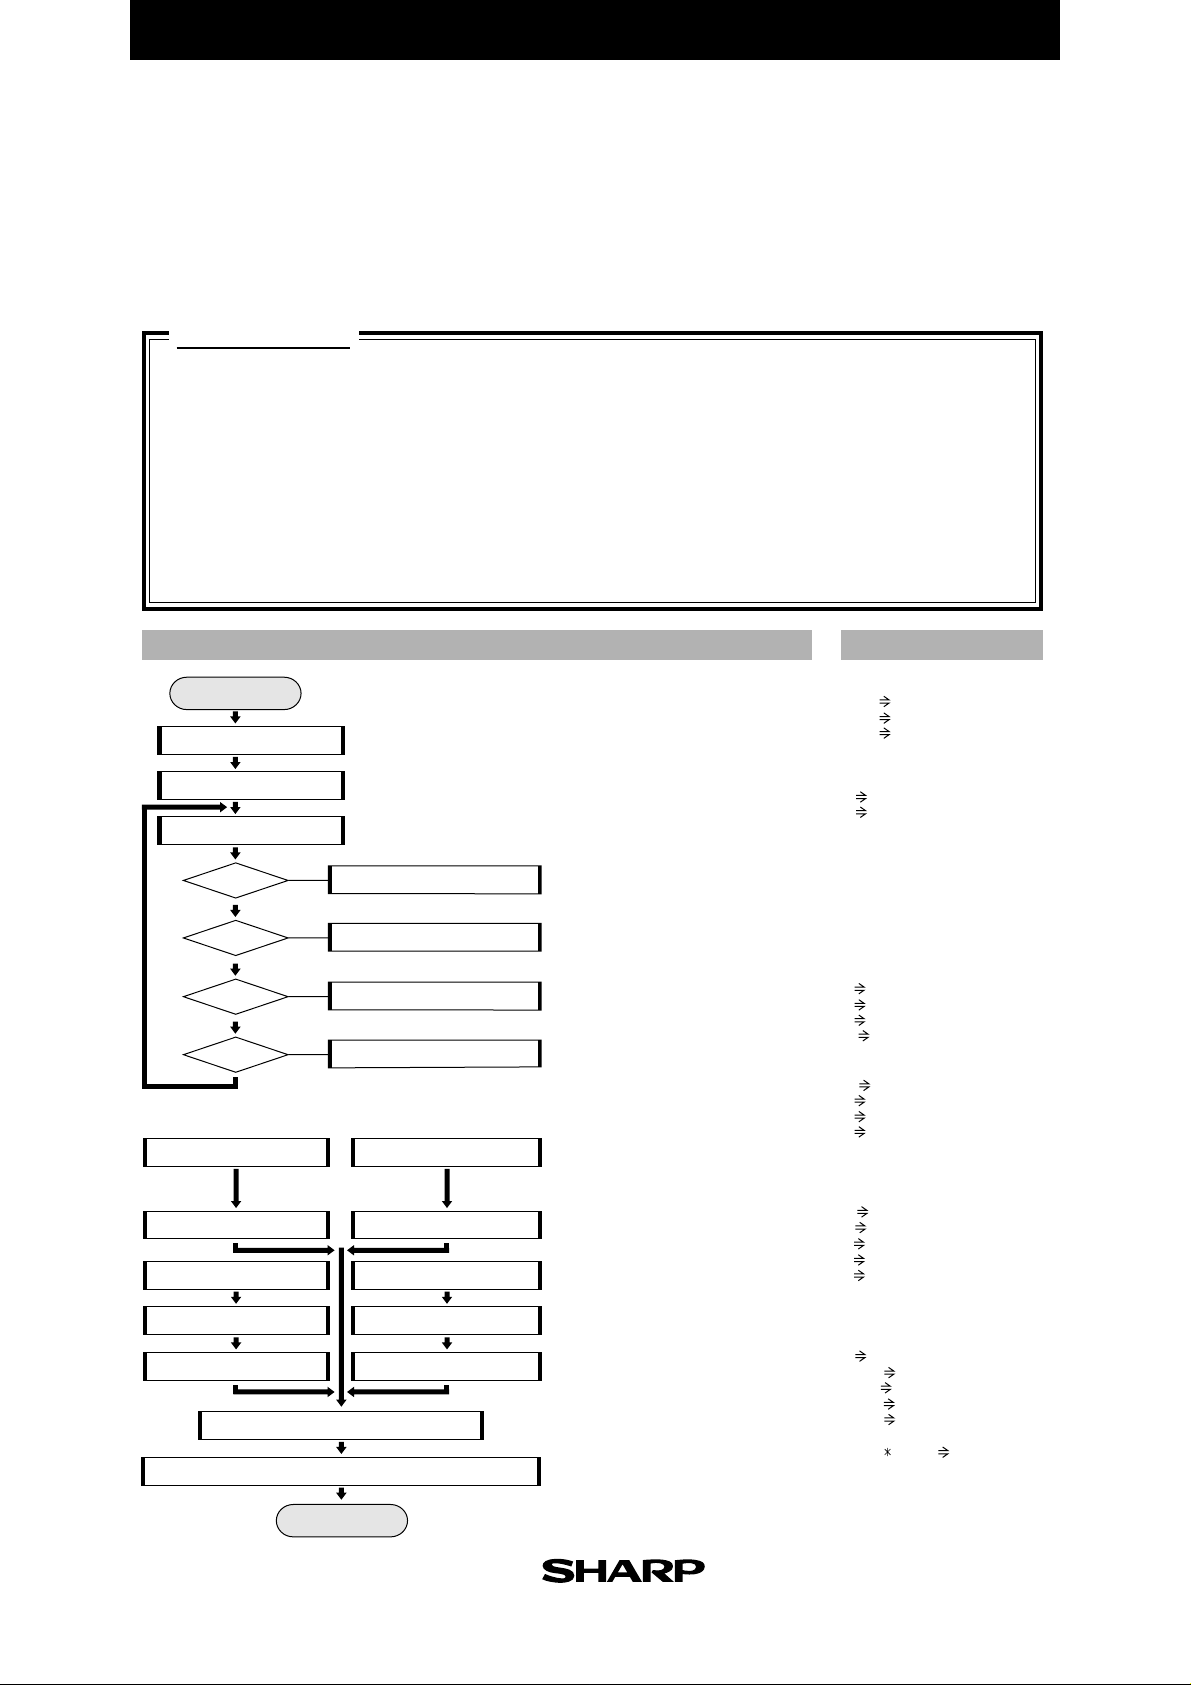
FLOWCHART
Start
Entry of number
of vectors
Definition of arrays
Vector data entry
K = K + 1
Y
Y
component of vector
K
≤
M
N
Entry of standard
vector data
Calculation of
component of
standard vector
Calculation of
inner product
I = I + 1
I > M
N
Calculation of
PROGRAMME LIST
Title : VECTOR
Print " Input NUMBER
Enter no. of vectors for which
angles are calculated.
Arrays defined.
matA, matB, matC.
Counter for data entry.
Enter x component and Y
component of each vector.
Entry repeated by no. of vectors.
Enter x component and Y component
of standard vector.
Length component of standard
vector (scalar) calculated.
Product of matrices A and B
calculated.
Counter for calculation of angle.
Calculation repeated by no.
of vectors.
Length component of vector
(scalar) calculated.
Input N
N M
{M,2} dim (mat A)
{2,1} dim (mat B)
{M,1} dim (mat C)
For K, 1, M, 1
Print " Input VECTOR
Print K
Input X
X mat A(K,1)
Input Y
Y mat A(K,2)
NEXT
Print "Input FUNDAMENTAL VECTOR
Input X
X mat B(1,1)
Input Y
Y mat B(2,1)
√ (mat B(1,1)
mat A mat B mat C
For I, 1, M, 1
√ (mat A(I,1)
cos
Print "ANGLE OF VECTOR
Print I
Print "θ=
Print θ
Wait
NEXT
End
2
+mat B(2,1)2) B
2
-1
(mat C(I,1) / (A B)) θ
+mat A(I,2)2) A
(MATRIX MODE)
12
Calculation of angle
and display of angle
Angle calculated and displayed.
Page 20
PARAMETERS
EL-9900 Graphing Calculator
Name of parameter
A
B
I
K
M
X
Y
Content
vector scalar quantity
standard vector scalar quantity
calculating counter
input counter
number of vectors
input of x component
input of y component
Name of parameter
θ
K
N
mat A
mat B
mat C
Content
vector angle
display
input of number of vectors
vector components
standard vector components
vector inner product
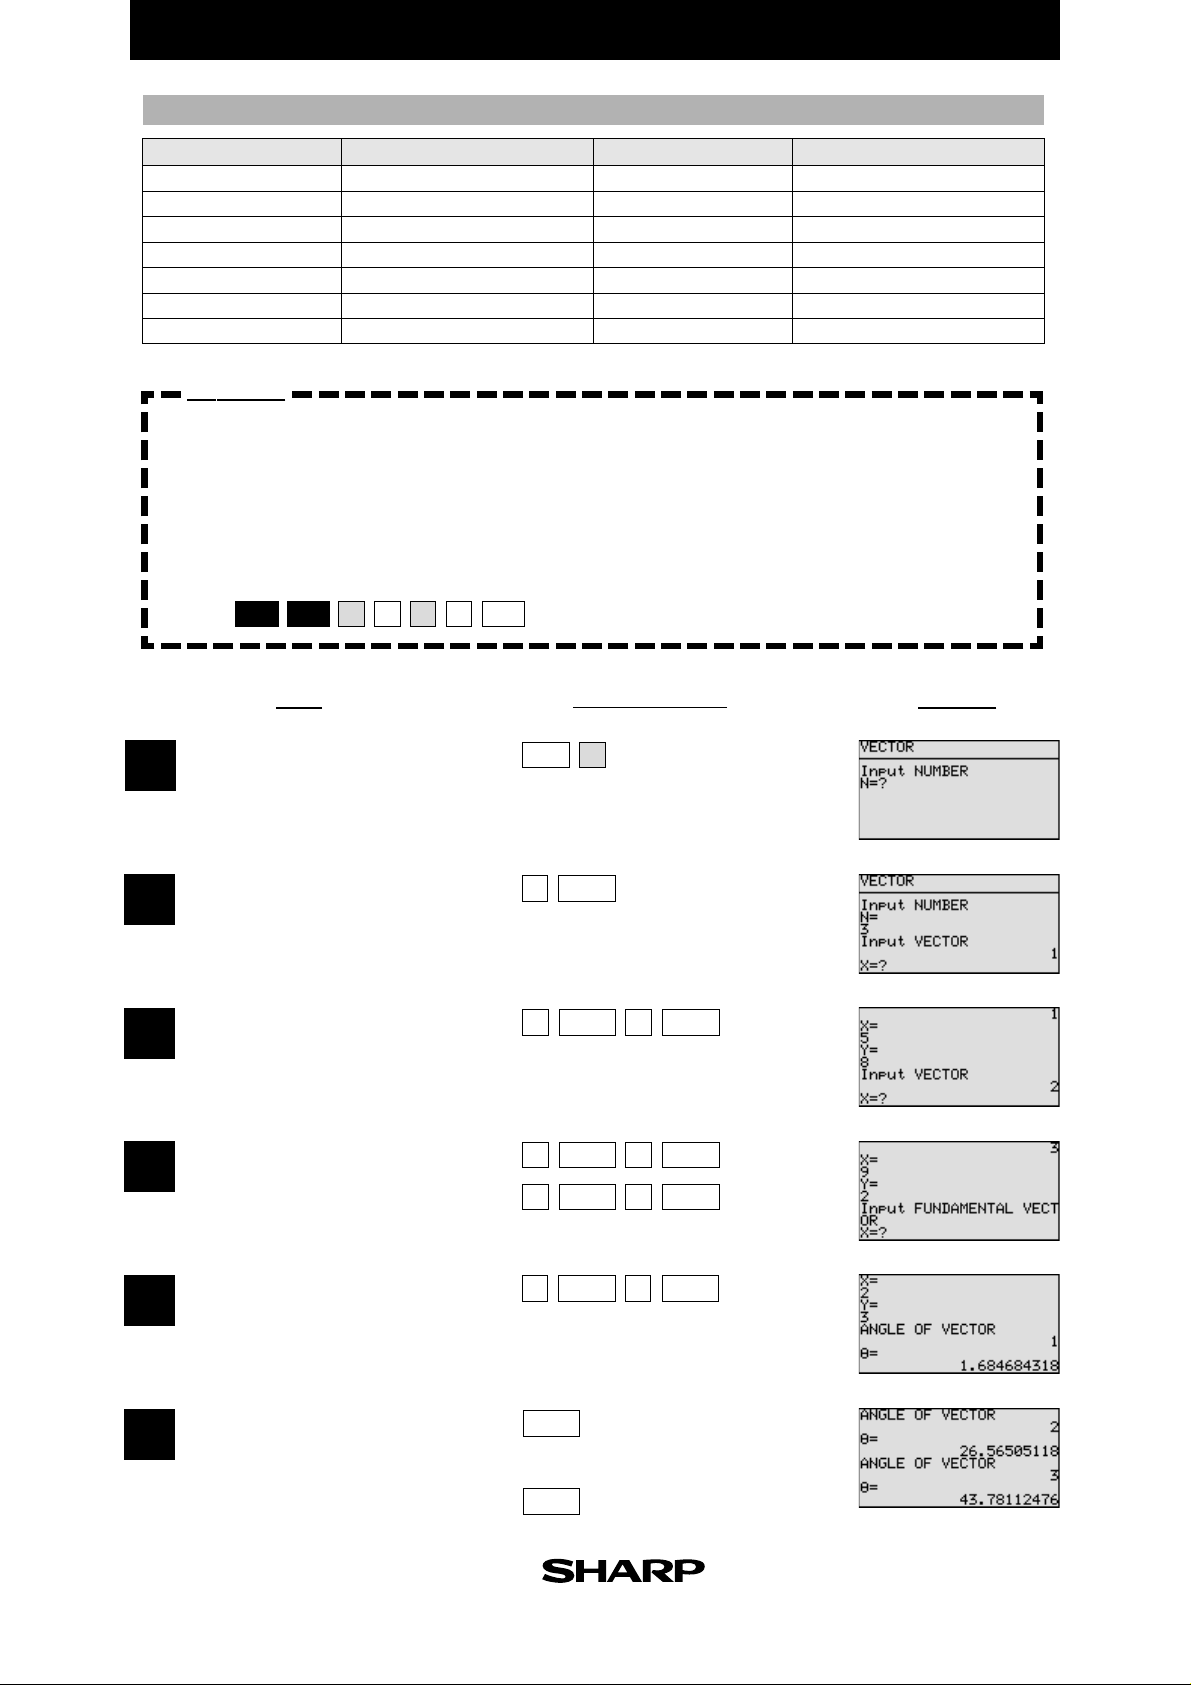
Exercise
Calculate the angle formed by the following 3 vectors and standard vector (2,3).
vector 1 (5, 8)
vector 2 (7, 4)
vector 3 (9, 2)
Set up condition: angle unit in Deg mode, and decimal point in Float Pt
mode.
2nd F
SET UP
1
B
C
CL
1
Key Operation
DisplayStep
Specify the programme mode.
1
Select the title VECTOR.
Enter the number of vectors.
2
Enter the values of vector 1.
3
Enter the values of vectors
4
2 and 3.
Enter the value of standard
5
vector.
A
PRGM
3
ENTER
5
ENTER
7
ENTER
ENTER
9
2
ENTER
8
ENTER
ENTER
4
ENTER
2
3
ENTER
6
(Display of angle of vector 1)
ENTER
(Display of angle of vector 2)
ENTER
(Display of angle of vector 3)
13
Page 21
EL-9900 Graphing Calculator
Linear Transformation
Use the matrix to find four types of the linear transformation of x-axis symmetric
transformation, y-axis symmetric transformation, similar transformation and
revolution around the origin.
Calculation
1. Symmetric transformation to
x-axis (Case 1)
X'
() ()
Y'
1 0
=
() ()
0 -1
X
Y
2. Symmetric transformation to
y-axis (Case 2)
X'
() ()()
Y'
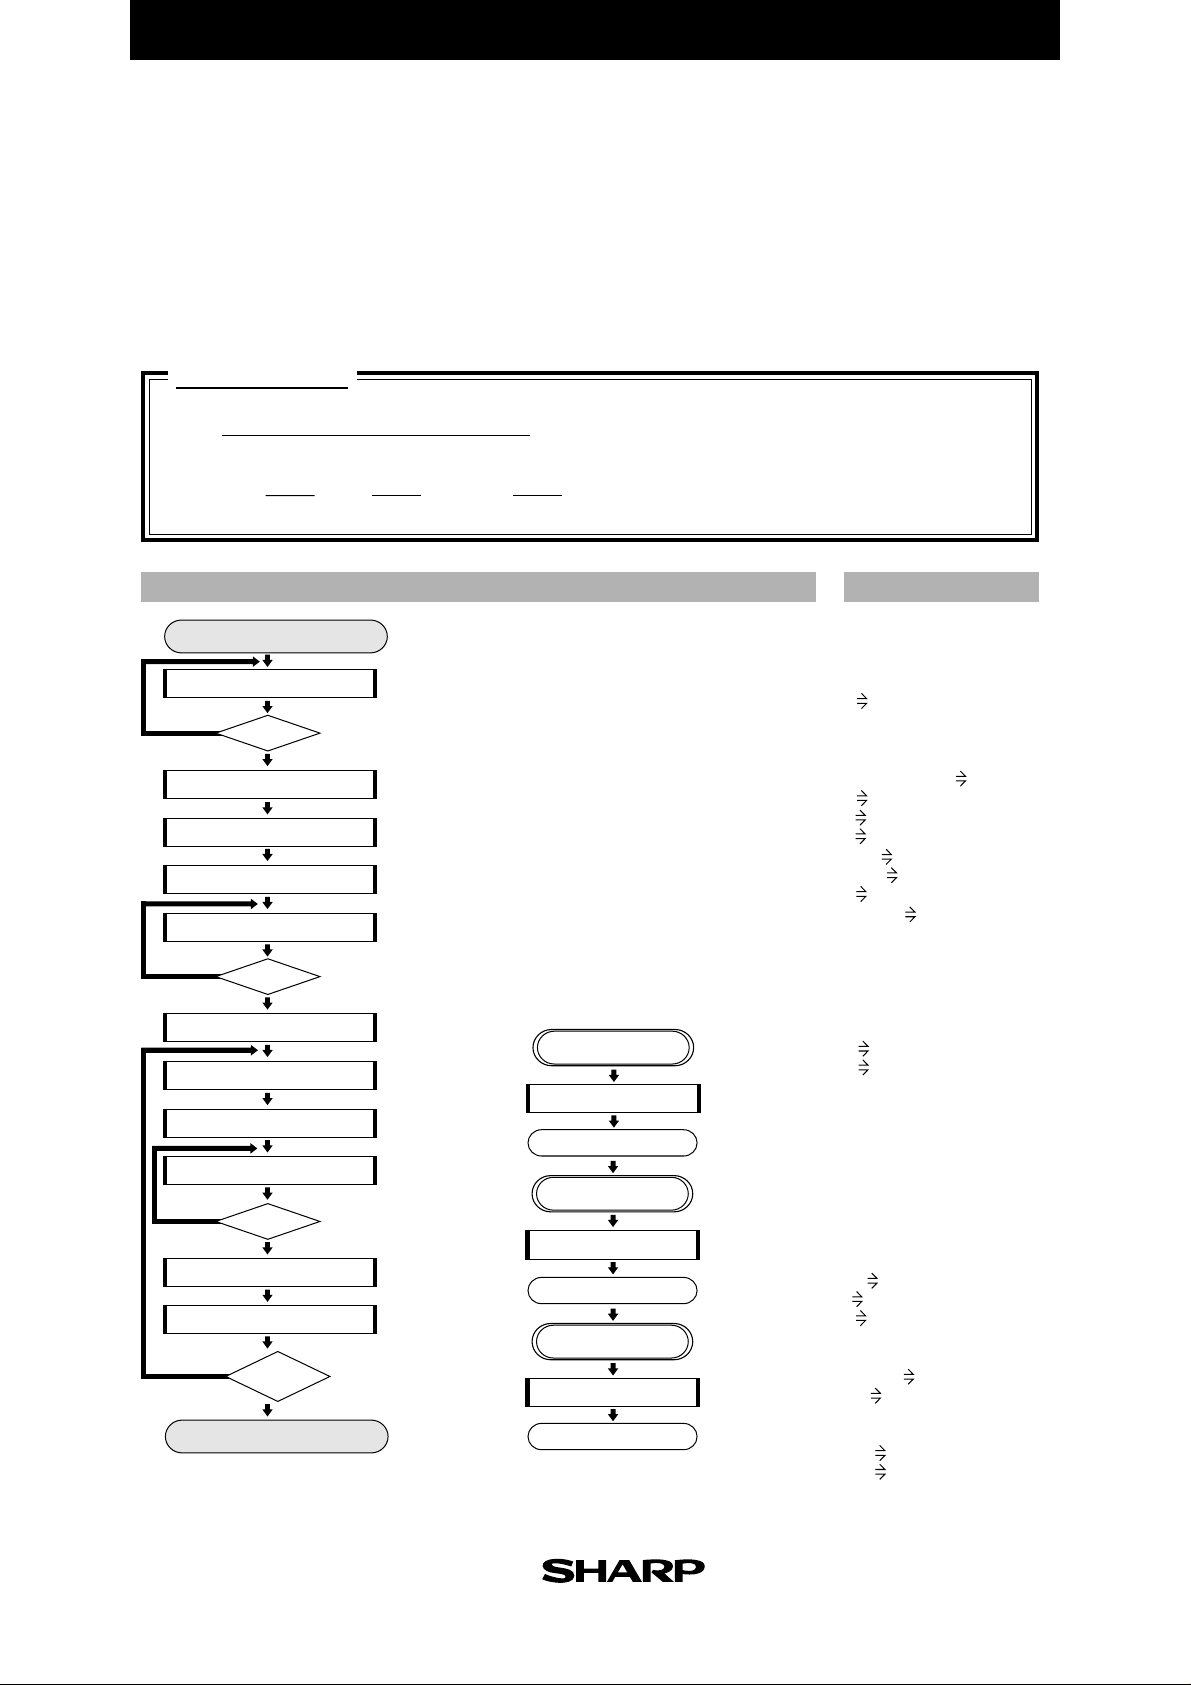
Start
Array declaration
Entry of coordinates (X,Y)
Entry of type
s = 1
s = 2
s = 3
s = 4
Label XSYMMETRY
Transformation data set
Label SIMRATIO
Entry of ratio of similitude
Data set of transformation
Display of coordinates after transformation
-1 0
=
01
Y
N
Y
N
Y
N
Y
N
Coordinate transformation
X
Y
FLOWCHART
TYPE
To label XSYMMETRY
To label YSYMMETRY
To label SYMRATIO
To label ROTATE
Label YSYMMETRY
Transformation data set
Label ROTATE
Entry of angle
Data set of transformation
End
3. Similar transformation with ratio of
similitude K around origin (Case 3)
X'
Y'
=
K0
0 K
X
()()
Y
4. Transformation revolving around
only angle B at the origin (Case 4)
X'
(())()
Y'
Declare array size, etc.
matH(2,2), matD(2,1), matA(2,1)
Enter coordinates before transformation.
Type of transformation specified
with no from 1 to 4.
Jumps to destination corresponding
to entered number.
XSYMMETRY
Data set of x-axis symmetric transformation
matH(1,1) = 1, matH(1,2) = 0,
matH(2,1) = 0, matH(2,2) = -1
YSYMMETRY
Data set of y-axis symmetric transformation
matH(1,1) = -1, matH(1,2) = 0,
matH(2,1) = 0, matH(2,2) = 1
SIMRATIO
Data set of similar transformation
Entry of ratio of similitude (R)
matH(1,1) = K, matH(1,2) = 0,
matH(2,1) = 0, matH(2,2) = θ
Data set of transformation by revolving
Entry of angle (A)
matH(1,1) = cos B, matH(2,1) = sin B,
matH(1,2) = -sin B, matH(2,2) = cos B,
Matrix H multiplied by matrix D.
Coordinates displayed.
cos B -sin B
=
sin B cos B
X
Y
PROGRAMME LIST
Title : LINE TRN
{2, 2} dim(mat H)
{2, 1} dim(mat D)
{2, 1} dim(mat A)
Print "Input POINT
Input X
Input Y
X mat D(1, 1)
Y mat D(2, 1)
Label TYPE
Print "SELECT 1, 2, 3, 4
Input S
ClrT
If S=1 Goto XSYMMETRY
If S=2 Goto YSYMMETRY
If S=3 Goto SIMRATIO
If S=4 Goto ROTATE
GotoTYPE
Label XSYMMETRY
1 mat H(1, 1)
0 mat H(2, 1)
0 mat H(1, 2)
-1 mat H(2, 2)
Goto TRANS
Label YSYMMETRY
-1 mat H(1, 1)
0 mat H(2, 1)
0 mat H(1, 2)
1 mat H(2, 2)
Goto TRANS
Label SIMRATIO
Print "Input
Input R
R K
K mat H(1, 1)
0 mat H(2, 1)
0 mat H(1, 2)
θ mat H(2, 2)
Goto TRANS
Label ROTATE
Print "Input ANGLE
Input A
A B
cos B mat H(1, 1)
sin B mat H(2, 1)
-sin B mat H(1, 2)
cos B mat H(2, 2)
Label TRANS
mat H mat D mat A
Print "mat A(1, 1)
Print mat A(1, 1)
Print "mat A(2, 1)
Print mat A(2, 1)
End
SIMILITUDE RATIO
14
Page 22
PARAMETERS
EL-9900 Graphing Calculator
Name of parameter
B
K
S
X
Content
angle
ratio of similitude
selecting type
(S=1: case 1, S=2: case 2,
S=3: case 3, S=4: case 4)
x-coordinate
Name of parameter
Y
A
R
mat A
mat H
mat D
Content
y-coordinate
input of angle
input of ratio of similitude
coordinate after transformation
transformation data
x,y-coordinate
Exercise
1. Transform symmetrically the point (3, 5) to the x-axis.
2. Rotate the point (2, 6) at 45˚ around the origin.
Set up condition: angle unit in Deg Mode and decimal point in
Float Pt Mode.
Specify the programme mode.
1
Select the title LINE TRN.
2nd F
SET UP
1B
1C
CL
Key Operation
PRGM
A
DisplayStep
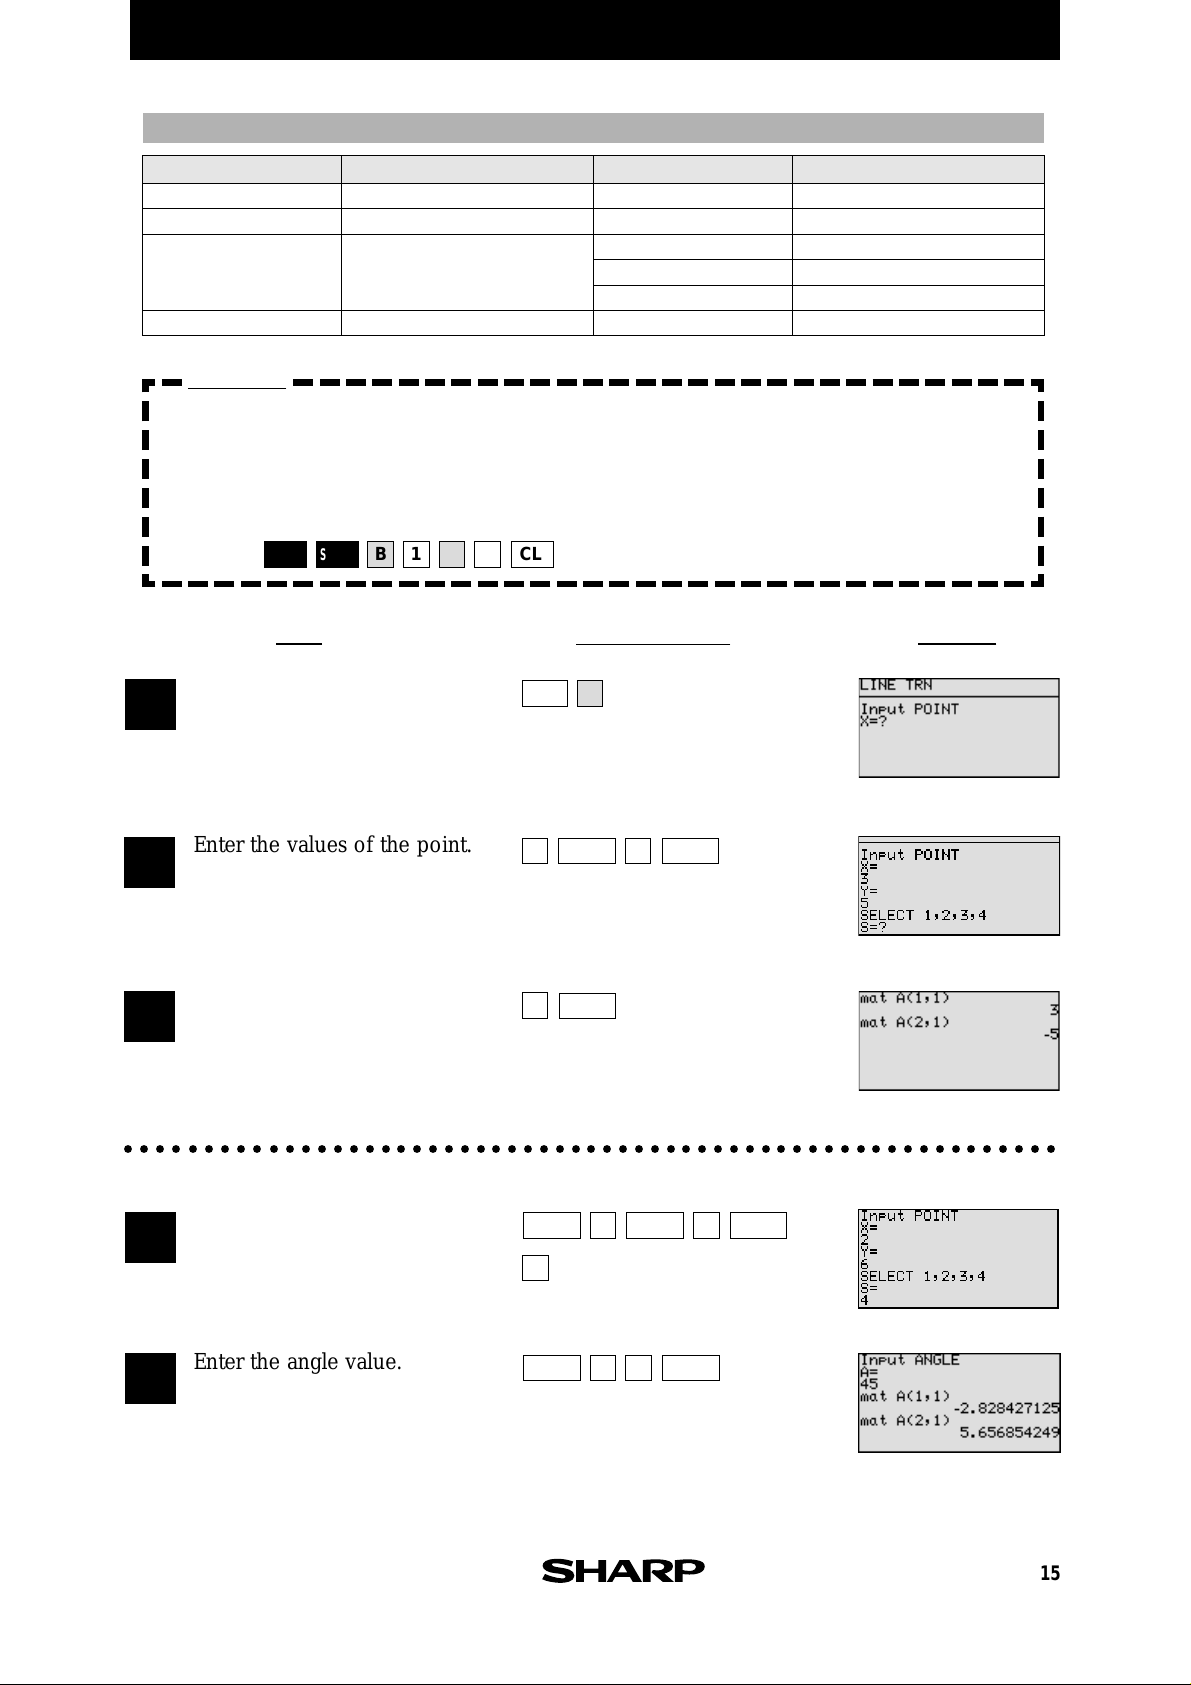
Enter the values of the point.
2
Select symmetric transformation
3
to x-axis (case 1).
○○○○○○○○○○○○○○○○○○○○○○○○○○○○○○○○○○○○○○○○○○○○○○○○○○○○○○○○○○○
Select transformation revolving
4
around only angle B at the
origin (case 4).
Enter the angle value.
5
3
ENTER
ENTER
1
ENTER
4
ENTER
2
4
5
ENTER
5
ENTER
6
ENTER
ENTER
15
Page 23
EL-9900 Graphing Calculator
Moving Average
Plot a moving average graph which helps to understand how the results change over a
specified period. The progress of sales and amounts of consumption and production can
also be seen.
Calculation
Xi-(M-1) / 2 + ... + Xi + ... Xi+(M-1) / 2
Hi =
M
( I = 1 +
M-1
2 2 2
, 2 +
M-1
FLOWCHART
Start
MAIN
Entry of number of divisions
Y
Setting of calculation range
Gosub MOVINGSUM
Y
Gosub AVERAGE
Gosub MOVINGSUM
Y
Gosub AVERAGE
Y
M>=n
N
Calculation
Gosub count
LOOP1
M>=J
N
LOOP2
Substitution
Gosub COUNT
LOOP3
(I+M)>J
N
Display of line
K≠
(n-int(M/2))
N
End
Hi: moving average
M : number of divisions
X
i
, ... , n +
Enter unit for calculating average.
Returns to entry of no. of divisions if the number
of divisions more than no. of data.
Range for graph set.
I = 0, K = int (M/2)
First calculation. Jumps to subroutine.
Jumps to subroutine.
Number of calculation times of moving sum judged.
Repeated until calculation of no. of divisions performed.
X = K, Y = H
Jumps to
subroutine.
Jumps to
subroutine.
M-1
)
COUNT
I = I + 1, J = I, S = 0
Return
MOVINGSUM
Subroutine
Setting of counter
Subroutine
Calculation of
moving sum
: data
n : number of data
Calculation of moving sum
Jumps to
subroutine.
Line displayed.
Judgment of end.
Return
AVERAGE
Subroutine
Calculation of
average
Calculation of moving average
Return
PROGRAMME LIST
Title : MVIN AVG
Label MAIN
Print "Input DIVISION
Input D
D M
1_Stats L1
If M≥n Goto MAIN
Rem RANGE
(xmax-xmin)/10 Yscl
0 Xmin
n Xmax
1 Xscl
xmin Ymin
xmax Ymax
0 I
int (M/2) K
Gosub COUNT
Label LOOP1
Gosub MOVINGSUM
If M≥J Goto LOOP1
Gosub AVERAGE
Label LOOP2
K X
H Y
Gosub COUNT
Label LOOP3
Gosub MOVINGSUM
If (I+M)>J Goto LOOP3
Gosub AVERAGE
Line (X, Y, K, H)
If K≠(n-int (M/2))
Wait
End
Label COUNT
I+1 I
I J
0 S
Return
Label MOVINGSUM
S+L1(J) S
J+1 J
Return
Label AVERAGE
S/M H
K+1 K
Return
Goto LOOP2
16
Page 24
Parameters
EL-9900 Graphing Calculator
name of parameter
H
I
J
K
M
content
moving average
counter
counter
counter
number of divisions
name of parameter
S
X
Y
Yscl
B
content
moving sum
starting point (x)
starting point (y)
scale of y-axis
input of number of divisions
Exercise
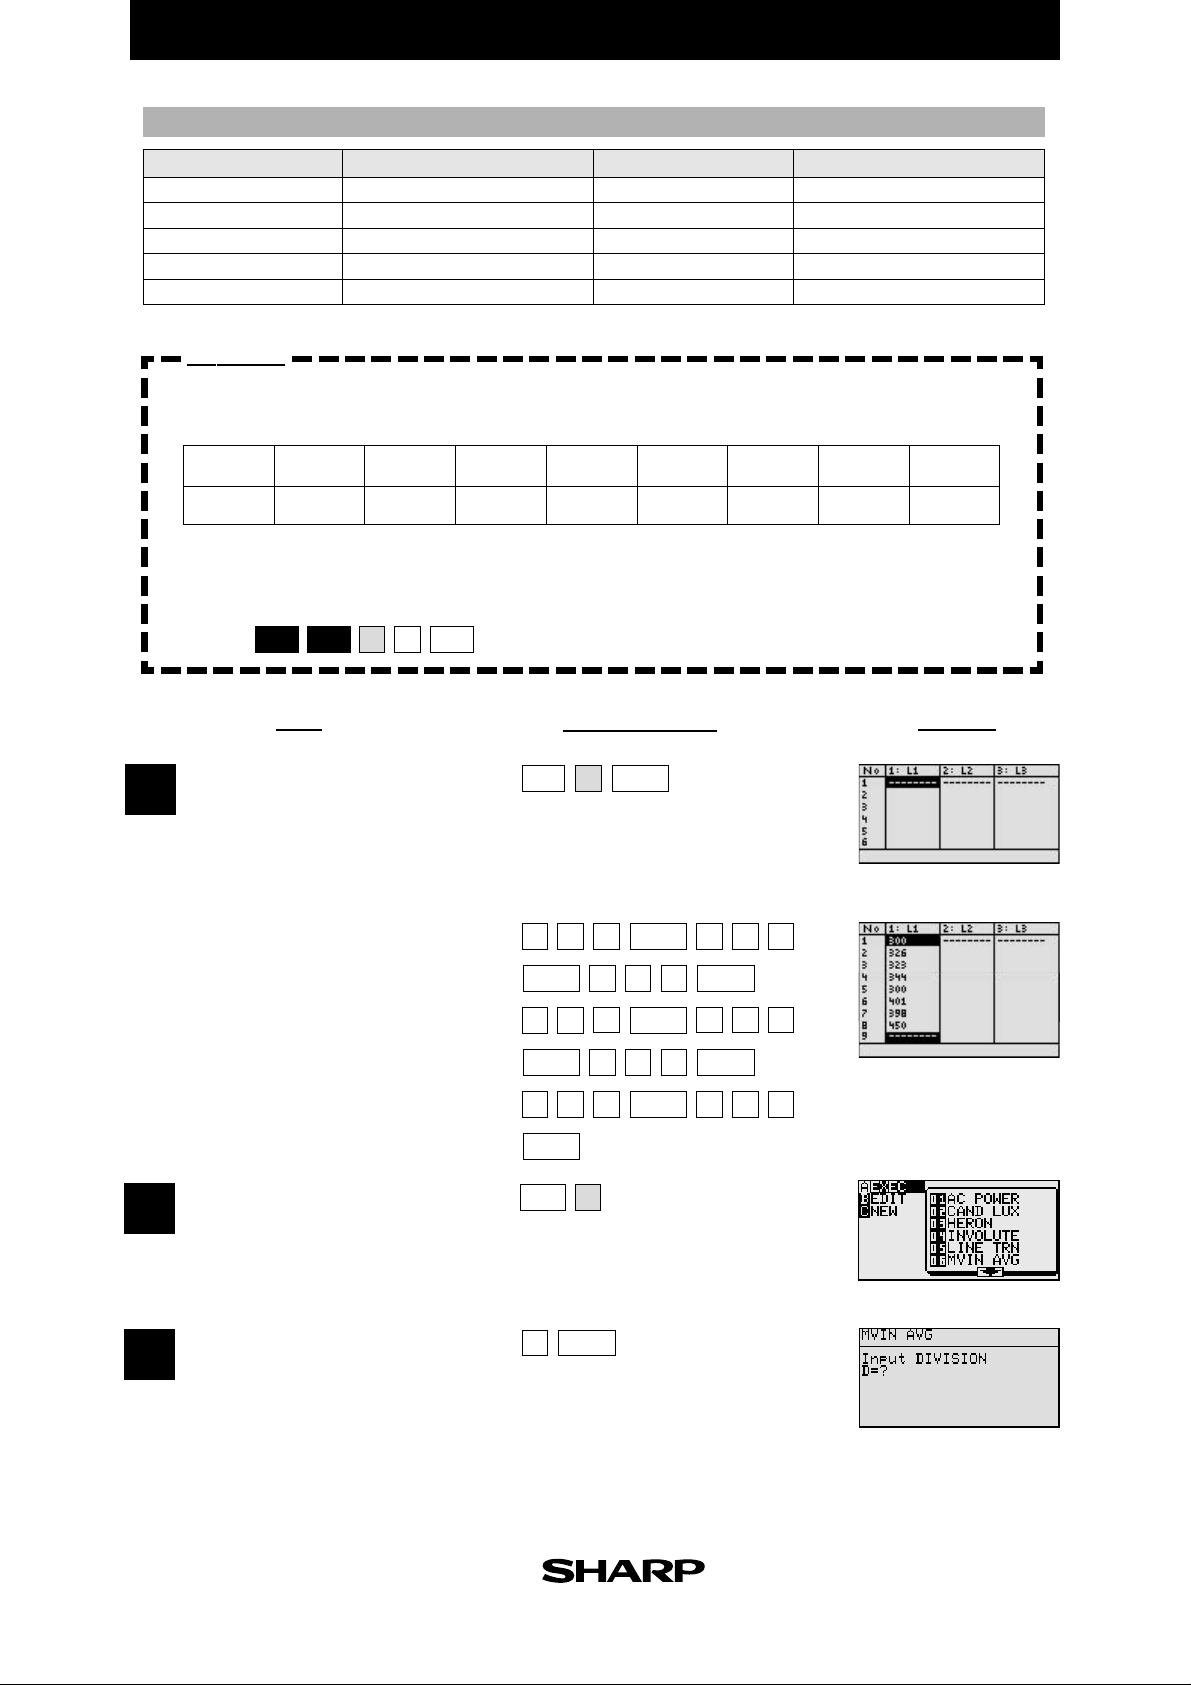
Find the moving average every three months (number of divisions: 3) fr om the follo wing
table of monthly sales.
Month
Sales[$]
Jan.
300
Feb.
326
Mar.
323
Apr.
344
May.
300
Jun.
401
Jul.
398
Aug.
450
On the graph, Xmax = 8, Ymin = 300, and Ymax = 450.
Set up condition: decimal point in Float Pt Mode.
2nd F
SET UP
1
C
CL
Key Operation
DisplayStep
Enter statistical data into L1.
1
Specify the programme mode.
2
Select the title MVIN AVG.
Enter the number of divisions(3).
3
STAT
ENTER
ENTER
ENTER
PRGM
3
ENTER
A
0
03623
43
93
ENTER
ENTER
4
8
A
23
ENTER
04
ENTER
3
1
ENTER
ENTER
4
003
05
17
Page 25
EL-9900 Graphing Calculator
Creating a Graph of Experimental Data
Graph the results of an experiment and examine the trends.
(Example: examined data relating to water vapour pressure and temperature.)
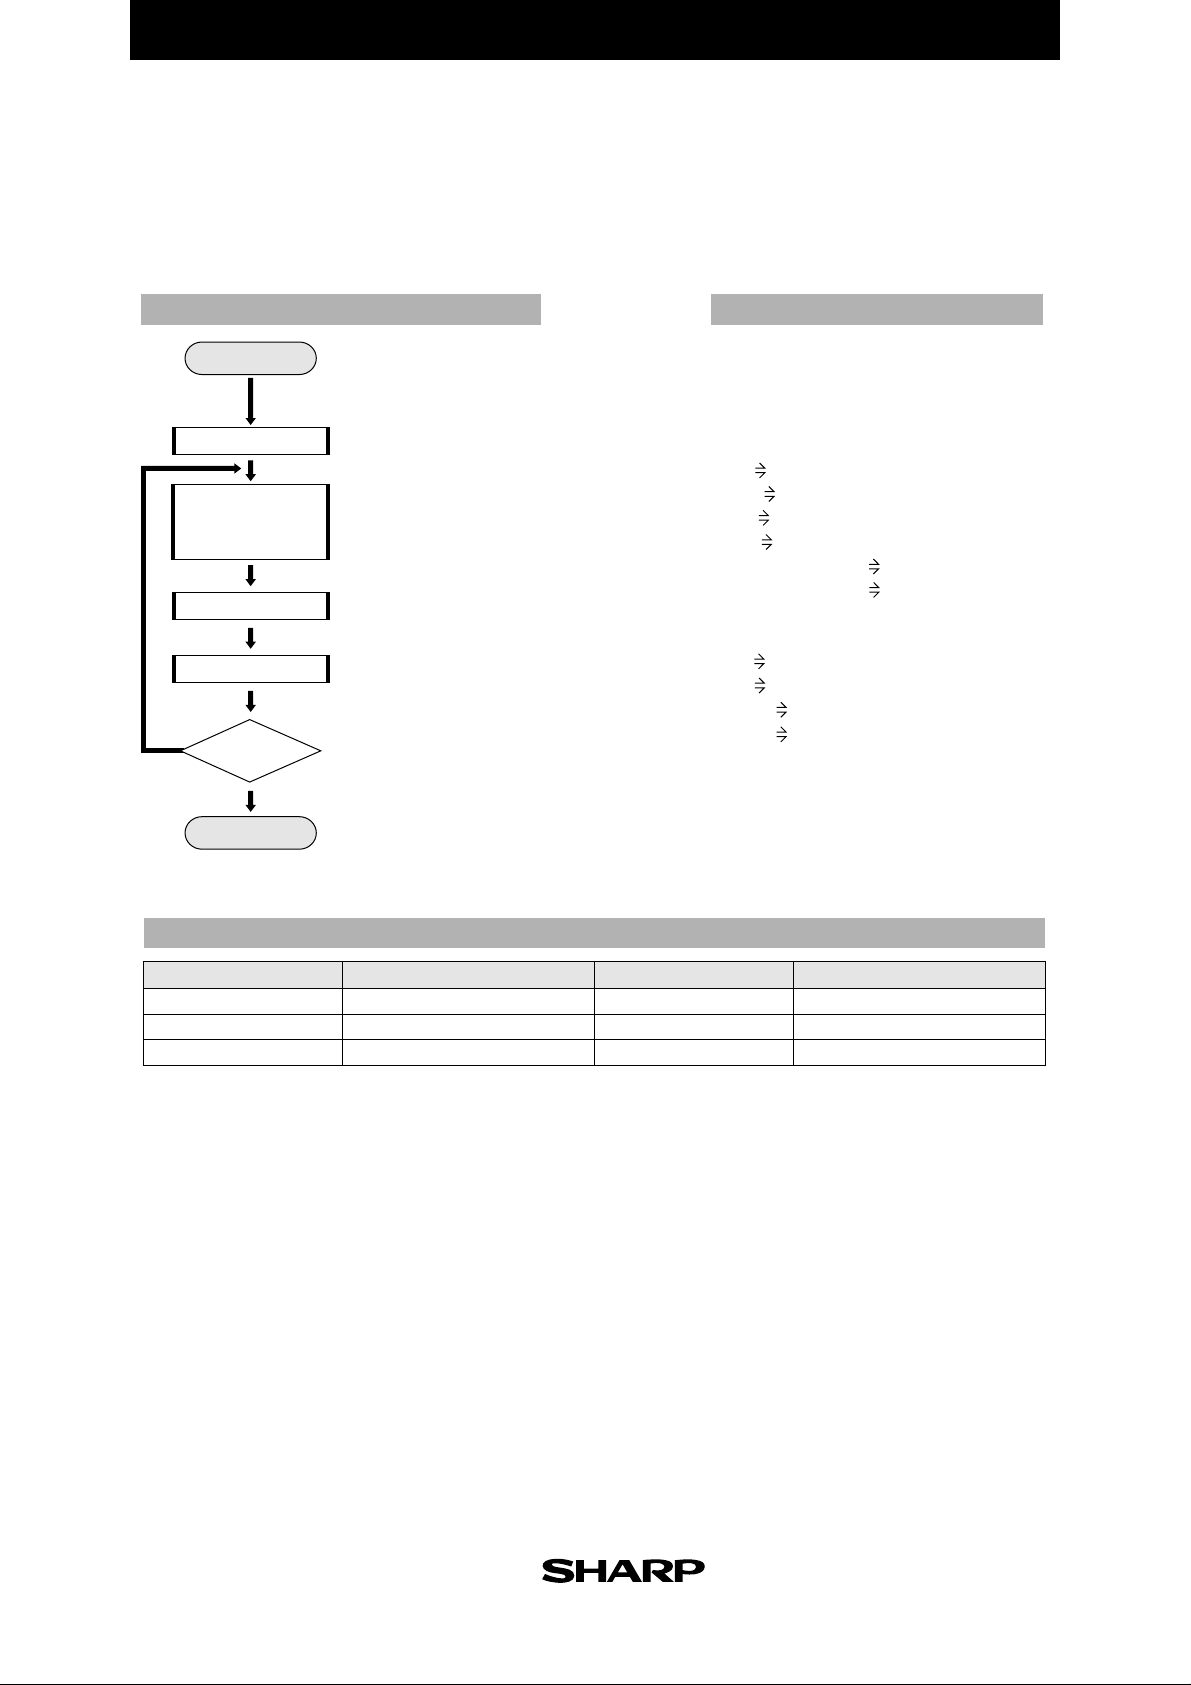
Start
Graph plot
Setting of
coordinates
of line
Display of line
I = I + 1
Y
I < N
End
FLOWCHART
Enter statistical data using
statistics feature before
executing program.
Graph plotted using
DRAWLOOP
N
automatic scaling.
Counter
Data as coordinates
(starting point and
finishing point).
Line drawn between
set coordinates.
Whether or not lines of no.
of data drawn judged.
Repeated until lines drawn
by the no. of data.
PROGRAMME LIST
Title : XY GRAPH
ClrG
Rem DRAWING SD
2 -Stats L1,L2
Rem RANGE
xmin Xmin
xmax Xmax
ymin Ymin
ymax Ymax
(Xmax-Xmin) / 10 Xscl
(Ymax-Ymin) / 10 Yscl
Rem BROKEN LINE
For I, 1, n-1, 1
L1(I) X
L2(I) Y
L1(I+1) Z
L2(I+1) W
Line(X,Y,Z,W)
NEXT
Wait
End
Name of parameter
I
X
Z
Content
counter
x of line starting point
x of line finishing point
PARAMETERS
Name of parameter
Y
W
Content
y of line starting point
y of line finishing point
*n = number of statistical data
18
Page 26

EL-9900 Graphing Calculator
Exercise
The following table shows examined water vapour pressure. Draw a graph
of this data.
Temperature [˚C]
Pressure [mmHg]04.581109.2052017.5323031.8264055.3395092.55860149.4770223.7980355.2990525.90
Set up condition: decimal point in Float Pt Mode.
Enter statistical data into
1
L1 and L2.
Enter the value for temperature.
2nd F
SET UP
CL1C
Key Operation
A
ENTER
ENTER
01
ST A T
…
0
2
1
(Other numbers not shown)
00
ENTER
100
760.00
DisplayStep
Enter the value for pressure.
3
Specify the programme mode.
4
Select the title XY GRAPH.
(Drawing of graph)
▲
…
PRGM
•
0
6
7
A
854
ENTER
1
ENTER
19
Page 27

EL-9900 Graphing Calculator
Ordinary Differential Equations
Enter the initial conditions (X, Y) with the step H and interval T. Use Runge Kutta Gill method
to solve the ordinary differential equation of first order.
Calculation
Use the following four steps of Runge Kutta Gill method to find the
n + 1
and Y
n - 1
equation X
0
starting point X
1. K0 = Hf (Xn , Yn), R1 = (1/2) (K0-2Q0), Y
.
from Xn and Yn. Input Qo = 0 at the
(1)
= Yn +R
1
Y
2. Q1 = Q0 + 3R1- (1/2)K
K1 = Hf (Xn + H/2, Y
3. Q2 = Q1 + 3R2 - (1 - 1/2) K
K2 = Hf (Xn + H/2, Y
4. Q3 = Q2 + 3R3- (1 + 1/2) K
K3 = Hf (X
Q4 = Q3 + 3R4 - (1/2)K
n+1
, Y
Start
Entry of data
Initial setting
MAIN
Gosub
Calculation of step 1.
Gosub
Calculation of step 2.
Gosub
Calculation of step 3.
Gosub
Calculation of step 4.
Z <= I
Y
S = I
O = J
Z ≠ I
Y
Processing
in case of
inequality
SUB1
Display of result
Processing for
next calculation
0
(1)
), R2 = (1 - 1/2) (K1-Q1), Y
1
(2)
), R3 = (1 + 1/2) (K2 -Q2),Y
(3)
), R4 = (1/6) (K3-2Q3), Y
N
N
2
3
Enter Data.
Initial coordinates (X, Y), step
of x (H), and interval of solutions (T)
Data for calculation set.
Calculation executed.
Jumps to subroutine.
Jumps to subroutine.
Jumps to subroutine.
Jumps to subroutine.
Judgment of calculation end.
If calculation result of I smaller
than value of increase of I,
calculation repeated again.
Following calculation
SUB2
performed when calculation
result of x not equal to the
value of increase of X.
(Z - S) (J - O)
P =
Prior processing for next calculation
Z = Z + T, S = X, O = J
(2)=Y(1)
+ R
2
(3)
(2)
= Y
+ R
(3)
n+1
= Y
+ R
4
FLOWCHART
M = Z
+ O,
H
N = P
3
Subroutine
FORMULA
Subroutine for
calculating
built-in function
Return
PROGRAMME LIST
Title : RUNGE
Rem INITIAL
Print " Input X0
Input X
Print " Input Y0
Input Y
X I
Y J
Print " Input H
Input H
Print " Input T
Input T
-1
1+√(2
) A
-1
1- √(2
) B
I+T Z
O Q
I S
Label MAIN
Rem 1
Gosub
FORMULA
H F K
(K-2 Q) /2 R
J+R J
Q+3 R-K/2 Q
I+H/2 I
Rem 2
Gosub
H F K
B (K-Q) R
J+R J
Q+3 R-B K Q
Rem 3
Gosub
H F K
A (K-Q) R
J+R J
Q+3 R - A K Q
I+H/2 I
Rem 4
Gosub
H F K
(K - 2 Q) /6 R
J+R J
Q+3 R - K/2 Q
If Z≤I Goto
I S
J O
Y
3
Y
2
1
Y
h
h
0
X1X2X
Subroutine for calculating
built-in function
(Another equation can be used.)
(REAL MODE)
FORMULA
FORMULA
FORMULA
NEXT
X
3
f = -I J
Goto MAIN
Label NEXT
If Z≠I Goto
SUB2
I M
J N
Label SUB1
ClrT
Print "XN=
Print M
Print "YN=
Print N
Wait
Z+T Z
I S
J O
Goto MAIN
Label SUB2
(Z-S) (J-O) /H+O
P
Z M
P N
Goto SUB1
Label
FORMULA
-I J F
Return
20
Page 28

PARAMETERS
EL-9900 Graphing Calculator
Name of parameter
A
B
F
H
K
O
P
Q
R
Content
value of 1+ (1/2)
value of 1- (1/2)
f (I,J)
step
calculating working area
value of Yn-1
increase of J
value of Qn
value of Rn
Name of parameter
S
T
I
J
Z
X
Y
M
N
Content
value of Xn-1
interval
Xn
Yn
value of increase of X
input of X
input of Y
indicates Xn
indicates Yn
0
0
Exercise
Initial settings: Y = 10 when X = 0. Find J when H = 0.01, T = 0.03 and I = 0.03, 0.06
(The built-in differential equation is F = -I J.)
Set up condition: angle unit in Rad Mode and decimal point in
Float Pt Mode.
2nd F
SET UP
C
CL2B
1
Key Operation
DisplayStep
...
.
Specify the programme mode.
1
Select the title RUNGE.
Enter the values of X0, Y0,
2
H and T.
3
(Display of X1)
(Display of Y1)
4
(Display of X2)
(Display of Y2)
2nd F
A
PRGM
0
ENTER
0
0
ENTER
ENTER
0
•
•
0
ENTER
ENTER
1
1
30
5
(Display of X3)
(Display of Y3)
Similar operation is performed
hereafter.
ENTER
21
Page 29

A
EL-9900 Graphing Calculator
nalysing with One-way Layout Method
Use the one-way layout method to verify whether there is a relation to the results
achieved based on one condition. Analysis of variance is carried out with this method.
Calculation
Analysis of variance chart of one-way layout method
Factor
Error
Total
Sum of squares (S)
SA = [A] - [X]
S
E
= [AS] - [A]
S
T
= [AS] - [X]
Degree of freedom (θ)
θA = A - 1
θ
E
= A (N- 1)
θ
T
= AN - 1
Variance (V)
VA = SA ÷ θ
VE = SE ÷ θ
Variance ratio (F)
A
FA = VA ÷ V
E
E
[X] = (Σ Σ Xij)2 ÷ AN
2
[A] = Σi (Σj Xij)
[AS] = Σi Σj (Xij)
÷ N
2
A : number of levels
N: repeated frequency
X: number of data
FLOWCHART PROGRAMME LIST
Start
LOOP2
Entry of number of levels
and repeat frequency
Declaration of one
variable statistic
LOOP1
Entry of data
Accumulation of data
Accumulation of
square of data
K = K + 1
Y
K ≤ N
N
Display of ΣX
(sum of levels)
Accumulation
of (ΣX)
2
S = S + 1
Y
S
≤
1
N
Calculation of X,Y and Z
Calculation and display
of sum of squares
Calculation and display
of degree of freedom
Calculation and display
of variance
Judgment of repeated frequency
Repeated frequency corresponding
to no. of levels judged.
Title : VARIANCE
Rem INPUT
Enter no. of levels and repeated
frequency.
One variable statistic
(Stat X) declared.
Data and square of data
accumulated.
ΣX (sum of levels) displayed.
ΣX obtained with
statistics feature.
Square of ΣX accumulated.
X, Y and Z calculated.
Sum of squares (E, M, P)
calculated and displayed.
Sum of degree of freedom
Print "Input LEVEL
Input L
L A
Print "Input TIMES
Input T
T N
0 W
0 B
0 C
For S, 1, A, 1
N dim(L1)
For K, 1, N, 1
ClrT
S L
K T
Print "Input DATA
Print "LEVEL
Print L
Print "TIME
Print T
Input I
I L1(K)
B+I B
2
C+I
C
NEXT
1_Stats L1
Σx J
Print "Σx=
Print J
Wait
W+(Σx)
NEXT
Rem CALCULATE
2
B
/A/N X
W/N Y
C Z
(Q, R, D) calculated and
displayed.
Variance (V, U) calculated and displayed.
2
W
(STAT MODE)
Rem SUM OF SQUARES
Y-X E
Z-Y M
Z-X P
Print "SUM OF SQUARES
Print E
Print "ERROR SUM OF SQUARES
Print M
Wait
Print "TOTAL SUM OF SQUARES
Print P
Wait
Rem DEGREES OF FREEDOM
A-1 Q
A (N-1) R
A N-1 D
Print "DEGREES OF FREEDOM
Print Q
Print "
DEGREES OF FREEDOM
Print R
Wait
Print "
SUM OF DEGREES OF FREEDOM
Print D
Wait
Rem VARIANCE
E/Q V
M/R U
Print "VARIANCE
Print V
Print "VARIANCE OF ERRORS
Print U
Wait
Rem VARIANCE RATIO
V/U F
Print "VARIANCE RATIO
Print F
End
ABOUT ERRORS
Calculation and display
of variance ratio
End
22
Variance ratio (F) calculated and displayed.
Page 30

PARAMETERS
EL-9900 Graphing Calculator
Name of parameter
A
I
K
J
N
S
X
Z
F
E
M
P
Content
number of levels
input of data
loop 1 counter
indicating Σx
repeated frequency
loop 2 counter
2
/ a/ n
(ΣΣ xi)
Σi Σj (xij)
variance ratio factor
sum of squares factor
sum of squares error
sum of squares total
2
Name of parameter
V
U
Y
Q
R
D
T
L
W
B
C
Content
variance factor
variance error
2
Σi (Σ jxij)
degree of freedom factor
degree of freedom error
degree of freedom total
input and indicating frequency
input and indicating number of levels
total sum of squares of each level
total sum (all data)
total sum of squares (all data)
/ n
Exercise
When a mouse is given a dosage of hormone, the relationship between dosage amount
and increase of mouse weight is as shown in the following table. Find the analysis of
variance. If the value of the variance ratio is larger than the value of the F- distribution
table at the 5% level of significance, the relationship between the hormone amount
and the increase of mouse weight is a causal relation.
Increase mouse weight (grams/day)
Hormone
(grams/mouse)
10
20
30
10
882
923
933
20
891
915
939
30
864
923
925
40
888
912
940
50
885
930
932
The number of levels (number of columns in the table) is A = 3
The repeated frequency (number of rows in the table ) is N = 5
Set up condition: decimal point in Float Pt Mode.
1
2
3
2nd F
SET UP
CL1C
Specify the programme mode.
Select the title VARIANCE.
Enter the number of levels and
the repeated frequency.
PRGM
3
ENTER
ENTER
Key Operation
A
5
DisplayStep
23
Page 31

EL-9900 Graphing Calculator
Enter the statistical data
4
in level 1.
(Display of total of hormone 10 g)
Enter the statistical data
5
in level 2.
(Display of total of hormone 20 g)
Enter the statistical data
6
in level 3.
(Display of total of hormone 30 g)
Key Operation
2
88
ENTER
88
ENTER
ENTER
19
ENTER
39
ENTER
9
3
ENTER
39
ENTER
8
5
0
9
2
68
ENTER
29
ENTER
19
ENTER
39
ENTER
49
ENTER
4
3
2
3
0
ENTER
ENTER
ENTER
ENTER
ENTER
DisplayStep
198
588
329
529
7
8
9
10
11
ENTER
(Display of sum of squares)
(Display of error sum of squares)
ENTER
(Display of sum of squares)
ENTER
(Display of degrees of freedom)
(Display of degrees of freedom about errors)
ENTER
(Display of sum of degrees of freedom)
ENTER
(Display of variance)
(Display of variance of errors)
12
(Display of variance ratio)
The F-distribution chart shows that the value of F of upper probability P = 5% is 3.89. Since f > 3.98 in this
example, the relationship between the hormone amount and the increase of mouse weight is a causal
relation with 5% level of significance.
24
ENTER
Page 32
EL-9900 Graphing Calculator
w
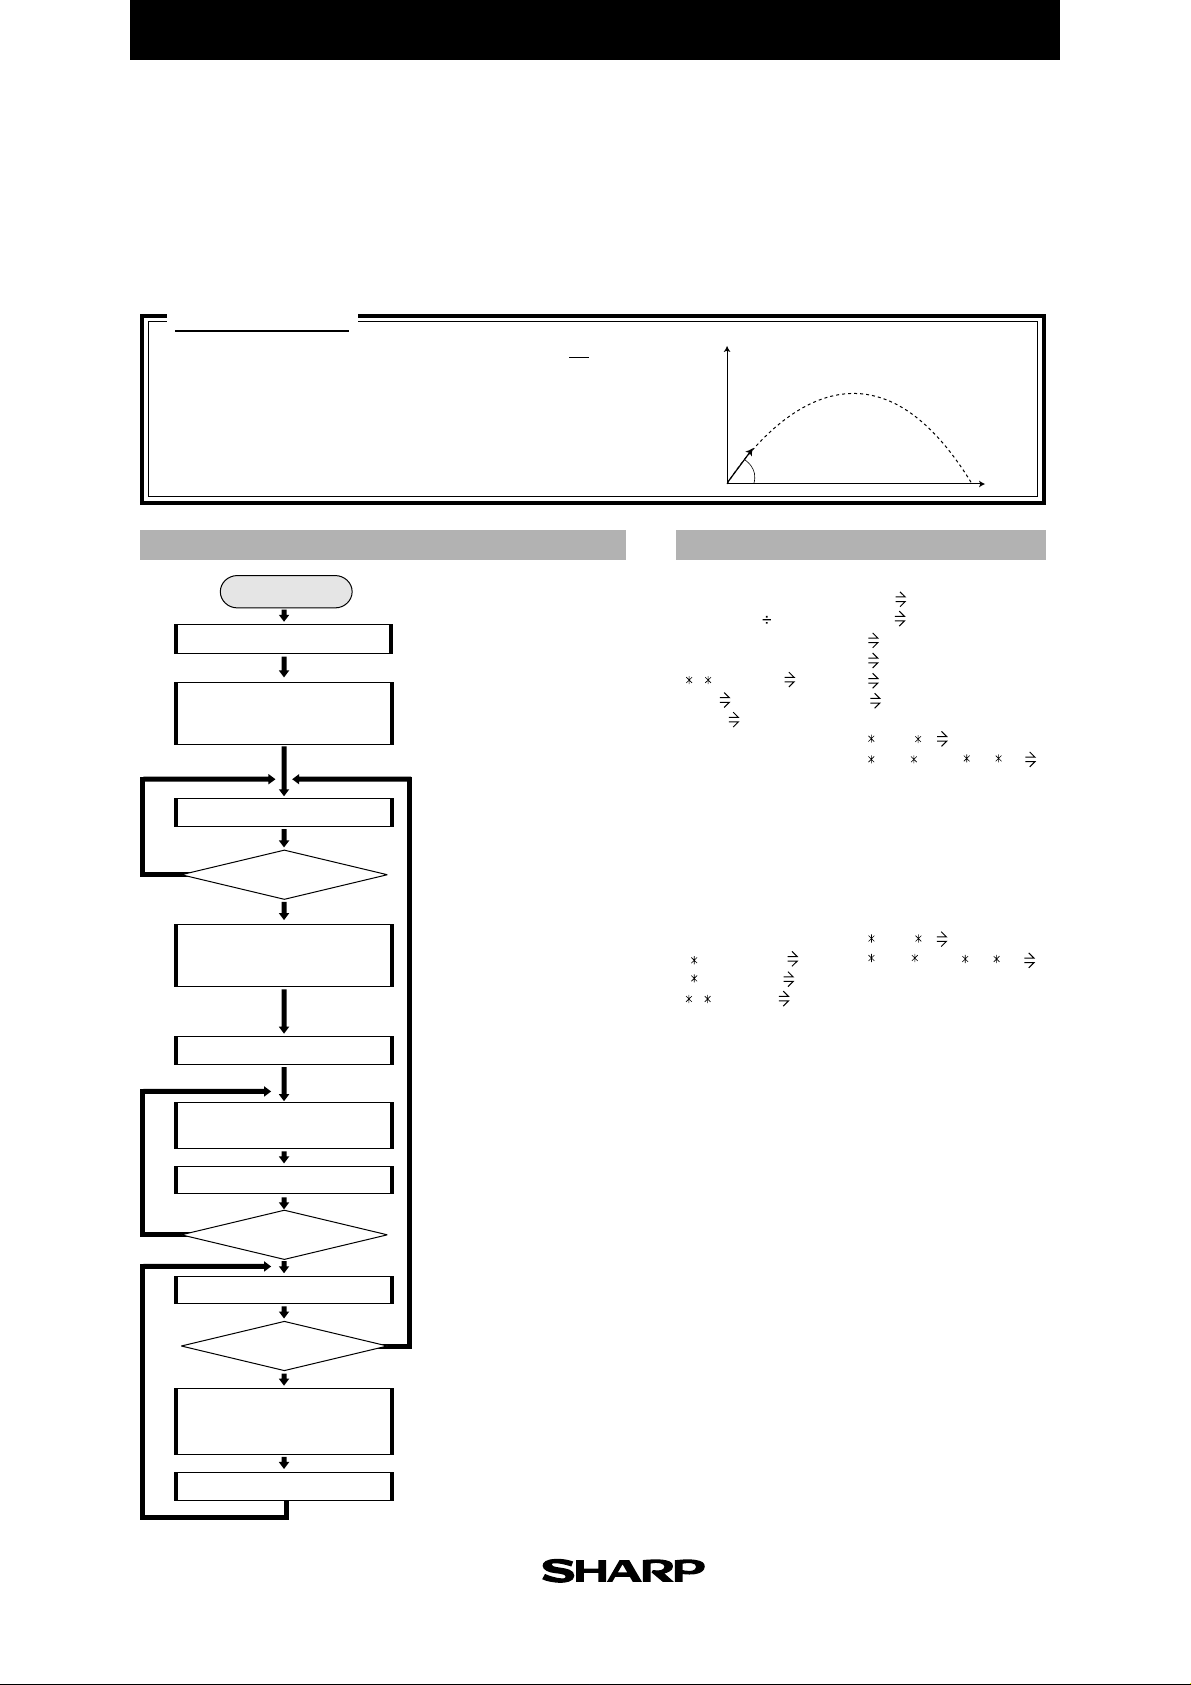
Calculating Parabolic Motion
Display on a graph the altitude change and the horizontal distance over a period of time
hen an object is thrown at initial velocity V0 and angle θ, and find the horizontal
distance and altitude after t seconds. Specify the angle in Deg.
Calculation
•
X = V0
Initial velocity V0 [m/s]
Angle θ [˚ ]
Gravitational acceleration g = 9.8 [m/s
Time T [s]
Entry of initial velocity
Calculation and
display from
released angle 45ß
Entry of released angle
Y
θ≤ 0 or θ> 90
Calculation and
display of values
for entered angle
Range setting
LOOP1
Calculation and
plotting of graph
•
cos θ
T Y = V
FLOWCHART PROGRAMME LIST
Start
THETA
N
•
0
Enter velocity when thrown.
Highest altitude, throwing
distance (horizontal distance),
and time (duration of flight) in
case of released angle 45˚
calculated and displayed.
Angle for throwing entered.
Entered angle less than or equal
to 0˚ or larger than 90˚?
Highest altitude, throwing distance
(horizontal distance), and time
(duration of flight) for entered angle
calculated and displayed.
Range of graph set based on
values for released angle 45˚.
Graph (parabola) calculated
and plotted.
sin θ
2
]
•
T - 1 gT
2
2
y
0
V
θ
Title : PARABOLA
Deg
Print "V0 (M S),θ,T(S)
Print "Input V0
Input V
2 V sin 45/9.8 A
2
/9.8 B
V
2
V
/19.6 C
Print "HMAX=
Print C
Print "LMAX=
Print B
Print "TMAX=
Print A
Wait
Label THETA
Input θ
If θ ≤ 0 Goto THETA
If θ > 90 Goto THETA
2
(sin θ)2/19.6 H
V
2
sin (2θ)/9.8 L
V
2 V sin θ/9.8 T
Print "H=
Print H
Print "L=
Print L
Print "T=
Print T
Wait
x
(REAL MODE)
C/10 Yscl
B/10 Xscl
0 Xmin
0 Ymin
B Xmax
C Ymax
For D, 0, T, T/100
V cos θ D X
V sin θ D-(0.5 9.8 D
Pnt0N(X,Y)
NEXT
Wait
Label TX
Print "Input TX
Input Z
If Z≤0 Goto THETA
If Z>T Goto THETA
V cos θ Z X
V sin θ Z-(0.5 9.8 Z
Print "X=
Print X
Print "Y=
Print Y
Wait
Line(0,Y,X,Y)
Line(X,0,X,Y)
Wait
Goto TX
2
) Y
2
) Y
D = (D + T/100)
Y
D ≤ T
N
Entry of time
Z ≤ 0 or Z > T
N
Calculation and
display of distance
and altitude after time Z.
Display of graph
Elapsed time counted.
Calculation and plotting repeated
until D (time elapsed) reaches
T (duration of flight).
TX
Entered time less than or equal
Y
to 0 or more than T?
Altitude and distance after entered
time elapses from throwing
calculated and displayed.
Returns to entry of time.
25
Page 33
PARAMETERS
EL-9900 Graphing Calculator
Name of parameter
H
L
T
X
Y
D
Yscl
Content
highest altitude
horizontal distance
time
distance (after time Z)
altitude (after time Z)
time elapsed
scale of y-coordinate
Name of parameter
Xscl
Z
V
θ
C
B
A
Content
scale of x-coordinate
input of time period
initial velocity (V
angle (released angle)
highest altitude when released at 90˚
horizontal distance when released at 45˚
time period when released at 45˚
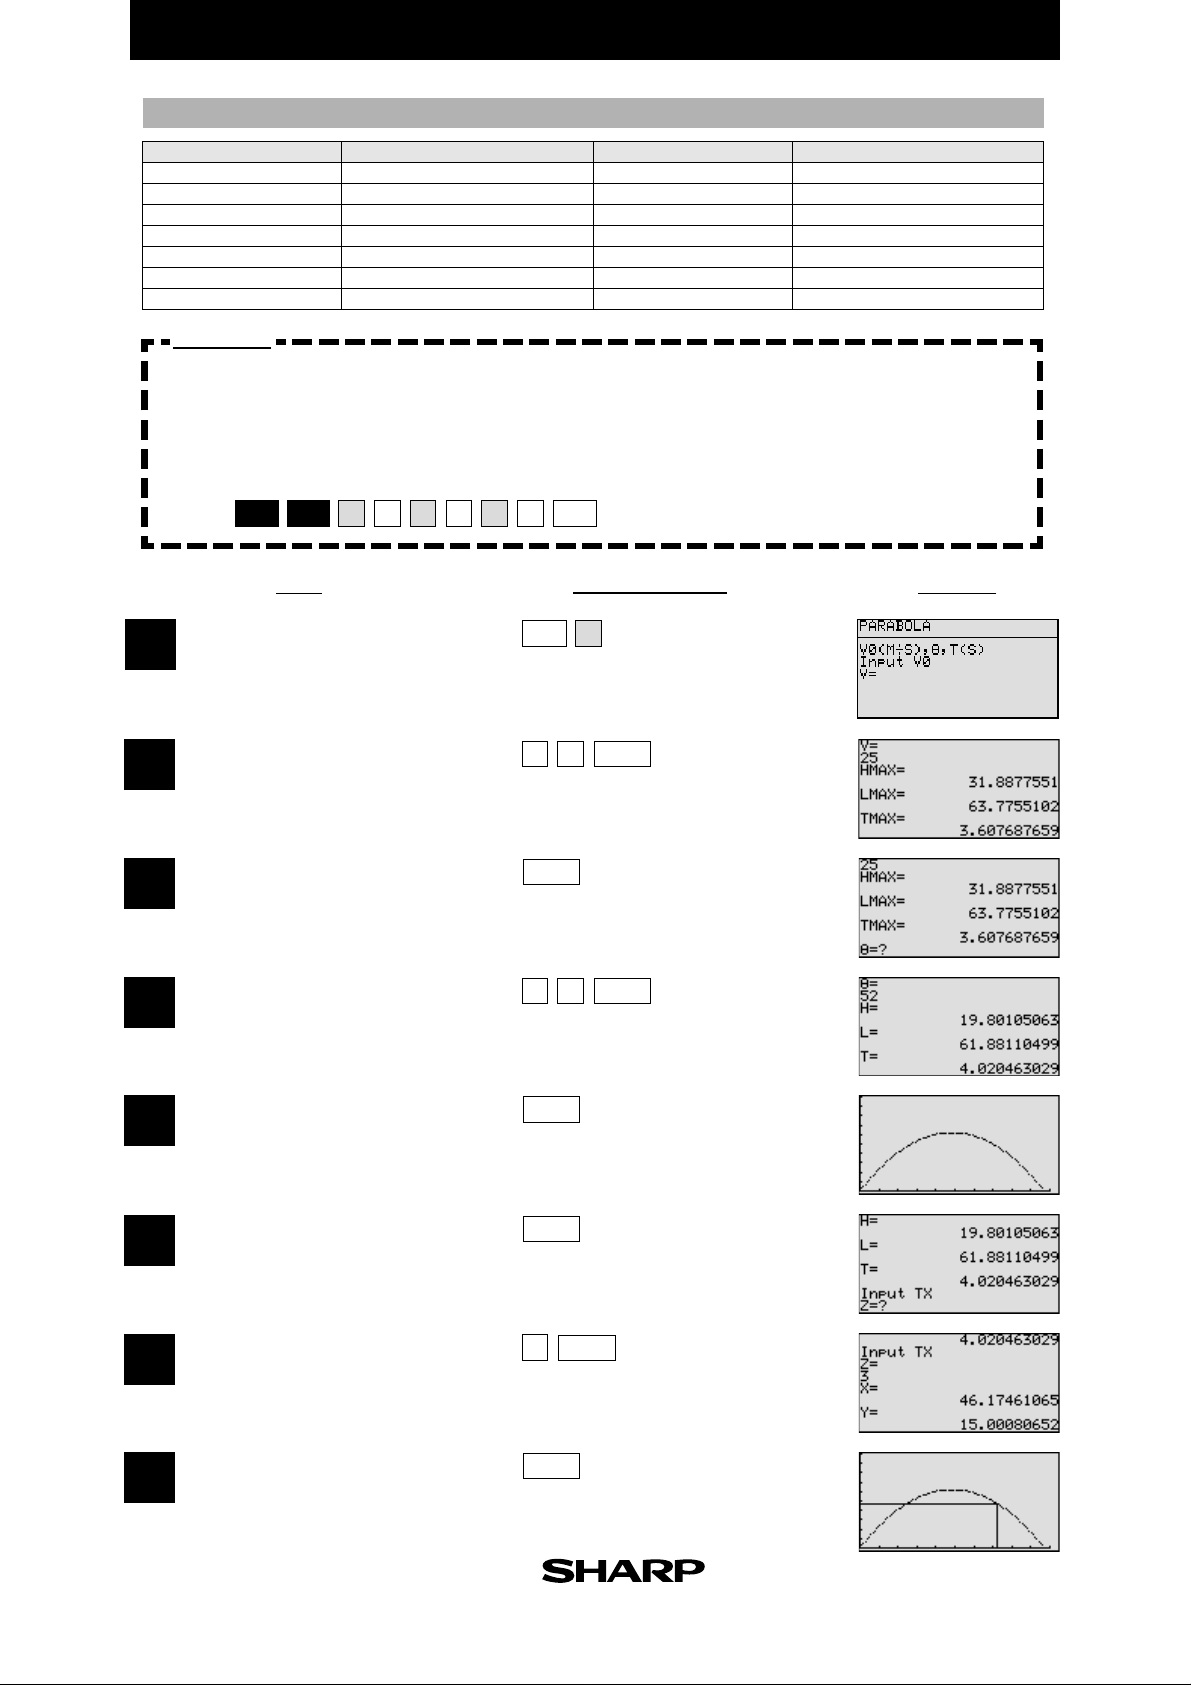
Exercise
Find the horizontal distance and altitude three seconds after an object is thrown, when
the initial velocity is 25m/sec and the angle is 52˚.
Set up condition: angle unit in Deg mode, and decimal point in Float Pt
mode.
2nd F
SET UP
Specify the programme mode.
1
Select the title PARABOLA.
1B1E
1
C
CL
Key Operation
PRGM
A
DisplayStep
0
)
Enter the value of the initial velocity.
2
(Highest altitude when released at 90˚)
(Distance when released at 45˚)
(Time when released at 45˚)
3
Enter the angle value.
4
(Display of highest altitude)
(Display of horizontal distance)
(Display of time until dropping of object)
5
(Display of graph of parabola)
6
25
ENTER
2
5
ENTER
ENTER
ENTER
ENTER
26
Enter the value of time period Z.
7
(Display of distance after Z seconds)
(Display of altitude after Z seconds)
8
(Altitude and distance after Z seconds are
displayed on the parabola graph.)
ENTER
3
ENTER
Page 34
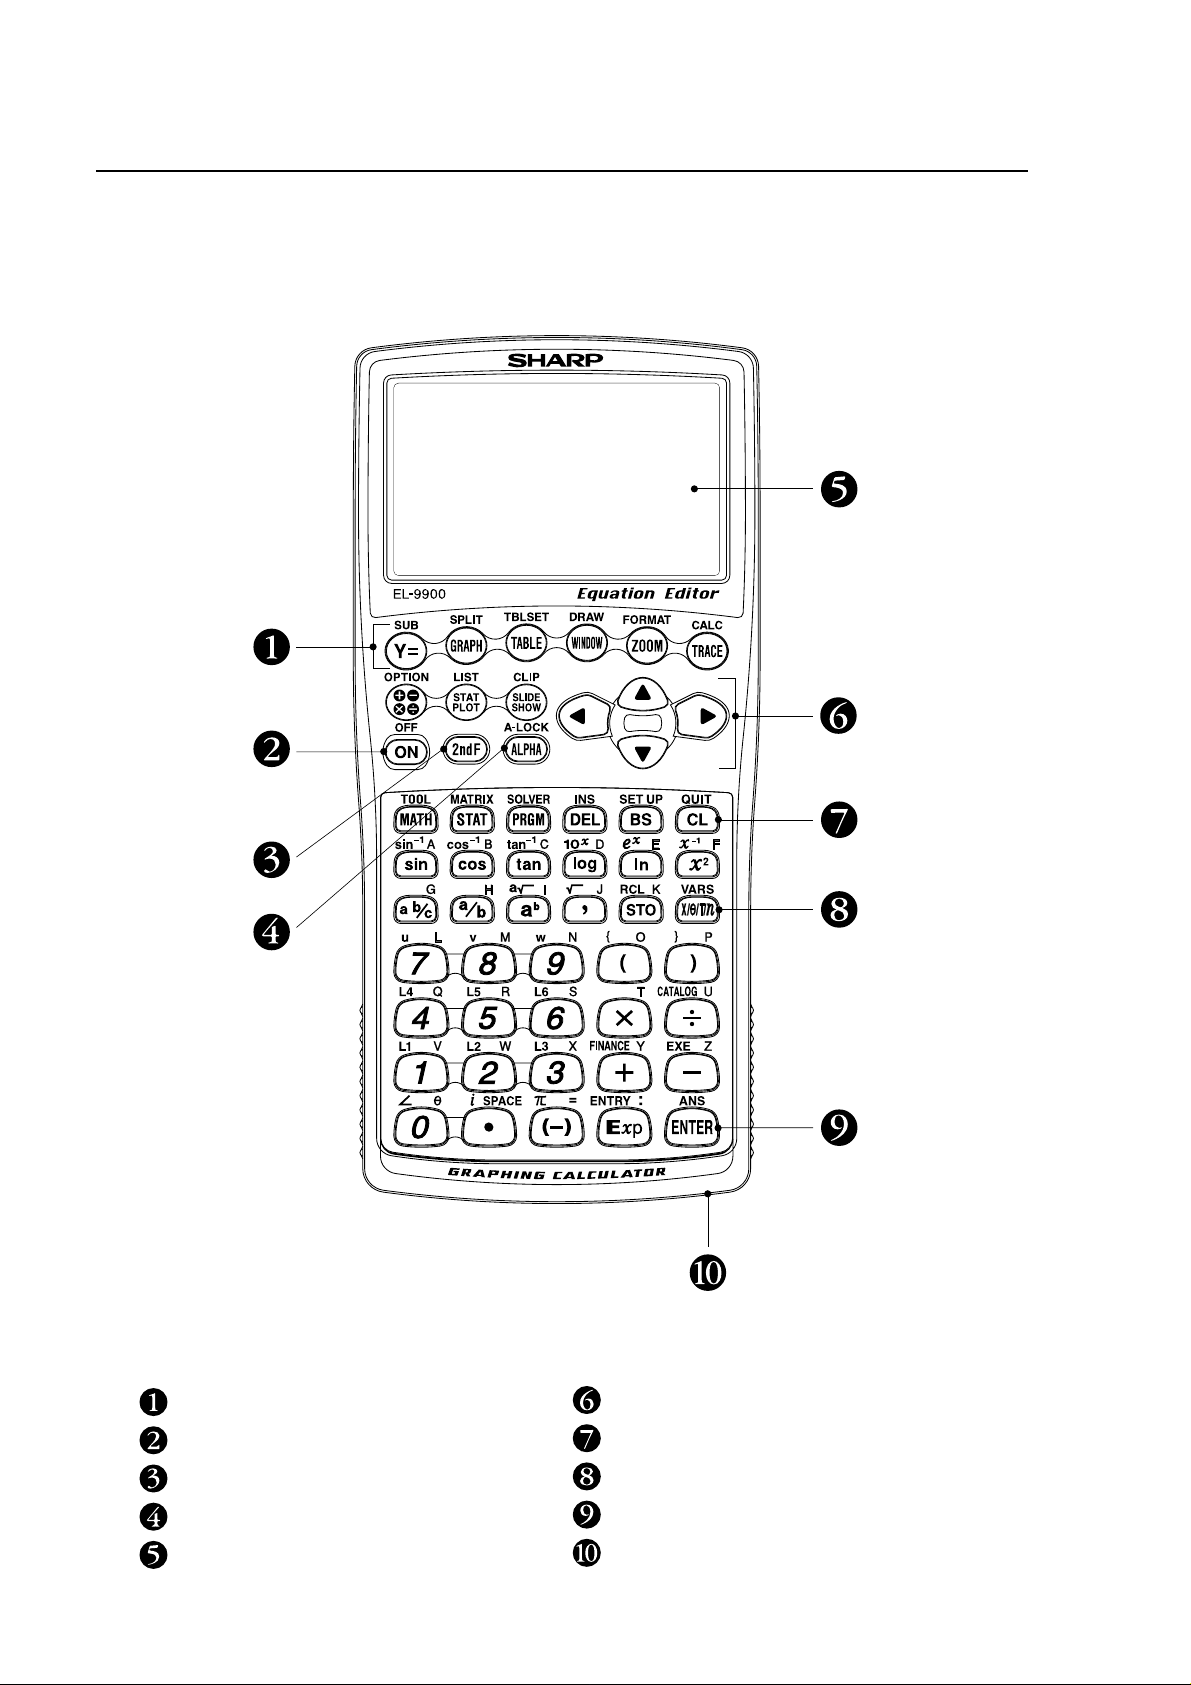
Key pad for the SHARP EL-9900 Calculator
Advanced Keyboard
Graphing keys
Power supply ON/OFF key
Secondary function specification key
Alphabet specification key
Display screen
Cursor movement keys
Clear/Quit key
Variable enter key
Calculation execute key
Communication port for peripheral devices
Page 35
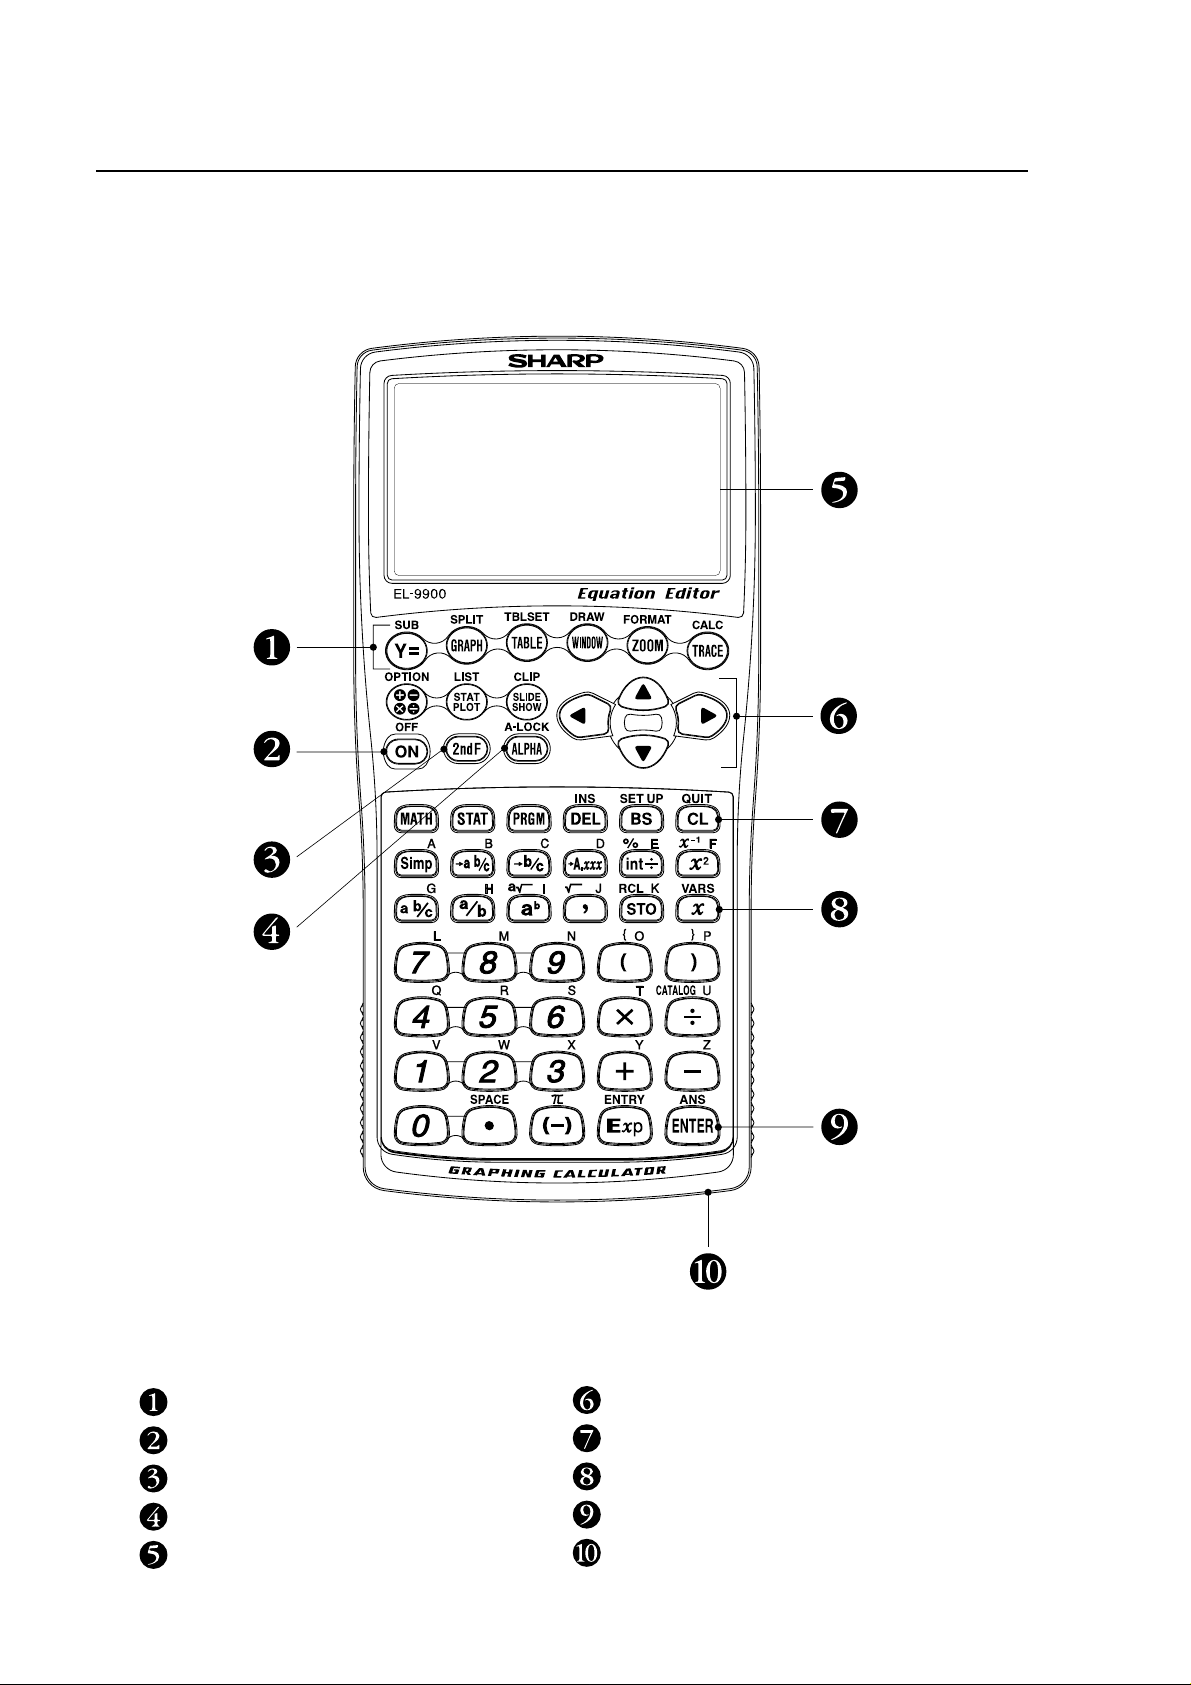
Key pad for the SHARP EL-9900 Calculator
Basic Keyboard
Graphing keys
Power supply ON/OFF key
Secondary function specification key
Alphabet specification key
Display screen
Cursor movement keys
Clear/Quit key
Variable enter key
Calculation execute key
Communication port for peripheral devices
Page 36
○○○○○○○○○○○○○○○○○○○○○○○○○○○○○○○○○○○○○○○○○○○○○○○○○○○○○○○○○○○○○○○○○○○○○○○○○○○○○○○○○○○○○○○○○○○○○○○○○○○○○○○○○○
Use this form to send us your contribution
Dear Sir/Madam
We would like to take this opportunity to invite you to create a mathematical problem which can be solved
with the SHARP EL-9900 graphing calculator, including the necessary procedures and definitions as outlined in the form below.
For this purpose, we would be grateful if you could complete the form and return it to us by fax or mail.
If your contribution is chosen, your name will be included in the next edition of The EL-9900 Graphing
Calculator Handbook or on our homepage. We regret that we are unable to return contributions. Also,
please note that the problems you send us might be opened to the public at Sharp’s home page.
We thank you for your cooperation in this project.
Name: ( Mr. Ms.
)
School/College/Univ.:
Address:
Post Code: Country:
Phone: Fax:
E-mail:
SUBJECT: Write either a title or about the subject matter.
○○○○○○○○○○○○○○○○○○○○○○○○○○○○○○○○○○○○○○○○○○○○○○○○○○○○○○○○○○○
INTRODUCTION and CALCULATION:
Write a brief explanation of the subject, and the formula with definitions, including a diagram if relevant.
○○○○○○○○○○○○○○○○○○○○○○○○○○○○○○○○○○○○○○○○○○○○○○○○○○○○○○○○○○○
○○○○○○○○○○○○○○○○○○○○○○○○○○○○○○○○○○○○○○○○○○○○○○○○○○○○○○○○○○○
○○○○○○○○○○○○○○○○○○○○○○○○○○○○○○○○○○○○○○○○○○○○○○○○○○○○○○○○○○○
○○○○○○○○○○○○○○○○○○○○○○○○○○○○○○○○○○○○○○○○○○○○○○○○○○○○○○○○○○○
○○○○○○○○○○○○○○○○○○○○○○○○○○○○○○○○○○○○○○○○○○○○○○○○○○○○○○○○○○○
○○○○○○○○○○○○○○○○○○○○○○○○○○○○○○○○○○○○○○○○○○○○○○○○○○○○○○○○○○○
○○○○○○○○○○○○○○○○○○○○○○○○○○○○○○○○○○○○○○○○○○○○○○○○○○○○○○○○○○○
○○○○○○○○○○○○○○○○○○○○○○○○○○○○○○○○○○○○○○○○○○○○○○○○○○○○○○○○○○○
○○○○○○○○○○○○○○○○○○○○○○○○○○○○○○○○○○○○○○○○○○○○○○○○○○○○○○○○○○○
○○○○○○○○○○○○○○○○○○○○○○○○○○○○○○○○○○○○○○○○○○○○○○○○○○○○○○○○○○○
SHARP Graphing Calculator
Page 37
○ ○○○○○○○○○○○○○○○○○○○○○○○○○○○○○○○○○○○○○○○○○○○○○○○○○○○○○○○○○○○○○○○○○○○○○○○○○○○○○○○○○○○○○○○○○○○○○○○○○○○○○○○○○
PARAMETERS:
Define the parameters used in the programme.
○○○○○○○○○○○○○○○○○○○○○○○○○
○○○○○○○○○○○○○○○○○○○○○○○○○
○○○○○○○○○○○○○○○○○○○○○○○○○
○○○○○○○○○○○○○○○○○○○○○○○○○
○○○○○○○○○○○○○○○○○○○○○○○○○
○○○○○○○○○○○○○○○○○○○○○○○○○
○○○○○○○○○○○○○○○○○○○○○○○○○
○○○○○○○○○○○○○○○○○○○○○○○○○
○○○○○○○○○○○○○○○○○○○○○○○○○
○○○○○○○○○○○○○○○○○○○○○○○○○
○○○○○○○○○○○○○○○○○○○○○○○○○
○○○○○○○○○○○○○○○○○○○○○○○○○
○○○○○○○○○○○○○○○○○○○○○○○○○
PROGRAMME LIST:
List the procedure of data to be entered.
○○○○○○○○○○○○○○○○○○○○○○○○○○○○○○○○
○○○○○○○○○○○○○○○○○○○○○○○○○○○○○○○○
○○○○○○○○○○○○○○○○○○○○○○○○○○○○○○○○
○○○○○○○○○○○○○○○○○○○○○○○○○○○○○○○○
○○○○○○○○○○○○○○○○○○○○○○○○○○○○○○○○
○○○○○○○○○○○○○○○○○○○○○○○○○○○○○○○○
○○○○○○○○○○○○○○○○○○○○○○○○○○○○○○○○
○○○○○○○○○○○○○○○○○○○○○○○○○○○○○○○○
○○○○○○○○○○○○○○○○○○○○○○○○○○○○○○○○
○○○○○○○○○○○○○○○○○○○○○○○○○○○○○○○○
○○○○○○○○○○○○○○○○○○○○○○○○○○○○○○○○
○○○○○○○○○○○○○○○○○○○○○○○○○○○○○○○○
○○○○○○○○○○○○○○○○○○○○○○○○○○○○○○○○
○○○○○○○○○○○○○○○○○○○○○○○○○
○○○○○○○○○○○○○○○○○○○○○○○○○○○○○○○○
○○○○○○○○○○○○○○○○○○○○○○○○○○○○○○○○
○○○○○○○○○○○○○○○○○○○○○○○○○○○○○○○○
EXERCISE and SET UP CONDITION:
Include an example of a problem which can be solved with the
formula. Write a step-by-step guide to solving the pr oblem with
an explanation. Detail any important conditions to be set up
before solving the problem.
○○○○○○○○○○○○○○○○○○○○○○○○○
○○○○○○○○○○○○○○○○○○○○○○○○○
○○○○○○○○○○○○○○○○○○○○○○○○○
○○○○○○○○○○○○○○○○○○○○○○○○○
○○○○○○○○○○○○○○○○○○○○○○○○○
○○○○○○○○○○○○○○○○○○○○○○○○○
○○○○○○○○○○○○○○○○○○○○○○○○○
○○○○○○○○○○○○○○○○○○○○○○○○○
○○○○○○○○○○○○○○○○○○○○○○○○○
○○○○○○○○○○○○○○○○○○○○○○○○○○○○○○○○
○○○○○○○○○○○○○○○○○○○○○○○○○○○○○○○○
○○○○○○○○○○○○○○○○○○○○○○○○○○○○○○○○
○○○○○○○○○○○○○○○○○○○○○○○○○○○○○○○○
○○○○○○○○○○○○○○○○○○○○○○○○○○○○○○○○
○○○○○○○○○○○○○○○○○○○○○○○○○○○○○○○○
○○○○○○○○○○○○○○○○○○○○○○○○○○○○○○○○
○○○○○○○○○○○○○○○○○○○○○○○○○○○○○○○○
○○○○○○○○○○○○○○○○○○○○○○○○○○○○○○○○
○○○○○○○○○○○○○○○○○○○○○○○○○○○○○○○○
○○○○○○○○○○○○○○○○○○○○○○○○○○○○○○○○
○○○○○○○○○○○○○○○○○○○○○○○○○○○○○○○○
○○○○○○○○○○○○○○○○○○○○○○○○○
○○○○○○○○○○○○○○○○○○○○○○○○○
○○○○○○○○○○○○○○○○○○○○○○○○○
○○○○○○○○○○○○○○○○○○○○○○○○○
○○○○○○○○○○○○○○○○○○○○○○○○○
○○○○○○○○○○○○○○○○○○○○○○○○○
○○○○○○○○○○○○○○○○○○○○○○○○○
SHARP CORPORATION Osaka, Japan
Fax:
SHARP Graphing Calculator
Page 38

SHARP CORPORATION OSAKA,JAPAN
 Loading...