

Shark 50, 100, 100T, 100B Installation & Operation Manual

Shark
100/100T/100B/50
MULTIFUNCTION
METER
100
®
MULTIFUNCTION
METER
50
®
BACNET METER
100B
®
MULTIFUNCTION
TRANSDUCER
100T
®

This page intentionally left blank.

Electro Industries/GaugeTech
The Leader In Power Monitoring and Smart Grid Solutions
Electro Industries/GaugeTech
The Leader In Power Monitoring and Smart Grid Solutions
Shark® 100/100T/100B/50 Meter Installation and Operation Manual Version 1.25
Published by:
Electro Industries/GaugeTech
1800 Shames Drive
Westbury, NY 11590
All rights reserved. No part of this publication may be reproduced or transmitted in
any form or by any means, electronic or mechanical, including photocopying, recording, or information storage or retrieval systems or any future forms of duplication, for
any purpose other than the purchaser's use, without the expressed written permission
of Electro Industries/GaugeTech.
© 2014 Electro Industries/GaugeTech
Nexus® and Shark® are registered trademarks of Electro Industries/GaugeTech. The
distinctive shape, style, and overall appearances of all Shark® meters are tr ademarks
of Electro Industries/GaugeTech. Communicator EXT
TM
is a trademark of Electro
Industries/GaugeTech.
Windows® is a registered trademark of Microsoft Corporation in the United States
and/or other countries.
BACnet® is a registered trademark of ASHRAE.
Modbus® is a registered trademark of Schneider Electric, licensed to the Modus
Organization, Inc.
Doc# E145701 i

Electro Industries/GaugeTech
The Leader In Power Monitoring and Smart Grid Solutions
Electro Industries/GaugeTech
The Leader In Power Monitoring and Smart Grid Solutions
This page intentionally left blank.
Doc# E145701 ii

Electro Industries/GaugeTech
The Leader In Power Monitoring and Smart Grid Solutions
Electro Industries/GaugeTech
The Leader In Power Monitoring and Smart Grid Solutions
Customer Service and Support
Customer support is available 9:00 am to 4:30 pm, Eastern Standard Time, Monday
through Friday. Please have the model, serial number and a detai led probl em description available. If the problem concerns a particular reading, please have all meter
readings available. When returning any merchandise to EIG, a return materials
authorization number is required. For customer or technical assistance, repair or
calibration, phone 516-334-0870 or fax 516-338-4741.
Product Warranty
Electro Industries/Gauge Tech warrants all products to be free from defects in material
and workmanship for a period of four years from the date of shipment. During the
warranty period, we will, at our option, either repair or replace any product that
proves to be defective.
To exercise this warranty, fax or call our customer-support department. You will
receive prompt assistance and return instructions. Send the instrument, transportation prepaid, to EIG at 1800 Shames Drive, W estbury, NY 11590. Repairs will be made
and the instrument will be returned.
This warranty does not apply to defects resulting from unauthorized modification,
misuse, or use for any reason other than electrical power monitoring. The Shark
100/100T/100B/50 meter is not a user-serviceable product.
®
THIS WARRANTY IS IN LIEU OF ALL OTHER WARRANTIES, EXPRESSED
OR IMPLIED, INCLUDING ANY IMPLIED WARRANTY OF MERCHANTABILITY OR FITNESS FOR A PARTICULAR PURPOSE. ELECTRO INDUSTRIES/
GAUGETECH SHALL NOT BE LIABLE FOR ANY INDIRECT, SPECIAL OR
CONSEQUENTIAL DAMAGES ARISING FROM ANY AUTHORIZED OR
UNAUTHORIZED USE OF ANY ELECTRO INDUSTRIES/GAUGETECH
PRODUCT. LIABILITY SHALL BE LIMITED TO THE ORIGINAL COST OF
THE PRODUCT SOLD.
Doc# E145701 iii
Electro Industries/GaugeTech
The Leader In Power Monitoring and Smart Grid Solutions
Electro Industries/GaugeTech
The Leader In Power Monitoring and Smart Grid Solutions
Use of Product for Protection
Our products are not to be used for primary over-current protection. Any protection
feature in our products is to be used for alarm or secondary protection only.
Statement of Calibration
Our instruments are inspected and tested in accordance with specifications publi shed
by Electro Industries/GaugeTech. The accuracy and a calibration of our instruments
are traceable to the National Institute of Standards and Technology through
equipment that is calibrated at planned interv als by comparison to certified standards.
For optimal performance, EIG recommends that any meter, including those manufactured by EIG, be verified for accuracy on a yearly interval using NIST traceable accuracy standards.
Disclaimer
The information presented in this publication has been carefully checked for reliability; however, no responsibility is assumed for inaccuracies. The information contained
in this document is subject to change without notice.
This symbol indicates that the operator must refer must to an
important WARNING or CAUTION in the oper ating instructions.
Please see Chapter 4 for important safety information regard-
ing installation and hookup of the Shark® 50/100/100B meter.
Dans ce manuel, ce symbole indique que l’opérateur doit se référer à un important
AVERTISSEMENT ou une MISE EN GARDE dans les instructions opérationnelles. Veuillez consulter le chapitre 4 pour des informations importantes relatives à l’installation
et branchement du compteur.
The following safety symbols may be used on the meter itself:
Les symboles de sécurité suivante peuvent être utilisés sur le compteur même:
This symbol alerts you to the presence of high voltage, which can
cause dangerous electrical shock.
Ce symbole vous indique la présence d’une haute tension qui peut
provoquer une décharge électrique dangereuse.
This symbol indicates the field wiring terminal that must be connected
to earth ground before operating the meter, which protects against
electrical shock in case of a fault condition.
Doc# E145701 iv

Electro Industries/GaugeTech
The Leader In Power Monitoring and Smart Grid Solutions
Electro Industries/GaugeTech
The Leader In Power Monitoring and Smart Grid Solutions
Ce symbole indique que la borne de pose des canalisations in-situ qui doit être
branchée dans la mise à terre avant de faire fonctionner le compteur qui est protégé
contre une décharge électrique ou un état défectueux.
This symbol indicates that the user must refer to this manual for
specific WARNING or CAUTION information to avoid personal injury or
damage to the product.
Ce symbole indique que l'utilisateur doit se référer à ce manuel pour AVERTISSEMENT
ou MISE EN GARDE l'information pour éviter toute blessure ou tout endommagement
du produit.
About Electro Industries/GaugeTech (EIG)
Founded in 1975 by engineer and inventor Dr. Samuel Kagan, Electro Industries/
Gauge Tech changed the face of power monitoring forever with its first breakthrough
innovation: an affordable, easy-to-use AC power meter.
Thirty years since its founding, Electro Industries/GaugeTech, the leader in power
monitoring and control, continues to revolutionize the industry with the highest quality, cutting edge power monitoring and control technology on the market today. An
ISO 9001:2000 certified company, EIG sets the industry standard for advanced power
quality and reporting, revenue metering and substation data acquisition and control.
EIG products can be found on site at mainly all of today's leading manufacturers,
industrial giants and utilities.
EIG products are primarily designed, manufactured, tested and calibrated at our facility in Westbury, New York.
Doc# E145701 v

Electro Industries/GaugeTech
The Leader In Power Monitoring and Smart Grid Solutions
Electro Industries/GaugeTech
The Leader In Power Monitoring and Smart Grid Solutions
This page intentionally left blank.
Doc# E145701 vi

Electro Industries/GaugeTech
The Leader In Power Monitoring and Smart Grid Solutions
Electro Industries/GaugeTech
The Leader In Power Monitoring and Smart Grid Solutions
Table of Contents
Customer Service and Support iii
Product Warranty iii
Use of Product for Protection iv
Statement of Calibration iv
Disclaimer iv
About Electro Industries/GaugeTech (EIG) v
1: Three-Phase Power Measurement 1-1
1.1: Three-Phase System Configurations 1-1
Table of Contents
1.1.1: Wye Connection 1-1
1.1.2: Delta Connection 1-4
1.1.3: Blondel’s Theorem and Three Phase Measurement 1-6
1.2: Power, Energy and Demand 1-8
1.3: Reactive Energy and Power Factor 1-12
1.4: Harmonic Distortion 1-14
1.5: Power Quality 1-17
2: Meter Overview and Specifications 2-1
2.1: Hardware Overview 2-1
2.1.1: Voltage and Current Inputs 2-3
2.1.2: Model Number plus Option Numbers 2-4
2.1.3: V-Switch
TM
Technology 2-6
2.1.4: Measured Values 2-8
2.1.5: Utility Peak Demand 2-9
Doc# E145701 TOC - 1

Table of Contents
Electro Industries/GaugeTech
The Leader In Power Monitoring and Smart Grid Solutions
Electro Industries/GaugeTech
The Leader In Power Monitoring and Smart Grid Solutions
2.2: Specifications 2-9
2.3: Compliance 2-15
2.4: Accuracy 2-16
3: Mechanical Installation 3-1
3.1: Introduction 3-1
3.2: ANSI Installation Steps 3-4
3.3: DIN Installation Steps 3-5
3.4: Shark® 100T Transducer Installation 3-6
4: Electrical Installation 4-1
4.1: Considerations When Installing Meters 4-1
4.2: CT Leads Terminated to Meter 4-4
4.3: CT Leads Pass Through (No Meter Termination) 4-5
4.4: Quick Connect Crimp-on Terminations 4-6
4.5: Voltage and Power Supply Connections 4-7
4.6: Ground Connections 4-7
4.7: Voltage Fuses 4-7
4.8: Electrical Connection Diagrams 4-8
4.9: Extended Surge Protection for Substation Instrumentation 4-21
5: Communication Installation 5-1
5.1: Shark® 100/50 Meter Serial Based Communication 5-1
5.1.1: IrDA Port (Com 1) 5-2
5.1.2: RS485/KYZ Output Com 2 (485P Option) 5-3
5.1.2.1: Using the Unicom 2500 5-7
Doc# E145701 TOC - 2

Table of Contents
Electro Industries/GaugeTech
The Leader In Power Monitoring and Smart Grid Solutions
Electro Industries/GaugeTech
The Leader In Power Monitoring and Smart Grid Solutions
5.2: Configuring the Shark® 100 - INP10
Ethernet Connection 5-8
5.2.1: Setting up the Host PC to Communicate with
the Shark® 100 - INP10 meter 5-9
5.2.1.1: Configuring the Host PC's Ethernet Adapter through
Windows© 5-9
5.2.2: Setting up the Shark® 100 - INP10 Meter
for Ethernet Communication 5-11
5.2.2.1: Configuring the Shark® 100 - INP10 Meter's
Ethernet Connection on the Host Computer 5-12
5.2.2.2: Resetting the Ethernet Card (INP10) 5-14
5.3: Shark® 100B Meter Ethernet Configuration 5-14
6: Using the Shark® 100/50 Meter 6-1
6.1: Programming the Shark® 100/100B/50 Meter Using the
Faceplate 6-1
6.1.1: Understanding Meter Face Elements 6-1
6.1.2: Understanding Meter Face Buttons 6-2
6.2: Using the Front Panel 6-3
6.2.1: Understanding Startup and Default Displays 6-3
6.2.2: Using the Main Menu 6-4
6.2.3: Using Reset Mode 6-5
6.2.4: Entering a Password 6-6
6.2.5: Using Configuration Mode 6-7
6.2.5.1: Configuring the Scroll Feature 6-9
6.2.5.2: Configuring CT Setting 6-10
Doc# E145701 TOC - 3

Table of Contents
Electro Industries/GaugeTech
The Leader In Power Monitoring and Smart Grid Solutions
Electro Industries/GaugeTech
The Leader In Power Monitoring and Smart Grid Solutions
6.2.5.3: Configuring PT Setting 6-11
6.2.5.4: Configuring Connection Setting 6-13
6.2.5.5: Configuring Communication Port Setting 6-13
6.2.6: Using Operating Mode 6-15
6.3: Understanding the % of Load Bar 6-16
6.4: Performing Watt-Hour Accuracy Testing (Verification) 6-17
6.5: Programming the Transducer or Meter Using Software 6-19
6.5.1: Accessing the Transducer/Meter in Default
Communication Mode (RS485 Communication) 6-19
6.5.2: Connecting to the Transducer/Meter through
Communicator EXT
TM
Software 6-20
6.5.3: Device Profile Settings 6-24
7: Using the Shark® 100B Meter 7-1
7.1: Introduction 7-1
7.1.1: About BACnet 7-1
7.2: Shark® 100B meter’s BACnet Objects 7-2
7.3: Configuring the Shark® 100B Meter 7-5
7.4: Using the Shark® 100B Meter’s Web Interface 7-12
7.5: Using the Shark® 100B in a BACnet Application 7-18
A: Shark® 100/50 Meter Navigation Maps A-1
A.1: Introduction A-1
A.2: Navigation Maps (Sheets 1 to 4) A-1
B: Shark® 100 and 50 Meter Modbus Map B-1
B.1: Introduction B-1
Doc# E145701 TOC - 4

Table of Contents
Electro Industries/GaugeTech
The Leader In Power Monitoring and Smart Grid Solutions
Electro Industries/GaugeTech
The Leader In Power Monitoring and Smart Grid Solutions
B.2: Modbus Register Map Sections B-1
B.3: Data Formats B-1
B.4: Floating Po i nt Values B-2
B.5: Modbus Register Map B-3
C: Shark® 100 Meter DNP Map C-1
C.1: Introduction C-1
C.2: DNP Mapping (DNP-1 to DNP-2) C-1
D: DNP 3.0 Protocol Assignments D-1
D.1: DNP Implementation D-1
D.2: Data Link Layer D-2
D.3: Transport Layer D-3
D.4: Application Layer D-3
D.4.1: Object and Va riation D-4
D.4.1.1: Binary Output Status (Obj. 10, Var. 2) D-5
D.4.1.2: Control Relay Output Block (Obj. 12, Var. 1) D-6
D.4.1.3: 32-Bit Binary Counter Without Flag (Obj. 20, Var. 5) D-7
D.4.1.4: 16-Bit Analog Input Without Flag (Obj. 30, Var. 4) D-7
D.4.1.5: Class 0 Data (Obj. 60, Var. 1) D-13
D.4.1.6: Internal Indications (Obj. 80, Var. 1) D-13
E: Using the USB to IrDA Adapter CAB6490 E-1
E.1: Introduction E-1
E.2: Installation Procedures E-1
Doc# E145701 TOC - 5

Table of Contents
Electro Industries/GaugeTech
The Leader In Power Monitoring and Smart Grid Solutions
Electro Industries/GaugeTech
The Leader In Power Monitoring and Smart Grid Solutions
This page intentionally left blank.
Doc# E145701 TOC - 6

1: Three-Phase Power Measurement
Electro Industries/GaugeTech
The Leader In Power Monitoring and Smart Grid Solutions
Electro Industries/GaugeTech
The Leader In Power Monitoring and Smart Grid Solutions
1: Three-Phase Power Measurement
This introduction to three-phase power and power measurement is intended to
provide only a brief overview of the subject. The professional meter engineer or meter
technician should refer to more advanced documents such as the EEI Handbook for
Electricity Metering and the application standards for more in-depth and technical
coverage of the subject.
1.1: Three-Phase System Configurations
Three-phase power is most commonly used in situations where large amounts of
power will be used because it is a more effective way to transmit the power and
because it provides a smoother delivery of power to the end load. There are two
commonly used connections for three-phase power, a wye connection or a delta
connection. Each connection has several different manifestations in actual use.
When attempting to determine the type of connection in use, it is a good practice to
follow the circuit back to the transformer that is serving the circuit. It is often not
possible to conclusively determine the correct circuit connection simply by counting
the wires in the service or checking voltages. Checking the transformer connection
will provide conclusive evidence of the circuit connection and the relationships
between the phase voltages and ground.
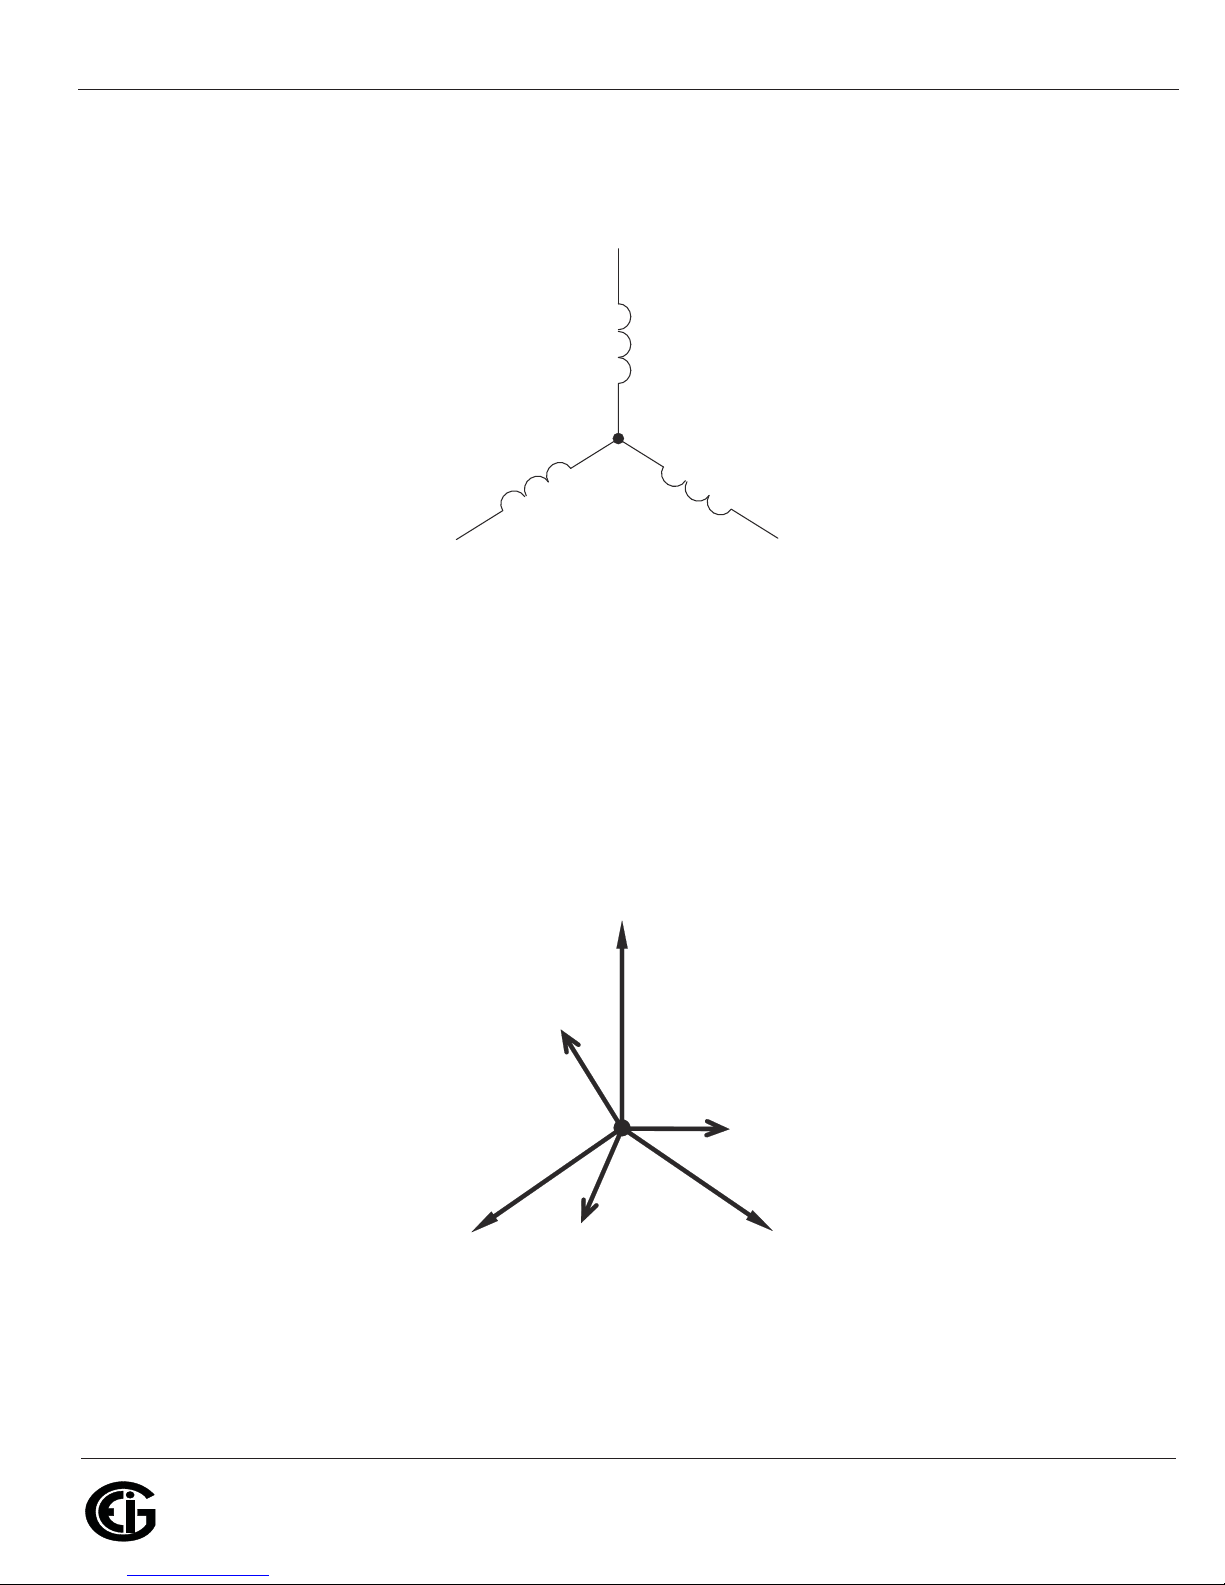
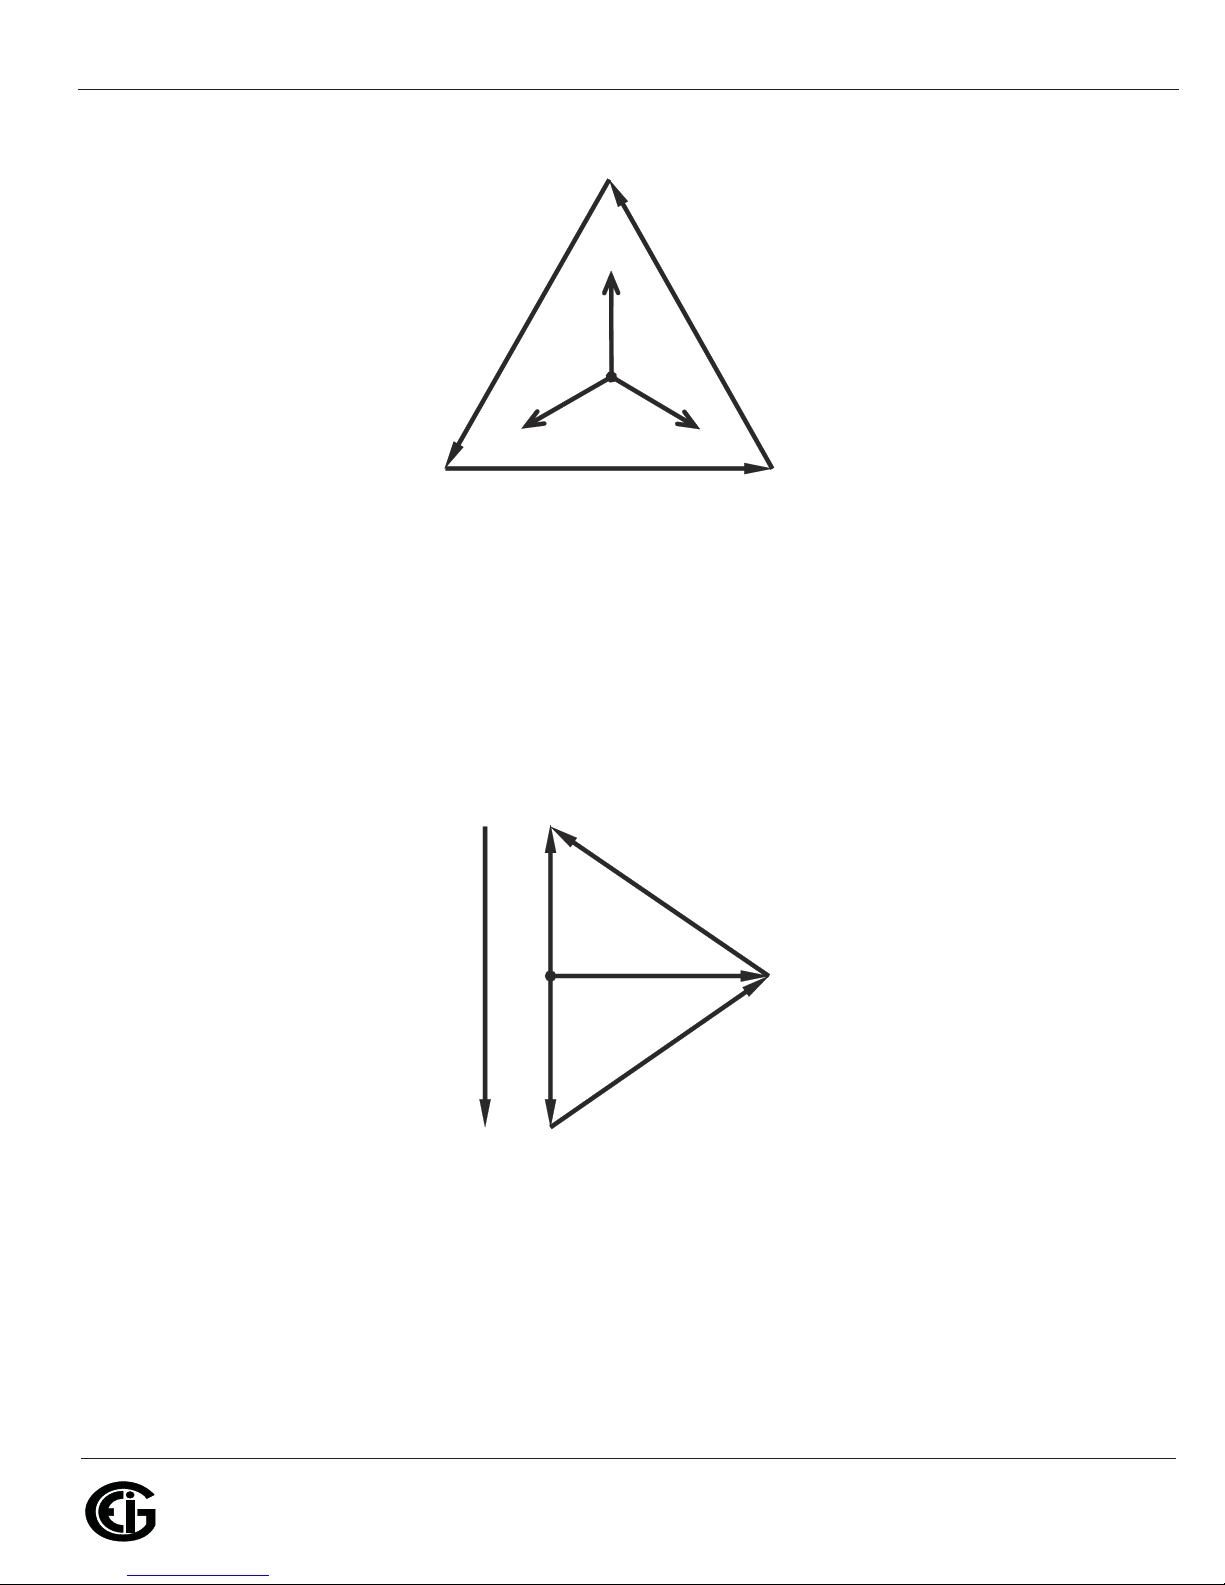
1.1.1: Wye Connection
The wye connection is so called because when you look at the phase relationships and
the winding relationships between the phases it looks like a Y. Figure 1.1 depicts the
winding relationships for a wye-connected service. In a wye service the neutral (or
center point of the wye) is typically grounded. This leads to common voltages of 208/
120 and 480/277 (where the first number represents the phase-to-phase voltage and
the second number represents the phase-to-ground voltage).
Doc# E145701 1-1
1: Three-Phase Power Measurement
Electro Industries/GaugeTech
The Leader In Power Monitoring and Smart Grid Solutions
Electro Industries/GaugeTech
The Leader In Power Monitoring and Smart Grid Solutions
V
A
V
B
Phase 3
Phase 2
V
B
Figure 1.1: Three-phase Wye Winding
The three voltages are separated by 120o electrically. Under balanced load conditions
the currents are also separated by 120
conditions can cause the currents to depart from the ideal 120
V
C
N
Phase 1
o
. However, unbalanced loads and other
V
A
o
separation. Three-
phase voltages and currents are usually represented with a phasor diagram. A phasor
diagram for the typical connected voltages and currents is shown in Figure 1.2.
V
C
I
C
N
I
A
I
B
Figure 1.2: Phasor Diagram Showing Three-phase Voltages and Currents
Doc# E145701 1-2
1: Three-Phase Power Measurement
Electro Industries/GaugeTech
The Leader In Power Monitoring and Smart Grid Solutions
Electro Industries/GaugeTech
The Leader In Power Monitoring and Smart Grid Solutions
The phasor diagram shows the 120o angular separation between the phase voltages.
The phase-to-phase voltage in a balanced three-phase wye system is 1.732 times the
phase-to-neutral voltage. The center point of the wye is tied together and is typically
grounded. Table 1.1 shows the common voltages used in the United States for wye-
connected systems.
Phase to Ground Voltage Phase to Phase Voltage
120 volts 208 volts
277 volts 480 volts
2,400 volts 4,160 volts
7,200 volts 12,470 volts
7,620 volts 13,200 volts
Table 1: Common Phase Voltages on Wye Services
Usually a wye-connected service will have four wires: three wires for the phases and
one for the neutral. The three-phase wires connect to the three phases (as shown in
Figure 1.1). The neutral wire is typically tied to the ground or center point of the wye.
In many industrial applications the facility will be fed with a four-wire wye service but
only three wires will be run to individual loads. The load is then often referred to as a
delta-connected load but the service to the facility is still a wye service; it contains
four wires if you trace the circuit back to its source (usually a transformer). In this
type of connection the phase to ground voltage will be the phase-to-ground voltage
indicated in Table 1, even though a neutral or ground wire is not physically present at
the load. The transformer is the best place to determine the circuit connection type
because this is a location where the voltage reference to ground can be conclusively
identified.
Doc# E145701 1-3
Electro Industries/GaugeTech
The Leader In Power Monitoring and Smart Grid Solutions
Electro Industries/GaugeTech
The Leader In Power Monitoring and Smart Grid Solutions
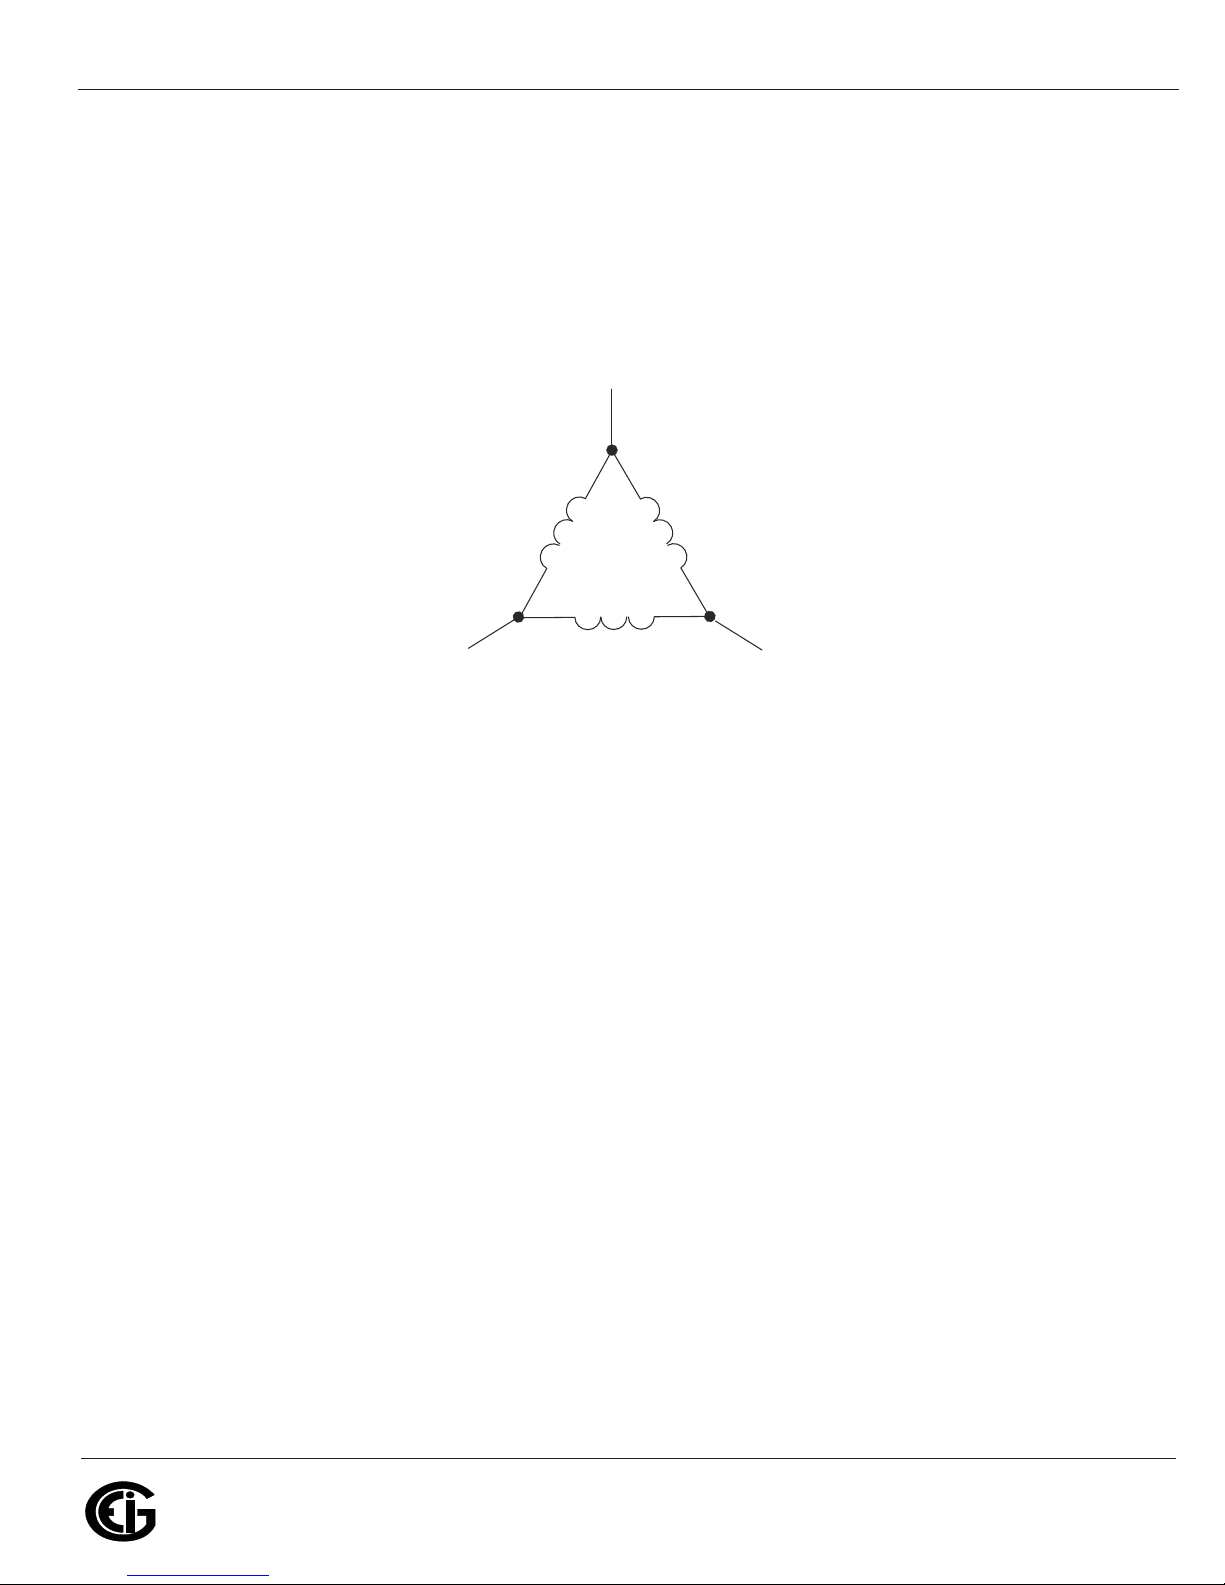
1.1.2: Delta Connection
V
A
V
B
Delta-connected services may be fed with either three wires or four wires. In a three-
phase delta service the load windings are connected from phase-to-phase rather than
from phase-to-ground. Figure 1.3 shows the physical load connections for a delta
service.
V
1: Three-Phase Power Measurement
C
Phase 2
Phase 1
Figure 1.3: Three-phase Delta Winding Relationship
In this example of a delta service, three wires will transmit the power to the load. In a
true delta service, the phase-to-ground voltage will usually not be balanced because
the ground is not at the center of the delta.
Figure 1.4 shows the phasor relationships between voltage and current on a three-
phase delta circuit.
In many delta services, one corner of the delta is grounded. This means the phase to
ground voltage will be zero for one phase and will be full phase-to-phase voltage for
the other two phases. This is done for protective purposes.
Phase 3
Doc# E145701 1-4
1: Three-Phase Power Measurement
Electro Industries/GaugeTech
The Leader In Power Monitoring and Smart Grid Solutions
Electro Industries/GaugeTech
The Leader In Power Monitoring and Smart Grid Solutions
V
A
V
BC
Figure 1.4: Phasor Diagram, Three-Phase Voltages and Currents, Delta-Connected
Another common delta connection is the four-wire, grounded delta used for lighting
loads. In this connection the center point of one winding is grounded. On a 120/240
volt, four-wire, grounded delta service the phase-to-ground voltage would be 120
volts on two phases and 208 volts on the third phase. Figure 1.5 shows the phasor
diagram for the voltages in a three-phase, four-wire delta system.
V
I
C
I
B
V
AB
C
V
CA
I
A
V
CA
V
BC
Doc# E145701 1-5
Figure 1.5: Phasor Diagram Showing Three-phase Four-Wire Delta-Connected System
N
V
AB
V
B

1: Three-Phase Power Measurement
Electro Industries/GaugeTech
The Leader In Power Monitoring and Smart Grid Solutions
Electro Industries/GaugeTech
The Leader In Power Monitoring and Smart Grid Solutions
1.1.3: Blondel’s Theorem and Three Phase Measurement
In 1893 an engineer and mathematician named Andre E. Blondel set forth the first
scientific basis for polyphase metering. His theorem states:
If energy is supplied to any system of conductors through N wires, the total power in
the system is given by the algebraic sum of the readings of N wattmeters so arranged
that each of the N wires contains one current coil, the corresponding potential coil
being connected between that wire and some common point. If this common point is
on one of the N wires, the measurement may be made by the use of N-1 Wattmeters.
The theorem may be stated more simply, in modern language:
In a system of N conductors, N-1 meter elements will measure the power or energy
taken provided that all the potential coils have a common tie to the conductor in
which there is no current coil.
Three-phase power measurement is accomplished by measuring the three individual
phases and adding them together to obtain the total three phase value. In older
analog meters, this measurement was accomplished using up to three separate
elements. Each element combined the single-phase voltage and current to produce a
torque on the meter disk. All three elements were arranged around the disk so that
the disk was subjected to the combined torque of the three elements. As a result the
disk would turn at a higher speed and register power supplied by each of the three
wires.
According to Blondel's Theorem, it was possible to reduce the number of elements
under certain conditions. For example, a three-phase, three-wire delta system could
be correctly measured with two elements (two potential coils and two current coils) if
the potential coils were connected between the three phases with one phase in
common.
In a three-phase, four-wire wye system it is necessary to use three elements. Three
voltage coils are connected between the three phases and the common neutral
conductor. A current coil is required in each of the three phases.
In modern digital meters, Blondel's Theorem is still applied to obtain proper
metering. The difference in modern meters is that the digital meter measures each
phase voltage and current and calculates the single-phase power for each phase. The
meter then sums the three phase powers to a single three-phase reading.
Doc# E145701 1-6
1: Three-Phase Power Measurement
Electro Industries/GaugeTech
The Leader In Power Monitoring and Smart Grid Solutions
Electro Industries/GaugeTech
The Leader In Power Monitoring and Smart Grid Solutions
Some digital meters measure the individual phase power values one phase at a time.
This means the meter samples the voltage and current on one phase and calculates a
power value. Then it samples the second phase and calculates the power for the
second phase. Finally, it samples the third phase and calculates that phase power.
After sampling all three phases, the meter adds the three readings to create the
equivalent three-phase power value. Using mathematical averaging techniques, this
method can derive a quite accurate measurement of three-phase power.
More advanced meters actually sample all three phases of voltage and current
simultaneously and calculate the individual phase and three-phase power values. The
advantage of simultaneous sampling is the reduction of error introduced due to the
difference in time when the samples were taken.
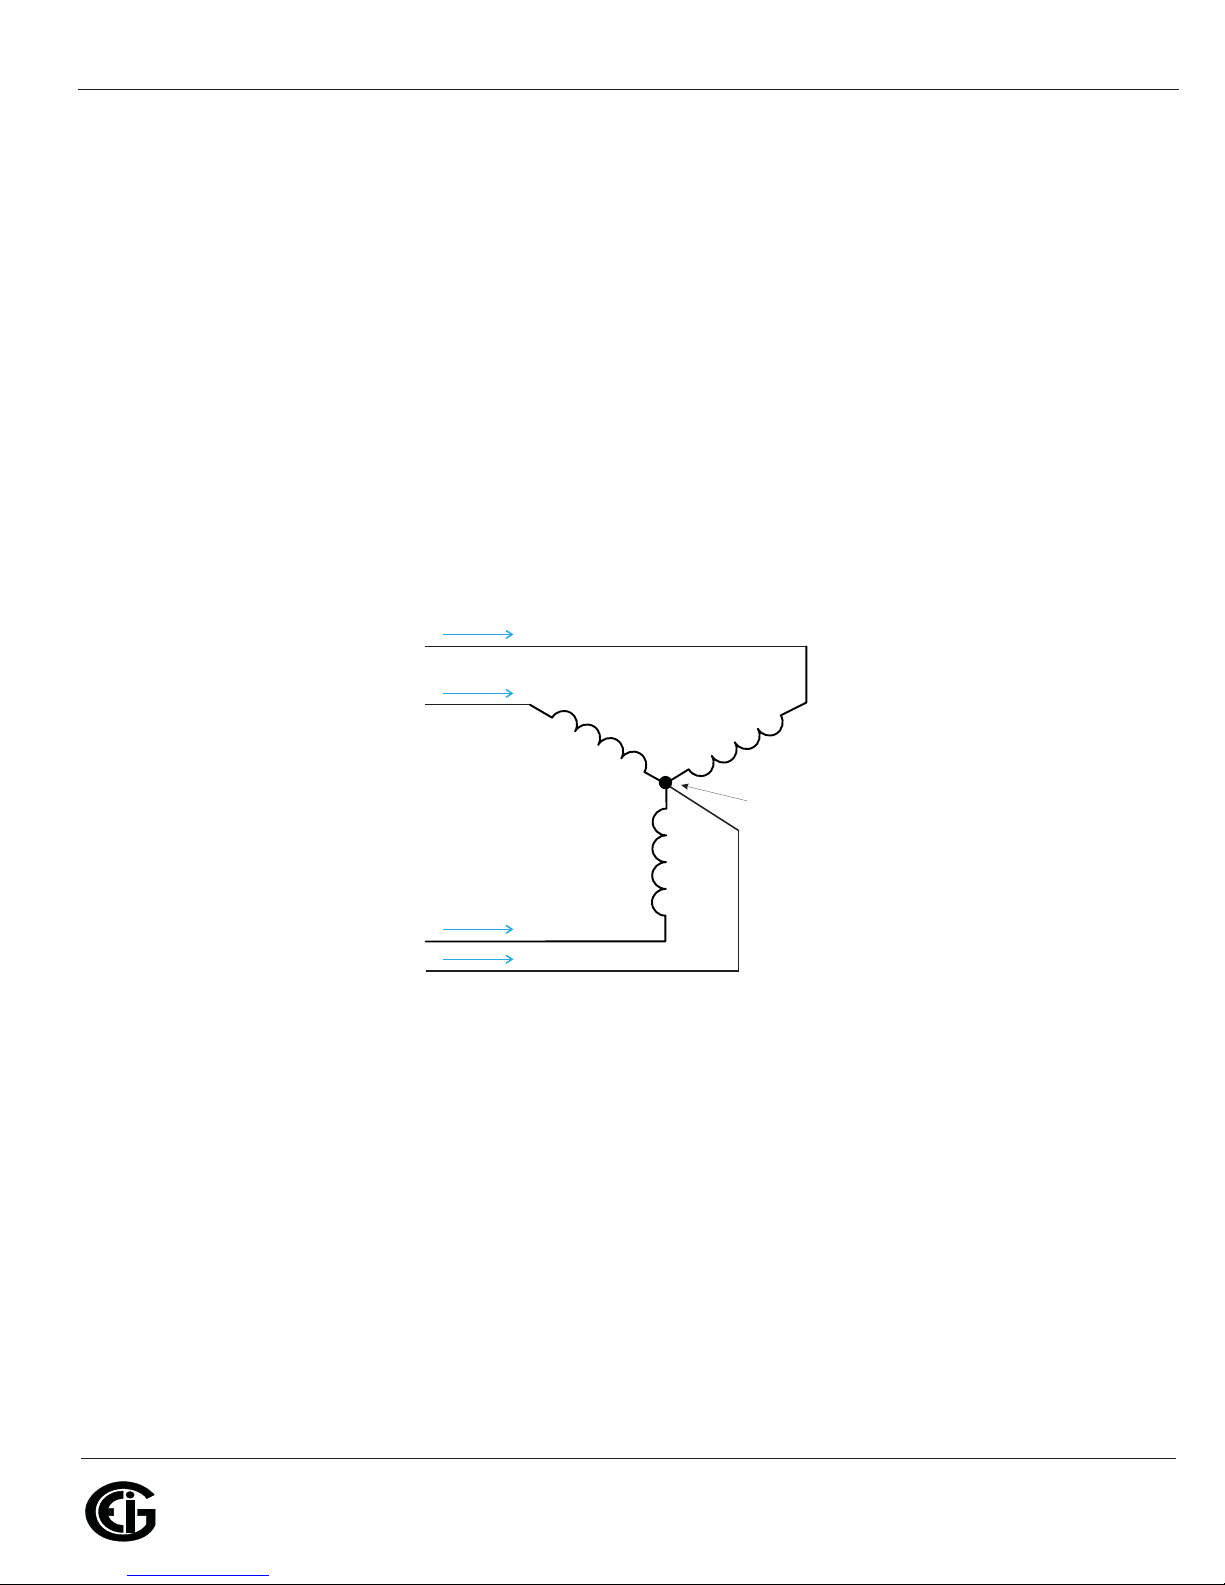
C
B
A
N
Figure 1.6: Three-Phase Wye Load Illustrating Kirchhoff’s Law and Blondel’s Theorem
Phase B
Phase C
Node "n"
Phase A
Blondell's Theorem is a derivation that results from Kirchhoff's Law. Kirchhoff's Law
states that the sum of the currents into a node is zero. Another way of stating the
same thing is that the current into a node (connection point) must equal the current
out of the node. The law can be applied to measuring three-phase loads. Figure 1.6
shows a typical connection of a three-phase load applied to a three-phase, four-wire
service. Kirchhoff's Law holds that the sum of currents A, B, C and N must equal zero
or that the sum of currents into Node "n" must equal zero.
If we measure the currents in wires A, B and C, we then know the current in wire N by
Kirchhoff's Law and it is not necessary to measure it. This fact leads us to the
conclusion of Blondel's Theorem- that we only need to measure the power in three of
Doc# E145701 1-7

Electro Industries/GaugeTech
The Leader In Power Monitoring and Smart Grid Solutions
Electro Industries/GaugeTech
The Leader In Power Monitoring and Smart Grid Solutions
the four wires if they are connected by a common node. In the circuit of Figure 1.6 we
must measure the power flow in three wires. This will require three voltage coils and
three current coils (a three-element meter). Similar figures and conclusions could be
reached for other circuit configurations involving Delta-connected loads.
1.2: Power, Energy and Demand
It is quite common to exchange power, energy and demand without differentiating
between the three. Because this practice can lead to confusion, the differences
between these three measurements will be discussed.
Power is an instantaneous reading. The power reading provided by a meter is the
present flow of watts. Power is measured immediately just like current. In many
digital meters, the power value is actually measured and calculated over a one second
interval because it takes some amount of time to calculate the RMS values of voltage
1: Three-Phase Power Measurement
and current. But this time interval is kept small to preserve the instantaneous nature
of power.
Energy is always based on some time increment; it is the integration of power over a
defined time increment. Energy is an important value because almost all electric bills
are based, in part, on the amount of energy used.
Typically, electrical energy is measured in units of kilowatt-hours (kWh). A kilowatt-
hour represents a constant load of one thousand watts (one kilowatt) for one hour.
Stated another way, if the power delivered (instantaneous watts) is measured as
1,000 watts and the load was served for a one hour time interval then the load would
have absorbed one kilowatt-hour of energy. A different load may have a constant
power requirement of 4,000 watts. If the load were served for one hour it would
absorb four kWh. If the load were served for 15 minutes it would absorb ¼ of that
total or one kWh.
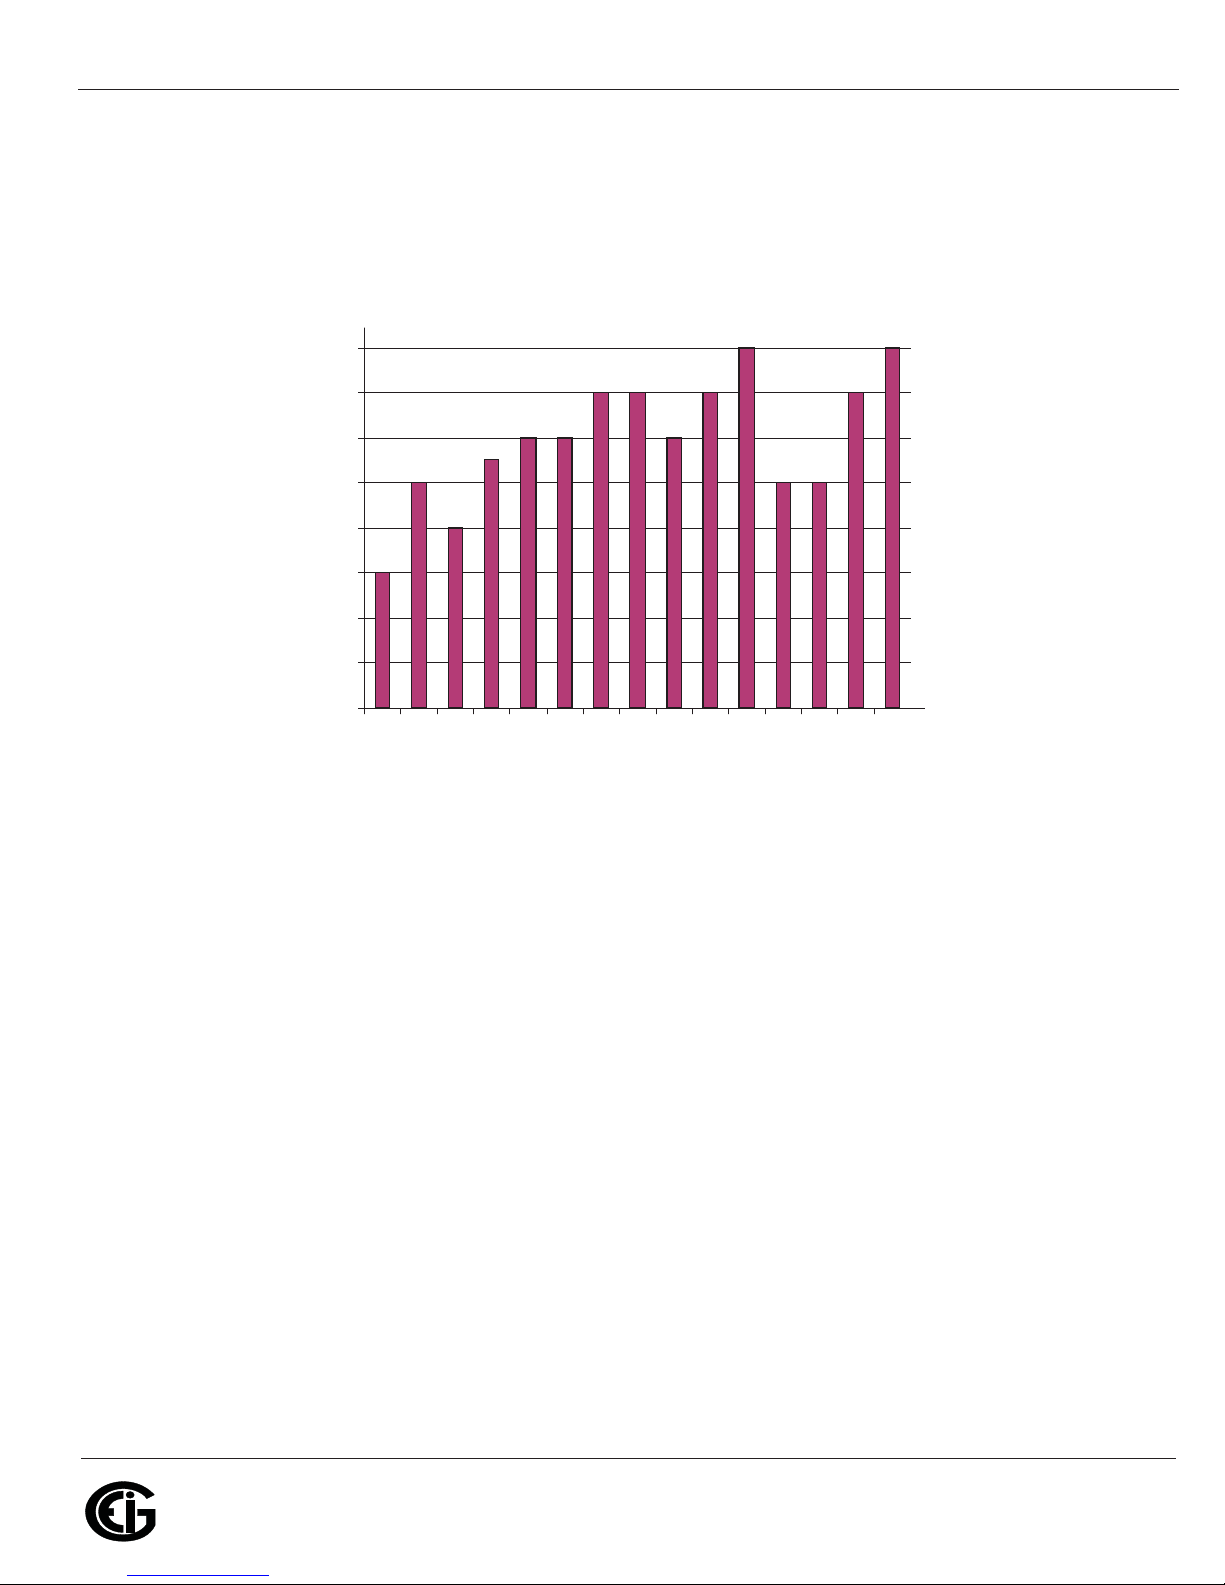
Figure 1.7 shows a graph of power and the resulting energy that would be transmitted
as a result of the illustrated power values. For this illustration, it is assumed that the
power level is held constant for each minute when a measurement is taken. Each bar
in the graph will represent the power load for the one-minute increment of time. In
real life the power value moves almost constantly.
The data from Figure 1.7 is reproduced in Table 2 to illustrate the calculation of
energy. Since the time increment of the measurement is one minute and since we
Doc# E145701 1-8
1: Three-Phase Power Measurement
Electro Industries/GaugeTech
The Leader In Power Monitoring and Smart Grid Solutions
Electro Industries/GaugeTech
The Leader In Power Monitoring and Smart Grid Solutions
0
10
20
30
40
50
60
70
80
1 2 3 4 5 6 7 8 9 10 11 12 13 14 15
Time (minutes)
sttawolik
specified that the load is constant over that minute, we can convert the power reading
to an equivalent consumed energy reading by multiplying the power reading times 1/
60 (converting the time base from minutes to hours).
Figure 1.7: Power Use over Time
Doc# E145701 1-9

1: Three-Phase Power Measurement
Electro Industries/GaugeTech
The Leader In Power Monitoring and Smart Grid Solutions
Electro Industries/GaugeTech
The Leader In Power Monitoring and Smart Grid Solutions
Time
Interval
(minute)
Power
(kW)
Energy
(kWh)
Accumulated
1 30 0.50 0.50
2 50 0.83 1.33
3 40 0.67 2.00
4 55 0.92 2.92
5 60 1.00 3.92
6 60 1.00 4.92
7 70 1.17 6.09
8 70 1.17 7.26
9 60 1.00 8.26
10 70 1.17 9.43
11 80 1.33 10.76
12 50 0.83 12.42
13 50 0.83 12.42
Energy
(kWh)
14 70 1.17 13.59
15 80 1.33 14.92
Table 1.2: Power and Energy Relationship over Time
As in Table 1.2, the accumulated energy for the power load profile of Figure 1.7 is
14.92 kWh.
Demand is also a time-based value. The demand is the average rate of energy use
over time. The actual label for demand is kilowatt-hours/hour but this is normally
reduced to kilowatts. This makes it easy to confuse demand with power, but demand
is not an instantaneous value. To calculate demand it is necessary to accumulate the
energy readings (as illustrated in Figure 1.7) and adjust the energy reading to an
hourly value that constitutes the demand.
In the example, the accumulated energy is 14.92 kWh. But this measurement was
made over a 15-minute interval. To convert the reading to a demand value, it must be
normalized to a 60-minute interval. If the pattern were repeated for an additional
three 15-minute intervals the total energy would be four times the measured value or
Doc# E145701 1-10
1: Three-Phase Power Measurement
Electro Industries/GaugeTech
The Leader In Power Monitoring and Smart Grid Solutions
Electro Industries/GaugeTech
The Leader In Power Monitoring and Smart Grid Solutions
0
20
40
60
80
100
12345678
Intervals (15 mins.)
sruoh-ttawolik
59.68 kWh. The same process is applied to calculate the 15-minute demand value.
The demand value associated with the example load is 59.68 kWh/hr or 59.68 kWd.
Note that the peak instantaneous value of power is 80 kW, significantly more than the
demand value.
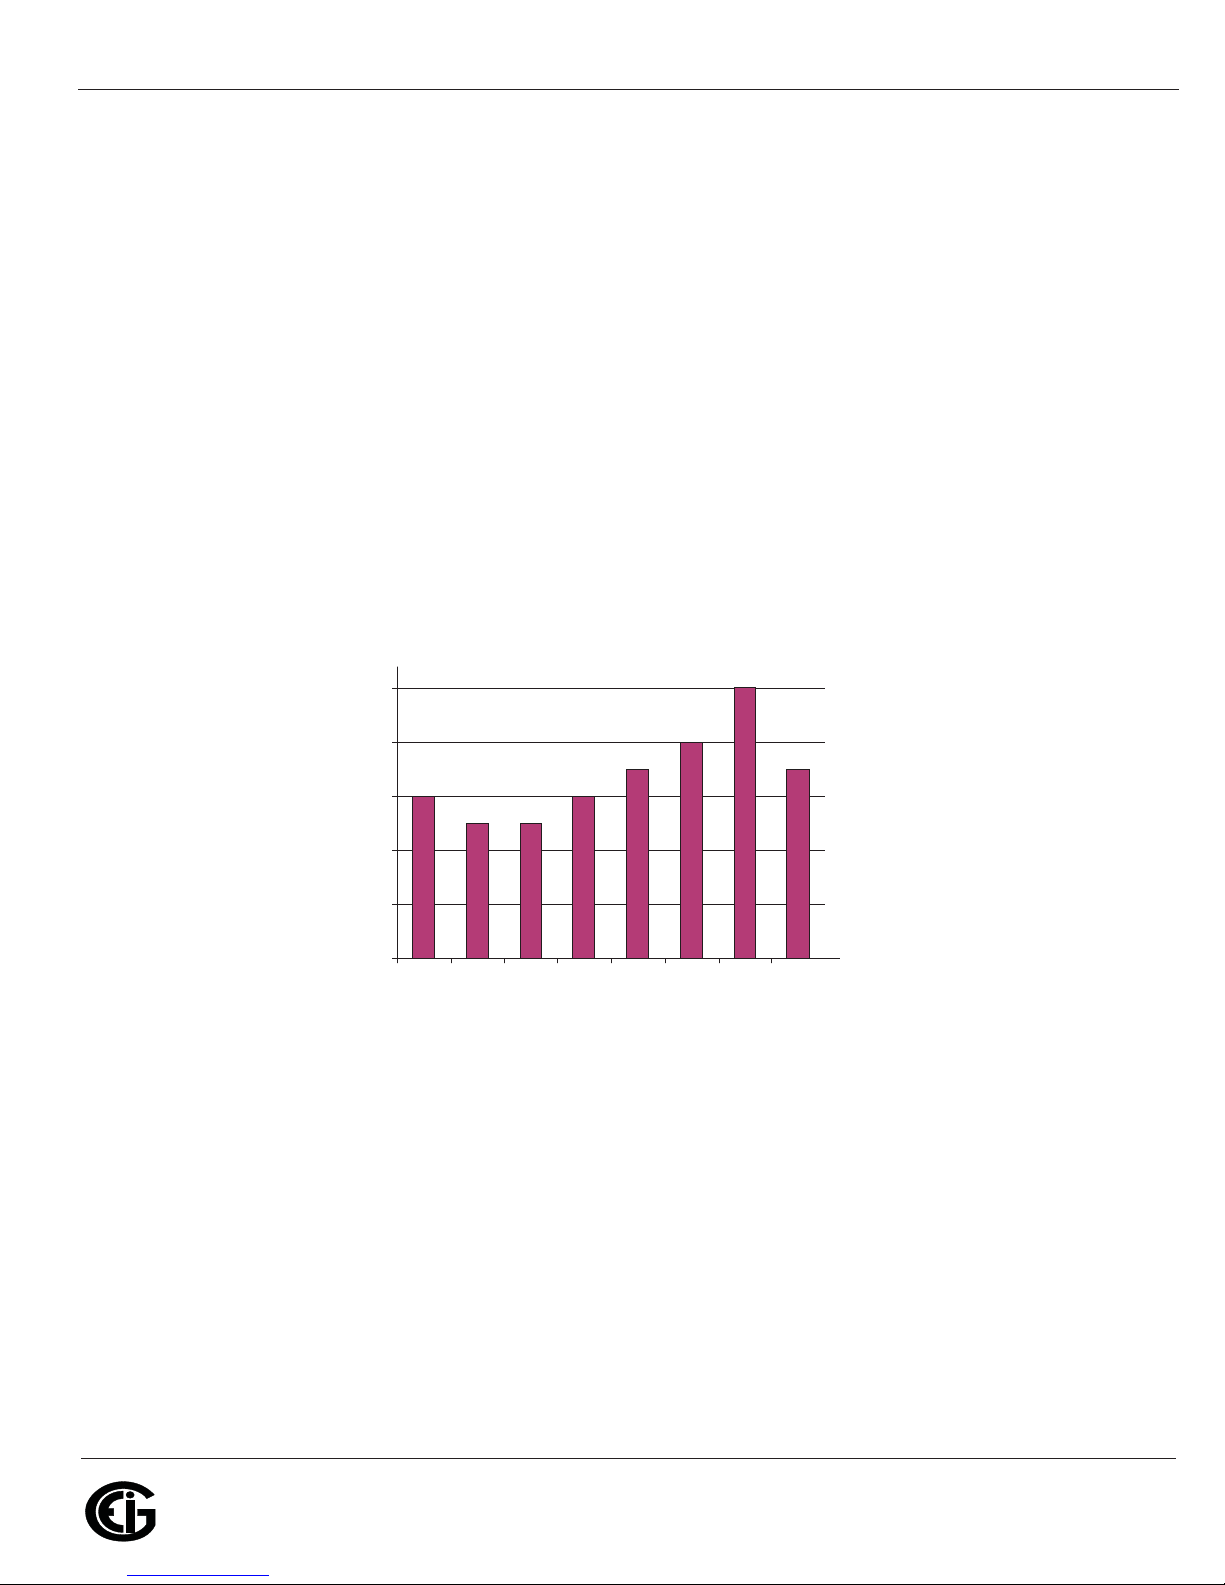
Figure 1.8 shows another example of energy and demand. In this case, each bar
represents the energy consumed in a 15-minute interval. The energy use in each
interval typically falls between 50 and 70 kWh. However, during two intervals the
energy rises sharply and peaks at 100 kWh in interval number 7. This peak of usage
will result in setting a high demand reading. For each interval shown the demand
value would be four times the indicated energy reading. So interval 1 would have an
associated demand of 240 kWh/hr. Interval 7 will have a demand value of 400 kWh/
hr. In the data shown, this is the peak demand value and would be the number that
would set the demand charge on the utility bill.
As can be seen from this example, it is important to recognize the relationships
between power, energy and demand in order to control loads effectively or to monitor
use correctly.
Doc# E145701 1-11
Figure 1.8: Energy Use and Demand
Electro Industries/GaugeTech
The Leader In Power Monitoring and Smart Grid Solutions
Electro Industries/GaugeTech
The Leader In Power Monitoring and Smart Grid Solutions
1.3: Reactive Energy and Power Factor
V
I
I
R
I
X
The real power and energy measurements discussed in the previous section relate to
the quantities that are most used in electrical systems. But it is often not sufficient to
only measure real power and energy. Reactive power is a critical component of the
total power picture because almost all real-life applications have an impact on
reactive power. Reactive power and power factor concepts relate to both load and
generation applications. However, this discussion will be limited to analysis of reactive
power and power factor as they relate to loads. To simplify the discussion, generation
will not be considered.
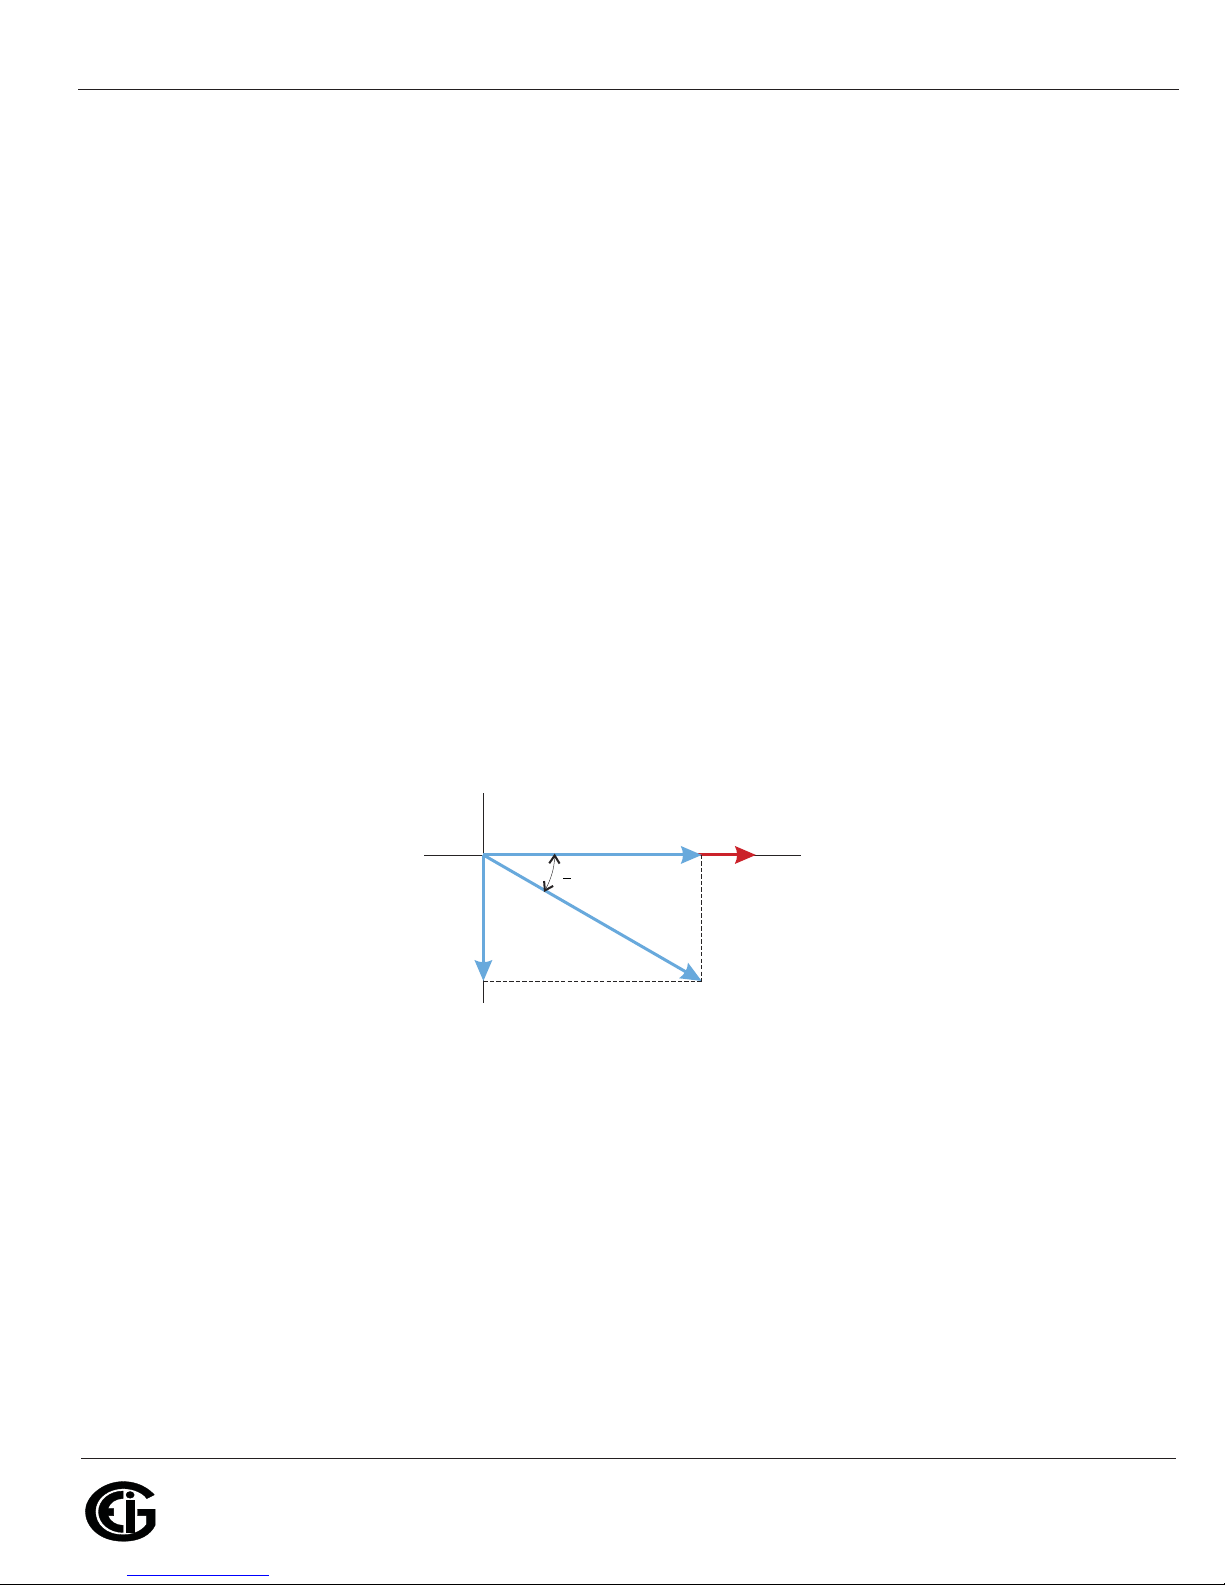
Real power (and energy) is the component of power that is the combination of the
voltage and the value of corresponding current that is directly in phase with the
voltage. However, in actual practice the total current is almost never in phase with the
voltage. Since the current is not in phase with the voltage, it is necessary to consider
1: Three-Phase Power Measurement
both the inphase component and the component that is at quadrature (angularly
rotated 90
o
or perpendicular) to the voltage. Figure 1.9 shows a single-phase voltage
and current and breaks the current into its in-phase and quadrature components.
0
Figure 1.9: Voltage and Complex Current
The voltage (V) and the total current (I) can be combined to calculate the apparent
power or VA. The voltage and the in-phase current (I
real power or watts. The voltage and the quadrature current (I
) are combined to produce the
R
) are combined to
X
calculate the reactive power.
The quadrature current may be lagging the voltage (as shown in Figure 1.9) or it may
lead the voltage. When the quadrature current lags the voltage the load is requiring
both real power (watts) and reactive power (VARs). When the quadrature current
Doc# E145701 1-12

1: Three-Phase Power Measurement
Electro Industries/GaugeTech
The Leader In Power Monitoring and Smart Grid Solutions
Electro Industries/GaugeTech
The Leader In Power Monitoring and Smart Grid Solutions
leads the voltage the load is requiring real power (watts) but is delivering reactive
power (VARs) back into the system; that is VARs are flowing in the opposite direction
of the real power flow.
Reactive power (VARs) is required in all power systems. Any equipment that uses
magnetization to operate requires VARs. Usually the magnitude of VARs is relatively
low compared to the real power quantities. Utilities have an interest in maintaining
VAR requirements at the customer to a low value in order to maximize the return on
plant invested to deliver energy. When lines are carrying VARs, they cannot carry as
many watts. So keeping the VAR content low allows a line to carry its full capacity of
watts. In order to encourage customers to keep VAR requirements low, some utilities
impose a penalty if the VAR content of the load rises above a specified value.
A common method of measuring reactive power requirements is power factor. Power
factor can be defined in two different ways. The more common method of calculating
power factor is the ratio of the real power to the apparent power. This relationship is
expressed in the following formula:
Total PF = real power / apparent power = watts/VA
This formula calculates a power factor quantity known as Total Power Factor. It is
called Total PF because it is based on the ratios of the power delivered. The delivered
power quantities will include the impacts of any existing harmonic content. If the
voltage or current includes high levels of harmonic distortion the power values will be
affected. By calculating power factor from the power values, the power factor will
include the impact of harmonic distortion. In many cases this is the preferred method
of calculation because the entire impact of the actual voltage and current are
included.
A second type of power factor is Displacement Power Factor. Displacement PF is based
on the angular relationship between the voltage and current. Displacement power
factor does not consider the magnitudes of voltage, current or power. It is solely
based on the phase angle differences. As a result, it does not include the impact of
Doc# E145701 1-13
Electro Industries/GaugeTech
The Leader In Power Monitoring and Smart Grid Solutions
Electro Industries/GaugeTech
The Leader In Power Monitoring and Smart Grid Solutions
harmonic distortion. Displacement power factor is calculated using the following
equation:
where T is the angle between the voltage and the current (see Fig. 1.9).
In applications where the voltage and current are not distorted, the Total Power Factor
will equal the Displacement Power Factor. But if harmonic distortion is present, the
two power factors will not be equal.
1.4: Harmonic Distortion
Harmonic distortion is primarily the result of high concentrations of non-linear loads.
1: Three-Phase Power Measurement
Displacement PF Tcos=
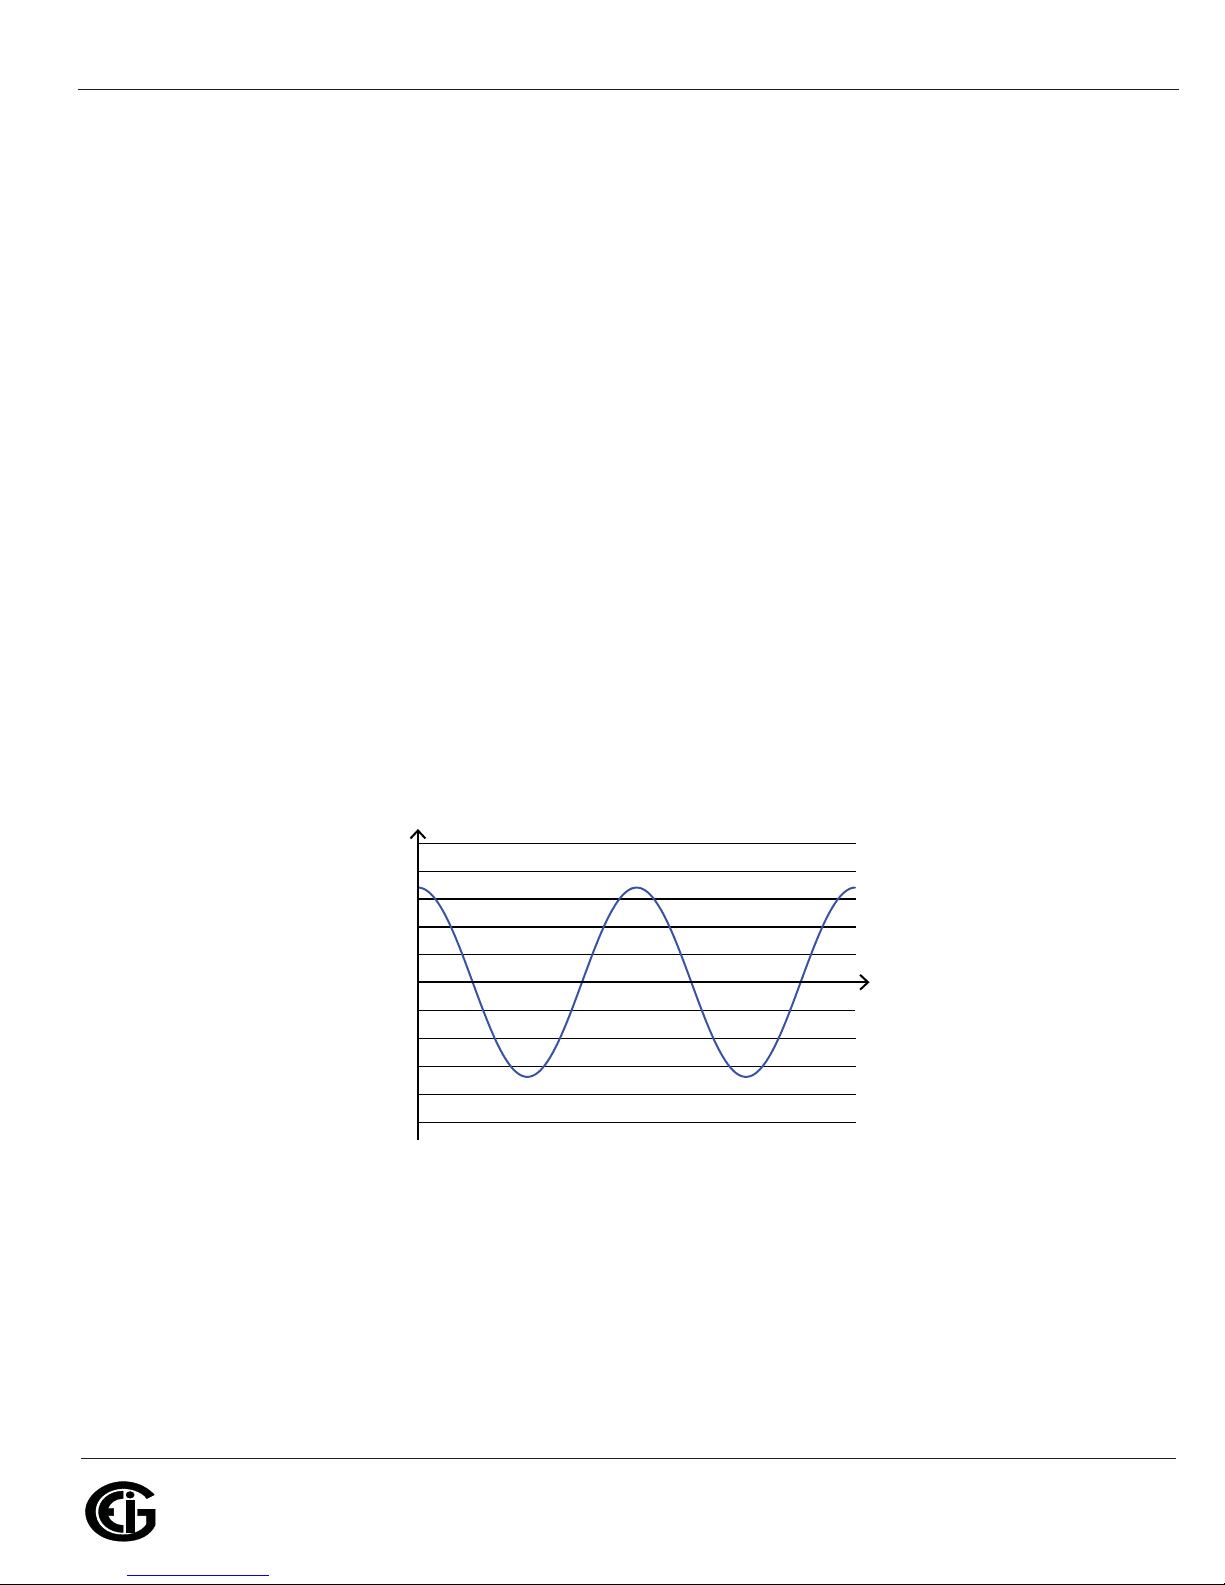
Devices such as computer power supplies, variable speed drives and fluorescent light
ballasts make current demands that do not match the sinusoidal waveform of AC
electricity. As a result, the current waveform feeding these loads is periodic but not
sinusoidal. Figure 1.10 shows a normal, sinusoidal current waveform. This example
has no distortion.
1000
500
0
Amps
– 500
– 1000
Figure 1.10: Nondistorted Current Waveform
Time
Figure 1.11 shows a current waveform with a slight amount of harmonic distortion.
The waveform is still periodic and is fluctuating at the normal 60 Hz frequency.
However, the waveform is not a smooth sinusoidal form as seen in Figure 1.10.
Doc# E145701 1-14
Electro Industries/GaugeTech
The Leader In Power Monitoring and Smart Grid Solutions
Electro Industries/GaugeTech
The Leader In Power Monitoring and Smart Grid Solutions
)spma( tnerruC
Time
Amps
3rd harmonic
5th harmonic
7th harmonic
Total
fundamental
– 500
0
500
1000
1: Three-Phase Power Measurement
1500
1000
500
0
a
–500
–1000
–1500
t
2a
Figure 1.11: Distorted Current Waveform
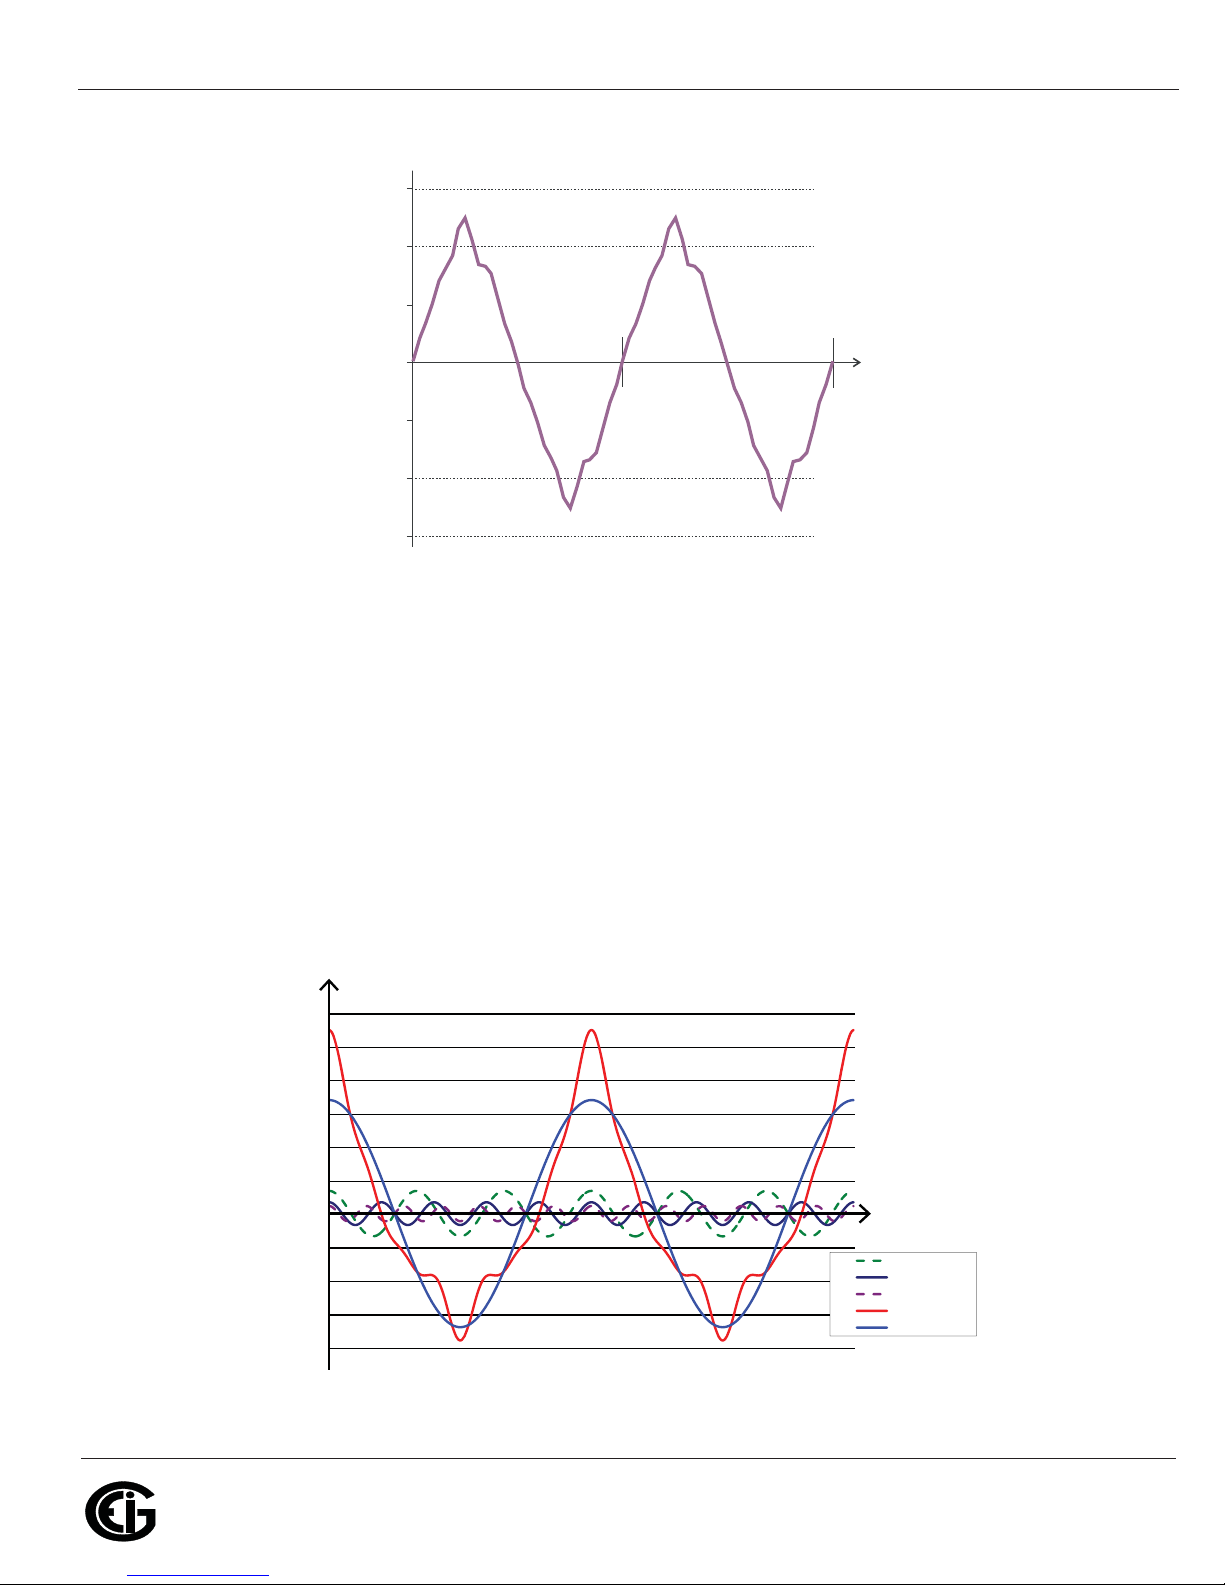
The distortion observed in Figure 1.11 can be modeled as the sum of several
sinusoidal waveforms of frequencies that are multiples of the fundamental 60 Hz
frequency. This modeling is performed by mathematically disassembling the distorted
waveform into a collection of higher frequency waveforms.
These higher frequency waveforms are referred to as harmonics. Figure 1.12 shows
the content of the harmonic frequencies that make up the distortion portion of the
waveform in Figure 1.11.
Doc# E145701 1-15
Figure 1.12: Waveforms of the Harmonics

1: Three-Phase Power Measurement
Electro Industries/GaugeTech
The Leader In Power Monitoring and Smart Grid Solutions
Electro Industries/GaugeTech
The Leader In Power Monitoring and Smart Grid Solutions
The waveforms shown in Figure 1.12 are not smoothed but do provide an indication of
the impact of combining multiple harmonic frequencies together.
When harmonics are present it is important to remember that these quantities are
operating at higher frequencies. Therefore, they do not always respond in the same
manner as 60 Hz values.
Inductive and capacitive impedance are present in all power systems. We are
accustomed to thinking about these impedances as they perform at 60 Hz. However,
these impedances are subject to frequency variation.
X
= jZL and
L
= 1/jZC
X
C
At 60 Hz, Z = 377; but at 300 Hz (5th harmonic) Z = 1,885. As frequency changes
impedance changes and system impedance characteristics that are normal at 60 Hz
may behave entirely differently in the presence of higher order harmonic waveforms.
Traditionally, the most common harmonics have been the low order, odd frequencies,
such as the 3rd, 5th, 7th, and 9th. However newer, non-
cant quantities of higher order harmonics.
signifi
linear loads are introducing
Since much voltage monitoring and almost all current monitoring is performed using
instrument transformers, the higher order harmonics are often not visible. Instrument
transformers are designed to pass 60 Hz quantities with high accuracy. These devices,
when designed for accuracy at low frequency, do not pass high frequencies with high
accuracy; at frequencies above about 1200 Hz they pass almost no information. So
when instrument transformers are used, they effectively filter out higher frequency
harmonic distortion making it impossible to see.
However, when monitors can be connected directly to the measured circuit (such as
direct connection to a 480 volt bus) the user may often see higher order harmonic
distortion. An important rule in any harmonics study is to evaluate the type of
equipment and connections before drawing a conclusion. Not being able to see har-
monic distortion is not the same as not having harmonic distortion.
It is common in advanced meters to perform a function commonly referred to as
waveform capture. Waveform capture is the ability of a meter to capture a present
picture of the voltage or current waveform for viewing and harmonic analysis.
Doc# E145701 1-16
 Loading...