

SGS Thomson Microelectronics STTH5L06D, STTH5L06B Datasheet

®
TURBO 2 ULTRAFAST HIGH VOLTAGE RECTIFIER
MAIN PRODUCT CHARACTERISTICS
STTH5L06D/B/FP
I
F(AV)
V
RRM
(max) 125 µA
I
R
5A
600 V
Tj (max) 175 °C
(max) 1.05 V
V
F
trr (max) 95 ns
FEATURES AND BENEFITS
Ultrafast switching
■
■ Low reverse recovery current
■ Reduces switching & conduction losses
Low thermal resistance
■
DESCRIPTION
The STTH5L06D/B/FP, which is using ST Turbo 2
600V technology, is specially suited as boost
diode in discontinuous or critical mode power
factor corrections.
The device, available in TO-220AC, TO-220FPAC
and DPAK, is also intended for use as a free
wheeling diode in power supplies and other power
switching applications.
TO-220AC
STTH5L06D
A
K
K
NC
DPAK
STTH5L06B
A
K
TO-220FPAC
STTH5L06FP
A
ABSOLUTE RATINGS (limiting values)
Symbol Parameter Value Unit
V
RRM
I
F(RMS)
I
F(AV)
I
FSM
Repetitive peak reverse voltage 600 V
RMS forward current TO-220AC/TO-220FPAC
DPAK
Average forward
current
Surge non
repetitive forward
TO-220AC / DPAK Tc = 150°C δ =0.5 5 A
TO-220FPAC Tc= 135°C δ=0.5
tp = 10 ms Sinusoidal
tp = 10 ms Sinusoidal
TO-220AC/TO-220FPAC
DPAK
20
10
90
60
current
T
stg
T
November 2002 - Ed: 4B
Storage temperature range - 65 + 175 °C
Maximum operating junction temperature + 175 °C
j
A
A
1/7
STTH5L06D/B/FP
THERMAL PARAMETERS
Symbol Parameter Maximum Unit
R
th(j-c)
Junction to case TO-220AC / DPAK 3.5 °C/W
TO-220FPAC 6.0
STATIC ELECTRICAL CHARACTERISTICS
Symbol Parameter Tests conditions Min. Typ. Max. Unit
I
R
V
Reverse leakage
current
Forward voltage drop IF=5A Tj= 25°C 1.3 V
F
VR= 600V Tj= 25°C 5 µA
T
= 150°C 10 125
j
T
= 150°C 0.85 1.05
j
To evaluate the maximum conduction losses use the following equation :
P=0.89xI
F(AV)
+ 0.033 I
F2(RMS)
DYNAMIC ELECTRICAL CHARACTERISTICS
Symbol Parameter Tests conditions Min. Typ. Max. Unit
t
rr
Reverse recovery
time
IF=1A dIF/dt=-50A/µs
VR= 30V
Tj= 25°C 65 95 ns
t
fr
V
FP
Forward recovery
time
Forward recovery
IF=5A dIF/dt = 100 A/µs
VFR=1.1xVFmax
IF=5A dIF/dt = 100 A/µsTj= 25°C 7 V
time
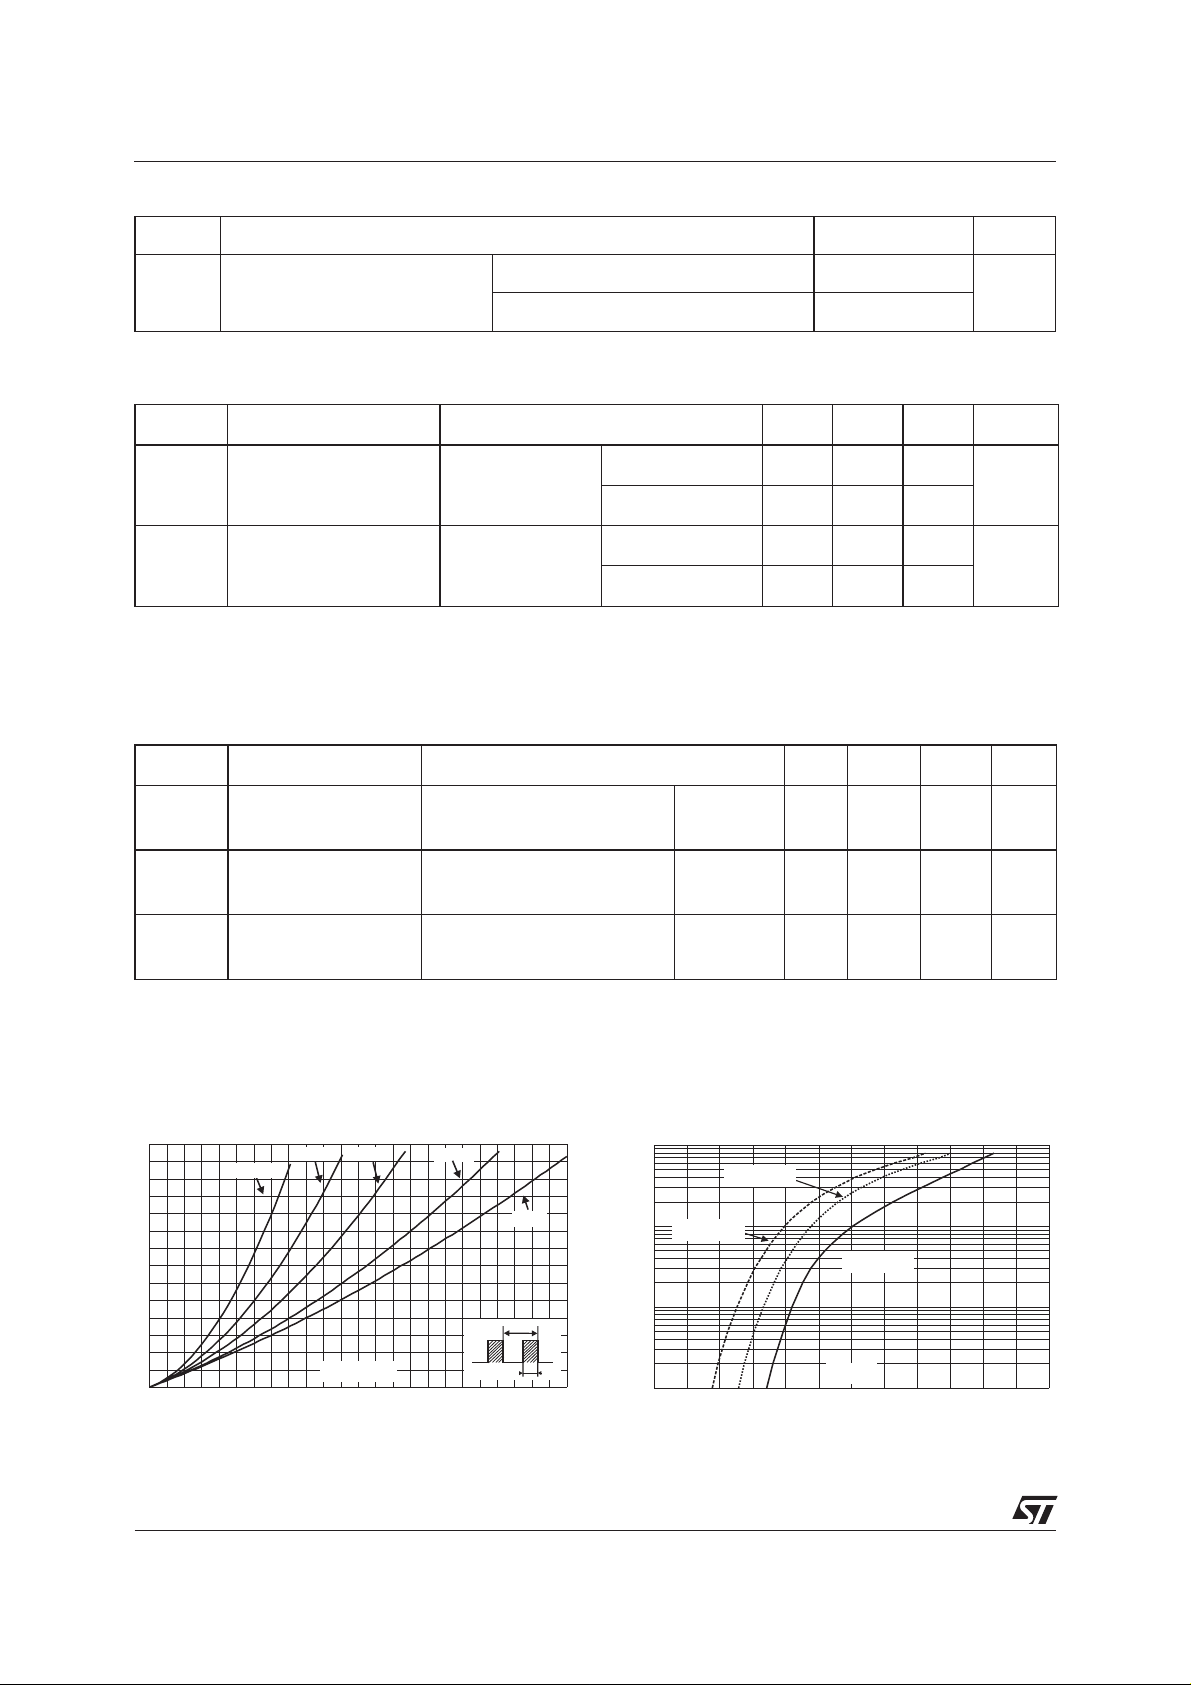
Fig.1: Conductionlosses versus averagecurrent.
P(W)
7
6
5
4
3
2
1
0
0.0 0.5 1.0 1.5 2.0 2.5 3.0 3.5 4.0 4.5 5.0 5.5 6.0
δ = 0.05
δ = 0.1
δ = 0.2
I (A)
F(AV)
δ = 0.5
δ
=tp/T
δ = 1
T
tp
Tj= 25°C 150 ns
Fig. 2: Forward voltage drop versus forward
current.
I (A)
FM
100.0
T=150°C
j
(maximum values)
T=150°C
10.0
1.0
0.1
j
(typical values)
T=25°C
j
(maximum values)
V (V)
FM
0.0 0.5 1.0 1.5 2.0 2.5 3.0
2/7

STTH5L06D/B/FP
Fig. 3-1: Relative variation of thermal impedance
junctionto case versus pulse duration(TO-220AC,
DPAK).
Z/R
th(j-c) th(j-c)
1.0
0.9
0.8
0.7
δ = 0.5
0.6
0.5
0.4
δ = 0.2
δ = 0.1
0.3
0.2
Single pulse
0.1
0.0
1.E-03 1.E-02 1.E-01 1.E+00
t (s)
p
δ
=tp/T
T
tp
Fig.4: Peak reverserecoverycurrent versus dIF/dt
(90% confidence).
I (A)
RM
8
V =400V
R
T=125°C
j
7
6
5
4
3
2
1
0
I =0.25 x I
F F(AV)
0 102030405060708090100
I =0.5 x I
F F(AV)
dI /dt(A/µs)
F
I=I
F F(AV)
I =2 x I
F F(AV)
Fig. 3-2: Relative variation of thermal impedance
junction to case versus pulse duration
(TO-220FPAC).
Z/R
th(j-c) th(j-c)
1.0
0.9
0.8
0.7
0.6
δ = 0.5
0.5
0.4
δ = 0.2
0.3
δ = 0.1
0.2
0.1
Single pulse
0.0
1.E-03 1.E-02 1.E-01 1.E+00 1.E+01
t (s)
p
δ
=tp/T
T
tp
Fig. 5: Reverse recovery time versus dIF/dt
(90% confidence).
t (ns)
rr
1000
900
800
700
600
500
400
300
200
100
0
I =2 x I
F F(AV)
I=I
F F(AV)
0 102030405060708090100
I =0.5 x I
F F(AV)
dI /dt(A/µs)
F
V =400V
R
T=125°C
j
Fig. 6: Reverse recovery charges versus dIF/dt
(90% confidence).
Q (nC)
rr
500
V =400V
R
450
T=125°C
j
400
350
300
250
200
150
100
50
0
0 102030405060708090100
I =2 x I
F F(AV)
I=I
F F(AV)
I =0.5 x I
F F(AV)
dI /dt(A/µs)
F
Fig. 7: Softness factor versus dIF/dt (typical
values).
S factor
2.4
I=I
F F(AV)
V =400V
R
2.2
T=125°C
j
2.0
1.8
1.6
1.4
1.2
1.0
0.8
0.6
0.4
0.2
0 102030405060708090100
dI /dt(A/µs)
F
3/7
 Loading...