

SGS Thomson Microelectronics STTH1L06U, STTH1L06, STTH1L06A Datasheet
®
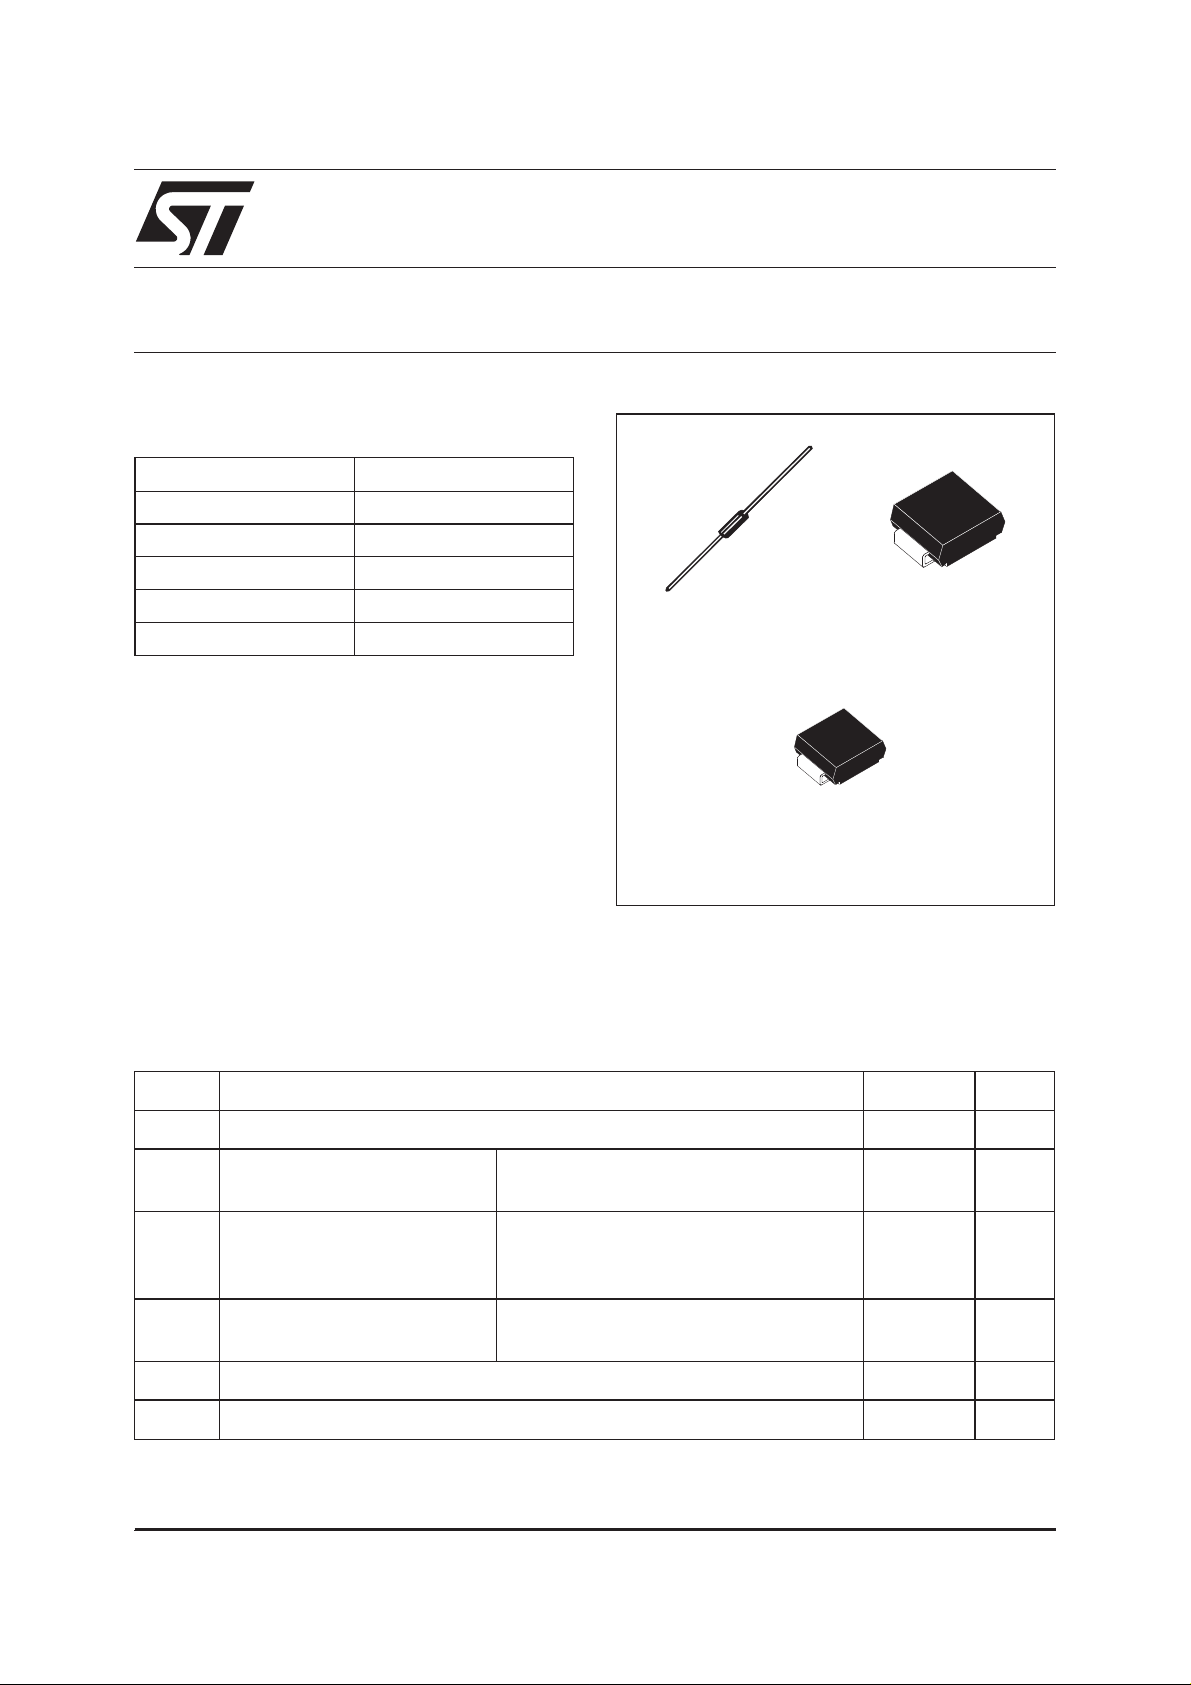
TURBO 2 ULTRAFAST HIGH VOLTAGE RECTIFIER
MAIN PRODUCT CHARACTERISTICS
STTH1L06/U/A
I
F(AV)
V
RRM
(max) 75 µA
I
R
1A
600 V
Tj (max) 175 °C
(max) 1.05 V
V
F
trr (max) 80 ns
FEATURES AND BENEFITS
Ultrafast switching
■
■ Low reverse recovery current
Reduces switching & conduction losses
■
Low thermal resistance
■
DESCRIPTION
The STTH1L06/U/A, which is using ST Turbo 2
600V technology, is specially suited as boost
diode in discontinuous or critical mode power
factor corrections.
The device is also intended for use as a free
wheeling diode in power supplies and other power
switching applications.
DO-41
STTH1L06
SMB
STTH1L06U
SMA
STTH1L06A
ABSOLUTE RATINGS (limiting values)
Symbol Parameter Value Unit
V
RRM
I
F(RMS)
I
F(AV)
I
FSM
T
stg
Repetitive peak reverse voltage 600 V
RMS forward current DO-41
SMA / SMB
Average forward current Tl = 120°C δ = 0.5 DO-41
TI = 135°C δ = 0.5 SMA
TI = 145°C δ = 0.5 SMB
Surge non repetitive forward
current
tp = 10 ms Sinusoidal DO-41
tp = 10 ms Sinusoidal SMA / SMB
10
7
1
1
1
30
20
Storage temperature range - 65 + 175 °C
Tj Maximum operating junction temperature + 175 °C
July 2002 - Ed: 3C
A
A
A
1/8

STTH1L06/U/A
THERMAL PARAMETERS
Symbol Parameter Maximum Unit
R
th (j-l)
Junction to lead L = 10 mm DO-41 45 °C/W
SMA 30
SMB 25
R
th (j-a)
Note 1: Rth(j-a)is measured with a copper areaS=5cm2(see Fig 12)
Junction to ambient (note 1) L = 10 mm DO-41 70
STATIC ELECTRICAL CHARACTERISTICS
Symbol Parameter Tests conditions Min. Typ. Max. Unit
I
R
V
Reverse leakage
current
Forward voltage drop IF= 1 A Tj = 25°C 1.3 V
F
VR= 600V Tj = 25°C 1 µA
Tj = 150°C 10 75
Tj = 150°C 0.85 1.05
To evaluate the maximum conduction losses use the following equation :
P=0.89xI
F(AV)
+ 0.165 I
F2(RMS)
DYNAMIC ELECTRICAL CHARACTERISTICS
Symbol Parameter Tests conditions Min. Typ. Max. Unit
trr Reverse recovery
time
tfr Forward recovery
time
V
FP
Forward recovery
voltage
=1A dIF/dt=-50A/µs
I
F
Tj = 25°C 55 80 ns
VR= 30V
I
=1A dIF/dt = 100 A/µs
F
Tj = 25°C 50 ns
VFR= 3.5V
IF=1A dIF/dt = 100 A/µs Tj = 25°C 10 V
2/7

STTH1L06/U/A
Fig.1: Conductionlossesversus average current.
P(W)
1.50
δ = 0.05
1.25
1.00
0.75
0.50
0.25
0.00
0.0 0.1 0.2 0.3 0.4 0.5 0.6 0.7 0.8 0.9 1.0 1.1 1.2 1.3
δ = 0.1
δ = 0.2
IF(av)(A)
δ = 0.5
δ
=tp/T
δ = 1
T
tp
Fig. 3-1: Relative variation of thermal impedance
junction ambient versus pulse duration (epoxy
FR4, Leads = 10mm)
Zth(j-a)/Rth(j-a)
1.0
DO-41
Lleads = 10mm
0.9
0.8
0.7
0.6
δ = 0.5
0.5
0.4
0.3
δ = 0.2
0.2
δ = 0.1
0.1
Single pulse
0.0
1.E-01 1.E+00 1.E+01 1.E+02 1.E+03
tp(s)
δ
=tp/T
T
tp
Fig. 2: Forward voltage drop versus forward
current.
IFM(A)
100.0
Tj=150°C
Tj=150°C
(Maximum values)
10.0
(Maximum values)
Tj=150°C
Tj=150°C
(Typical values)
(Typical values)
Tj=25°C
1.0
(Maximum values)
VFM(V)
0.1
0.0 0.5 1.0 1.5 2.0 2.5 3.0 3.5 4.0 4.5
Fig. 3-2: Relative variation of thermal impedance
junction ambient versus pulse duration (epoxy
FR4, S = 1cm²)
Zth(j-a)/Rth(j-a)
1.0
SMB
0.9
0.8
0.7
0.6
δ = 0.5
0.5
0.4
δ = 0.2
0.3
δ = 0.1
0.2
0.1
Single pulse
0.0
1.E-01 1.E+00 1.E+01 1.E+02 1.E+03
tp(s)
δ
=tp/T
T
tp
Fig. 3-3: Relative variation of thermal impedance
junction ambient versus pulse duration (epoxy
FR4)
Zth(j-a)/Rth(j-a)
1.0
SMA
0.9
0.8
0.7
0.6
δ = 0.5
0.5
0.4
δ = 0.2
0.3
δ = 0.1
0.2
0.1
Single pulse
0.0
1.E-01 1.E+00 1.E+01 1.E+02 1.E+03
tp(s)
δ
=tp/T
T
tp
Fig. 4: Peak reverse recovery current versus
/dt (90% confidence).
dI
F
IRM(A)
2.5
VR=400V
Tj=125°C
2.3
2.0
1.8
1.5
1.3
IF=0.25 x IF(av)IF=0.25 x IF(av)
1.0
0.8
0.5
0.3
0.0
0 5 10 15 20 25 30 35 40 45 50
IF=0.5 x IF(av)IF=0.5 x IF(av)
IF=IF(av)IF=IF(av)
dIF/dt(A/µs)
IF=2 x IF(av)IF=2 x IF(av)
3/8
 Loading...