

Page 1

LISST-AOBS
Super-Turbidity Sensor
User’s Manual
Version 1.3
November 2020
Sequoia Scientific, Inc.
2700 Richards Road Suite 107
Bellevue, WA, 98005, USA
Phone: +1 425-641-0944; Fax: +1 425-643-0595
[email protected]; www.SequoiaSci.com
Page 2

Page 3
FOR TECHNICAL ASSISTANCE please contact your local Distributor, or Sequoia if the
instrument was purchased directly from Sequoia. Please be sure to include the instrument
serial number with any correspondence.
A list of local Sequoia distributors can be found at our website
http://www.sequoiasci.com/about/contact/distributors
Sequoia Scientific, Inc. can be reached at
[email protected] or by phone +1-425-641-0944.
Page 4

INTRODUCTION .............................................................................................................................. 1
LISST-AOBS system parts ...................................................................................................... 1
Data interface and logging options .......................................................................................... 1
Data outputs ............................................................................................................................ 1
Wi ing ...................................................................................................................................... 2
OPERATION WITH THE NEXSENS X2 LOGGER ......................................................................... 3
About the X2 and X2-SDL ....................................................................................................... 3
WQDataLIVE ........................................................................................................................... 3
CONNECT software ................................................................................................................ 3
SDI-12 Addressing .................................................................................................................. 4
Initial setup .............................................................................................................................. 4
Parameter labels on WQDataLIVE .......................................................................................... 4
GENERAL SDI-12 OPERATION ..................................................................................................... 5
Overview .................................................................................................................................. 5
Addressing ............................................................................................................................... 5
Sampling and averaging .......................................................................................................... 5
Recommended command sequences ..................................................................................... 5
SDI-12 COMMAND REFERENCE ...................................................................................................... 6
PROCESSING LOGGED SDI-12 DATA............................................................................................... 7
Raw data ................................................................................................................................. 7
Processing ............................................................................................................................... 7
HOW SUPER-TURBIDITY MEASUREMENT WORKS .................................................................. 8
Acoustic ................................................................................................................................... 8
Optical ..................................................................................................................................... 8
Pairing ABS with turbidity ........................................................................................................ 9
Measuring Pairing Factor ........................................................................................................ 9
Pairing Results ........................................................................................................................ 9
CONNECTION DETAILS ............................................................................................................... 11
Pin functions .......................................................................................................................... 11
Male connector numbering .................................................................................................... 11
Female mating connector numbering .................................................................................... 11
Cables ................................................................................................................................... 11
SPECIFICATIONS ......................................................................................................................... 12
Page 5
1
Introduction
LISST-AOBS
system parts
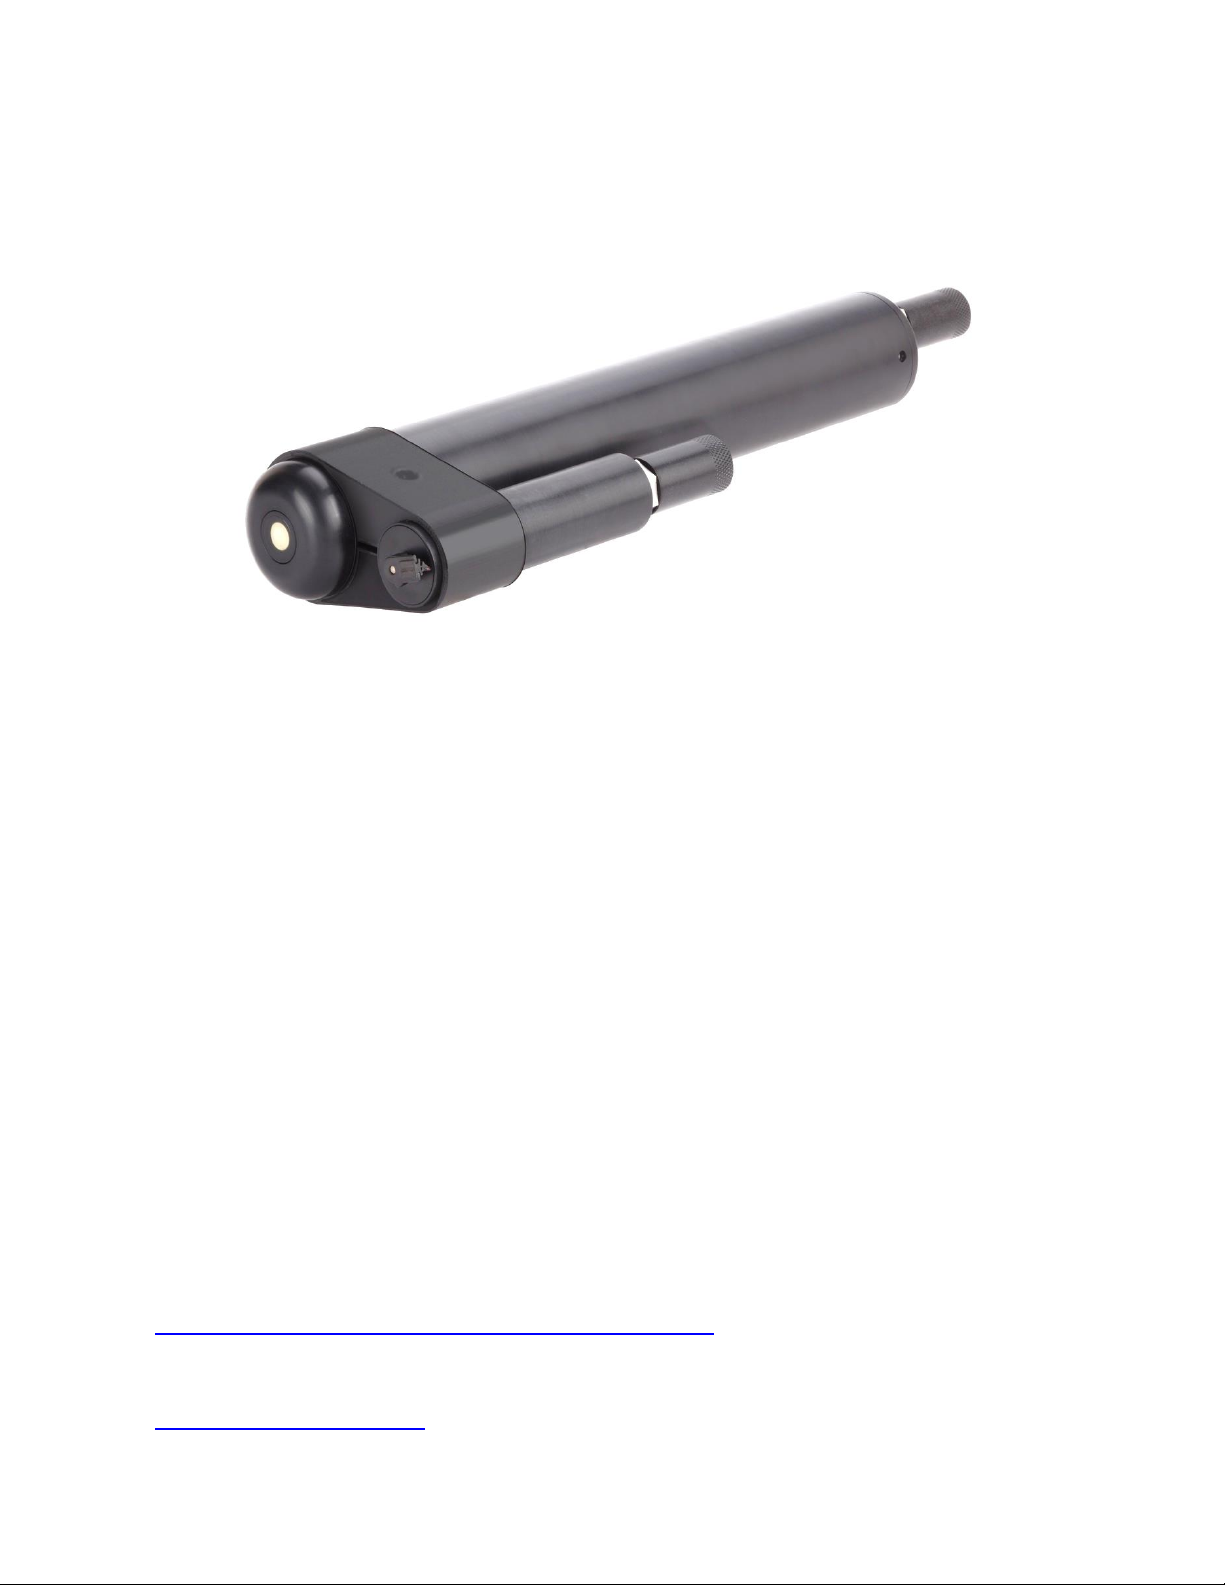
The LISST-AOBS is a system with three main parts:
1. LISST-ABS acoustic backscattering sensor
2. Turner Designs Turbidity Plus™ optical backscattering
sensor
3. An intelligent Y-cable/adapter that provides SDI-12
interfacing with the two sensors.
The combination of acoustic and optical sensors provides
measurements of total s concentration that are much less
affected by particle size than standard turbidity measurements (see
How Super-Turbidity Measurement Works on page 8)
For complete technical details of the Turbidity Plus™, see the
User’s Manual at https://www.turnerdesigns.com/turbidity-plus-
submersible-sensor.
Data interface
and logging
options
LI T-AOBS communicates through t S -12 protocol version
1.3. Any logger that supports SDI-12 can collect LISST-AOBS data.
Sequoia has teamed with NexSens Technology to integrate the
LISST-AOBS with the NexSens X2 logger family. The X2 can
automatically detect a LISST-AOBS and deliver its data, with data
from other connected sensors, through Wi-Fi, cellular or radio
channels. See more in Operation with the NexSens X2 logger on
page 3.
If operating with a logger other than the X2 family, see General
SDI-12 Operation on page 5.
Data outputs
LISST-ABS output is expressed in mg/liter, as calibrated with 75-90
µm microspheres. The Turbidity Plus is reported in Volts, not
calibrated in terms of concentration. The AOBS output, the
absolute concentration in mg/liter, is calculated by the user, as a
simple weighted sum of the two other parameters as described in
Processing Logged SDI-12 Data on page 7.
Page 6

2
Wi ing
As with any SDI-12 device, only three connections are required:
power (nominally 12 V), ground, and SDI-12 data. However, for
compatibility with existing LISST-ABS cabling, the LISST-AOBS
uses the same 8-pin connector as a standard LISST-ABS. For
details, see Connection Details on page 11. The user must
determine how to connect the LISST-AOBS to the SDI-12 logger.
Sequoia Scientific can provide cable pigtails for this purpose.
Page 7

3
Operation with the NexSens X2 logger
About the X2
and X2-SDL
The NexSens X2 is a data logger that directly supports the LISSTAOBS, as well as many other SDI-12 sensors. The X2 is sealed in a
waterproof (but not submersible) housing. The X2-SDL is
functionally identical, but is submersible to a maximum depth of 60
meters.
X2 loggers can communicate their data through a Wi-Fi or cellular
connection (depending on hardware configuration), for near-realtime display of data on the WQDataLive website. Raw data can also
be offloaded directly to a computer through a USB port.
Sequoia Scientific and NexSens offer complete packages that
include an X2 or X2-SDL, and all necessary cabling.
For detailed information, see the X2 Document and Resource
Library at https://www.nexsens.com/knowledge-base-v2/data-
loggers/x2, and the X2-SDL resources at
https://www.nexsens.com/knowledge-base-v2/data-loggers/x2-sdl.
WQDataLIVE
WQData LIVE is a web-based platform for collecting and displaying
data from Nexsens loggers. Users of X2 loggers can set up projects
on this platform, free of charge. A project can have one or more X2
loggers associated with it, and those loggers can automatically
deliver their data to the site through a WiFi or cellular connection
(depending on their hardware). The site aggregates the data and
offers customizable graphical and tabular displays of data. See
https://v2.wqdatalive.com.
CONNECT
software
CONNECT is a Windows application for communicating directly to
the X2 logger. It is not required for routine logging, but is often
helpful for setup. It also allows copying data directly from the
memory of the X2. Full information about CONNECT is available at
https://www.nexsens.com/knowledge-basev2/software/connect/user-guide. The software can be can be
downloaded from https://www.nexsens.com/support/downloads.
Using CONNECT requires an adapter cable, Nexsens part number
UW6-USB-485P, which is supplied with most X2 systems sold by
Sequoia. This cable connects to any USB port on your computer or
laptop, and to the waterproof connection in the center of the X2
logger’s cap.
Page 8

4
SDI-12
Addressing
By default, the LISST-AOBS occupies SDI-12 addresses 0 and 1. If
your system includes other devices, you must ensure that they have
unique addresses. The LISST-AOBS addresses can be changed,
but are limited by the X2 logger detection script to the range 0 to 9,
and the address of the LISST-ABS must be lower than that of the Ycable interface.
Initial setup
Please follow the latest Quick Start Guide from NexSens, available
at https://www.nexsens.com/knowledge-base-v2.
If you purchased the complete X2-LISST-AOBS system as a
package, the X2 logger will already be set up to with knowledge of
the LISST-AOBS that is connected.
If you add sensors or otherwise change the configuration of the
system, you must run the X2’s process for detecting which sensors
are connected. This can be initiated either with the CONNECT
software, or through the X2’s WiFi web interface. For instructions on
running sensor detection from CONNECT, see
https://www.nexsens.com/knowledge-basev2/software/connect/user-guide/run-sensor-detection.
Parameter
labels on
WQDataLIVE
In a WQData LIVE project, the 3 parameters from the LISST-AOBS
are, by default, labeled as follows:
1. Suspended Particle in mg/L—the direct output of the LISSTABS.
2. Voltage—the direct output of the Turbidity Plus sensor
3. Suspended Particle in mg/L—the AOBS composite
concentration, as described on page 7.
For clarity, we recommend that after setting up a project on
WQDataLIVE, you change the parameter names from their defaults.
To do this:
1. On your WQDataLIVE project’s dashboard, pull down the
Admin menu and select Settings.
2. On the Settings page, find the Parameter Settings section.
3. Under Parameter Settings, click on the name of the logger
location, then on the name of the logger.
4. Now you should see a list of all the parameters measured by
the logger, including the LISST-AOBS parameters. You can
edit the names as you see fit. We recommend “ABS
Concentration”, “Turbidity” and “Total Concentration”.
Page 9

5
General SDI-12 Operation
Overview
The acoustic (LISST-ABS) and optical (Turbidity Plus) sensors in
the LISST-AOBS share power and data connections, but are
independent with respect to the SDI-12 data interface. They have
independent SDI-12 addresses and somewhat different command
sets. The commands for the Turbidity measurement are detailed
below, while those for the LISST-ABS are described in its separate
manual.
Addressing
When shipped from Sequoia Scientific, the LISST-ABS is normally
set to address 0 (zero), and the adapter for the Turbidity Plus is set
to address 1. You can change the addresses according to your own
requirements, using standard SDI-12 methods. In this document, we
use a to represent the LISST-ABS address, and o for the address of
the optical sensor.
Sampling and
averaging
The ABS and turbidity sensors in the LISST-AOBS can be sampled
every 1 to 2 seconds, using the SDI-12 M command. However, we
recommend collecting 30-second averages in most cases, to reduce
the effect of natural variability due to turbulent motion of particles.
30-second averaging is executed with the C1 and C2 commands.
Because “C” commands are concurrent, this allows collecting 30second averages simultaneously from the acoustic and optical
sensors.
Recommended
command
sequences
The following command sequence operates the wiper on the
Turbidity Plus wiper before each sample:
1. oC1! – operate wiper, then start 30-second data average
2. aC1!—start concurrent 30-second average in LISST-ABS
3. wait 40 seconds from the time of the oC1! Command
4. aD0!—retrieve the LISST-ABS data
5. oD0!—retrieve the Turbidity Plus data
You can also operate the wiper with a separate command. This is
appropriate if you do not wish to operate the wiper at every sample.
1. [oM1!—operate the wiper (execution takes 10 seconds)]
2. oC2!—start concurrent 30-second data average of turbidity
3. aC1!—start concurrent 30-second average in LISST-ABS
4. wait 30 seconds
5. aD0!—retrieve the LISST-ABS data
6. oD0!—retrieve the Turbidity Plus data
Page 10

6
SDI-12 Command Reference
The following commands are understood by the circuit embedded in the Y-cable adapter,
to control and sample data from the Turbidity Plus sensor. These are separate, and
somewhat different, from the commands for the LISST-ABS sensor (for those, see the
LISST-ABS User’s Manual).
Command Name
Command
Code
Notes
Address Query
?!
Request address (requires that no LISST-ABS
be connected to the Y-cable)
Acknowledge Active
o!
Request response from sensor at address o
Change Address
oAx!
Change address of sensor at address o to x
Send Identification
oI!
Send ID string including SI address, SDI
version, Manufacturers ID and sensor model
Start Measurement
oM!
oM1!
oM2!
oM9!
Sample the turbidity voltage once
Run the wiper for 10 seconds, then check the
position of the wiper. If the position is correct,
the next D command will return a value < 0.5.
Sample the power supply voltage (reported in
Volts upon next D command)
Sample the temperature of the electronics
(reported in C upon next D command)
Start Concurrent
Measurement
oC1!
oC2!
Operate the wiper for 10 seconds, then collect
a 30-second average of the turbidity voltage.
Collect a 30-second average (without
operating the wiper).
Send Data
oD0!
Requests output data from the preceding M or
C command.
Page 11

7
Processing Logged SDI-12 Data
Raw data
If you are using a properly configured Nexsens X2 or X2-SDL logger
(see p. 3), the logger automatically calculates the optimized total
concentration value, in addition to delivering the LISST-ABS and
Turbidity values.
If you are using a different logger, and follow one of the
recommended SDI-12 command sequences (see p.5) , your SDI-12
logger will receive two numeric values for each sample: one from
the LISST-ABS and one from the turbidity sensor.
Processing
When set up and calibrated by Sequoia, the LISST-AOBS Y-cable
controller holds calibration coefficients and calculates the combined
AOBS concentration estimate.
To calculate the total concentration estimate, C
AOBS
, use the formula
C
AOBS
= C
ABS
+ P*(V
OBS
– V0)
where
C
ABS
is the concentration reported by the LISST-ABS, in mg/l
V
OBS
is the voltage from the turbidity sensor
V0 is the offset voltage of the turbidity sensor in clean water
P is the pairing factor in mg/l/V
P and V0 are ordinarily measured by Sequoia Scientific, and
provided when you purchase an AOBS sensor from Sequoia. The
coefficients can also be measured by customers with proper
equipment and training. Contact Sequoia for details.
Page 12
8
How Super-Turbidity Measurement Works
Acoustic
Optical
The LISST-AOBS combines two measurement techniques: acoustic
(ultrasonic) and optical, to measure suspended sediment concentration,
providing data superior to either technique alone.
The acoustic measurement is provided by the LISST-ABS, which
measures backscattering with 8 MHz ultrasonic pulses. The LISST-ABS
works best for particles with diameters from 30 to 400 µm. For more
details, see the LISST-ABS User’s Manual.
The optical measurement is provided by a Turner Designs Turbidity
Plus™ sensor with integrated anti-fouling wiper. The Turbidity Plus’s
sensitivity to particles, like that of any turbidity sensor, is inversely
related to the size of the individual particles. That makes turbidity a poor
proxy for total particle mass, because turbidity from small particles can
be the same as for a much larger mass of large particles.
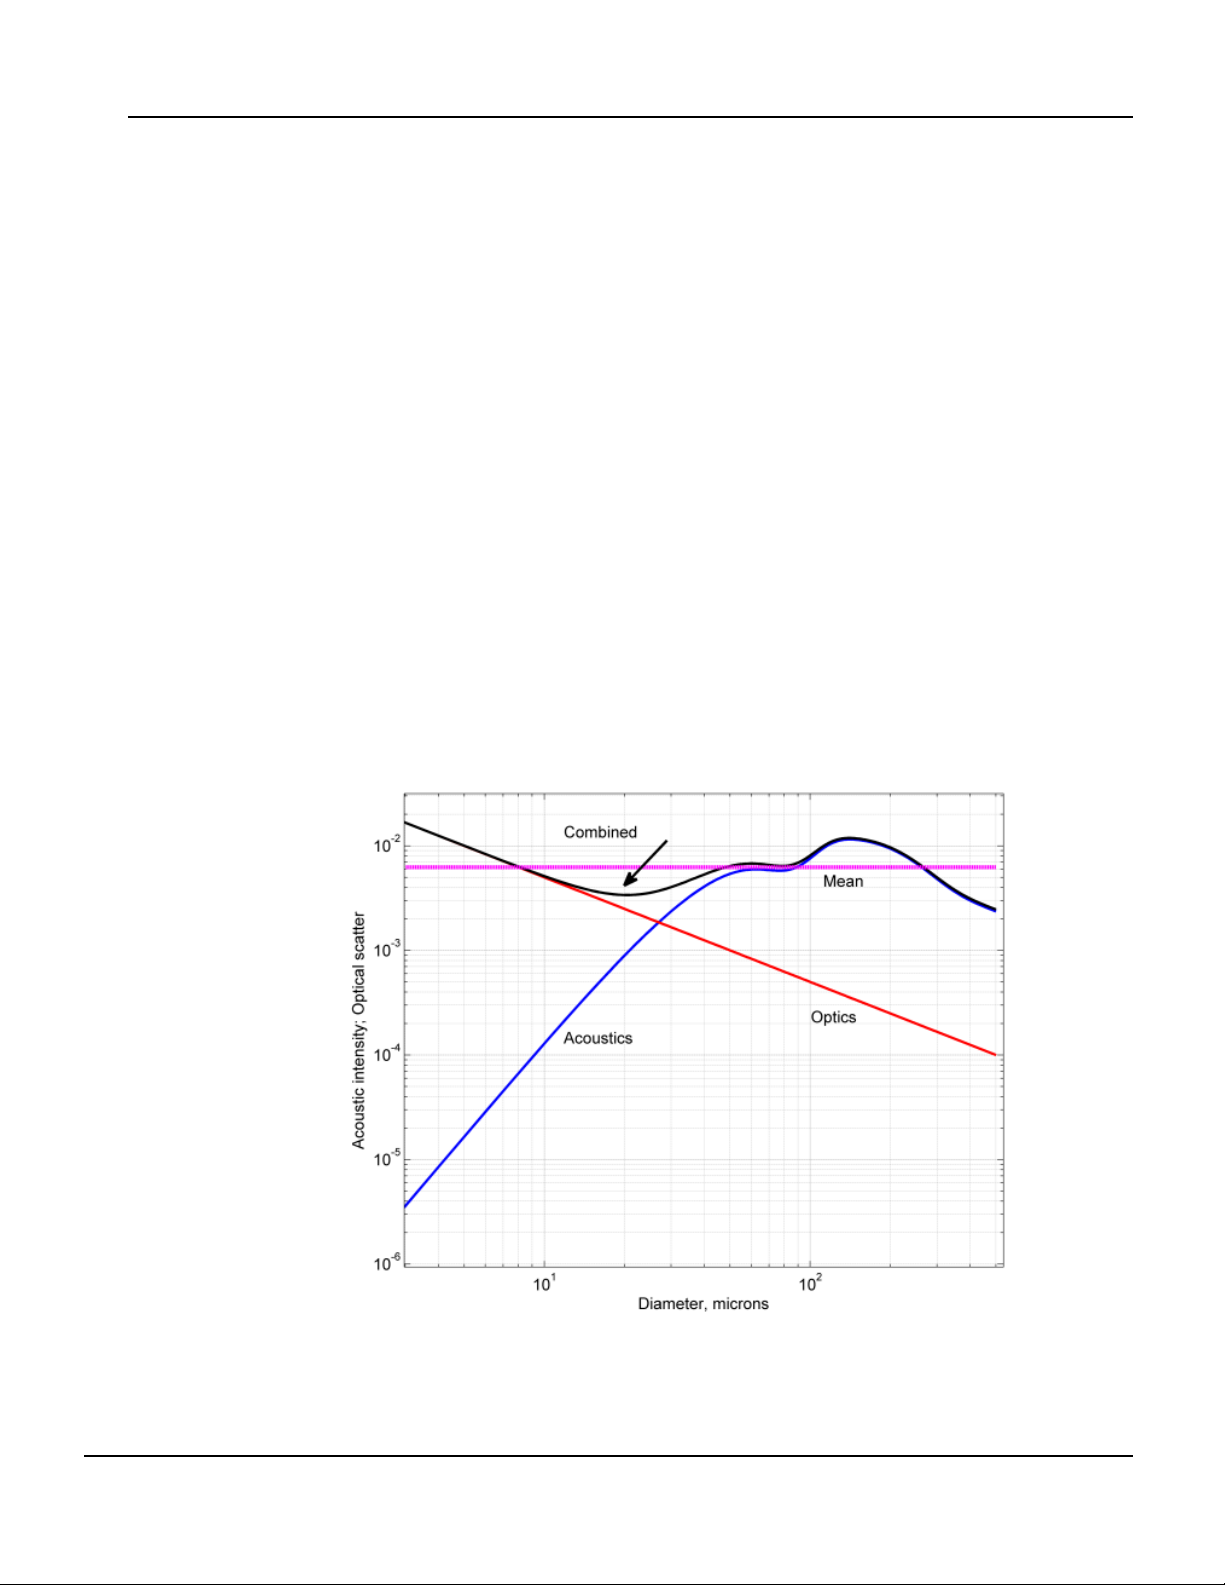
Figure 1 shows the contrast between the ABS (blue curve) and turbidity
(red) sensor responses versus particle size. For particles larger than
about 30 µm, the ABS response is relatively flat, while the response of
the turbidity (OBS) sensor is strongest for smaller sizes.
Figure 1—ABS and OBS response versus particle size
Page 13

9
Pairing
ABS with
turbidity
By combining the complementary characteristics of the optical and
acoustic measurements, the LISST-AOBS provides better tracking of
total sediment concentration than either measurement alone. We can
define a combined concentration measurement, C
AOBS
, as follows:
C
AOBS
= C
ABS
+ P * (V
OBS
– V0)
where
C
ABS
is the concentration reported by the LISST-ABS, in mg/l
V
OBS
is the voltage from the turbidity sensor
Vo is the voltage from the turbidity sensor in clean water
P is the pairing factor in mg/l/V
Intuitively, we can see from Figure 1 that adding the two sensor
responses will produce a curve that is “flatter” than either curve alone,
but it is not obvious what value of P is optimum. From a combination of
theory and experiment, we find that the optimum pairing factor is
P = C
ABS/VOBS
when measured with particles of 30 µm diameter, and with a high
enough concentration to make the clean-water offset V0 negligible. Put
another way, P should have the value that equalizes the acoustic and
optical contributions to C
AOBS
from 30 µm particles.
Measuring
Pairing
Factor
To determine the pairing factor P in practice, we immerse the AOBS
sensors in a suspension of natural particles (Arizona Test Dust) filtered
to a range of 20 to 40 µm, that is, centered on the 30 µm optimum size
cited above. The outputs of the two sensors provide C
ABS
and V
OBS
, and
the ratio of those values is the pairing factor P.
Pairing
Results
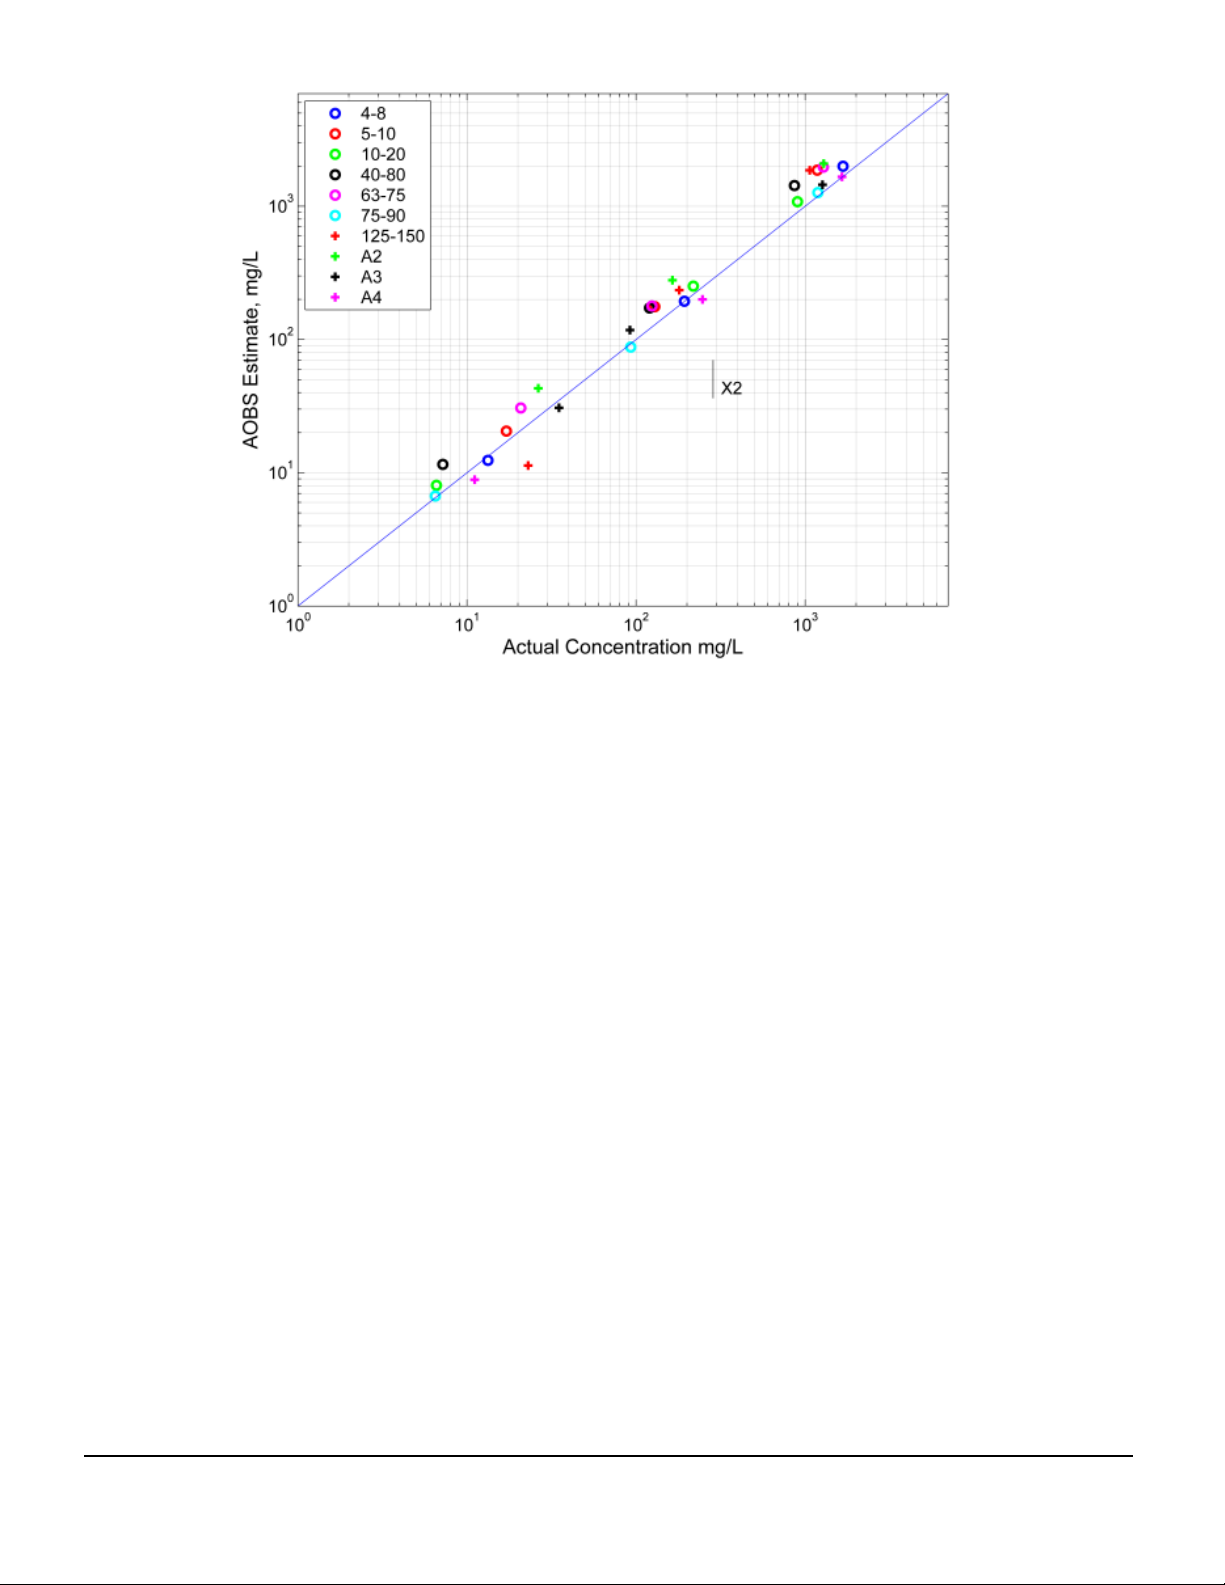
Figure 2 shows the response of a properly paired AOBS sensor to a
wide range of particle sizes and concentrations. While obviously
imperfect (perfect data would lie on the diagonal blue line), these results
are vastly superior to what could be expected from a simple turbidity
measurement.
Page 14
10
Figure 2—Response of combined AOBS sensor for various particle sizes
Page 15
11
Connection Details
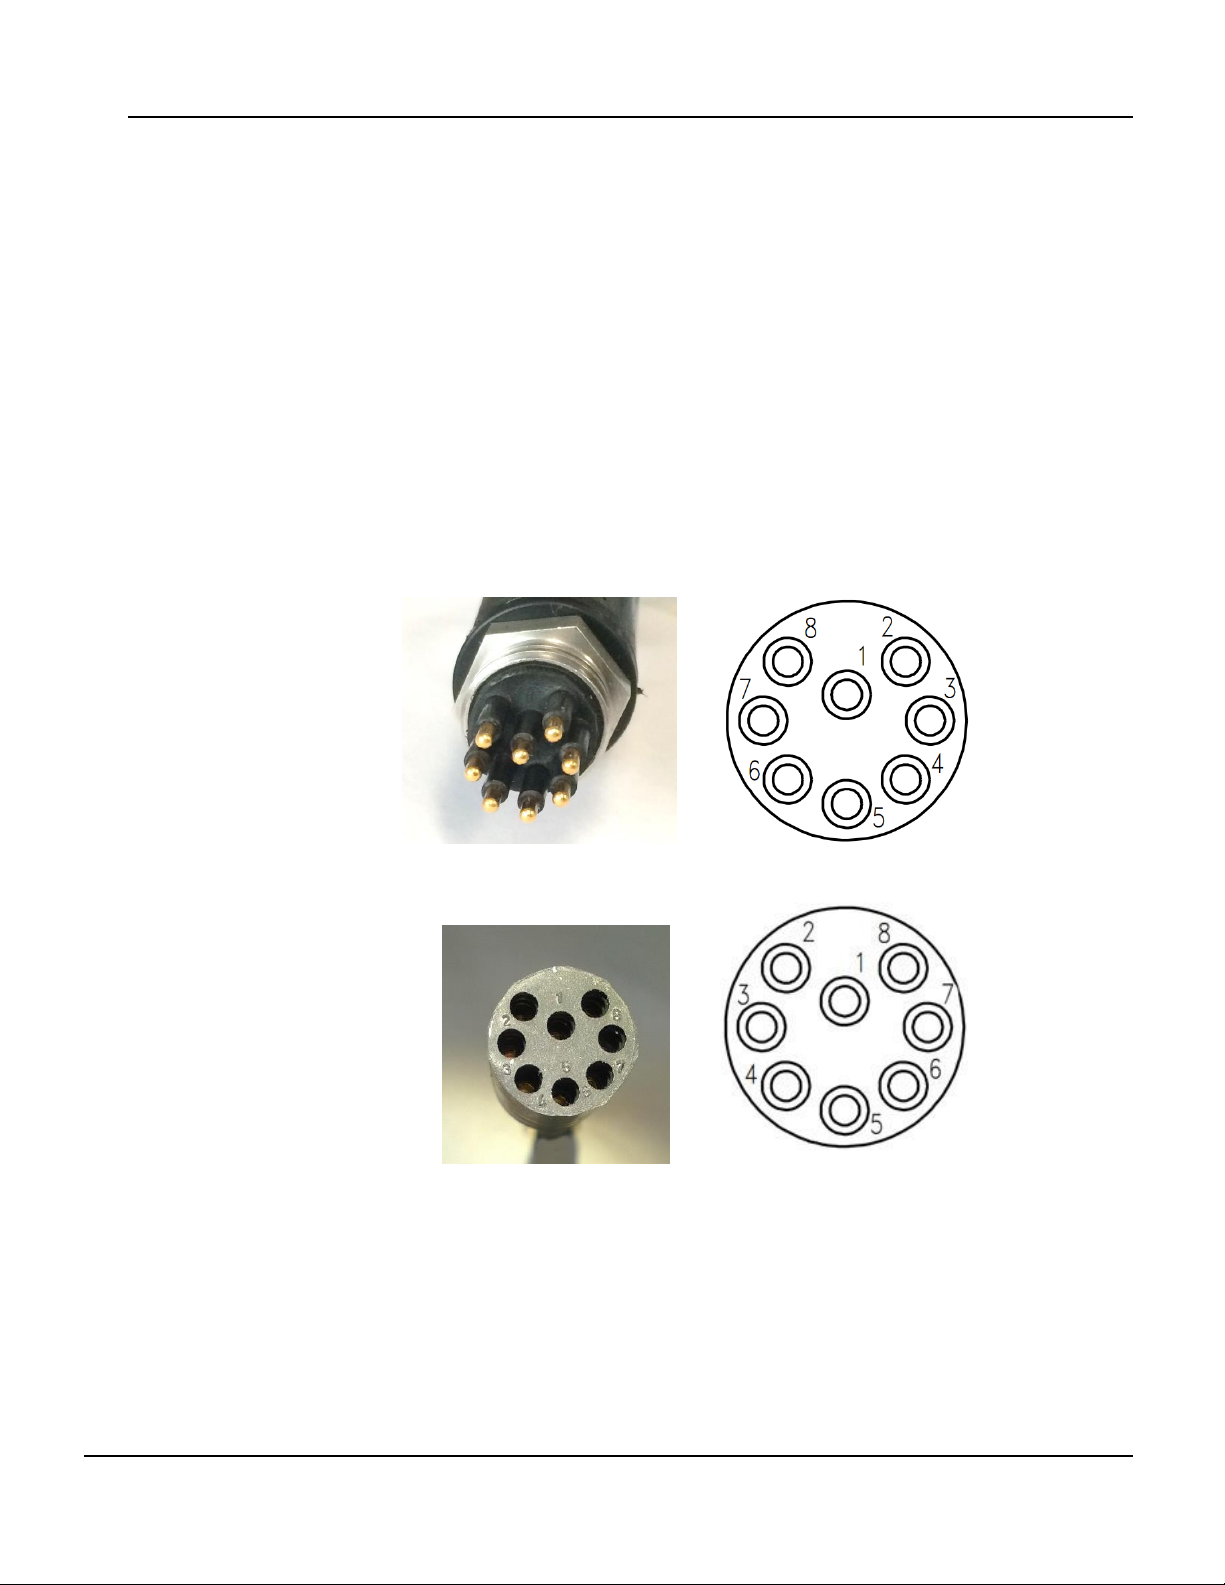
Pin
functions
Male
connector
numbering
Female
mating
connector
numbering
The endcap connector on the LISST-AOBS Y-adapter is an Impulse
MCBH8-M-P, wired as shown below. Mating connector is MCIL8-F-S.
1. Common*
2. Supply voltage, 10 to 18 V
3. Common*
4. No connection
5. No connection
6. SDI-12 input/output
7. No connection
8. Common*
* Connected inside the AOBS.
Cables
Green-jacketed cables supplied by Sequoia Scientific for the LISST-ABS
are compatible with the LISST-AOBS adapter. See the LISST-ABS manual
for details.
Page 16
12
Specifications
• Power Consumption (typical, 12 V input):
o Idle: 80 mA
o Sampling: 120 mA
o Sampling and wiper running: 130 mA
• Input voltage: 10 to 15 VDC (maximum limited by Turbidity Plus™)
• Maximum depth: 100 meters (limited by LISST-ABS)
• Settling time from power-on: 3 seconds
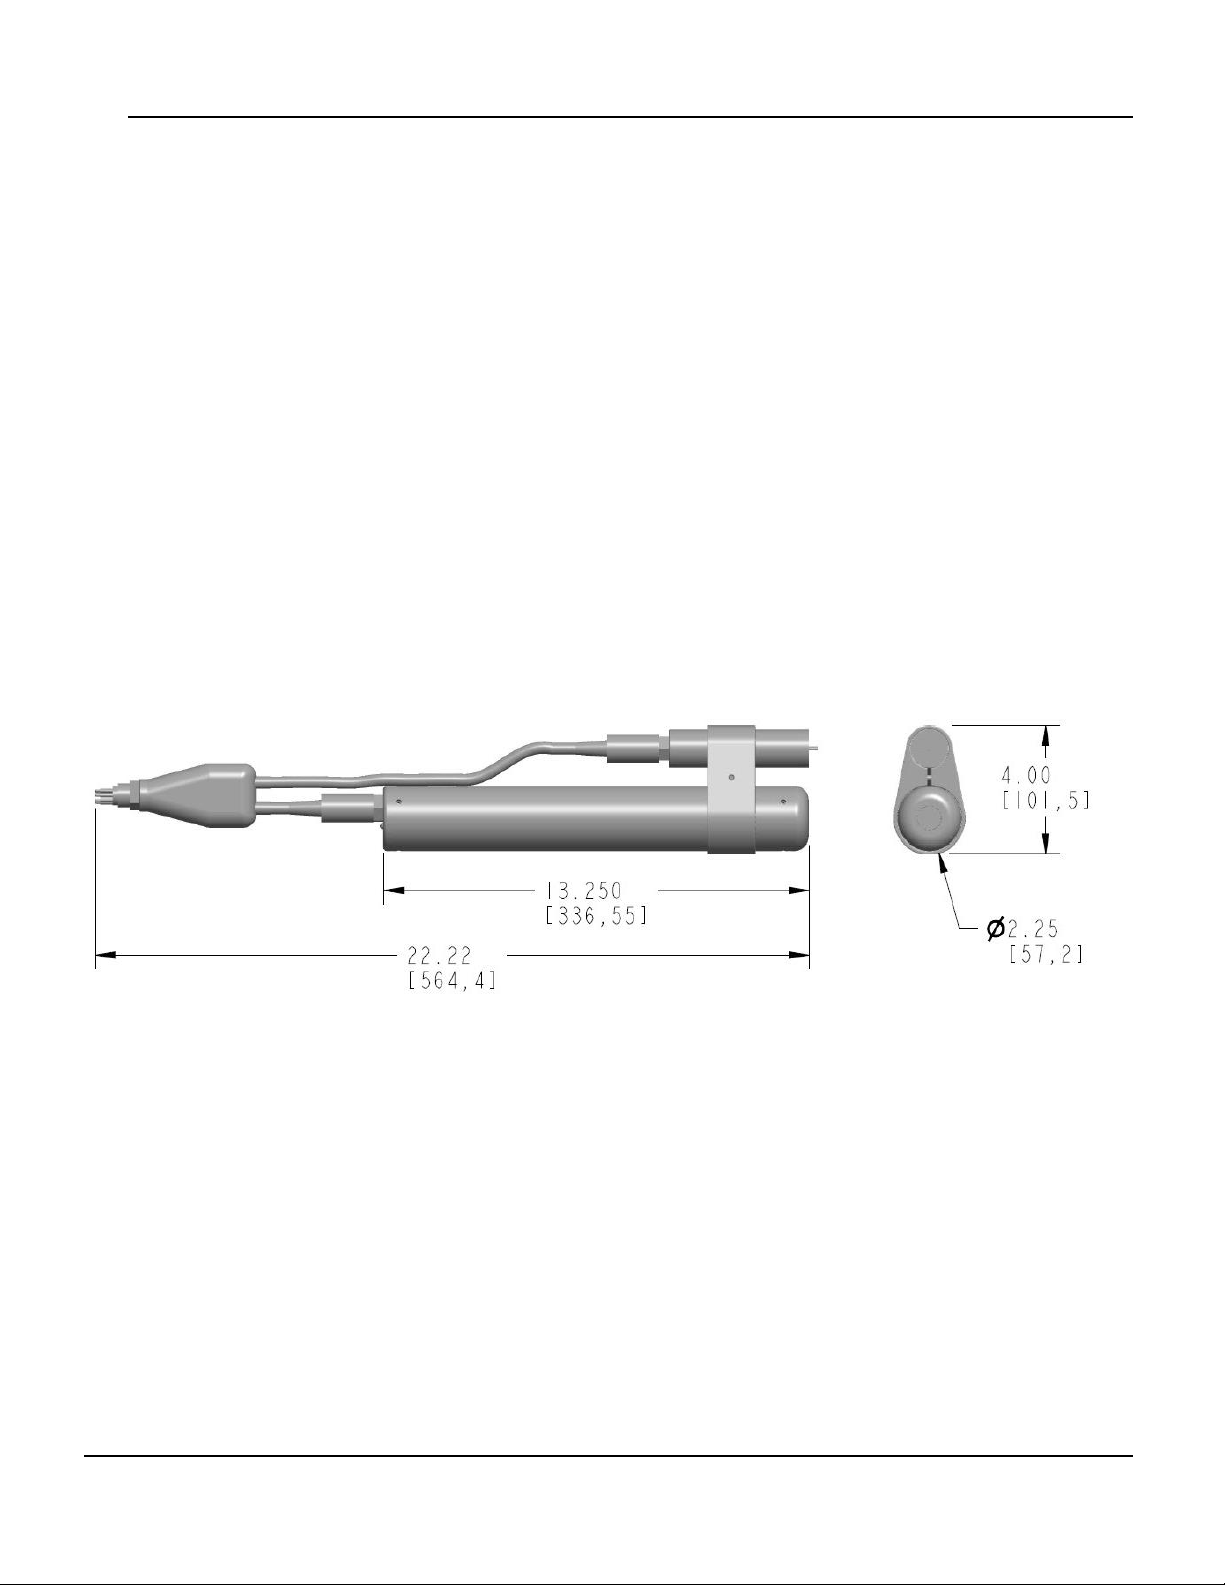
• Dimensions: see drawing below
• Concentration measurement range:
o 1 mg/liter minimum
o 10 g/liter maximum for particles of any size
o 30 g/liter maximum for particles 20 µm or smaller
• Weight: 0.9 kg in air; buoyant in water
• Housing materials: Acetal and ABS plastic
Dimensions in inches [mm]
Page 17

13
Revision history
Version 1.3
Remove incorrect warranty statement. For warranty information see
www.sequoiasci.com/support/warranty
Version 1.2
General revision and formatting, add information about X2 loggers, May
2020
Version 1.1
Improved figure 1. March, 2020
Version 1.0
First released version, March 2020
 Loading...