

Page 1
Sentinel Quick Start Guide
g
The basic information required to use the Sentinel is below. Detailed information
necessary to fully exploit the instrument’s capabilities may be found in the User
Manual and the online help.
Software Compatibility
The Sentinel web browser user interface requires Chrome v6.0, Mozilla Firefox v3.5.x, Safari v5.0, Internet
Explorer 8 (with IE7 Compatibility View off) or later versions of these. We recommend Chrome since it’s
currently fastest. The log data features require the Java Runtime Environment v1.5.x (or later) be installed on
your host computer and enabled in your web browser settings.
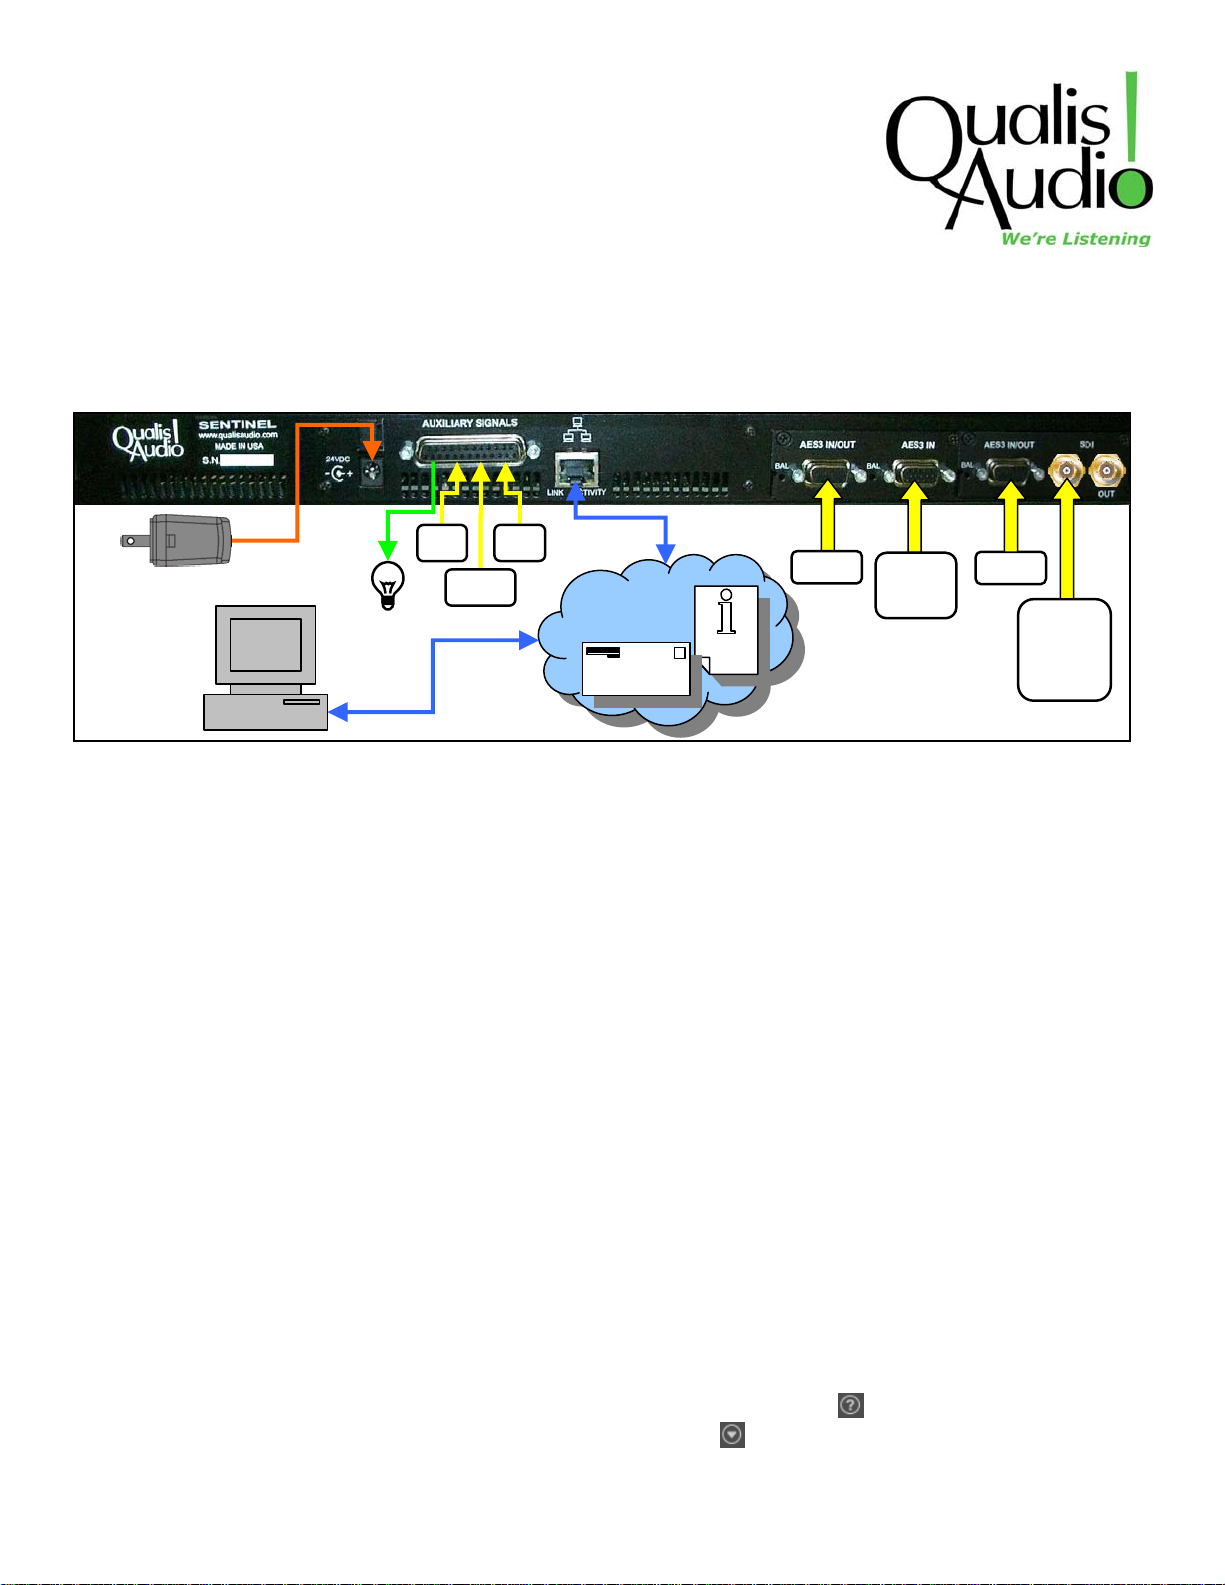
Connections
Logic
LTC
Ethernet
PCM
Coded
Di
ital
PCM
PCM or
DC
Alarms
Coded
Digital
Connect the supplied 24VDC adapter, securing the cable in the plastic clip near the jack.
Connect to your network using an Ethernet cable. The Sentinel’s default is to obtain its IP address
automatically, using DHCP. You can configure it for static IP using the front panel Network Setup menu. Use
the ‘Select’ button to open the menu system and to enter selections.
Connect the audio source. Unbalanced AES digital connections are made using a DB15-HD to BNC VGA
monitor cable on the Red, Green, Blue and Horizontal Sync (usually white or grey) connectors. Balanced AES
digital connections are made using a DB15-HD to XLR cable available from Qualis Audio. SDI signals connect
to the “IN” BNC. Analog versions use the TASCAM standard DB25 pinout.
PCM audio must be applied to the “SDI IN” BNC or the “AES3 IN/OUT” DB15-HD, as appropriate. It cannot be
used with the AES input labeled “AES3 IN”. Dolby coded audio must be connected to the “SDI IN” BNC or the
“AES3 IN” DB15-HD, as appropriate. Coded audio cannot be used with the AES input labeled “AES3 IN/OUT”.
Linear Time Code (LTC) wires to pins 12 and 24 of the Auxiliary Signals connector.
Connect the automation control system to the loudness measurement control inputs: “Program/Commercial” or
“Measure/Pause” goes to pin 1 and “New” or “Reset” to pin 14 of the Auxiliary Signals connector.
Connector pins for alarm outputs and DC inputs are given in the manual and online help.
Set the Sentinel real time clock date, time and time zone through the front panel menu.
Accessing the UI
The Sentinel’s front panel LCD display shows the current date, time and IP address. Enter this IP address in
your web browser as http://<Sentinel IP address>. Help is accessed using the
panels. Settings that only affect the display are accessed with the
icons. These display settings are stored
in browser cookies and don’t affect instrument operation or measurements. Up to 3 users may simultaneously
access the Sentinel and each may have a different combination of displayed panels and local settings.
Quick Start Guide, February 9, 2011 Page 1
icon on any of the displayed
Page 2
Instrument Settings
A
p
Click the “Show Settings” icon to open the settings window. To change settings click the “Modify Settings”
button, a dialog box appears the first time. Leave the username blank, enter audio as the password.
Click the “Inputs & Sources” button to access input and surround format options. For Dolby inputs select
“Coded Audio” for the input Digital Mode. Select a Surround Format, for example “5.1 Ch” then assign the
channels to the appropriate source channels. Other settings affecting measurements, error detection and
alarms are accessed using the other buttons on this page.
Click the “Save Settings” button to send changes to the Sentinel. Click on the “Show Readings” button to
return to the main display panel of the Sentinel.
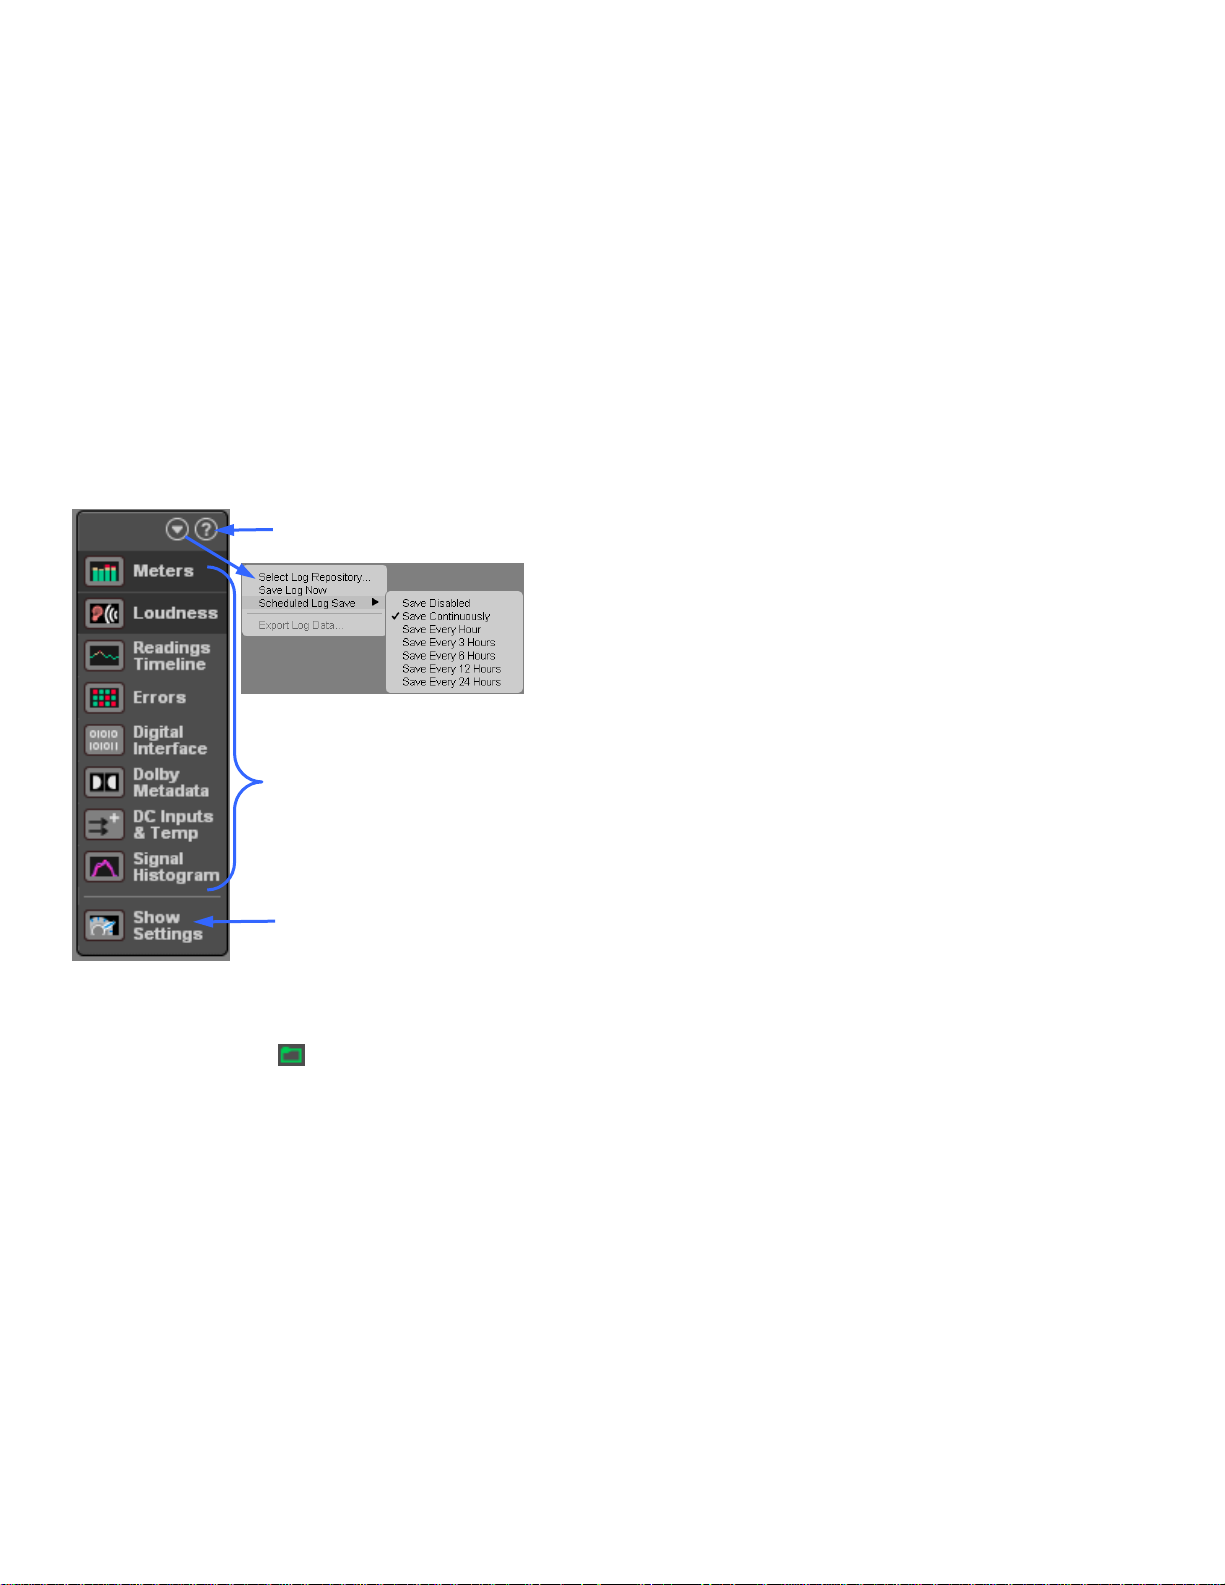
Using Log Data
The Sentinel maintains 27 hours of data in memory. Longer storage requires copying data to a directory called
the Log Repository. This repository is updated by a Java applet which may be run through the browser or
using a Java Web Start application on any computer on the network.
ccess hel
The Log Repository location is defined using the pull-down
menu on the navigation panel (at left). This is required for the
browser to find the repository, regardless of whether saves are
performed through the browser or via the Java Web Start
application.
The “Select Repository” option presents a file browser to select
the desired directory. The “Scheduled Log Save” option
enables periodic downloading of log data from the Sentinel to
the repository, and sets the interval. The “Save Log Now”
Display listed panel(s)
option performs an immediate download of all log data in
memory.
The web interface saves these settings as cookies in your
browser, so they are maintained from one browser session to
the next. You will need to reenter the settings if they are lost,
Go to settings page
e.g. if you clear cookies, change browsers or change the
Sentinel IP address.
Since the scheduled downloading is performed by the web interface, it works only if the browser remains open.
To set up downloads independent of a browser see the user manual.
A folder shaped icon
in the lower left corner of the Meters panel provides an indication of log repository
status. It is green when there are no problems, yellow to indicate a warning, and red to indicate problems. An
updating repository is indicated by a moving dot in the center of the folder. Placing the cursor over the icon will
show a detailed status description.
Common Problems
If the panel selection buttons appear but the panels do not, check that cookies are enabled.
If the Log Repository settings are not available check that Java is enabled.
If the panels do not draw correctly in Internet Explorer 8, check that IE7 compatibility mode is not enabled. If
panels do not draw correctly under other browsers check that the version meets the requirements above.
For other issues call Qualis Audio, Inc. at (503) 635-9376 or email support@qualisaudio.com.
Quick Start Guide, February 9, 2011 Page 2
Page 3

r
A
Close
dBFS for digital
dBu for analog
True Peak
Help
Set Channel Order and
True Peak Hold Time
Sound field balance. Brightness
proportional to channel loudness
Level displays
Level display ballistics
Channel bandwidth
Connection Status
Log Repository Status
Serial numbe
Short-Term Loudness
Short-Term Loudness
Error Threshold
Loudness Target
Momentary Loudness
Program/Commercial
selection
mount LFE cancels when
mixed with surround channels.
Instrument date & time.
Integrated Loudness
Max. Momentary Loudness
Integrated Loudness
Error Tolerance
Loudness Range
Measurement Status
Maximum True-Peak
Loudness Range
Complete & Restart All
Integrated Measurements
Method of converting
1/30th octave data to
octave resolution.
Surround program spectrum
Left, Right, Mono
Downmix level
Linear Time Code
Cancellation when downmixed to stereo and mono,
shows loss of any component in the mix.
The information displayed applies to
the indicated channels. If channels
differ, the indicators will cycle at a 1.5
second interval.
At left, LB and RB have 20 active bits.
Source: SRC4 applies to all channels.
Destination: R applies to RF, RS, RB.
The Common Metadata shown applies
to all channels except LB, RB,
The dropdown menu allows display of
a selected channel’s data.
Quick Start Guide, February 9, 2011 Page 3
Page 4

Short-Term Loudness vs. Time
A
p
g
p
Target Loudness
Loudness Measurement
Blue: Program
Green: Commercial
Break: New segment
Select measurements to display
Playback speed relative to real time
Time scale in measurements/pixel
Range of data selected with slider
End of segment 1
Start of segment 1
Type of segment
P: Program
C: Commercial
+,
-, □: cursor defined
Current segment
bein
measured
Selected segment
Delete Selected Segment
Add New Segment
begin/end cursor manipulation
new select and move split
Percentage of time spent
at the indicated loudness
Errors (yellow) &
larms (red) vs. Time
Jump right to next cursor
Go to real-time if
ast last cursor
Jump left to next cursor
Play/Pause stored data playback
Current Position Cursor
Timeline scroll bar
+, - will display on histogram and
add-to or subtract-from Total
P, C,
□ will not
Total of loudness, max peak and range over segments
identified at left, loudness and
Segment table scroll bar
eak in LKFS, range in LU
The Readings Timeline panel provides access to previous measurements and data stored in the log
repository. Moving the Current Position Cursor away from the right edge of the graph puts the UI
into log data display mode. The measurements for the time selected by the Current Position Cursor
will be displayed on all meters and panels.
The Add New Segment button will cause a numbered pair of begin and end cursors to appear on the
graph. Initially they will overlap. Select the right side and move it left (or the left side and move it
right) to spread them apart. The region they define will appear in the segment table below the
graph. Their locations may also be changed by highlighting the entry and using the keyboard.
Loudness, true peak and loudness range values, along with time information, are displayed in the
table. These segments may be summed to measure disjoint data ranges.
Lettered segments are generated by the Sentinel hardware based on hardware or software control
signals. The P or C identify whether the segment was classified as Program or Commercial content.
The Play/Pause control will start and stop playback of stored data. Speed (from 1X to 64X real time)
is controlled through the drop-down menu. If the Current Position Cursor is between begin and end
Loudness
cursors the playback will stop when the end cursor is reached.
Quick Start Guide, February 9, 2011 Page 4
 Loading...