

Page 1
Consultation with SebaKMT
Abwassernetze
User Manual
Noise Level and Frequency Logger
Sebalog N3
Mess- und Ortungstechnik
Measuring and Locating Technologies
Elektrizitätsnetze
Power Networks
Kommunikationsnetze
Communication Networks
Rohrleitungsnetze
Water Networks
Sewer Systems
Leitungsortung
Line Locating
1 (08/2011) - ENG
1
Page 2

Consultation with SebaKMT
2
Page 3
Consultation with SebaKMT
Consultation with SebaKMT
The present system manual has been designed as an operating guide and for
reference. It is meant to answer your questions and solve your problems in as fast and
easy a way as possible. Please start with referring to this manual should any trouble
occur.
In doing so, make use of the table of contents and read the relevant paragraph with
great attention. Furthermore, check all terminals and connections of the instruments
involved.
Should any question remain unanswered, please contact:
Seba Dynatronic
Mess- und Ortungstechnik GmbH
Dr.-Herbert-Iann-Str. 6
D - 96148 Baunach
Phone: +49 / 9544 / 68 – 0
Fax: +49 / 9544 / 22 73
E-Mail: sales@sebakmt.com
http://www.sebakmt.com
Hagenuk KMT
Kabelmesstechnik GmbH
Röderaue 41
D - 01471 Radeburg / Dresden
Phone: +49 / 35208 / 84 – 0
Fax: +49 / 35208 / 84 249
SebaKMT
All rights reserved. No part of this handbook may be copied by photographic or other means unless SebaKMT
have before-hand declared their consent in writing. The content of this handbook is subject to change without
notice. SebaKMT cannot be made liable for technical or printing errors or shortcomings of this handbook.
SebaKMT also disclaim all responsibility for damage resulting directly or indirectly from the delivery, supply, or
use of this matter.
3
Page 4

Terms of Warranty
Terms of Warranty
SebaKMT accept responsibility for a claim under warranty brought forward by a
customer for a product sold by SebaKMT under the terms stated below.
SebaKMT warrant that at the time of delivery SebaKMT products are free from
manufacturing or material defects which might considerably reduce their value or
usability. This warranty does not apply to faults in the software supplied. During the
period of warranty, SebaKMT agree to repair faulty parts or replace them with new parts
or parts as new (with the same usability and life as new parts) according to their choice.
SebaKMT reject all further claims under warranty, in particular those from consequential
damage. Each component and product replaced in accordance with this warranty
becomes the property of SebaKMT.
All warranty claims versus SebaKMT are hereby limited to a period of 12 months from
the date of delivery. Each component supplied by SebaKMT within the context of
warranty will also be covered by this warranty for the remaining period of time but for 90
days at least.
Each measure to remedy a claim under warranty shall exclusively be carried out by
SebaKMT or an authorized service station.
To register a claim under the provisions of this warranty, the customer has to complain
about the defect, in case of an immediately detectable fault within 10 days from the date
of delivery.
This warranty does not apply to any fault or damage caused by exposing a product to
conditions not in accordance with this specification, by storing, transporting, or using it
improperly, or having it serviced or installed by a workshop not authorized by SebaKMT.
All responsibility is disclaimed for damage due to wear, will of God, or connection to
foreign components.
For damage resulting from a violation of their duty to repair or re-supply items,
SebaKMT can be made liable only in case of severe negligence or intention. Any liability
for slight negligence is disclaimed.
4
Page 5

Contents
Contents
Consultation with SebaKMT ........................................................................................... 3
Terms of Warranty ........................................................................................................... 4
Contents ........................................................................................................................... 5
1
1.1
1.2
1.3
2
3
3.1
3.2
3.3
3.4
3.5
4
Technical description ...................................................................................... 7
Technical data .................................................................................................... 9
Scope of delivery and accessories ................................................................... 12
Optional accessories ........................................................................................ 12
Important and common terms ...................................................................... 13
The loggers ..................................................................................................... 15
Function ............................................................................................................ 15
Design .............................................................................................................. 16
Switching on and off ......................................................................................... 17
Memory............................................................................................................. 17
Power supply .................................................................................................... 17
The Commander ............................................................................................. 18
4.1
4.2
4.3
4.4
4.5
4.6
4.6.1
4.6.2
4.7
4.8
4.8.1
4.8.2
4.8.3
4.8.4
4.9
4.10
4.11
4.12
Function ............................................................................................................ 18
Device design ................................................................................................... 19
Design of the user interface ............................................................................. 20
Basics of operation ........................................................................................... 21
User mode ........................................................................................................ 23
Making a connection ........................................................................................ 24
Connection between the Commander and logger ........................................... 24
Connection between the Commander and PC................................................. 24
Switching on the display lighting ...................................................................... 25
System settings ................................................................................................ 25
Basic settings ................................................................................................... 26
Extended settings in Professional mode .......................................................... 27
System info ....................................................................................................... 28
Saving settings ................................................................................................. 28
Performing a hardware reset ............................................................................ 28
Updating the firmware ...................................................................................... 29
Memory............................................................................................................. 30
Power supply .................................................................................................... 30
5
5.1
5.1.1
5.1.2
Working in Easy mode ................................................................................... 31
Starting up the Commander ............................................................................. 31
Switching on the Commander .......................................................................... 31
Checking the basic settings ............................................................................. 31
5
Page 6

Contents
5.1.3
5.2
5.3
5.4
5.4.1
5.4.2
5.5
5.5.1
5.5.2
6
6.1
6.1.1
6.1.2
6.1.3
6.2
6.2.1
6.2.2
Defining a workgroup ....................................................................................... 32
Programming the loggers ................................................................................. 33
Installing the loggers ........................................................................................ 35
Reading out the measured data ....................................................................... 37
Reading out a “Lift&Shift” group ....................................................................... 38
Reading out a “Patrol” group ............................................................................ 39
Evaluating the measured data ......................................................................... 41
Calling up the measured values ....................................................................... 41
Displaying the measured values ...................................................................... 42
Working in Professional mode ..................................................................... 44
Starting up the Commander ............................................................................. 44
Switching on the Commander .......................................................................... 44
Checking the system settings .......................................................................... 44
Registering loggers in the Commander and specifying the workgroup ........... 44
Managing the loggers ....................................................................................... 45
Managing logger groups in the Commander .................................................... 45
Managing the loggers in the Commander ........................................................ 47
6.3
6.4
6.5
6.5.1
6.5.2
6.5.3
6.6
6.6.1
6.6.2
7
7.1
7.2
7.2.1
7.2.2
7.2.3
7.2.4
8
Programming the loggers ................................................................................. 50
Installing the loggers ........................................................................................ 53
Reading out the measured data ....................................................................... 54
Quick query of the workgroup .......................................................................... 54
Standard query of a single logger .................................................................... 55
Standard query of a “Lift&Shift” group .............................................................. 55
Evaluating the measured data ......................................................................... 56
Calling up the measured values ....................................................................... 56
Displaying the measured values ...................................................................... 57
Additional measuring functions ................................................................... 58
Real time measurement ................................................................................... 58
Audio recordings .............................................................................................. 60
Reading out the audio data .............................................................................. 60
Playing back the audio data ............................................................................. 61
Displaying the frequency spectrum of the leak noise (in Professional mode
only) .................................................................................................................. 62
Recording a noise directly (in Professional mode only) ................................... 63
Increasing the wireless range of the loggers with repeaters when
patrolling (in Professional mode only) ......................................................... 64
8.1
8.2
Repeater design ............................................................................................... 65
Installing the wireless extension ....................................................................... 66
6
Page 7
Technical description
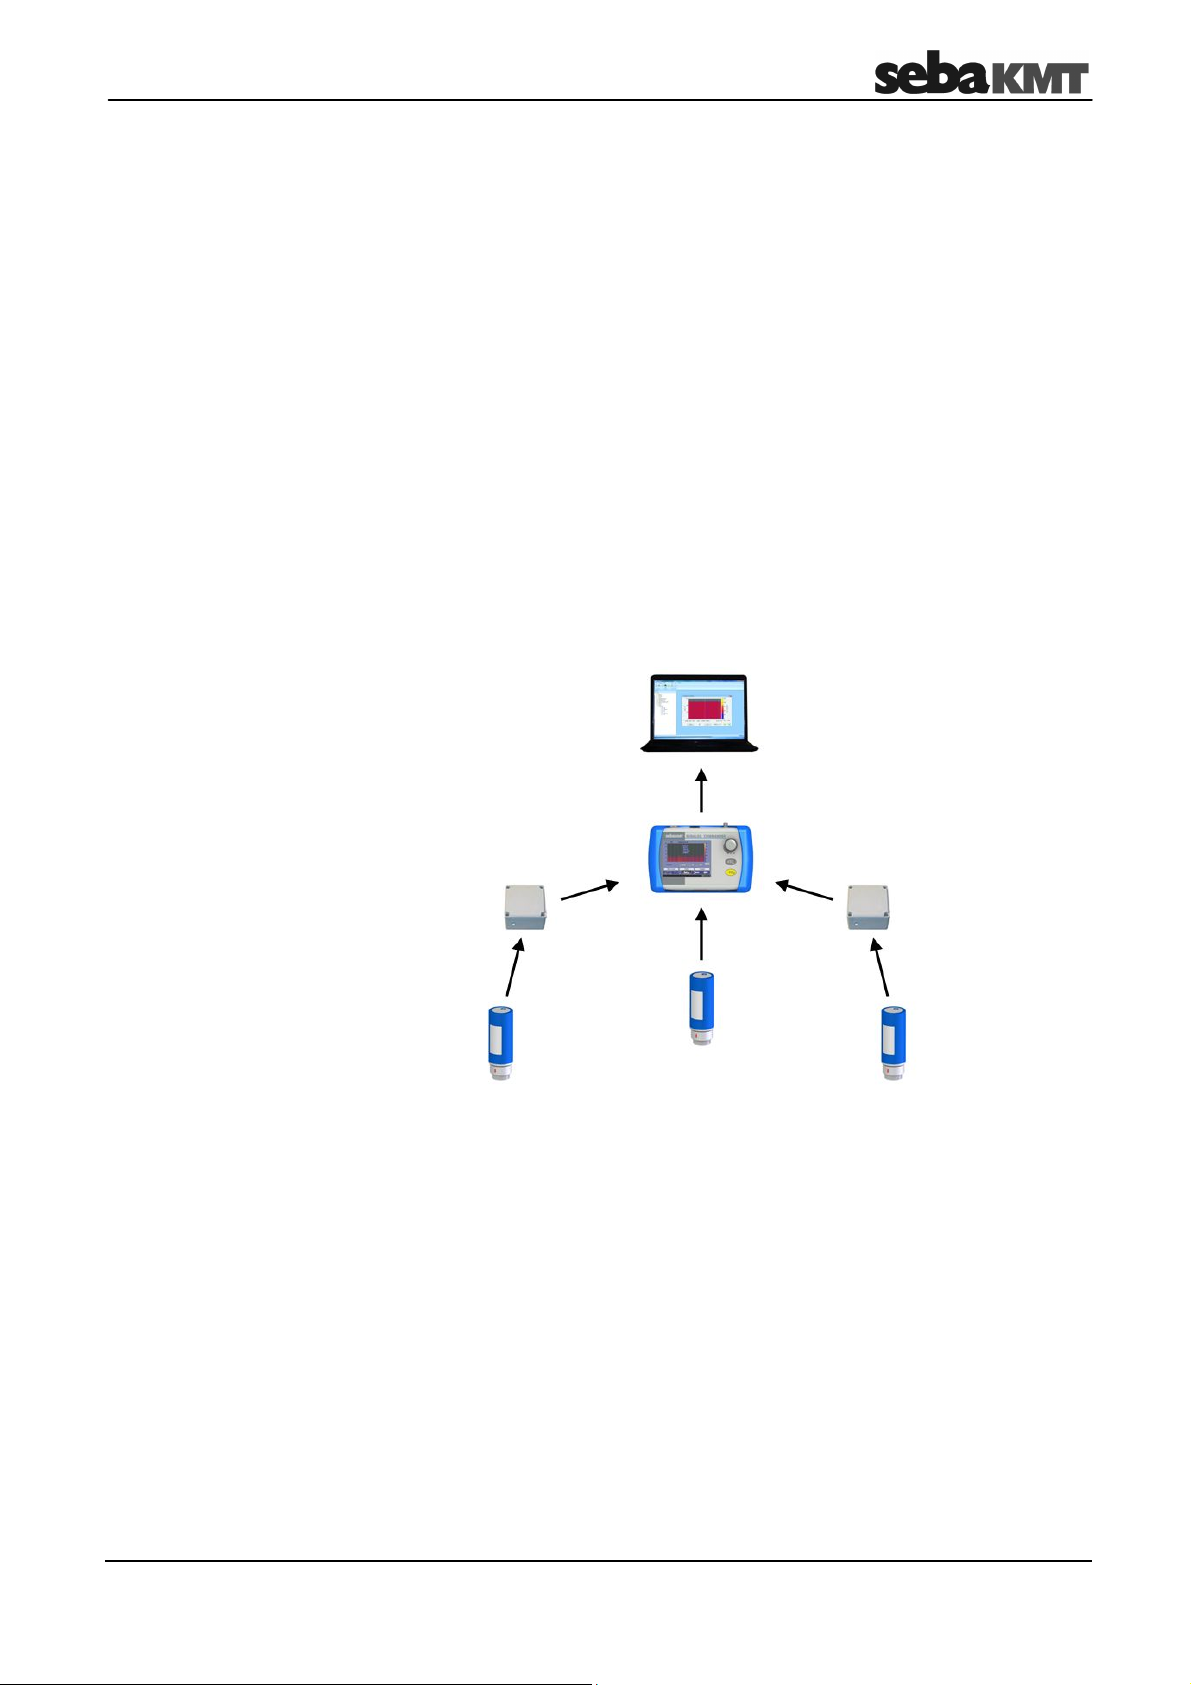
1 Technical description
Function
Sebalog N-3 is a system for acoustically monitoring pipe systems. It has Log N-3 noise
level loggers and the Commander-3 as its basis. The Commander is used for
programming the loggers as well as reading out and analysing the recorded
measurements.
To monitor a zone, you can attach as many noise level loggers along the pipe as you
wish. They then perform regular noise measurements within a certain time window. The
user can set the exact measurement time window and other parameters before
measuring begins. The level and frequency of the individual measurements are saved in
the logger. Even the quietest noise is saved as an audio recording.
After measuring, you can collect the loggers, call up the readings and check for leak
noises, and then put them back in a new zone, for example. This allows all the zones in
a pipe system to be checked in succession for leaks.
However, the loggers can also be left in the same zone to monitor it permanently. The
measurements from the individual loggers are then read out on site. Just approaching
the installed loggers with the Commander or another reader will suffice. Wireless data
transfer takes place automatically. Ideally, all you have to do is drive by where the
loggers are being used.
Features
The Sebalog N-3 system has the following features:
• Loggers can be used temporarily, permanently or in the network
• Wireless communication between all components
• Audio data recorded directly in the logger
• “Commander-3” with colour display, USB port, large memory capacity, and
much more.
• Complete group/logger management without a PC
• History function
• Extended wireless range using repeater
• Logger available as TNC version with external antenna
7
Page 8
Technical description
Components
The Sebalog N-3 system consists of the following components:
Component
Log N-3
noise loggers
Commander-3 is the portable device for programming the loggers before measuring,
Repeaters-3 forward the radio signals from the loggers and therefore extend the
GSM box-3 is used as the interface between the logger network and control
SebaDataView-3
software
Reader-3 is a convenient device for reading out the measurements taken by
Log RI is used as the wireless interface to the loggers or repeaters when
Use
measures regularly the volume level and frequency of the noise in
the pipe during the programmed measuring window.
and for reading out and analysing the recorded data after measuring.
wireless link between the loggers and Commander.
centre during wireless remote data transmission.
is the application software for programming the loggers before
measuring, and for reading out and analysing the recorded data with
a PC or laptop.
the Sebalog series of loggers.
connected to a PC/laptop.
8
Page 9
Technical description
1.1 Technical data
Logger
The noise level loggers in the Sebalog N-3 system are specified by the following
technical parameters:
Parameter
Wireless interface (bidirectional)
•
Frequency
•
Transmitting power
•
Range
Value
868 MHz (915 MHz optional)
10 mW
Approx. 80 m (depends on the surroundings)
Memory capacity Max. 100 measuring days
Audio recording Possible
Power supply Lithium battery
Battery life Max. 5 years (depending on use)
Operating temperature -20 to 60°C (-4°F to 140°F)
Storage temperature -25 to 70°C (-13°F to 158°F)
Dimensions (W x H) 115 x 45 mm
Weight 400 g
Degree of protection IP68
Commander-3
The Sebalog N-3 Commander is specified by the following technical parameters:
Parameter Value
Display 6’’ VGA colour display, 640 x 480 pixels
Wireless interface (bidirectional)
•
Frequency
•
Transmitting power
•
Range
868 MHz (915 MHz optional)
10 mW
Approx. 100 m (depends on the surroundings)
USB port USB 2.0 for connecting to a PC
Memory capacity 2 GB (corresponding to approx. 1,000 groups,
each with 1,000 loggers, including audio data, etc.)
Power supply Li-ion rechargeable battery (7.4 V / 12.25 Ah);
connection to 110-240 V supply using charger
(input: 50-60 Hz, 700 mA)
Operating time Approx. 20 hours
Operating temperature -20 to 60°C (-4°F to 140°F)
Storage temperature -25 to 70°C (-13°F to 158°F)
Dimensions (L x W x H) 250 x 190 x 100 mm
Weight 2,100 g
Degree of protection IP65
9
Page 10
Technical description
Reader-3
The Reader-3 reading device in the Sebalog N-3 system is specified by the following
technical parameters:
Parameter Value
Display LCD display (b/w), 128 x 32 pixels
Wireless interface (bidirectional)
•
Frequency
•
Transmitting power
•
Range
868 MHz (915 MHz optional)
10 mW
Max. 100 m (depends greatly on the surroundings)
USB port USB 2.0 for connecting to a PC via docking station
Memory capacity 1 GB (SD memory card)
Power supply Li-ion rechargeable battery (7.2 V / 12 Ah)
Operating time 10 hours
Operating temperature -20 to 60°C (-4°F to 140°F)
Storage temperature -25 to 70°C (-13°F to 158°F)
Dimensions (L x W x H) 200 x 100 x 60 mm
Weight 450 g
Degree of protection IP22
Repeater-3
The repeaters in the Sebalog N-3 system are specified by the following technical
parameters:
Parameter Value
Display Status LED
Wireless interface (bidirectional)
•
Frequency
•
Transmitting power
•
Range
868 MHz (915 MHz optional)
10 mW
Max. 400 m (depends on the surroundings)
Power supply Lithium battery (replaceable)
Battery life Max. 5 years (depending on use)
Operating temperature -20 to 70°C (-4°F to 158°F)
Storage temperature -25 to 70°C (-13°F to 158°F)
Dimensions (L x W x H) 80 x 80 x 55 mm
Weight 250 g
Degree of protection IP67
10
Page 11
Technical description
GSM box-3
Log RI
The GSM box in the Sebalog N-3 system is specified by the following technical
parameters:
Parameter Value
Wireless interface (bidirectional)
•
Frequency
•
Transmitting power
•
Range
868 MHz (915 MHz optional)
10 mW
Max. 400 m (depends on the surroundings)
Memory capacity 2 GB (corresponds to the data from approx.
50 loggers)
Power supply Lithium battery (replaceable)
Battery life Up to 4 years
Operating temperature -20 to 70°C (-4°F to 158°F)
Storage temperature -25 to 70°C (-13°F to 158°F)
Dimensions (L x W x H) 170 x 140 x 100 mm
Weight 1,000 g
Degree of protection IP67
The Log RI wireless interface in the Sebalog N-3 system is specified by the following
technical parameters:
Parameter Value
Display Status LED
Wireless interface (bidirectional)
•
Frequency
•
Transmitted power
•
Range
868 MHz (915 MHz optional)
10 mW
Max. 10 m (depending on surroundings)
USB port USB 2.0 for connecting to a PC
Power supply Via USB
Operating temperature 0 to 40°C (32°F to 104°F)
Storage temperature 0 to 40°C (32°F to 104°F)
Dimensions (L x W x H) 83 x 17 x 47 mm
Weight 50 g
Degree of protection IP22
11
Page 12
Technical description
1.2 Scope of delivery and accessories
The Sebalog N-3 system is delivered with the following as standard:
Logger set
Commander set
A logger set consists of the following components:
Designation Description Item No.:
LOG N-3 Noise level logger
(number depending on set size)
LOG TB-240 Transport box 118303892
MWA LOG N-3 Magnetic angle adaptor 118303355
Thread cap M6 118304578
A Commander is delivered with the following components:
Designation Description Item No.:
LOG CDR-3 Commander-3 820024391
LOG CDR-3-T Carrier bag for Commander-3 820025752
LK 14 Vehicle charger cable (3.5 m long) 81003758
Antenna 868 MHz
with magnet (MAG3-900 TNC)
LG SEBALOG Charger for Commander-3 810919
VK 77 Connection cable (USB output) 820012451
820019682
122010060
KR 22-5 Stereo headphone 810002087
User software
The SebaDataView-3 software for PC/laptop is part of the scope of delivery:
Designation Description Item No.:
CSW DATAVIEW-3
1.3 Optional accessories
The following optional accessories are available:
Designation Description Item No.:
GPS module
SebaDataView-3 user software
118302210
12
Page 13

Important and common terms
2 Important and common terms
User mode
Level and frequency
ESA value
Group mode
The Commander-3 can be operated in two different user modes (see page 23):
• Easy mode
• Professional mode
You can switch between these modes in system settings menu (see page 25).
These two values are identified each time a noise logger performs a measurement:
• “Level”
• “Frequency”
ESA stands for “Extended Spectral Analysis” and means that noise level and frequency
are combined in one reading using a mathematical formula. This results in an extended
view of the measured data, which makes the leak probability and position visible in
relation to other loggers. The dimensionless ESA value can be between 0 and 100. The
higher the ESA value, the higher the leak probability and the shorter the distance from
the logger to the leak.
In order to analyse the recorded measurements, the noise loggers must be read after
measuring, i.e. the data in the loggers is accessed wirelessly with a reading device
(Commander/Reader/PC). It is possible to do this in the following ways:
Group mode
… is the noise level (volume) of a measurement
… is the frequency in the measurement’s frequency spectrum with
the greatest deflection
“Lift&Shift” “Patrol” “Network”
The loggers are collected;
data is read out wirelessly
in the office
The method must be chosen for reading out the measured data before the measuring
work is performed. Before measuring, the mode decided on is permanently assigned to
the loggers or logger groups. After that, only loggers that have been configured for
reading using “Patrol” can be read with “Patrol”, for example, and not with “Lift&Shift” or
“Network”. The same applies to the other group modes.
The loggers remain at
the place of use;
data is read out
wirelessly while
“driving by”
All the installed loggers
are networked with each
other and connected to
a GSM box;
data is read out via
mobile radio from the
office
13
Page 14

Important and common terms
Workgroup
Measuring window
Measuring period
Leak threshold
Leak status
Leak value
Configuration mode
The Commander can only ever interact with a single registered logger group. This group
is called the “workgroup”. It is not possible to program or read loggers from another
group.
The “measuring window” is the time during which a logger is programmed to carry out
measurements, e.g. from 2 a.m. until 4 a.m. in the morning.
A measuring window could also be referred to as a “measuring day”.
A measuring period refers to the time span that passes between programming and
reading a logger. A measuring period can therefore last 1 to 100 measuring days.
There is a certain basic noise level in each pipe system. This basic noise level is
referred to as the “leak threshold”. This level may be known or estimated based on
experience. If the lowest measured noise level in a section of pipe is above the leak
threshold, there is presumed to be a leak.
If the level of the quietest noise in a measuring window is above the previously found
leak threshold (see above), the logger goes into “leak status”. This means, for example,
that when this logger is read, a warning appears on the reader indicating that there is an
increased probability of a leak close to the logger.
The term “leak value” combines the three measurement results – level, frequency and
ESA value – determined for the quietest noise in a measuring period.
If a noise logger has been switched off (i.e. it has stood “on its head” for at least
3 minutes), it is in “configuration mode” after it is switched back on. This means:
• The previous programming has been deleted. The logger is now unprogrammed.
• Switching off has not deleted the previously saved measurement results. They are
still in the logger’s memory and can be accessed by a reading device, but only by
single interrogation (see page 54).
• The logger is ready for wireless operation and waiting to be contacted by the
Commander or PC.
The logger remains in configuration mode until it is reprogrammed.
Identification number
Each device in the Sebalog N-3 series has a unique serial number (SN). You will find it
on the type plate of the device.
All loggers, repeaters and GSM boxes also have an identification number (ID) which can
be used by the Commander or the SebaDataView software to manage them. You will
also find the ID on the type plate, or on a separate plate on the device. The identification
number is identical to the last six digits of the serial number.
When inputting an ID, the preceding zero digits can be omitted.
Thus, if the ID is “000815”, you need only enter “815”.
14
Page 15

The loggers
3 The loggers
3.1 Function
The noise loggers are installed along a section of pipe directly on the pipe, or directly on
fittings on the pipe.
Within the configured measuring window, they perform regular noise measurements,
each 3 seconds in length. The volume level and frequency of each measurement are
saved in the logger. While the noise level alone only records the general existence of a
leak, together with the frequency it also provides information on the approximate
distance in relation to other loggers.
The measurement results gathered by the logger can be queried later using a reading
device (Commander/Reader/PC).
The quietest noise of the last measuring window is saved as an audio file. After reading
out the data, you can actually listen to the assumed leak noise and immediately decide if
it is a leak noise or background noise.
The “Real time measurement” function can be used to observe a logger “live” as it
measures (see page 58).
With the “Direct recording” function can be used to listen to a noise in a pipe (see page
63).
Communication with the loggers is performed with short range radio only.
15
Page 16
The loggers
3.2 Design
Introduction
Standard version
All noise loggers have a highly sensitive microphone with a large dynamic range, a data
memory and a lithium battery inside. The standard loggers also have an internal radio
antenna.
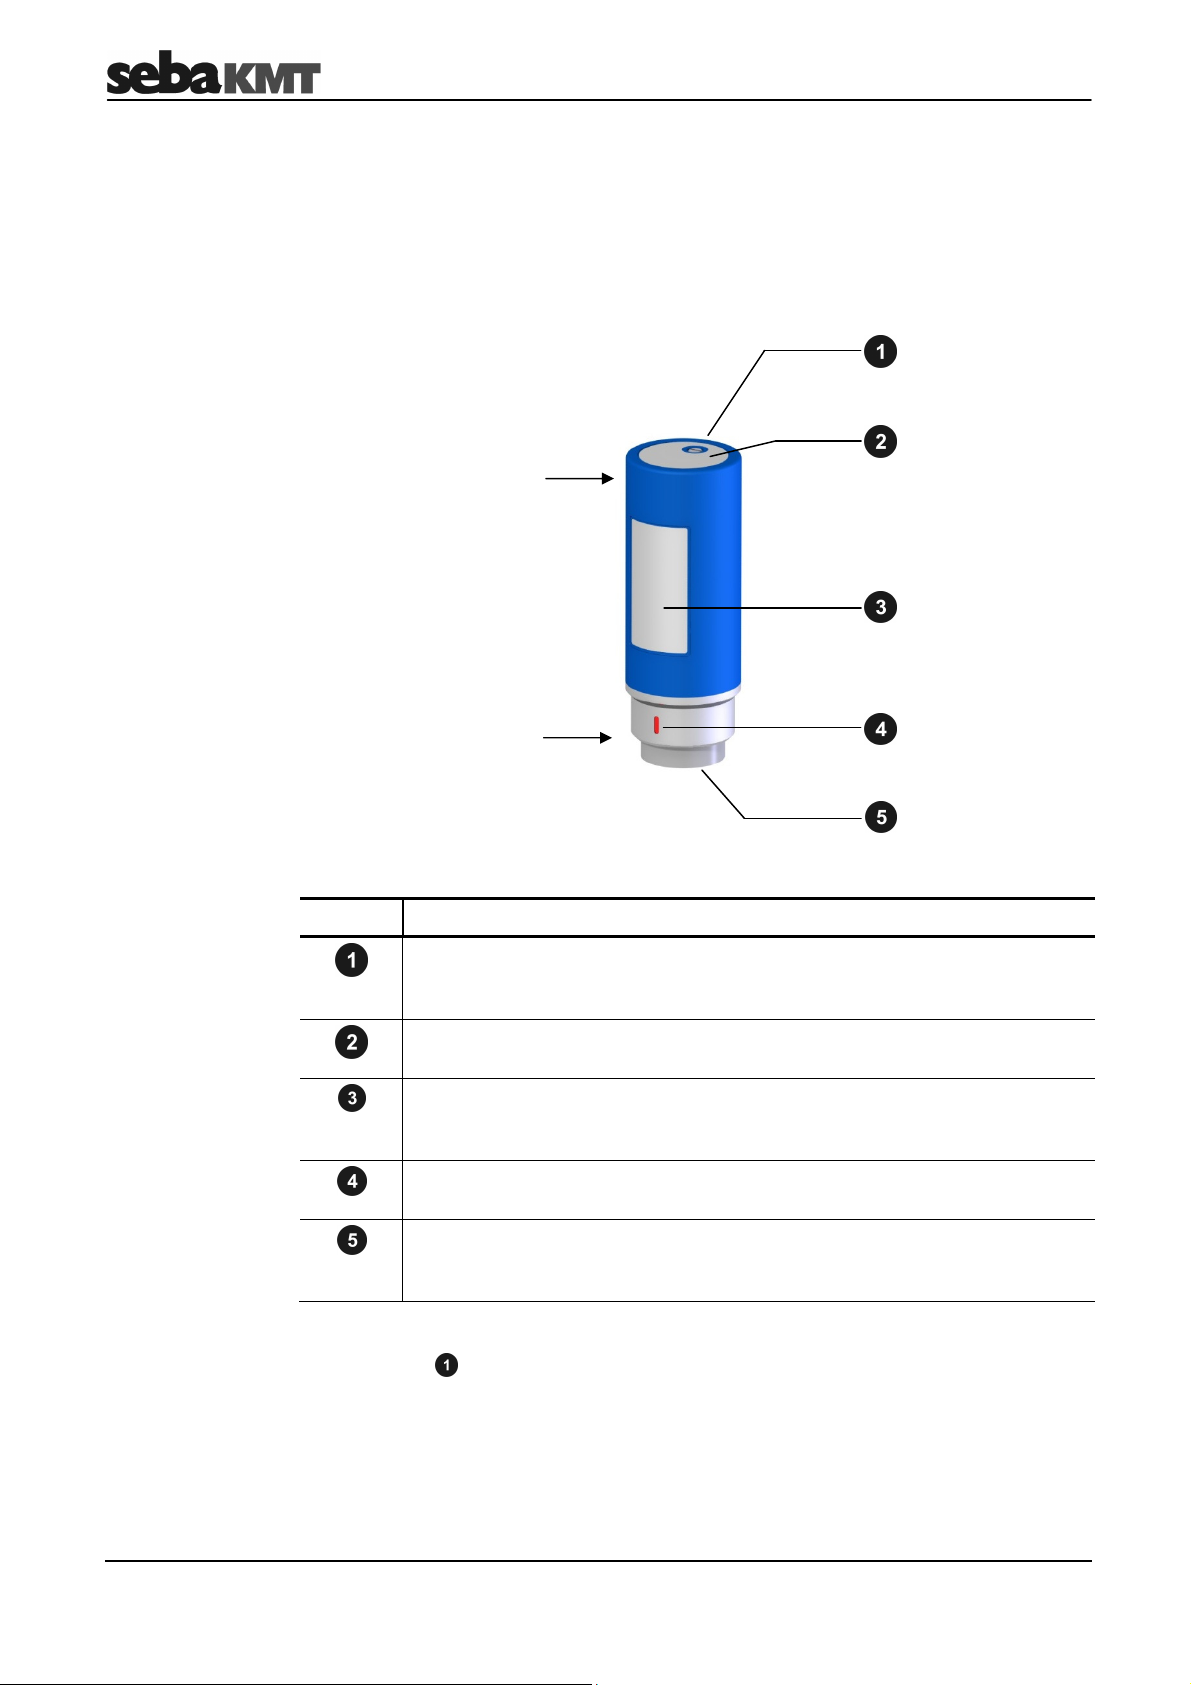
The loggers have the following external characteristics:
“Head” of the logger
“Foot” of the logger
TNC version
Element Description
Hole (M5 thread)
For fitting the supplied ring, which can be used for carrying the logger and
pulling it out of the shaft.
Label with identification number (ID)
Each logger has its own six-digit identification number.
Type plate
The last six digits of the serial number (SN) on the type plate of the device
are identical to the ID.
Marking
Must always face upwards when the logger is fitted horizontally.
Magnetic foot
Can be unscrewed and replaced by an adapter, or similar, from the
assembly accessories.
The special TNC version of loggers have no internal antenna. Instead of the hole for the
assembly ring they have an antenna socket for connecting an external antenna.
16
Page 17
The loggers
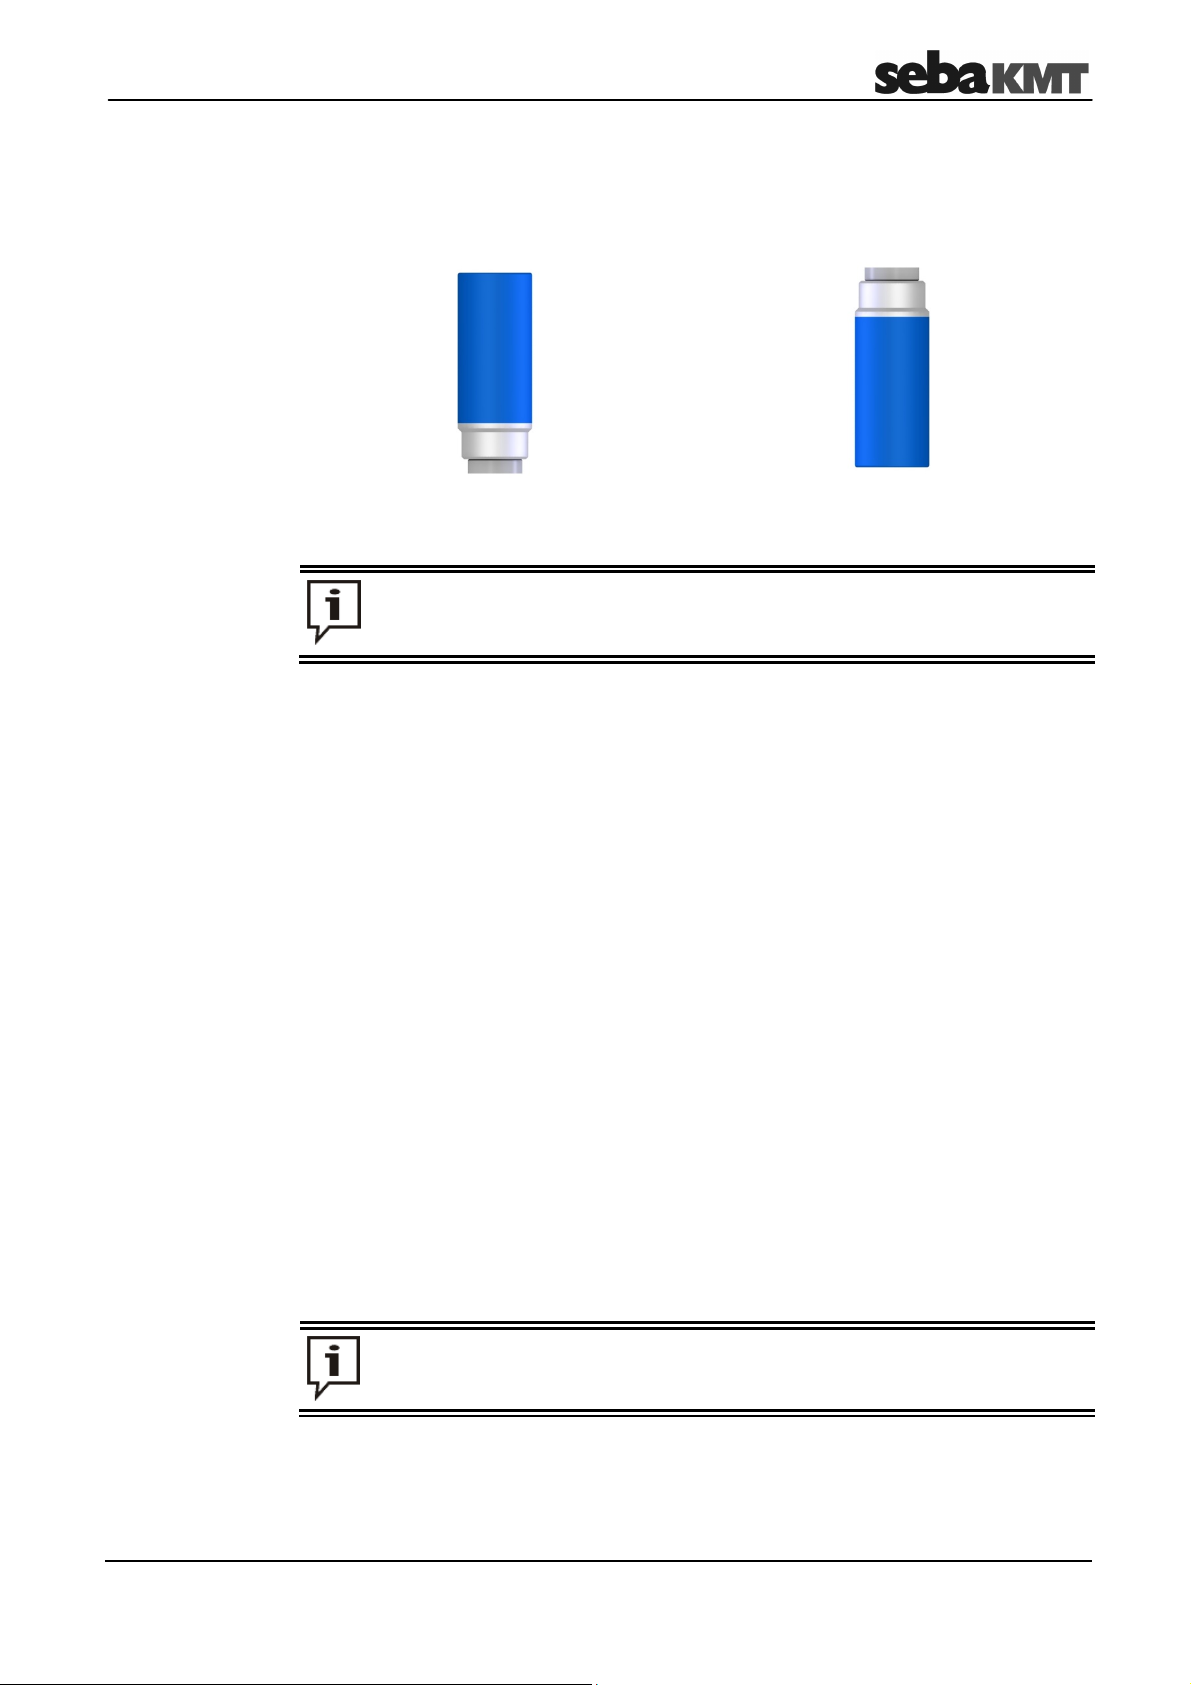
3.3 Switching on and off
The noise loggers have an internal tilt switch and are switched on and off simply by
turning them over.
Loggers standing on their foot are
switched on.
Each time a logger is switched on, its configuration data is reset to the default
values. The time internally is also lost. Therefore, whenever the logger is
switched back on, it must be reprogrammed (see page 50).
3.4 Memory
A logger’s internal memory allows a maximum of 100 pairs of values (the level and
frequency of a measurement) to be recorded.
Furthermore, the quietest recording of the last measuring window is saved as an audio
file (3 seconds in length).
Circular buffering is used, with the oldest stored measuring window being deleted after
100 measurements.
3.5 Power supply
Loggers standing on their head for longer
than 3 minutes are switched off.
Each logger has an internal lithium battery.
The actual battery lifetime depends on the intensity of use.
If a logger is always operated using the default configuration data, factory-set in the
Commander, a battery lifetime of up to 5 years is possible.
Longer measuring periods and increased wireless activity/availability shorten the life of
the logger battery. Severe fluctuations in climatic conditions also have a negative
impact.
Flat batteries cannot be recharged. They must be replaced.
SebaKMT or an authorised service partner must change the batteries.
Otherwise, water- and dirt-resistance of the logger cannot be guaranteed.
17
Page 18

The Commander
4 The Commander
4.1 Function
The Sebalog Commander 3 is the mobile programming and reading device for noise
loggers in the Sebalog N-3 series. The Commander is used to program the noise
loggers before measuring. After measuring, the recorded data in the loggers can be
queried with the Commander. Both current and older data can be displayed on the
device’s screen and analysed in greater detail. Furthermore, a real time measurement
can be performed (see page 58).
After connecting the supplied headphones, you can play back audio files of leak noises.
It is also possible to listen to the current noise in a pipe (see page 63).
18
Page 19
The Commander
4.2 Device design
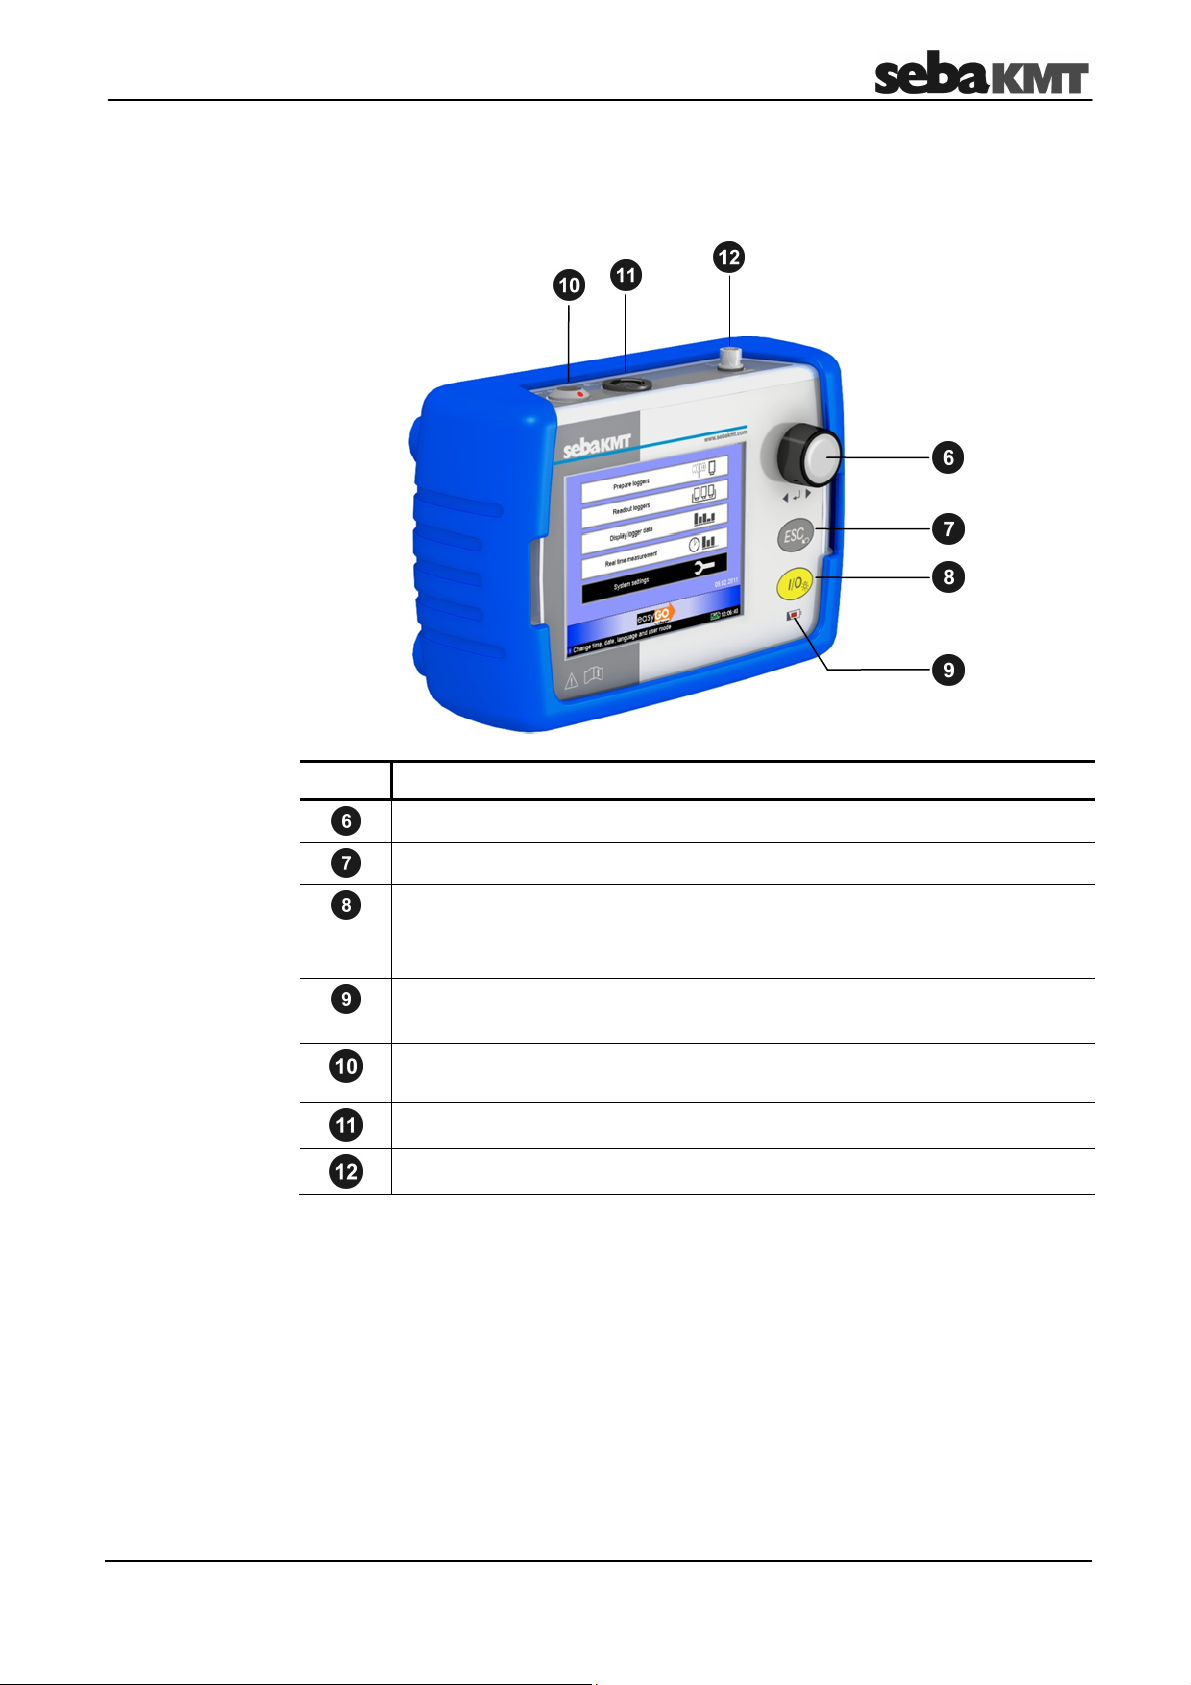
Controls and
connections
The Commander has the following controls and connections:
Element Description
Selector knob
ESC button
I/O button
•
Device on/off
•
Backlight on/off
Charging indicator light
•
Lights up red … external supply, battery is being charged
Socket for USB link to PC and for connecting an optional GPS module
(combined)
Headphone and charging socket (combined)
Antenna socket
19
Page 20
The Commander
N
P
L
al mode
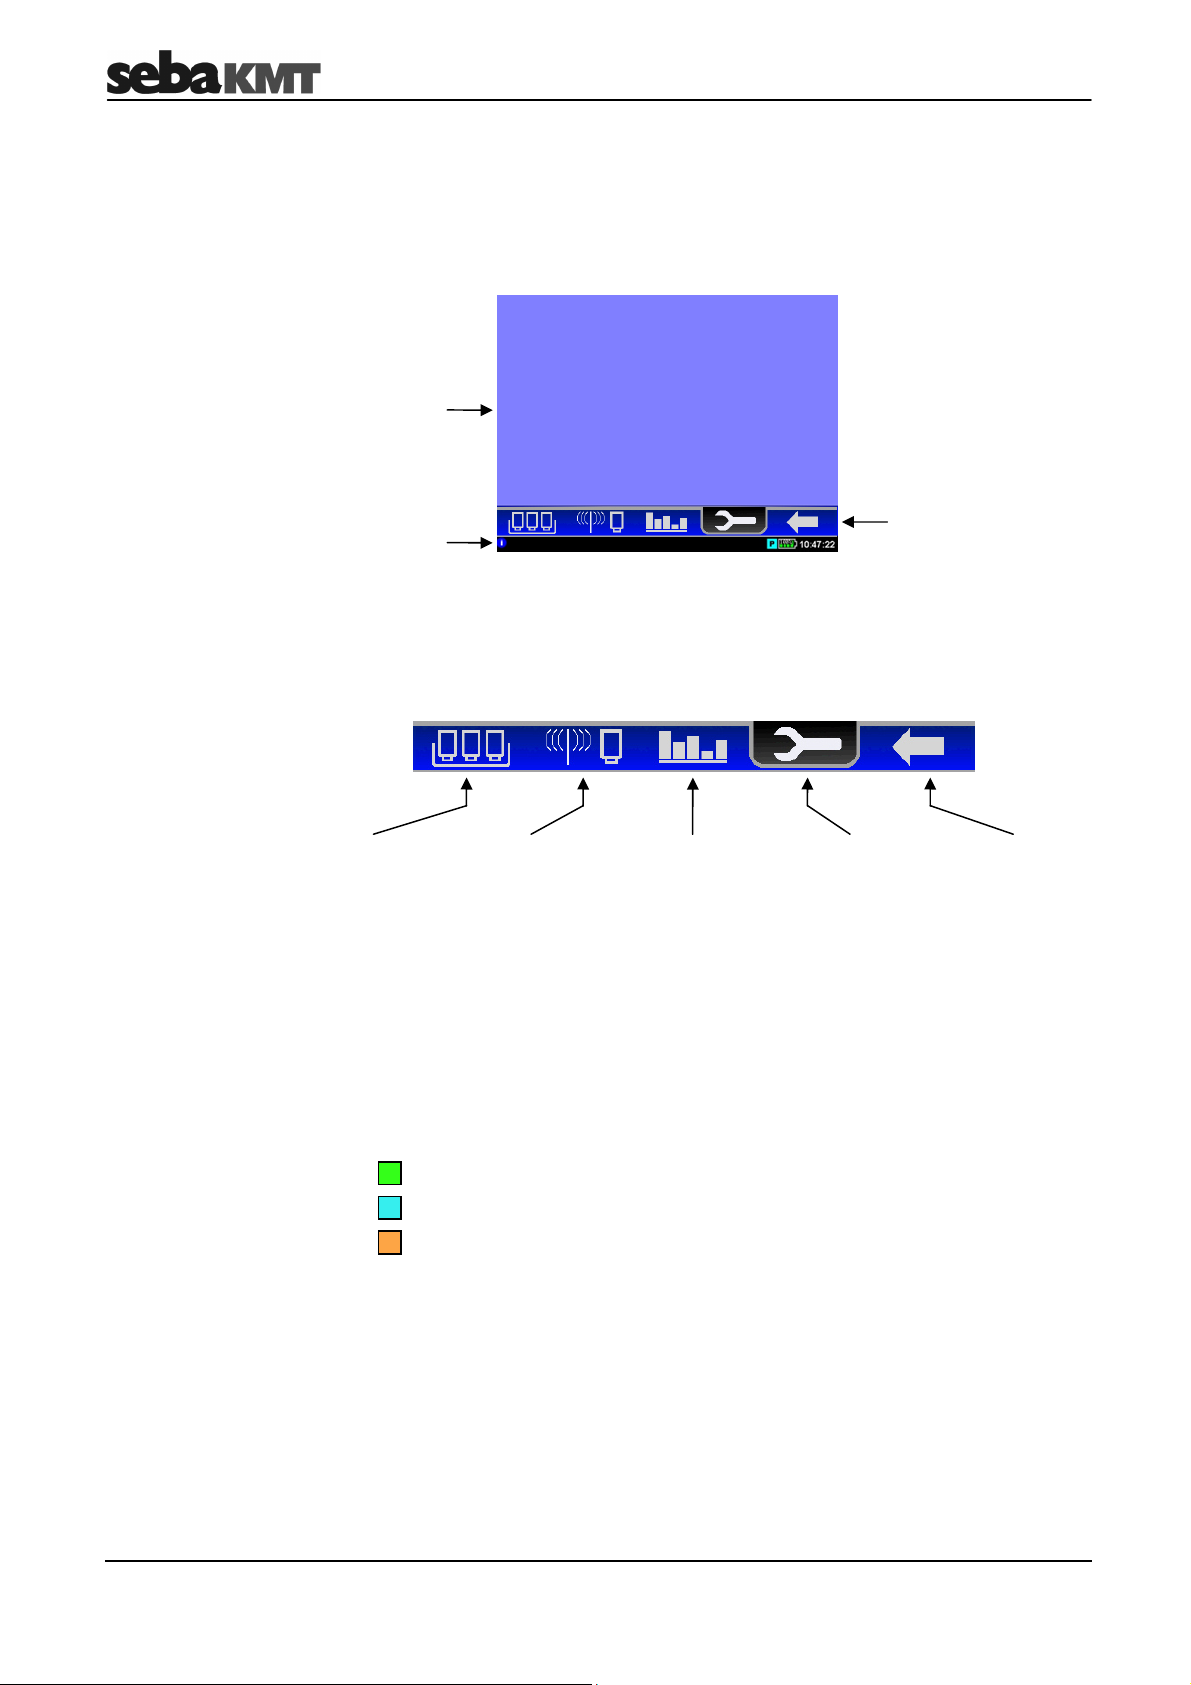
4.3 Design of the user interface
All the menu levels on the Commander’s user interface consist of a large display area
and an infobar on the bottom edge of the screen. The content and structure of the
display area change depending on the system status.
Display area
Main menu bar
Infobar
Help text ++ Help text ++ Help text
(Profession
only)
Main menu
Infobar
In Easy Mode, the main menu can be selected in the display area of the start screen.
In Professional Mode, the “Main menu bar” is between the display area and infobar. You
can access the individual functions of the device using the symbols shown.
Quick start
for reading out
the measured
data of the
workgroup
Functions for
programming
and reading
loggers
Functions for
displaying,
playing back and
analysing data,
etc.
Functions for
managing
loggers in the
Commander,
etc.
Back to the next
higher menu
level
The infobar structure remains the same in each menu and continuously provides the
user with the following information (from left to right):
• A help text gives short explanations on the selected element or on how to
proceed further.
• A coloured symbol indicates the group mode (see page 13) of the workgroup
… “Lift&Shift”
… “Patrol”
“Network”
…
• The battery symbol indicates the charge level of the battery.
• The Commander’s internal time.
20
Page 21
The Commander
4.4 Basics of operation
Navigation within the
menus
Exiting the menu
Adjustable parameters
The Commander is very simple to operate and intuitive in principle. Navigation within the
menus is done exclusively with the aid of the selector knob as follows:
The selected element appears on a black background:
In Easy Mode, use the ESC button to exit each menu. This immediately returns you
to the start screen. Any functions started are cancelled.
In Professional Mode, you can use the symbol at any time to return to the previous
menu level. Pressing the ESC button once makes the hidden main menu bar
reappear. Pressing it a second time takes you back directly to the start screen.
With the aid of the selector knob, not only can individual menu items be accessed but
also settings can be changed and parameters adapted. Please proceed as follows:
Turning = select
Pressing =
Not
selected
open/confirm
(ENTER function)
Selected
select
element
In some cases, the parameter can be changed directly in the input field. In others, a pulldown list opens where you can select a new setting.
→ ENTER
If in doubt, you can always cancel a procedure with the ESC button.
→ change parameter → ENTER
20 20 5 5
21
Page 22

The Commander
Virtual keyboard
Sorting loggers
To input comments or similar, a virtual keyboard appears on the screen, which is also
operated with the selector knob.
… deletes last character
… switches between upper- and lower-case
… inserts space
… confirms and completes input
Various menus list the individual loggers of a logger group. This appears in a table-like
form. You are able to re-sort these loggers by the criteria “Comment”, “Time of data
read-out” or “ESA value”. This can be useful for identifying certain loggers straightaway,
e.g. all loggers where a leak is suspected, etc.
To change the sort, apply the Sort button repeatedly. A small triangular symbol in the
header of a column indicates which criterion is selected and whether the loggers are
arranged in descending ▼ or ascending ▲ order.
Entering an
identification number
Examples of possible settings:
“ESA ▼” … sorting by ESA value (descending),
i.e. the loggers with a suspected leak are at the top of the list
“Date/time ▼” … sorting by time of the data read-out (descending),
i.e. the loggers most recently read are at the top of the list
“Date/time ▲” … sorting by time of the data read-out (ascending),
i.e. the loggers not yet read are at the top of the list
Various functions require the identification numbers (IDs) of loggers, repeaters or GSM
boxes to be given. When inputting an ID, all the preceding zero digits can be omitted.
Thus, if the ID is “000815”, you need only enter “815”.
22
Page 23

The Commander
4.5 User mode
Introduction
How to identify
the user mode?
The Commander-3 can be operated in two different user modes.
Easy mode Professional mode
In Easy mode all the main functions of the
device are available. They can perform
most day-to-day work quickly and simply from programming a logger group to
analysing measured data on the
Commander. The individual applications
are structured very clearly; the user is
partly guided step-by-step from one action
to the next. Easy mode is therefore not just
suited to first-time users but also
experienced operators who prefer to use its
simpler menu structure.
If the Commander is in Easy mode, the following symbol is permanently displayed
above the infobar:
If the EasyGo symbol isn’t shown on the screen, the Commander is in Professional
mode.
In Professional mode all the functions of
the device are available to the user. This
allows the system to be better adapted to
the user’s requirements and conditions on
site. Difficult measurements can be
prepared more exactly and the results
evaluated and documented in more
different ways, etc. Some applications can
only be used in Professional mode, such
as using Repeaters or building a logger
network.
How to change the
user mode?
The user mode can be switched in the system settings (see page 26).
23
Page 24

The Commander
4.6 Making a connection
4.6.1 Connection between the Commander and logger
Short range radio is used for communication between the Commander and loggers.
The Commander has an integrated radio module. After the antenna is connected
(standard or vehicle antenna), the device is ready for wireless operation.
The loggers must be switched on and wirelessly available (see page 52). The radio
range of a logger is affected by the conditions where it is used. To extend the range a
repeater can be used (see page 64).
4.6.2 Connection between the Commander and PC
Purpose
Making a connection
The connection between the Commander and a PC/laptop is made using the VK 77
connection cable supplied and is needed for the following tasks:
• Transferring measured data from the Commander to the PC.
• Transferring configuration data from the SebaDataView-3 software to the
Commander.
• Installing a firmware update on the Commander.
The Commander must be operated in Professional mode to connect it to the PC.
Proceed as follows:
Step Description
1
Select the button in the main menu bar.
2 In the next menu, select the Connect to PC button.
3
Use the USB socket on the Commander for connecting the cable to the PC.
Markings on the plug and socket ensure that the plug is lined up correctly. You
must feel the plug engage.
4 Select the Connect button on the Commander.
Result: The connection is made. The Commander is automatically detected by
the PC as a mass storage device. As soon as the Connected message on the
Commander’s screen appears, data can be transferred between the
Commander and PC.
If no connection is made, check the cable connection again. If necessary, disconnect
the Commander from the PC, restart it again, or perform a reset, and follow steps 1 to 4
once again.
Disconnection
To end the connection, select the Disconnect button on the Commander.
As soon as the Disconnected message on the Commander’s screen appears, the
connection cable can be removed.
24
Page 25

The Commander
4.7 Switching on the display lighting
The Commander’s screen has a backlight. It is activated by using the selector knob or
briefly pressing the I/O button . The lighting then remains on for a certain time period.
The length of this period (a maximum of 4 minutes) can be adjusted in the system
settings (see page 26).
4.8 System settings
You can use the System settings menu to customise various device settings to the
needs of the user.
Beginning at the start screen, follow the symbols.
The System settings menu opens:
When the Commander is in Professional mode, more settings can be changed
than in Easy mode. Use the Next button to go to the second page of the menu.
25
Page 26

The Commander
4.8.1 Basic settings
The following basic settings can be made in both Professional mode and Easy mode:
Line Description
User mode
Language
Time and date
settings
Select a user mode for the device (see page 26).
Select a language for the user interface.
If you cannot read the preset language, you can go to
the language selection - starting from the main menu via the following symbols:
In the Timezone line, select the timezone for where you are.
In the Daylight saving time line select whether it is currently
winter or summer time.
In the Date format line, select the date format to be used by the
Commander.
DD … Day
MM … Month
YYYY … Year
In the Time line, enter the current time for the Commander
(hour:minutes:seconds).
Backlight switch off
Turn off autom.
after
Keybeep
History
In the Date line, enter the current date for the Commander
(day:month:year).
Select a period of time for the backlight until it is switched off
automatically (never = continuous backlight).
Select a period of time for the auto-off function.
If no entry is made for longer the specified time, the Commander
switches off automatically (never = automatic switch off
deactivated).
Activate/deactivate the key tone that sounds when the selector
knob is pressed.
Activate/deactivate the “History” function.
If the “History” function is activated, the measured data from
loggers remains stored in the Commander after they are read
out. They can then be called up at any time and displayed again.
If the function is deactivated, the previous data set is overwritten
when new data is read. Deactivating the function can be useful
because this saves memory space and the Commander can
work faster in certain situations.
26
Page 27

The Commander
4.8.2 Extended settings in Professional mode
The following extended settings are only available in Professional mode:
Line Description
Logger list visibility
Logger found beep
Additional hints
Select table columns to be shown/hidden.
Various menu levels list the loggers of a group in a table on the
screen. The columns contain information about the loggers,
such as the logger ID and logger comment. To make the table
clearer, you can specify which columns are actually shown.
Switch the acoustic signal on/off that occurs when a logger is
found.
An acoustic signal sounds each time the Commander detects a
logger when reading out data. A corresponding message is
shown briefly on the screen.
When “patrolling”, this can happen several times in succession
because the loggers send data packets to the Commander at
regular intervals.
You can specify how often there is a signal or a message:
• always … acoustic signal each time the Commander
detects a logger
• only once if logger found … acoustic signal only when a
logger is detected the first time
• never … no acoustic signal
• beep and display only once … acoustic signal and
message on the screen only when a logger is detected the
first time
Decide if additional information shall be shown or not.
At various positions in the menu, special displays appear on the
screen, providing additional information about the current
functions. These displays can be deactivated.
Sorting order
Factory settings
Select the standard sorting order for loggers in tables.
Various menu levels list the loggers of a group in a table on the
screen. The criterion by which the loggers are sorted within the
table as standard can be specified..
Restore factory settings.
The settings on the Commander can be reset to the factory
settings, to the state when the Commander was delivered.
27
Page 28

The Commander
4.8.3 System info
When the Commander is operated in Professional mode, the System settings menu
has the following information on the device and the firmware currently in use:
Line Description
Free space
Software version
Software date/time
ID
Commander’s free memory space in MB
Firmware version of the Commander
When the firmware was last updated
Identification number of the Commander
4.8.4 Saving settings
To save any changed settings in Easy mode, apply the OK button before exiting the
System settings menu with the ESC button .
In Professional mode, saving is automatic when exiting the menu.
4.9 Performing a hardware reset
If the Commander stops responding to inputs (from the selector knob or buttons), a
hardware reset can be performed.
Hold down the selector knob and the ESC button at the same time for about one
second. The Commander restarts automatically. This usually rectifies the malfunction.
If the malfunction persists after this normal reset, try the following: Hold down the
selector knob and the ESC button at the same time for about three seconds. The
Commander switches off. Wait about a minute before switching the Commander back
on with the I/O button . The device should now function correctly again.
28
Page 29

The Commander
4.10 Updating the firmware
Visit regularly the Downloads section at www.sebakmt.com for information about new
versions of firmware. You can install any updated versions of the firmware on the
Commander if they are available.
The current version of the Commander firmware installed can be found in the system
settings (see page 28).
To update the firmware, proceed as follows:
Step Description
1
First ensure that the Commander’s battery has sufficient power to update the
firmware (at least one bar on the battery symbol on the infobar (see page 20)).
If in doubt, recharge the battery first (see page 30).
2 Download the latest firmware archive from www.sebakmt.com and extract it to a
directory on your PC.
3
Connect the PC and Commander together via USB- (see page 24).
4
Copy the extracted files directly into the Commander’s main directory.
5
Disconnect the Commander from the PC (see page 24).
6
Switch the Commander off and then on again, or perform a reset (see above).
Result: The firmware update begins. A bar indicator shows the progress on the
screen.
During the update, no entries whatsoever must be made on the
Commander! This could cause the device irreparable damage.
CAUTION
After the procedure is complete, the device switches back on automatically.
Check the version number in the start screen to see if the Commander is
actually using the new firmware.
29
Page 30

The Commander
4.11 Memory
The Commander has a 2 GB internal memory. This is sufficient to manage the data of
up to 1,000 logger groups, each with 1,000 loggers.
You can query the available memory space at any time in the system settings (see page
25).
4.12 Power supply
Internal supply
External supply
Automatic switch off
The Commander is fitted with an internal Li-ion rechargeable battery. This can power
the device for approximately 20 hours. The battery’s present charge level is shown
continuously by the battery symbol in the infobar on the screen.
If the battery is low, a warning on a coloured background appears on the screen:
• Yellow background … device can still operate for a few hours
• Red background + warning sound ... device will shortly switch off
The Commander can be operated using an external electricity source. Connect it to the
mains voltage or to your vehicle’s 12 volt socket. A guide on the round plug of the
charging cable and a groove on the charging socket of the Commander specify the
correct alignment of the plug.
As soon as the Commander is connected to the external power supply, its battery is
charged up automatically. This is shown by the red charging indicator light and by the
arrow in the battery symbol at the bottom right of the screen. Charging takes
approximately 12 hours. The battery is fully charged once four bars are shown in the
battery symbol. After the battery is fully charged, the Commander switches to trickle
charging.
During charging, the ambient temperature should be between
10°C and 40°C (50°F and 104°F). Otherwise the device could be damaged!
Only use the supplied charging cable to connect the Commander to
CAUTION
The Commander automatically switches off if no input is made within a specified time
period. This timespan can be configured in the system settings (see page 26).
external power sources.
If you experience problems with the battery, please contact your SebaKMT
sales partner. Do not open the device yourself. The stated water- and dirtresistance can only be guaranteed if any work on the device is performed
solely by service departments authorised to do so.
30
Page 31

Working in Easy mode
Name of the
5 Working in Easy mode
5.1 Starting up the Commander
5.1.1 Switching on the Commander
Switch on the Commander by pressing the I/O button .
The Easy mode main menu appears on the screen:
Changing the
user mode
Changing the language
5.1.2 Checking the basic settings
workgroup
In Easy mode, the symbol is continuously shown at the bottom of the screen. If
you do not see this symbol, the Commander is in Professional mode. To switch to Easy
mode, open the system settings menu. Starting from the start screen, follow the
symbols and, in the first line of the menu, select the “Easy mode” setting
from the list.
The screen might not be displaying the correct language. The language can be changed
in the system settings menu. Beginning at the start screen, follow the
symbols and select your language from the list.
Before a measuring session, check that the Commander’s system settings are up-todate and correct (see page 26). The date and time settings in particular must be correct.
Beginning at the start screen, follow the symbols to open the system
settings menu.
System date
31
Page 32

Working in Easy mode
5.1.3 Defining a workgroup
More than one group of loggers can be registered in the Commander. However, the
Commander can only work with one of these groups at a time. This group is called the
“workgroup”.
Specify the workgroup for the impending measurement session. Please proceed as
follows:
Step Description
1
In the main menu, select the System settings button.
2 In the next menu, select the Change group button.
Result: A list with all the registered logger groups opens.
The current workgroup is indicated by an X.
3
Select a logger group for the measurement session.
Result: The selected group is now registered in the Commander as the
workgroup. In the main menu, the name of the workgroup is shown at the
bottom left of the display area.
Each logger group in the list has already been assigned its group mode (see
page 13).
Groups with an “L” before the name can only be read using “Lift & Shift”, i.e. all
the loggers in the group are collected and then read together.
Groups with a “P” before the name can only be read using “Patrol”, i.e. all the
loggers in the group remain in the shaft and are read on location individually.
The loggers of a group with an “N” before the name are networked together and
connected to a GSM-Box. These loggers can’t be read by a reading device but
send their data regularly to a FTP server.
32
Page 33

Working in Easy mode
5.2 Programming the loggers
Introduction
Procedure
The loggers in the workgroup must be reprogrammed before each session. This means
that the Commander sends basic data for the session wirelessly to the loggers (e.g. the
measuring window).
To program the workgroup proceed as follows:
Step Description
1
In the main menu, select the Prepare loggers button.
Result: The workgroup is shown. The name of the group is at the very top of
the display, and all the loggers in the group are listed underneath.
2 Select the Prog. Group button.
Result: The next step is shown.
3
Switch off all the loggers in the group, i.e. place them “on their head” for about
three minutes.
As an aid, a three-minute countdown on the screen can be started with the
Start button.
Then select the OK button.
Result: The next step is shown.
33
(continued on the next page)
Page 34

Working in Easy mode
Step Description
4
Switch on all the loggers in the group, i.e. place them “on their foot”.
Select the OK button to confirm.
Result: The next display provides information about the data used to program
the loggers.
(It is not possible to change this configuration data in Easy mode).
5 Select the Program button.
Result: The next display opens and the Commander automatically begins
transferring data to the loggers.
Possible sources of
error
The flashing antenna symbol on the bottom left of the display area indicates
that the data transfer is in progress. The left-hand window shows all the loggers
in the group already programmed. The right-hand window contains all the
loggers with which no contact has yet been possible.
The Stop button can be used to cancel programming at any time. It can be
recommenced with the Start button.
The procedure ends automatically once all the loggers in the group have been
successfully programmed.
The loggers are now ready to be installed for use on location.
Use the ESC button to return to the main menu.
From now on, do not place the loggers on their head because switching off
would cause them to lose their configuration data and they would need to be
reprogrammed.
If a logger could not be programmed, it may be because it was not in “Configuration
mode” at the time of programming, (see page 14) i.e. it had not been properly switched
off and switched back on 3 minutes later. It is also possible that the logger is not within
the wireless range of the Commander. The ideal distance between a logger and the
Commander is about one meter.
34
Page 35

Working in Easy mode
5.3 Installing the loggers
Basics
Horizontal installation
Install the loggers of the workgroup in succession along the stretch of pipe. It is best to
fit them directly on the pipe. However, you can also attach the loggers to valve rods or
hydrants, for example, or any other position along the pipeline that is easily accessible.
There must be the best possible contact between the logger foot or the mounted
adapter (see below) and the pipe.
If the logger is attached to a valve rod, for example, make sure the surface is as flat as
possible. Clean the rod thoroughly (preferably with a wire brush).
Due to their powerful magnet, the loggers can also be attached horizontally to
ferromagnetic surfaces. You must however make sure the red mark on the logger is
facing upwards. Otherwise the internal tilt switch will switch the logger off after
3 minutes.
Loggers with the mark facing upwards are
switched on.
Loggers with the mark facing downwards are
switched off.
Special cases
If the logger cannot be attached anywhere directly, the accessories for the Sebalog N-3
set have various adapters.
If, for example, the surface of the valve rod is not flat, or not magnetic, unscrew the
magnet on the foot of the logger and fit the 20 mm or 42 mm valve rod adapter
(optionally available) instead.
When installing the logger on an underground hydrant, you can fit it on the valve rod or
on the side of the rod, depending on the height of the shaft. Use the magnetic angle
adapter, for example, for side mounting.
For underground hydrants with bayonet fittings, you can use the underground hydrant
adapter. Fit the adapter in the hydrant claw.
For plastic domestic pipes (water meter fittings), use the plastic fitting, if necessary in
combination with the angle adapter.
35
Page 36

Working in Easy mode
Installation examples
The following pictures show a few methods for installing N-3 noise loggers:
Logger on the valve rod of an
underground hydrant
Logger on an underground hydrant
Logger with an angle adapter
on the valve rod
Logger with an angle adapter
horizontally on the valve rod
Logger with an angle adapter
on the hydrant claw
36
Page 37

Working in Easy mode
5.4 Reading out the measured data
After the loggers have been installed on location for at least one measuring day, the
recorded measured data can be read out with the Commander. The exact same group
mode (“Lift&Shift”/“Patrol”/”Network”) for which the workgroup was programmed is used.
Groups with an “L” before the name can only be read using “Lift & Shift”, i.e. all the
loggers in the group are collected and then read together.
Groups with a “P” before the name can only be read using “Patrol”, i.e. all the loggers in
the group remain in the shaft and are read on location individually.
The loggers of a group with an “N” before the name are networked together and
connected to a GSM-Box. These loggers can’t be read by a reading device but send
their data regularly to a FTP server.
37
Page 38

Working in Easy mode
5.4.1 Reading out a “Lift&Shift” group
To read out the measured data in the loggers, proceed as follows:
Step Description
1
Collect up all the loggers of the group and place them next to the Commander.
Avoid placing the loggers on their head! The stored data would not be
lost if the loggers were switched off, but it would no longer be indicated
if a logger is in leak status or not (see page 14).
2 In the main menu of the Commander, select the Readout loggers button.
Result: The Commander and the loggers are connected. Data transfer begins
automatically. The antenna symbol in the bottom left of the display flashes.
As soon as the Commander detects a logger, it receives its measured data. The
corresponding logger switches from the right-hand to the left-hand window on
the screen.
The coloured background of the read data in the left-hand window reflects the
probability of a leak.
No colour … Leak probability low, leak threshold was not exceeded
Grey … Leak probability not available, logger in configuration mode
(was switched off during or after the measurement)
Other
colour
… Leak probability high! Leak threshold exceeded!
The colour reflects approximately the frequency of the leak
noise:
Blue
0 Hz
2,500 Hz
Yellow
If a logger’s comment is on a red background, this means that its battery is
weak.
3 The Stop button can be used to cancel reading at any time. It can be continued
with the Start button.
The procedure finishes automatically once the Commander has received and
saved the measured data from all the loggers in the group.
If a logger could not be read, it may have been switched off, not ready for
wireless operation or it was outside the Commander’s wireless range.
4
You can immediately view the data of a logger that has just been read. To do so,
select the left-hand window on the screen and then select the respective logger.
Result: The logger’s measured data is shown (see page 42).
Use the ESC button to return to the main menu.
38
Page 39

Working in Easy mode
5.4.2 Reading out a “Patrol” group
To read out the measured data in the loggers, proceed as follows:
Step Description
1 In the main menu of the Commander, select the Patrol Loggers button.
Result: The Commander is ready to receive the measured data from the
individual loggers. The antenna symbol in the bottom left of the display flashes.
2
Move into the wireless range of each logger one after the other.
If the radio signals of the loggers are strong enough, the data can also be
collected while in the car, simply by driving past where the loggers are installed.
The Commander’s standard antenna can be replaced with the supplied vehicle
antenna to do this.
As soon as the Commander has detected a logger, the following message
appears on the screen:
Logger comment
Logger ID
Level/frequency of the
quietest noise in the
measuring period
The message has a coloured background. The colour shows straightaway
whether the programmed leak threshold has been exceeded or not during the
measuring period.
• Yellow … Attention! Leak threshold exceeded!
• Blue ... Leak threshold not exceeded
There is an acoustic signal along with the message:
• Long tone ... Attention! Leak!
• Short tone … No leak
As standard, the tone sounds each time a logger is detected. It can be
deactivated in the system settings of Professional mode (see page 27).
If the displayed message contains a battery symbol, this means the battery of
the particular logger is weak.
If the displayed message contains a clock symbol, this means the logger’s
internal clock differs from the system time of the reading device by more than
30 minutes. The logger group concerned should be reprogrammed. The logger’s
clock is synchronised with that of the Commander. It is only possible to change
the time of individual loggers in Professional mode.
39
(continued on the next page)
Page 40

Working in Easy mode
Step Description
The detected logger switches from the right-hand to the left-hand window on the
Commander screen. The coloured background of the read data reflects the
probability of a leak.
No colour … Leak probability low,
leak threshold was not exceeded
Grey … Leak probability not available,
logger in config. mode,
(was switched off during or after the measurement)
Other colour … Leak probability high!
Leak threshold exceeded!
The colour reflects approximately the frequency of the
leak noise:
Blue
0 Hz
2,500 Hz
Yellow
If a logger’s comment is on a red background, this means its battery is weak.
3 The Stop and Start buttons can be used to cancel and continue reading at any
time.
The procedure finishes automatically once the Commander has received and
saved the measured data from all the loggers in the group.
During “Patrolling”, the complete measured data set is only transferred
to the Commander from loggers in leak status (see page 14). To save
power, if the quietest noise in a measurement is below the programmed
leak threshold, the loggers will only send a small packet to the
Commander, with the level and frequency of this noise. If necessary, the
complete measured data of these loggers can be called up using single
interrogation in Professional mode (see page 54).
If a logger could not be read, it may have been switched off, not ready for
wireless operation or it was outside the Commander’s wireless range.
4
You can immediately view the data of a logger that has just been read. To do so,
select the respective logger in the left-hand window on the screen.
Result: The logger’s measured data is shown (see page 42). Use the ESC
button to return to the main menu.
40
Page 41

Working in Easy mode
5.5 Evaluating the measured data
You can use the Commander to view the measured data read out from a logger and to
analyse it in greater detail.
5.5.1 Calling up the measured values
To call up the measured data of a logger, proceed as follows:
Step Description
1
In the main menu, select the Display logger data button.
Result: The loggers in the workgroup are listed in the next view.
2 Call up the data of the highlighted logger using the View button or select
another logger in the list.
Result: The logger’s measured data is shown (see page 42).
41
Page 42

Working in Easy mode
4
3
2
1
5.5.2 Displaying the measured values
View
The measured data from the loggers are shown as a bar diagram on the screen.
1
2
Element Description
4
3
4
Identification number and comment of the displayed logger
Diagram
Each bar represents a single noise recording.
X-axis ... course of measurement over time
Y-axis ... noise level in dB
The colour of the bar shows the approximate frequency of the noise.
Blue
0 Hz
Yellow
2,500 Hz
The point where the two green lines intersect marks the quietest recording in
the displayed measurement, the so-called “leak value”.
Leak value (lowest value to be displayed)
The leak value refers to the quietest recording in the displayed measuring
period. The values of this recording are shown in the three fields directly
under the diagram:
Left-hand field … ESA value of the recording
Centre field … Noise level in dB for the quietest measurement
Right-hand field … Frequency of the noise in Hz
Buttons to access individual functions (see below)
42
Page 43

Working in Easy mode
Functions
There are the following functions for analyzing the displayed data:
Button Description
Scroll
You can use this function to view in the diagram the measurement
results of the other loggers in the group.
To do so, apply the button and turn the selector knob to select a logger.
Apply the button again to confirm your selection.
Move
Cursor
You can use this function to move the vertical green line in the diagram
from one bar to the next. The values of the particular noise measurement
(volume, frequency, ESA) and the time of the recording are shown.
To do so, apply the button and turn the selector knob. Apply the button
again to end the function.
Details
This function opens a new window on the screen. It shows the
configuration data of the particular logger at the time of the measurement.
You can use the Scroll button to view the configuration data of the other
loggers in the group. Use the OK button to return to the measured data
display.
Mode
You can use this function to change the measurement unit on the Y-axis
in the diagram.
Standard view … The Y-axis shows the volume of the noises. Each bar
in the diagram represents a single recording.
ESA view
… The Y-axis shows the ESA value.
Each bar represents the quietest recording of a
measuring day.
43
Page 44

Working in Professional mode
6 Working in Professional mode
6.1 Starting up the Commander
6.1.1 Switching on the Commander
Switching on
Changing the
user mode
Changing the language
Use the I/O button to switch on the Commander.
The Professional mode start image appears on the screen:
Workgroup
Firmware version,
Main menu bar
If the symbol is shown at the bottom in the middle of the screen, the
Commander is not in Professional mode but Easy mode instead. To switch to
Professional mode, open the system settings menu. Beginning at the start screen, follow
the symbols and, in the first line of the menu, select the “Professional
mode” setting from the list.
The screen might not be displaying the correct language. The language can be changed
in the system settings. Beginning at the start screen, follow the
symbols and select your language from the list.
System date,
Identification number of
the Commander
6.1.2 Checking the system settings
Before a measuring session, check that the Commander’s system settings are up-todate and correct (see page 25). The date and time settings in particular must be correct.
6.1.3 Registering loggers in the Commander and specifying the
workgroup
The loggers to be used for an impending measurement must be registered and
combined in a group (see page 23) in the Commander.
To specify the workgroup (see page 14), select the symbol in the main menu bar,
open the Group Management menu and select a group in the list of registered logger
groups (marked with an X).
However, a lot of menus in Professional mode also have a drop-down list at the very top
of the screen. It can be used to access a group list directly and select a workgroup.
44
Page 45

Working in Professional mode
6.2 Managing the loggers
All loggers to be used for a measurement must be registered in the Commander
beforehand. Only registered loggers can be programmed and read. Registration is
performed either by manually inputting the logger ID or by automatic wireless detection.
The registered loggers are combined in groups.
6.2.1 Managing logger groups in the Commander
Introduction
Managing groups
Defining a workgroup
Creating a new group
All loggers registered in the Commander must be assigned to a group. The Commander
can only communicate with one of the logger groups created, the so called “workgroup”
(see page 14).
Logger groups can be created, deleted, copied and renamed directly on the
Commander.
Select the symbol in the main menu, and the Group Management button in the
next view, to go to the menu for managing logger groups. All the registered logger
groups are listed.
The workgroup is marked with an X in the view. To turn another logger group into the
workgroup, select the list and then a group.
To create a completely new logger group in the Commander, proceed as follows:
Step Description
1 Select the Add button.
Result: A new view opens.
2
Select the group mode (see page 13) for the new group and confirm with OK.
After the group is created, the group mode can no longer be changed.
All loggers in a group must belong to the same group mode as the
group itself (e.g. a “Lift&Shift” group may only contain “Lift&Shift”
loggers).
Result: A new view opens.
3
Enter a name for the new group. Use the virtual keyboard for this.
To complete the input, select the ENTER button.
Result: The new group is now created in the Commander. The display jumps
automatically to the Logger Management menu.
4
Use this menu to assign loggers to the newly created group (see page 47).
45
Page 46

Working in Professional mode
Renaming a group
Copying a group
Deleting a group
You can rename an existing logger group.
First select the particular group in the list and then select the Rename button. In the
following screen views, enter a group mode (see page 13) and the new name of the
group.
The group then appears with the new name in the group list.
You can copy an existing logger group, with all its loggers, within the list and allocate a
new name and new group mode to this copy. (This can be useful if, for example, you
wish to use the loggers of an existing “Lift&Shift” group for the next measuring
assignment, but would like to read out data by “Patrolling”.) The new group
automatically adopts the configuration data of the original group but contains no
measured data at all.
First select the particular group in the list and then select the Copy button. In the
following screen views, enter the group mode (see page 13) and the name of the new
group.
The new group then appears in the group list. If needed, more new loggers can now be
allocated to it (see page 47).
You can delete a logger group from the Commander.
First select the particular group in the list. Then select the Delete button and answer the
confirmation query with Yes.
If the loggers in this group are not contained in any other existing groups, deleting
simultaneously de-registers them from the Commander. The measured data of the
group is retained in the history as long as the “History” function is active (see page 26).
Otherwise the data will be lost.
46
Page 47

Working in Professional mode
6.2.2 Managing the loggers in the Commander
Select the symbol in the main menu, and the Logger Management button in the
next view, to go to the menu for managing loggers. The loggers of the workgroup (see
page 45) are listed.
If the incorrect group is displayed, you can use the pull-down menu at the top edge of
the screen to change the workgroup.
If you do not wish to allocate a new logger to an existing but to a completely new group
instead, this new group must be created beforehand (see page 45).
Registering loggers
using automatic
detection
A logger can be registered using “automatic detection”. For this purpose, it has to be
close to the Commander and switched off. Proceed as follows:
Step Description
1 Apply the Add logger button.
2
Switch the logger on.
Result: Directly after it is switched on, the logger sends a signal with its
identification number a few times. Once the logger is detected by the
Commander, New ID found appears on the screen. The ID of the logger is
displayed underneath.
3 Select Accept to add the logger to the group or Decline to discard it.
4
If you want to number the loggers consecutively, stick the supplied selfadhesive label with the number of the automatically assigned comment on the
logger (see below).
5
Use the same method to add all the other new loggers to the group. When
loggers need to be switched on, always bring them close to the Commander
singly. This is because only the last detected ID is shown on the screen and
able to be registered.
6 Apply the Finish button to complete the procedure.
Result: The registered loggers are now shown in the list.
47
Page 48
Working in Professional mode
Registering loggers
manually
Numbering loggers
Changing a comment
A logger can be registered manually by entering its ID. Proceed as follows:
Step Description
1 Apply the Add logger button.
2
Type in the logger’s six-digit ID using the displayed keyboard (see page 14).
Confirm the input with the ENTER button.
Result: The registered logger is now shown in the list.
3
If you want to number the loggers consecutively, stick the supplied selfadhesive label with the number of the automatically assigned comment on the
logger (see below).
4
To add further loggers to the group, repeat steps 1 to 3.
A comment is automatically left on every logger, when it is registered. The first
registered logger gets the comment “LOG001”, the second one “LOG002” and so on.
This way, the loggers of a group are consecutively numbered.
Self-adhesive labels with the same numbers come supplied. Sometimes it can be
helpful to put the labels, with the relevant numbers, on the loggers directly after
registration. Thus, the loggers can easier be identified on-site.
You are able to change the automatically assigned comment of a logger in the displayed
group. Proceed as follows:
Exchanging loggers
Step Description
1
Select the logger in the list to change its comment.
2 Apply the Change comment button and use the displayed keyboard to change
the text in the following view.
Confirm the input with the ENTER button.
Result: The changed comment is now shown in the list.
You are able to delete a logger in one step from the displayed group and to replace it
with another logger. This may be necessary if, for example, an individual logger
develops a fault and needs to be replaced with a new one. Proceed as follows:
Step Description
1
Select the logger that needs to be replaced in the list.
2 Apply the Replace logger button and use the displayed keyboard to enter the
ID of the new logger to be put in the group.
Result: The new logger appears in the list instead of the old one.
If the old logger is not contained in any other existing group, deleting simultaneously deregisters it from the Commander.
The measured data of the old logger is deleted within the group. However, it is retained
in the history as long as the “History” (see page 26) function is active. Otherwise the
data will be lost.
48
Page 49

Working in Professional mode
Deleting loggers
You can delete a logger from the displayed group. Proceed as follows:
Step Description
1
Select the logger in the list.
2 Apply the Delete button and answer the confirmation query with Yes.
Result: The logger is no longer contained in the list.
If the logger is not contained in any other existing group, it is simultaneously deregistered from the Commander.
The measured data of the logger is deleted within the group. However, it is retained in
the history as long as the “History” (see page 26) function is active.
49
Page 50

Working in Professional mode
n
6.3 Programming the loggers
Introduction
Opening the
configuration window
Each logger must be configured before each measuring session. They are assigned
with all the relevant parameters before the impending measurement.
Even loggers that have already been programmed and installed can usually be
reprogrammed. However, to save power, all loggers in group mode “Patrol” can
only receive the Commander’s signal every 10 seconds, even in the time when
they are ready for wireless operation. It can therefore take a very long time to
program these loggers.
Where possible, we recommend that all the loggers are changed to configuration
mode before programming, i.e. to switch them off for at least 3 minutes and then
to switch them back on again. Loggers can be reliably programmed in
configuration mode.
Proceed as follows to open the configuration window for a logger:
Step Description
1
Select the symbol in the main menu bar.
2 In the next menu, select the Program Logger / Group button.
Result: The menu for logger programming opens. The loggers in the current
workgroup are listed here.
If you would like to program loggers not in the workgroup, you can use the drop-
down list at the very top of the screen to call up another registered logger
group.
3
If you wish to program all the loggers i
the displayed group, apply the
Prog. Group button.
Result: The input window for configuring the loggers opens on the screen.
If you wish to program a single logger
in the group, first select the list and
then choose the logger. Then apply the
Prog. Single button.
50
Page 51

Working in Professional mode
Measuring parameters
The following parameters must be stated in order to define the measuring window:
Parameter Description
Measurement
(from … to)
Beginning and end of the daily measuring window.
Select from: 0:00 to 24:00 hours
Default: 2 a.m. to 4 a.m.
Explanation: The logger performs measurements and saves the
measurement values within the stated window. Interference from
background noise (traffic, water use, etc.) should be at a minimum at
this time.
Values per
measuring
window
Number of saved measured values per day.
Select from: All 100 measured values or the 50/20/10/5 lowest values
of the measuring window
Default: 50
Explanation: A logger performs 100 measurements in each measuring
window. A maximum of 100 pairs of values (noise level and frequency)
can be saved in the internal memory. The pull-down menu is used to
specify whether all 100 measured values in the logger are to be saved
or just the lowest 50/20/10/5 values in the period.
If, for example, “100 pairs per measuring window” is specified, the
logger must be read after each measuring day so that no measured
data is overwritten in the subsequent day.
If “20 measurement values per measuring window” is specified, the
logger only has to be read after 5 measuring days.
Leak
threshold
value
Measuring
days
(Mon to Sun)
Noise level from which to classify a noise as a leak.
Select from: 0 to 60 dB
Default: 10 dB
Explanation: If the lowest measured noise level in a measuring period
is above this threshold, this is an indication to the user that there is a
leak in the pipe system. Loggers where the threshold is exceeded are
pointed out in particular during the data read-out and analysis.
Experience shows that it is often sensible to have a value of
10 dB as the leak threshold.
In order to gain an impression of the average noise level in the
pipe and to gauge whether the default leak threshold of 10 dB
is too high or too low, one possibility would be to perform a real
time measurement before programming the loggers at the
place of use (see page 58).
If, during the first few measuring days, the selected leak
threshold is always far too low or far too high, you should once
again reprogram the loggers concerned and adjust the leak
threshold.
Days of the week when measurements are to be taken.
Select from: Monday to Sunday
Default: Monday to Sunday
Explanation: No measurements are performed on the other days.
51
Page 52

Working in Professional mode
Radio parameters
Continuous wireless availability and frequent wireless exchange of data have a
detrimental effect on the lifetime of a logger’s battery. To spare the battery, the periods
of wireless availability and activity can be restricted. To do this, the following parameters
must be entered:
Parameter Description
Radio signal
(from … to)
Beginning and end of the daily transmission window.
Select from: 0:00 to 24:00 hours
Default: 9:00 to 15:00 hours (in group mode “Patrol”) or
8:00 to 17:00 hours (in group mode “Lift&Shift”)
Explanation: The logger is ready to receive during this time and can
be configured or read. Furthermore, when a logger is in group mode
“Patrol”, it regularly transmits packets with measured data during this
time.
It is not possible to communicate with the logger outside the
given transmission window.
Transmission
interval
Transmission interval in “Patrol” mode.
Select from: 2/3/4/5/10/15 seconds
Default: 4 sec.
Explanation: Number of seconds after which a logger in group mode
“Patrol” repeats the transmission of the recorded measured data
(during the time span entered in radio signal only!).
The shorter the transmission interval, the faster a logger is detected by
the reading device as it passes by. However, long transmission
intervals spare the battery of the logger.
Battery symbol
Transmission
days
(Mon to Sun)
Days of the week when the set transmission window applies.
Select from: Monday to Sunday
Default: Monday to Friday
Explanation: It is not possible to communicate with the logger on the
other days of the week.
The colour of the battery symbol on the bottom left of the input window indicates how
much the entered configuration will affect the service life of the logger’s battery.
Green … battery lifetime not or hardly affected
Yellow … battery lifetime badly affected
Red … battery lifetime very badly affected
If the factory-set, default configuration is used, a noise logger can be operated for about
5 years without interruption. Any extension of the measuring window or transmission
window reduces the battery’s life accordingly.
52
Page 53

Working in Professional mode
Continuing
programming
Proceed as follows to continue the programming process:
Step Description
1
Enter the data in turn for the group or the single logger.
2 Apply the Program button in order to finish the programming.
Result: The configuration data is
transferred from the Commander to the
group.
A new view opens on the screen with
two windows:
The left-hand window shows the
loggers in the group that have been
successfully programmed.
The right-hand window shows the
loggers that have yet to be
programmed.
The antenna symbol indicates that the
Commander is wirelessly operational.
The Stop and Start buttons can be
used to cancel and continue the
procedure at any time.
Data transfer ends automatically once
all the loggers in the group have been
successfully programmed.
Result: The configuration data is
transferred from the Commander to the
individual logger.
A blue bar shows the progress of the
data transfer.
From now on, do not place the loggers on their head because switching
off would cause them to lose their configuration data and they would
need to be reprogrammed.
If a logger could not be programmed, it may have been switched off, not ready
for wireless operation or it was outside the Commander’s wireless range.
The loggers are now ready to be installed for use on location.
6.4 Installing the loggers
You can find detailed information on installing the loggers in the previous chapter (see
page 35).
53
Page 54

Working in Professional mode
6.5 Reading out the measured data
After a group has been installed for at least one measuring day, the recorded data can
be called up with the Commander.
The same group mode for which the workgroup was configured is used (see page 13).
Furthermore, you can always read just a single logger instead of a group.
6.5.1 Quick query of the workgroup
The button on the very left of the main menu bar is always used as a quick-start button
for reading the workgroup. Depending on the workgroup’s group mode, the quick-start
symbol is as follows:
Starts reading a
“Lift&Shift” group
When this button is applied, reading immediately begins for the current workgroup.
Make sure a wireless connection with the loggers or the GSM-Box can be established.
The Commander and logger are connected and the measured data is transferred.
Starts
“Patrol”
Starts reading data of a
“Network” group
from the GSM-Box
The following view opens:
The left-hand window shows the loggers in the group that have been successfully read.
The right-hand window contains all the loggers that have yet to be reached. The
antenna symbol indicates that the Commander is wirelessly operational.
Reading finishes automatically once the Commander has received and saved the
measured data from all the loggers in the group.
If a logger cannot be read, it may be switched off, not ready for wireless operation or it
may be outside the Commander’s wireless range.
54
Page 55

Working in Professional mode
It is not possible to read a “Patrol” group or a “Network” group using this method.
6.5.2 Standard query of a single logger
If you only wish to read a single logger with the commander, proceed as follows:
Step Description
1
Select the symbol in the main menu bar.
2 In the next menu, select the Read measurement data button.
Result: The loggers in the workgroup are listed in the next view.
3
If necessary, call up another logger group using the drop-down list at the very
top of the screen.
4 Select the concerning logger in the list. Then apply the Read Single button.
Result: The identification number and name of the logger are shown in the next
view.
5 Apply the Read button.
Result: The Commander and logger are connected and the measured data is
transferred.
A blue bar shows the progress of the data transfer.
After the transfer has been successfully completed, the display automatically
switches to the menu for showing the measured data (see page 42).
An error message appears if the data transfer fails. Ensure the Commander is
in the wireless range of the logger/group/GSM-Box concerned. The logger must
be ready for wireless operation. Press Read again to repeat the procedure.
6.5.3 Standard query of a “Lift&Shift” group
If you wish to read a “Lift&Shift” group, proceed as follows:
Step Description
1
Select the symbol in the main menu bar.
2 In the next menu, select the Read measurement data button.
Result: The loggers in the workgroup are listed in the next view.
3
If necessary, call up the group concerned using the drop-down list at the very
top of the screen.
4 Apply the Read Group button.
Result: The Commander and logger/GSM-Box are connected and the
measured data is transferred. The same view opens on the screen as with the
“Quick query”.
For them, please use the “Quick query” (see page 54).
55
Page 56

Working in Professional mode
6.6 Evaluating the measured data
6.6.1 Calling up the measured values
Calling up recent
measured data
Calling up older
measured data
To view the measured values from a logger on the Commander’s screen, select the
symbol in the main menu and then the Display logger data button.
The loggers in the workgroup are listed in the next view:
If necessary, you can call up a different group using the drop-down list at the very top of
the screen.
Use the View button to call up the measured data of the highlighted logger. To call up
the data of another logger in the list, select the list and then the logger. The measured
data is shown.
If the History function has been activated in the Commander’s system settings (see
page 26), you are not only able to access recent data read from the logger but also
older sets of data.
To do so, select the Actual line and then, from the drop-down list, the date of the data
set that you wish to view. The date refers to the day of the read-out.
56
Page 57

Working in Professional mode
6.6.2 Displaying the measured values
Introduction
Comparing
measured data
In Professional mode the measured data from the loggers is shown as a bar diagram on
the screen just as in Easy mode (see page 42). But, additionally the Professional mode
provides the opportunity to compare the measured data of two loggers.
After the measured data of a logger has been called up, this data can be compared to
the data of another logger in the group.
To do so, select the Compare button. The list of loggers in the workgroup opens on the
screen. Select the table and choose a logger for comparison. The following view
appears on the screen:
The two diagrams show the values of the loggers graphically. The values of the logger
selected first are above, the values of the logger for comparison below.
The leak value of the first and second logger are shown numerically under the diagrams.
After applying the Move Cursor button, you can move the vertical green line in the
diagrams to view the values of the individual recordings in greater detail.
You can use the Mode button to change the measurement unit on the Y-axis in the
diagram (see page 43).
To choose another logger in the group for comparison, use the arrow key to return to the
logger list and select a different logger.
57
Page 58

Additional measuring functions
7 Additional measuring functions
7.1 Real time measurement
Introduction
Purpose
Requirements
Procedure in
Easy mode
The “Real time measurement” function allows you to follow, in real time, the current
noise level and the frequency in a pipe directly on location and without additional
measuring devices. A logger measures continuously and immediately transfers the data
to the Commander.
The real time measurement can be useful in many situations. Here are some examples:
• Before a measurement session, you can use the real time measurement to gain a
first impression of the noises in the section of pipe concerned. This enables you, for
example, to estimate a sensible leak threshold for the measurement.
• With real time measurements at various points on the pipe network, you can already
distinguish during the day the non-critical pipe sections from the potentially critical
ones. They can then be examined more closely using a night measurement.
If the pipe noise in a section is already very low during the day, the probability of a
leak is not very high. A night measurement may then no longer be necessary at this
position and the logger can be used at a more critical point in the pipe network.
• When “patrolling”, you can use a real time measurement to check the results there
and then from the loggers indicating a high leak probability.
The logger used for the real time measurement must be switched on and ready for
wireless operation. You can install a logger in configuration mode (see page 14) at a
position on the pipe or use a logger already installed for the function. The logger does
not have to be programmed for the function!
In Easy mode, proceed as follows to perform the real time measurement:
Step Description
Procedure in
Professional mode
1
In the main menu, select the Real time measurement button.
Result: The loggers in the workgroup are listed in the next view.
2
Select the list and there select the logger that you wish to observe.
Result: Observation of the logger begins. The view for the real time
measurement appears on the screen (see further down in the text).
In Professional mode, proceed as follows to perform the real time measurement:
Step Description
1
Select the symbol in the main menu.
2 In the next menu, select the Real time measurement button.
Result: The loggers in the workgroup are listed in the next view.
3
If necessary, you can call up another group using the drop-down list at the very
top of the screen.
4
Select the list and there select the logger that you wish to observe.
Result: Observation of the logger begins. The view for the real time
measurement appears on the screen (see further down in the text).
58
Page 59

Additional measuring functions
6
5
4
3
2
1
Display of
measured data
The course of the real time measurement is shown on the Commander’s screen with a
running bar diagram:
1
2
4
5
3
6
Element Description
Identification number and comment of the observed logger
Diagram
Each bar represents a single noise recording.
X-axis ... course of measurement over time
Y-axis ... noise level in dB
The colour of the bar represents the frequency of the noise.
Blue
0 Hz
Yellow
2,500 Hz
The point where the two green lines intersect marks the quietest recording in
the displayed measurement, the so-called “leak value”.
Antenna symbol
indicates that the Commander is wirelessly operational
Minimum value of the display (leak value)
Left-hand field … ESA value of the recording
Centre field … Noise level in dB for the quietest measurement
Right-hand field … Frequency of the noise in Hz
Current value of the display
Noise level (bar height) and frequency (bar colour) of the current measuring
value (including numeric values).
Buttons
Stop and Start can be used to cancel and continue the observation at any
time. However, the time gap between cancellation and continuation is not
shown.
Use the ESC button to end the function and return to the main menu.
The permanent wireless connection during the real time measurement requires a
lot of power. This has a detrimental effect on the lifetime of the logger’s battery.
Please consider this when using the function.
59
Page 60

Additional measuring functions
7.2 Audio recordings
Loggers in the Sebalog N-3 series are able to save recorded noises as audio files and to
send them to the reading device. This means the user is no longer reliant on the
measurement values alone (level/frequency/ESA value) when evaluating a noise. You
can actually listen to the suspected leak.
Firstly, the loggers automatically save the quietest noise in the measuring period as an
audio file. This file can, for example, be called up later with the Commander and
replayed.
Secondly, you can get a recording of the current noise in the pipe from each installed
logger. This allows you to listen on a pipe, almost in real time, without any additional
equipment (sensor rod microphone or similar).
7.2.1 Reading out the audio data
Introduction
Procedure
Each logger automatically records the quietest noise (leak noise) in a measuring period
and saves it as an audio file. To spare the logger’s battery, this file is not automatically
sent to the reading device when the logger is read. It must be queried separately.
To query audio data in a logger, proceed as follows:
Step Description
1
In Easy mode … In Professional mode …
… select the button in the
main menu.
2 Select the Read / Play audio data
button.
Result: The loggers in the workgroup are listed in the next view.
3
4
Select the logger list and then the logger from which you wish to call up the leak
noise.
5 Apply the Read audio data button to continue.
Result: The ID and comment of the logger, from which the audio data is called
up, are shown once again in the next view. Data transfer starts automatically. A
blue bar shows the progress of the transfer. After the transfer has been
successfully completed, the display automatically switches to the menu for
playing back audio data (see page 61). You can then listen to the leak noise
that has just been read.
An error message appears on the screen if the data transfer fails. Ensure the
Commander is in the wireless range of the logger concerned. Press Start to
repeat the procedure.
… select the symbol in the main
menu bar.
Select the Read audio data button.
If necessary, you can call up another
group using the drop-down list at the
very top of the screen.
60
Page 61

Additional measuring functions
7.2.2 Playing back the audio data
Introduction
Procedure
After an audio file is sent from a logger to the Commander, it can be played back with
the Commander and listed to over headphones.
First, connect the supplied headphones to the Commander via the 5-pin headphone
socket . White markings on the plug and socket show the correct position of the plug.
You must feel the plug engage.
To play back an audio file, proceed as follows:
Step Description
1
In Easy mode … In Professional mode …
… apply the button in the
main menu of the Commander.
2 Select Read / Play audio data once
again in the next view.
3 Apply the Play button.
Result: The menu for playing back audio files opens.
… select the symbol in the main
menu bar of the Commander.
Apply the Play audio data button in
the next view.
If necessary, you can call up another
group using the drop-down list at the
very top of the screen.
4
Select the logger list and then the logger from which you wish to play back the
audio data.
A note symbol , on the very right of the list indicates the loggers from which
audio data is saved in the Commander. Only loggers with this symbol have a
leak noise saved.
5 Apply the Play button.
Result: The three-second recording of the leak noise is played back and
continuously repeated.
The yellow bar indicates the playback.
You can adjust the headphone volume. To do so, apply the VOL +/- button and
turn the selector knob. The blue bar above the button shows the current setting.
Before playing an audio file, it is advisable to first have the headphone
volume on a medium setting (e.g. level 18).
In Professional mode the frequency range of the recorded noise can be
displayed using the Spectrum button (see next page).
Playback can be ended at any time with the Stop button.
61
Page 62

Additional measuring functions
7.2.3 Displaying the frequency spectrum of the leak noise (in Professional
mode only)
Introduction
Purpose
Procedure
In Professional mode, you can view the frequency spectrum of the saved leak noise for
an even more in-depth analysis.
Sometimes the assumed leak noise stems from a known source of interference (e.g.
50 Hz/100 Hz mains voltage or a pump in operation). However, you should not
prematurely believe the conspicuous noise to be non-critical because there could still be
a real leak noise next to the background noise. By analysing the frequency spectrum,
you can check the saved noise for frequency peaks other than those of the interference.
Apply the Spectrum button in the menu for playing back audio files (see previous page).
The following view opens on the screen:
The diagram shows the spectrum of frequencies producing the saved leak noise (0 to
about 3,250 Hz).
X-axis … Frequency spectrum of the leak noise
Y-axis … The most dominant frequency of the noise
corresponds to “1” on the dimensionless scale. All the
other frequencies occurring are shown in relation to
this.
You can move the vertical green line in the diagram in order to view in greater detail the
frequencies at individual points on the curve. To do so, apply the Move Cursor button
and turn the selector knob.
Close the view with the OK button and return to the menu for playing back audio files.
The recorded frequency spectrum of a noise is influenced by many factors
(position of the logger, logger’s contact with the pipe, reflections in the pipe, etc.).
Even small changes in these factors can considerably change the displayed
frequency spectrum of the same noise. The inexperienced user can quickly make
misjudgements. Therefore, the frequency spectrum analysis should above all be
performed by experienced users who, for example, know how to use correlators.
Sometimes the frequency shown under “leak value” can diverge slightly from the
maximum frequency in the diagram display. This is not an error. This is caused
by the finer graduation of the displayed frequency band in the Commander,
compared to the internal graduation in the loggers. The value shown in the
diagram is therefore somewhat more precise.
62
Page 63

Additional measuring functions
7.2.4 Recording a noise directly (in Professional mode only)
Introduction
Requirements
Procedure
The “Direct recording” function of a Log N-3 logger enables you to listen in on the
current noise in a pipe without using additional equipment (sensor rod microphone or
similar).
If “Direct recording” is performed with a logger already installed, you do not even have to
open the shaft to listen to the pipe.
With this function, the logger creates a three-second recording of the current noise in
the pipe. This audio file is then immediately sent to the Commander where it can be
replayed. The pipe noise can thus be tracked almost in real time.
You can perform “Direct recording” with any logger already installed, if it is programmed
in “Lift&Shift” or “Patrol” group mode and if it is within its programmed “Wireless on”
time. (Unfortunately, the system will not allow loggers in “Network” group mode to be
used for this.)
However, you can also use a logger that has not been installed yet. The logger does not
have to be programmed after being switched on. It can simply remain in configuration
mode instead (see page 14).
To record a noise directly, a logger must be switched on, installed on the pipe and
located within the wireless range of the Commander. The distance is preferably between
1 and 10 m.
Proceed as follows to record the pipe noise directly:
Step Description
1
Select the symbol in the main menu and the Direct recording button
in the next view.
Result: The loggers in the workgroup are listed in the next view.
2
If necessary, you can call up another logger group using the drop-down list at
the very top of the screen.
3
Select the table and then the logger for recording the current noise.
4 Apply the Start recording button.
Result: The ID and comment of the logger to perform the recording are shown
once again in the next view. The Commander and the logger are connected.
The noise recording and following transfer of the audio file to the Commander
take place automatically. A bar shows the progress.
After the data has been transferred successfully, the menu for playing back
audio files opens automatically on the Commander’s screen (see page 61).
63
Page 64

Increasing the wireless range of the loggers with repeaters when patrolling (in
Professional mode only)
8 Increasing the wireless range of the loggers with repeaters when
patrolling (in Professional mode only)
Introduction
Requirements
The actual wireless range of a noise logger depends on the conditions at the place of
use. If a logger is installed in a shaft, its radio signal sometimes does not reach far
enough above the surface to be received properly during “patrolling”. In such cases a
repeater can be used. The repeater passes on the logger’s radio signal, therefore
extending the wireless link.
In principle, any repeater can work with any Log N-3 noise logger. However, a repeater
in “Patrol” group mode can only ever pass on the signal of a single logger.
The particular logger must be “paired up” with the repeater before the measurement.
The logger must already have been programmed beforehand (group mode: “Patrol”).
The logger should already be installed at the place of use.
64
Page 65

Increasing the wireless range of the loggers with repeaters when patrolling (in Professional mode only)
8.1 Repeater design
Design
A repeater has the following features:
Element Description
Status LED
•
Flashes blue … ready to receive
•
Lights up blue … receiving data
•
Flashes red … transmitting data
•
Lights up yellow then red … switching off
•
Lights up red then quickly
flashes blue
… update is being installed
Switching on/off
Power supply
•
No light … switched off
On/Off contact field
The repeater is switched on using a magnetic switch.
Move the supplied magnet over the On/Off contact field of the repeater. The status
LED first lights up red; after the magnet is removed it flashes green three times.
Regular blue flashing then indicates that the repeater is switched on and ready to
receive.
To switch off the repeater, keep the magnet at the On/Off contact field for a few
seconds. The LED first lights up yellow. As soon as it lights up red, you can remove the
magnet. The repeater then switches off and the LED goes out.
Each repeater has an internal lithium battery. It can power the device for up to five
years. The actual battery lifetime depends on the wireless settings of the “paired”
loggers.
When you query a repeater’s configuration, its battery status is also shown.
Flat batteries cannot be recharged. They must be replaced.
SebaKMT or an authorised service partner must change the batteries.
Otherwise, water- and dirt-resistance of the repeater cannot be guaranteed.
65
Page 66

Increasing the wireless range of the loggers with repeaters when patrolling (in
Professional mode only)
8.2 Installing the wireless extension
Before the wireless extension via repeaters can be set up, the logger concerned must
already be programmed and installed at its place of use.
Proceed on location as follows:
Step Description
1
Select the symbol in the main menu and the
Connect Repeater to Logger button in the next view.
If this button is not shown, the current workgroup is probably not a “Patrol”
group. In this case you must first specify a new workgroup (see page 45).
Result: The loggers in the workgroup are listed.
2
If necessary, you can call up another logger group using the drop-down list at
the very top of the screen.
3
Select the logger list and then the logger to be connected to the repeater. If the
respective reader is already preset, apply the “Select Repeater” button.
Result: A window for registering the repeater in the Commander automatically
opens on the screen.
4
Use one of these two methods to register the repeater:
Automatic detection: Move the
switched off repeater close to the
Commander and switch it on. Once the
repeater is detected, New ID found
appears on the screen. The ID of the
repeater is displayed underneath. Use
the Accept button to confirm.
Result: The following display opens on the screen:
This display can be used to test the quality of the wireless connection between
the logger and repeater and to find a suitable location for the repeater.
Manual input: Enter the repeater’s sixdigit ID with the virtual keyboard. Use
the ENTER button to confirm.
66
Page 67

Increasing the wireless range of the loggers with repeaters when patrolling (in Professional mode only)
Step Description
5 Apply the Start button.
The logger and repeater are connected.
The vertical blue line in the bar indicator shows the strength currently of the
wireless connection between the logger and repeater.
Installing the repeater
• Green area
• Yellow area
6
Look for a suitable place around the installed logger for fitting the repeater.
… … good connection
poor connection
When doing so, keep an eye on the signal strength indicator on the
Commander, or watch the status LED on the repeater:
…
• Lights up green
• Lights up yellow
• Flashes blue
good connection
…
poor connection
…
no connection to the logger
7 When you have found a suitable position for the repeater, apply the Accept
button on the Commander.
Result: The logger and repeater are now “paired” with each other.
Any communication with the logger now automatically takes place via the
repeater.
This is the case until the repeater is switched back off.
When installing the repeater, you should observe the following:
• The wireless signal between the logger and repeater should be as strong as
possible (green); if the connection is poor (yellow) interference can easily occur,
causing the read-out to fail.
• The place of installation should be somewhat elevated, e.g. at a height of 2 m
on a lamp post, or similar.
• The repeater should not be too easily accessible, to prevent theft or vandalism.
• The repeater must not be a nuisance to anyone or infringe any property laws.
• While measurement takes place, no impairment of the wireless connection
should be expected due to external influences.
You can, for example, attach the repeater to a street lamp, house wall or, if necessary,
to a tree. To do so, use the supplied cable ties, for example, or any other form of
fastening that does not cause damage.
67
 Loading...