

Page 1
Consultation with SebaKMT
User Manual
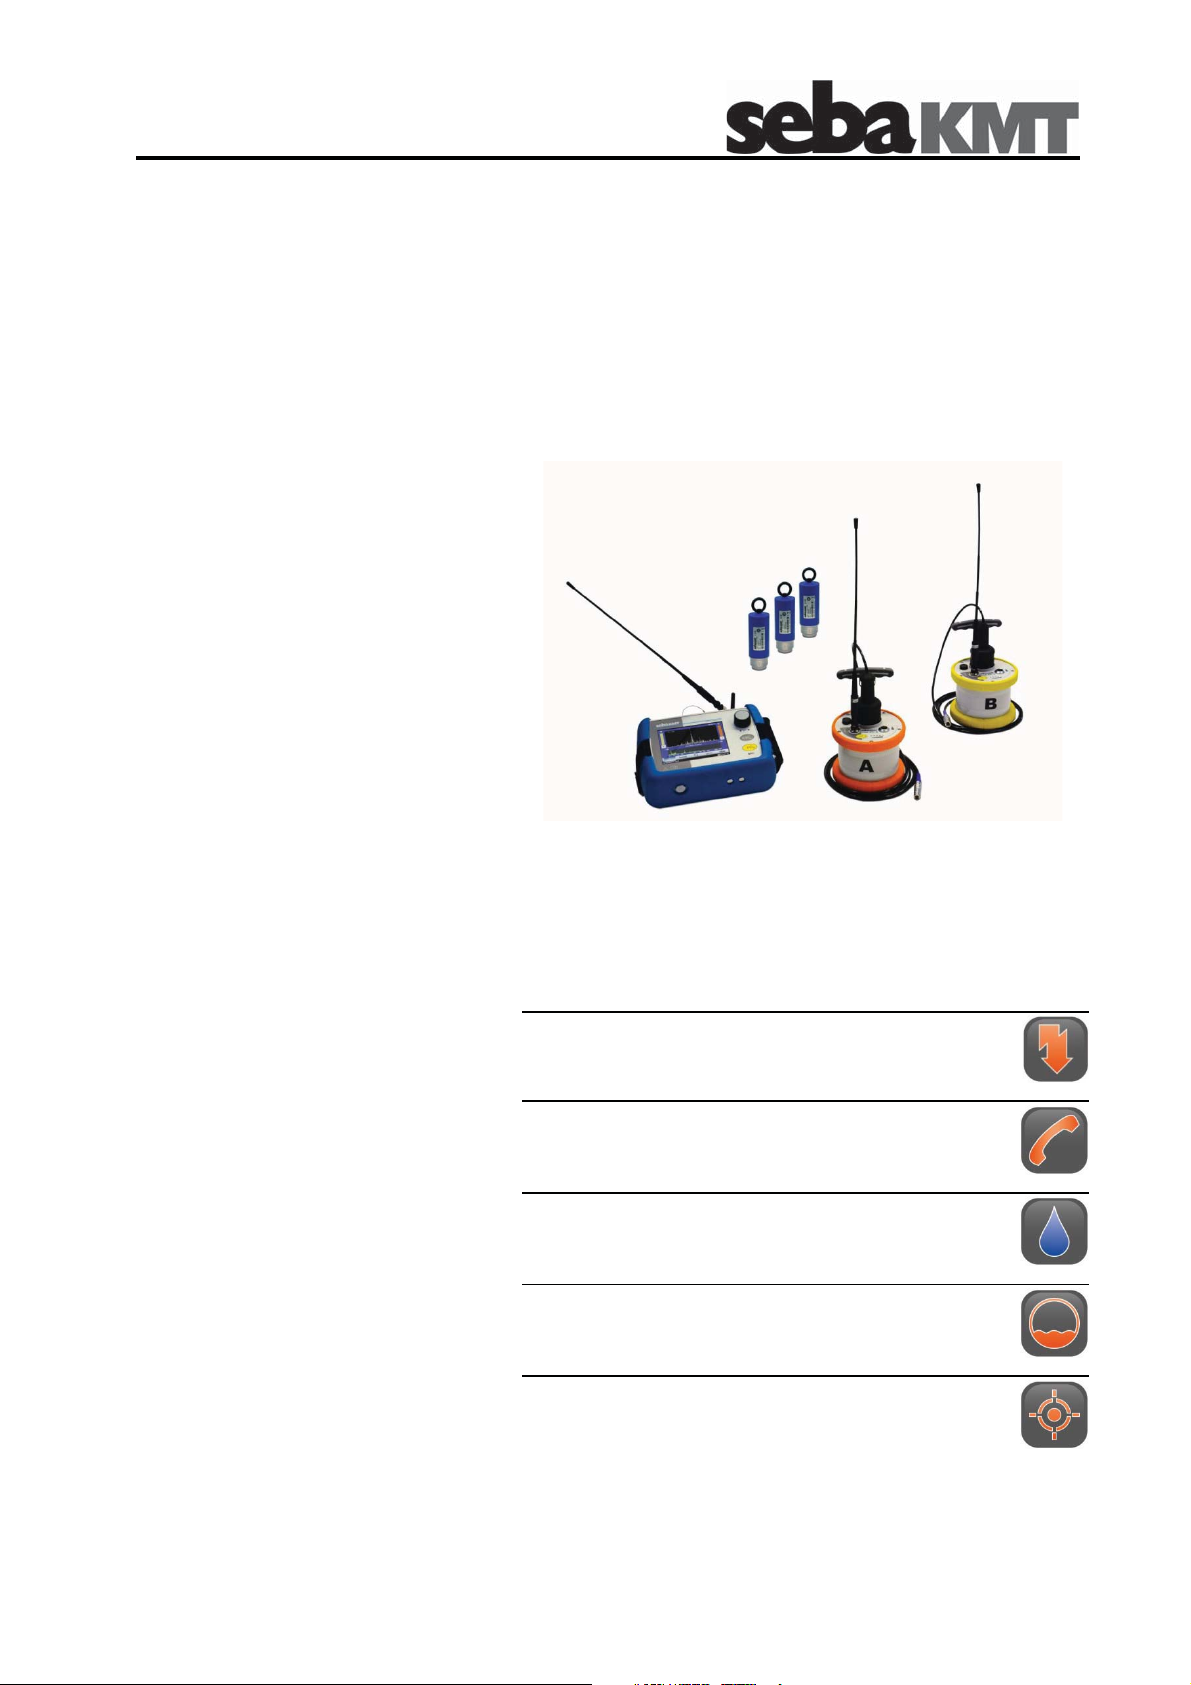
Correlator
Correlux C-3
Mess- und Ortungstechnik
Measuring and Locating Technologies
Elektrizitätsnetze
Power Networks
Kommunikationsnetze
Communication Networks
Rohrleitungsnetze
Water Networks
Abwassernetze
Sewer Systems
Leitungsortung
Line Locating
Issue: 3.2 (02/2016) - EN
1
Article number: 84416
Page 2

Consultation with SebaKMT
2
Page 3

Consultation with SebaKMT
Consultation with SebaKMT
The present system manual has been designed as an operating guide and for
reference. It is meant to answer your questions and solve your problems in as fast and
easy a way as possible. Please start with referring to this manual should any trouble
occur.
In doing so, make use of the table of contents and read the relevant paragraph with
great attention. Furthermore, check all terminals and connections of the instruments
involved.
Should any question remain unanswered or should you need the help of an authorized
service station, please contact:
Seba Dynatronic
Mess- und Ortungstechnik GmbH
Dr.-Herbert-Iann-Str. 6
D - 96148 Baunach
Phone: +49 / 9544 / 68 – 0
Fax: +49 / 9544 / 22 73
E-Mail: sales@sebakmt.com
http://www.sebakmt.com
Hagenuk KMT
Kabelmesstechnik GmbH
Röderaue 41
D - 01471 Radeburg / Dresden
Phone: +49 / 35208 / 84 – 0
Fax: +49 / 35208 / 84 249
© SebaKMT
All rights reserved. No part of this handbook may be copied by photographic or other means unless SebaKMT
have before-hand declared their consent in writing. The content of this handbook is subject to change without
notice. SebaKMT cannot be made liable for technical or printing errors or shortcomings of this handbook.
SebaKMT also disclaims all responsibility for damage resulting directly or indirectly from the delivery, supply,
or use of this matter.
3
Page 4

Terms of Warranty
Terms of Warranty
SebaKMT accept responsibility for a claim under warranty brought forward by a
customer for a product sold by SebaKMT under the terms stated below.
SebaKMT warrant that at the time of delivery SebaKMT products are free from
manufacturing or material defects which might considerably reduce their value or
usability. This warranty does not apply to faults in the software supplied. During the
period of warranty, SebaKMT agree to repair faulty parts or replace them with new parts
or parts as new (with the same usability and life as new parts) according to their choice.
This warranty does not cover wear parts, lamps, fuses, batteries and accumulators.
SebaKMT reject all further claims under warranty, in particular those from consequential
damage. Each component and product replaced in accordance with this warranty
becomes the property of SebaKMT.
All warranty claims versus SebaKMT are hereby limited to a period of 12 months from
the date of delivery. Each component supplied by SebaKMT within the context of
warranty will also be covered by this warranty for the remaining period of time but for 90
days at least.
Each measure to remedy a claim under warranty shall exclusively be carried out by
SebaKMT or an authorized service station.
This warranty does not apply to any fault or damage caused by exposing a product to
conditions not in accordance with this specification, by storing, transporting, or using it
improperly, or having it serviced or installed by a workshop not authorized by SebaKMT.
All responsibility is disclaimed for damage due to wear, will of God, or connection to
foreign components.
For damage resulting from a violation of their duty to repair or re-supply items,
SebaKMT can be made liable only in case of severe negligence or intention. Any liability
for slight negligence is disclaimed.
Since some states do not allow the exclusion or limitation of an implied warranty or of
consequential damage, the limitations of liability described above perhaps may not
apply to you.
For FCC:
- User Information acc. to FCC15.21:
Changes or modifications not expressly approved by the party responsible for
compliance could void the user's authority to operate the equipment.
- Part 15 Statement gem. FCC 15.19/RSS Gen Issue 3 Sect. 7.1.3
This device complies with Part 15 of the FCC Rules and with Industry Canada
license-exempt RSS standard(s). Operation is subject to the following two
conditions:
(1) this device may not cause harmful interference, and (2) this device must
accept any interference received, including interference that may cause
undesired operation
4
Page 5

Terms of Warranty
Contents
Consultation with SebaKMT ........................................................................................... 3
Terms of Warranty ........................................................................................................... 4
1
1.1
1.2
2
2.1
2.2
2.3
2.4
2.5
2.6
2.7
2.8
3
3.1
Safety Instructions ........................................................................................... 9
General Safety Instructions and Warnings ......................................................... 9
General Notes .................................................................................................... 9
Frequently used menus ................................................................................. 11
Start menu ........................................................................................................ 11
Pipe data menu ................................................................................................ 13
Correlation menu .............................................................................................. 15
Correlation menu (Offline correlation) .............................................................. 17
Correlation analysis menu ................................................................................ 19
Frequency analysis menu ................................................................................ 21
Audio menu ...................................................................................................... 23
Audio menu (when ground microphone is connected) ..................................... 25
Technical description .................................................................................... 27
Function ............................................................................................................ 27
3.2
3.3
3.4
3.5
3.6
4
4.1
4.2
4.3
4.4
4.5
5
5.1
5.2
5.3
5.4
Features of the set ........................................................................................... 28
Communication of the components .................................................................. 29
Power supply .................................................................................................... 29
Scope of delivery .............................................................................................. 30
Technical data .................................................................................................. 31
The Power transmitters ................................................................................. 33
Function and Design ........................................................................................ 33
Identification number (ID) ................................................................................. 35
Power supply .................................................................................................... 35
Commissioning ................................................................................................. 36
Installation ........................................................................................................ 36
The Multi sensors ........................................................................................... 37
Design and function .......................................................................................... 37
Identification number (ID) ................................................................................. 37
Power supply .................................................................................................... 38
Switching ON/OFF ........................................................................................... 38
5.5
5.6
6
6.1
Installation ........................................................................................................ 39
Angle adapter ................................................................................................... 39
The Correlator ................................................................................................. 41
Design and function of the device .................................................................... 41
5
Page 6

Terms of Warranty
6.2
6.3
6.4
6.4.1
6.4.2
6.4.3
6.4.4
6.4.5
6.5
6.5.1
6.5.2
6.5.3
6.5.4
6.5.5
6.6
6.6.1
6.6.2
6.6.3
Power supply .................................................................................................... 43
Design of the user interface ............................................................................. 44
Basics of operation ........................................................................................... 45
Input methods ................................................................................................... 45
Entering identification numbers ........................................................................ 45
Entering text ..................................................................................................... 46
Sorting devices in lists and tables .................................................................... 47
ESC pushbutton and "Back" button ................................................................. 47
Commissioning ................................................................................................. 48
Switch the Correlator ON/OFF ......................................................................... 48
Basic settings at initial start-up ......................................................................... 48
Change the language ....................................................................................... 49
Activate the display light ................................................................................... 49
Enable/Disable the touch screen (touch sensitivity) ........................................ 50
System settings ................................................................................................ 51
Basic settings ................................................................................................... 51
System info ....................................................................................................... 53
Saving the settings ........................................................................................... 53
6.7
6.7.1
6.7.2
6.8
7
7.1
7.2
7.3
7.4
7.5
8
8.1
8.2
8.3
9
10
Communication ................................................................................................ 54
Connection between the Correlator and the sensors ....................................... 54
Connection between the Correlator and the computer .................................... 54
Hardware reset ................................................................................................. 54
Sensor management ...................................................................................... 55
Introduction ....................................................................................................... 55
Access the sensor pool .................................................................................... 55
Register sensors .............................................................................................. 57
Replace / Delete sensors ................................................................................. 58
Additional functions .......................................................................................... 59
Online correlation ........................................................................................... 61
Measurement with 2 Power transmitters .......................................................... 61
Measurement with only 1 Power transmitter .................................................... 65
How to exchange A - B on the screen .............................................................. 67
Offline correlation (Multipoint measurement) ............................................. 69
GPS position data .......................................................................................... 77
10.1
10.2
10.3
11
12
12.1
Introduction ....................................................................................................... 77
Determine and save GPS coordinates ............................................................. 77
Distance measurement and navigation via GPS ............................................. 79
Real-time measurement ................................................................................. 81
Sound velocity measurement ....................................................................... 85
Velocity measurement in Online measurement mode ..................................... 85
6
Page 7

Terms of Warranty
12.2
Velocity measurement in Offline measurement mode ..................................... 88
12.2.1Introduction ....................................................................................................... 88
12.2.2Procedure ......................................................................................................... 89
12.2.3Notes and examples ......................................................................................... 91
13
14
14.1
14.2
14.2.1Call up and display a correlation ...................................................................... 98
14.2.2Rename a correlation / Create a comment ...................................................... 99
15
16
16.1
16.2
16.3
Map function ................................................................................................... 93
Storage / Management of correlations (History) ......................................... 97
Storing a correlation ......................................................................................... 97
Managing stored correlations ........................................................................... 98
Reset of correlation settings and data ....................................................... 101
Pinpointing .................................................................................................... 103
Introduction ..................................................................................................... 103
Pinpointing using the ground microphone ...................................................... 103
Pinpointing using Multi sensor s ...................................................................... 107
17
18
18.1
18.2
18.2.1Work step 1: Download and store the update-file .......................................... 115
18.2.2Work step 2: Transfer and run the update-file................................................ 116
19
19.1
19.2
19.2.1Storage location for application database ...................................................... 123
19.2.2GPS receiver port ........................................................................................... 123
19.2.3System of units ............................................................................................... 123
19.2.4Logarithmic/linear display ............................................................................... 124
19.3
19.4
19.5
19.6
19.6.1Perform / display correlation........................................................................... 127
19.6.2Display / select audio blocks (Offline measurements only) ............................ 128
19.6.3Calling up the correlation analysis menu ....................................................... 129
19.6.4Selecting correlation method (Offline measurements only) ........................... 130
Query the status of a device ....................................................................... 111
Firmware update ........................................................................................... 113
How to update the Correlator ......................................................................... 113
How to update Power transmitters or Multi sensors ...................................... 115
CorreluxView Software ................................................................................ 121
User interface ................................................................................................. 121
Basic settings ................................................................................................. 123
Creating, renaming and deleting directories .................................................. 124
Importing data ................................................................................................ 125
Editing a map ................................................................................................. 125
Correlation ...................................................................................................... 127
7
Page 8

Terms of Warranty
8
Page 9
Safety Instructions
1 Safety Instructions
1.1 General Safety Instructions and Warnings
•
Do not drop the device / the system’s components or subject it / them to
strong impacts or mechanical shocks.
•
The limits described under Technical Data may not be exceeded.
•
The device / system must be in a technically perfect condition for
measurement.
•
The indicated degree of protection can only be ensured if plugs or the
provided protection caps are put in all sockets of the device.
•
The plugs of the supplied connection cables are only compliant to the
indicated degree of protection as long as they are plugged in. Plugs
which are not connected or which are connected in a wrong way are not
protected from water and dust ingress.
•
If the O-ring seal of a socket is obviously damaged, it must be replaced
in order to ensure the total protection against water and dust ingress.
1.2 General Notes
Safety precautions
Labelling of safety
instructions
This manual contains basic instructions for the commissioning and operation of the
device / system. For this reason, it is important to ensure that the manual is always
available to the authorised and trained operator. He needs to read the manual
thoroughly. The manufacturer is not liable for damage to material or humans due to nonobservance of the instructions and safety advices provided by this manual.
Locally applying regulations have to be observed!
The following signal words and symbols are used in this manual and on the product
itself:
Signal word /
Description
symbol
CAUTION
Indicates a potential hazard which may result in moderate or minor injury
if not avoided.
NOTICE
Indicates a potential hazard which may result in material damage if not
avoided.
Serves to highlight warnings and safety instructions.
As a warning label on the product it is used to draw attention to potential
hazards which have to be avoided by reading the manual.
Serves to highlight important information and useful tips on the operation
of the device/system. Failure to observe may lead to unusable
measurement results.
Check contents
Working with products
from SebaKMT
Check the contents of the package for completeness and visible damage right after
receipt. In the case of visible damage, the device must under no circumstances be taken
into operation. If something is missing or damaged, please contact your local sales
representative.
It is important to observe the generally applicable regulations of the country in which the
device will be operated, as well as the current national accident prevention regulations
and internal company directives (work, operating and safety regulations).
9
Page 10

Safety Instructions
Use genuine accessories to ensure system safety and reliable operation. The use of
other parts is not permitted and invalidates the warranty.
Repair and
maintenance
Special transportation
requirements
Electromagnetic
radiation
Repair and maintenance work has to be carried out by SebaKMT or authorised service
partners using original spare parts only. SebaKMT recommends having the system
tested and maintained at a SebaKMT service centre once a year.
SebaKMT also offers its customers on-site service. Please contact your service centre if
needed.
The lithium batteries of the device are dangerous goods. The transport of the batteries
itselves and of devices which contain such batteries is subject to regulations based on
the UN Model Regulations “Transport of Dangerous Goods” (ST/SG/AC.10-1).
Please inform yourself about the transportation requirements and follow them when
shipping the device.
This device is designed for industrial use. When used at home it could cause
interference to other equipment, such as the radio or television.
The interference level from the line complies with the limit curve B (living area), the
radiation level complies with the limit curve A (industrial area) according to EN 55011.
Given that living areas are sufficiently far away from the planned area of operation
(industrial area), equipment in living areas will not be impaired.
10
Page 11
Frequently used menus
2 Frequently used menus
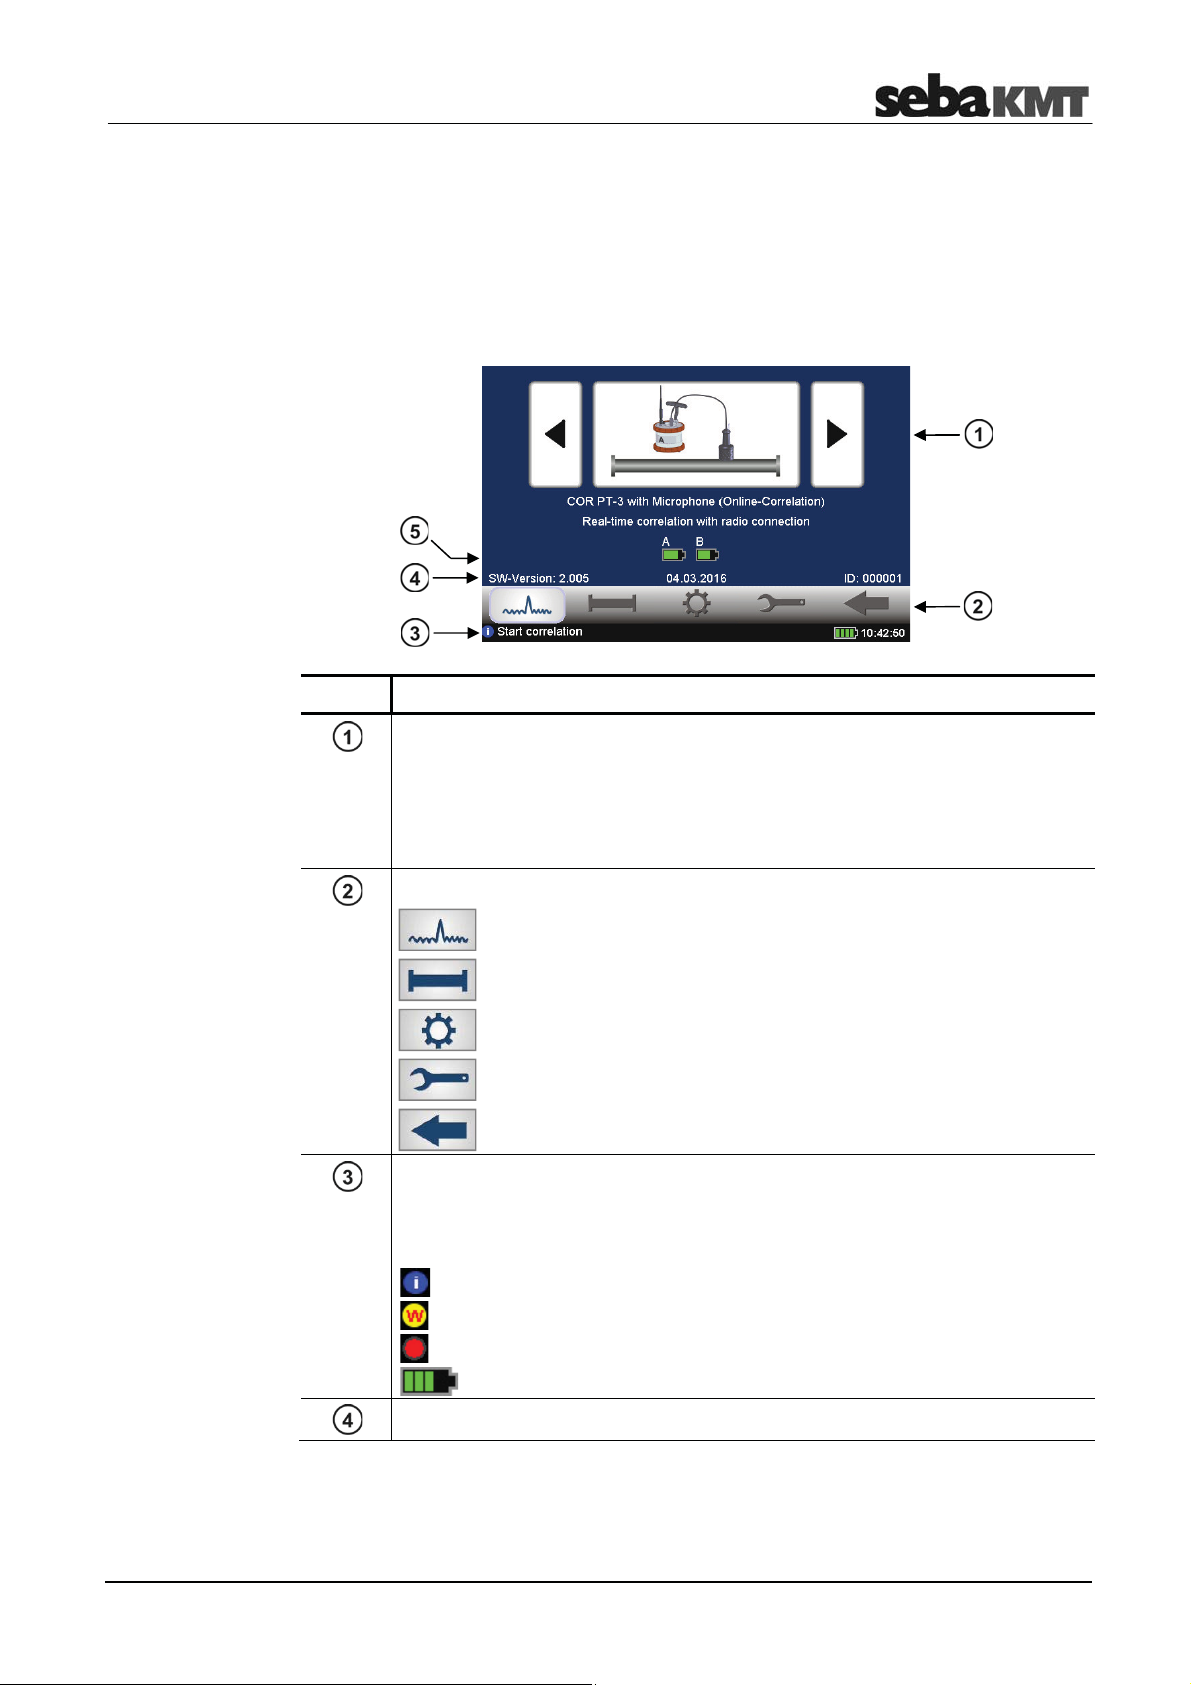
2.1 Start menu
The Start menu appears on the screen after the device has been switched on. In
addition, the ESC pushbutton takes you back directly to the Start menu from every
menu level.
Element Description
Measuring mode selection
Arrow buttons ... To go forward / backward through the available
Large central button ... Opens the relevant measuring mode menu or starts
Main menu
Starts the Correlation
Opens the Pipe data menu
Opens the Tools menu
Opens the System settings menu
Goes Back to the previous menu
Info line
This line provides information on the display, comments and notes on how to
proceed. On the right, the Correlator's battery status and the time are
shown.
measuring methods.
the correlation.
this symbol indicates info texts
this symbol indicates warnings
this symbol indicates that an Offline measurement is in progress
shows the Correlator battery level
Firmware version / Date / Identification number (ID) of the device
11
Page 12
Frequently used menus
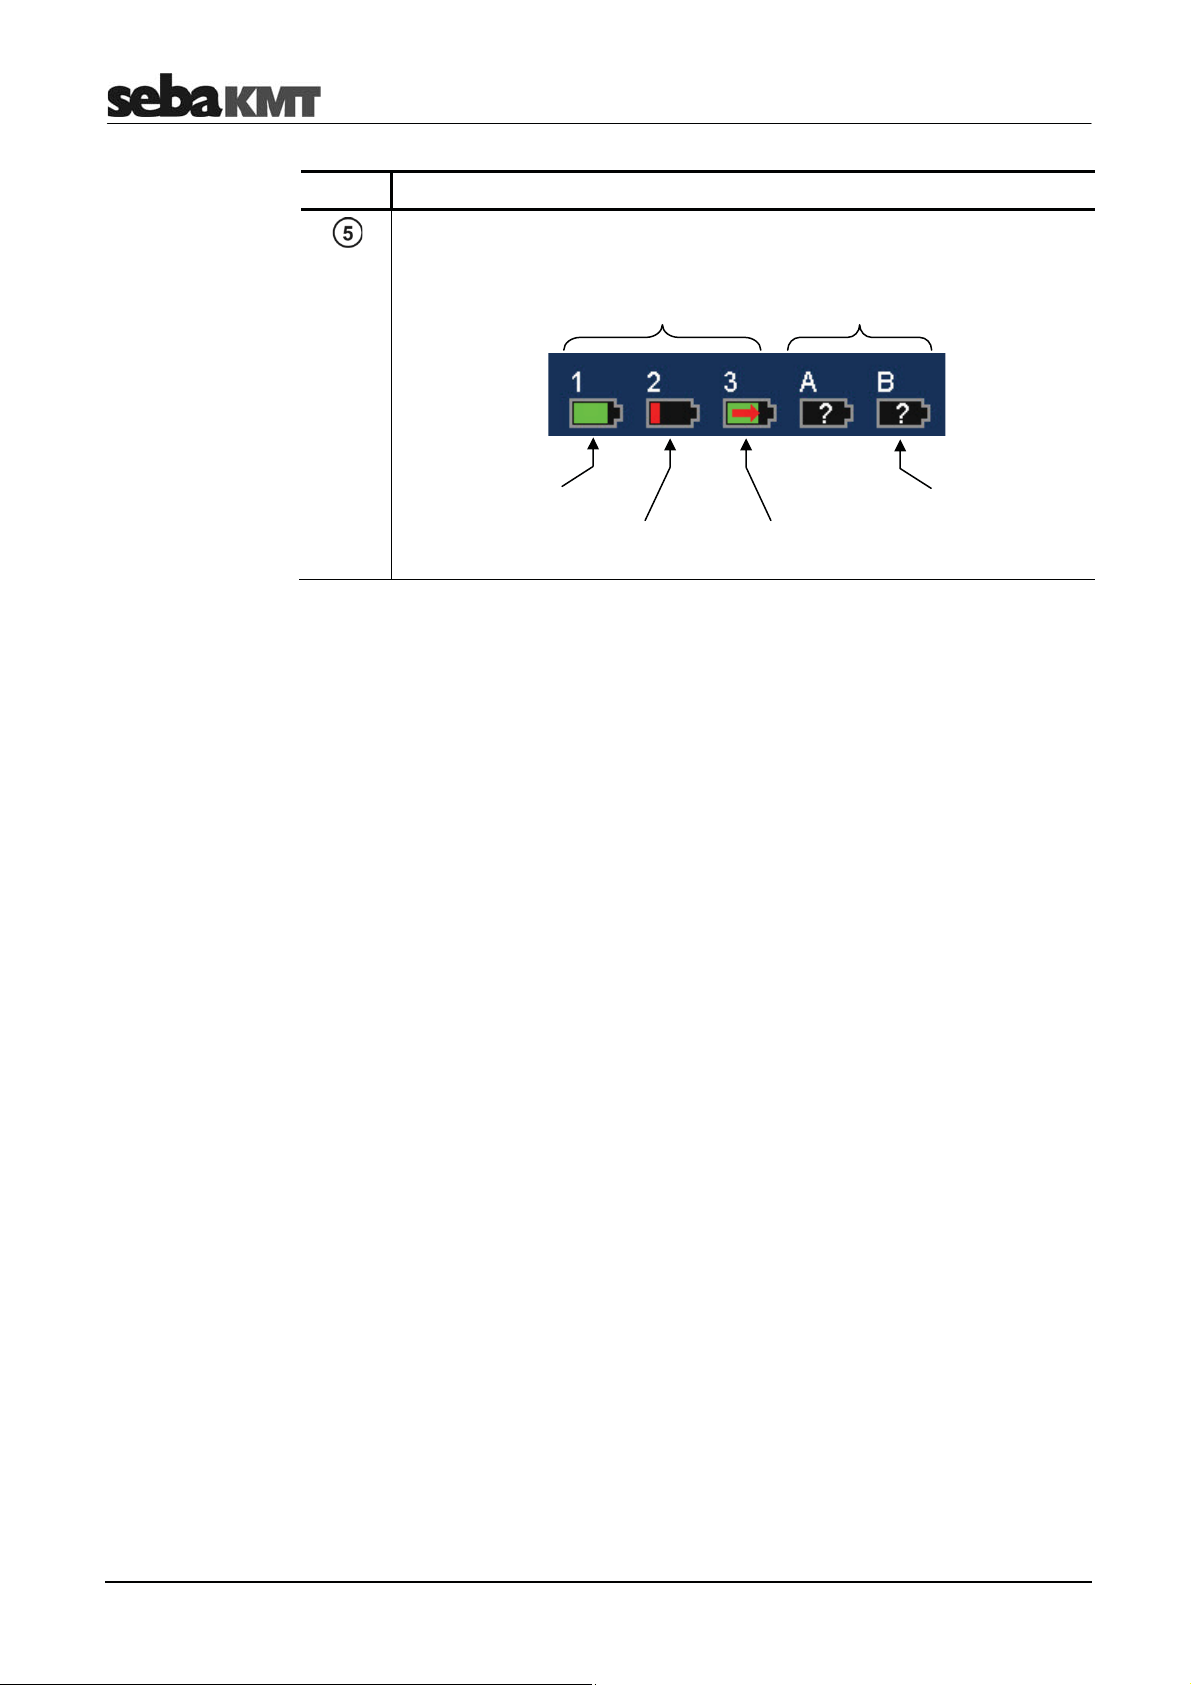
Element Description
Battery level of the received Power transmitters or Multi sensors.
Multi sensors
No.1 to 3
Fully charged
Critical
Power transmitters
"A" and "B"
Charging
No information
available about the
status of the device
12
Page 13
Frequently used menus
g
pip
pip
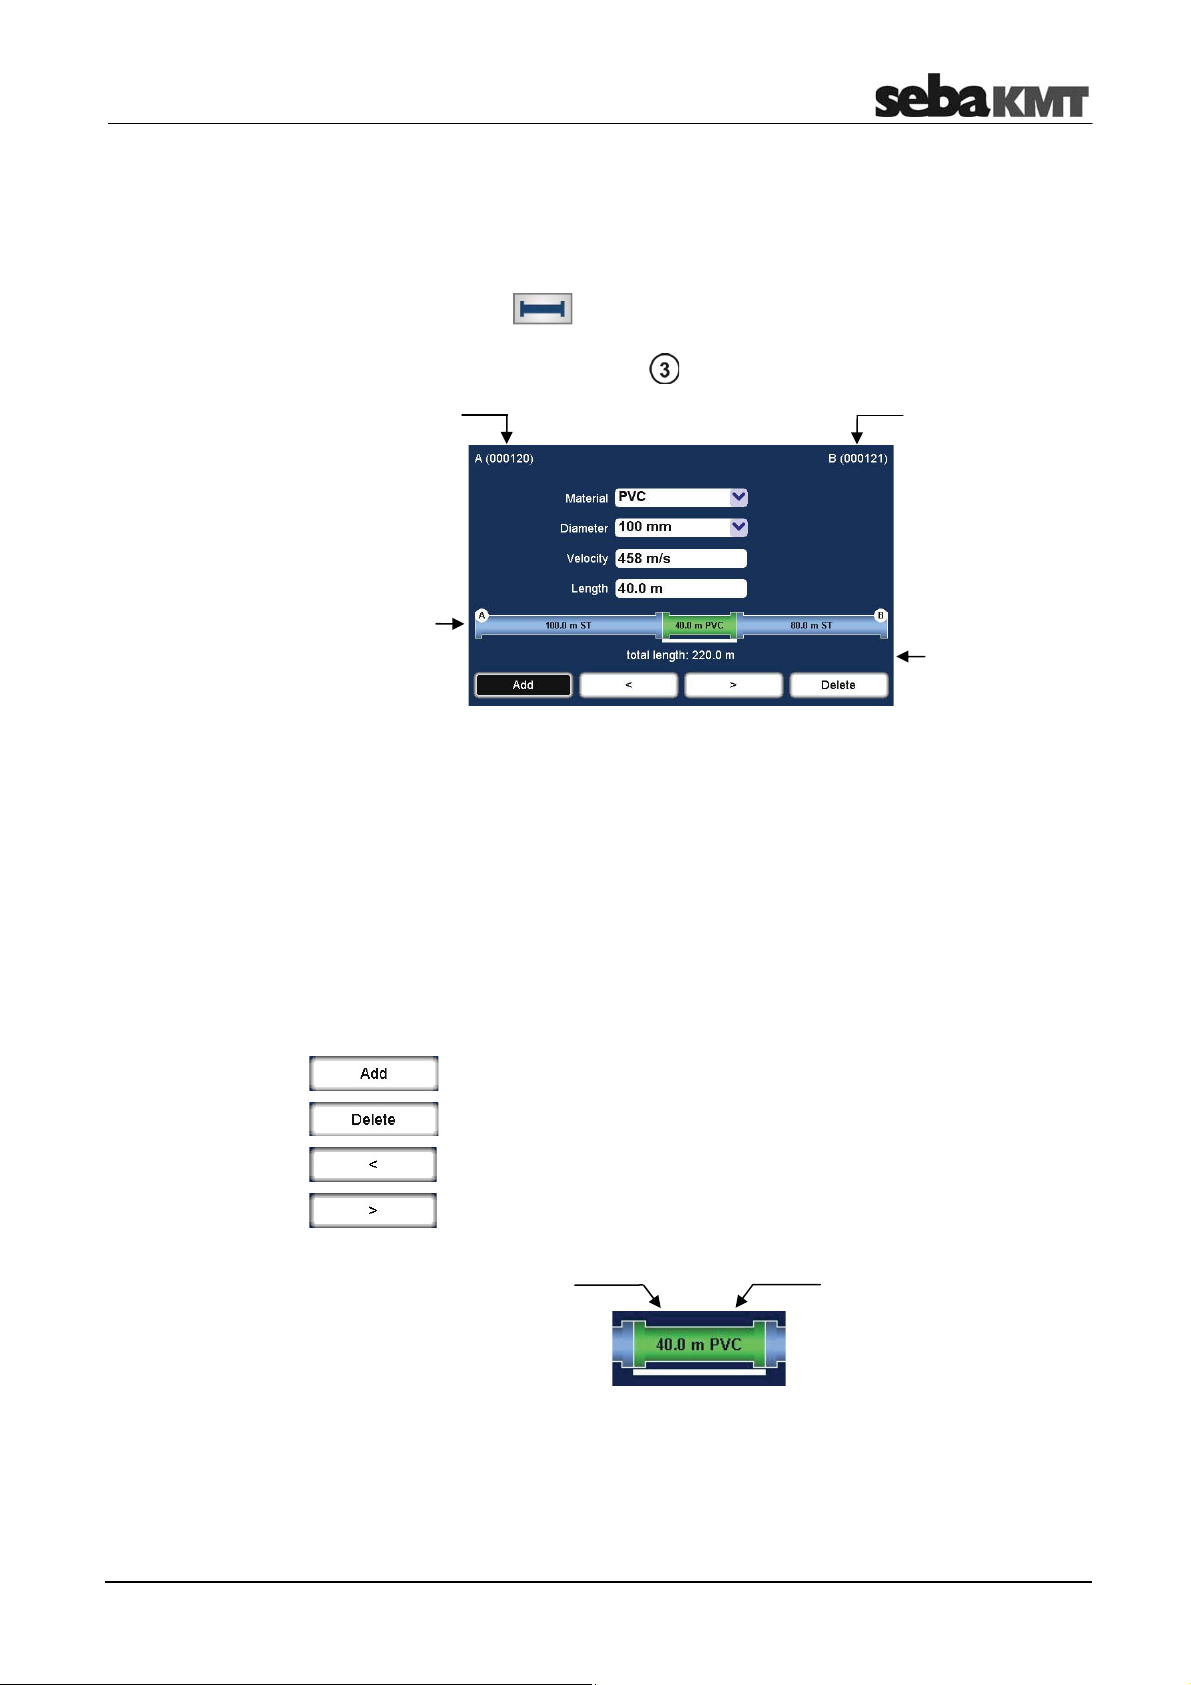
2.2 Pipe data menu
In the Pipe data menu the properties of the pipe can be specified.
The menu can be opened by:
•
tapping the button in the main menu
•
tapping the button between the two diagrams in the Correlation menu, representing
the pipe (see next section: button )
Drop down lists
Input fields
ID of the sensor
at the first
measuring point
Visual
illustration of
eline
the
Material
Diameter
Velocity
Length
ID of the sensor
at the second
measuring point
Totallength of
the
the measuring
points
... Select the pipe section's material.
... Select the pipe section's diameter.
... Input field for the pipe section's sound velocity.
The displayed value automatically adjusts to the selected pipe
material. The value can be entered manually when needed as well. To
do so, tap the field. A numeric keypad opens.
... Input field for the pipe section's length.
Tap the field. A numeric keypad opens.
e between
Buttons
Use these buttons to divide the pipe line displayed in up to 12 sections.
Use these buttons to move from one pipe section to the next.
Len
ths of the
pipe section
Pipe section
material
The selected pipe section is "highlighted" with a white bar. The pipe parameters in the
four input fields refer to this section.
13
Page 14

Frequently used menus
14
Page 15
Frequently used menus
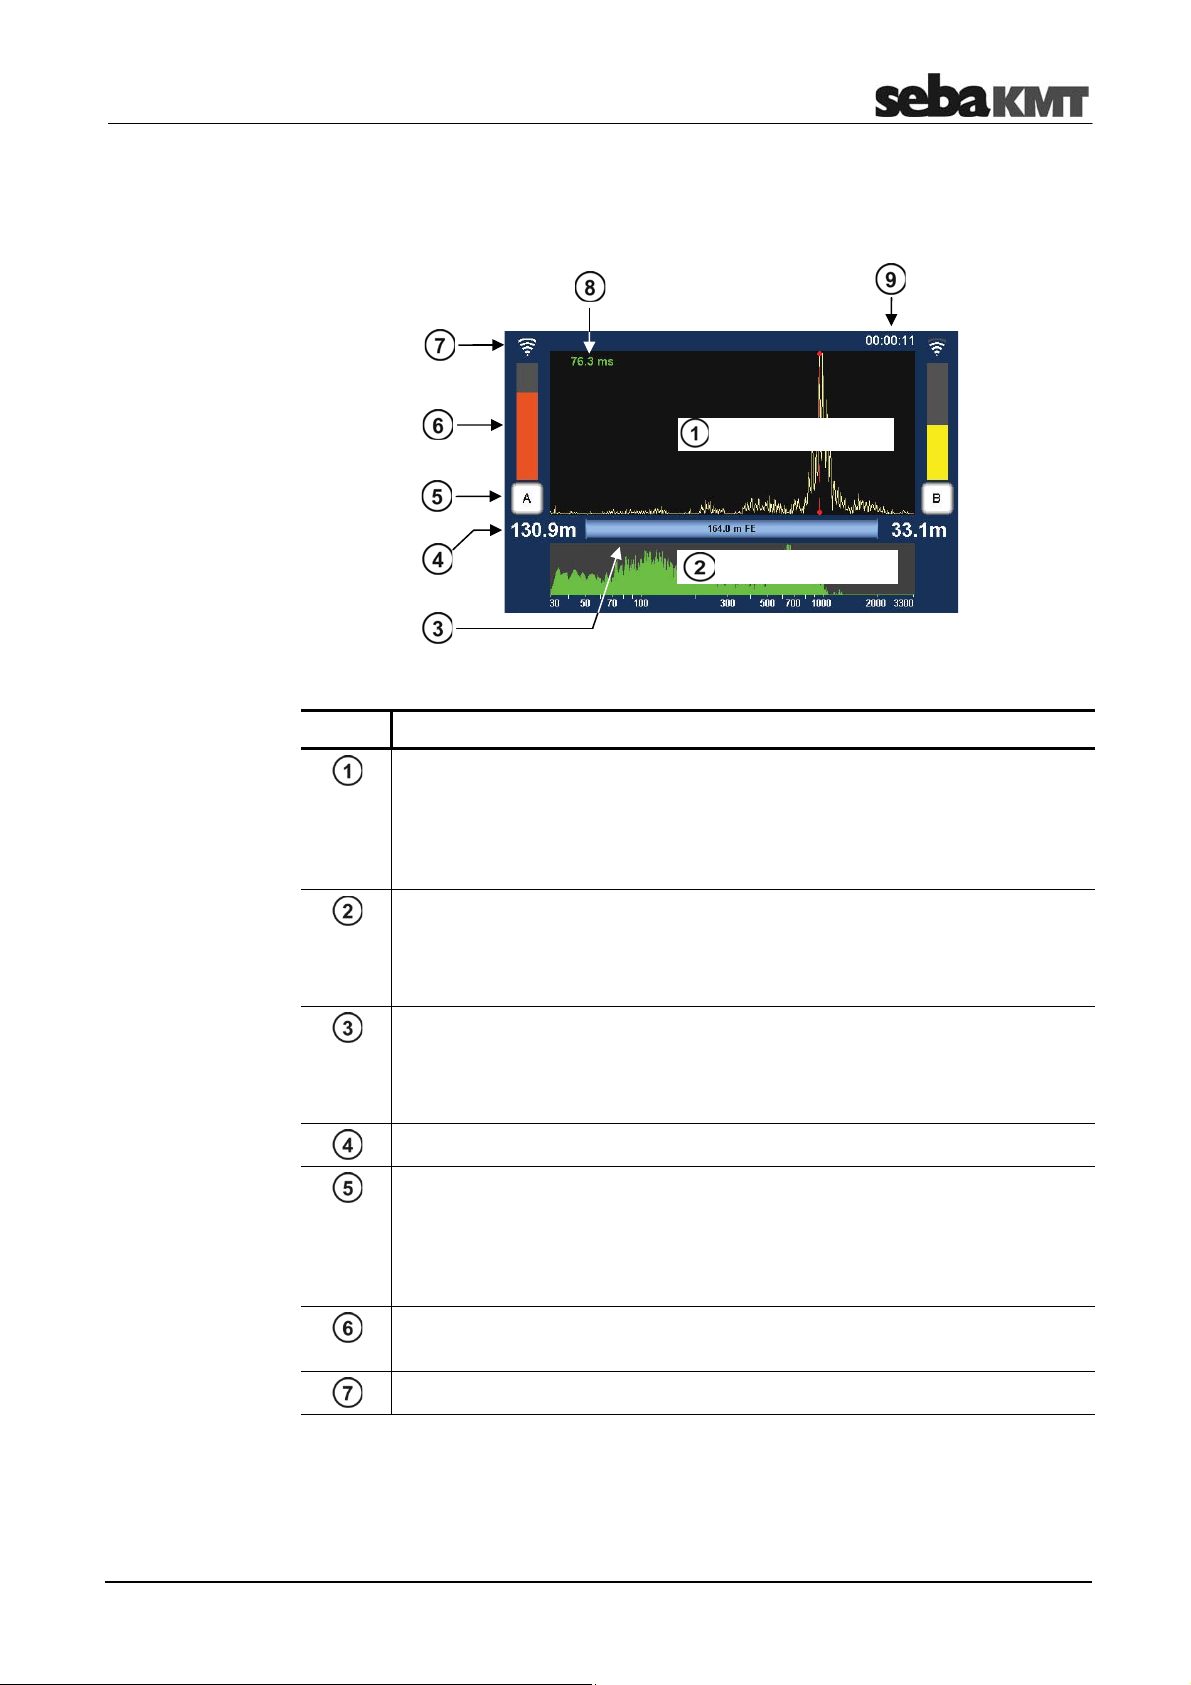
2.3 Correlation menu
After starting a correlation the result is displayed in the following view:
Correlation curve
Coherence curve
Element Description
Correlation curve
Result from comparing the recordings of the two sensors with regard to the
delay time of the signals.
Tap to open the Correlation analysis menu which provides a number of
analysis tools.
Coherence curve
Result from comparing the recordings of the two sensors with regard to the
frequency range of the recordings.
Tap to open the frequency filter settings menu.
Pipeline between A and B
The graphic illustrates the pipeline between the measuring points A and B
with all its sections.
Tap to open the Pipe data menu.
Distance from the measuring point to the leak
Measuring point A / B
Indicates whether the Power transmitter A or B is installed at this measuring
point.
Tap the button to open the Audio menu which can be used to listen to the leak
noise.
Noise level at the measuring point
The height of the bar reflects the noise level at the measuring point.
Quality of the radio link between transmitter and Correlator
15
(continued on next page)
Page 16

Frequently used menus
Element Description
Lag value
Indicates the delay of the leak noise between the two sensors. The color of
the numbers shows how reliable the result of this correlation is:
green
yellow
red
negat. sign
posit. sign
Term of the correlation
... "good" correlation, reliable result
... correlation is not optimal
... "bad" correlation; no leak or unreliable result
... The leak is on the left from the center of the line.
... The leak is on the right from the center of the line.
Specifies how long the displayed correlation is already running.
Any interruption resets the counter to 00:00:00.
16
Page 17
Frequently used menus
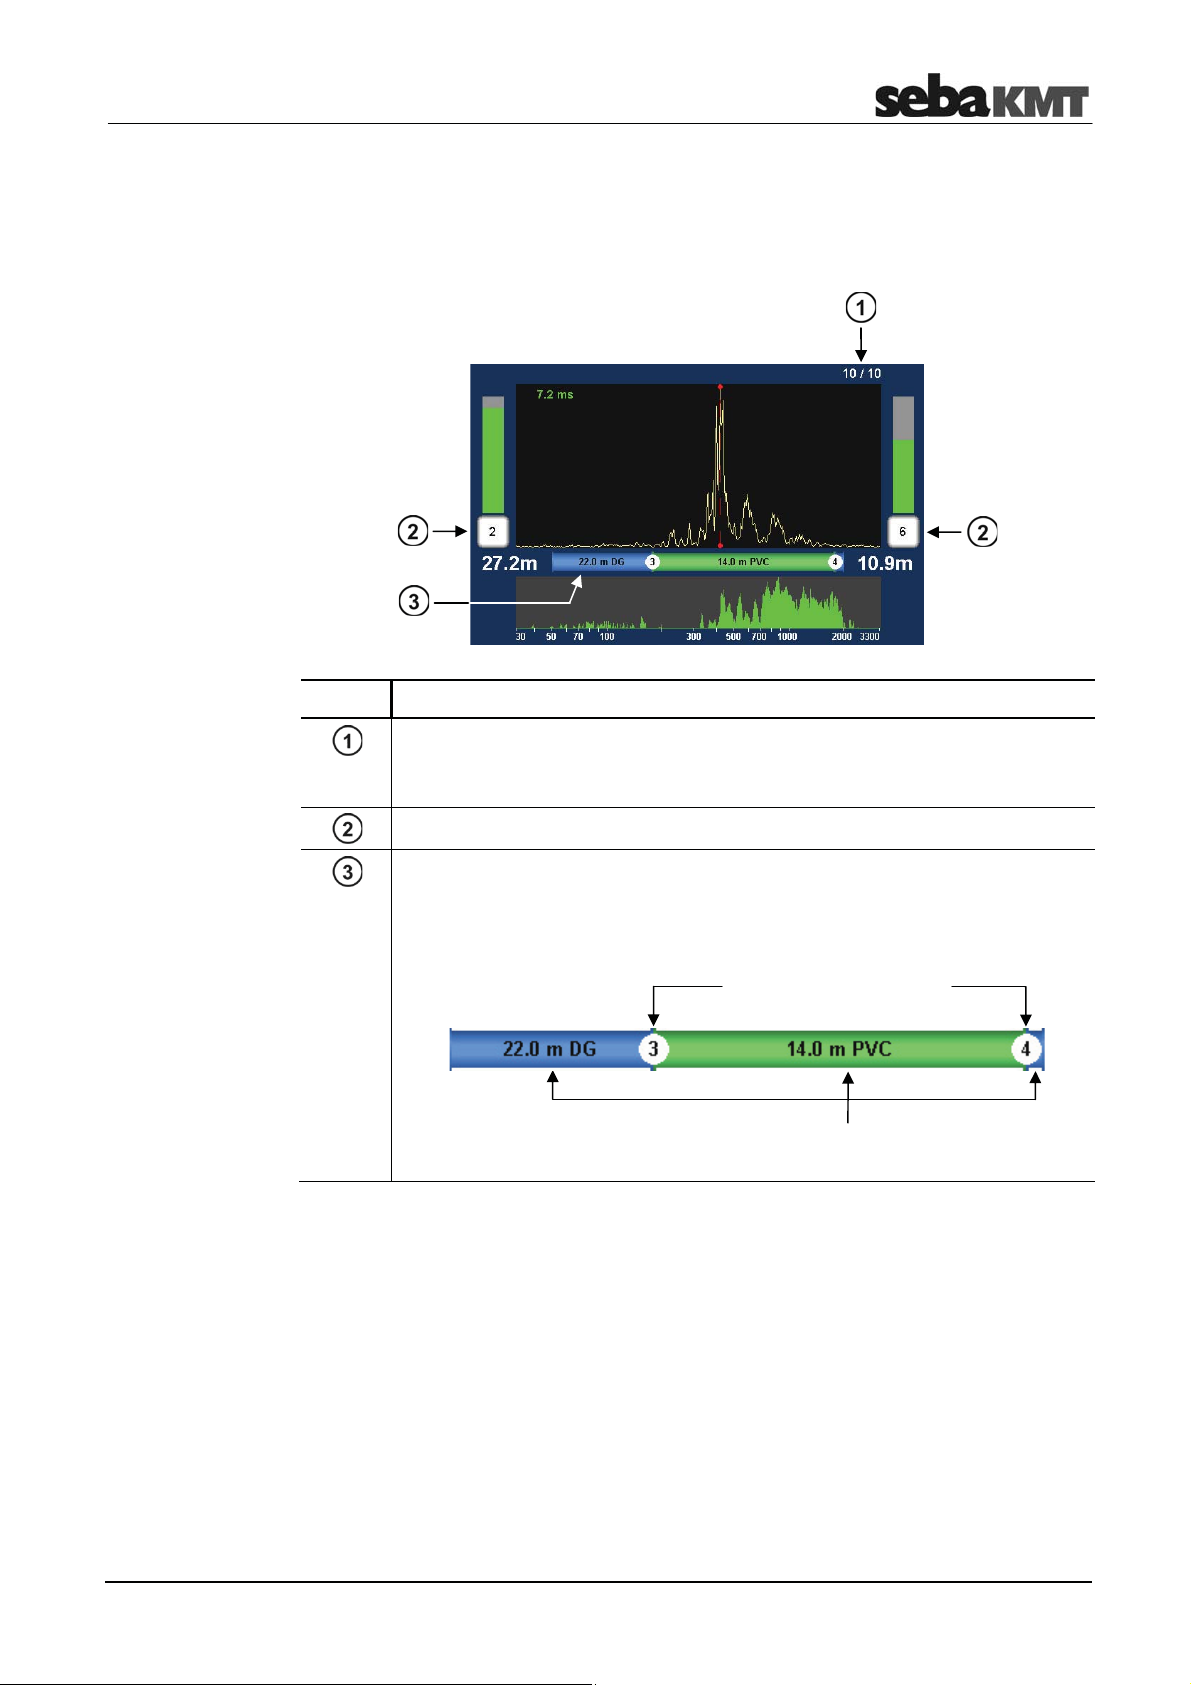
2.4 Correlation menu (Offline correlation)
In Offline measurement mode with Multi sensors, the Correlation menu differs in the
following aspects from the menu in Online measurement mode.
Element Description
Number of correlated audio blocks
The displayed curve is the result of an averaging from up to 10 single
correlations.
Number of the sensor at the measuring point
Pipeline between the measuring points
The graphic illustrates the pipeline between the measuring points.
Tap to open the Pipe data menu.
Installation points of
sensors No.3 and 4
Pipeline sections
17
Page 18

Frequently used menus
18
Page 19
Frequently used menus
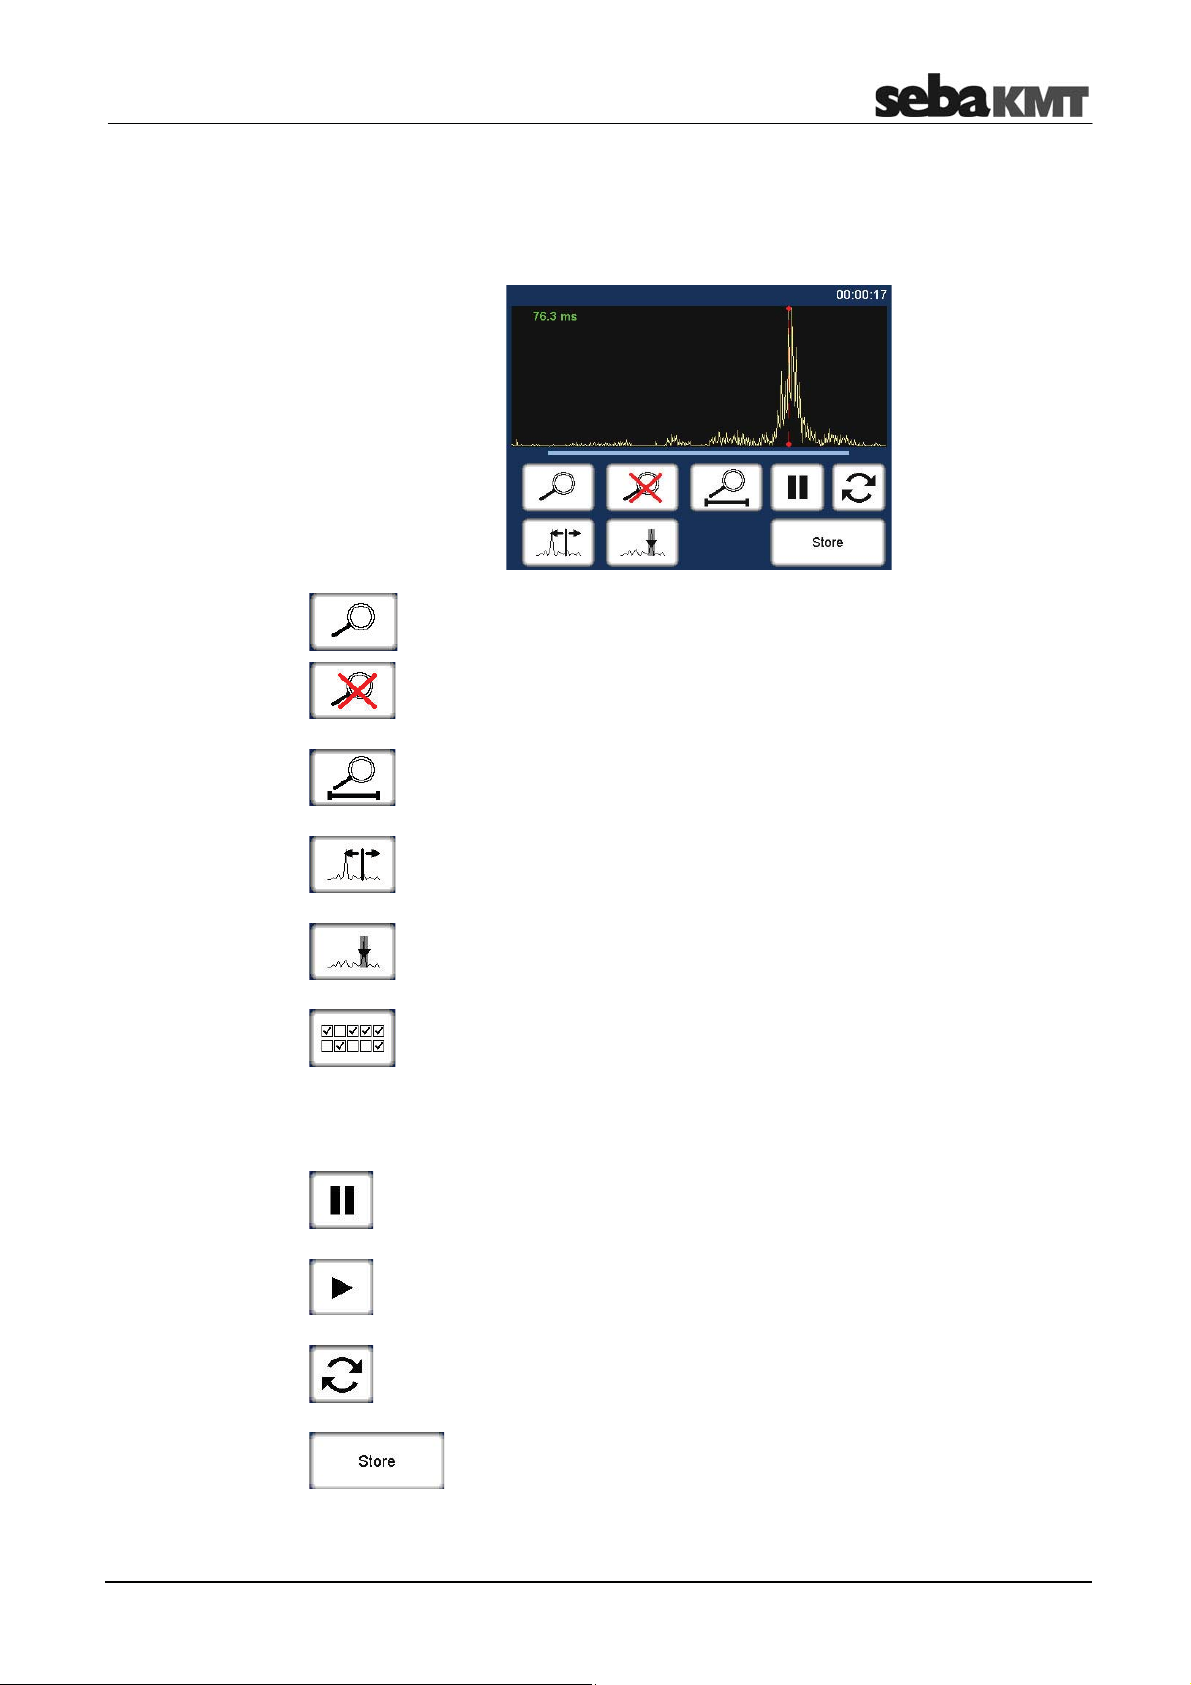
2.5 Correlation analysis menu
Tapping the Correlation curve always opens the following menu. This provides tools
for analyzing the correlation.
Zoom … to magnify a section of the curve
Tap the button, then mark the area to be magnified in the diagram.
Zoom-Reset … to reset the curve to its initial state
Magnification and suppression are abolished. The entire correlation curve
is displayed.
Zoom opt. ...magnifies length of the pipeline
Exactly the part of the correlation curve is shown, which refers to the pipe
between the two measuring points.
Move cursor … to read the lag value or the distance to the leak at any
point of the curve
Tap the button, then move the vertical red line in the diagram.
Suppress … to hide a section of the curve
Tap the button, then mark the area to be suppressed in the diagram,
i.e. tap and draw out the required range.
Suppress individual audio blocks (only Offline correlation)
Opens a menu showing the 10 single correlations of this pair of sensors.
"Bad" single-correlations can be 'deactivated' and, by this means,
excluded from the total-correlation.
Tap the buttons to remove/set the checkmark. Use the arrow button to
return back to the correlation analysis menu.
Pause
Interrupts the current correlation.
Continue
Continues the interrupted correlation, but does not reset the averaging
interval.
Refresh
Resets the averaging interval and restarts the correlation.
Store
Opens the Correlation management menu to store the displayed
correlation data in the Correlator's data base.
19
Page 20

Frequently used menus
20
Page 21
Frequently used menus
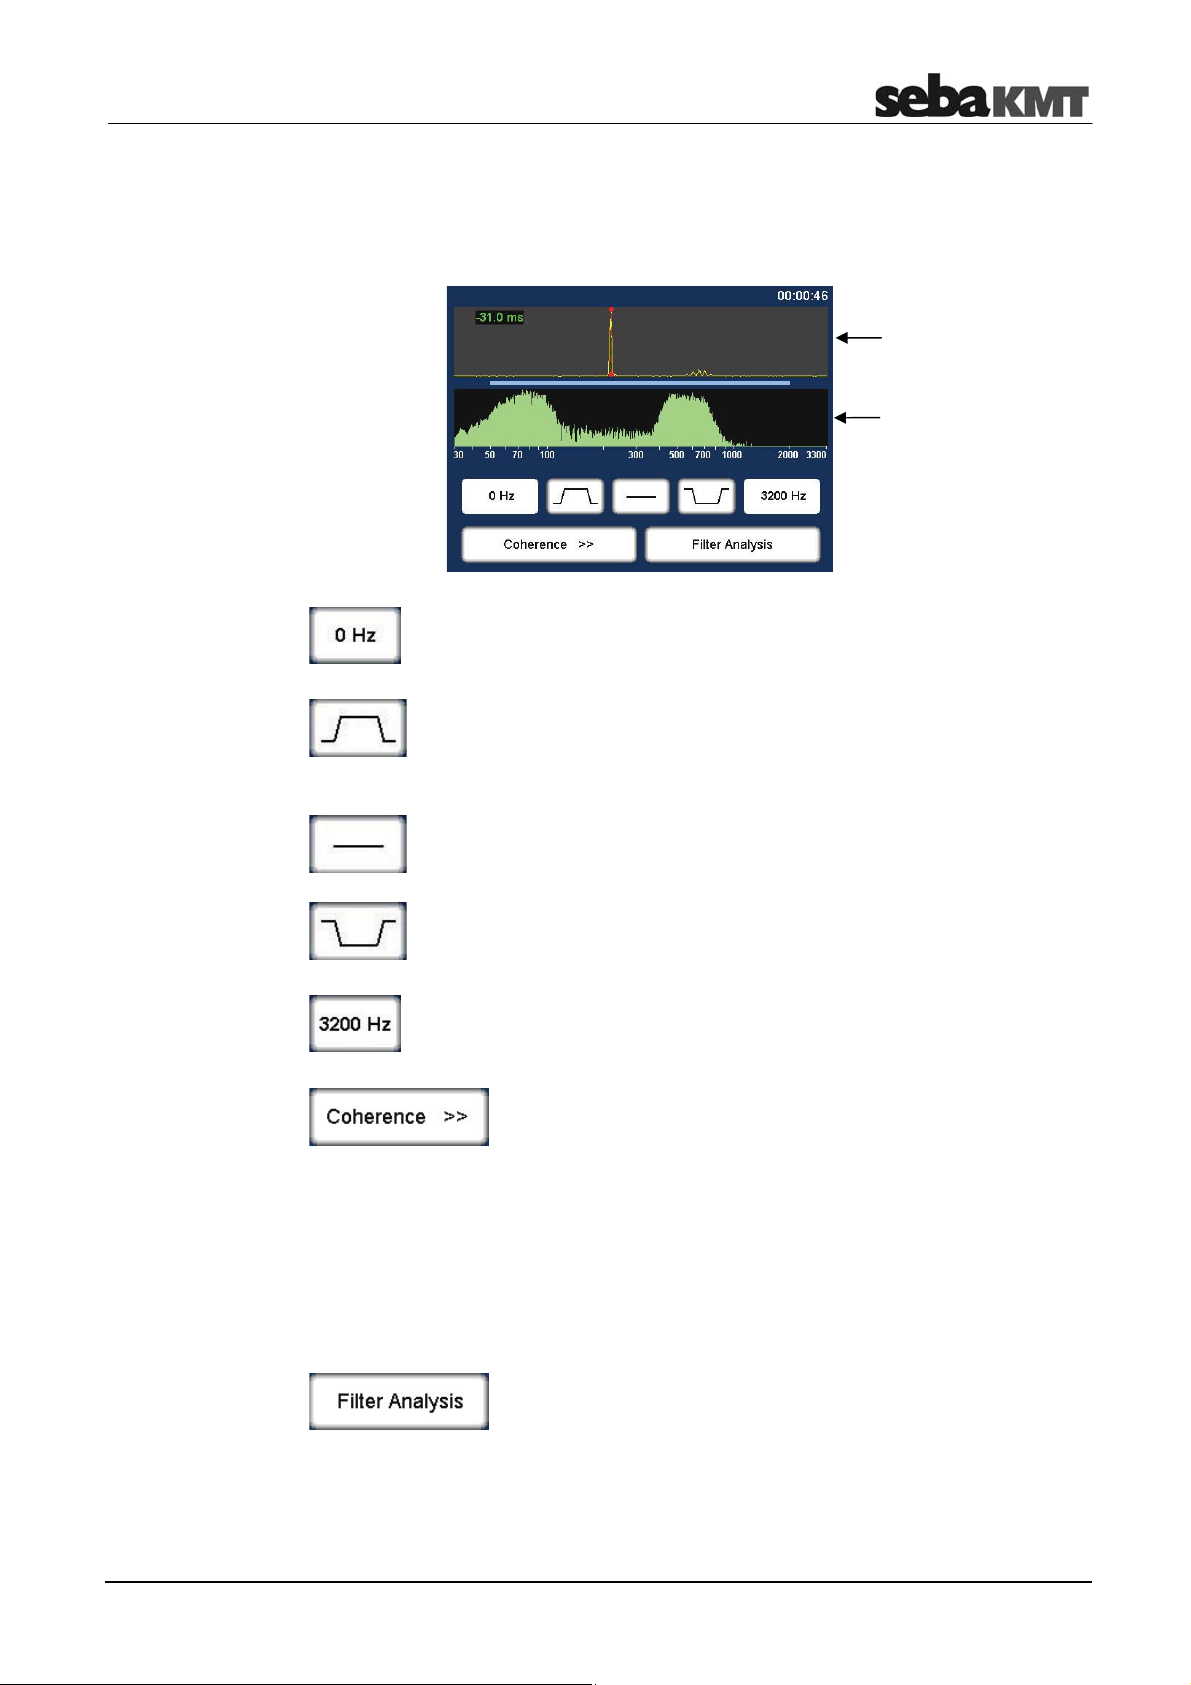
2.6 Frequency analysis menu
Tapping the Coherence curve always opens the following menu. This provides tools for
analyzing the frequency range.
Correlation
curve
Coherence
curve
Lower frequency limit
Shows the lower limit of the frequency range.
Tap the button to change the value.
Bandpass … to isolate a frequency range
Tap button. Then mark the required range in the frequency diagram.
The correlation is updated. The frequencies outside the selected range
are suppressed.
Filter reset
Tap the button to reset the frequency filter settings to the initial state.
Bandstop … to suppress a frequency range
Tap button. Then mark the required range in the frequency diagram.
The correlation is updated. The selected frequency range is suppressed.
Upper frequency limit
Shows the upper limit of the frequency range.
Tap the button to change the value.
Frequency spectrum
Allows to change between the following frequency diagram
options:
Coherence ... Coherence of the recordings of both sensors.
Spectrum L ... Frequency spectrum of the sensor on the left.
Spectrum R ... Frequency spectrum of the sensor on the right.
Spectrum L+R ... Frequency spectra of both sensors.
•
Orange curve … Sensor A
•
Yellow curve … Sensor B
Automatic search for filter
Provides 10 possible filter settings for selection
21
Page 22

Frequently used menus
22
Page 23
Frequently used menus
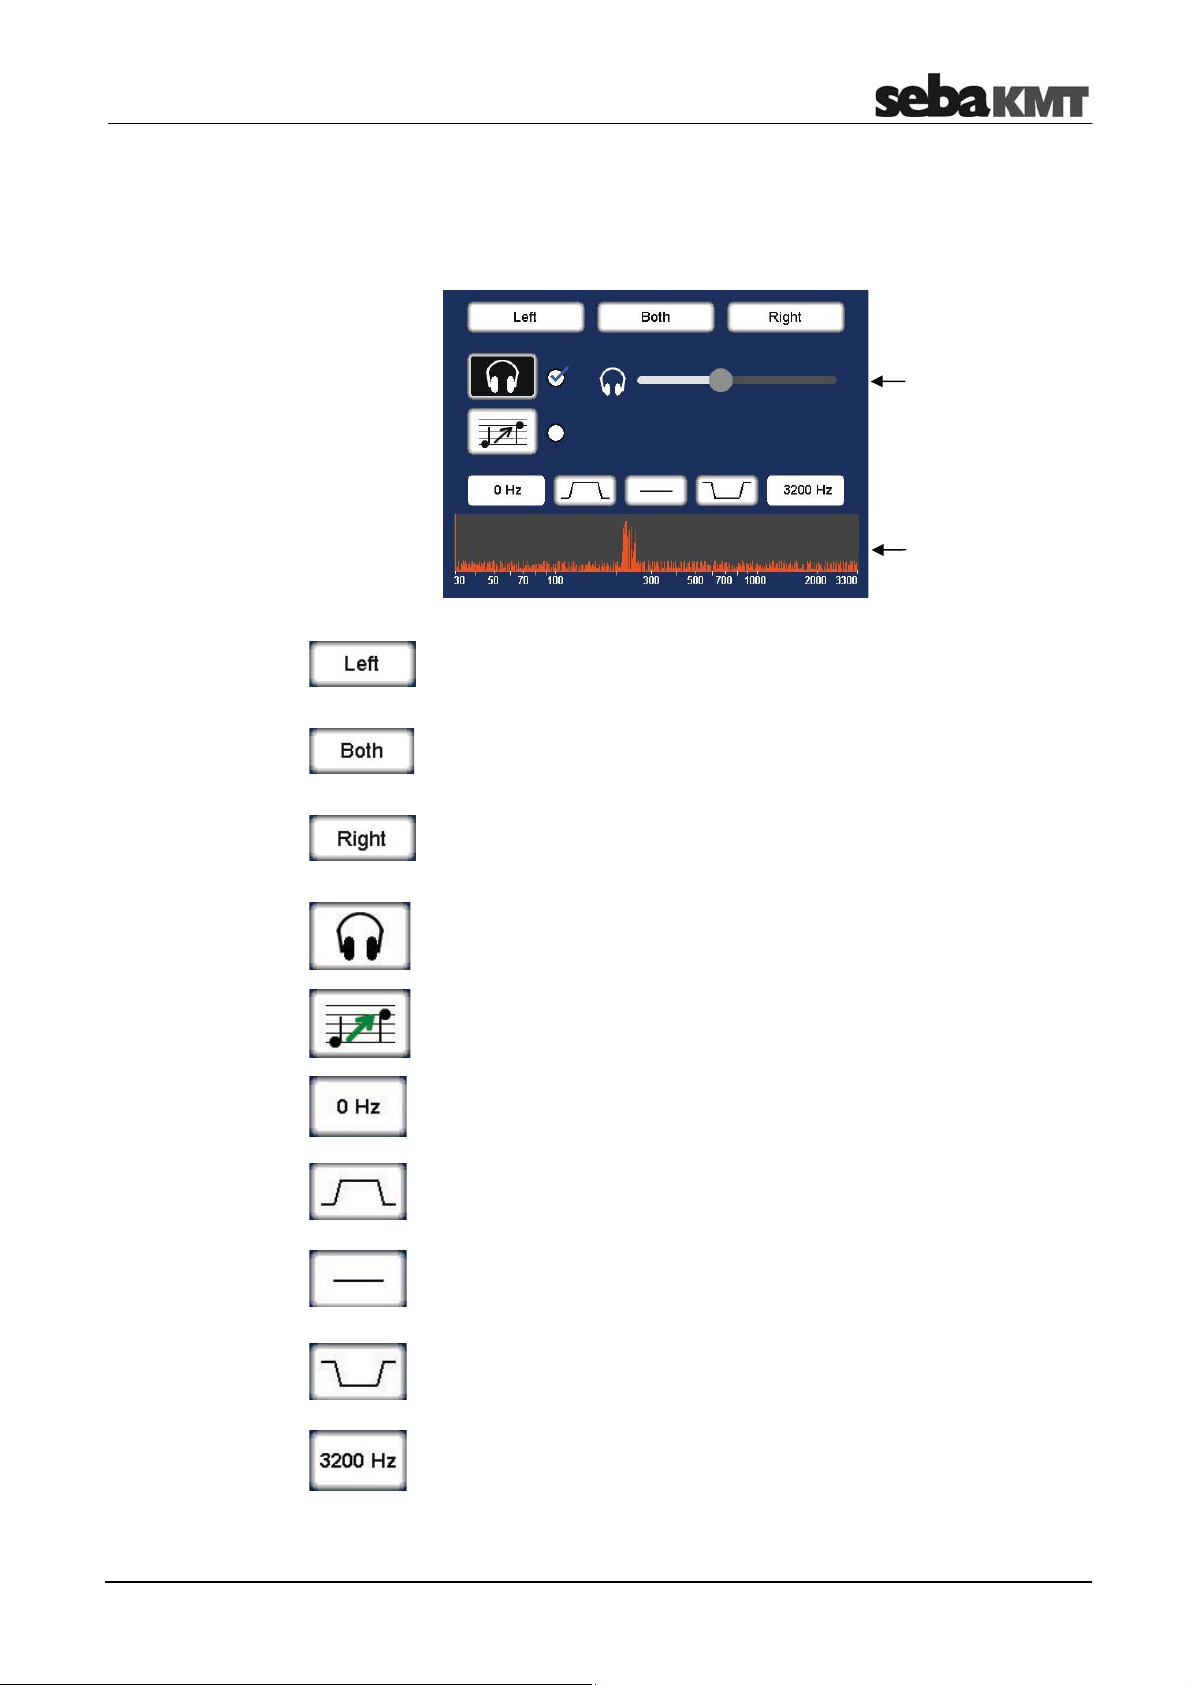
2.7 Audio menu
Tapping the buttons A / B / Sensor number in the Correlation menu opens the Audio
menu. It is used to listen to the leak noise via the supplied headphones.
Headphone
volume
(slide control)
Frequency
curve
Listen only to the left sensor
Only the noise recorded by the sensor on the left is reproduced.
Listen to both sensors
The combined noise of both sensors is reproduced.
Listen only to the right sensor
Only the noise recorded by the sensor on the right is reproduced.
Headphones ON / OFF
Button to enable/disable the connected headphones
Pitching function ON / OFF
This function lifts very low frequencies artificially up to a higher
frequency range to make them more audible to the user.
Audio filter: Lower limit
Shows the lower limit of the frequency range.
Tap the button to change the value.
Audio filter: Bandpass
Specify the frequency range to be reproduced. Frequencies outside this
range are suppressed.
Audio filter: Reset
Tap the button to reset the audio filter settings to the initial state.
Audio filter: Bandstop
Specify the frequency range to be suppressed, i.e.frequencies in this
range are suppressed.
Audio filter: Upper limit
Shows the upper limit of the frequency range.
Tap the button to change the value.
23
Page 24

Frequently used menus
24
Page 25
Frequently used menus
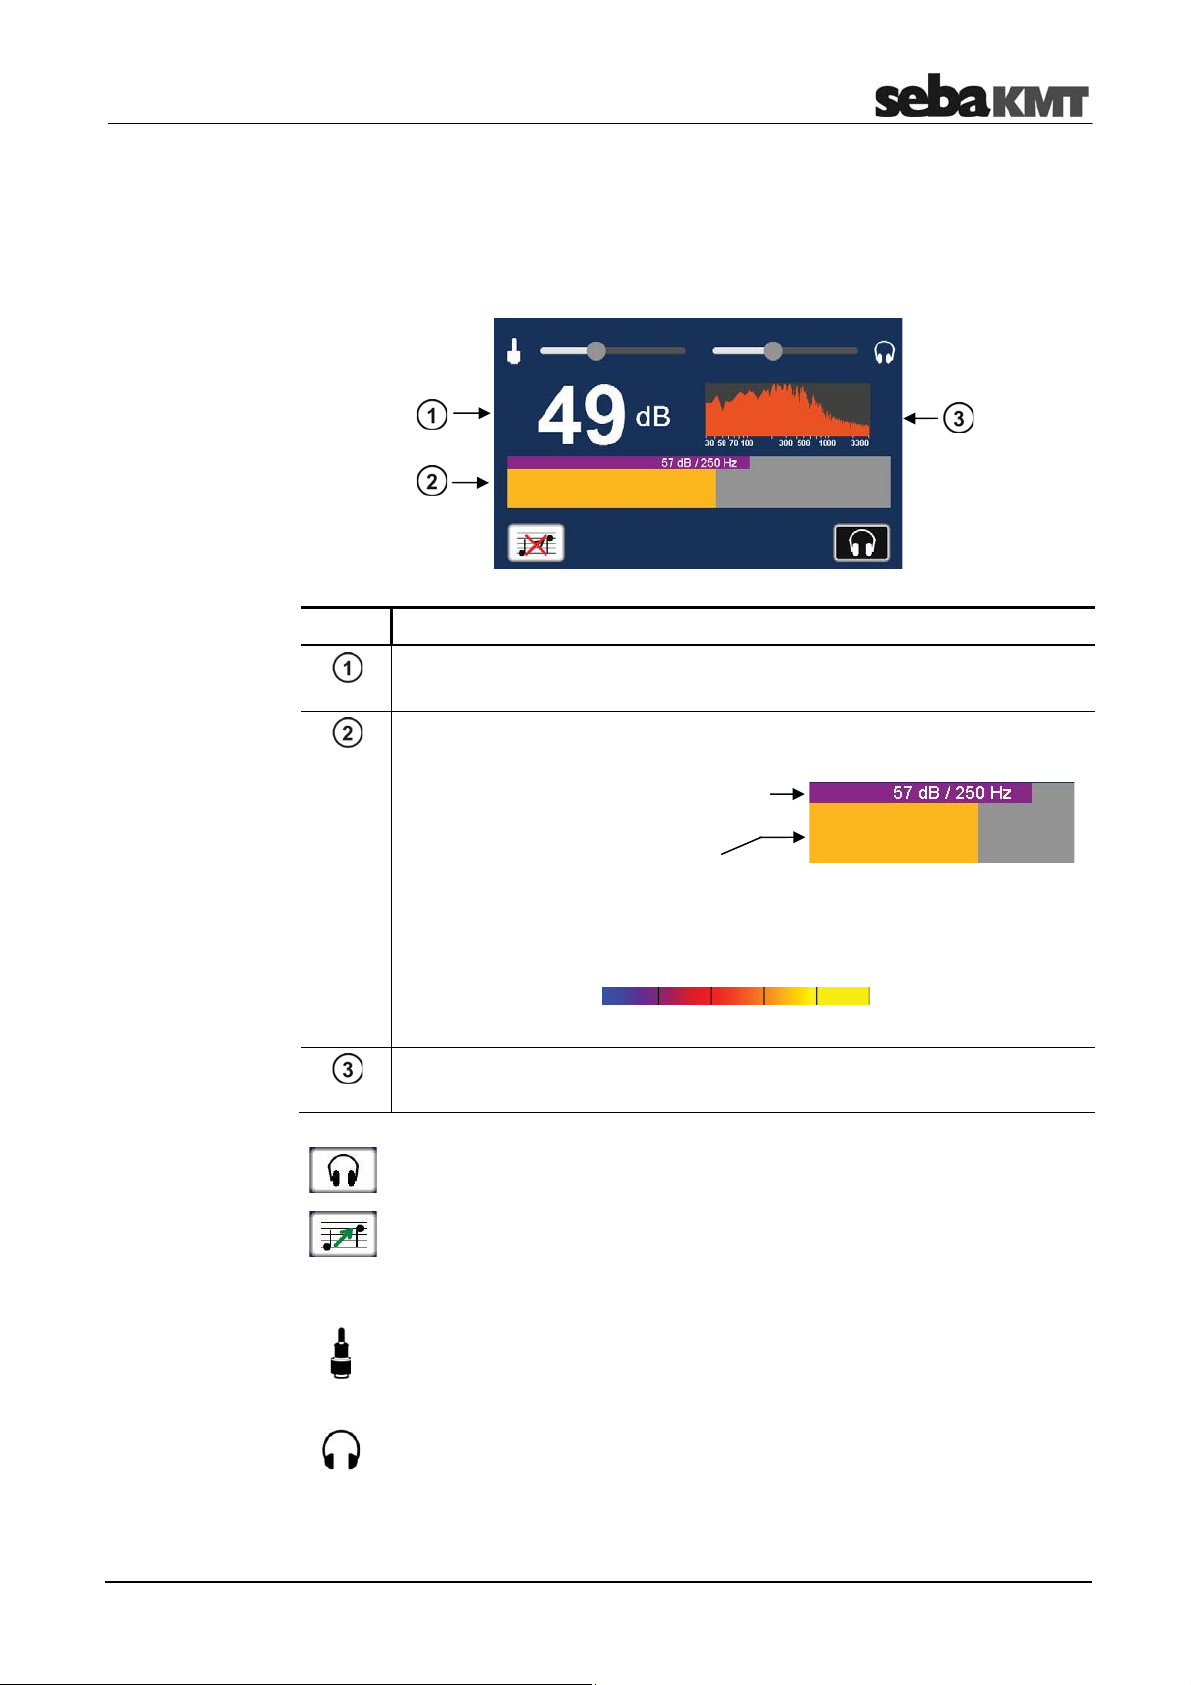
2.8 Audio menu (when ground microphone is connected)
A ground microphone can be connected to the Correlator. When you open the
Pinpointing function, at first this audio menu appears. It is used to listen to the leak noise
via the supplied headphones.
Indicators
Buttons
Element Description
Minimum value
lowest noise level of the measurement as a numeric value in dB
Bar graph display
Narrow bar: Instantaneous value
(currently measured level and frequency)
Broad bar: Minimum value
(lowest level and frequency of measurement)
The bar's height represents the noise level.
The bar's color illustrates the frequency of the noise.
blue yellow
0 Hz 3300 Hz
Frequency spectrum
Tap to open the menu for adjusting the frequency filter.
Headphones ON / OFF
Button to enable/disable the connected headphones
Slide controls
Pitching function ON / OFF
This function lifts very low frequencies artificially up to a higher frequency
range to make them more audible to the user.
Microphone gain
slide to the left ... reduces the gain
slide to the right ... increases the gain
Headphone volume
slide to the left ... lower
slide to the right ... louder
25
Page 26

Frequently used menus
26
Page 27

Technical description
3 Technical description
3.1 Function
The Correlux C-3 is a digital Correlator to locate leaks in drinking water pipes.
Pressurized water at the leak location creates a noise which travels out in all directions
of the pipe. This noise is recorded, amplified and sent wirelessly to the Correlator by two
sensors (piezo microphone, hydrophone) which are attached to the pipe (e.g. valve,
hydrants).
The Correlux C-3 compares both signals (correlation) and calculates the exact distance
to the leakage on the basis of the delay time of the signals, the sensor spacing and the
sound velocity in the pipe.
The Correlux C-3 is suitable for both immediate measurement ("Online measurement")
as well as time-delayed measurement ("Offline measurement").
Online measurement
In a so-called Online measurement, the noise recording and the correlation of the data
take place at the same time.
Step Description
1
Installing the Power transmitters "A" and "B" at two measuring points.
2
Noise recording, at the same time data transfer and live data correlation on the
Correlator.
Offline measurement
In a so-called Offline measurement, the correlation of the measured data takes place
only after the noise recording has been terminated.
Step Description
1
Programming the sensors (Multi sensors and Power transmitters)
2
Installing the Power transmitters and/or Multi sensors at up to 8 measuring points.
3
Noise recording, immediately or at a preset time (e.g. at night).
4
Collecting the sensors.
5
Reading and analyzing the measured data using the Correlator.
Pinpointing
To determine the exact location of the leak after the correlation, a pinpoint search can
be performed using the Multi sensors or the ground microphone connected to the
Correlator.
27
Page 28
Technical description
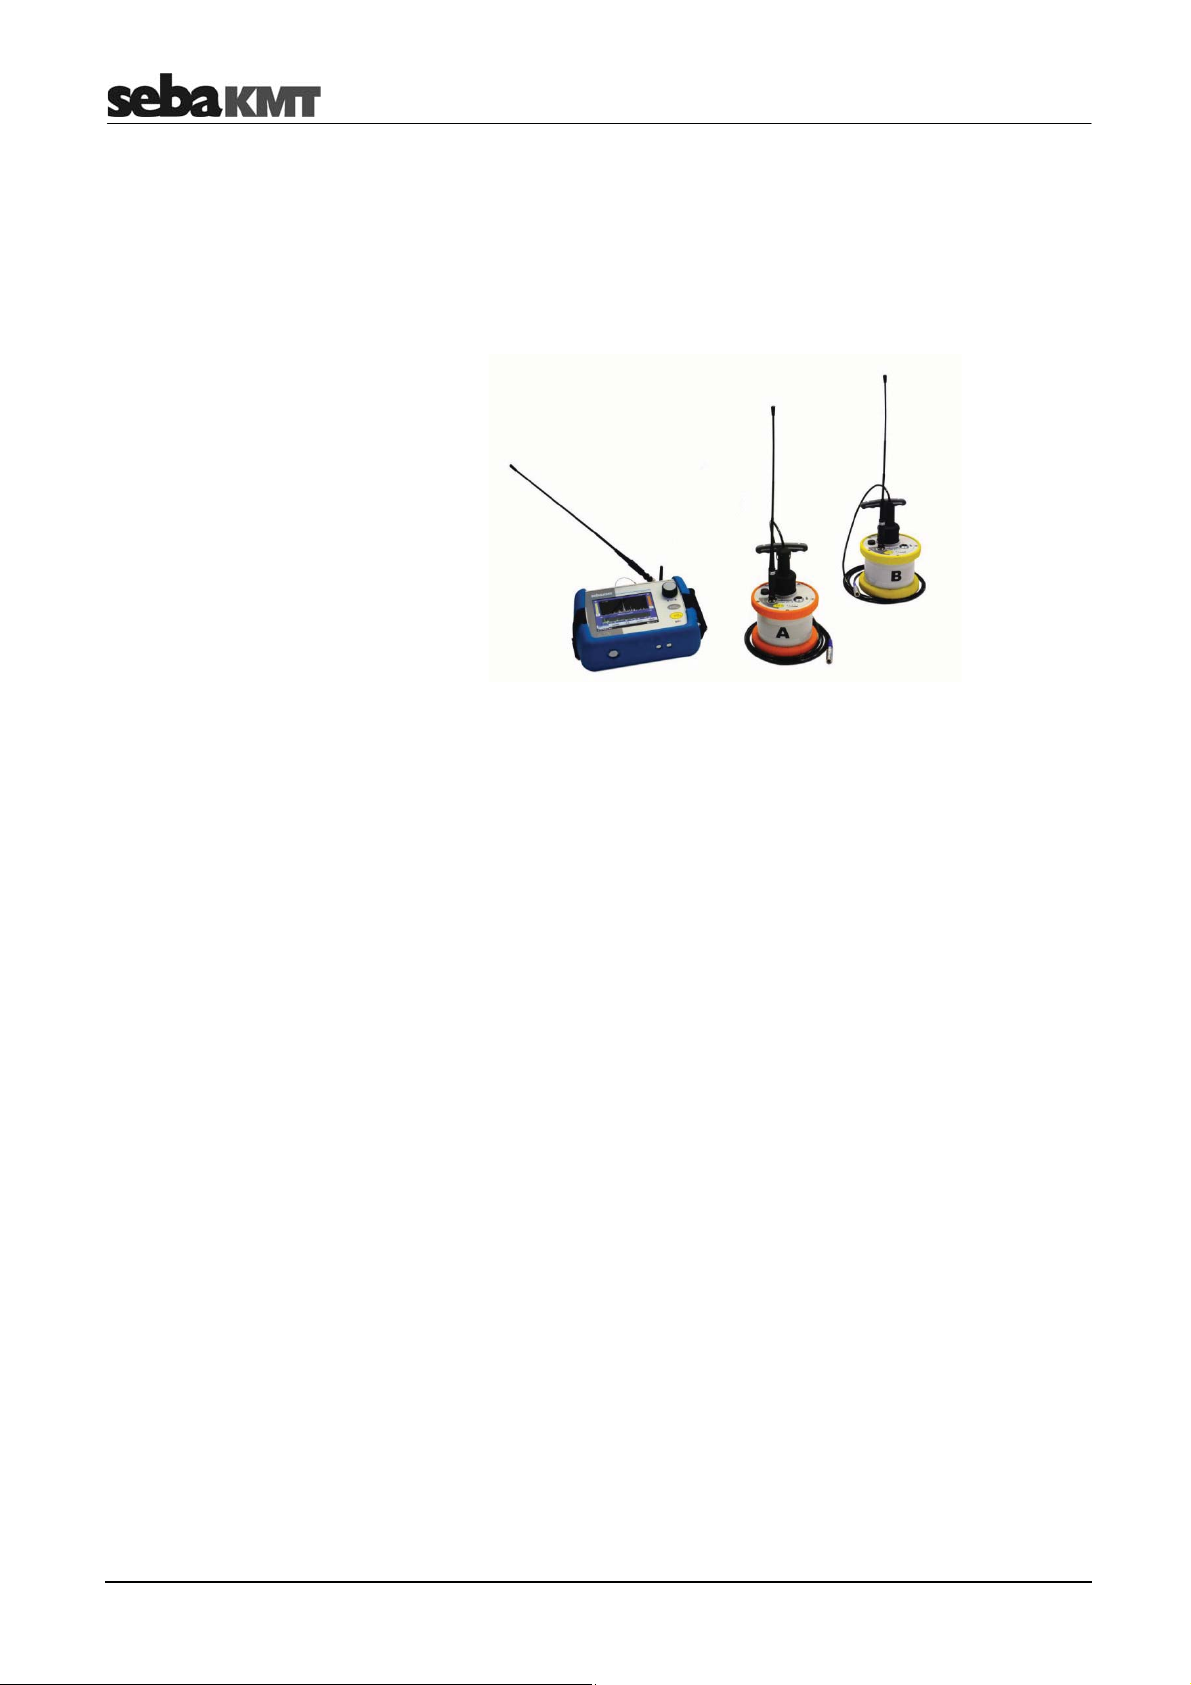
3.2 Features of the set
The Correlux C-3 set mainly comprises the following components:
•
Correlator
•
2 Power transmitters with microphone (Transmitter A / Transmitter B)
for recording the leak noise at two measuring points and sending the recorded data
to the Correlator
The set can be extended by the following components:
•
up to 8 multi sensors
for recording the leak noise of up to 8 measuring points at the same time followed
by an "Offline-correlation"
•
hydrophones
for recording the leak noise directly at the water column
•
a ground microphone
for pinpointing the leak after correlation
The Transport case offers space for the Correlator, 2 Power transmitters and
3 Multi sensors. The case is not only for storage and transportation purposes, but also
functions as a charging station for the devices.
Using the CorreluxView analysis software measurement data can be displayed and
processed on the computer. The software can be downloaded from the SebaKMT
Internet page:
www.sebakmt.com >> Information > User area > Software > Leak localization
28
Page 29
Technical description
3.3 Communication of the components
The components of the system communicate with each other in the following ways:
Participating devices Communication channel
Correlator ļ Power transmitter Short range radio (digital or analogue)
Correlator ļ Multi sensors Short range radio (digital)
Correlator ļ Computer USB cable
Correlator ļ Ground microphone Connection cable
3.4 Power supply
The Correlator, the Power transmitters and the Multi sensors come with internal
rechargeable Li-Ion batteries.
The storage places of the individual devices in the transport case function as charging
stations. As soon as a device is placed in/on its station in the case, the device is
automatically charged, provided the case is connected to the mains.
The case can be connected via the connection socket and the supplied connection
cable to either a 12 V connector of a vehicle or to the mains
NOTE
When connected to the electrical system of a car, the transport case is
powered by the vehicle's battery, even while the vehicle is not in
operation. This could result in the complete discharge of the vehicle
battery.
When you park the car, disconnect the Correlux transport case from the
vehicle power supply.
NOTE
Use inductive charging units inside for COR PT-3 and COR MS-3 only!
NOTE
Close cover of transport case if it is raining!
You can find more information in the chapters which describe the individual devices.
29
Page 30

Technical description
3.5 Scope of delivery
Standard accessory
Additional accessory
The basic set comprises the following devices and accessories:
Accessory Description Art.no.
COR C-3 Correlator 1006550
COR PT-3A Power transmitter A 1004779
COR PT-3B Power transmitter B 1004780
PAM CORR-2 2 x active universal microphone for PT-3 820019615
CPK 3-B Case for COR C-3 (Basis) 2007235
LG C-3 Charging unit for CPK 3/CMK 3 1006646
LK 13 Car charging adaptor, 3.5m 810000006
KR 22-5 Stereo headphones 810002087
VST T-1 2 x extension rod for PAM CORR-2 810000103
VK 77 Connection cable set Sebalog D (USB) 820012451
2 x nylon cord 3mm blue, 2m 304035025
CSW CorreluxView C-3 PC software 1006584
The following devices and accessories are available to extend the basic set.
PAM W-2
ground microphone set
Accessory Description Art.no.
COR MS-3 Multi sensor 1004815
CMK 3-8-MS Case for 8 Multi sensors COR MS-3 2005301
LOG TP Trivet adaptor for Sebalog Corr 128309877
LOG MWA Magnetic angled adaptor 118303355
Mounting set for COR MWA
(Screws for angled adapters)
Set of labels COR C-3 (1 - 8) 2007321
The PAM W-2 ground microphone set is available to extend the basic set. It consists of
the following parts:
Part Description Art.no.
PAM W-2 Windproof ground microphone 820013157
PAM W-2 D Trivet adapter for PAM W-2 820013234
VK 65 Connection cable 820000936
Carrying rod 210100071
VK 100 Connection cable 118302742
2007393
Article number of the complete set: 128310702
30
Page 31

Technical description
3.6 Technical data
Correlux C-3 is specified by the following parameters:
Correlator
COR C-3
Parameter Value
Indicators 5,7'' VGA color display
640 x 480 pixels
Entry Touch display,
Rotary encoder with enter function
Power supply Internal rechargeable Li-Ion battery,
12 V DC charging pins
Operating time min. 16 h
Power transmitter
COR PT-3A/B
PC interface
Connections
Dimensions
Weight
Degree of protection
Parameter Value
Sensor Piezo sensor with active amplifier (standard) /
Indicators I/O LED (device On/Off)
Operation On/Off pushbutton
Power supply Internal rechargeable Li-Ion battery,
USB
Sensor (microphone/hydrophone),
12 V DC / headphones (combined)
USB / GPS (combined)
External antenna 1 (digital radio)
External antenna 2 (analogue radio)
250 x 190 x 100 mm
1.9 kg
IP 65
hydrophone (optional)
Radio LED (radio module On/Off))
Row of LEDs (battery status or measured noise level)
inductive charging
Operating time min. 12 h
Connections
Dimensions (without
handle)
Weight (without sensor)
Degree of protection
Sensor (microphone/hydrophone),
Radio antenna
Ø 125 x 111 mm
0.9 kg
IP 65
31
Page 32

Technical description
Sensor
PAM CORR-2
Ground microphone
PAM W-2
Multi sensor
COR MS-3
Parameter Value
Type Piezo sensor with magnetic adaptor
(to be connected to Power transmitter or Correlator)
Active amplification yes
Dimensions Ø 38 x 78 mm
Weight 0.4 kg
Degree of protection IP 68
Parameter Value
Type Wind shielded piezo sensor
(to be connected to Correlator)
Dimensions Ø 185 x 165 mm
Weight 4 kg
Parameter Value
Sensor Integrated piezo sensor with active amplifier
Adapter Magnetic adaptor
Indicators Status LED
Operation On/Off magnetic switch
Power supply Internal rechargeable Li-Ion battery,
inductive charging
Operating time min. 16 h
Dimensions
Weight
Degree of protection
Ø 45 x 115 mm
0.4 kg
IP 68
32
Page 33

The Power transmitters
4 The Power transmitters
4.1 Function and Design
Each Power transmitter has an active amplifier for the microphone signal, a data
memory, a rechargeable Li-Ion battery, a digital radio module and an analogue radio
module with antenna inside.
The sensors have the following external characteristics:
Element Description
Microphone storage place
Sensor socket
for connecting the microphone / hydrophone
I/O pushbutton
short pressing ... switches the device on
long pressing ... Switches the device off
Antenna socket
Antenna socket for connecting the analogue radio antenna
Ventilation/venting membrane
33
Page 34

The Power transmitters
Indicator lights
The Power transmitters have the following lights (LEDs):
Element Description
LED bar
lit green ... represents the current battery level
lit red ... represents the noise level
I/O LED
lit green ... the transmitter is switched on
flashing ... the device is charging
not lit ... the transmitter is switched off
Radio LED
lit red ... the transmitter is in "Active" mode,
not lit ... the transmitter is in "Stand-by" mode,
noise measurement in progress,
measurement data is being sent to the Correlator
no measurement in progress,
no radio traffic
34
Page 35

The Power transmitters
4.2 Identification number (ID)
Each Power transmitter has its own six-digit identification number (short: ID). Using this
ID the device can be managed and clearly identified in the Correlator, computer and
within the SebaKMT-Cloud.
The ID is deduced from the last six digits of the device's serial number (short: SN). You
find the serial number on the nameplate of the device.
When entering an ID on the Correlator or computer, the preceding zero digits can be
omitted.
4.3 Power supply
Battery level
Charging
The Power transmitters are fitted with internal rechargeable Li-Ion batteries This can
power the device for approximately 12 hours.
In the Start menu of the Correlator two battery icons indicate the current battery status
of the Power transmitters.
On the Power transmitters, the current battery status is indicated by the LED bar
when it is green. If only one of five LEDs is lit, the device should be charged. Otherwise,
it switches itself off automatically.
Red light represents the recorded noise during the measurement and not the battery
status.
The Power transmitters are charged wirelessly in the transport case. The case must be
connected to a power supply. As soon as the Power transmitters are situated at their
storage places in the case, they are recharged inductively.
Charging takes approximately 12 hours. The I/O LED flashes when loading. The
LED bar indicates the progress of charging The I/O LED turns back to permanent
light as soon as the battery is full.
CAUTION
No objects must be put into empty charging stations.
Risk of fire!
The charging stations are for transport and charging of the devices only.
NOTE
Any repairs must be carried out by SebaKMT or an authorized service
partner.
Otherwise, the devices' resistance against water and dirt cannot be
guaranteed.
Do not open the device yourself. If you have problems with the battery,
please contact your SebaKMT service partner.
35
Page 36

The Power transmitters
4.4 Commissioning
Switching ON/OFF
Stand-by
4.5 Installation
To turn on, briefly press the I/O pushbutton . The I/O LED is lit green when the
device is turned on. To turn the device off, press the button until the LED goes out.
The microphone's storage place is fitted with a magnetic switch. As a result, the
Power transmitter "knows" whether the microphone is currently in use or not.
As long as the microphone rests in its storage place, the Power transmitter remains in
"Stand-by" mode. The internal analogue radio module stays off as no measuring data
needs to be transferred to the Correlator. This saves battery power.
As soon as the microphone is taken from the storage place, the Power transmitter
switches from "Stand-by" to "Active" mode. The radio module is activated. From now on,
the recorded data are directly sent to the Correlator. The row of LEDs switches from
green to red and represents the recorded noise level.
The sensors should be installed directly on the pipe but, however, you can also attach
them to valve rods or hydrants, for example, or any other position along the pipeline that
is easily accessible.
There must be the best possible contact between the sensor foot or the mounted
adapter (see below) and the pipe. If need be, clean the contact point thoroughly
(preferably with a wire brush).
In some situations it might be helpful to use one of the supplied magnetic angle
adapters.
36
Page 37

The Multi sensors
5 The Multi sensors
5.1 Design and function
Each Multi sensor has a highly sensitive piezo microphone with active amplifier, a data
memory, a rechargeable Li-Ion battery and a radio module with antenna inside.
The sensors have the following external characteristics:
Element Description
Status LED
flashes green ... Battery OK
flashes yellow ... Battery critical
flashes red ... Device needs to be re-charged
flashes rapidly ... Device is charging
no light ... Device is turned off
ON/OFF contact area I/O
Magnetic foot (detachable)
Type plate
Carrying ring (detachable)
5.2 Identification number (ID)
Each Multi sensor has its own six-digit identification number (short: ID). Using this ID the
device in the Correlator and the CorreluxView PC software can be managed and clearly
identified.
The ID is deduced from the last six digits of the device's serial number (short: SN). You
find the serial number on the nameplate of the device.
When entering an ID on the Correlator or computer, the preceding zero zero digits can
be omitted (see page 45).
37
Page 38

The Multi sensors
5.3 Power supply
Battery level
Charging
The Multi sensors are fitted with internal rechargeable Li-Ion batteries This can power
the device for at least 16 hours.
In the Start menu of the Correlator up to eight battery icons can be seen. They indicate
the current battery status of the registered Multi sensors in reach. To know the exact
battery state of a Multi sensor, read the unit's configurations menu (see page 111). In
the line battery status the battery level of the sensor is shown as a percentage.
When the battery level of a Multi sensor falls below a certain threshold, the indicator
light of the device will flash red. The device must be charged. Otherwise, it switches
itself off automatically.
To charge the Power transmitters place them in the transport case. The case must be
connected to a power supply. As soon as the sensors are situated at their storage
places in the case, they are recharged inductively.
Charging takes approximately 6 hours. The units' indicator lights are rapidly flashing
during the charging process. The indicator lights turn to permanent green light as soon
as the battery is full.
CAUTION
No objects must be put into empty charging stations.
Risk of fire!
The charging stations are for transport and charging of the devices only.
NOTE
Any repairs must be carried out by an authorized service partner.
Otherwise, the devices' resistance against water and dirt cannot be
guaranteed.
Do not open the Multi sensors yourself. If you have problems with the
battery, please contact your SebaKMT service partner.
5.4 Switching ON/OFF
The Multi sensors have an internal magnetic switch.
To turn a Multi sensor on, briefly hold a magnet (e.g. the foot of another Multi sensor) in
front of the sensor's I/O area . The device turns on. The indicator light flashes
3 times.
To turn the device off, hold a magnet in front of the I/O area for approximately
2 seconds. The indicator light will flash 2 times before it goes out.
38
Page 39

The Multi sensors
5.5 Installation
The Multi sensors should be installed directly on the pipe However, you can also attach
them to valve rods or hydrants, for example, or any other position along the pipeline that
is easily accessible. Due to their powerful magnet, the sensors can also be attached
horizontally.
There must be the best possible contact between the sensor foot or the mounted
adapter (see below) and the pipe. If need be, clean the contact point thoroughly
(preferably with a wire brush).
5.6 Angle adapter
In some situations, the Multi sensor cannot be attached directly to the desired
measurement point due to its size, e.g. in very narrow shafts or similar. In such cases, it
can be helpful to use one of the supplied angle adapters.
Magnetic connection
Screw connection
Thanks to its magnetic foot, the sensor is simply placed on the
adapter. Then, the magnetic adapter can be attached to the
pipe or fitting etc.
NOTE
The sensor's type plate and I/O area must face
away from the angle adapter - as can be seen on
the picture.
Otherwise, the magnet of the angle adapter would
You can screw the angle adapter firmly to the sensor.
This can be useful as the holding strength between the angle adapter and the pipe in
general is higher than the holding strength between the angle adapter and the sensor.
When collecting the sensors, it may happen that you pull the sensor from the angle
without intention. The adapter then remains on the pipe and it could be difficult to
remove it.
Unscrew the magnetic foot from the sensor. Take one of the
supplied screws from the Correlux C-3 set to screw the angle
adapter on the sensor.
turn off the Multi sensor unintentionally.
Make sure that the sensor's type plate does face away from the
angle adapter.
39
Page 40

The Multi sensors
40
Page 41

The Correlator
6 The Correlator
6.1 Design and function of the device
The COR C-3 Correlator is the central control unit for the Correlux C-3 system.
The device has the following control elements and external features:
Element Description
Rotary encoder
Turning ... Guides through the buttons and input fields displayed
Pressing ... Executes the selected button or enters the input field
ESC pushbutton
Exits the current menu and returns to the Start menu
I/O pushbutton
Short pressing ... Switches the device on or activates the back light for the
Long pressing ... Switches the device off
Charging indicator light
Charging pins
To charge the device wirelessly in the transport case
Ventilation/venting membrane
Touch screen
(the Touch function can be enabled/disabled in the sytem settings (see
page 50))
screen
41
Page 42

The Correlator
Element Description
Antenna 1 (digital radio)
Data transfer in Offline measurement mode
Antenna 2 (analogue radio)
Measurement data transfer in Online measurement mode
Microphone
Connection socket for ground microphone
12V DC /
Connection socket for headphones
USB / GPS
Combined connection socket for
•
USB cable
•
GPS receiver
42
Page 43

The Correlator
6.2 Power supply
Internal supply
Charging
The Correlator is fitted with an internal rechargeable Li-ion battery. This can power the
devices for at least 16 hours. The battery’s present charge level is shown by the battery
symbol bottom right of the screen.
When the battery is low, a warning tone is heard and a warning message appears on
the screen. The device must be charged. Otherwise, it switches itself off automatically.
The Correlator is charged wirelessly in the C-3 transport case.
As soon as the device is situated at its storage place in the case, it is recharged via the
two pins , provided the case is connected to mains or a 12 Volt vehicle power
supply. The red indicator light is lit while the device is charging.
The Correlator is switched on during the entire charging process and can not be
deactivated. After the end of charging, the device remains switched on for the Auto-OFF
period specified in the system settings before it switches off.
Charging takes approximately 9 hours.
Heat is generated while charging. The charging station in the case therefore has a
temperature switch. The charger switches off automatically when it gets too warm inside
the case. It turns back on as soon as the degree of heat has fallen below a certain level.
NOTE
In order to prevent damage, observe the following precautions when
charging:
•
Use only the charging station in the transport case. Do not use other
chargers.
•
The ambient temperature should be between 10°C and 35°C
(50°F and 95°F).
•
To avoid heat accumulation, do not close the lid of the case at high
ambient temperatures during charging.
•
If you experience problems with the battery, please contact your
SebaKMT sales or service partner. Do not open the Correlator yourself.
43
Page 44

The Correlator
6.3 Design of the user interface
All the menu levels on the Correlator's user interface consist of a large display area, the
main menu and an info bar.
Display
area
Main menu
Info bar
Info bar
Help text ++ Help text ++ Help text
Using the buttons in the main menu you can access the individual functions of the
device.
Main menu
Correlation
Quick start
to begin a
correlation
Pipe data
Menu to enter
pipe parameters
(length, material,
diameter etc.)
Measurement
functions
Functions to
arrange, perform
and analyze
measurements
Settings
Functions to
manage devices,
correlation data and
system settings
Back
Return
to previous
menu level
The info bar provides the user with the following information (from left to right):
•
A help text with short explanations for the selected element (button / field / box) or
on how to proceed
•
The battery symbol indicates the charge level of the battery
•
The Correlator's internal time
44
Page 45

The Correlator
6.4 Basics of operation
6.4.1 Input methods
Entries can be made directly on the screen or via the rotary encoder.
2 ways of entering data
Touch display Rotary encoder
The Correlator screen is touch-sensitive.
All entries can be made directly on the
screen.
The buttons or fields displayed
can be accessed or executed by tapping
with your finger.
You can always switch between operating via touch screen and operating via rotary
encoder.
6.4.2 Entering identification numbers
Introduction
Various functions require the identification numbers (IDs) of the Power transmitters or
Multi sensors to be specified.
The ID is deduced from the last six digits of the device's serial number (short: SN). You
find the serial number on the nameplate of the relevant device.
Example:
The Correlator has a rotary encoder.
All entries can be made using the rotary
encoder.
Turn the rotary encoder to navigate
through the displayed buttons.
Press the encoder to access the selected
button (ENTER function).
Serial number (SN):
Identification number (ID):
Entry on Correlator / PC:
You can enter device IDs manually or you can use the "Automatic device detection".
Automatic detection means that once a device is activated its ID is immediately sent to
the Correlator. There, it is detected and displayed.
0888000225
000225
45
225
Page 46

The Correlator
For entering a device ID the following screen view, or a similar one, opens:
Manual entry
Automatic detection
6.4.3 Entering text
DEL
ENTER
Accept
Decline
Finish
For the manual entry of IDs, use the number pad displayed. Confirm with the ENTER
button.
To the right of the number pad, there are fields and buttons for the automatic sensor
detection. The devices concerned must be close to the Correlator.
To register a Power transmitter, briefly press the I/O pushbutton of the device. To
register a Multi sensor, briefly move a magnet past the sensor's I/O area, so that the
LED lights up briefly. As a result, the device's ID is sent, detected by the Correlator and
displayed on the screen. Using the buttons the detected ID can be accepted or declined.
This way several device IDs can be added to the Correlator in quick succession.
To enter comments or similar, a virtual keyboard appears on the screen. Enter the
required text and confirm with OK.
... Deletes the last character
... Confirms and completes the entry
... Accepts and enters the automatically detected ID
... Does not accept the automatically detected ID
... Completes the automatic detection
46
Page 47

The Correlator
6.4.4 Sorting devices in lists and tables
In various menus, device IDs or other information are listed in a kind of table.
For example, the following picture shows the Correlator's sensor pool with all registered
Multi sensors listed.
If a black triangle can be seen in the header of a column, you have the option to change
the sort order (ascending / descending). Just tap the respective header.
Example:
Tapping this header changes the sort order of the displayed devices from 1-3 to 3-1.
In the picture, a triangle can be seen in the Number header.
Changing the sort order is only possible via touch screen, not via the rotary
encoder.
6.4.5 ESC pushbutton and "Back" button
By pressing the ESC pushbutton of the Correlator you can cancel or end any
process. The button closes the displayed menu and opens the start menu.
You can use the Back button in the main menu to return to the previous menu
level.
47
Page 48

The Correlator
6.5 Commissioning
6.5.1 Switch the Correlator ON/OFF
Switching ON
Switching OFF
Auto-OFF
The Correlator is switched on with the I/O pushbutton . The device requires a few
seconds to boot. Then the Start menu appears on the screen. The device is now ready.
To switch the Correlator off, press the I/O pushbutton until the screen turns off
(approx. 2 seconds).
The Correlator automatically switches off if no entry is made within a specified time
period. This timespan can be configured in the system settings (see page 51).
6.5.2 Basic settings at initial start-up
When the Correlator is switched on for the first time, two consecutive Welcome menus
appear on the screen. There, some basic system settings have to be made before the
Start menu can be entered.
Language,
date and time
Select your language in the first of the two menus. Use the first pull down list to do so.
The Correlator's operating language immediately adapts to your selection. After that,
enter the remaining requested details.
Line Description
Daylight saving time
Date format
Date / Time
Confirm with OK. The menu is closed. The settings are accepted.
Select whether it is currently winter or summer time.
Select the date format to be used by the Correlator.
DD
MM
YYYY
Enter the current date and time (hour:minute:second) for the
Correlator.
Day
...
Month
...
Year
...
48
Page 49

The Correlator
You have the option to change these settings again in the Correlator's system settings
menu, at any time.
Devices of your set
Specify in the next menu which devices are part of your Correlux C-3 set. Tick the
relevant checkbox/es.
The statements made here determine which measuring methods will be offered in the
Correlator's Start screen.
Example: If you select no checkbox except "COR PT-3", the Online measurement
method "COR PT-3 with microphone" will be the only available method in the Start
screen.
Confirm with OK. The menu is closed. The settings are accepted. The Start menu of the
Correlator appears.
You have the option to change these settings again in the Correlator's system settings
menu, at any time.
6.5.3 Change the language
The operating language can be changed in the system settings of the device.
If currently a foreign language is set, call the Start menu and follow these symbols:
Next to the second flag you find a pull-down list with all available languages.
6.5.4 Activate the display light
The display light is switched on once
•
the screen is touched (provided the touch function is not disabled)
•
the rotary encoder is turned
•
the I/O pushbutton is briefly pressed
The light remains on for a certain time period. The length of this period can be adjusted
in the system settings.
Î Î
49
Page 50

The Correlator
6.5.5 Enable/Disable the touch screen (touch sensitivity)
The touch function of the screen can be disabled/enabled if needed. The screen will no
longer respond to tapping. The device can only be operated using the rotary encoder.
Enable/disable
touch function
To enable/disable the touch function, proceed as follows:
Step Description
1
In the main menu, select the button .
2 In the displayed menu, select the System settings button.
Result: The system settings menu is opened.
Use the buttons Next and Previous to browse through the available settlings.
3 Look for the Touch option.
Enable/Disable the corresponding checkbox.
50
Page 51

The Correlator
6.6 System settings
By means of the System settings various device settings can be customized to the
needs of the user. Furthermore, the menu provides useful information on the status of
the device and the firmware used.
To access the System settings menu, proceed as follows:
Step Description
1
In the main menu, tap the button .
2 In the displayed menu, tap the System settings button.
Result: The system settings menu is opened.
Use the buttons Next and Previous to browse through the available settlings.
6.6.1 Basic settings
The following basic settings can be made
Line Description
Backlight
Auto-OFF
Key beep
Language
Backlight switch
off
Turn off autom.
after
Key beep
Language
Select a period of time for the backlight until it is switched off
automatically.
Explanation:
automatically after a period of time. Specify the length of this period
here.
If you select never, the backlight will remain on permanently.
Select a period of time for the Correlator until it is switched off
automatically.
Explanation:
automatically after a period of time. Specify the length of this period
here.
If you select never, the Correlator will remain switched on
permanently.
Activate/deactivate the key tone that sounds when a button is
tapped or the rotary encoder is pressed.
Select your language.
If no entry is made, the display light is switched off
If no entry is made, the device switches itself off
51
Page 52

The Correlator
Time and date
Format of units
Reset system settings
Touch screen ON/OFF
Averaging during
correlation
Timezone
Daylight saving
Select the time zone for where you are.
Select whether it is currently winter or summer time.
time
Date format
Date / Time
Select the date format to be used by the Correlator.
DD
MM
YYYY
...
...
...
Day
Month
Year
Enter the current date and time (hour:minute:second) for the
Correlator.
Measurement
units
Select the system of units to be used by the Correlator.
Metric
Imperial
...
Used in Europe and most countries around the world
...
Used in the US
Factory settings Tap the Reset button if you want to reset all system settings to
factory defaults.
Touch
Enable/Disable the touch function (touch sensitivity) of the screen.
If this function is disabled, the screen only works as a display. The
device can only be operated using the rotary encoder.
Averaging
Select the averaging interval.
Explanation:
When performing an Online measurement, the
calculation will automatically be restarted and the displayed
correlation curve will be updated at regular intervals. Here you set
the time interval
no averaging
20 s
unlimited
No averaging takes place.
...
Averaging of the correlation curve takes place in
...
a 20 seconds interval.
Averaging of the correlation curve takes place
...
with every new received measuring data
package.
52
Page 53

The Correlator
Frequency scale
linear / logarithmic
Available measuring
methods
in Start menu
Frequency scale
Available quick
start buttons
Select if the X-axis of the coherence diagram in the Correlation
menu shall ascend in a linear or logarithmic way.
Explanation:
from 0 to 3300 Hz. Based on experience the frequency of leak
noise ranges from 0 to 1000 Hz. The logarithmic view results in a
wider display area for lower frequencies.
logarithmic:
linear:
Specify which devices are part of your Correlux C-3 set.
Enable/Disable the relevant checkbox/es.
Explanation:
measuring methods will be offered in the Correlator's Start screen.
Example: If you select no checkbox except "COR PT-3", the Online
measurement method "COR PT-3 with microphone" will be the only
available method on the Start screen.
The frequency range of the Correlux C-3 system is
The statements made here determine which
6.6.2 System info
The System settings menu has the following information on the device and the
firmware currently in use:
Line Description
Free space
Software Version
Software date/time
ID
The Correlator's free memory space in MB
Firmware version of the Correlator
Date of the last firmware updates
Identification number of the Correlator
6.6.3 Saving the settings
When leaving the system settings menu all the settings are automatically saved and
accepted.
53
Page 54

The Correlator
6.7 Communication
6.7.1 Connection between the Correlator and the sensors
Short range radio is used for communication between the Correlator and the sensors
(Power transmitters and Multi sensors).
Analogue short range radio is used for Online measurements. Digital short range radio
is used for Offline measurements. Therefore, the Correlator is equipped with two radio
antennas.
Antenna 1 ... Digital radio
Antenna 2 ... Analogue radio
6.7.2 Connection between the Correlator and the computer
The included VK 77 connection cable is used to connect the Correlator to a PC/laptop.
This connection is needed for
•
correlation data transfer to the computer
•
firmware update file transfer to the Correlator
Connecting
Disconnecting
To connect the Correlator to a computer, proceed as follows:
Step Description
1
In the main menu, tap the button .
2 In the displayed menu, tap the Connect Correlator to PC button.
3
Establish the cable connection.
Connect the round plug of the cable to the USB/GPS socket of the Correlator.
Observe the markings on the plug and socket. You must feel the plug engage.
4 Tap the Connect button on the Correlator.
Result: The connection is established. The Correlator is automatically detected
by the computer as a mass storage device. As soon as the Connected message
on the Correlator’s screen appears, data can be transferred.
If no connection is made, check the cable connection again. If necessary, disconnect
the Correlator from the computer, restart it or perform a reset, and follow steps 1 to 4
once again.
To end the connection, select the Disconnect button on the Correlator. As soon as the
Disconnected message appears, the connection cable can be removed.
6.8 Hardware reset
If the Correlator stops responding to inputs (neither from touch screen nor from rotary
encoder or pushbuttons), a hardware reset can be performed.
Hold down the rotary encoder and the ESC pushbutton at the same time for
about one second. The Correlator restarts automatically. This usually rectifies the
malfunction.
If the device still malfunctions after resetting the device, try the following: Hold down the
rotary encoder and the ESC pushbutton at the same time for about 3 seconds. The
Correlator switches off. Wait about a minute before switching the Correlator back on.
The Correlator should now function correctly again.
54
Page 55

Sensor management
7 Sensor management
7.1 Introduction
All Power transmitters and Multi sensors of your Correlux C-3 set have to be registered
in the Correlator.
Two Power transmitters and up to 8 Multi sensors can be registered. The units make up
the so-called "sensor-pool". The Correlator can only communicate with registered
devices.
7.2 Access the sensor pool
To access the sensor pool, proceed as follows:
Step Description
1
In the main menu, tap the button .
2 In the displayed menu, tap the Sensor management button.
Result: One additional menu appears, if the Correlator currently is in
Offline measurement mode. There, tap the Edit / Manage button.
Indicators
Result: The Correlator's sensor pool appears.
The sensor pool is divided into two sections:
Element Description
"Online" pool
Under the Power transmitter tab the two Power transmitters of your set are
managed which are used for Online correlations.
"Offline" pool
Under the Multi sensor tab the Multi sensors and Power transmitters are
managed which can be used for Offline correlations.
55
Page 56

Sensor management
The registered sensors are listed respectively. The columns of the table have the
following definitions:
Element Description
Index / Number of the device
A / B
1 - 8
... indicates whether this is the Power transmitter A or B
... shows the number of this Multi sensor which was assigned to the
device during the registration
Identification number of the device
Type designation of the device (as it is also found on the nameplate)
COR PT-3A
COR PT-3B
COR MS-3
Sensors which are marked with an X have been used in the last
measurement.
... Power transmitter "A"
... Power transmitter "B"
... Multi sensor
56
Page 57

Sensor management
7.3 Register sensors
Add sensors for
Online measurements
To register a Power transmitter for Online measurements, proceed as follows:
Step Description
1 In the Sensor pool menu, select the Power transmitter tab.
2 Tap the Add button.
Result: A question appears on the screen. You must decide whether the
Power transmitter in question shall be added to the "Online pool" only or to both
the "Online pool" and "Offline pool" at the same time.
3 Use the buttons Yes or No to answer the question displayed.
No
Yes
... The device will only be added to the Online pool.
... The device will be added to both pools at the same time
Result: The menu for entering device IDs opens.
Add sensors for
Offline measurements.
4
Enter the ID of the Power transmitter.
Via manual input:
•
Enter the ID.
•
Confirm with the ENTER
button.
Via „Automatic detection“:
•
Briefly contact the I/O field of the
Multi sensor with a magnet or press the
I/O button of the Power transmitter.
•
On the Correlator screen, confirm the ID
displayed with Accept.
•
Add another sensor or conclude by
tapping Finish.
Result: The display returns to the Sensor management menu.
The relevant device now appears in the list.
If the device could not be added, maybe there already exists a Power transmitter
of the same type (PT-A or PT-B) in the list. It is not possible to manage two PT-A
or two PT-B in the same list.
For Offline measurements, Multi sensors as well as Power transmitters can be used.
Therefore, the Offline pool can contain both types of sensors.
To register a sensor for Offline measurements, proceed as follows:
Step Description
1 In the Sensor management menu, select the Multi sensor tab.
2 Tap the Add button.
Result: The menu for entering device IDs opens.
57
(continued on next page)
Page 58

Sensor management
Step Description
3
Enter the identification number of the sensor in question.
7.4 Replace / Delete sensors
Replace a sensor
Via manual input:
•
Enter the ID.
•
On the right, a drop-down list
appears. There, select whether the
device in question is a
Multi sensor (COR MS-3) or a
Power transmitter (COR PT-3).
•
Confirm with the ENTER button.
Via „Automatic detection“:
•
Briefly contact the I/O field of the
Multi sensor with a magnet or press
the I/O button of the
Power transmitter.
•
On the Correlator screen, confirm
the ID displayed with Accept.
•
Add another sensor or conclude
with Finish.
Result: The display returns to the Sensor management menu.
The relevant device now appears in the list.
Every Multi sensor receives a consecutive number from 1 to 8, according to the
registration order. This number is displayed in the first column of the table. The
number will be used in various functions of the Correlator to represent this sensor.
You can remove a single sensor from the pool and replace it by a new sensor.
Proceed as follows:
Step Description
Delete a sensor
1
In the list, tap on the applicable sensor.
2 Tap the Replace button.
3 Answer the question displayed with Yes.
Result: The menu for entering device IDs opens.
4
Enter the identification number of the sensor which you want to add new to the
sensor pool. Use the key pad displayed or the "Automatic detection".
Result: The display returns to the Sensor management menu. The new sensor
now appears in the list. It takes over the number of the replaced sensor.
To remove a sensor from the pool, proceed as follows:
Step Description
1
In the list, tap on the applicable sensor.
2 Tap the Delete button.
3 Answer the question displayed with Yes.
Result: The sensor is removed from the list.
58
Page 59

Sensor management
7.5 Additional functions
Change sorting order
of power transmitters
Using the A < > B button you can reverse the sorting order of the two
Power transmitters A and B in the Online pool. This step has an impact on the
Correlation menu which is shown on the screen when performing an
Online measurement.
Variant 1:
Variant 2:
Sorting order A ĺ B
In the Correlation menu, Power transmitter A appears on the left,
Transmitter B appears on the right.
Sorting order B ĺ A
Change a sensor's
number
In the Correlation menu, Power transmitter A appears on the right,
Transmitter B appears on the left.
You can change a Multi sensor's number in the sensor pool. Proceed as follows:
Step Description
1
In the list, tap on the applicable sensor.
2 Tap the Change number button.
3 Answer the question displayed with Yes.
Result: A key pad appears on the screen.
4
Enter the new number for this sensor. A number from 1 to 8 is possible. There
must not be two devices with the same number in the sensor pool.
Confirm with the ENTER button.
Result: The display returns to the sensor pool menu.
The relevant sensor is now shown with the new number in the list.
59
Page 60

Sensor management
60
Page 61

Online correlation
8 Online correlation
8.1 Measurement with 2 Power transmitters
Checklist
prior to measurement
Start correlation
The following requirements must be met or preparations must be made:
•
The batteries of the Power transmitters and the Correlator must be charged.
•
All radio antennas have to be properly connected to the Power transmitters and the
Correlator.
•
The microphones/hydrophones have to be properly connected to the Transmitters.
•
The radio of each Power transmitter should be tested. For this, take the
transmitter’s microphone from the storage place. The Radio LED must now be
lit. If not, put the microphone back to the storage place, switch the transmitter off
and on again and repeat the test.
Deploy the Power transmitters at the required measuring points and start the correlation.
Proceed as follows:
Step Description
1
Take the Power transmitter "A" (orange) and go to the first measuring point.
Attach the microphone to the pipe (or, alternatively, install the hydrophone).
Switch the Power transmitter on.
2
Take the Power transmitter "B" (yellow) and go to the first measuring point.
Attach the microphone to the pipe (or, alternatively, install the hydrophone).
Switch the Power transmitter on.
3
Take the Correlator and choose a position half way between the measuring
points. Switch the Correlator on.
4
In the Start menu, use the arrow buttons ŻŹ to choose the required Online
measuring mode (COR PT-3 with microphone or COR PT-3 with hydrophone.)
61
Page 62

Rate the correlation
Online correlation
Step Description
5
To start the measurement, tap the large central button in the display area or
tap the button in the main menu.
Result: The correlation starts. The Correlation Analysis menu opens.
Rate the correlations. To do so answer the following questions.
Is the radio signal of both transmitters strong enough?
If the radio symbol shows a strong signal, the measurement can be
continued and a detailed analysis can be started.
If the radio symbol shows a weak signal, a continuous correlation will
be hardly or not possible.
The following actions may help:
•
Move closer to the Power transmitter in question.
•
Place the transmitter higher
(e.g. on a wall or on a traffic cone or similar).
•
If necessary, place the transmitter at an other measuring point.
•
If possible, there should be a direct line of sight connection between
Correlator and transmitter.
If still no connection can be made, conduct an Offline measurement instead
of the Online measurement.
Is the correlation result reliable?
The curve shows one clear peak;
the lag value is green or yellow
The curve shows no clear peak;
the lag value is red and fluctuating
and does not fluctuate
Meaning:
How to proceed:
The result is reasonable.
Continue the
measurement and start a detailed
analysis.
62
How to proceed:
here, the following can help:
•
Access the system settings menu, adjust the
„Averaging“ to “unlimited” and restart the
correlation.
•
Conduct an Offline measurement (at night)
instead of the Online measurement.
If you still suppose a leak to be
Page 63

Online correlation
Listen to leak noise
Enter pipe parameters
You have the option to listen to the sound in the pipe “live”, in order to judge whether a
leak noise or a background noise can be heard.
Connect the supplied headphones to the 12 V DC / socket of the Correlator. In the
Correlation menu, tap the button or to access the Audio menu (see chapter 2).
If you assess the correlation as "good", in the next step specify the properties of the pipe
in order to be able to calculate the distance to the leak.
Proceed as follows:
Step Description
1
In the Correlation menu, tap the button between the two diagrams representing
the pipe or use the button in the main menu.
Result: The Pipe data menu opens.
2
Reproduce the pipeline.
Use the Add and Delete buttons to divide the line into sections.
3
Enter the pipe data (material, diameter, length) for each section.
4
Use the Back button to return to the Correlation menu or the Start menu.
The entered pipe data are accepted
Result: In the Correlation menu, the distance from transmitter A or B to the leak
is displayed now.
63
Page 64

Online correlation
Rate the leak position
Use the following questions to assess whether the leak position seems plausible or not.
Is one of the values zero or close to zero?
If the answer is NO, the values seem plausible.
Continue the measurement and start a detailed analysis.
If the answer is YES, the leak is located precisely at the measuring point or outside the
correlated pipe section.
Cancel the measurement. Take the relevant transmitter and look for a new installation
point in order to enlarge the measuring length. Then start a new correlation.
Does each value show the half of the measuring length
Detailed analysis
If the answer is NO, the values seem plausible.
Continue the measurement and start a detailed analysis.
If the answer is YES, the leak is located precisely half way between the measuring
points or a measuring error has occurred (so called ‘center point correlation’).
Cancel the measurement. Take one of the transmitters and look for a new installation
point in order to enlarge the measuring length. Then start a new correlation.
Use the various tools to analyze the displayed correlation:
•
When you tap the displayed correlation curve, the Correlation analysis menu with
the relevant tools opens.
•
When you tap the displayed coherence curve, the Frequency analysis menu with
the relevant tools opens.
Use the Back button to return to the Correlation menu.
Some settings for calculating and presenting the correlation curve can be changed in
the in the System settings menu (see page 51).
64
Page 65

Online correlation
8.2 Measurement with only 1 Power transmitter
It is possible to replace one of the two Power transmitters by the Correlator. Thus, the
Correlator performs both, the function of a control unit and the function of a noise sensor
at the second measuring point.
This allows performing Online measurements even if one of the two Power transmitters
is not available or malfunctions.
Connect
the microphone
Configure the
Correlator
The universal microphone PAM CORR-2 needs to be connected to the Correlator.
Simply use the microphone of the not used Power transmitter.
The Correlator's microphone socket has this icon:
Observe the markings on the plug and socket. You must feel the plug engage.
On the Correlator, it has to be specified which Power transmitter will be replaced at the
coming measurement.
Proceed as follows:
Step Description
1
In the Start menu, use the arrow buttons to choose an Online measuring mode,
e.g. "COR PT-3 with microphone".
2
In the main menu, tap the button .
3 In the displayed menu, tap the Sensor connection button.
4
In the menu displayed, specify which Power transmitter shall be replaced by the
Correlator at the next measurement.
Variant 1:
Then tap the Direct button beneath A and confirm with OK.
The measurement shall be performed without Power transmitter A?
Variant 2:
Then tap the Direct button beneath Band confirm with OK.
Use the Back button or the ESC pushbutton to return to the Start menu.
The measurement shall be performed without Power transmitter B?
65
Page 66

Online correlation
The changed setting is accepted and will become effective at the next measurement.
The setting will remain valid until it is changed again in the Sensor connection menu or
until the Reset last correlation data command in the System settings menu is used to
reset all measurement data (see page 101).
Perform measurement
Reset the
"Sensor connection"
setting
First, take the Power transmitter which shall be used, go to the first measuring position.
Attach the sensor to the pipe and turn the device on.
Then, take the Correlator and go to the second measuring position. Attach the sensor
which is connected to the Correlator to the pipe.
The measurement can now be started using the button in the main menu.
Before the next Online measurement with two Power transmitters can be performed, the
Sensor connection setting has to be reset.
For this, access the Sensor connection menu and tap the RF button beneath A as well
as the RF button beneath B and confirm by pressing OK.
If you use the Reset last correlation data command in the System settings
menu prior to a new correlation, the Sensor connection setting will be reset to
RF-RF at the same time.
66
Page 67

Online correlation
8.3 How to exchange A - B on the screen
In the Correlation menu, the Power transmitter icons and are positioned to the
left and right of the correlation curve. As standard, Power transmitter A is on the left,
Power transmitter B is on the right.
It is possible to exchange the two icons on the screen, when required. Then,
Power transmitter A will be on the right, Power transmitter B will be on the left.
Procedure
To exchange the Power transmitter icons with each other, proceed as follows.
Step Description
1
In the main menu, tap the button .
2 In the displayed menu, tap the Sensor management button.
Result: The Sensor management menu opens. There, the list of
Power transmitters is shown. If this is not the case, tap the Power Transmitter
tab.
3 Tap the A < > B button.
Result: The sort order of the two Power transmitters in the list is reversed.
Use the Back button or the ESC pushbutton to leave the menu. The changed
setting is accepted and will become effective as soon as a new correlation is performed.
The setting will remain valid until it is changed again in the same way.
67
Page 68

Online correlation
68
Page 69

Offline correlation (Multipoint measurement)
9 Offline correlation (Multipoint measurement)
A group of 2 to 8 sensors is programmed for measurement and then deployed at the
measuring points. Multi sensors and/or Power transmitters can be used. The
measurement is carried out by all sensors simultaneously. During the measurement,
there is no contact between the sensors or between the sensors and the Correlator.
After the measurement, the sensors are collected and the recorded data is read, then
correlations can be carried out and displayed on the Correlator.
Checklist
prior to measurement
Programming sensors
The following requirements must be met or preparations must be made:
•
A digital or printed pipe network plan of the relevant measuring area with all pipe
parameters is needed.
•
The batteries of the devices involved must be charged.
•
All sensors involved must be registered in the Correlator's Multisensor pool (also
called "Offline pool" (see page 55))
•
If Power transmitters will be used: The microphones must be properly connected.
•
All sensors must be received by the Correlator. (This is the case, when each battery
icon in the Correlator's Start menu shows the battery level of the relevant sensor. If
a question mark is shown, the corresponding sensor cannot be reached.)
Configure the sensors for the measurement:
Step Description
1
All sensors must be turned on.
2
In the Correlator's Start menu, select the required Offline measuring mode
("COR MS-3 with microphone" or "COR MS-3 with hydrophone").
Use the arrow buttons to choose the mode, then tap the large central button to
open it up.
3 In the displayed menu, tap the Program button.
69
(continued on next page)
Page 70

Offline correlation (Multipoint measurement)
Step Description
Result: In the displayed menu, up to 8 fields represent the sensors which are
registered in the Correlator's Multi sensor pool.
4
Select the sensors which shall be programmed. Tap the appropriate field to
enable/disable the checkbox.
Only "enabled" sensors will be part of the measurement.
Sensor ID
Sensor no.
5 Tap the Program and Synchronize button.
6
In the menu displayed, decide whether the measurement shall be carried out
immediately or at night.
Tap one of the two buttons:
Instantaneous measurement
(Explanation:
measurement takes 2min
30sec and starts directly after the
(Explanation: Start and end time of the
measurement are set by the user)
Custom measurement
sensors have been deployed)
7 Use the Time offset field to specify the
period of time which it will take to deploy
the sensors at the individual measuring
points.
The entered time span will later be used
as a "countdown to measurement".
Use the Start of measurement field to
specify when the measurement shall
start.
Use the End of measurement field to
specify when the measurement shall be
finished.
8 Tap the OK button. Tap the OK button.
Result: The sensors are programmed and synchronized successively. The
Correlator successively establishes a connection to each sensor. The progress of
the operation is shown on the screen.
When the operation is completed, a countdown appears on the screen showing
the time remaining before the measurement starts.
70
Page 71

Offline correlation (Multipoint measurement)
Deploying sensors
Reading out data
Step Description
9
Deploy the sensors at the measuring
points.
Result: Once the countdown reached
zero, the sensors start measuring.
A new countdown of 2min 30sec is
displayed on the Correlator screen
representing the total time of the
measurement. During this time, the
sensors simultaneously record 10 audio
blocks, each of 3 seconds length. Once
the countdown reached zero, the
measurement is completed.
Deploy the sensors at the measuring
points.
Result: The sensors start measuring at
the programmed time.
A new countdown is displayed on the
Correlator screen showing the time
remaining until the programmed end of
measurement.
During this time, the sensors
simultaneously record 10 audio blocks,
each of 3 seconds length. Once the
countdown reached zero, the
measurement is completed.
10
Once the measurement is completed, collect the sensors.
The sensors need to remain turned on. Otherwise the measurement data would
be lost.
To read the measuring data from the sensors, proceed as follows:
Step Description
1
In the Start menu, select the required Offline measuring mode.
2 In the displayed menu, tap the Read button.
Result: The Correlator successively contacts all sensors. Thereby, the devices
are synchronized. Then, the following menu appears:
(continued on next page)
71
Page 72

Offline correlation (Multipoint measurement)
Step Description
3
If you want to read the audio files of all
sensors, tap the Read all button.
If you want to read just one sensor, tap
the field of the sensor in question.
Result: The audio files are successively transferred.
The progress of the operation is shown in the individual fields.
Radio packages
received
Audio files
received
Use the ESC pushbutton to return to the Start menu.
72
Page 73

Offline correlation (Multipoint measurement)
q
Perform correlation
Step Description
1
In the Start menu, select the required Offline measuring mode.
2 In the displayed menu, tap the Correlation button.
Result: A "Multi correlation" is carried out, which means that the values of all
sensors are correlated with each other. The process can take a few seconds.
Subse
uently, the correlation results for all sensor pairs are shown in thumbnails.
Element Description
Correlation curve
Sensor numbers of the two devices whose data are correlated.
Time distance from the middle of the pipe line to the leak.
The color of the numbers shows how reliable the result of this
correlation is:
green ... "good" correlation, reliable result
yellow ... correlation is not optimal
red ... bad correlation; no leak or no clear
localization possible
negat. value ... the leak is on the left from the center of the
line
posit. value ... the leak is on the right from the center of the
line
73
Page 74

Offline correlation (Multipoint measurement)
Rate correlations
The Multi correlation gives you an overview of the noise situation along the measured
pipeline. In the ideal case, the pipe sections where leaks are most likely can be
identified at a glance.
Rate the displayed correlations.
"Good correlation"
•
clear peak
•
lag value is green
•
lag value is not zero
Probability of a leak
is high
"Bad correlation"
•
more than one peak
•
lag value is yellow or
red
•
lag value is zero or
nearly zero
No leak or no clear
localization possible
If the Multi correlation shows at least one "good correlation" with one clear peak, the
probability of a leak between the respective sensors is high.
Take a closer look at the good correlations. Tap the relevant thumbnail. The
Correlation menu for this sensor pair appears.
74
Page 75

Offline correlation (Multipoint measurement)
How to proceed
if there is pipe data
To be able to calculate the distance to the leak, the properties of the pipe have to be
specified.
2 options
proceeding via
Pipe data menu
proceeding via
Map menu
You can tap the button to open
the Pipe data menu directly and enter
the pipe parameters there.
Prerequisite:
The two measuring points
in question need to be connected directly
which means that there must be no other
sensor attached to the pipe between the
two points.
Otherwise, input errors may easily occur
which would lead to wrong correlation
results.
Alternative:
It is highly recommended to
The Map menu offers a good overview of
the used sensors and the sections of the
pipe. The Map menu can not only be
used to specify the pipe parameters for
all pipe sections, but also to carry out
more correlations.
To access the Map menu, tap the
button , then tap the Map button
in the displayed menu.
You find detailed information about the
Map function in a separate section of this
manual (see page 93).
use the Map menu instead of the
Pipe data menu.
How to proceed
if there is no pipe data
available
If there is no complete pipe data available, you have the option to switch now to the
"Velocity measurement" menu.
This menu is for:
•
Calculating the distance between a sensor and the leak, although material and
diameter of the pipe are unknown.
•
Calculating the sound velocity in the pipe. The value can then be adopted for further
correlations.
You find detailed information on how to use the Velocity measurement function in a
separate section in this manual (see page 88).
75
Page 76

Offline correlation (Multipoint measurement)
76
Page 77

GPS position data
10 GPS position data
10.1 Introduction
You can use the Correlator to determine and store the GPS coordinates of the individual
measuring points.
GPS data facilitate the management and analysis of the measured data in the Offline
measurement. For some analysis capabilities GPS data are even a prerequisite.
Requirements
The GPS receiver LOG GPS-3 has to be connected to the Correlator. The GPS receiver
is optionally available.
The GPS module is connected to Correlator using the USB / GPS socket. You must feel
the plug engage. The GPS module is powered by the Correlator. The device switches
on immediately after connection and is ready for operation. The status LED lights up.
The device immediately begins to search for GPS signals.
10.2 Determine and save GPS coordinates
To determine the GPS position for a sensor, you must take the Correlator and proceed
as close as possible to the installed device.
Subsequently, proceed as follows:
Step Description
1
In the main menu, tap the button .
2 In the displayed menu, tap the Store GPS position button.
Result: The following menu opens. Up to 8 fields represent the sensors which are
registered in the Correlator's Multisensor pool.
Sensor ID
Sensor no.
GPS position
3
Tap the field of the sensor whose position is to be determined.
Result: The GPS menu opens. The GPS receiver is searching for available
satellites.
After a while, the current GPS time is displayed.
As soon as the position of the Correlator can be calculated, the current latitude
and longitude are specified.
77
(continued on next page)
Page 78

GPS position data
Step Description
You can change the GPS format for displaying the GPS position. Tap the
GPS format button to select one of the following formats:
•
Decimal degrees
•
Degrees, minutes
•
Degrees, minutes, seconds
The bar at the right of the screen indicates how high the accuracy is with which
the position can currently be determined.
4
Wait until the position has leveled out on a reliable value. The bar to the right
should show an accuracy of 100%.
The first time the position is determined after connecting the GPS module
may take a some time. The Correlator should not be moved during this
phase. It is best to put it down somewhere.
5 Tap the Store button.
Result: The coordinates are accepted. The display returns to the previous menu.
78
Page 79

GPS position data
10.3 Distance measurement and navigation via GPS
You can use the GPS function of the Correlator to determine the distance between two
points. You can also use GPS navigation as a guide to find a stored GPS position.
Access the menu
To open the GPS menu, proceed as follows:
Step Description
1
In the main menu, tap the button .
2 In the displayed menu, tap the Tools button.
3 In the displayed menu, tap the Distance measurement / Navigation button.
The menu is structured as follows:
Element Description
Current position
Indicates the current position of the Correlator. Once the Correlator is moved,
the displayed value is adapted.
Distance
Indicates the linear distance between the Correlator and the
Target position .
Target position
Indicates the GPS position of the point, which was defined as Target position.
Sensor list
List of all sensors, i.e. measuring points, whose GPS coordinates have been
determined and stored. One of these sensor installation points can be
selected and specified as Target position.
top down:
•
Positioning accuracy for the Correlator position (in percent).
•
Number of available GPS satellites.
•
The current GPS date and GPS time.
Speed at which the Correlator is currently moved.
79
Page 80

GPS position data
Distance from here
to a measuring point
Distance from here
to any location
Navigating
to a location
You can calculate the distance from your current position to a stored measuring point.
In the drop-down list , select the sensor which is installed at the relevant measuring
point.
The GPS coordinates of the measuring point are adopted and displayed as the new
"Target position". The distance information is updated and displays the distance
between the Correlator and the measuring point.
You can calculate the distance from your current position to any other location.
Proceed as follows:
Step Description
1
In the drop-down list , select Current position.
2 Tap the Set button.
Result: The GPS coordinates of your current location are adopted and displayed
as the new "Target position".
3
Take the Correlator and proceed to the desired other location.
Result: The distance information is updated and displays the distance from your
current to the previous location.
You can use the directional sign of the GPS menu to guide you to a measuring point.
Proceed as follows:
Step Description
1
In the drop-down list , select the sensor which is installed at the relevant
measuring point.
Result: The GPS coordinates of the measuring point are adopted and displayed
as the new "Target position".
2
Go into the direction the compass needle shows.
The target location is reached when the "Current position" coordinates match the
"Target position" coordinates.
The direction specified by the compass needle is reliable, as long as you
are in motion. Once you stand still at a place, the needle begins to rotate
and the direction shown is no longer reliable.
80
Page 81

Real-time measurement
11 Real-time measurement
With a single sensor, you can perform a real-time measurement. By this means, you get
an idea about the current noise situation in the pipe.
The real-time measurement can be performed with a Power transmitter or with a
Multi sensor.
At the desired location, the sensor is attached to the pipe. Then, via the Correlator a
noise measurement is started. The measurement data are transferred from the sensor
to the Correlator and displayed there in real-time.
If a Power transmitter is used, you have the chance to listen to the recorded noise "live"
via headphones.
Requirements
Perform measurement
The following requirements must be met:
•
The relevant Power transmitter or Multi sensor must be registered to the Correlator.
•
The battery level of the sensor must be OK.
(Power transmitter: LED bar must show at least 2 green lights
Multi sensor: status LED must show green or yellow light)
•
The measuring point must be in the Correlator's radio range (max. 5 m).
•
If a Power transmitter will be used: Antenna and microphone must be properly
connected.
Switch the Power transmitter or Multi sensor on and attach the sensor to the pipe.
Subsequently, proceed as follows:
Step Description
1
If a Power transmitter is used,
use the arrow buttons in the Correlator's
Start menu to choose an
Online measuring mode
(e.g. "COR PT-3 with microphone").
2
In the main menu, tap the button .
If a Multi sensor is used,
use the arrow buttons in the Correlator's
Start menu to choose an
Offline measuring mode
(e.g. "COR MS-3 with microphone").
3 In the displayed menu, tap the Tools button.
4 In the displayed menu, tap the Real time measurement button.
Result: A new menu opens. The up to 8 fields displayed represent the
Power transmitters or Multi sensors registered in the Correlator's sensor pool.
5
In the display, tap on the device which you want to use for the measurement.
Result: The Real-time measurement menu opens. The measurement is started.
The progress of the measurement is shown on the screen.
Use the ESC pushbutton to finish the real-time measurement and to return to the Start
menu.
81
Page 82

Real-time measurement
View measurement
results
The course of the real-time measurement is shown on the Correlator's screen with a
running bar diagram.
Element Description
Headphone volume slide control
slide to the left ... lower
slide to the right ... louder
Minimum value
left-hand field ... ESA value of the quietest recording
center field ... noise level of the quietest recording (in dB)
right-hand field ... frequency of the quietest recording (in Hz)
Instantaneous value
noise level (in dB) and frequency (in Hz) of the current measuring value
shown as numeric values and as a bar graph
bar height ... noise level
bar color ... frequency
Start and Stop buttons
to cancel and continue the measurement
Antenna symbol
indicates that radio communication is in progress
Diagram
X-axis ... course of measurement over time
Y-axis ... noise level in dB
Each bar represents a single noise recording. The color of the bar shows the
approximate frequency of the noise:
blue yellow
0 Hz 3300 Hz
The point where the two green lines intersect marks the quietest recording in
the displayed measurement.
Number and ID of the sensor
82
Page 83

Real-time measurement
Listening to the
noise „live“
If a Power transmitter is used, you have the option to listen to the recorded noise "live"
via headphones.
Connect the supplied headphones to the 12 V DC / socket of the Correlator.
Observe the markings on the plug and socket.
The sound is reproduced as long as the measurement is in progress. To adjust the
headphone volume use the slide control top right of the screen.
If a Multi sensor is used, listening to the recorded noise is not possible. To save energy,
no audio files are transferred from the sensor to the Correlator.
83
Page 84

Real-time measurement
84
Page 85

Sound velocity measurement
12 Sound velocity measurement
The Correlux C-3 system can be used to perform a sound velocity measurement in
order to determine the actual speed of sound in a pipe section.
This function is useful when no reliable information on the pipe material is available for a
pipe section or the entire measurement area. The calculated sound speed is then
accepted by the Correlator and used for the correlation.
The calculation of the speed of sound is possible in both the Online measurement as
well as the Offline measurement mode.
12.1 Velocity measurement in Online measurement mode
The Velocity measurement function compares the measuring values of the
Power transmitters while they are recording the noise from one specific source. The
sound velocity in the pipe is calculated using the sound delay.
There must be a source of noise on the pipe, which is clearly measurable for both
sensors. If such a noise source does not exist, it must be created artificially, for
example, by opening a fire hydrant.
Requirements
The following conditions must be met in order to use the function:
•
Two Power transmitters (PT-A and PT-B) at two measuring points.
•
The distance between the measuring points must be known.
•
The noise must be clearly measurable for both sensors.
•
The source of noise may be inside or outside the measuring section.
•
The source of noise should not be half way between the measuring points.
•
If the source of noise is inside the measuring section, the distance from the first
measuring point to the sound source must be known.
Distance
Distance
Measuring point 2 Measuring point 1
Source of noise
85
Page 86

Sound velocity measurement
•
If the source of noise is outside the measuring section, the measuring points and
sound source must be arranged as shown on the following picture.
Distance
Measuring point 2 Measuring point 1
Source of noise
Procedure
Proceed as follows:
Step Description
1
Position the Power Transmitters at both measuring points, attach the sensors
(Microphone / Hydrophone) to the pipe and switch the Power Transmitter on.
There must be radio contact between the Power transmitters and the Correlator.
(The two battery symbols in the Correlator’s Start screen can be seen. These
must show the battery level of the Power Transmitter. Question marks are shown
if the Power transmitters are not available.)
2
Make sure the required sound source does exist.
3
In the Correlator's Start menu, use the two arrow buttons to choose the required
Online measuring mode (e.g. "COR PT-3 with microphone").
4
In the main menu, tap the button .
5 In the displayed menu, tap the Tools button.
6 In the displayed menu, tap the Velocity measurement button.
Result: The corresponding menu opens.
7
Specify whether the source of noise is inside or outside the measuring section.
Tap the appropriate button:
Leak outside sensors Leak between sensors
8
Specify the length of the measuring
section. Tap the Distance between
sensors button.
9
Specify the distance from the first
Specify the length of the measuring
section. Tap the Distance between
sensors button.
measuring point to the sound source.
Tap the Distance from left sensor
button.
86
Page 87

Sound velocity measurement
Step Description
10 Tap the OK button.
Result: The correlation starts. The sound velocity in the pipe is calculated and
displayed below the correlation curve.
The result is considered reliable if the following criteria are met:
•
The radio signal from both transmitters is good or excellent.
•
The lag value (top left of the diagram) is green and seems plausible.
•
The displayed sound velocity seems stable and plausible.
If no reliable result is shown, you can use the Cancel button to terminate the
measurement.
11 Tap the Accept and edit pipe button.
Result: The Pipe data menu opens.
There, for the Material and Diameter input fields, the “Manual” option is
automatically selected. The recently calculated sound velocity is accepted and
shown in the corresponding field.
Once the length of the pipe section is changed in this menu, the sound
velocity measurement must be performed again.
Use the Back button to return to the Start menu.
Use the button to start a new correlation between the Power transmitters. The
determined sound velocity will be used for the calculation. This applies until the pipe
parameters are changed in the Pipe data menu, or the entire correlation data are reset
in the system settings menu.
87
Page 88

Sound velocity measurement
12.2 Velocity measurement in Offline measurement mode
12.2.1 Introduction
The Velocity measurement function compares the measuring values of three sensors
which have recorded a shared noise. As a result, the following applications are possible:
Application options
Requirements
Determining the sound velocity
in the pipe
Determining the position of a leak
(despite unknown pipe material)
(for an unknown pipe material)
The actual sound velocity in the pipe is
calculated.
This value can then be adopted for the
The distance from a certain measuring
point to the leak position is calculated.
pipe section being analyzed as a pipe
parameter.
The correlation curve will be updated on
this basis.
The following conditions must be met in order to determine sound velocity or the leak
position:
•
A measurement (night or instantaneous measurement) with at least 3 sensors has
been performed.
•
The measured data has been read and saved with the Correlator.
•
Between the three considered sensors exists a clearly perceptible source of noise.
(The louder the noise, the lower are the negative effects of any potential
interference on the result of the sound velocity calculation).
•
The lengths of the pipe sections between the measuring points must be known.
•
The measuring points and sound source must be arranged as shown on the
following picture.
Distance
Position 3
Position 1
Distance
Position 2
Source of noise
There must be one sensor „in front of“ the sound source (Position 1).
There must be two sensors “behind” the sound source (Positions 2 and 3).
88
Page 89

Sound velocity measurement
12.2.2 Procedure
To calculate the sound velocity in the pipe, proceed as follows:
Step Description
1
In the Correlator's Start menu, use the two arrow buttons to choose the required
Offline measuring mode (e.g. “COR MS-3 with microphone”).
2
In the main menu, tap the button .
3 In the displayed menu, tap the Tools button.
4 In the displayed menu, tap the Velocity measurement button.
Result: The following menu opens:
The square boxes represent the Multi sensors (1 to 8) or Power transmitters
(A and B) used in the measurement.
The scheme below illustrates how the sensors must be positioned in relation to
the source of noise. Take care to follow this scheme when selecting the three
sensors for the measurement. Otherwise the result of the calculation may be
wrong.
Position 1
Source of noise
5
Select the sensor which represents Position 1 (sensor “in front of” the sound
Position 2
Position 3
source) by tapping the required box.
Result: The number of the selected sensor is shown at position 1. The white
highlighting switches to position 2.
6
Select the sensor which represents Position 2 (first sensor “behind” the sound
source).
7
Select the sensor which represents Position 3 (second sensor “behind” the sound
source).
8 Tap the OK button.
Result: The menu for calculating the speed of sound opens.
(continued on next page)
89
Page 90

Sound velocity measurement
Step Description
Button:
Sensor No. at
position 1 / 2 / 3
9
Specify the pipe length from position 1 to 2 and from position 2 to 3.
Input field:
Pipe section length
from position 1 to 2
Input field:
Pipe section length
from position 2 to 3
For that, tap the input field between the relevant sensors. A numeric keypad is
displayed. Enter the pipe section length and confirm with ENTER.
Result: The sound velocity in the pipe is calculated immediately and displayed at
the top of the screen (here: 1277 m/s).
The upper diagram shows the correlation between position 1 and 2.
The lower diagram shows the correlation between position 2 and 3.
Next to the chart, you can read the distance from the respective measuring point
to the source of noise.
Distance from sensor No. 1
to the source of noise
Distance from sensor No. 2
to the source of noise
You have the option to replace one of the three sensors and repeat the
calculation.
Tap the sensor to be replaced. In the next menu, tap the required new
sensor, then tap OK. The sound velocity will be re-calculated and
displayed.
The next section offers an example.
10 Use the Accept button to accept the velocity value displayed as a pipe parameter
for the pipe section in question.
The correlation results are automatically updated in the background.
The display returns to the previous menu.
Use the Cancel button to cancel the velocity measurement and return to the
previous menu.
90
Page 91

Sound velocity measurement
12.2.3 Notes and examples
Take care to follow this scheme at the bottom of the display area when selecting the
three sensors (see step 4). Otherwise the result of the calculation may be wrong.
There must be one sensor "in front" and two sensors "behind" the source of noise. The
sensors' numbers and their order on the pipe are of no importance in this process.
Example 1:
Example 2:
The source of noise is located between the sensors 1 and 2.
Entry on the Correlator: first, sensor 1 (in front of the sound source), then sensors 2 and
3 (behind the sound source).
The source of noise is located between the sensors 2 and 3.
Possible entry: first, sensor 2, then sensors 3 and 4.
Possible entry: first, sensor 3, then sensors 2 and 1.
91
Page 92

Sound velocity measurement
92
Page 93

Map function
13 Map function
The Map function is a very clear and comfortable way to work with Offline Measurement
data.
The sensors used are shown as icons. Pipelines can be drawn between these icons and
the pipe parameters can be specified. In the Map menu, the existing pipe network can
be reproduced on the screen.
Then, the correlation can be accessed between any sensor pairs.
Access the Map
To access the Map menu, proceed as follows:
Step Description
1
In the main menu, tap the button .
2 In the displayed menu, tap the Map button.
Result: The following menu opens:
The square boxes represent the Multi sensors (1 to 8) or Power transmitters
(A + B) used in the measurement. The icons can be arranged realistically to each
other by hand or, if the GPS coordinates of the measuring points have been
determined and stored with the Correlator, at the touch of a button.
Arrange sensor icons
The sensor icons can be moved and repositioned on the screen. (Only possible via
touch screen, not possible via rotary encoder).
Proceed as follows:
Step Description
1 Tap the Move button.
2
Tap and move the sensor icons on the screen.
If GPS coordinates of the measuring points have been stored, you can use the
GPS button to arrange the sensor icons automatically.
3 Tap on Return to conclude the process.
93
Page 94

Map function
Draw pipelines
To draw, change or delete pipelines in the map, proceed as follows:
Step Description
1
Tap the sensor icon which represents the start point of the line.
2
Tap the sensor icon which represents the end point of the line.
3 Tap the Pipe button.
Result: If there is no line between the two sensors in question so far, first the
following screen appears.
Tap the Add button.
Result: The Pipe data menu opens.
5
You can divide the displayed pipeline into individual sections if the line between
the sensors is not consistently of the same material or diameter.
Use the buttons Add and Delete to create or remove pipe sections.
To select a section, tap directly on the relevant section in the graph or use the two
arrow keys. The currently selected section is underlined white.
6
Enter the pipe data (material, diameter, length) for each pipe section.
Use the Back button to return to the Map menu.
94
Page 95

Map function
Show Leak
Once the pipe net in the map is created, the correlation calculations for all sensor pairs
are automatically updated in the background.
You can display the calculated leak between two sensors in the map. Proceed as
follows:
Step Description
1
Tap the first sensor.
2
Tap the second sensor.
Result: The leak position is marked on the map with a drop icon, provided the
correlation between the two sensors in question found a leak noise.
Example:
The correlation of the line from sensor 5 to 2 results in a leak at the marked
position.
The correlation of the line from sensor 5 to 3 results in a leak at the very
same position.
The correlation of the line from sensor 5 to 1 shows the drop icon right at
sensor 1.
This indicates either that the leak is right at sensor 1 or that the leak is near
sensor 1 but outside the correlated pipeline section.
95
Page 96

Start correlation
Map function
The correlation of the line from sensor 3 to 4 shows the drop icon right at
sensor 2.
This indicates either that the leak is right at sensor 2 or that the leak is near
sensor 2 but outside the correlated pipeline section.
To start the correlation between two sensors, proceed as follows:
Step Description
1
Tap the first sensor (start point of the pipeline section to be correlated).
2
Tap the second sensor (end point of the pipeline section to be correlated).
3 Tap the Correlation button.
Result: The Correlation menu opens. The correlation is displayed.
Use the various analysis tools:
•
When you tap the displayed correlation curve, the Correlation analysis menu with
the relevant tools opens.
•
When you tap the displayed coherence curve, the Frequency analysis menu
with the relevant tools opens.
•
When you tap the buttons that symbolize the sensors at the measuring points
(e.g. and ), the Audio menu opens which can be used to listen to the
stored leak noise.
For that, connect the supplied headphones to the 12 V DC / socket of the
Correlator.
Use the Back button to return to the previous menu.
Some settings for calculating and presenting the correlation curve can be changed in
the system settings menu.
96
Page 97

Storage / Management of correlations (History)
14 Storage / Management of correlations (History)
14.1 Storing a correlation
Every correlation can be saved permanently in the Correlator. This means that the
measurement data of the relevant correlation is written to the Correlator's internal data
base.
Saved correlations can be accessed, displayed and analyzed on the Correlator anytime.
Saved correlations can also be transferred to a computer and processed there using the
CorreluxView software.
If an Online correlation is not saved using the Store button, the corresponding
measurement data is lost once the correlation menu closes. However, the entered pipe
data and GPS coordinates are kept and preserved for the next correlation.
If an Offline correlation is not saved, the corresponding measurement data is lost as
soon as a new Offline measurement is performed.
Procedure
To store the displayed correlation, proceed as follows:
Step Description
1
In the Correlation menu, tap on the correlation curve displayed.
Result: The Correlation Analysis menu opens.
2 Tap the Store button.
3
In the displayed menu, enter a name for this correlation.
If no entry is made, a name is automatically generated. The leading 8 digits
represent the date when the measurement has been performed.
To confirm, tap the ENTER button.
Result: The measurement data is stored in the Correlator. Subsequently, the
Correlation Management menu appears on the screen. There, all stored
correlations are listed.
Use the Back button or the ESCpushbutton to return to the Start menu.
97
Page 98

Storage / Management of correlations (History)
14.2 Managing stored correlations
In the Correlation Management menu the stored correlations are listed. There, the
corresponding measurement data sets can be called up or managed.
To access the menu, proceed as follows:
Step Description
1
In the main menu, tap the button .
2 In the displayed menu, tap the Correlation management button.
Result: The menu opens. The stored correlations are listed
14.2.1 Call up and display a correlation
Call up a correlation
To call up and display a stored correlation, proceed as follows:
Step Description
3
Select the desired correlation in the list.
4 Tap the Load button.
Result: The measurement data set in question is loaded into the Correlator's
memory (RAM).
5
In the main menu, tap the button .
Result: With the loaded measurement data, a correlation is performed. The
Correlation menu opens and the correlation curve is displayed. The known
analytical tools are available.
Use the Back button or the ESC pushbutton to return to the Start menu.
Element Description
The floppy disk icon indicates that the "History" mode is active. This means
that currently a stored correlation is loaded and ready to be displayed.
In the upper line can be read whether the loaded correlation is an Online
measurement or Offline measurement.
In the lower line the name of the correlation is shown.
If you tap the large button (floppy disk icon), the loaded correlation is displayed again.
Once you use the arrow buttons to set a measuring mode, the History mode is left and
the loaded measurement dataset is removed from the memory.
98
Page 99

Storage / Management of correlations (History)
play
14.2.2 Rename a correlation / Create a comment
The name of a stored correlation can be changed.
Furthermore, you have the chance to add a "comment" to each correlation stored which
can be used to make useful annotation.
Access the menu
Rename a correlation
In the Correlation management menu, select the desired correlation and tap the Edit
button. The following menu opens:
Date and time of the
measurement
Dis
To change the name of a stored correlation, proceed as follows:
Step Description
1 Tap the Rename button.
Result: A keyboard appears on the screen.
2 Enter the new name. To confirm, tap the ENTER button.
Result: The screen returns to the previous menu.
3 Tap the OK button.
Result: The screen returns to the Correlation management menu. The new name
for the correlation in question is accepted and displayed.
area of the
comment
Create / edit a
comment
To create a comment or to change the comment text, proceed as follows:
Step Description
1 Tap the Edit button.
Result: A keyboard appears on the screen
2 Enter the desired text. To confirm, tap the OK button.
Result: The screen returns to the previous menu.
3 Tap the OK button.
Result: The screen returns to the Correlation management menu. The new
comment for the correlation in question is accepted and displayed.
Using the Clear button you can delete the entire comment displayed in one step.
Note that this step cannot be undone.
99
Page 100

Storage / Management of correlations (History)
100
 Loading...