

Page 1

Version 9
Scripting Guide
“The real voyage of discovery consists not in seeking new
landscapes, but in having new eyes.”
Marcel Proust
JMP, A Business Unit of SAS
SAS Campus Drive
Cary, NC 27513
9.0.1
Page 2

The correct bibliographic citation for this manual is as follows: SAS Institute Inc. 2010. JMP® 9
Scripting Guide. Cary, NC: SAS Institute Inc.
®
JMP
9 Scripting Guide
Copyright © 2010, SAS Institute Inc., Cary, NC, USA
ISBN 978-1-60764-598-6
All rights reserved. Produced in the United States of America.
For a hard-copy book: No part of this publication may be reproduced, stored in a retrieval system, or
transmitted, in any form or by any means, electronic, mechanical, photocopying, or otherwise, without
the prior written permission of the publisher, SAS Institute Inc.
For a Web download or e-book: Your use of this publication shall be governed by the terms established
by the vendor at the time you acquire this publication.
U.S. Government Restricted Rights Notice: Use, duplication, or disclosure of this software and related
documentation by the U.S. government is subject to the Agreement with SAS Institute and the
restrictions set forth in FAR 52.227-19, Commercial Computer Software-Restricted Rights (June 1987).
SAS Institute Inc., SAS Campus Drive, Cary, North Carolina 27513.
1st printing, September 2010
2nd printing, January 2011
®
JMP
, SAS® and all other SAS Institute Inc. product or service names are registered trademarks or
trademarks of SAS Institute Inc. in the USA and other countries. ® indicates USA registration.
Other brand and product names are registered trademarks or trademarks of their respective companies.
Page 3

Get the Most from JMP
Whether you are a first-time or a long-time user, there is always something to learn about JMP.
Visit JMP.com to find the following:
• live and recorded Webcasts about how to get started with JMP
• video demos and Webcasts of new features and advanced techniques
• schedules for seminars being held in your area
• success stories showing how others use JMP
• a blog with tips, tricks, and stories from JMP staff
• a forum to discuss JMP with other users
®
http://www.jmp.com/getstarted/
Page 4

Page 5

1 Introducing JSL
Tutorials and Demonstrations . . . . . . . . . . . . . . . . . . . . . . . . . . . . . . . . . . . . . . . . . . . . . . . . . . . 1
Hello, World . . . . . . . . . . . . . . . . . . . . . . . . . . . . . . . . . . . . . . . . . . . . . . . . . . . . . . . . . . . . . . . . . . . . . 3
Modify the Script . . . . . . . . . . . . . . . . . . . . . . . . . . . . . . . . . . . . . . . . . . . . . . . . . . . . . . . . . . . . . . . 4
Save a Script . . . . . . . . . . . . . . . . . . . . . . . . . . . . . . . . . . . . . . . . . . . . . . . . . . . . . . . . . . . . . . . . . . . 6
Save the Log . . . . . . . . . . . . . . . . . . . . . . . . . . . . . . . . . . . . . . . . . . . . . . . . . . . . . . . . . . . . . . . . . . . 6
Saving and Sharing Your Work . . . . . . . . . . . . . . . . . . . . . . . . . . . . . . . . . . . . . . . . . . . . . . . . . . . . . . . . 6
Capturing Scripts for Data Tables . . . . . . . . . . . . . . . . . . . . . . . . . . . . . . . . . . . . . . . . . . . . . . . . . . 7
Capturing Scripts for Analyses . . . . . . . . . . . . . . . . . . . . . . . . . . . . . . . . . . . . . . . . . . . . . . . . . . . . . 8
A General Method for Creating Scripts . . . . . . . . . . . . . . . . . . . . . . . . . . . . . . . . . . . . . . . . . . . . . . 9
Use JMP Interactively to Learn Scripting . . . . . . . . . . . . . . . . . . . . . . . . . . . . . . . . . . . . . . . . . . . . . 11
Using the Script Editor and Debugger . . . . . . . . . . . . . . . . . . . . . . . . . . . . . . . . . . . . . . . . . . . . . . . . . 12
The Script Editor . . . . . . . . . . . . . . . . . . . . . . . . . . . . . . . . . . . . . . . . . . . . . . . . . . . . . . . . . . . . . . 12
The JSL Debugger (Windows Only) . . . . . . . . . . . . . . . . . . . . . . . . . . . . . . . . . . . . . . . . . . . . . . . 18
Help with JSL . . . . . . . . . . . . . . . . . . . . . . . . . . . . . . . . . . . . . . . . . . . . . . . . . . . . . . . . . . . . . . . . . . . 20
JSL Browsers . . . . . . . . . . . . . . . . . . . . . . . . . . . . . . . . . . . . . . . . . . . . . . . . . . . . . . . . . . . . . . . . . 20
Show Commands . . . . . . . . . . . . . . . . . . . . . . . . . . . . . . . . . . . . . . . . . . . . . . . . . . . . . . . . . . . . . . 21
Show Properties . . . . . . . . . . . . . . . . . . . . . . . . . . . . . . . . . . . . . . . . . . . . . . . . . . . . . . . . . . . . . . . 21
Table of Contents
JMP Scripting Guide
2 JSL Building Blocks
Learn the Basic Components of JSL . . . . . . . . . . . . . . . . . . . . . . . . . . . . . . . . . . . . . . . . . . . . 23
First JSL Script . . . . . . . . . . . . . . . . . . . . . . . . . . . . . . . . . . . . . . . . . . . . . . . . . . . . . . . . . . . . . . . . . . . 25
The JSL Language . . . . . . . . . . . . . . . . . . . . . . . . . . . . . . . . . . . . . . . . . . . . . . . . . . . . . . . . . . . . . . . . 25
Lexical Rules of the Language . . . . . . . . . . . . . . . . . . . . . . . . . . . . . . . . . . . . . . . . . . . . . . . . . . . . . 26
Data Elements . . . . . . . . . . . . . . . . . . . . . . . . . . . . . . . . . . . . . . . . . . . . . . . . . . . . . . . . . . . . . . . . 32
Operators . . . . . . . . . . . . . . . . . . . . . . . . . . . . . . . . . . . . . . . . . . . . . . . . . . . . . . . . . . . . . . . . . . . . 33
Context: Meaning is Local . . . . . . . . . . . . . . . . . . . . . . . . . . . . . . . . . . . . . . . . . . . . . . . . . . . . . . . . . . 36
Programming Versus Scripting . . . . . . . . . . . . . . . . . . . . . . . . . . . . . . . . . . . . . . . . . . . . . . . . . . . . 36
Data Table Context . . . . . . . . . . . . . . . . . . . . . . . . . . . . . . . . . . . . . . . . . . . . . . . . . . . . . . . . . . . . 37
Scoping Operators . . . . . . . . . . . . . . . . . . . . . . . . . . . . . . . . . . . . . . . . . . . . . . . . . . . . . . . . . . . . . 38
Page 6

vi
Name Resolution . . . . . . . . . . . . . . . . . . . . . . . . . . . . . . . . . . . . . . . . . . . . . . . . . . . . . . . . . . . . . . . 38
Name-Binding Rules . . . . . . . . . . . . . . . . . . . . . . . . . . . . . . . . . . . . . . . . . . . . . . . . . . . . . . . . . . . . 38
Frequently-Asked Questions . . . . . . . . . . . . . . . . . . . . . . . . . . . . . . . . . . . . . . . . . . . . . . . . . . . . . . 41
Function Resolution Rules . . . . . . . . . . . . . . . . . . . . . . . . . . . . . . . . . . . . . . . . . . . . . . . . . . . . . . 42
Gluing Expressions Together . . . . . . . . . . . . . . . . . . . . . . . . . . . . . . . . . . . . . . . . . . . . . . . . . . . . . . . . 42
Variables . . . . . . . . . . . . . . . . . . . . . . . . . . . . . . . . . . . . . . . . . . . . . . . . . . . . . . . . . . . . . . . . . . . . . . . . 43
Wat ch . . . . . . . . . . . . . . . . . . . . . . . . . . . . . . . . . . . . . . . . . . . . . . . . . . . . . . . . . . . . . . . . . . . . . . . 43
Show Symbols, Clear Symbols, and Delete Symbols . . . . . . . . . . . . . . . . . . . . . . . . . . . . . . . . . . . 44
Locking and Unlocking Symbols . . . . . . . . . . . . . . . . . . . . . . . . . . . . . . . . . . . . . . . . . . . . . . . . . . . 45
Local . . . . . . . . . . . . . . . . . . . . . . . . . . . . . . . . . . . . . . . . . . . . . . . . . . . . . . . . . . . . . . . . . . . . . . . . 45
Datetime Operators . . . . . . . . . . . . . . . . . . . . . . . . . . . . . . . . . . . . . . . . . . . . . . . . . . . . . . . . . . . . . . . 46
Constructing Dates . . . . . . . . . . . . . . . . . . . . . . . . . . . . . . . . . . . . . . . . . . . . . . . . . . . . . . . . . . . . 46
Extracting Parts of Dates . . . . . . . . . . . . . . . . . . . . . . . . . . . . . . . . . . . . . . . . . . . . . . . . . . . . . . . . 46
Arithmetic on Dates . . . . . . . . . . . . . . . . . . . . . . . . . . . . . . . . . . . . . . . . . . . . . . . . . . . . . . . . . . . 47
Converting Datetime Units . . . . . . . . . . . . . . . . . . . . . . . . . . . . . . . . . . . . . . . . . . . . . . . . . . . . . . 47
Y2K-Ready Date Handling . . . . . . . . . . . . . . . . . . . . . . . . . . . . . . . . . . . . . . . . . . . . . . . . . . . . . . 47
Datetime Notation . . . . . . . . . . . . . . . . . . . . . . . . . . . . . . . . . . . . . . . . . . . . . . . . . . . . . . . . . . . . 48
Currency . . . . . . . . . . . . . . . . . . . . . . . . . . . . . . . . . . . . . . . . . . . . . . . . . . . . . . . . . . . . . . . . . . . . . . . . 53
Inquiry Functions . . . . . . . . . . . . . . . . . . . . . . . . . . . . . . . . . . . . . . . . . . . . . . . . . . . . . . . . . . . . . . . . . 53
Functions that communicate with users . . . . . . . . . . . . . . . . . . . . . . . . . . . . . . . . . . . . . . . . . . . . . . . . . 55
Writing to the log . . . . . . . . . . . . . . . . . . . . . . . . . . . . . . . . . . . . . . . . . . . . . . . . . . . . . . . . . . . . . . 55
Send information to the user . . . . . . . . . . . . . . . . . . . . . . . . . . . . . . . . . . . . . . . . . . . . . . . . . . . . . . 56
3 Programming Functions
Script Control . . . . . . . . . . . . . . . . . . . . . . . . . . . . . . . . . . . . . . . . . . . . . . . . . . . . . . . . . . . . . . . . . . 59
Programming Example . . . . . . . . . . . . . . . . . . . . . . . . . . . . . . . . . . . . . . . . . . . . . . . . . . . . . . . . . . . . . 61
Iterating . . . . . . . . . . . . . . . . . . . . . . . . . . . . . . . . . . . . . . . . . . . . . . . . . . . . . . . . . . . . . . . . . . . . . . . . . 61
For . . . . . . . . . . . . . . . . . . . . . . . . . . . . . . . . . . . . . . . . . . . . . . . . . . . . . . . . . . . . . . . . . . . . . . . . . 61
While . . . . . . . . . . . . . . . . . . . . . . . . . . . . . . . . . . . . . . . . . . . . . . . . . . . . . . . . . . . . . . . . . . . . . . . 63
Summation . . . . . . . . . . . . . . . . . . . . . . . . . . . . . . . . . . . . . . . . . . . . . . . . . . . . . . . . . . . . . . . . . . . 63
Product . . . . . . . . . . . . . . . . . . . . . . . . . . . . . . . . . . . . . . . . . . . . . . . . . . . . . . . . . . . . . . . . . . . . . . 63
Break and Continue . . . . . . . . . . . . . . . . . . . . . . . . . . . . . . . . . . . . . . . . . . . . . . . . . . . . . . . . . . . . 63
Conditional functions . . . . . . . . . . . . . . . . . . . . . . . . . . . . . . . . . . . . . . . . . . . . . . . . . . . . . . . . . . . . . 64
If . . . . . . . . . . . . . . . . . . . . . . . . . . . . . . . . . . . . . . . . . . . . . . . . . . . . . . . . . . . . . . . . . . . . . . . . . . 64
Match . . . . . . . . . . . . . . . . . . . . . . . . . . . . . . . . . . . . . . . . . . . . . . . . . . . . . . . . . . . . . . . . . . . . . . . 65
Choose . . . . . . . . . . . . . . . . . . . . . . . . . . . . . . . . . . . . . . . . . . . . . . . . . . . . . . . . . . . . . . . . . . . . . 66
Interpolate . . . . . . . . . . . . . . . . . . . . . . . . . . . . . . . . . . . . . . . . . . . . . . . . . . . . . . . . . . . . . . . . . . . 66
Page 7

vii
Step . . . . . . . . . . . . . . . . . . . . . . . . . . . . . . . . . . . . . . . . . . . . . . . . . . . . . . . . . . . . . . . . . . . . . . . . 67
Controlling script execution . . . . . . . . . . . . . . . . . . . . . . . . . . . . . . . . . . . . . . . . . . . . . . . . . . . . . . . . . 68
Wai t . . . . . . . . . . . . . . . . . . . . . . . . . . . . . . . . . . . . . . . . . . . . . . . . . . . . . . . . . . . . . . . . . . . . . . . . 68
Schedule . . . . . . . . . . . . . . . . . . . . . . . . . . . . . . . . . . . . . . . . . . . . . . . . . . . . . . . . . . . . . . . . . . . . . 68
JSL Data Structures . . . . . . . . . . . . . . . . . . . . . . . . . . . . . . . . . . . . . . . . . . . . . . . . . . . . . . . . . . . . . . . 68
Lists . . . . . . . . . . . . . . . . . . . . . . . . . . . . . . . . . . . . . . . . . . . . . . . . . . . . . . . . . . . . . . . . . . . . . . . . 68
Matrices . . . . . . . . . . . . . . . . . . . . . . . . . . . . . . . . . . . . . . . . . . . . . . . . . . . . . . . . . . . . . . . . . . . . . 72
Associative Arrays . . . . . . . . . . . . . . . . . . . . . . . . . . . . . . . . . . . . . . . . . . . . . . . . . . . . . . . . . . . . . . 72
Character Functions . . . . . . . . . . . . . . . . . . . . . . . . . . . . . . . . . . . . . . . . . . . . . . . . . . . . . . . . . . . . . . . 77
Concat . . . . . . . . . . . . . . . . . . . . . . . . . . . . . . . . . . . . . . . . . . . . . . . . . . . . . . . . . . . . . . . . . . . . . . 77
Munger . . . . . . . . . . . . . . . . . . . . . . . . . . . . . . . . . . . . . . . . . . . . . . . . . . . . . . . . . . . . . . . . . . . . . 78
Repeat . . . . . . . . . . . . . . . . . . . . . . . . . . . . . . . . . . . . . . . . . . . . . . . . . . . . . . . . . . . . . . . . . . . . . . 79
Sequence . . . . . . . . . . . . . . . . . . . . . . . . . . . . . . . . . . . . . . . . . . . . . . . . . . . . . . . . . . . . . . . . . . . . 80
Comparison and Logical Operators . . . . . . . . . . . . . . . . . . . . . . . . . . . . . . . . . . . . . . . . . . . . . . . . . . . 81
Missing Values . . . . . . . . . . . . . . . . . . . . . . . . . . . . . . . . . . . . . . . . . . . . . . . . . . . . . . . . . . . . . . . . 82
Missing Character Values . . . . . . . . . . . . . . . . . . . . . . . . . . . . . . . . . . . . . . . . . . . . . . . . . . . . . . . . 83
Short-Circuiting Behavior . . . . . . . . . . . . . . . . . . . . . . . . . . . . . . . . . . . . . . . . . . . . . . . . . . . . . . . 83
4 Data Tables
Create, Open, and Manipulate Data Tables . . . . . . . . . . . . . . . . . . . . . . . . . . . . . . . . . . . . . . 85
Data Table Basics . . . . . . . . . . . . . . . . . . . . . . . . . . . . . . . . . . . . . . . . . . . . . . . . . . . . . . . . . . . . . . . . . 87
Getting a Data Table Object . . . . . . . . . . . . . . . . . . . . . . . . . . . . . . . . . . . . . . . . . . . . . . . . . . . . . 87
Objects and Messages . . . . . . . . . . . . . . . . . . . . . . . . . . . . . . . . . . . . . . . . . . . . . . . . . . . . . . . . . . . 90
Messages for Data Tables . . . . . . . . . . . . . . . . . . . . . . . . . . . . . . . . . . . . . . . . . . . . . . . . . . . . . . . . . . . 95
Naming, Saving, and Printing . . . . . . . . . . . . . . . . . . . . . . . . . . . . . . . . . . . . . . . . . . . . . . . . . . . . 95
Subscribing to a Data Table . . . . . . . . . . . . . . . . . . . . . . . . . . . . . . . . . . . . . . . . . . . . . . . . . . . . . . 95
Journal and Layout . . . . . . . . . . . . . . . . . . . . . . . . . . . . . . . . . . . . . . . . . . . . . . . . . . . . . . . . . . . . . 96
Creating and Deleting Columns . . . . . . . . . . . . . . . . . . . . . . . . . . . . . . . . . . . . . . . . . . . . . . . . . . . 97
Accessing Values . . . . . . . . . . . . . . . . . . . . . . . . . . . . . . . . . . . . . . . . . . . . . . . . . . . . . . . . . . . . . . . 99
Summarize . . . . . . . . . . . . . . . . . . . . . . . . . . . . . . . . . . . . . . . . . . . . . . . . . . . . . . . . . . . . . . . . . . 103
Working with Metadata . . . . . . . . . . . . . . . . . . . . . . . . . . . . . . . . . . . . . . . . . . . . . . . . . . . . . . . . 105
Commands from the Rows menu . . . . . . . . . . . . . . . . . . . . . . . . . . . . . . . . . . . . . . . . . . . . . . . . . . 110
Commands from the Tables Menu . . . . . . . . . . . . . . . . . . . . . . . . . . . . . . . . . . . . . . . . . . . . . . . . . 116
Manipulating columns . . . . . . . . . . . . . . . . . . . . . . . . . . . . . . . . . . . . . . . . . . . . . . . . . . . . . . . . . . . . 122
Obtaining Column Names . . . . . . . . . . . . . . . . . . . . . . . . . . . . . . . . . . . . . . . . . . . . . . . . . . . . . . 122
Select Columns . . . . . . . . . . . . . . . . . . . . . . . . . . . . . . . . . . . . . . . . . . . . . . . . . . . . . . . . . . . . . . 122
Moving Columns . . . . . . . . . . . . . . . . . . . . . . . . . . . . . . . . . . . . . . . . . . . . . . . . . . . . . . . . . . . . . . 123
Page 8

viii
Data Column Objects . . . . . . . . . . . . . . . . . . . . . . . . . . . . . . . . . . . . . . . . . . . . . . . . . . . . . . . . . . 123
Setting and Getting Attributes . . . . . . . . . . . . . . . . . . . . . . . . . . . . . . . . . . . . . . . . . . . . . . . . . . . . 125
Row State Operators . . . . . . . . . . . . . . . . . . . . . . . . . . . . . . . . . . . . . . . . . . . . . . . . . . . . . . . . . . . . . . 133
What are Row States? . . . . . . . . . . . . . . . . . . . . . . . . . . . . . . . . . . . . . . . . . . . . . . . . . . . . . . . . . . 134
An Overview of Row State Operators . . . . . . . . . . . . . . . . . . . . . . . . . . . . . . . . . . . . . . . . . . . . . . 137
Each of the Row State Operators in Detail . . . . . . . . . . . . . . . . . . . . . . . . . . . . . . . . . . . . . . . . . . 142
Optional: The Numbers Behind Row States . . . . . . . . . . . . . . . . . . . . . . . . . . . . . . . . . . . . . . . . . 150
Calculations . . . . . . . . . . . . . . . . . . . . . . . . . . . . . . . . . . . . . . . . . . . . . . . . . . . . . . . . . . . . . . . . . . . . 151
Pre-Evaluated Statistics . . . . . . . . . . . . . . . . . . . . . . . . . . . . . . . . . . . . . . . . . . . . . . . . . . . . . . . . . 151
Calculator Formulas . . . . . . . . . . . . . . . . . . . . . . . . . . . . . . . . . . . . . . . . . . . . . . . . . . . . . . . . . . . 152
5 Scripting Platforms
Create, Repeat, and Modify Analyses . . . . . . . . . . . . . . . . . . . . . . . . . . . . . . . . . . . . . . . . . . . 153
Scripting Analysis Platforms . . . . . . . . . . . . . . . . . . . . . . . . . . . . . . . . . . . . . . . . . . . . . . . . . . . . . . . . 155
Launching Platforms Interactively and Obtaining the Equivalent Script . . . . . . . . . . . . . . . . . . . . . . . 155
Launch a Platform . . . . . . . . . . . . . . . . . . . . . . . . . . . . . . . . . . . . . . . . . . . . . . . . . . . . . . . . . . . . . 156
Save Script . . . . . . . . . . . . . . . . . . . . . . . . . . . . . . . . . . . . . . . . . . . . . . . . . . . . . . . . . . . . . . . . . . . 156
Make Some Changes . . . . . . . . . . . . . . . . . . . . . . . . . . . . . . . . . . . . . . . . . . . . . . . . . . . . . . . . . . . 157
Syntax for Platform Scripting . . . . . . . . . . . . . . . . . . . . . . . . . . . . . . . . . . . . . . . . . . . . . . . . . . . . 157
BY Group Reports . . . . . . . . . . . . . . . . . . . . . . . . . . . . . . . . . . . . . . . . . . . . . . . . . . . . . . . . . . . . . 158
Saving BY Group Scripts . . . . . . . . . . . . . . . . . . . . . . . . . . . . . . . . . . . . . . . . . . . . . . . . . . . . . . . . 160
Sending Script Commands to a Live Analysis . . . . . . . . . . . . . . . . . . . . . . . . . . . . . . . . . . . . . . . . . . . 160
Conventions for Commands and Arguments . . . . . . . . . . . . . . . . . . . . . . . . . . . . . . . . . . . . . . . . . 161
Sending Several Messages . . . . . . . . . . . . . . . . . . . . . . . . . . . . . . . . . . . . . . . . . . . . . . . . . . . . . . . 162
Learning the Messages an Object Responds to . . . . . . . . . . . . . . . . . . . . . . . . . . . . . . . . . . . . . . . . 162
How to Interpret the Listing from Show Properties . . . . . . . . . . . . . . . . . . . . . . . . . . . . . . . . . . . . 163
Launching Platforms . . . . . . . . . . . . . . . . . . . . . . . . . . . . . . . . . . . . . . . . . . . . . . . . . . . . . . . . . . . . . . 164
Specifying Columns . . . . . . . . . . . . . . . . . . . . . . . . . . . . . . . . . . . . . . . . . . . . . . . . . . . . . . . . . . . 164
Platform Action Command . . . . . . . . . . . . . . . . . . . . . . . . . . . . . . . . . . . . . . . . . . . . . . . . . . . . . . 164
Invisible Reports . . . . . . . . . . . . . . . . . . . . . . . . . . . . . . . . . . . . . . . . . . . . . . . . . . . . . . . . . . . . . . 165
Titles . . . . . . . . . . . . . . . . . . . . . . . . . . . . . . . . . . . . . . . . . . . . . . . . . . . . . . . . . . . . . . . . . . . . . . . 166
General Messages for Platform Windows . . . . . . . . . . . . . . . . . . . . . . . . . . . . . . . . . . . . . . . . . . . . . . . 166
Options for All Platforms . . . . . . . . . . . . . . . . . . . . . . . . . . . . . . . . . . . . . . . . . . . . . . . . . . . . . . . 169
Additional Notes . . . . . . . . . . . . . . . . . . . . . . . . . . . . . . . . . . . . . . . . . . . . . . . . . . . . . . . . . . . . . . . . .169
Spline Fits . . . . . . . . . . . . . . . . . . . . . . . . . . . . . . . . . . . . . . . . . . . . . . . . . . . . . . . . . . . . . . . . . . . 169
Fit Model Effects . . . . . . . . . . . . . . . . . . . . . . . . . . . . . . . . . . . . . . . . . . . . . . . . . . . . . . . . . . . . . . 170
Fit Model Send Command . . . . . . . . . . . . . . . . . . . . . . . . . . . . . . . . . . . . . . . . . . . . . . . . . . . . . . 171
Page 9

DOE Scripting . . . . . . . . . . . . . . . . . . . . . . . . . . . . . . . . . . . . . . . . . . . . . . . . . . . . . . . . . . . . . . . 172
Scatterplot Scripting . . . . . . . . . . . . . . . . . . . . . . . . . . . . . . . . . . . . . . . . . . . . . . . . . . . . . . . . . . . 173
6 Display Trees
Create and Use Windows . . . . . . . . . . . . . . . . . . . . . . . . . . . . . . . . . . . . . . . . . . . . . . . . . . . . . . 175
Manipulating Displays . . . . . . . . . . . . . . . . . . . . . . . . . . . . . . . . . . . . . . . . . . . . . . . . . . . . . . . . . . . . 177
Introduction to Display Boxes . . . . . . . . . . . . . . . . . . . . . . . . . . . . . . . . . . . . . . . . . . . . . . . . . . . 177
DisplayBox Object References . . . . . . . . . . . . . . . . . . . . . . . . . . . . . . . . . . . . . . . . . . . . . . . . . . . 180
Sending Messages . . . . . . . . . . . . . . . . . . . . . . . . . . . . . . . . . . . . . . . . . . . . . . . . . . . . . . . . . . . . . 182
Using the << Operator . . . . . . . . . . . . . . . . . . . . . . . . . . . . . . . . . . . . . . . . . . . . . . . . . . . . . . . . . 184
Platform Example . . . . . . . . . . . . . . . . . . . . . . . . . . . . . . . . . . . . . . . . . . . . . . . . . . . . . . . . . . . . . 185
How to Access Built-in Windows . . . . . . . . . . . . . . . . . . . . . . . . . . . . . . . . . . . . . . . . . . . . . . . . . . . . 189
Using the Pick Windows . . . . . . . . . . . . . . . . . . . . . . . . . . . . . . . . . . . . . . . . . . . . . . . . . . . . . . . 189
Constructing Display Trees . . . . . . . . . . . . . . . . . . . . . . . . . . . . . . . . . . . . . . . . . . . . . . . . . . . . . . . . 190
Basics . . . . . . . . . . . . . . . . . . . . . . . . . . . . . . . . . . . . . . . . . . . . . . . . . . . . . . . . . . . . . . . . . . . . . . 190
Updating an Existing Display . . . . . . . . . . . . . . . . . . . . . . . . . . . . . . . . . . . . . . . . . . . . . . . . . . . . 192
Controlling Text Wrap . . . . . . . . . . . . . . . . . . . . . . . . . . . . . . . . . . . . . . . . . . . . . . . . . . . . . . . . . 194
Interactive Display Elements . . . . . . . . . . . . . . . . . . . . . . . . . . . . . . . . . . . . . . . . . . . . . . . . . . . . 194
Send Messages to Constructed Displays . . . . . . . . . . . . . . . . . . . . . . . . . . . . . . . . . . . . . . . . . . . . 209
Build Your Own Displays from Scratch . . . . . . . . . . . . . . . . . . . . . . . . . . . . . . . . . . . . . . . . . . . . 209
Construct Display Boxes Containing Platforms . . . . . . . . . . . . . . . . . . . . . . . . . . . . . . . . . . . . . . 210
Construct a Custom Platform . . . . . . . . . . . . . . . . . . . . . . . . . . . . . . . . . . . . . . . . . . . . . . . . . . . 212
Sheets . . . . . . . . . . . . . . . . . . . . . . . . . . . . . . . . . . . . . . . . . . . . . . . . . . . . . . . . . . . . . . . . . . . . . . . 215
Journals . . . . . . . . . . . . . . . . . . . . . . . . . . . . . . . . . . . . . . . . . . . . . . . . . . . . . . . . . . . . . . . . . . . . 217
Picture Display Type . . . . . . . . . . . . . . . . . . . . . . . . . . . . . . . . . . . . . . . . . . . . . . . . . . . . . . . . . . 217
ix
Modal Windows . . . . . . . . . . . . . . . . . . . . . . . . . . . . . . . . . . . . . . . . . . . . . . . . . . . . . . . . . . . . . . . . . 218
Constructing Modal Windows . . . . . . . . . . . . . . . . . . . . . . . . . . . . . . . . . . . . . . . . . . . . . . . . . . . 218
General-Purpose Modal Window . . . . . . . . . . . . . . . . . . . . . . . . . . . . . . . . . . . . . . . . . . . . . . . . . 219
Data Column Dialog Boxes . . . . . . . . . . . . . . . . . . . . . . . . . . . . . . . . . . . . . . . . . . . . . . . . . . . . . 222
Constructing Dialogs and Column Dialogs . . . . . . . . . . . . . . . . . . . . . . . . . . . . . . . . . . . . . . . . . 225
Scripting the Script Editor . . . . . . . . . . . . . . . . . . . . . . . . . . . . . . . . . . . . . . . . . . . . . . . . . . . . . . . . . 228
Syntax Reference . . . . . . . . . . . . . . . . . . . . . . . . . . . . . . . . . . . . . . . . . . . . . . . . . . . . . . . . . . . . . . . . 229
7 Scripting Graphs
Create and Edit 2-Dimensional Plots . . . . . . . . . . . . . . . . . . . . . . . . . . . . . . . . . . . . . . . . . . . 237
Adding Scripts to Graphs . . . . . . . . . . . . . . . . . . . . . . . . . . . . . . . . . . . . . . . . . . . . . . . . . . . . . . . . . . 239
Ordering Graphics Elements Using JSL . . . . . . . . . . . . . . . . . . . . . . . . . . . . . . . . . . . . . . . . . . . . 240
Adding a Legend to a Graph . . . . . . . . . . . . . . . . . . . . . . . . . . . . . . . . . . . . . . . . . . . . . . . . . . . . . . . 240
Page 10

x
Creating New Graphs From Scratch . . . . . . . . . . . . . . . . . . . . . . . . . . . . . . . . . . . . . . . . . . . . . . . . . . 241
Making Changes to Graphs . . . . . . . . . . . . . . . . . . . . . . . . . . . . . . . . . . . . . . . . . . . . . . . . . . . . . . 242
Graphing Elements . . . . . . . . . . . . . . . . . . . . . . . . . . . . . . . . . . . . . . . . . . . . . . . . . . . . . . . . . . . . . . . 243
Plotting Functions . . . . . . . . . . . . . . . . . . . . . . . . . . . . . . . . . . . . . . . . . . . . . . . . . . . . . . . . . . . . . 243
Getting the Properties of a Graphics Frame . . . . . . . . . . . . . . . . . . . . . . . . . . . . . . . . . . . . . . . . . 249
Adding a Legend . . . . . . . . . . . . . . . . . . . . . . . . . . . . . . . . . . . . . . . . . . . . . . . . . . . . . . . . . . . . . 249
Drawing Lines, Arrows, Points, and Shapes . . . . . . . . . . . . . . . . . . . . . . . . . . . . . . . . . . . . . . . . . . . . 249
Lines . . . . . . . . . . . . . . . . . . . . . . . . . . . . . . . . . . . . . . . . . . . . . . . . . . . . . . . . . . . . . . . . . . . . . . 249
Arrows . . . . . . . . . . . . . . . . . . . . . . . . . . . . . . . . . . . . . . . . . . . . . . . . . . . . . . . . . . . . . . . . . . . . . . 251
Markers . . . . . . . . . . . . . . . . . . . . . . . . . . . . . . . . . . . . . . . . . . . . . . . . . . . . . . . . . . . . . . . . . . . . . 252
Pies and Arcs . . . . . . . . . . . . . . . . . . . . . . . . . . . . . . . . . . . . . . . . . . . . . . . . . . . . . . . . . . . . . . . . .254
Regular Shapes: Circles, Rectangles, and Ovals . . . . . . . . . . . . . . . . . . . . . . . . . . . . . . . . . . . . . . . 255
Irregular Shapes: Polygons and Contours . . . . . . . . . . . . . . . . . . . . . . . . . . . . . . . . . . . . . . . . . . . . 258
Adding text . . . . . . . . . . . . . . . . . . . . . . . . . . . . . . . . . . . . . . . . . . . . . . . . . . . . . . . . . . . . . . . . . 260
Colors . . . . . . . . . . . . . . . . . . . . . . . . . . . . . . . . . . . . . . . . . . . . . . . . . . . . . . . . . . . . . . . . . . . . . . 261
Transparency . . . . . . . . . . . . . . . . . . . . . . . . . . . . . . . . . . . . . . . . . . . . . . . . . . . . . . . . . . . . . . . . .263
Fill patterns . . . . . . . . . . . . . . . . . . . . . . . . . . . . . . . . . . . . . . . . . . . . . . . . . . . . . . . . . . . . . . . . . 264
Line types . . . . . . . . . . . . . . . . . . . . . . . . . . . . . . . . . . . . . . . . . . . . . . . . . . . . . . . . . . . . . . . . . . 264
Drawing With Pixels . . . . . . . . . . . . . . . . . . . . . . . . . . . . . . . . . . . . . . . . . . . . . . . . . . . . . . . . . . . 265
Interactive graphs . . . . . . . . . . . . . . . . . . . . . . . . . . . . . . . . . . . . . . . . . . . . . . . . . . . . . . . . . . . . . . . 266
Handle . . . . . . . . . . . . . . . . . . . . . . . . . . . . . . . . . . . . . . . . . . . . . . . . . . . . . . . . . . . . . . . . . . . . 266
MouseTrap . . . . . . . . . . . . . . . . . . . . . . . . . . . . . . . . . . . . . . . . . . . . . . . . . . . . . . . . . . . . . . . . . 269
Drag Functions . . . . . . . . . . . . . . . . . . . . . . . . . . . . . . . . . . . . . . . . . . . . . . . . . . . . . . . . . . . . . . 270
Troubleshooting . . . . . . . . . . . . . . . . . . . . . . . . . . . . . . . . . . . . . . . . . . . . . . . . . . . . . . . . . . . . . . 272
8 Three-Dimensional Scenes
Scripting in Three Dimensions . . . . . . . . . . . . . . . . . . . . . . . . . . . . . . . . . . . . . . . . . . . . . . . . . 273
About JSL 3-D Scenes . . . . . . . . . . . . . . . . . . . . . . . . . . . . . . . . . . . . . . . . . . . . . . . . . . . . . . . . . . . . . 275
JSL 3-D Scene Boxes . . . . . . . . . . . . . . . . . . . . . . . . . . . . . . . . . . . . . . . . . . . . . . . . . . . . . . . . . . . . . . 275
Setting the Viewing Space . . . . . . . . . . . . . . . . . . . . . . . . . . . . . . . . . . . . . . . . . . . . . . . . . . . . . . . . . . 278
Setting Up a Perspective Scene . . . . . . . . . . . . . . . . . . . . . . . . . . . . . . . . . . . . . . . . . . . . . . . . . . . 279
Setting up an Orthographic Scene . . . . . . . . . . . . . . . . . . . . . . . . . . . . . . . . . . . . . . . . . . . . . . . . 280
Changing the View . . . . . . . . . . . . . . . . . . . . . . . . . . . . . . . . . . . . . . . . . . . . . . . . . . . . . . . . . . . . . . . 281
The Translate Command . . . . . . . . . . . . . . . . . . . . . . . . . . . . . . . . . . . . . . . . . . . . . . . . . . . . . . . . 281
The Rotate Command . . . . . . . . . . . . . . . . . . . . . . . . . . . . . . . . . . . . . . . . . . . . . . . . . . . . . . . . . 281
The Look At Command . . . . . . . . . . . . . . . . . . . . . . . . . . . . . . . . . . . . . . . . . . . . . . . . . . . . . . . . 283
The ArcBall . . . . . . . . . . . . . . . . . . . . . . . . . . . . . . . . . . . . . . . . . . . . . . . . . . . . . . . . . . . . . . . . . . 284
Page 11

Graphics Primitives . . . . . . . . . . . . . . . . . . . . . . . . . . . . . . . . . . . . . . . . . . . . . . . . . . . . . . . . . . . . . . 285
Primitives Example . . . . . . . . . . . . . . . . . . . . . . . . . . . . . . . . . . . . . . . . . . . . . . . . . . . . . . . . . . . . 287
Controlling the Appearance of Primitives . . . . . . . . . . . . . . . . . . . . . . . . . . . . . . . . . . . . . . . . . . . 288
Other uses of Begin and End . . . . . . . . . . . . . . . . . . . . . . . . . . . . . . . . . . . . . . . . . . . . . . . . . . . . 294
Drawing Spheres, Cylinders, and Disks . . . . . . . . . . . . . . . . . . . . . . . . . . . . . . . . . . . . . . . . . . . . . . . 294
Construction . . . . . . . . . . . . . . . . . . . . . . . . . . . . . . . . . . . . . . . . . . . . . . . . . . . . . . . . . . . . . . . . 294
Lighting . . . . . . . . . . . . . . . . . . . . . . . . . . . . . . . . . . . . . . . . . . . . . . . . . . . . . . . . . . . . . . . . . . . . 295
Drawing Text . . . . . . . . . . . . . . . . . . . . . . . . . . . . . . . . . . . . . . . . . . . . . . . . . . . . . . . . . . . . . . . . . . . 295
Using Text with Rotate and Translate . . . . . . . . . . . . . . . . . . . . . . . . . . . . . . . . . . . . . . . . . . . . . . 296
Using the Matrix Stack . . . . . . . . . . . . . . . . . . . . . . . . . . . . . . . . . . . . . . . . . . . . . . . . . . . . . . . . . . . . 297
Lighting and Normals . . . . . . . . . . . . . . . . . . . . . . . . . . . . . . . . . . . . . . . . . . . . . . . . . . . . . . . . . . . . 300
Creating Light Sources . . . . . . . . . . . . . . . . . . . . . . . . . . . . . . . . . . . . . . . . . . . . . . . . . . . . . . . . . 300
Lighting Models . . . . . . . . . . . . . . . . . . . . . . . . . . . . . . . . . . . . . . . . . . . . . . . . . . . . . . . . . . . . . . 302
Normal Vectors . . . . . . . . . . . . . . . . . . . . . . . . . . . . . . . . . . . . . . . . . . . . . . . . . . . . . . . . . . . . . . 302
Shading Model . . . . . . . . . . . . . . . . . . . . . . . . . . . . . . . . . . . . . . . . . . . . . . . . . . . . . . . . . . . . . . . 303
Material Properties . . . . . . . . . . . . . . . . . . . . . . . . . . . . . . . . . . . . . . . . . . . . . . . . . . . . . . . . . . . . 304
Alpha Blending . . . . . . . . . . . . . . . . . . . . . . . . . . . . . . . . . . . . . . . . . . . . . . . . . . . . . . . . . . . . . . 304
Fog . . . . . . . . . . . . . . . . . . . . . . . . . . . . . . . . . . . . . . . . . . . . . . . . . . . . . . . . . . . . . . . . . . . . . . . . 305
Example . . . . . . . . . . . . . . . . . . . . . . . . . . . . . . . . . . . . . . . . . . . . . . . . . . . . . . . . . . . . . . . . . . . . 305
xi
Bézier Curves . . . . . . . . . . . . . . . . . . . . . . . . . . . . . . . . . . . . . . . . . . . . . . . . . . . . . . . . . . . . . . . . . . . 306
One-Dimensional Evaluators . . . . . . . . . . . . . . . . . . . . . . . . . . . . . . . . . . . . . . . . . . . . . . . . . . . . 306
Two-Dimensional Evaluators . . . . . . . . . . . . . . . . . . . . . . . . . . . . . . . . . . . . . . . . . . . . . . . . . . . . 309
Using the mouse . . . . . . . . . . . . . . . . . . . . . . . . . . . . . . . . . . . . . . . . . . . . . . . . . . . . . . . . . . . . . . 309
Parameters . . . . . . . . . . . . . . . . . . . . . . . . . . . . . . . . . . . . . . . . . . . . . . . . . . . . . . . . . . . . . . . . . . . . . . 311
9 Matrices
Matrix Algebra in JMP . . . . . . . . . . . . . . . . . . . . . . . . . . . . . . . . . . . . . . . . . . . . . . . . . . . . . . . . . 313
Basics . . . . . . . . . . . . . . . . . . . . . . . . . . . . . . . . . . . . . . . . . . . . . . . . . . . . . . . . . . . . . . . . . . . . . . . . . . 315
Definitions . . . . . . . . . . . . . . . . . . . . . . . . . . . . . . . . . . . . . . . . . . . . . . . . . . . . . . . . . . . . . . . . . . . 315
Constructing Matrices . . . . . . . . . . . . . . . . . . . . . . . . . . . . . . . . . . . . . . . . . . . . . . . . . . . . . . . . . . 315
Numeric Operators . . . . . . . . . . . . . . . . . . . . . . . . . . . . . . . . . . . . . . . . . . . . . . . . . . . . . . . . . . . 317
Manipulating Values . . . . . . . . . . . . . . . . . . . . . . . . . . . . . . . . . . . . . . . . . . . . . . . . . . . . . . . . . . 319
Subscripts . . . . . . . . . . . . . . . . . . . . . . . . . . . . . . . . . . . . . . . . . . . . . . . . . . . . . . . . . . . . . . . . . . . . 321
Matrix Operators . . . . . . . . . . . . . . . . . . . . . . . . . . . . . . . . . . . . . . . . . . . . . . . . . . . . . . . . . . . . . . . . 324
Solving Linear Systems . . . . . . . . . . . . . . . . . . . . . . . . . . . . . . . . . . . . . . . . . . . . . . . . . . . . . . . . . 325
Additional Construction Functions . . . . . . . . . . . . . . . . . . . . . . . . . . . . . . . . . . . . . . . . . . . . . . . 327
Decompositions and Normalizations . . . . . . . . . . . . . . . . . . . . . . . . . . . . . . . . . . . . . . . . . . . . . . 329
Page 12

xii
Build Your Own Matrix Operators . . . . . . . . . . . . . . . . . . . . . . . . . . . . . . . . . . . . . . . . . . . . . . . . 333
Matrices With the Rest of JMP . . . . . . . . . . . . . . . . . . . . . . . . . . . . . . . . . . . . . . . . . . . . . . . . . . . . . . 334
Matrices and Data Tables . . . . . . . . . . . . . . . . . . . . . . . . . . . . . . . . . . . . . . . . . . . . . . . . . . . . . . . 334
Matrices and Reports . . . . . . . . . . . . . . . . . . . . . . . . . . . . . . . . . . . . . . . . . . . . . . . . . . . . . . . . . . . 335
Statistical Examples . . . . . . . . . . . . . . . . . . . . . . . . . . . . . . . . . . . . . . . . . . . . . . . . . . . . . . . . . . . . . . . 335
Regression Example . . . . . . . . . . . . . . . . . . . . . . . . . . . . . . . . . . . . . . . . . . . . . . . . . . . . . . . . . . . . 335
ANOVA Example . . . . . . . . . . . . . . . . . . . . . . . . . . . . . . . . . . . . . . . . . . . . . . . . . . . . . . . . . . . . . 336
10 Extending JMP
Add-Ins, External Data Sources and Analytical Tools, and Automation . . . . . . . . . . . . 341
Real-Time Data Capture . . . . . . . . . . . . . . . . . . . . . . . . . . . . . . . . . . . . . . . . . . . . . . . . . . . . . . . . . . . 343
Create a Datafeed Object . . . . . . . . . . . . . . . . . . . . . . . . . . . . . . . . . . . . . . . . . . . . . . . . . . . . . . . . 343
Manage a Datafeed with Messages . . . . . . . . . . . . . . . . . . . . . . . . . . . . . . . . . . . . . . . . . . . . . . . . . 344
Examples of Datafeed . . . . . . . . . . . . . . . . . . . . . . . . . . . . . . . . . . . . . . . . . . . . . . . . . . . . . . . . . . 346
Dynamic Link Libraries (DLLs) . . . . . . . . . . . . . . . . . . . . . . . . . . . . . . . . . . . . . . . . . . . . . . . . . . . . . 349
Using Sockets in JSL . . . . . . . . . . . . . . . . . . . . . . . . . . . . . . . . . . . . . . . . . . . . . . . . . . . . . . . . . . . . . . 351
Socket-Related Commands . . . . . . . . . . . . . . . . . . . . . . . . . . . . . . . . . . . . . . . . . . . . . . . . . . . . . . 352
Messages for Sockets . . . . . . . . . . . . . . . . . . . . . . . . . . . . . . . . . . . . . . . . . . . . . . . . . . . . . . . . . . . 352
Database Access (Windows Only) . . . . . . . . . . . . . . . . . . . . . . . . . . . . . . . . . . . . . . . . . . . . . . . . . . . . 354
Working with SAS . . . . . . . . . . . . . . . . . . . . . . . . . . . . . . . . . . . . . . . . . . . . . . . . . . . . . . . . . . . . . . . . 355
Make a SAS DATA Step . . . . . . . . . . . . . . . . . . . . . . . . . . . . . . . . . . . . . . . . . . . . . . . . . . . . . . . . 355
SAS Variable Names . . . . . . . . . . . . . . . . . . . . . . . . . . . . . . . . . . . . . . . . . . . . . . . . . . . . . . . . . . . 356
Connect to a SAS Metadata Server . . . . . . . . . . . . . . . . . . . . . . . . . . . . . . . . . . . . . . . . . . . . . . . . 356
Preferences . . . . . . . . . . . . . . . . . . . . . . . . . . . . . . . . . . . . . . . . . . . . . . . . . . . . . . . . . . . . . . . . . . . 358
Sample Scripts . . . . . . . . . . . . . . . . . . . . . . . . . . . . . . . . . . . . . . . . . . . . . . . . . . . . . . . . . . . . . . . . 358
Working with R . . . . . . . . . . . . . . . . . . . . . . . . . . . . . . . . . . . . . . . . . . . . . . . . . . . . . . . . . . . . . . . . . . 359
Installing R . . . . . . . . . . . . . . . . . . . . . . . . . . . . . . . . . . . . . . . . . . . . . . . . . . . . . . . . . . . . . . . . . 360
JMP to R Interfaces . . . . . . . . . . . . . . . . . . . . . . . . . . . . . . . . . . . . . . . . . . . . . . . . . . . . . . . . . . . . 361
R JSL Scriptable Object Interfaces . . . . . . . . . . . . . . . . . . . . . . . . . . . . . . . . . . . . . . . . . . . . . . . . . 361
Conversion Between JMP Data Types and R Data Types . . . . . . . . . . . . . . . . . . . . . . . . . . . . . . . 361
Troubleshooting . . . . . . . . . . . . . . . . . . . . . . . . . . . . . . . . . . . . . . . . . . . . . . . . . . . . . . . . . . . . . . 363
Examples . . . . . . . . . . . . . . . . . . . . . . . . . . . . . . . . . . . . . . . . . . . . . . . . . . . . . . . . . . . . . . . . . . . . 364
Working with Excel . . . . . . . . . . . . . . . . . . . . . . . . . . . . . . . . . . . . . . . . . . . . . . . . . . . . . . . . . . . . . . . 366
JMP Add-Ins . . . . . . . . . . . . . . . . . . . . . . . . . . . . . . . . . . . . . . . . . . . . . . . . . . . . . . . . . . . . . . . . . . . . 366
Workflow for Creating an Add-In . . . . . . . . . . . . . . . . . . . . . . . . . . . . . . . . . . . . . . . . . . . . . . . . . 367
More About Installation and Registration . . . . . . . . . . . . . . . . . . . . . . . . . . . . . . . . . . . . . . . . . . . 369
Page 13

Addin.def File Specification . . . . . . . . . . . . . . . . . . . . . . . . . . . . . . . . . . . . . . . . . . . . . . . . . . . . . 371
Example JMP Add-In . . . . . . . . . . . . . . . . . . . . . . . . . . . . . . . . . . . . . . . . . . . . . . . . . . . . . . . . . . 372
OLE Automation . . . . . . . . . . . . . . . . . . . . . . . . . . . . . . . . . . . . . . . . . . . . . . . . . . . . . . . . . . . . . . . . 373
Automating JMP through Visual Basic . . . . . . . . . . . . . . . . . . . . . . . . . . . . . . . . . . . . . . . . . . . . . 373
Automating JMP through Visual C++ . . . . . . . . . . . . . . . . . . . . . . . . . . . . . . . . . . . . . . . . . . . . . . 381
11 Advanced Concepts
Complex Scripting Techniques And Additional Functions . . . . . . . . . . . . . . . . . . . . . . . . 385
Advanced Programming Concepts . . . . . . . . . . . . . . . . . . . . . . . . . . . . . . . . . . . . . . . . . . . . . . . . . . . 387
Throwing and Catching Exceptions . . . . . . . . . . . . . . . . . . . . . . . . . . . . . . . . . . . . . . . . . . . . . . . 387
Functions . . . . . . . . . . . . . . . . . . . . . . . . . . . . . . . . . . . . . . . . . . . . . . . . . . . . . . . . . . . . . . . . . . . 388
Recursion . . . . . . . . . . . . . . . . . . . . . . . . . . . . . . . . . . . . . . . . . . . . . . . . . . . . . . . . . . . . . . . . . . . 389
Includes . . . . . . . . . . . . . . . . . . . . . . . . . . . . . . . . . . . . . . . . . . . . . . . . . . . . . . . . . . . . . . . . . . . . 390
Loading and Saving Text Files . . . . . . . . . . . . . . . . . . . . . . . . . . . . . . . . . . . . . . . . . . . . . . . . . . . 390
Advanced Scoping and Namespaces . . . . . . . . . . . . . . . . . . . . . . . . . . . . . . . . . . . . . . . . . . . . . . . . . . 390
Names Default To Here . . . . . . . . . . . . . . . . . . . . . . . . . . . . . . . . . . . . . . . . . . . . . . . . . . . . . . . . 390
Scoped Names . . . . . . . . . . . . . . . . . . . . . . . . . . . . . . . . . . . . . . . . . . . . . . . . . . . . . . . . . . . . . . . 393
Namespaces . . . . . . . . . . . . . . . . . . . . . . . . . . . . . . . . . . . . . . . . . . . . . . . . . . . . . . . . . . . . . . . . . 396
Referencing Namespaces and Scopes . . . . . . . . . . . . . . . . . . . . . . . . . . . . . . . . . . . . . . . . . . . . . . 401
Resolving Named Variable References . . . . . . . . . . . . . . . . . . . . . . . . . . . . . . . . . . . . . . . . . . . . . 403
Best Practices for Advanced Scripting . . . . . . . . . . . . . . . . . . . . . . . . . . . . . . . . . . . . . . . . . . . . . . 405
xiii
Scripting BY Groups . . . . . . . . . . . . . . . . . . . . . . . . . . . . . . . . . . . . . . . . . . . . . . . . . . . . . . . . . . . . . 405
Lists and Expressions . . . . . . . . . . . . . . . . . . . . . . . . . . . . . . . . . . . . . . . . . . . . . . . . . . . . . . . . . . . . . 406
Stored expressions . . . . . . . . . . . . . . . . . . . . . . . . . . . . . . . . . . . . . . . . . . . . . . . . . . . . . . . . . . . . 406
Macros . . . . . . . . . . . . . . . . . . . . . . . . . . . . . . . . . . . . . . . . . . . . . . . . . . . . . . . . . . . . . . . . . . . . . 414
Manipulating lists . . . . . . . . . . . . . . . . . . . . . . . . . . . . . . . . . . . . . . . . . . . . . . . . . . . . . . . . . . . . 414
Manipulating expressions . . . . . . . . . . . . . . . . . . . . . . . . . . . . . . . . . . . . . . . . . . . . . . . . . . . . . . . 416
Encryption . . . . . . . . . . . . . . . . . . . . . . . . . . . . . . . . . . . . . . . . . . . . . . . . . . . . . . . . . . . . . . . . . . . . . 420
Encryption and Global Variables . . . . . . . . . . . . . . . . . . . . . . . . . . . . . . . . . . . . . . . . . . . . . . . . . 421
Encrypting Scripts in Data Tables . . . . . . . . . . . . . . . . . . . . . . . . . . . . . . . . . . . . . . . . . . . . . . . . 421
XML Parsing Operations . . . . . . . . . . . . . . . . . . . . . . . . . . . . . . . . . . . . . . . . . . . . . . . . . . . . . . . . . . 422
Example . . . . . . . . . . . . . . . . . . . . . . . . . . . . . . . . . . . . . . . . . . . . . . . . . . . . . . . . . . . . . . . . . . . . 422
Pattern Matching and Regular Expressions . . . . . . . . . . . . . . . . . . . . . . . . . . . . . . . . . . . . . . . . . . . . . 424
Patterns and Case . . . . . . . . . . . . . . . . . . . . . . . . . . . . . . . . . . . . . . . . . . . . . . . . . . . . . . . . . . . . . 426
Regular Expressions . . . . . . . . . . . . . . . . . . . . . . . . . . . . . . . . . . . . . . . . . . . . . . . . . . . . . . . . . . . 427
Projects . . . . . . . . . . . . . . . . . . . . . . . . . . . . . . . . . . . . . . . . . . . . . . . . . . . . . . . . . . . . . . . . . . . . . . . 427
Page 14

xiv
Hexadecimal and BLOB Functions . . . . . . . . . . . . . . . . . . . . . . . . . . . . . . . . . . . . . . . . . . . . . . . . . . . 430
Web . . . . . . . . . . . . . . . . . . . . . . . . . . . . . . . . . . . . . . . . . . . . . . . . . . . . . . . . . . . . . . . . . . . . . . . . . . . 432
Scheduling Actions . . . . . . . . . . . . . . . . . . . . . . . . . . . . . . . . . . . . . . . . . . . . . . . . . . . . . . . . . . . . . . . 433
Additional Numeric Operators . . . . . . . . . . . . . . . . . . . . . . . . . . . . . . . . . . . . . . . . . . . . . . . . . . . . . . 434
Derivatives . . . . . . . . . . . . . . . . . . . . . . . . . . . . . . . . . . . . . . . . . . . . . . . . . . . . . . . . . . . . . . . . . . 434
Algebraic Manipulations . . . . . . . . . . . . . . . . . . . . . . . . . . . . . . . . . . . . . . . . . . . . . . . . . . . . . . . . 436
Maximize and Minimize . . . . . . . . . . . . . . . . . . . . . . . . . . . . . . . . . . . . . . . . . . . . . . . . . . . . . . . . 437
A JSL Syntax Reference
Summary of Operators, Functions, And Messages . . . . . . . . . . . . . . . . . . . . . . . . . . . . . . . 439
Arithmetic Functions . . . . . . . . . . . . . . . . . . . . . . . . . . . . . . . . . . . . . . . . . . . . . . . . . . . . . . . . . . . . . . 441
Assignment Functions . . . . . . . . . . . . . . . . . . . . . . . . . . . . . . . . . . . . . . . . . . . . . . . . . . . . . . . . . . . . . 443
Character Functions . . . . . . . . . . . . . . . . . . . . . . . . . . . . . . . . . . . . . . . . . . . . . . . . . . . . . . . . . . . . . 447
Character Pattern Functions . . . . . . . . . . . . . . . . . . . . . . . . . . . . . . . . . . . . . . . . . . . . . . . . . . . . . . . . 458
Comments . . . . . . . . . . . . . . . . . . . . . . . . . . . . . . . . . . . . . . . . . . . . . . . . . . . . . . . . . . . . . . . . . . . . 466
Comparison Functions . . . . . . . . . . . . . . . . . . . . . . . . . . . . . . . . . . . . . . . . . . . . . . . . . . . . . . . . . . . 467
Conditional and Logical Functions . . . . . . . . . . . . . . . . . . . . . . . . . . . . . . . . . . . . . . . . . . . . . . . . . . 472
Constants . . . . . . . . . . . . . . . . . . . . . . . . . . . . . . . . . . . . . . . . . . . . . . . . . . . . . . . . . . . . . . . . . . . . . 477
Date and Time Functions . . . . . . . . . . . . . . . . . . . . . . . . . . . . . . . . . . . . . . . . . . . . . . . . . . . . . . . . . 477
Discrete Probability Functions . . . . . . . . . . . . . . . . . . . . . . . . . . . . . . . . . . . . . . . . . . . . . . . . . . . . . . . 483
Display . . . . . . . . . . . . . . . . . . . . . . . . . . . . . . . . . . . . . . . . . . . . . . . . . . . . . . . . . . . . . . . . . . . . . . . 486
Financial Functions . . . . . . . . . . . . . . . . . . . . . . . . . . . . . . . . . . . . . . . . . . . . . . . . . . . . . . . . . . . . . . 497
Graphic Functions . . . . . . . . . . . . . . . . . . . . . . . . . . . . . . . . . . . . . . . . . . . . . . . . . . . . . . . . . . . . . . . . 502
Matrix Functions . . . . . . . . . . . . . . . . . . . . . . . . . . . . . . . . . . . . . . . . . . . . . . . . . . . . . . . . . . . . . . . . .514
Numeric Functions . . . . . . . . . . . . . . . . . . . . . . . . . . . . . . . . . . . . . . . . . . . . . . . . . . . . . . . . . . . . . . . 528
Probability Functions . . . . . . . . . . . . . . . . . . . . . . . . . . . . . . . . . . . . . . . . . . . . . . . . . . . . . . . . . . . . . 529
R Integration Functions . . . . . . . . . . . . . . . . . . . . . . . . . . . . . . . . . . . . . . . . . . . . . . . . . . . . . . . . . . . 541
Random Functions . . . . . . . . . . . . . . . . . . . . . . . . . . . . . . . . . . . . . . . . . . . . . . . . . . . . . . . . . . . . . . . 546
Row Functions . . . . . . . . . . . . . . . . . . . . . . . . . . . . . . . . . . . . . . . . . . . . . . . . . . . . . . . . . . . . . . . . . . 550
Row State Functions . . . . . . . . . . . . . . . . . . . . . . . . . . . . . . . . . . . . . . . . . . . . . . . . . . . . . . . . . . . . . . 551
SAS Integration Functions . . . . . . . . . . . . . . . . . . . . . . . . . . . . . . . . . . . . . . . . . . . . . . . . . . . . . . . . . . 554
Statistical Functions . . . . . . . . . . . . . . . . . . . . . . . . . . . . . . . . . . . . . . . . . . . . . . . . . . . . . . . . . . . . . . . 568
Transcendental Functions . . . . . . . . . . . . . . . . . . . . . . . . . . . . . . . . . . . . . . . . . . . . . . . . . . . . . . . . . . 572
Page 15

Trigonometric Functions . . . . . . . . . . . . . . . . . . . . . . . . . . . . . . . . . . . . . . . . . . . . . . . . . . . . . . . . . . 575
Utility Functions . . . . . . . . . . . . . . . . . . . . . . . . . . . . . . . . . . . . . . . . . . . . . . . . . . . . . . . . . . . . . . . . 578
Platform Scripting Notes . . . . . . . . . . . . . . . . . . . . . . . . . . . . . . . . . . . . . . . . . . . . . . . . . . . . . . . . . . 623
Scripting Options for All Platforms . . . . . . . . . . . . . . . . . . . . . . . . . . . . . . . . . . . . . . . . . . . . . . . 623
Individual Platform Options . . . . . . . . . . . . . . . . . . . . . . . . . . . . . . . . . . . . . . . . . . . . . . . . . . . . 623
Index
Syntax Reference . . . . . . . . . . . . . . . . . . . . . . . . . . . . . . . . . . . . . . . . . . . . . . . . . . . . . . . . . . . . . 629
BMessages
Summary of Object Messages . . . . . . . . . . . . . . . . . . . . . . . . . . . . . . . . . . . . . . . . . . . . . . . . . 639
Associative Arrays . . . . . . . . . . . . . . . . . . . . . . . . . . . . . . . . . . . . . . . . . . . . . . . . . . . . . . . . . . . . . . . . 641
Data Tables . . . . . . . . . . . . . . . . . . . . . . . . . . . . . . . . . . . . . . . . . . . . . . . . . . . . . . . . . . . . . . . . . . . . 642
Columns . . . . . . . . . . . . . . . . . . . . . . . . . . . . . . . . . . . . . . . . . . . . . . . . . . . . . . . . . . . . . . . . . . . 653
Rows . . . . . . . . . . . . . . . . . . . . . . . . . . . . . . . . . . . . . . . . . . . . . . . . . . . . . . . . . . . . . . . . . . . . . . 657
Data Filter . . . . . . . . . . . . . . . . . . . . . . . . . . . . . . . . . . . . . . . . . . . . . . . . . . . . . . . . . . . . . . . . . . 658
Databases . . . . . . . . . . . . . . . . . . . . . . . . . . . . . . . . . . . . . . . . . . . . . . . . . . . . . . . . . . . . . . . . . . . . . . 660
Datafeed . . . . . . . . . . . . . . . . . . . . . . . . . . . . . . . . . . . . . . . . . . . . . . . . . . . . . . . . . . . . . . . . . . . . . . . 660
xv
Display Boxes . . . . . . . . . . . . . . . . . . . . . . . . . . . . . . . . . . . . . . . . . . . . . . . . . . . . . . . . . . . . . . . . . . . 661
Windows . . . . . . . . . . . . . . . . . . . . . . . . . . . . . . . . . . . . . . . . . . . . . . . . . . . . . . . . . . . . . . . . . . . 661
All Display Boxes . . . . . . . . . . . . . . . . . . . . . . . . . . . . . . . . . . . . . . . . . . . . . . . . . . . . . . . . . . . . . 663
Outline Boxes . . . . . . . . . . . . . . . . . . . . . . . . . . . . . . . . . . . . . . . . . . . . . . . . . . . . . . . . . . . . . . . 667
Frame Boxes . . . . . . . . . . . . . . . . . . . . . . . . . . . . . . . . . . . . . . . . . . . . . . . . . . . . . . . . . . . . . . . . . 667
Table Boxes . . . . . . . . . . . . . . . . . . . . . . . . . . . . . . . . . . . . . . . . . . . . . . . . . . . . . . . . . . . . . . . . . 668
Tab Boxes . . . . . . . . . . . . . . . . . . . . . . . . . . . . . . . . . . . . . . . . . . . . . . . . . . . . . . . . . . . . . . . . . . . 669
Tex t B oxe s . . . . . . . . . . . . . . . . . . . . . . . . . . . . . . . . . . . . . . . . . . . . . . . . . . . . . . . . . . . . . . . . . . 669
Axis Boxes . . . . . . . . . . . . . . . . . . . . . . . . . . . . . . . . . . . . . . . . . . . . . . . . . . . . . . . . . . . . . . . . . . 670
Number Col Boxes . . . . . . . . . . . . . . . . . . . . . . . . . . . . . . . . . . . . . . . . . . . . . . . . . . . . . . . . . . . . 672
Slider Boxes . . . . . . . . . . . . . . . . . . . . . . . . . . . . . . . . . . . . . . . . . . . . . . . . . . . . . . . . . . . . . . . . . 673
String Col Boxes . . . . . . . . . . . . . . . . . . . . . . . . . . . . . . . . . . . . . . . . . . . . . . . . . . . . . . . . . . . . . . 673
Matrix Boxes . . . . . . . . . . . . . . . . . . . . . . . . . . . . . . . . . . . . . . . . . . . . . . . . . . . . . . . . . . . . . . . .674
Nom Axis Boxes . . . . . . . . . . . . . . . . . . . . . . . . . . . . . . . . . . . . . . . . . . . . . . . . . . . . . . . . . . . . . . 674
Panel Boxes . . . . . . . . . . . . . . . . . . . . . . . . . . . . . . . . . . . . . . . . . . . . . . . . . . . . . . . . . . . . . . . . . 674
Border Boxes . . . . . . . . . . . . . . . . . . . . . . . . . . . . . . . . . . . . . . . . . . . . . . . . . . . . . . . . . . . . . . . .674
Dynamic Link Libraries (DLLs) . . . . . . . . . . . . . . . . . . . . . . . . . . . . . . . . . . . . . . . . . . . . . . . . . . . . . 675
Platforms . . . . . . . . . . . . . . . . . . . . . . . . . . . . . . . . . . . . . . . . . . . . . . . . . . . . . . . . . . . . . . . . . . . . . . 676
R Integration Messages . . . . . . . . . . . . . . . . . . . . . . . . . . . . . . . . . . . . . . . . . . . . . . . . . . . . . . . . . . . . 679
Page 16

xvi
SAS Integration Messages . . . . . . . . . . . . . . . . . . . . . . . . . . . . . . . . . . . . . . . . . . . . . . . . . . . . . . . . . . 683
Metadata Server Objects . . . . . . . . . . . . . . . . . . . . . . . . . . . . . . . . . . . . . . . . . . . . . . . . . . . . . . . . 683
SAS Server Objects . . . . . . . . . . . . . . . . . . . . . . . . . . . . . . . . . . . . . . . . . . . . . . . . . . . . . . . . . . . 684
Stored Processes . . . . . . . . . . . . . . . . . . . . . . . . . . . . . . . . . . . . . . . . . . . . . . . . . . . . . . . . . . . . . . 692
SAS Results . . . . . . . . . . . . . . . . . . . . . . . . . . . . . . . . . . . . . . . . . . . . . . . . . . . . . . . . . . . . . . . . . 697
Messages for Schedule . . . . . . . . . . . . . . . . . . . . . . . . . . . . . . . . . . . . . . . . . . . . . . . . . . . . . . . . . . . . 699
Sockets . . . . . . . . . . . . . . . . . . . . . . . . . . . . . . . . . . . . . . . . . . . . . . . . . . . . . . . . . . . . . . . . . . . . . . . 700
Other Objects . . . . . . . . . . . . . . . . . . . . . . . . . . . . . . . . . . . . . . . . . . . . . . . . . . . . . . . . . . . . . . . . . . . 703
Zip Archives . . . . . . . . . . . . . . . . . . . . . . . . . . . . . . . . . . . . . . . . . . . . . . . . . . . . . . . . . . . . . . . . . 703
Journals . . . . . . . . . . . . . . . . . . . . . . . . . . . . . . . . . . . . . . . . . . . . . . . . . . . . . . . . . . . . . . . . . . . . 704
C Compatibility Notes
Changes in Scripting from JMP 8 to JMP 9 . . . . . . . . . . . . . . . . . . . . . . . . . . . . . . . . . . . . . . 705
DGlossary
Terms, Concepts, and Placeholders . . . . . . . . . . . . . . . . . . . . . . . . . . . . . . . . . . . . . . . . . . . 709
Index
Scripting Guide . . . . . . . . . . . . . . . . . . . . . . . . . . . . . . . . . . . . . . . . . . . . . . . . . . . . . . . . . . . . . . . 713
Page 17

Credits and Acknowledgments
Origin
JMP was developed by SAS Institute Inc., Cary, NC. JMP is not a part of the SAS System, though portions
of JMP were adapted from routines in the SAS System, particularly for linear algebra and probability
calculations. Version 1 of JMP went into production in October 1989.
Credits
JMP was conceived and started by John Sall. Design and development were done by John Sall, Chung-Wei
Ng, Michael Hecht, Richard Potter, Brian Corcoran, Annie Dudley Zangi, Bradley Jones, Craige Hales,
Chris Gotwalt, Paul Nelson, Xan Gregg, Jianfeng Ding, Eric Hill, John Schroedl, Laura Lancaster, Scott
McQuiggan, Melinda Thielbar, Clay Barker, Peng Liu, Dave Barbour, Jeff Polzin, John Ponte, and Steve
Amerige.
In the SAS Institute Technical Support division, Duane Hayes, Wendy Murphrey, Rosemary Lucas, Win
LeDinh, Bobby Riggs, Glen Grimme, Sue Walsh, Mike Stockstill, Kathleen Kiernan, and Liz Edwards
provide technical support.
Nicole Jones, Kyoko Keener, Hui Di, Joseph Morgan, Wenjun Bao, Fang Chen, Susan Shao, Michael
Crotty, Jong-Seok Lee, Tonya Mauldin, Audrey Ventura, Ani Eloyan, Bo Meng, and Sequola McNeill
provide ongoing quality assurance. Additional testing and technical support are provided by Noriki Inoue,
Kyoko Takenaka, Yusuke Ono, Masakazu Okada, and Naohiro Masukawa from SAS Japan.
Bob Hickey and Jim Borek are the release engineers.
The JMP books were written by Ann Lehman, Lee Creighton, John Sall, Bradley Jones, Erin Vang, Melanie
Drake, Meredith Blackwelder, Diane Perhac, Jonathan Gatlin, Susan Conaghan, and Sheila Loring, with
contributions from Annie Dudley Zangi and Brian Corcoran. Creative services and production was done by
SAS Publications. Melanie Drake implemented the Help system.
Jon Weisz and Jeff Perkinson provided project management. Also thanks to Lou Valente, Ian Cox, Mark
Bailey, and Malcolm Moore for technical advice.
Thanks also to Georges Guirguis, Warren Sarle, Gordon Johnston, Duane Hayes, Russell Wolfinger,
Randall Tobias, Robert N. Rodriguez, Ying So, Warren Kuhfeld, George MacKensie, Bob Lucas, Warren
Kuhfeld, Mike Leonard, and Padraic Neville for statistical R&D support. Thanks are also due to Doug
Melzer, Bryan Wolfe, Vincent DelGobbo, Biff Beers, Russell Gonsalves, Mitchel Soltys, Dave Mackie, and
Stephanie Smith, who helped us get started with SAS Foundation Services from JMP.
Acknowledgments
We owe special gratitude to the people that encouraged us to start JMP, to the alpha and beta testers of JMP,
and to the reviewers of the documentation. In particular we thank Michael Benson, Howard Yetter (d),
Page 18

xviii
Andy Mauromoustakos, Al Best, Stan Young, Robert Muenchen, Lenore Herzenberg, Ramon Leon, Tom
Lange, Homer Hegedus, Skip Weed, Michael Emptage, Pat Spagan, Paul Wenz, Mike Bowen, Lori Gates,
Georgia Morgan, David Tanaka, Zoe Jewell, Sky Alibhai, David Coleman, Linda Blazek, Michael Friendly,
Joe Hockman, Frank Shen, J.H. Goodman, David Iklé, Barry Hembree, Dan Obermiller, Jeff Sweeney,
Lynn Vanatta, and Kris Ghosh.
Also, we thank Dick DeVeaux, Gray McQuarrie, Robert Stine, George Fraction, Avigdor Cahaner, José
Ramirez, Gudmunder Axelsson, Al Fulmer, Cary Tuckfield, Ron Thisted, Nancy McDermott, Veronica
Czitrom, Tom Johnson, Cy Wegman, Paul Dwyer, DaRon Huffaker, Kevin Norwood, Mike Thompson,
Jack Reese, Francois Mainville, and John Wass.
We also thank the following individuals for expert advice in their statistical specialties: R. Hocking and P.
Spector for advice on effective hypotheses; Robert Mee for screening design generators; Roselinde Kessels
for advice on choice experiments; Greg Piepel, Peter Goos, J. Stuart Hunter, Dennis Lin, Doug
Montgomery, and Chris Nachtsheim for advice on design of experiments; Jason Hsu for advice on multiple
comparisons methods (not all of which we were able to incorporate in JMP); Ralph O’Brien for advice on
homogeneity of variance tests; Ralph O’Brien and S. Paul Wright for advice on statistical power; Keith
Muller for advice in multivariate methods, Harry Martz, Wayne Nelson, Ramon Leon, Dave Trindade, Paul
Tobias, and William Q. Meeker for advice on reliability plots; Lijian Yang and J.S. Marron for bivariate
smoothing design; George Milliken and Yurii Bulavski for development of mixed models; Will Potts and
Cathy Maahs-Fladung for data mining; Clay Thompson for advice on contour plotting algorithms; and
Tom Little, Damon Stoddard, Blanton Godfrey, Tim Clapp, and Joe Ficalora for advice in the area of Six
Sigma; and Josef Schmee and Alan Bowman for advice on simulation and tolerance design.
For sample data, thanks to Patrice Strahle for Pareto examples, the Texas air control board for the pollution
data, and David Coleman for the pollen (eureka) data.
Translations
Trish O'Grady coordinates localization. Special thanks to Noriki Inoue, Kyoko Takenaka, Masakazu Okada,
Naohiro Masukawa, and Yusuke Ono (SAS Japan); and Professor Toshiro Haga (retired, Tokyo University
of Science) and Professor Hirohiko Asano (Tokyo Metropolitan University) for reviewing our Japanese
translation; François Bergeret for reviewing the French translation; Bertram Schäfer and David Meintrup
(consultants, StatCon) for reviewing the German translation; Patrizia Omodei, Maria Scaccabarozzi, and
Letizia Bazzani (SAS Italy) for reviewing the Italian translation; RuiQi Qiao, Rula Li, and Molly Li for
reviewing Simplified Chinese translation (SAS R&D Beijing); Finally, thanks to all the members of our
outstanding translation and engineering teams.
Past Support
Many people were important in the evolution of JMP. Special thanks to David DeLong, Mary Cole, Kristin
Nauta, Aaron Walker, Ike Walker, Eric Gjertsen, Dave Tilley, Ruth Lee, Annette Sanders, Tim Christensen,
Eric Wasserman, Charles Soper, Wenjie Bao, and Junji Kishimoto. Thanks to SAS Institute quality
assurance by Jeanne Martin, Fouad Younan, and Frank Lassiter. Additional testing for Versions 3 and 4 was
done by Li Yang, Brenda Sun, Katrina Hauser, and Andrea Ritter.
Also thanks to Jenny Kendall, John Hansen, Eddie Routten, David Schlotzhauer, and James Mulherin.
Thanks to Steve Shack, Greg Weier, and Maura Stokes for testing JMP Version 1.
Page 19

Thanks for support from Charles Shipp, Harold Gugel (d), Jim Winters, Matthew Lay, Tim Rey, Rubin
Gabriel, Brian Ruff, William Lisowski, David Morganstein, Tom Esposito, Susan West, Chris Fehily, Dan
Chilko, Jim Shook, Ken Bodner, Rick Blahunka, Dana C. Aultman, and William Fehlner.
Technology License Notices
xix
Scintilla is Copyright 1998-2003 by Neil Hodgson <neilh@scintilla.org>.
WARRANTIES WITH REGARD TO THIS SOFTWARE, INCLUDING ALL IMPLIED WARRANTIES OF
MERCHANTABILITY AND FITNESS, IN NO EVENT SHALL NEIL HODGSON BE LIABLE FOR ANY SPECIAL,
INDIRECT OR CONSEQUENTIAL DAMAGES OR ANY DAMAGES WHATSOEVER RESULTING FROM LOSS OF
USE, DATA OR PROFITS, WHETHER IN AN ACTION OF CONTRACT, NEGLIGENCE OR OTHER TORTIOUS
ACTION, ARISING OUT OF OR IN CONNECTION WITH THE USE OR PERFORMANCE OF THIS SOFTWARE.
XRender is Copyright © 2002 Keith Packard.
TO THIS SOFTWARE, INCLUDING ALL IMPLIED WARRANTIES OF MERCHANTABILITY AND FITNESS, IN NO
EVENT SHALL KEITH PACKARD BE LIABLE FOR ANY SPECIAL, INDIRECT OR CONSEQUENTIAL DAMAGES OR
ANY DAMAGES WHATSOEVER RESULTING FROM LOSS OF USE, DATA OR PROFITS, WHETHER IN AN ACTION
OF CONTRACT, NEGLIGENCE OR OTHER TORTIOUS ACTION, ARISING OUT OF OR IN CONNECTION WITH
THE USE OR PERFORMANCE OF THIS SOFTWARE.
KEITH PACKARD DISCLAIMS ALL WARRANTIES WITH REGARD
NEIL HODGSON DISCLAIMS ALL
ImageMagick software is Copyright © 1999-2010 ImageMagick Studio LLC, a non-profit organization
dedicated to making software imaging solutions freely available.
bzlib software is Copyright © 1991-2009, Thomas G. Lane, Guido Vollbeding. All Rights Reserved.
FreeType software is Copyright © 1996-2002 The FreeType Project (www.freetype.org). All rights reserved.
Page 20

xx
Page 21

Chapter 1
Introducing JSL
Tutorials and Demonstrations
This introduction shows you the basics of JMP Scripting Language (JSL). The chapter starts with a simple,
progressive tutorial example to show you where to type a script, how to submit it, and how to modify and
save it. The purpose of this tutorial is to give you the basic techniques for working with any script, whether
it’s one you write or one you get from someone else. Next is a showcase of examples to demonstrate how
scripting might be useful in a variety of settings. For example, classroom simulations, advanced data
manipulations, custom statistics, production lines, and so forth.
Confusion alert! Throughout this book, special shaded “confusion alerts” like this one
call your attention to important concepts that could be unfamiliar or more
complicated than you might expect, or where JMP might be a little different from
other applications. These alerts appear whenever a particularly good example of a
potential problem arises in the text, and although you will find them under topics that
might not apply to your immediate needs, the ideas presented are always general and
important. Please be sure to take a look even when you are skipping pages and looking
for something else.
You can quickly locate these pointers by looking up “confusion alert” in the “Index,”
p. 713.
Page 22

Contents
Hello, World . . . . . . . . . . . . . . . . . . . . . . . . . . . . . . . . . . . . . . . . . . . . . . . . . . . . . . . . . . . . . . . . . . . . . . . 3
Modify the Script . . . . . . . . . . . . . . . . . . . . . . . . . . . . . . . . . . . . . . . . . . . . . . . . . . . . . . . . . . . . . . . . 4
Save a Script . . . . . . . . . . . . . . . . . . . . . . . . . . . . . . . . . . . . . . . . . . . . . . . . . . . . . . . . . . . . . . . . . . . . 6
Save the Log . . . . . . . . . . . . . . . . . . . . . . . . . . . . . . . . . . . . . . . . . . . . . . . . . . . . . . . . . . . . . . . . . . . . 6
Saving and Sharing Your Work . . . . . . . . . . . . . . . . . . . . . . . . . . . . . . . . . . . . . . . . . . . . . . . . . . . . . . . . . 6
Capturing Scripts for Data Tables . . . . . . . . . . . . . . . . . . . . . . . . . . . . . . . . . . . . . . . . . . . . . . . . . . . . 7
Capturing Scripts for Analyses. . . . . . . . . . . . . . . . . . . . . . . . . . . . . . . . . . . . . . . . . . . . . . . . . . . . . . . 8
A General Method for Creating Scripts . . . . . . . . . . . . . . . . . . . . . . . . . . . . . . . . . . . . . . . . . . . . . . . . 9
Use JMP Interactively to Learn Scripting. . . . . . . . . . . . . . . . . . . . . . . . . . . . . . . . . . . . . . . . . . . . . . . 11
Using the Script Editor and Debugger. . . . . . . . . . . . . . . . . . . . . . . . . . . . . . . . . . . . . . . . . . . . . . . . . . . .12
The Script Editor . . . . . . . . . . . . . . . . . . . . . . . . . . . . . . . . . . . . . . . . . . . . . . . . . . . . . . . . . . . . . . . .12
The JSL Debugger (Windows Only) . . . . . . . . . . . . . . . . . . . . . . . . . . . . . . . . . . . . . . . . . . . . . . . . . . 18
Help with JSL . . . . . . . . . . . . . . . . . . . . . . . . . . . . . . . . . . . . . . . . . . . . . . . . . . . . . . . . . . . . . . . . . . . . . 20
JSL Browsers . . . . . . . . . . . . . . . . . . . . . . . . . . . . . . . . . . . . . . . . . . . . . . . . . . . . . . . . . . . . . . . . . . . 20
Show Commands . . . . . . . . . . . . . . . . . . . . . . . . . . . . . . . . . . . . . . . . . . . . . . . . . . . . . . . . . . . . . . . .21
Show Properties. . . . . . . . . . . . . . . . . . . . . . . . . . . . . . . . . . . . . . . . . . . . . . . . . . . . . . . . . . . . . . . . . . 21
Page 23
Chapter 1 Introducing JSL 3
Hello, World
Hello, World
This exercise is simple and hearkens back to a classic. Perhaps you recognize it.
1. Start JMP.
2. If the log window is not open, open it by selecting
Macintosh.
3. In the JMP Starter window, click
New Script.
New scripts can also be created from the menus. On Windows, select
Macintosh, select
File>New>NewScript.
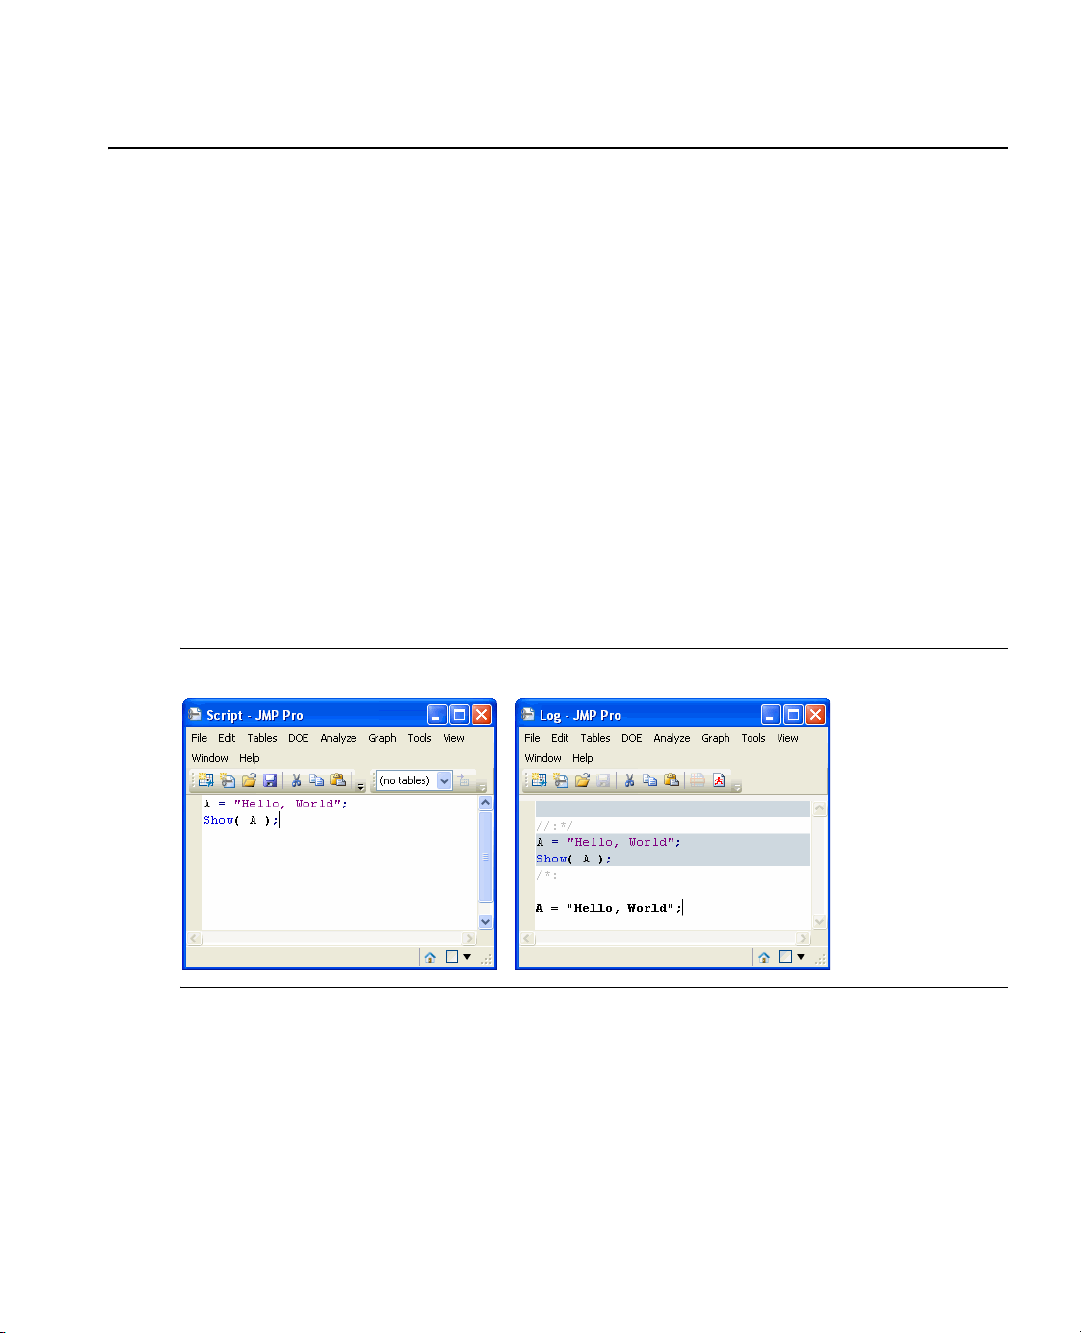
4. In the resulting script editor, type these lines:
A = "Hello, World";
Show( A );
5. From the Edit menu, select Run Script.
The keyboard shortcut is to press CTRL-R on Windows or COMMAND-R on Macintosh.
The result is shown in the Log window. Besides showing results and errors, this window is also a script
editor.
View > Log on Windows or Window > Log on
File > New > Script. On
Figure 1.1 The Script Window (left) and the Log Window (right)
This is how you enter and submit JSL. You have just created a global variable named A, assigned a value to
it, and shown its value. Notice that the log echoes your script first, and then echoes any results. In this case,
the result is the output for the
Show(A) command.
Go To Line
As your scripts grow in size, it is handy to jump to specific lines in the script. Use the
from the
Edit menu to jump to a specific line.
Go To Line command
Page 24

4 Introducing JSL Chapter 1
Hello, World
This command is also useful during the debugging process, since error messages frequently mention the line
of the script where the error occurred.
Show Line Numbers
The script window does not show line numbers by default. To see the line numbers, right-click anywhere in
the script window, and then select
Show Line Numbers.
Modify the Script
Now try making this script do a little more work by adding a For-loop to greet the world not just once, but
four times. Also, use
For-loop works.
1. In the script window, change the script to this:
For( i = 1, i < 5, i++,
X = i;
A = "Hello, World";
Print( X, A );
);
Print( "done" );
2. Submit the script as before.
(To submit part of the text in a window instead of all text, select the text first and then press Control-R
on Windows or a-R on Macintosh)
Print this time instead of Show, and make a few other changes to see how the
Output
1
"Hello, World"
2
"Hello, World"
3
"Hello, World"
4
"Hello, World"
"done"
Print
is similar to Show except that it does not label the results with the variable name. It just prints the
value.
Stopping a Script
When you run a script, the
is running, you can select this option to stop it. You can also press ESC on Windows or
COMAND-PERIOD on Macintosh . Many scripts execute more quickly than you can stop them.
Run Script command in the Edit menu changes to Stop Script. While a script
Page 25

Chapter 1 Introducing JSL 5
Hello, World
Punctuation and Spaces
Notice the indented lines inside the
For-loop. This is not necessary for JMP’s sake; it just makes it a little
easier to read. You could write this script like this if you want:
fo R(i=
1,i<5,i++
,X=i;A="Hello, World";P r i N T( X,A));print("done");
Words in JMP’s scripting language are separated by parentheses, commas, semicolons, and various operators
such as +, –, and so on. As far as JMP is concerned, spaces, tabs, returns, and blank lines inside or between
operators or within JSL words do not exist. This is because most JSL words come from JMP’s usual
graphical user interface (GUI), and most of those commands have spaces in them. For example, you will see
later on that to do Fit Model, the JSL would be
parentheses)
. Most people would rather see “Fit Model” than “fitmodel.”
Fit Model(and some arguments inside
JSL is not case-sensitive, so you do not have to worry about reaching for the Shift key all the time.
You do have to be a little careful inside a text string. In “Hello, World” extra spaces would affect the output,
because text strings inside double quotation marks are taken literally, exactly as you type them. Also, you
would get errors if you put spaces between the two plus signs in
same as
43).
i++, (i+ +), or in numbers (43 is not the
Generally, JSL uses:
commas , between arguments inside the parentheses for a command.
parentheses ( ) to surround all the arguments of a command. Many JSL words have parentheses after
them even if they do not take arguments; for example
the number 3.14...
do give it. Therefore,
Pi does not expect an argument and will complain about any argument that you
Pi(mincemeat) would be considered an error (although it seems heretical to
pi() has the parentheses even though π is just
say so). But the parentheses are still required.
semicolons ; to separate commands but also to glue them together. In other words, you use a
semicolon to separate one complete message from the next. For example,
semicolon really does is tell JMP to continue and do more things. For example, the
a=1;b=2. What the
For-loop
example showed how to put several statements in the place of one statement for the fourth
argument, because the semicolon effectively turned all three statements into one argument.
Trailing semicolons (extras at the end of a script or at the end of a list of arguments) are harmless, so
you can also think of semicolons as terminating characters. In fact, terminating each complete JSL
statement with a semicolon is a good habit to adopt.
quotation marks " " to enclose text strings. Anything inside quotation marks is taken literally,
exactly as is, including spaces and upper- or lower-case. Nothing that could be evaluated is evaluated.
If you have
pi()^2 inside quotation marks, it is just a sequence of six characters, not a value close to
ten. See “Quoted Strings,” p. 28, for ways to include special characters and quotation marks in
strings.
For a more formal discussion of punctuation rules, see “Lexical Rules of the Language,” p. 26.
Page 26

6 Introducing JSL Chapter 1
Saving and Sharing Your Work
Save a Script
To save your script, just follow these instructions:
1. Make the script window active (click the “Untitled” window to make it the front-most window).
2. From the
3. Specify a filename, including the extension
4. Click
Scripts are saved as text files, and you can edit them with any text editor. However, if you do edit scripts
with applications other than JMP, be careful to save them as plain text files. If you preserve the
you can double-click a script file to launch JMP.
File menu, select Save or Save As.
.jsl. For example, hello.jsl.
Save.
.jsl extension,
To reuse a script, use
Open from JMP’s File menu, double-click a .jsl file, or drag and drop the file onto
JMP’s application icon.
When opening a JSL file, the actual script is always opened in its own script window. However, it might be
distracting to some users to see this window. To keep a script from opening in a script window, put this
command on the first line of the script.
//!
If it is not on the very first line by itself, this command does nothing.
You can over-ride this comment when opening the file. Select
select the JSL file and click
Open. The script opens into a script window instead of being executed.
Save the Log
You can also save logs as text files, which can be viewed with any text editor. Double-clicking a log file does
not launch JMP.
1. Make the log window active (click the Log window to make it the front-most window).
2. From the
File menu, select Save or Save As.
3. Specify a filename, including the extension .txt on Windows. For example, hello.txt.
4. Click Save
Saving and Sharing Your Work
File > Open. Hold the CTRL key while you
Here is something just about everybody will find useful sooner or later: JMP can create scripts to duplicate
your data tables and analyses. For example:
• Suppose you need to describe an analysis process in detail, from beginning to end, such as to create an
audit trail for a governing agency or for peers reviewing your journal article.
• Suppose you have a set of analysis steps that should be followed routinely by your lab technicians.
• Suppose you fit the same model to new data every day, and you are tired of clicking the same buttons
over and over again.
Page 27
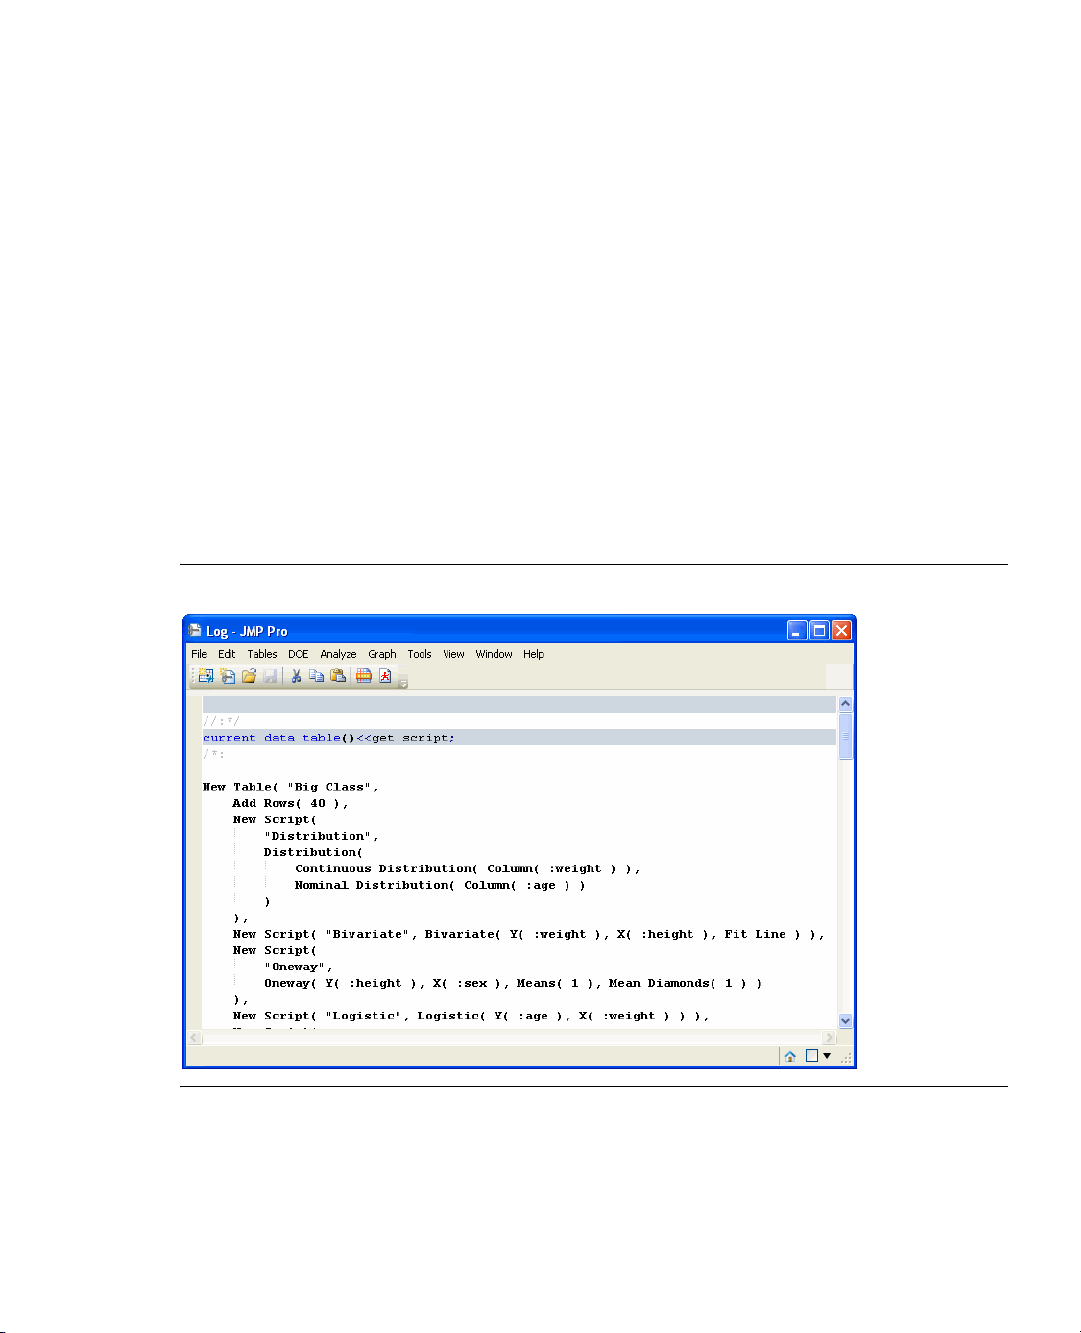
Chapter 1 Introducing JSL 7
Saving and Sharing Your Work
• Suppose you are working with somebody in another city who cannot simply look over your shoulder to
see how you put something together.
You can use JMP interactively as usual, save scripts to reproduce your work, and in the future just run those
scripts. Next are some examples showing how this works.
Capturing Scripts for Data Tables
1. Open a data table and make all types of changes. For example, add rows and columns, change values,
rearrange columns, sort the rows, make a formula column, make a row state column, and so on.
2. When you are finished, open a script window and type this:
current data table()<<get script;
3. In the Script window, click and drag to select (highlight) the script.
4. Run the script and look at the output shown in the Log window:
From the
Figure 1.2 The Get Script Command and the Log
Edit menu, select Run Script.
Now try running the script in the log window:
1. In the Log window, click and drag to select (highlight) the script, starting with
with the last line in the log.
2. From the
Edit menu, select Run Script.
New Table and ending
Page 28

8 Introducing JSL Chapter 1
Saving and Sharing Your Work
The script produces a perfect clone of your data table.
Capturing Scripts for Analyses
Launch a platform, such as Fit Model. Look at the default results and then go exploring. Try options to see
related tests and graphs. Work with the red triangle menus in the report surface to get exactly the report that
you want.
When you are finished, get a script to recreate your results. There are two methods of getting a script for
your results. One is to use the Script menu located at the bottom of each platform’s red triangle menu. This
method is detailed in “Use JMP Interactively to Learn Scripting,” p. 11.
1. First you need to figure out what JMP calls your analysis. This can be tricky in some cases, as discussed
in the “Scripting Platforms” chapter, but usually you can read it from the title of the analysis window,
after the name of the data table. For example, the platform for a window titled “Big Class: Fit Least
Squares” would be called
2. Now you have to specify a part of the report. You might have fit several models before getting the one
that you want to keep. You need to tell JMP which one you want by supplying a subscript, which is just
a number inside brackets after the name. If the third model that you fit is the one that you want, you
would specify it as
3. You are ready to get the script from the object:
Fit Least Squares[3] << get script;
Fit Least Squares.
Fit Least Squares[3].
The results might look something like this, depending on which steps you performed:
Fit Model(
Y( :weight ),
Effects( :sex, :height, :sex * :height ),
Personality( Standard Least Squares ),
Run Model(
Profiler(
Confidence Intervals( 1 ),
Desirability Functions( 1 )
),
Contour Profiler(
Surface Plot( 1 )
)
)
)
Tr y r un ni n g th e s c ri p t:
1. In the Log window, click and drag to select (highlight) the script
2. From the
Edit menu, select Run Script.
The script produces a perfect clone of your analysis. If you want a journal, use this command:
Fit Least Squares[1] << journal window;
Page 29

Chapter 1 Introducing JSL 9
Saving and Sharing Your Work
A General Method for Creating Scripts
1. Did you use an existing data table as is? Write an Open statement for it:
dt = Open( "$SAMPLE_DATA/Big Class.JMP" );
2. Did you create a new table or make changes to an existing data table? Did you work with row states,
such as to color and label points in your plots? Did you exclude some rows? Did you fix errors? If so, you
should get a script to recreate your data table.
Current Data Table() << get script;
3. Which platforms did you launch, work with, and keep for your final results? Get scripts to recreate
them. You will learn the details in the “Scripting Platforms” chapter; here you will just try some
examples.
Bivariate[1] << get script;
Fit Least Squares[1] << get script;
4. Now edit the log into a complete script. Be sure to put semicolons ( ; ) in between statements. You
might have something like this:
New Table( "Big Class",
Add Rows( 40 ),
New Column( "name",
Character,
Nominal,
Set Property( Notes, "...usually used as a label variable in plots" ),
Values(
{"KATIE", "LOUISE", "JANE", "JACLYN", "LILLIE", "TIM", "JAMES",
"ROBERT", "BARBARA", "ALICE", "SUSAN", "JOHN", "JOE", "MICHAEL",
"DAVID", "JUDY", "ELIZABETH", "LESLIE", "CAROL", "PATTY",
"FREDRICK", "ALFRED", "HENRY", "LEWIS", "EDWARD", "CHRIS",
"JEFFERY", "MARY", "AMY", "ROBERT", "WILLIAM", "CLAY", "MARK",
"DANNY", "MARTHA", "MARIAN", "PHILLIP", "LINDA", "KIRK",
"LAWRENCE"}
)
),
New Column( "age",
Numeric,
Ordinal,
Set Property( Notes, "Explore data adventurously" ),
Values(
[12, 12, 12, 12, 12, 12, 12, 12, 13, 13, 13, 13, 13, 13, 13, 14,
14, 14, 14, 14, 14, 14, 14, 14, 14, 14, 14, 15, 15, 15, 15, 15, 15,
15, 16, 16, 16, 17, 17, 17]
)
),
New Column( "sex",
Character,
Nominal,
Set Property( Notes, "Explore data adventurously" ),
Values(
{"F", "F", "F", "F", "F", "M", "M", "M", "F", "F", "F", "M", "M",
Page 30

10 Introducing JSL Chapter 1
Saving and Sharing Your Work
"M", "M", "F", "F", "F", "F", "F", "M", "M", "M", "M", "M", "M",
"M", "F", "F", "M", "M", "M", "M", "M", "F", "F", "M", "F", "M",
"M"}
)
),
New Column( "height",
Numeric,
Continuous,
Set Property( Notes, "Explore data adventurously" ),
Values(
[59, 61, 55, 66, 52, 60, 61, 51, 60, 61, 56, 65, 63, 58, 59, 61,
62, 65, 63, 62, 63, 64, 65, 64, 68, 64, 69, 62, 64, 67, 65, 66, 62,
66, 65, 60, 68, 62, 68, 70]
)
),
New Column( "weight",
Numeric,
Continuous,
Set Property( Notes, "Explore data adventurously" ),
Values(
[95, 123, 74, 145, 64, 84, 128, 79, 112, 107, 67, 98, 105, 95, 79,
81, 91, 142, 84, 85, 93, 99, 119, 92, 112, 99, 113, 92, 112, 128,
111, 105, 104, 106, 112, 115, 128, 116, 134, 172]
)
)
);
Bivariate(
Y( weight ),
X( height ),
Fit Line( {Confid Curves Fit( 1 )} ),
Where( :sex == "F" )
);
Bivariate(
Y( weight ),
X( height ),
Fit Line( {Confid Curves Fit( 1 )} ),
Where( :sex == "M" )
);
Fit Model(
Y( :weight ),
Effects( :sex, :height, :sex * :height ),
Personality( Standard Least Squares ),
Run Model(
Profiler( Confidence Intervals( 1 ), Desirability Functions( 1 ) ),
:weight << {Plot Actual by Predicted( 1 ),
Plot Residual by Predicted( 1 ), Plot Effect Leverage( 1 )}
)
);
Scatterplot 3D( Y( age, weight, height ) );
5. Save the script.
Page 31

Chapter 1 Introducing JSL 11
Saving and Sharing Your Work
6. If you share your JSL file with your colleagues, be sure to include any data tables or additional files along
with the script.
Use JMP Interactively to Learn Scripting
One of the simplest ways to accomplish anything is to get somebody else to do it for you, and writing JSL is
no exception. The best JSL writer is JMP itself. This example shows how to work in JMP interactively and
then save the results as a script to reuse later on. With simple modifications, this script can serve as a
template for speeding up routine tasks.
What JMP Can and Cannot do to Help You Write Scripts
JMP can automatically save scripts to reproduce any data table or analysis in its current state. You can pause
any time in your analysis to save a script to a script window, in a data table, or in an analysis report. You can
then modify the automatically generated script as needed for future projects.
JMP cannot record scripts while you are working. While script-recording is a useful feature in some other
scripting languages, it is less important for a program like JMP, where the important thing is the results. You
cannot use script-recording to observe how a sequence of interactive steps is performed.
However, remember that you can save a script when you are finished, and that script reproduces everything
that you have accomplished.
JMP’s scripting language is not intended to be an alternative command-line interface for using the program.
JSL is intended for recreating results and for extending JMP’s capabilities beyond JMP’s intended use in data
discovery.
There is More Than One Way
Since JSL is a very flexible language, you can accomplish things many different ways.
Typically the script that JMP saves for you specifies every detail of your analysis, even if most of the details
happen automatically by default. Does that mean that the scripts that you write have to be just as complete
and detailed? Not at all. You usually just need to specify the details that you would specify when using the
graphical user interface (GUI). For example, if you open
height, weight, and sex, you would need only to do this in JSL:
Distribution( Y( :height, :weight, :sex ) );
But if you select Script > Save Script to Script Window from the red triangle menu for the report, you
would see this:
Distribution(
Continuous Distribution( Column( :height ) ),
Continuous Distribution( Column( :weight ) ),
Nominal Distribution( Column( :sex ) ),
SendToReport(
Dispatch( {"height", "Quantiles"}, "", NumberColBox, {Set Format( 7 )}
),
Dispatch( {"height", "Moments"}, "", NumberColBox, {Set Format( 9 )} ),
Big Class and want to launch Distribution for
Page 32

12 Introducing JSL Chapter 1
Saving and Sharing Your Work
Dispatch( {"weight", "Quantiles"}, "", NumberColBox, {Set Format( 7 )}
),
Dispatch( {"weight", "Moments"}, "", NumberColBox, {Set Format( 9 )} )
)
);
Both methods give the same result. Feel free to experiment with JSL. If you think something ought to be
possible, it probably is. Give it a try, and see what happens.
Using the Script Editor and Debugger
JMP provides both an editor and a debugger for writing and troubleshooting your JSL scripts.
The Script Editor
The Script Editor (as shown in Figure 1.3) provides a friendly environment for writing and reading JSL
scripts.
Figure 1.3 The Script Editor
The script editor has several useful features:
• color-coding for JSL and SAS code
• autocompletion for JSL functions (press CONTROL-SPACE on Windows or COMMAND-SPACE
on Macintosh)
• tooltips when hovering over JSL functions
Page 33

Chapter 1 Introducing JSL 13
Saving and Sharing Your Work
• value-reporting when hovering over a global symbol
• live brace matching
• highlighting matching braces
• find and replace using regular expressions
• automatic formatting
The script editor is also used in the log window and anywhere else you can edit or write a script.
Color-Coding
The script window uses the following colors for JSL:
• green for comments
• blue for JSL functions
• dark magenta for string values
• dark cyan and bold for scalar values
• black for everything else
Colors can be customized in Preferences. See “Setting Preferences for the Script Editor,” p. 15.
Auto-Completion
If you do not remember the exact name of a function, you can type part of the name and then press
CONTROL-SPACE or CONTROL-ENTER on Windows, or ESC on Macintosh to see a list of functions
that match what you have typed so far.
For example, if you want to clear your JSL variables, but do not remember the command, you can type
clear, then CONTROL-SPACE, to see a list of possible clear commands.
Figure 1.4 Autocomplete Example
Select the command that you want to use.
Tooltips
If you are using a function and do not remember its syntax or what it does exactly, you can hover over it to
get a brief explanation. This only works with JSL function names, not platform commands, messages, or
user-created functions. JSL function names are colored blue in the script editor.
Page 34

14 Introducing JSL Chapter 1
Saving and Sharing Your Work
Figure 1.5 Tooltip for a JSL Function
The tooltip shows the grammar, any arguments, and a brief explanation of the function.
You can also hover over variable names to see their current value. If you hover over a variable before running
the script, no tip appears, because JMP does not yet know about it.
Example of a Tooltip for a JSL Variable
1. Enter and run the following line in a script window:
my_variable = 8;
2. Hover over the variable name after you run the line.
A tooltip shows the name of the variable and its value: 8.
3. Enter and run the following line:
my_variable = "eight";
4. Hover over the variable name after you run the line.
A tooltip shows the name of the variable and its value: “eight”.
Brace-Matching
The script editor helps you match parentheses, square brackets, and curly braces in the following ways:
• The matching closing brace is added when you type an opening brace.
• When you place your cursor next to either an opening or closing brace, it and its match are highlighted
in blue. If it does not have a match, it is highlighted in red.
• If you double-click a brace, everything between the matching braces is selected (including the braces).
• If you put your cursor within a statement and press CONTROL-] on Windows, or CONTROL-B on
Macintosh, the entire statement is selected (including the braces that define it).
Figure 1.3 “The Script Editor,” p. 12 shows highlighted matching braces in the third line of code.
When you type an opening brace, add code in between, and then type the closing brace, the script editor
skips the cursor over the brace it that added automatically for you. This prevents you from accidentally
adding an additional closing brace.
You can turn on and off the autocompletion of braces in the Preferences window. See “Setting Preferences
for the Script Editor,” p. 15 for details.
Page 35

Chapter 1 Introducing JSL 15
Saving and Sharing Your Work
Find and Replace
The
Edit > Search menu options are now available in scripts. Searching and replacing is the same as for
data tables.
1. From the
2. In the
Edit menu, select Search > Find.
Find what field, enter the text that you want to search for.
3. If you want to find text and replace it, enter the replacement text in the
4. Select any other check boxes that you want to use.
5. Click
Find to find the next occurrence, or click Replace to replace the current occurrence and find the
next.
See the Using JMP book for details about the Search window.
Automatic Formatting
The script editor can format a script for easier reading. Any generated script (for example, by saving a
platform script) is automatically formatted with tabs and returns in appropriate places.
If you open or write a script that is poorly formatted (for example, older saved JMP scripts that might have
all commands strung together with no whitespace characters), you can have the script editor format it for
you.
From the
Edit menu, select Reformat Script.
Tip: This command alerts you if your script is badly formed (for example, if your parentheses are not
matched).
Setting Preferences for the Script Editor
Replace with field.
You can customize several parts of the script editor. Open the Preference Settings window by selecting
Preferences.
Setting the Fonts
1. Select the Fonts group.
2. Click
Mono to set the font for the script editor.
For more details about font preferences, see the Using JMP book.
File >
Page 36

16 Introducing JSL Chapter 1
Saving and Sharing Your Work
Figure 1.6 Changing the Font for Script Windows
Setting editor preferences
On the Script Editor page, you can make many other customizations:
Use tabs Check this option to enable tabs in your scripts. If it is unchecked, any tab you type is
replaced by spaces. This is on by default.
Tab w id th Enter how many spaces a tab should indent. If you have disabled tabs, any tab you type is
replaced with the number of spaces specified. The default value is 4.
Extra space at bottom of document Check this option to enable scrolling the last line of a script to
the top of the script editor. This is on by default.
Auto-complete parentheses and braces Check this option to enable the script editor to
automatically add closing parentheses, square brackets, and curly braces when you type an opening
one. This is on by default.
Show line numbers Check this option to show the line numbers on the right side of the script editor.
This is off by default.
Show operator tips Check this option to see tooltips for JSL functions. This is on by default.
Show indentation guides Check this option to see faint vertical lines that mark indention. This is
on by default.
Show variable value tips Check this option to see tooltips for variable values. This is on by default.
Spaces inside parentheses Check this option to cause the script editor to add spaces between
parentheses, brackets, and braces and their contents for automatically formatted scripts. This is on
by default.
Page 37

Chapter 1 Introducing JSL 17
Saving and Sharing Your Work
Spaces in operator names
within function names. For example, turning on this option results in
NewWindow. This is on by default.
Setting colors used in the editor
To set your own color for any of the listed types, click the color box and select your color. (See Figure 1.7.)
Figure 1.7 Color Selection
Scripting the Script Editor
The editor is also scriptable, meaning you can write a script to write, change, or get information from
another script. First, you need to make a reference to your script window. For example, here is code that
creates a new script window and assigns a reference to it to the variable
Check this option to cause the script editor to add spaces between words
New Window instead of
ww:
ww = New Window( "Script Test", <<script, "initial contents" );
The initial contents can be left off, so that you create a blank script window. Next, you need to get a
reference to the display box portion of the script window:
ed = ww[Script Box( 1 )];
Although there is only one script box object, you still must call it by number.
There is a variety of messages that you can send your script box object.
Ta bl e 1 .1 Messages for a Script Box Object
ed << get text();
Places all the text in the script window in a single
string.
ed << set text( "string" );
Removes all the text currently in the script window
and replaces it with the string argument.
ed << append text( "string" );
Adds the string argument to the end of the script
window.
ed << get line text( 2 );
Places only the text from the designated line in a
string.
Page 38

18 Introducing JSL Chapter 1
Saving and Sharing Your Work
Ta bl e 1 .1 Messages for a Script Box Object (Continued)
ed << set line text( 2, "string" );
ed << get line count();
ed << get lines();
ed << reformat();
ed << run();
The JSL Debugger (Windows Only)
In the JSL debugger, you can run the entire script, or step through the script one line at the time. This
feature is available only Windows. If you run a script with the debug command, the script runs normally.
To use the debugger, the first line of the JSL script should be as follows:
/*debug step*/
Be sure to type it exactly as shown above, in the first line of the script, with no extra blanks (including extra
blanks within the comment). All letters must be lower case.
Removes the text currently in the designated line
and replaces it with the string argument.
Returns the number of lines in the script window
as an integer.
Returns all the text in the script window as a list of
strings, one line per string.
Reformats the script.
Runs the entire script in the script window.
Page 39

Chapter 1 Introducing JSL 19
Saving and Sharing Your Work
Figure 1.8 JSL Debugger
The following tasks are possible in the debugger.
Run Without Debugger Closes the debugger windows and runs the script normally.
Step Steps through the script one command at a time. A green arrow shows the current command.
Run Runs the script from the current command.
Add Watch Adds a variable to the watch list, located at the bottom of the debugger window. Watched
variables display their values as the script runs.
Remove Watch Removes a watched variable.
You can add a breakpoint to the script by clicking in the area to the left of a JSL line (the same area where
the green arrow circulates). A red circle appears at that line, and the script pauses when the line is executed.
Click the circle to remove the breakpoint.
Page 40
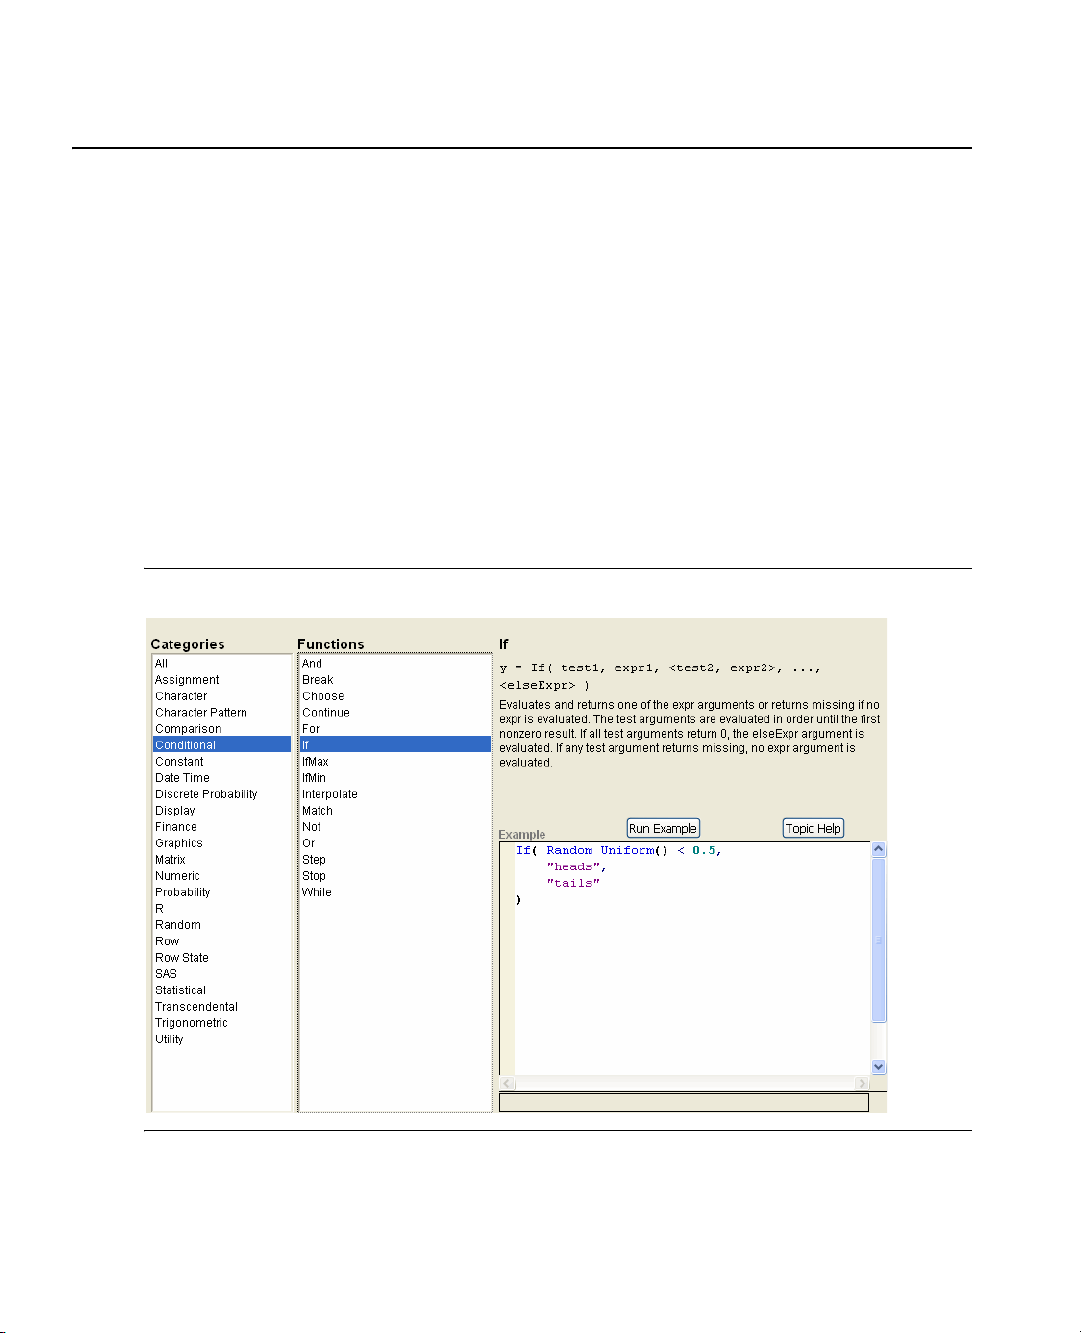
20 Introducing JSL Chapter 1
Help with JSL
Help with JSL
There are several places within JMP to get help writing or understanding a JSL script.
JSL Browsers
The Help menu contains indexes for browsing functions, objects, and display boxes in the scripting
language:
JSL Functions Shows information about all functions.
Object Scripting Shows scriptable objects and what messages each can interpret.
DisplayBox Scripting Shows the elements in results windows and their messages.
An entry in the JSL Functions Index includes the syntax and a brief explanation. Many entries also have
example code. The Topic Help button for each entry opens the Help system and shows you the entry for the
item in the “JSL Syntax Reference,” p. 439. See Figure 1.9 for the entry for
Figure 1.9 JSL Functions Index
If().
Page 41

Chapter 1 Introducing JSL 21
Help with JSL
Show Commands
Show Commands lists all the scriptable objects and functions in the log window, producing a text report that
is equivalent to the Functions browser. The default argument (if none is given) is
all JSL commands:
Show Commands();
Built-in Commands
Add 7 Internal
Subtract 7 Internal
Multiply 8 Internal
Divide 8 Internal
...
Other arguments are:
•
Scriptables (The platforms and their messages.)
•
DisplayBoxes (For display tree objects and messages that you can send to them. Note that some
objects are not scriptable.)
•
ScriptableObjects (Any objects that currently have instances.)
•
StatTerms (Places all the information in the Statistics Index into a JMP data table.)
•
All for all of the above.
Builtins, which shows
Try these commands and look in the log for the output.
Showing Translations
If you are running JMP in another language, you can get a table that shows all objects’ JSL commands in
English and the localized language.
Show Commands( translations );
This command creates a data table that lists commands, the English name, and the localized name.
Argument translations are enumerated after their commands in entries beginning with the (localized) word
Enumeration.
Show Properties
Show Properties lists the messages that can be sent to a scriptable object and produces a text report that
is equivalent to the
display.
Open( "$SAMPLE_DATA/Big Class.jmp" );
Show Properties( Current Data Table() );
Tables [Subtable]
Summary [Action]
Subset [Action]
Sort [Action]
Stack [Action]
Split [Action]
...
Objects browser. Scriptable objects might include a data table, an analysis platform, or a
Page 42

22 Introducing JSL Chapter 1
Help with JSL
Bivariate( Y( :weight ), X( :height ) );
Show Properties( Bivariate[1] ); //the analysis platform
Show Points [Boolean] [Default On]
Fit Mean [New Entity]
Fit Line [New Entity]
...
Show Properties( Report( Bivariate[1] ) ); //the platform's display tree
Close [Boolean]
Horizontal [Boolean]
Open All Below [Action]
Close All Below [Action]
...
Page 43

Chapter 2
JSL Building Blocks
Learn the Basic Components of JSL
JMP is scripted by a very simple language called JMP Scripting Language, or JSL. You might not need to
ever learn JSL, because almost every feature in the product is accessible through a direct user interface, as
well as through the scripting language. Even if you use JSL, you can usually get JMP to write the scripts for
you rather than typing them in yourself. JSL is most useful to power users who want to extend JMP past its
normal operating realm, or in production settings to automate a regularly scheduled analysis.
JSL is used in many places in JMP internally.
• Column Formulas are implemented internally in JSL.
• Platforms are launched using JSL internally.
• Platforms are interactively modified using JSL internally.
• Some graphics are performed through JSL.
Confusion alert! As described in the section on logical operators, a single pipe symbol
(
|) represents a logical OR. In the interests of brevity, programming and scripting
manuals commonly use a
| to represent the word or when discussing alternative values.
For example, a filepath can be either absolute or relative. When you see an argument
to a filepath function as
•
absolute to indicate an absolute filepath or
•
relative to indicate a relative filepath.
More than two options can be strung together with an or pipe in this way.
So, when you see words separated with a
absolute|relative, this means that you enter either:
|, read it as or.
Page 44

Contents
First JSL Script . . . . . . . . . . . . . . . . . . . . . . . . . . . . . . . . . . . . . . . . . . . . . . . . . . . . . . . . . . . . . . . . . . . . .25
The JSL Language . . . . . . . . . . . . . . . . . . . . . . . . . . . . . . . . . . . . . . . . . . . . . . . . . . . . . . . . . . . . . . . . . . .25
Lexical Rules of the Language . . . . . . . . . . . . . . . . . . . . . . . . . . . . . . . . . . . . . . . . . . . . . . . . . . . . . . 26
Data Elements. . . . . . . . . . . . . . . . . . . . . . . . . . . . . . . . . . . . . . . . . . . . . . . . . . . . . . . . . . . . . . . . . . .32
Operators . . . . . . . . . . . . . . . . . . . . . . . . . . . . . . . . . . . . . . . . . . . . . . . . . . . . . . . . . . . . . . . . . . . . . . 33
Context: Meaning is Local. . . . . . . . . . . . . . . . . . . . . . . . . . . . . . . . . . . . . . . . . . . . . . . . . . . . . . . . . . . . .36
Programming Versus Scripting . . . . . . . . . . . . . . . . . . . . . . . . . . . . . . . . . . . . . . . . . . . . . . . . . . . . . .36
Data Table Context. . . . . . . . . . . . . . . . . . . . . . . . . . . . . . . . . . . . . . . . . . . . . . . . . . . . . . . . . . . . . . .37
Scoping Operators. . . . . . . . . . . . . . . . . . . . . . . . . . . . . . . . . . . . . . . . . . . . . . . . . . . . . . . . . . . . . . . .38
Name Resolution. . . . . . . . . . . . . . . . . . . . . . . . . . . . . . . . . . . . . . . . . . . . . . . . . . . . . . . . . . . . . . . . .38
Name-Binding Rules. . . . . . . . . . . . . . . . . . . . . . . . . . . . . . . . . . . . . . . . . . . . . . . . . . . . . . . . . . . . . .38
Frequently-Asked Questions . . . . . . . . . . . . . . . . . . . . . . . . . . . . . . . . . . . . . . . . . . . . . . . . . . . . . . . .41
Function Resolution Rules . . . . . . . . . . . . . . . . . . . . . . . . . . . . . . . . . . . . . . . . . . . . . . . . . . . . . . . . 42
Gluing Expressions Together . . . . . . . . . . . . . . . . . . . . . . . . . . . . . . . . . . . . . . . . . . . . . . . . . . . . . . . . . . 42
Variables . . . . . . . . . . . . . . . . . . . . . . . . . . . . . . . . . . . . . . . . . . . . . . . . . . . . . . . . . . . . . . . . . . . . . . . . . .43
Wat ch . . . . . . . . . . . . . . . . . . . . . . . . . . . . . . . . . . . . . . . . . . . . . . . . . . . . . . . . . . . . . . . . . . . . . . . . .43
Show Symbols, Clear Symbols, and Delete Symbols . . . . . . . . . . . . . . . . . . . . . . . . . . . . . . . . . . . . . 44
Locking and Unlocking Symbols. . . . . . . . . . . . . . . . . . . . . . . . . . . . . . . . . . . . . . . . . . . . . . . . . . . . .45
Local . . . . . . . . . . . . . . . . . . . . . . . . . . . . . . . . . . . . . . . . . . . . . . . . . . . . . . . . . . . . . . . . . . . . . . . . . .45
Datetime Operators. . . . . . . . . . . . . . . . . . . . . . . . . . . . . . . . . . . . . . . . . . . . . . . . . . . . . . . . . . . . . . . . . 46
Constructing Dates . . . . . . . . . . . . . . . . . . . . . . . . . . . . . . . . . . . . . . . . . . . . . . . . . . . . . . . . . . . . . . 46
Extracting Parts of Dates . . . . . . . . . . . . . . . . . . . . . . . . . . . . . . . . . . . . . . . . . . . . . . . . . . . . . . . . . . 46
Arithmetic on Dates . . . . . . . . . . . . . . . . . . . . . . . . . . . . . . . . . . . . . . . . . . . . . . . . . . . . . . . . . . . . . 47
Converting Datetime Units. . . . . . . . . . . . . . . . . . . . . . . . . . . . . . . . . . . . . . . . . . . . . . . . . . . . . . . . 47
Y2K-Ready Date Handling . . . . . . . . . . . . . . . . . . . . . . . . . . . . . . . . . . . . . . . . . . . . . . . . . . . . . . . . 47
Datetime Notation . . . . . . . . . . . . . . . . . . . . . . . . . . . . . . . . . . . . . . . . . . . . . . . . . . . . . . . . . . . . . . 48
Currency . . . . . . . . . . . . . . . . . . . . . . . . . . . . . . . . . . . . . . . . . . . . . . . . . . . . . . . . . . . . . . . . . . . . . . . . . .53
Inquiry Functions . . . . . . . . . . . . . . . . . . . . . . . . . . . . . . . . . . . . . . . . . . . . . . . . . . . . . . . . . . . . . . . . . . . 53
Functions that communicate with users. . . . . . . . . . . . . . . . . . . . . . . . . . . . . . . . . . . . . . . . . . . . . . . . . . .55
Writing to the log . . . . . . . . . . . . . . . . . . . . . . . . . . . . . . . . . . . . . . . . . . . . . . . . . . . . . . . . . . . . . . . .55
Send information to the user. . . . . . . . . . . . . . . . . . . . . . . . . . . . . . . . . . . . . . . . . . . . . . . . . . . . . . . .56
Page 45

Chapter 2 JSL Building Blocks 25
First JSL Script
First JSL Script
This example shows you how to enter a script in the script editor, run it, and see the output.
1. Select
2. Select
File > New > Script.
View > Log on Windows, or Window > Log on Macintosh.
3. In the script window that appears, enter the following text:
X = 12 + 8;
A = "Hello, World";
Show( X, A );
4. Select Edit > Run Script.
You can also press CONTROL-R on Windows, or COMMAND-R on Macintosh.
The result appears in the Log window.
X = 20;
A = "Hello, World";
You have just created two global variables, X and A, and assigned values to them.
The JSL Language
JSL consists entirely of nested message names, with message contents enclosed in parentheses:
Message Name ( argument 1, argument 2, ... )
JSL expressions hold data, manipulate data, and send commands to objects.
The meaning of JSL phrases is dependent on who the message is sent to. The same name might mean one
thing in one context and something entirely different in another context.
Almost anything that obeys certain punctuation rules, such as matching parentheses, is a valid JSL
expression, though it might not be understood by the object it is sent to.
Here is a valid JSL expression:
New Window( "A Window",
<<modal,
Text Box( "Hello, World" ),
Text Box( "-----" ),
Button Box( "OK" )
);
Notice the following:
• Names can have embedded blanks.
• Message contents are enclosed in parentheses, which must be balanced.
• Items are separated by commas.
• You can use upper-case and lower-case characters interchangeably.
Page 46

26 JSL Building Blocks Chapter 2
The JSL Language
• Messages are commonly nested inside other messages.
Lexical Rules of the Language
The language consists of the following types of tokens. Each are discussed briefly in subsections below.
Ta bl e 2 .1 Ty p es o f To ke n s i n J S L
To ke n E xa m pl e
Commas and
, and ()
Parentheses
Names
Numbers and
Dates
sqrt
Distribution
Net Income
12.3
1.24E9
31Oct99:23:59:59
Quoted strings
Matrices
Lists
"ABC"
[1 2, 3 4]
{oil,vinegar}
Associative Arrays { { "gps", [78.7812 35.7873] }, {"high schools", {"Cary",
"Green Hope", "Panther Creek"} }, {"population", 127640},
Operators
{"state", "NC"}, {"weather", {"sunny", "warm"} } }
+ - * /
File Paths "$SAMPLE_DATA/Big Class.jmp"
Comments
// the rest of a line after // is a comment
Commas
/* these symbols start and stop comments of any length */
Commas ( , ) separate items, such as items in lists, rows in matrices, or named arguments to a function.
mylist = {1, 2, 3};
yourlist = List( 4, 5, 6 );
mymatrix = [3 2 1, 0 -1 -2];
Note: when you have a sequence of commands to execute, you do not separate them with commas. Rather,
you glue them together with semicolons, as discussed under “Gluing Expressions Together,” p. 42.
Page 47

Chapter 2 JSL Building Blocks 27
The JSL Language
Parentheses
Parentheses ( ) are used to group operations in an expression and to delimit arguments to a function, such as
in
root(49). Parentheses also delimit the end of a function name even when arguments are not needed.
Consider
e( ) below, where the empty argument “()” after “e” is what distinguishes JSL’s function for e
from the name “e.”
For( i = 0, i < 10, i++, Show( i, e() ^ i ) );
Be careful that parentheses match. Every ( needs an ), or else errors result.
On Windows, the script editor can match fences (parentheses, brackets, and braces). Press CTRL-] with
your cursor in any part of a script. The editor searches for fences, highlighting the text between the first set
of opening and closing fences that it finds. Repeat this process to highlight the next-higher fence.
Names
A name is exactly what you think: something to call a thing. For example, when you assign the numeric
value 3 to a global variable in the statement
too. In the statement
Log( 4 ), the word “Log” is the name of the logarithm function. A name is any
language token that is not a number or a string or a special symbol operator (such as
a = 3, “a” is a name. Commands and functions have names,
+ or – or ++ or ^).
Names have a few rules:
•Names must start with an alphabetic character or underscore (
a-z A-Z _), and can continue with the
following:
– alphabetic characters (
– numeric digits (
a-z A-Z)
0-9)
– whitespace characters (spaces, tabs, and line and page delimiters)
– double-byte characters
– a few punctuation or special characters (apostrophes (
(
\), underscore (_))
‘), percent signs (%), periods (.), backslashes
• When comparing names, the whitespace characters (like spaces, tabs, and newlines) are ignored, and
upper and lower case is not distinguished. For example, the names
Forage and for age are equivalent.
Note: Why does the language allow whitespace characters inside names? For one reason, it is good for the
names of commands and options to match the equivalent commands in menus and windows. Another
reason is because people think in terms of multi-word names. The price of allowing whitespace characters is
that JSL needs more delimiters, specifically commas and parentheses.
• Actually, you can still have a name that is any other sequence of characters. If it does not obey the rules
above, it needs to be quoted and placed inside a special parser directive called
use a global variable with the name
-)(*$%(*&$%A, you must use Name( ) every time it appears in
Name( ). For example, to
JSL:
Name( "-)(*$%(*&$%A" ) = 42;
foo = 4;
Print( foo + Name( "-)(*$%(*&$%A" ) );
Page 48

28 JSL Building Blocks Chapter 2
The JSL Language
46
is harmless when it is not needed. For example, foo and Name( "foo" ) are exactly the same
Name
thing.
Numbers
Numbers can be written as integers, decimal numbers, in scientific notation with an E preceding the power
of ten, and as dates, times, or date/time values. A single period by itself is the missing numeric value
(sometimes called NAN for “not a number”).
For example, these are all numbers:
. 1 12 1.234 3E3 0.314159265E+1 1E-20
If you precede a number with a minus sign, the minus sign is usually interpreted as a prefix operator, not
part of the number. You can follow a number immediately with an E followed by a power of ten you want to
scale the number by. For example 3E2 means 3 times 10 to the power 2, or 300. If you need a negative
exponent of ten in E notation, that minus sign is part of the number.
Dates and Times
JMP supports datetime values in a variety of common date/time notation formats. Datetime values are
stored and computed as a number of seconds since midnight, January 1, 1904. However, you can enter a
datetime value literally, using the format ddMonyyyy:hh:mm:ss.ddd. For example:
x = 14Feb2002:19:15:00;
Several shorter forms can also be used for datetime literals:
x = 14Feb2002:19:15;
x = 14Feb2002;
y = 19:15:00;
y = 19:15;
JMP has numerous operators for converting datetime values to strings in common notations, for example:
invitation = "Would you like to dine with me on " || Long Date( x ) || "?";
These and other datetime subjects are detailed in “Datetime Operators,” p. 46.
Quoted Strings
Strings are put in double quotation marks. Be careful to include the end quotation mark, or your string
includes unintended text until it finds the next double quotation mark.
How do you put a double quotation mark inside a quoted string? Inside quoted strings, you can use a special
escape sequence
script and look at the title of the window:
New Window( "For example,\!"Hello\!" is a quoted string",
);
"Would you like to dine with me on Thursday, February 14, 2002?“
\! (backslash-bang) to precede a code for special characters. For example, run the following
Text Box( Char( Repeat( "*", 70 ) ) )
Page 49

Chapter 2 JSL Building Blocks 29
The JSL Language
Warning: The null character is dangerous to use, because it is normally treated as the end of the string.
Ta bl e 2 .2 Escape Sequences for Quoted Strings
\!b
\!t
\!r
\!n
\!N
\!f
\!0
\!\
\!"
a. On Macintosh, this is CR (carriage return character, hexadecimal ‘0D’). On
Windows, this is CR LF (carriage return followed by a linefeed, hexadecimal ‘0D0A’).
Sometimes, long passages require a lot of escaped characters. In these cases, use the notation
blank
tab
carriage return only
linefeed (newline) only
inserts line breaking characters appropriate for the host environment
formfeed (page break)
null character. (See warning.) Type the number zero, not the letter O.
backslash
double quotation mark
a
\[...]\ and
everything between the brackets does not need or support escape sequences. Here is an example where
\[...]\ is used inside a double-quoted string.
jslPhrase = "The JSL to do this is :\[
a = "hello";
b = a|| " world.";
show(b);
]\ and you use the Submit command to run it.";
Matrices
Matrices can be specified as signed numbers inside brackets, with values separated by blanks or other
whitespace characters, and rows separated by commas or semicolons. Brackets are also used to represent
subscripting, when brackets occur after another expression. You can represent an empty matrix of no rows
and no columns by
A = [1 2, 3 4];
two = A[1, 2]; // subscript picks the first row, second column element from A
Empty = [];
[].
Matrices are discussed at greater length in the “Matrices” chapter.
Page 50

30 JSL Building Blocks Chapter 2
The JSL Language
Lists
Like matrices, lists are compound data structures, but they are more flexible than matrices. Lists are a way to
store numerous items of different type: numbers, text strings, expressions, matrices, and even other lists.
Lists can be expressed as arguments for the function
A = List( 1, 2, B, Sqrt( 3 ), List( a, b, 3 ) );
A = {1, 2, B, Sqrt( 3 ), {a, b, 3}};
List( ), or simply between { and } curly braces:
Lists are discussed at greater length under “Lists,” p. 68 in the “Programming Functions” chapter.
Associative Arrays
An associative array maps unique keys to values (possibly non-unique). Other languages call this type of data
structure a dictionary a map, a hash map, or a hash table. A key is a quoted string, while the value associated
with that key can be strings, numbers, dates, matrices, lists, and so forth. For example:
cary = Associative Array();
cary["state"] = "NC";
cary["population"] = 127640;
cary["gps"] = [78.7812 35.7873];
cary["weather"] = {"sunny", "warm"};
cary["high schools"] = {"Cary", "Green Hope", "Panther Creek"};
Associative arrays are discussed at greater length under “Associative Arrays,” p. 72 in the “Programming
Functions” chapter.
Operators
Operators are one- and two-character symbols for common arithmetic actions. Operators come in several
varieties: infix (with arguments on either side, such as
its right side, such as
incrementing a).
JSL operators all have function equivalents. Operators are discussed at greater length under “Operators,”
p. 33.
File Paths
In JMP, the preferred file path format is the POSIX (or UNIX) format, with forward slashes as separators.
Each host still accepts its native format for compatibility. This, along with path variables, often eliminates
the need for
Path variables are supported at the beginning of a POSIX path. JMP recognizes
SAMPLE_DATA, ENGLISH_SAMPLE_DATA, SAMPLE_IMPORT_DATA, SAMPLE_SCRIPTS, SAMPLE_IMAGES,
JMP_HOME, and TEMP as path variables. If you also have installed JMP Genomics, GENOMICS_HOME is also
available. They are used with a dollar sign at the beginning of a path.
Users can also add their own path variables, or override some of the built-in ones with the JSL functions
+ in 3+4, or = in a=7), prefix (with one argument on
!a for logical negation), or postfix (with one argument on its left side, such as a++ for
if(host is(...)...) logic to open files in a portable script.
HOME, DOCUMENTS,
Open("$SAMPLE_DATA/Big Class.jmp")
Page 51

Chapter 2 JSL Building Blocks 31
The JSL Language
posixPath = Set Path Variable(varName, posixPath);
posixPath = Get Path Variable(varName);
varName
is case-sensitive and does not include the dollar sign.
Confusion alert! You cannot override HOME, DOCUMENTS, or TEMP, and Get Path Variable does not
retrieve the settings for them. Instead, use this JSL function:
posixPath = Convert File Path("$HOME");
There are JSL functions for accessing the default directory:
posixPath = Set Default Directory(posixPath);
// returns the new directory path
posixPath = Get Default Directory();
The default directory is used for resolving relative paths. The file search list is also used for resolving relative
paths for opening files (not for saving).
You can convert among file paths using the
Convert File Path (path, <absolute|relative>, <POSIX|windows>,
<base(dir_path)>);
Convert File Path command.
For the <optional> arguments above, the defaults are absolute, POSIX, and a base path of the default
directory. The input path can be in Windows or POSIX style.
Path variables have the following characteristics:
• When changing the language that JMP runs in, their definitions are changed to match the language
automatically.
• When changing from running one version of JMP to another (for example, JMP 8 and then JMP 9),
their definitions are changed to match the language automatically.
•The path variable
$ENGLISH_SAMPLE_DATA always holds the definition of the English Sample Data
folder.
The path variable
$ALL_HOME points to a folder that can be accessed by all users on a machine. These
folders are different according to the operating system:
Ta bl e 2 .3 $ALL_HOME Path Variable
Operating System All Users Folder
Windows 7 or
C:\ProgramData\SAS\JMP\9
Windows Vista
Windows XP C:\Documents and Settings\All Users\Application Data\SAS\JMP\
Macintosh /Users/Shared/
Page 52

32 JSL Building Blocks Chapter 2
The JSL Language
Comments
Comments are notations that you add to your code that are ignored by the parser. Comments can be started
by either
// or /*. The // form continues until the end of a line. The /* form continues until a closing */
. Comments cannot be inside quoted strings.
Ta bl e 2 .4 Comments in JSL Scripts
Symbol Syntax Explanation
// // comment
/* */ /* comment */
Note: Add
Data Elements
Generally the language tokens translate into JSL data elements and expressions. JSL uses the following basic
elements in the language:
• integers
• numbers (floating point)
• character strings
•names
•lists
a list holds a number of other values, including nested lists and expressions
Doe family = List( John Doe, Jane Doe, Baby Doe );
Doe family = { John Doe, Jane Doe, Baby Doe };
• associative arrays
an associative array maps keys to values, which can be just about any other data element
•matrices
a matrix is a row-by-column table of numbers
Design Matrix = [1 1, 1 -1];
• expressions
expressions can be treated as complex data and manipulated by certain operators
• references to scriptable objects:
Start a comment line; does not have to be at beginning of line, but
everything following to the end of the line is a comment.
A comment that can appear in the middle of a line of script. Script text
before and after the comment is undisturbed. The
/*...*/ punctuation
is a convenient way to remove portions of script temporarily. These two
statements are equivalent:
c=1+ /* comment */ 2;
c=1+2;
//! to the beginning of a script to prevent it from being seen by users of the script.
Page 53

Chapter 2 JSL Building Blocks 33
The JSL Language
• data table columns
Operators
In order to make writing algebraic expressions natural, JSL has adopted certain special character operators.
These operators have the same meaning as if the phrase had been written as a message or function. For
example, the following two statements are equivalent:
Note: Usually white space is ignored in JSL, so that “netincomeaftertaxes” and “net income after taxes” are
the same thing. There is one exception: the two-character operators must not have a space between
characters, or they will be misunderstood. Always type these without spaces in between:
data table reference
obtained from the Open() or Current Data Table() function (represented
by dt in syntax summaries)
data column reference obtained from the Column() function (represented by col in syntax
summaries)
scriptable object reference obtained from platform launches or Scriptable class subscripting
(represented by obj in syntax summaries)
displayBox reference reports or parts of reports in windows (represented by db in syntax summaries)
Net Income After Taxes = Net Income - Taxes;
Assign( Net Income After Taxes, Subtract( Net Income, Taxes ) );
||, **, <=, >=, !=, ==, +=, -=, *=, /=, ++, --, :=, |/, <<, ::, :*, :/, :^, /
/, /*, */
The assignment operation can be written either as a function Assign or as an infix operator =. Similarly,
subtraction can be done with the
Subtract function, or the infix minus sign; they are equivalent inside
JMP.
Another common operator is the semicolon (
; ). The semicolon is a gluing operator that is used to both
separate yet join one expression to another in a programming sequence. The function equivalent of this is
Glue, so a;b is the same as Glue(a,b). The semicolon or Glue operator returns the result of its last
argument. It is also legal to end an expression with a semicolon. This might lead you to think of it as a
statement terminator like some other languages, but it is designed as an infix operator. Terminating
semicolons are allowed at the end of a script stream and before a closing parenthesis or closing brace:
) or }.
Table 2.5 shows operators and their function equivalents. The operators are grouped in their order of
precedence, where the binding priority decreases with each group. For example, in
multiplication
Ta bl e 2 .5 Operators and Function Equivalents In Precedence Order
Operator Syntax Explanation
{} List {a,b}
a*b is done before the addition of c.
Construct a list.
List(a,b)
a*b+c, the
Page 54

34 JSL Building Blocks Chapter 2
The JSL Language
Ta bl e 2 .5 Operators and Function Equivalents In Precedence Order (Continued)
Operator Syntax Explanation
[] Subscript a[b,c]
Subscript(a,b,c)
++ Post Increment a++
Post Increment(a)
–– Post Decrement a––
Post Decrement(a)
^Power a^b
Power(a,b)
Power(x)
– Minus –a
Minus(a)
! Not !a
Not(a)
* Multiply a*b
Multiply(a,b)
:* EMult a:*b
EMult(a,b)
Subscripts identify specific elements within a
data element a, where a could be a list, a matrix,
a data column, a platform object, a display box,
and so forth.
Adds one (1) to a, in place.
Subtracts one (1) from a, in place.
Raise a to exponent power b. With only one
argument, 2 is assumed as the power, so
Power(x) computes x
2
.
Reverses sign of a.
Maps nonzero values to 0, maps 0 values to 1.
Multiplies a by b.
Elementwise multiplication for matrices a and b.
/Divide a/b
Divide(a,b)
Divide(x)
:/ EDiv a:/b
EDiv(a,b)
+ Add a+b
Add(a,b)
– Subtract a–b
Subtract(a,b)
|| Concat a||b
Concat(a,b)
Divide(a, b) divides a by b.
Divide(x) interprets the argument as a
denominator and implies 1 as the numerator,
yielding the reciprocal 1/x.
Elementwise division for matrices a and b.
Adds a and b.
Subtracts b from a.
Concatenates strings together.
Page 55

Chapter 2 JSL Building Blocks 35
The JSL Language
Ta bl e 2 .5 Operators and Function Equivalents In Precedence Order (Continued)
Operator Syntax Explanation
matrix1 || matrix2
Concat(matrix1, matrix2)
|/ VConcat matrix1|/matrix2
VConcat(matrix1, matrix2)
:: Index a::b
Index(a,b)
<< Send Send(object, message)
object << message
== Equal a==b
Equal(a,b)...
!= Not Equal a!=b
Not Equal(a,b)...
< Less a<b
Less(a,b)...
<= Less or Equal a<=b
Less or Equal(a,b)
Horizontally concatenate matrices.
Vertically concatenate matrices.
For matrices, generates the integers from a to b.
(Colons are also used as infix operators for
scoping, where
and
::a means JSL global variable a. See
:a means data table column a,
“Global Scoping Operator,” p. 40.)
Send message to object.
Boolean values for comparisons. They all return
1 if true, 0 if false. Missing values in either a or b
causes a return value of missing, which evaluates
as neither true nor false.
> Greater a>b
Greater(a,b)
>= Greater or Equal a>=b
Greater or Equal(a,b)
<=, < Less Equal Less a<=b<c
Less Equal Less(a,b,c)
<, <= Less Less Equal a<b<=c
Less Less Equal(a,b,c)
&And a&b
And(a,b)
Range check. Return 1 if true, 0 if false. Missing
values in either a or b propagate missing values.
Logical And. Returns true if both are true. See
“Missing Values,” p. 82 in the “Programming
Functions” chapter, for treatment of missing
values.
Page 56

36 JSL Building Blocks Chapter 2
Context: Meaning is Local
Ta bl e 2 .5 Operators and Function Equivalents In Precedence Order (Continued)
Operator Syntax Explanation
|Or a|b
Or(a,b)
= Assign a=b
Assign(a,b)
+= Add To a+=b
AddTo(a,b)
–= Subtract To a–=b
SubtractTo(a,b)
*= Multiply To a*=b
MultiplyTo(a,b)
/= Divide To a/=b
DivideTo(a,b)
;Glue a;b
Glue(expr, expr, ...)
Context: Meaning is Local
Logical Or. Returns true if either or both are
true. See “Missing Values,” p. 82 in the
“Programming Functions” chapter, for
treatment of missing values.
Put the value of b into a. Replaces the current
value of a.
Add the value of b into a.
Subtract b from a, and put back into a.
Multiply b with a, and put back into a.
Divide b into a, and put back into a.
First do a, and then do b.
The JSL language is used both for scripting and programming. Programming emphasizes results, which
build from the inside out. Scripting emphasizes context, which builds from the outside in. Understanding
this distinction is crucial to understanding how JMP executes a script. For producing more complex JSL
programs, we recommend that you use namespaces, as described in “Advanced Scoping and Namespaces,”
p. 390 in the “Advanced Concepts” chapter.
Programming Versus Scripting
For example, consider how a typical programming statement evaluates:
x = Log( a * b ^ (c + d) )
The goal of this program is to find a result to assign to x. According to the rules of precedence for arithmetic
operators, this starts on the inside by evaluating c and d and adding them together. Next b is evaluated and
then raised to that power ( ), and that result in turn is multiplied by the evaluation of a. That result is
next passed to the
Log function, which finds the logarithm, and finally that result is assigned to x.
Evaluation started on the inside with
Now consider a typical scripting statement:
cd+
c + d and worked its way out.
Page 57

Chapter 2 JSL Building Blocks 37
Context: Meaning is Local
Fit Model( Effects( a, b, a * b ), Y( c ), Run Model );
The goal of this script is to launch an analysis platform and return a report. Evaluation starts on the outside
with
Fit Model, which calls the platform for fitting models. This platform in turn knows that Effects is
specifying the independent terms of a model, and in that context, the phrase
meaning. In the
Log statement above, it meant to multiply. In the Fit Model statement, a*b means the
a*b takes on a whole new
interaction term of a and b. In turn, a and b are evaluated as the data columns assigned to the global
variables a and b. The platform also knows that
term. Finally the platform sees
Model
and worked its way in.
Run Model and goes to work. Evaluation started on the outside with Fit
Y means that the column assigned to c is to be the response
Data Table Context
A formula column is evaluated down the rows of the data table. If a script needs to refer to a specific cell
each time, then you give a subscript to a specific row number. For example, this formula column gives the
ratio within each row, where
New Column( "Ratio", formula( Height / Weight ) );
This gives the ratio of each row’s Height to the Weight in row 1:
New Column( "Ratio B", formula( Height / Weight[1] ) );
There is a current row number that determines the cells of the data table, which can be set or displayed with
the function
Row(), for example.
height and weight are columns such as in the sample data table Big Class:
Row(); // returns current row number
Row() = 3; // makes the third row the current row
By default, the current row is always 0, which means that the following statement on its own returns a
missing value and be generally useless.
ratio = height / weight;
However, if you include something in the script to set the current row to a specific row number (for
example, the third), the result is assigned to the global variable ratio.
Row() = 3;
ratio = height / weight;
Another possibility is to ignore the current row and instead use subscripts to ask for a specific row number.
This version divides the height in row 3 by the weight in row 4:
::ratio = height[3] / weight[4]
Still another possibility is to create a column ratio and iterate the division a row at a time down the whole
column:
New Column( "ratio" );
For Each Row( :ratio = height / weight );
If you are working with global variables, pre-evaluated statistics, and so forth, you do not need to consider
the current row. (Pre-evaluated statistics are single number values computed from the data table, as discussed
in “Pre-Evaluated Statistics,” p. 151 in the “Data Tables” chapter.)
Page 58

38 JSL Building Blocks Chapter 2
Context: Meaning is Local
::myCalc = Col Mean( height ) / Col Mean( weight );
Scoping Operators
The scripts in the previous section used colons : or double colons :: in front of some names. These are
scoping operators. They tell JMP how to interpret the names that follow in cases that could be ambiguous.
For example, when a data table column and a JSL global variable have the same name. Scoping operators
and the rules for name resolution are discussed in detail under “Name Resolution,” p. 38, later in this
chapter.
:x; // data table column
::x; // JSL global variable
x; // depends on state when first used
Name Resolution
The following types of objects can be identified by name:
• Columns and table variables in a data table
• Global variables, which exist for a session
• Scriptable object types
• Parameters and
Locals inside formulas
If a name is just part of a script for an object, then its meaning is usually the name of an option or method
in the object. Otherwise it is considered by the evaluator using the rules in this section. If the name is
followed by parentheses, then it is regarded as a function. Otherwise, the name is looked up as some object.
Global variables are names that exist for the remainder of a session to hold values. Globals can contain many
types of values, including numbers, strings, lists, and references to objects. They are called globals because
they can be referred to almost anywhere, not just in some specific context.
Most of the time, you can just use an object’s name directly to refer to the object.
Ratio = Height / Weight;
N = N + 1;
Distribution( ... );
Now the trick is to learn the rules as to when you are referring to a column, when to a global, and when to a
type. This knowledge helps you to know when you can use the name directly and when you need to qualify
it somehow.
Name-Binding Rules
From a programming point of view, name resolution is important when getting and setting values in a
script. Names that are referred to for name-reference, rather than to get or set a value, are not resolved.
Rather they are just passed along, as with a script to launch a platform specifying certain columns to be
analyzed.
There are six possible resolutions for any name in a script. JMP tries each of the following in order:
Page 59

Chapter 2 JSL Building Blocks 39
Context: Meaning is Local
1. If followed by a pair of parentheses ( ), look it up as a function; see “Function Resolution Rules,” p. 42,
for details.
2. If not prefixed by
3. If not prefixed by
:, look it up as a global variable.
::, look it up as a data table column or table variable.
4. Look it up as a local variable.
5. Look it up as a platform launch name (for example,
Distribution or Bivariate).
6. If used as the target of an assignment (as an L-value), create and use a global variable.
A name in a script is resolved the first time it is used to get or set a value, and its resolution persists
thereafter. The operators
: and :: are always resolved respectively as As Column() and As Global().
Exceptions
If a name is resolved to a column in a data table that is closed, then it re-resolves the next time it gets or sets
in case the data table has been opened in the meantime. Other exceptions are function definitions, column
formulas, and nonlinear formulas.
When an Unscoped Name Refers to a Table Column
When an unscoped name is resolved to get or set a value, then it refers to a column in a data table, rather
than a global variable under these circumstances:
• if no global, local, or parameter of that name already exists,
• and the data table in context has a column of that name,
• and
– either the current row is set to a positive value
Warning: The current default row is now 0 instead of 1, as in JMP 3 and earlier.
– or the name is subscripted. For example,
If the data table has a table variable by that name, then the table variable takes precedence. In all other cases,
it binds to a global, local, or parameter.
Note: When an unqualified name in JSL is resolved to a data column in a data table, it must be associated
with the current data table. This is different from the rule in JMP 4 and earlier.
Exceptions
Column formulas and nonlinear formulas.
Column Scoping Operators
Column scoping operators can be used to force names to be resolved as columns.
A[i].
Page 60

40 JSL Building Blocks Chapter 2
Context: Meaning is Local
1. The prefix colon ( : ) means that the name refers to a table column or table variable only, never a global.
The prefix
Current Data Table() either returns or is assigned.
:colName
: refers to the current data table context. The current data table is the data table that
2. The infix colon ( : ) operator extends this notion to specify which data table has the column by using a
data table reference (data table references are discussed in the chapter “Data Tables,” p. 85). The
function equivalent is
dataTableRef:name;
As Column(dataTableRef, name);
As Column.
Therefore, these are equivalent:
:name;
Current Data Table():name;
As Column( Current Data Table(), name );
The Column function can also be used. However, it always evaluates its arguments, so you need to specify a
row to refer to a cell rather than the whole column.
Column( "X" ); // Refers to column X.
Column( "X", 12 ); // Refers to the cell of row 12, column X.
Column( "X" )[]; // Refers to the cell of the current row of column X.
Column( a ); // Evaluates a and looks up the column of the result.
Global Scoping Operator
A global scoping operator can be used to force names to be resolved as globals. The prefix double-colon
(
:: ) means that the name refers to a global only, never a table column. The function equivalent is As
Global
Ta bl e 2 .6 Scoping operators
.
::globalName;
As Global( globalName );
Operator and
Function
:As Column:name
:: As Global ::name
Syntax Explanation
Scoping operator. Forces name to be evaluated as a data table
dt:name
As Column(dt,
name)
column in the table given by the optional data table reference
argument, dt, rather than as a global variable.
Scoping operator. Forces name to be evaluated as a global
As Global(name)
variable, not a data table column.
(Notice that double-colon is also used as an infix operator to
represent ranges.)
Page 61

Chapter 2 JSL Building Blocks 41
Context: Meaning is Local
Frequently-Asked Questions
Should you scope?
Yes. When in doubt, scope. Scoping is especially important if you are writing scripts that define globals with
the same names as data table columns that you are not aware of. For example, scripts that might be used by
many people on a variety of data tables. Since global names always take precedence, you have to work to
ensure that the column name references map to a column and that globals do not map to a column. If you
are writing such scripts, consider using explicit scoping and namespaces. See “Advanced Scoping and
Namespaces,” p. 390 in the “Advanced Concepts” chapter.
Prefix scope operators do not take run-time overhead after the first resolution. Infix scope operators always
take run-time overhead.
What is the difference between a column referred to by name, and a column reference? If I have a column
reference in a global, how do I assign a value to a cell in the column?
Try submitting the following examples one line at a time. These scripts assume that you have a data table
with a column named “A” and you do not have a global variable named “A.” The first few examples begin
with a
Row()=3 assignment to set the current row to a valid row, in this case the third row. The current row
is irrelevant in the last few examples.
// assumes a data table with a column "A" and sufficient rows
Row() = 3; A = 1; //sets the current row of A to 1
Row() = 3; :A = 2; //sets the current row of A to 2
Row() = 3; :"A" = 3; //sets the current row of A to 3
ColA = Column( "A" ); //sets the global ColA to refer to column A
ColA[3] = 4; //sets the third row of A to 4
ColA << Formula( 6 ); //sets the formula for A to be 6
Confusion alert! The current row for scripting is not related to rows being selected
(highlighted) in the data table or to the current cursor position in the data table
window. The current row for scripting is defined to be zero (no row) by default. You
can set a current row with
setting only lasts for the duration of that script. Then,
Row (for example, Row() = 3). Please note that such a
Row() reverts to its default
value, zero. This behavior means that submitting a script all at once can produce
different results than submitting a script a few lines at a time.
Another way to establish a current row for a script is to enclose it in
For Each Row,
which executes the script once for each row of the current data table. See “What is the
Current Row?,” p. 101 in the “Data Tables” chapter, for more information.
Will a scoping operator “stick” to its name?
Yes. Once you use a scoping operator with a name, that name continues to be resolved accordingly for all
subsequent occurrences of the name. For example, to protect against overwriting data tables that happen to
contain a column named “i” when you use i as an index inside a
For() loop, declaring ::i at the head of
the script is all the protection that you need for the whole script.
::i = 1;
Page 62

42 JSL Building Blocks Chapter 2
Gluing Expressions Together
For( i = 1, i < 10, i++, doScript );
Normally this is not a problem since at time of execution Row() would typically be 0. However, if Row() is
greater than 0, such as inside a
::i = 1;
For Each Row( For( i = 1, i < 10, i++, doScript ) );
For Each Row() loop, you should be careful:
Which has precedence when scoping, ":" or "[ ]"?
Scoping occurs before subscripting. This means that these two lines of code are equivalent:
dataTable:colName[i]
(dataTable:colName)[i]
Function Resolution Rules
A name followed by a list of arguments enclosed in parentheses is the syntax for a number of contexts in
JSL:
• a call to a built-in function
• a call to a user-defined function
• a named argument
• a nesting in a script for an object: either an option with an argument, or a sub-object with messages, or
any other use recognized by the object itself
Gluing Expressions Together
The semicolon operator evaluates each argument in succession, returning the result of the last one. For
example:
i=0; j=2
The semicolon in other languages is used as a statement terminator character. In JSL it is just a binary
operator for gluing together expressions. The result returned is the result of the right-most expression. The
function version of the semicolon is
Glue(a=2,b=3)
a=2; b=3
You can also add a semicolon at the end of an expression as a terminator character, but it is not required.
The semicolon is ignored if nothing follows it. Trailing semicolons are allowed at the end of a script stream,
and before a closing parenthesis or closing brace:
semicolon to avoid errors when copying and pasting small scripts into larger ones.
The
First function works just like Glue ( ; ) except that it returns the first argument’s result instead of the
last’s. For example, this script increments a counter global i after getting the i
enclosing the two steps inside
counter.
Glue, which makes the following two statements the same:
First( ) enables the script to return the datum, not the new value of the
) or }. It is useful to get in the habit of using a final
th
value of a variable, but
Page 63

Chapter 2 JSL Building Blocks 43
Variables
i=1; First(height[i], i++);
Example
What are the results of this script?
a=root(b=9;4);
Semicolon has weak precedence, so when JMP evaluates this statement, it first attempts to evaluate the
quantity inside the parentheses. JMP simply executes two separate statements:
b=9;
4;
Thus it assigns 9 to b, then it evaluates the last statement, 4. Several statements glued together return the
return value of the last statement, so 4 is returned for the expression inside the parentheses. JMP then takes
the square root of 4 and assigns the result (2) to a. Assignment always returns the assigned value, so the
ultimate return value for the whole script is 2. So, this script results in two assignments,
a=2 and b=9, and
returns 2.
What are the results of this script?
a=root(First(b=9,4));
executes both its statements but returns the result of the first, not the last. So the statement 4
First
accomplishes nothing, 9 is assigned to b, and the square root of 9, 3, is assigned to a.
Variables
Assigning a variable this way:
x=2;
makes a global variable. JMP has a single global variable space that all scripts use. You can also create local
variables.
We recommend that you begin each script with
variables local to your script, instead of using the global space. This strategy ensures that scripts cannot
“collide” by accidentally using the same global variable names and over-writing their values.
If you turn the
variable accessible throughout your script, but does not affect the global variable space.
The following commands can help you manage variables.
Watch
Watch lets you keep track of the value in a variable.
Watch draws a window to report the values of variables you list. Use the named argument All to watch the
values for all variables. The window updates whenever values change while the script is executing, or you can
Names Default To Here(1). This mode makes all your
Names Default To Here mode on, then assigning a variable as shown above makes that
Page 64

44 JSL Building Blocks Chapter 2
Variables
manually change values yourself by simply editing the value shown in the Watch window. This is a useful
debugging tool.
Watch(a, b);
Watch(all);
Show Symbols, Clear Symbols, and Delete Symbols
Show Symbols() lists all variables and namespaces that are defined both globally and in the local script,
along with their current values.
globally and in the local script.
Note: The older Show Globals() and Clear Globals() functions are aliases of the newer Show
Symbols() and Clear Symbols() functions.
Clear Symbols erases the values set for variables that are defined both
The function
Globals()
c = "Global Variable"; // this is in the global space
Names Default To Here( 1 );
a = 5; // this is local to this script
b = 6; // this is local to this script
Show Symbols();
Clear Symbols();
Show Symbols();
Delete Symbols() actually removes all global variables and namespaces, while Clear
removes only their values.
// Locals
a = 5;
b = 6;
// 2 Locals
// Globals
c = "Global Variable";
// 1 Globals
// Locals
a = Empty;
b = Empty;
// 2 Locals
// Globals
c = Empty;
// 1 Globals
Delete Symbols();
Show Symbols();
Nothing is displayed in the log after the last Show Symbols(), because they have all been completely
removed from memory.
Page 65

Chapter 2 JSL Building Blocks 45
Variables
Note: None of these three functions affect namespaces, although they do affect variables that hold
references to namespaces. To show namespaces, use
<< Delete.
Show Namespaces(). To delete a namespace, use ns
Locking and Unlocking Symbols
If you want to lock a symbol to prevent it from being changed, use Lock Symbols(). (Lock Globals()
is an alias.)
Lock Symbols (name1, name2, ...)
To release the lock and enable the global to be changed, use Unlock Symbols(). (Unlock Globals() is
an alias.)
Unlock Symbols (name1, name2, ...)
The primary use of these two commands is to prevent inadvertent changes to variables. For example,
locking a variable prevents a
another script.
Note: You c a nn ot us e Lock Symbols() to lock a namespace. Instead, use ns << Lock().
Clear Symbols() command from clearing a variable that is being used by
Local
Local lets you deal with local variables without affecting the name space around you. For example, suppose
you want to call something x, but there could already be an x global in another script that is calling your
script. Just put x inside a
Local block. This differs from using Names To Default To Here(1)
because you can set portions of a script local, thus insulating a portion from the rest of the script.
y= Local({x},
x = sqrt(b^2-4*a*c);
{(-b+x)/(2*a), (-b-x)/(2*a)});
The general form is:
Local( {list_of_variables_or_assignments}, body );
All occurrences of names in the body expression that match names listed for the first argument are resolved
locally.
Locals can be nested in Functions and other Locals.
Another example: in the following expression, mn and mx are never seen outside the scope of the
Local
function:
y = local( {mn=min(x,y),mx=max(x,y)}, mx*(mx-1)+mn );
This example manipulates an expression temporarily without changing the permanent contents of the
expression:
polynomial = Expr( a * x ^ 2 + b * x + c );
Show( polynomial );
polynomial = a * x ^ 2 + b * x + c;
Page 66

46 JSL Building Blocks Chapter 2
Datetime Operators
Local( {polynomial = Insert( Name Expr( polynomial ), Expr( d * x ^ 3 ), 1 )},
Show( polynomial )
);
polynomial = d * x ^ 3 + a * x ^ 2 + b * x + c;
Show( polynomial );
polynomial = a * x ^ 2 + b * x + c;
Datetime Operators
Constructing Dates
You can construct dates with the following operators. If it were the stroke of midnight, 1 December 2003,
all of the following statements would be equivalent. Each would return 3153081600, and you could pass
any of them to a date notation operator such as
Date DMY(1,12,2003);
Date MDY(12,1,2003);
Today();
3153081600
Long Date to get a recognizable format:
long date(today());
"Monday, December 1, 2003"
These operators are handy if you are setting up a date column to label rows, or any other case where you can
describe a series of date values generally:
new column("Entry date", format("m/d/y"),formula(Date DMY(row(),3,2001)));
// be sure the format is available on your machine
Extracting Parts of Dates
You can extract parts of date values using the operators Month, Day, Year, Day Of Week, Day Of Year,
Week Of Year, and Time Of Day, which all return integers. For example:
day of year(today());
335
Page 67

Chapter 2 JSL Building Blocks 47
Datetime Operators
Confusion alert! Because Sunday is the first day of the week, the first Sunday of each year always
starts week 2. Days before the first Sunday (if there are any) are in week 1. This means that in a
year in which January 1 is on Sunday, the first week is counted as the second week.
Example:
Week of Year(Date DMY(1,1,2006));
2
In years in which Sunday is the first day of the year, subtract 1 from Week Of Year() to obtain
the correct week number.
Arithmetic on Dates
You can perform the usual arithmetic operations with date/time data as with any other numeric data. For
example, you could find the days elapsed between entries:
new column("Days elapsed",
formula(
if(row()==1,., //to avoid error for row 1
//else for rows after 1:
(:Entry date[row()]-:Entry date[row()-1])/in days())));
Converting Datetime Units
The In Minutes, In Hours, In Days, In Weeks, and In Years operators are useful for re-expressing a
time interval in units other than seconds. For example, this returns the number of fortnights between now
and the next Leap Day.
(Date DMY(29,2,2004)-Today())/InWeeks(2);
Usually n is 1, but you could use In Years(10) (for example, to re-express an interval in decades).
Y2K-Ready Date Handling
JMP uses its own Y2K-ready algorithms for interpreting and displaying date/time strings rather than
supporting operating system-specific date/time formats. JMP respects the date/time separator-characters
chosen in the Regional Settings control panel (Windows) or the Date&Time control panel (Macintosh) for
interpreting and displaying dates.
JMP always displays four-digit years regardless of Regional Settings. If for some reason it should be necessary
to show two-digit years, use JMP’s operators for manipulating character strings.
Two-digit years are interpreted according to the current system clock year, according to the rules below. To
avoid ambiguity or override the default interpretation, type a four-digit year value.
Page 68

48 JSL Building Blocks Chapter 2
Datetime Operators
Ta bl e 2 .7 How JMP interprets two-digit years
What you
type
00–10 before 1990 (Win) 19__ type 5 in year 1979 1905
11–89 (Win) any time current century type 13 in year 1988 1913
11–90 (Mac) type 13 in year 2024 2013
90–99 (Win) before 2011 19__ type 99 in year 1999 1999
91–99 (Mac) during or after 2011 20__ type 99 in year 2015 2099
Note that three locale-specific formats (Locale Date, Locale Date Time h:m, Locale Date Time h:m:s) always
display the date time according to your regional settings.
Datetime Notation
Several operators convert numbers directly to common formats.
Short Date(2998080000);
"01/02/1999"
Long Date(2998080000);
"Saturday, January 2, 1999"
Abbrev Date(2998080000);
"Jan 2, 1999"
mdyhms(2998080000);
"01/02/1999 12:00:00 AM"
You can also use the Format and InFormat operators for displaying and entering date/time values in one of
many notation formats.
When it is evaluated Result Examples Result
before or during 1990 (Mac)
during or after 1990 (Win) 20__ type 5 in year 1991 2005
after 1990 (Mac)
Format(3096558900,":day:hr:m");
":35839:19:15"
InFormat("02Jan1999 13:01:55","ddMonyyyy h:m:s");
02Jan1999:13:01:55
Dates that are the results of expressions that are to be displayed in a text window (like the log window) are
given as a date attribute using
x = As Date(8Dec2000 + inDays(2));
As Date. For example:
shows as
10Dec2000
Page 69

Chapter 2 JSL Building Blocks 49
Datetime Operators
The formats JMP currently supports are shown in Table 2.8. You can also use them for the format argument
to a
Format message to a data column, as discussed in “Display Formats,” p. 127 in the “Data Tables”
chapter. Note that the date-separator character on your machine might differ from the
/ character shown
here.
You c a n enter time values in 24-hour format (military time) or with AM/PM designators.
Ta bl e 2 .8 Date/time formats supported in JMP
Type Format string Example
Date only "m/d/y" "01/02/1999"
"mmddyyyy" "01021999"
"m/y" "01/1999"
"d/m/y" "02/01/1999"
"ddmmyyyy" "02011999"
"ddMonyyyy" "02Jan1999"
"Monddyyyy" "Jan021999"
"y/m/d" "1999/01/02"
"yyyymmdd" "19990102"
“yyyy-mm-dd” “1999-01-02“
“yyyyQq“ 1999Q1
Date and time "m/d/y h:m" "01/02/1999 13:01"
"01/02/1999 1:01 PM"
"m/d/y h:m:s" "01/02/1999 13:01:55"
"01/02/1999 1:01:55 PM"
"d/m/y h:m" "02/01/1999 13:01"
"02/01/1999 1:01 PM"
"d/m/y h:m:s" "02/01/1999 13:01:55"
"02/01/1999 1:01:55 PM"
“y/m/d h:m” ‘1999/01/02 13:01’
‘1999/01/02 1:01 PM’
“y/m/d h:m:s” ‘1999/01/02 13:01:02
‘1999/01/02 1:01:02 PM’
"ddMonyyyy h:m" "02Jan1999 13:01"
"02Jan1999 1:01 PM"
Page 70

50 JSL Building Blocks Chapter 2
Datetime Operators
Ta bl e 2 .8 Date/time formats supported in JMP (Continued)
Type Format string Example
"ddMonyyyy h:m:s" "02Jan1999 13:01:02"
"02Jan1999 1:01:02 PM"
"ddMonyyyy:h:m" "02Jan1999:13:01"
"02Jan1999:1:01 PM"
"ddMonyyyy:h:m:s" "02Jan1999:13:01:02"
"02Jan1999:1:01:02 PM"
"Monddyyyy h:m" "Jan021999 13:01"
"Jan021999 1:01 PM"
"Monddyyyy h:m:s" "Jan021999 13:01:02"
"Jan021999 1:01:02 PM"
Day number and
time
Duration “:day:hr:m“ “52:03:01”, which reads fifty-two days, three hours, and
":day:hr:m" "34700:13:01"
":33:001:01 PM"
":day:hr:m:s" "34700:13:01:02"
":33:001:01:02 PM"
"h:m:s" "13:01:02"
"01:01:02 PM"
“h:m” "13:01"
"01:02 PM"
“yyyy-mm-ddThh:mm” 1999-01-02T13:01
“yyyy-mm-ddThh:mm:ss” 1999-01-02T13:01:02
one minute.
“:day:hr:m:s“ “52:03:01:30”, which reads fifty-two days, three hours, one
minute, and thirty seconds.
“hr:m“ “17:37”, which reads seventeen hours and thirty-seven
minutes.
“hr:m:s“ “17:37:04”, which reads seventeen hours, thirty-seven
minutes, and 4 seconds.
“min:s” “37:04”, which reads thirty-seven minutes and 4 seconds.
Long date "Date Long" (Display only) "Saturday, January 2, 1999"
Abbreviated date "Date Abbrev" (Display only) "Jan 2, 1999"
Page 71

Chapter 2 JSL Building Blocks 51
Datetime Operators
Ta bl e 2 .8 Date/time formats supported in JMP (Continued)
Type Format string Example
Locale Date “Locale Date” (Display only) Depends on the locale setting for your
operating system. For the United States, “01/02/1999"
Locale Date Time “Locale Date Time h:m” (Display only) Depends on the locale setting for your
operating system. For the United States, “01/02/1999
13:01“ or “01/02/1999 01:01 PM“
“Locale Date Time h:m:s” (Display only) Depends on the locale setting for your
operating system. For the United States, “01/02/1999
13:01:02“ or “01/02/1999 01:01:02 PM“
Note that the last five date/time formats are not available for date input.
Ta bl e 2 .9 Date/time operators
Operator Explanation
In Minutes(n)
In Hours(n)
In Days(n)
In Weeks(n)
In Years(n)
Date DMY(day, month, year)
Date MDY(month, day, year)
Toda y( )
Second(datetime)
Minute(datetime)
These operators return the number of seconds per n minutes, hours, days,
weeks, or years. Divide by these to re-express an interval in seconds as an
interval in other units.
Returns the specified date, expressed as the number of seconds since
midnight, 1 January 1904. For example, the second Leap Day of the
second millennium is
DateDMY(29,2,2004), which returns
3160857600.
Returns the specified date, expressed as the number of seconds since
midnight, 1 January 1904. For example, the second Leap Day of the
second millennium is
DateMDY(2,29,2004), which returns
3160857600.
Returns the current date and time expressed as the number of seconds
since midnight, 1 January 1904. No arguments are accepted, but the
parentheses are still needed.
Returns an integer representation for the second part of the date-time
value supplied.
Returns an integer representation for the minute part of the date-time
value supplied.
Page 72

52 JSL Building Blocks Chapter 2
Datetime Operators
Ta bl e 2 .9 Date/time operators (Continued)
Operator Explanation
Hour(datetime)
Day(date)
Month(date)
Year(date)
Day Of Week(date)
Day Of Year(date)
Week Of Year(date)
Time Of Day(date)
Short Date(date)
Long Date(date)
Returns an integer representation for the hour part of the date-time value
supplied.
Returns an integer representation for the day of the month of the date
supplied.
Returns an integer representation for the month of the date supplied.
Returns an integer representation for the year of the date supplied.
Returns an integer representation for the day of the week of the date
supplied. Weeks are Sunday–Saturday.
Returns an integer representation for the day of the year of the date
supplied.
Returns an integer representation for the week of the year of the date
supplied. Weeks are Sunday–Saturday. Note that the first Sunday of the
year begins week 2.
Returns an integer representation for the time of day of the date/time
supplied.
Returns a string representation for the date supplied, in the format mm/
dd/yy. For example,
"02/29/04".
Returns a string representation for the date supplied, formatted like
"Sunday, February 29, 2004".
Abbrev Date(date)
MDYHMS(date)
Format(date, "format")
In Format(string, "format")
Parse Date(string, "format")
As Date(expression)
Returns a string representation for the date supplied, formatted like "Feb
29, 2004"
.
Returns a string representation for the date supplied, formatted like "2/
29/04 00:02:20"
.
Returns the value in the format specified in the second argument. Most
typically used for formatting date/time values from a number of seconds
to a formatted date. Format choices are those shown in the
Column Info
dialog box; also see Table 2.8 “Date/time formats supported in JMP,”
p. 49.
Parses a string of a given format and returns date/time value expressed as if
surrounded by As Date(), returning the date in
ddMonyyyy format.
Formats a number or expression so that it shows as a date when streamed
out to a text window.
Page 73

Chapter 2 JSL Building Blocks 53
Currency
Currency
JMP supports the use of currency symbols. To set a specific currency, use the Format() function. The
syntax is:
Format(x,"format", <"currency code">, <decimal>)
where x is a column, or a number. (For datetime formats, see “Datetime Operators,” p. 46).
To designate a number or a column as a currency, the format argument must be set to “Currency”. Then
add the ISO 4217 code for a specific currency as a quoted string. This third argument is invalid unless the
format is set to “Currency”. For example:
Format(12345.6, "Currency", "GBP", 3)
"£12,345.600"
Inquiry Functions
How can you tell what type of data element you have? JSL has inquiry operators to test whether something
is or is not a specific type of data element.
JSL also has an inquiry operator to test whether a global variable, a data table, or a data column has a value
assigned or not:
assigned a value yet. Programmers call this an “uninitialized variable.” To check whether a global variable,
data table, or data column has a value yet, use
Is Empty. You can get errors if you try to refer to something that has not been created or
Is Empty with the name of the item.
Is Empty(myGlobal);
Is Empty(dt);
Is Empty(col);
In addition, JSL provides a general Type function that returns a string naming the type of the resulting
value. The possible type names are
Empty, Pattern, Date, Integer, Number, String, Name, Matrix, RowState, Expression,
Associative Array, or Blob.
Unknown, List, DisplayBox, Picture, Column, TableVar, Table,
For example:
Show(Type(1), Type("hi"), Type({"a",2}));
results in
Type(1):"Integer"
Type("hi"):"String"
Type({"a", 2}):"List"
Is Scriptable()
that the previous results are scriptable and only continue with a script after
is especially useful when parts of a script depend on previous-generated results. Test
IsScriptable() returns true.
Page 74

54 JSL Building Blocks Chapter 2
Inquiry Functions
Ta bl e 2 .1 0 Inquiry functions to identify object types
Syntax Explanation
Is Number(x)
Returns 1 if the evaluated argument is a number or missing numeric value, or 0
otherwise.
Is String(x)
Is Matrix(x)
Is Expr(x)
Is Name(x)
Is List(x)
Is Associative Array(x)
Is Scriptable(x)
Is Empty(global)
Is Empty(dt)
Is Empty(col)
Type (x)
Returns 1 if the evaluated argument is a string, or 0 otherwise.
Returns 1 if the evaluated argument is a matrix, or 0 otherwise.
Returns 1 if the evaluated argument is an expression, or 0 otherwise.
Returns 1 if the evaluated argument is a name-only expression, or 0 otherwise.
Returns 1 if the evaluated argument is a list, or 0 otherwise.
Returns 1 if the evaluated argument is an associative array, or 0 otherwise.
Returns 1 if the evaluated argument is a scriptable object, or 0 otherwise.
Returns 1 if the global variable, data table, or data column does not have a value
(is uninitialized), or 0 otherwise.
Returns a string naming the type of X.
Version and Host Information
Host Is is an inquiry operator. Host Is returns a Boolean result, either 1 if true or 0 if false. This is useful
for identifying the current operating system in scripts intended for use on Windows and Macintosh
platforms. Although now not necessary,
Host Is was frequently used to open data tables. For example:
dt=if(
host is(Windows),
open("..\sample data\Big Class.JMP"),
host is(Macintosh),
open("::sample data:big class"));
Another use is to specify different text sizes in reports for different operating systems. If you commonly
write your scripts on Windows and share them with people who use them on Macintosh, the results can
look different from what you intended. For example, this line sets the text to a larger size on Macintosh and
a smaller size on Windows:
txtsize = if(host is(Mac),12,10);
The JMP Version() function returns the JMP version as a string. The function puts a leading blank on
the version if it is less than 10 to make it easier to compare versions 7, 8, or 9 with version 10 in the future.
This function is not available in releases before 6.0.
JMP Version();
" 9.0"
Page 75

Chapter 2 JSL Building Blocks 55
Functions that communicate with users
Functions that communicate with users
Show, Print, and Write put messages in the log window. Speak, Caption, Beep, and StatusMsg
provide ways to say something to a viewer.
JMP’s scripting language has methods for constructing dialog boxes to ask for data column choices and
other types of information. See “Modal Windows,” p. 218 in the “Display Trees” chapter.
Writing to the log
Show
Show displays the items that you specify in the log. Notice that when you show variables, the resulting
message is the variable name, a colon
X=1;A="Hello, World";
show(X,A,"foo");
x = 1
a = "Hello, World"
"foo"
Mail can send an e-mail alert to a process operator.
:, and its current value.
Write
Print sends the message that you specify to the log. Print is the same as Show except that it prints only
the value of each variable without the variable name and colon.
X=1;A="Hello, World";
print(X,A,"foo");
1
"Hello, World"
"foo"
Write sends the message that you specify to the log. Write is the same as Print except that it suppresses
the quotation marks around the text string, and it does not start on a new line unless you include a return
character yourself with the
write("Here is a message.");
Here is a message.
myText="Here is a message.";
write(myText||" Do not forget to buy milk."); // use || to concatenate
write("\!NAnd bread."); // use \!N for return
Here is a message. Do not forget to buy milk.
And bread.
\!N escape sequence.
The sequence \!N inserts the line breaking characters that are appropriate for the host environment. For an
explanation of the three line breaking escape sequences, see “Quoted Strings,” p. 28 in the “JSL Building
Blocks” chapter.
Page 76

56 JSL Building Blocks Chapter 2
Functions that communicate with users
Send information to the user
Beep
Beep causes the user’s computer to make an alert sound.
Speak
Speak reads text aloud. On Macintosh, Speak has one Boolean option, Wait, to specify whether JMP
should wait for speaking to finish before proceeding with the next step. The default is not to wait, and you
need to issue
Wait(1), you probably want to interrupt execution before too long. If you change it to Wait(0), the
iterations proceed faster than the speaking possibly can and the result sounds strange. On Windows, you
can use a
for(i=99,i>0,i--,
A more practical example has JMP announce the time every sixty seconds:
Wait(1) each time. For example, here is a script certain to drive anybody crazy. With
Wait(n) command to accomplish the same effect.
speak(wait(1),char(i)||" bottles of beer on the wall, "
||char(i)||" bottles of beer; "
||"if one of those bottles should happen to fall, "
||char(i-1)||" bottles of beer on the wall. ")
Caption
// Time Announcer
script = expr(
tod = mod(today(),indays(1));
hr = floor(tod/inHours(1));
min = floor(mod(tod,inHours(1))/60);
timeText = "time, " || char(hr) || " " || char(min);
text = Long Date(today()) || ", " ||timeText;
speak(text);
show(text);
schedule(60,script); // seconds before next script
);
script;
You might use a similar technique to have JMP alert an operator that a process has gone out of control.
Caption brings up a small window with a message to the viewer. Captions are a way to annotate
demonstrations without adding superfluous objects to results windows. The first argument is an optional
{x,y} screen location given in pixels from the upper left; the second argument is the text for the window. If
the location argument is omitted, windows appear in the upper left corner.
The
Spoken option causes captions to be read aloud by the operating system’s speech system (if available).
Spoken takes a Boolean argument, and the current setting (on or off ) remains in effect until switched by
another
You can include pauses in the playback by including the named argument
Caption statement that includes a Spoken setting.
Delayed and a time in seconds.
Such a setting causes that caption and all subsequent caption windows to be delayed by that number of
Page 77

Chapter 2 JSL Building Blocks 57
Functions that communicate with users
seconds, until a different Delay setting is issued in a Caption statement. Use Delay(0) to stop delaying
altogether.
This script turns speaking on and leaves it on until the last caption.
caption({10,30},"A tour of the JMP Analyses", spoken(1), Delayed(5));
caption("Open a data Table");
bigClass=open("$SAMPLE_DATA/Big Class.JMP");
caption("A JMP Data Table consists of rows and columns of data");
caption("The rows are numbered and the columns are named");
caption({250,50},"The data itself is in the grid on the right");
caption({5,30},spoken(0),"A panel along the left side shows columns and other
attributes");
Each new Caption hides the previous one. In other words, there is only one caption window available at a
time. To close a caption without displaying a new one, use the named argument
caption(remove);
Remove.
StatusMsg
This command sends a message to the status bar.
StatusMsg("string")
(Windows only)
Mail sends an e-mail message to alert a user about a condition in JMP. For example, a
process control manager might include a test alert script in a control chart to trigger an e-mail warning to
her pager:
mail("JaneDoe@company.com", "out of control", "Process 12A out of control at
"||Format(today(), "d/m/y h:m:s"));
can also send an attachment with the e-mail. An optional fourth argument specifies the attachment.
Mail
The attachment is transferred in binary format after its existence on the disk is verified. For example, to
attach the
Big Class.jmp data table, submit
mail("JohnDoe@company.com", "Interesting Data Set", "Have a look at this class
data.", "C:\myJMPData\Big Class.jmp");
Page 78

58 JSL Building Blocks Chapter 2
Functions that communicate with users
Page 79

Chapter 3
Programming Functions
Script Control
Sometimes you might need to program repetitive operations, or perhaps implement some statistical test that
are not part of JMP. Then you need to learn some of the functions that control flow.
The following functions take on the roles that in other programming languages have statements with special
syntactic structure. They are just functions in JSL, like any other functions, with arguments separated by
commas.
This chapter covers basic programming functions and variables. The chapter “Advanced Concepts,” p. 385,
covers more advanced techniques, such as throwing and catching exceptions and working with expressions.
Page 80

Contents
Programming Example . . . . . . . . . . . . . . . . . . . . . . . . . . . . . . . . . . . . . . . . . . . . . . . . . . . . . . . . . . . . . . .61
Iterating. . . . . . . . . . . . . . . . . . . . . . . . . . . . . . . . . . . . . . . . . . . . . . . . . . . . . . . . . . . . . . . . . . . . . . . . . . .61
For . . . . . . . . . . . . . . . . . . . . . . . . . . . . . . . . . . . . . . . . . . . . . . . . . . . . . . . . . . . . . . . . . . . . . . . . . . .61
While . . . . . . . . . . . . . . . . . . . . . . . . . . . . . . . . . . . . . . . . . . . . . . . . . . . . . . . . . . . . . . . . . . . . . . . . .63
Summation . . . . . . . . . . . . . . . . . . . . . . . . . . . . . . . . . . . . . . . . . . . . . . . . . . . . . . . . . . . . . . . . . . . . .63
Product . . . . . . . . . . . . . . . . . . . . . . . . . . . . . . . . . . . . . . . . . . . . . . . . . . . . . . . . . . . . . . . . . . . . . . . .63
Break and Continue . . . . . . . . . . . . . . . . . . . . . . . . . . . . . . . . . . . . . . . . . . . . . . . . . . . . . . . . . . . . . .63
Conditional functions . . . . . . . . . . . . . . . . . . . . . . . . . . . . . . . . . . . . . . . . . . . . . . . . . . . . . . . . . . . . . . . 64
If . . . . . . . . . . . . . . . . . . . . . . . . . . . . . . . . . . . . . . . . . . . . . . . . . . . . . . . . . . . . . . . . . . . . . . . . . . . . 64
Match . . . . . . . . . . . . . . . . . . . . . . . . . . . . . . . . . . . . . . . . . . . . . . . . . . . . . . . . . . . . . . . . . . . . . . . . .65
Choose . . . . . . . . . . . . . . . . . . . . . . . . . . . . . . . . . . . . . . . . . . . . . . . . . . . . . . . . . . . . . . . . . . . . . . . 66
Interpolate . . . . . . . . . . . . . . . . . . . . . . . . . . . . . . . . . . . . . . . . . . . . . . . . . . . . . . . . . . . . . . . . . . . . . 66
Step . . . . . . . . . . . . . . . . . . . . . . . . . . . . . . . . . . . . . . . . . . . . . . . . . . . . . . . . . . . . . . . . . . . . . . . . . . 67
Controlling script execution . . . . . . . . . . . . . . . . . . . . . . . . . . . . . . . . . . . . . . . . . . . . . . . . . . . . . . . . . . 68
Wai t . . . . . . . . . . . . . . . . . . . . . . . . . . . . . . . . . . . . . . . . . . . . . . . . . . . . . . . . . . . . . . . . . . . . . . . . . 68
Schedule . . . . . . . . . . . . . . . . . . . . . . . . . . . . . . . . . . . . . . . . . . . . . . . . . . . . . . . . . . . . . . . . . . . . . . 68
JSL Data Structures . . . . . . . . . . . . . . . . . . . . . . . . . . . . . . . . . . . . . . . . . . . . . . . . . . . . . . . . . . . . . . . . . 68
Lists. . . . . . . . . . . . . . . . . . . . . . . . . . . . . . . . . . . . . . . . . . . . . . . . . . . . . . . . . . . . . . . . . . . . . . . . . . 68
Matrices . . . . . . . . . . . . . . . . . . . . . . . . . . . . . . . . . . . . . . . . . . . . . . . . . . . . . . . . . . . . . . . . . . . . . . 72
Associative Arrays . . . . . . . . . . . . . . . . . . . . . . . . . . . . . . . . . . . . . . . . . . . . . . . . . . . . . . . . . . . . . . . 72
Character Functions . . . . . . . . . . . . . . . . . . . . . . . . . . . . . . . . . . . . . . . . . . . . . . . . . . . . . . . . . . . . . . . . 77
Concat . . . . . . . . . . . . . . . . . . . . . . . . . . . . . . . . . . . . . . . . . . . . . . . . . . . . . . . . . . . . . . . . . . . . . . . 77
Munger . . . . . . . . . . . . . . . . . . . . . . . . . . . . . . . . . . . . . . . . . . . . . . . . . . . . . . . . . . . . . . . . . . . . . . . 78
Repeat . . . . . . . . . . . . . . . . . . . . . . . . . . . . . . . . . . . . . . . . . . . . . . . . . . . . . . . . . . . . . . . . . . . . . . . . 79
Sequence . . . . . . . . . . . . . . . . . . . . . . . . . . . . . . . . . . . . . . . . . . . . . . . . . . . . . . . . . . . . . . . . . . . . . . 80
Comparison and Logical Operators. . . . . . . . . . . . . . . . . . . . . . . . . . . . . . . . . . . . . . . . . . . . . . . . . . . . . .81
Missing Values. . . . . . . . . . . . . . . . . . . . . . . . . . . . . . . . . . . . . . . . . . . . . . . . . . . . . . . . . . . . . . . . . . .82
Missing Character Values. . . . . . . . . . . . . . . . . . . . . . . . . . . . . . . . . . . . . . . . . . . . . . . . . . . . . . . . . . .83
Short-Circuiting Behavior . . . . . . . . . . . . . . . . . . . . . . . . . . . . . . . . . . . . . . . . . . . . . . . . . . . . . . . . . .83
Page 81

Chapter 3 Programming Functions 61
Programming Example
Programming Example
Here is an example script using JSL to implement a statistical method, a type of runs test. A flow-control
function,
The first statement opens a JMP data table. The Summarize function obtains the mean and count for the
column height.
values. Then it finds n1, the number of heights greater than the mean; n2, the remaining number; and r, the
number of adjacent heights that are not both above or both below the mean. The muR and sigmaR are the
mean and standard deviation of the test statistic under the hypothesis that there is no run pattern, zTest is
the normal test statistic, and p Value is the significance level of the test. If there is a pattern across time, then
neighboring values would be more likely to be alike in whether they were above or below the mean.
Summation, is also used to iterate computations over many rows at a time.
Open("$SAMPLE_DATA/Big Class.jmp");
Summarize(mean=mean(Height),n=count(Height));
nr = nrow();
n1 = summation(i=1, nr, Height[i]>mean);
n2 = n-n1;
r = summation(i=2, nr, (Height[i]>mean)!=(Height[i-1]>mean));
muR = 2*n1*n2/(n1+n2);
sigmaR = sqrt(2*n1*n2*(2*n1*n2-n1-n2)/(n^2*(n-1)));
zTest = (r-muR)/sigmaR;
pValue = (1-normal distribution(abs(zTest)))*2;
show(r, muR, sigmaR, zTest, p Value);
NRow gets the number of rows, which is the same as the count n, since there are no missing
Iterating
JSL provides For, While, Summation, and Product to iterate actions according to the conditions that you
specify.
To iterate actions over rows of a data table, use
chapter.
For
The For function first evaluates init expression, but just one time. Then it tests the while expression,
breaking if not true. As long as the while expression is true, it keeps executing the body and iter expressions.
For
For Each Row, which is discussed in the “Data Tables”
For(init, while, iter, body);
loops just like it does in the C (and C++) programming language, although the punctuation is different.
Confusion alert! If you know C, watch out for the difference between JSL and C in the
use of semicolons and commas. In JSL
arguments and semicolons join them; in C
For is a function where commas separate
for is a special clause where semicolons
separate arguments and commas join them.
Page 82

62 Programming Functions Chapter 3
Iterating
For example, you can do a Distribution on the first three columns of the current data table:
for(i=0, i<3, i++, Distribution(column(i+1)));
This loop does the following:
1. Sets i to 0.
2. Evaluates 0<3 as true.
3. Launches the Distribution platform for the first column.
4. Increments i to 1.
5. Evaluates 1<3 as true.
6. Launches the Distribution platform for the second column.
7. Increments i to 2.
8. Evaluates 2<3 as true.
9. Launches the Distribution platform for the third column.
10. Increments i to 3.
11. Evaluates 3<3 as false.
12. Breaks out of the loop.
Of course, it is not hard to write scripts that get into infinite loops. When this happens, you can use the
keyboard cancel sequence to get out of the loop (press ESC on Windows, or press COMMAND-PERIOD
on Macintosh).
The following expression sums the numbers from 0 to 20:
s=0; For(i=0, i<=20, i++, s=s+i);
The For loop works like this. It expects four arguments separated with commas ( , ). The first three
arguments are rules for how many times to repeat the loop, and the fourth is what to do repeatedly. This is
where the action takes place.
1. First it sets an initial condition or state. In this case, it assigns the value 1 to a variable i. The first
argument of a for loop is always a starting condition like this one, but the variable and the value could be
anything.
2. Next it tests whether the second argument,
i<=20, is true. If it is true, then it does the action script. If
false, it ends the for loop and continues with the rest of the script (if there is more waiting after the last
parenthesis of the for loop). The second argument is always a condition, like a little
If test. Usually the
condition involves the same variable initialized in the first argument, but that is not always the case. Be
careful not to create an infinite loop. (If you make a mistake, you can press ESC on Windows or
COMMAND-PERIOD on Macintosh to stop the looping.)
3. The third argument is what to do after completing the actions; typically it increments i (adds one to its
current value). The actions are everything that comes next inside the for’s parentheses. You come back to
this in step 5.
4. The fourth argument does the work of the for loop. In this case, it replaces
s with s+i. Only one
command statement is expected in the fourth argument. If you want to do several things on each step,
Page 83

Chapter 3 Programming Functions 63
Iterating
glue the statements together with semicolons ( ; ). Semicolons let numerous things stand in place of one
thing.
5. Now the third argument kicks in. After the action of the fourth argument is done, the counter variable i
is incremented, and the execution starts over at the second argument, testing again whether
i<=20 is
still true.
While
A related function is While, which repeatedly tests the condition and executes its body script as long as the
condition is true.
While(condition, body);
For example, here are two different programs to find the least power of 2 that is greater than or equal to x:
x=287;
y=1; while(y<x,y*=2);show(y);
k=0; while(2^k<x, k++);show(2^k);
Summation
The Summation function adds up the body results over all i values. For example:
s = Summation(i=0,10,i); // 0+1+2+....+9+10
This is the same idea as Σ in the calculator except that with Summation, you do not need to restrict yourself
to creating formula variables.
Summation(i=1, NRow(), x^2);
This is the JSL equivalent in the formula calculator:
NRow
2
i 1=
x
∑
Product
The Product function works just like Summation, except that it multiplies the body results rather than
adding them.
p = Product(i=1,5,i); // 1*2*3*4*5
This is the JSL equivalent of this in the formula calculator:
5
i
∏
i 1=
Break and Continue
Two functions give you further control over looping: Break() and Continue(). These two functions work
with For and While loops, and also with For Each Row.
Page 84

64 Programming Functions Chapter 3
Conditional functions
Break
Break immediately stops the loop and proceeds to the next command after the loop. This is usually used
inside a conditional statement. For example:
For( i = 1, i <= 10, i++,
If( i == 5, Break() );
Print( "i=" || Char( i ) );
);
Show( "Finished!" );
Without the If statement that contains Break, the loop would print out the values of i from 1 to 10, and
then
“Finished”. However, as soon as i reaches 5, the loop is immediately halted (before the print
statement, but after
If the
If and Break statements were at the end of the loop, the final value of i printed to the log would be
i is 5) and the following statement is processed (Show(“Finished”)).
5 rather than 4.
Continue
Continue is a gentler form of Break. It immediately stops the current iteration of the loop, but sends
execution back to the beginning of the loop rather than stopping the loop completely.
Continue is also
usually used inside a conditional statement. For example:
For( i = 1, i <= 10, i++,
If( i < 5, Continue() );
Print( "i=" || Char( i ) );
);
This loop iterates through i, but until i is greater than 5, the print statement is not executed. There is no
point to placing a
Continue at the end of a loop. The entire loop body has already been executed, so there
is nothing to skip. The loop continues anyway.
Conditional functions
JSL provides five functions to execute script conditionally: If, Match, Choose, Interpolate, and Step.
If
The If function returns the result statement(s) when condition evaluates as true (nonzero and nonmissing).
Otherwise it skips ahead and returns the next result when that condition evaluates as true. The final result is
the result if none of the preceding conditions are true. It is the “else” result.
If ( condition1, result1, condition2, result2, ...., resultLast )
If at least one condition evaluates to missing, the function keeps on evaluating and only returns missing
(rather than evaluating the
returned missing. The way to get a clause to always return despite missing conditionals is to add a
conditional at the end that is always true. For example,
else clause) if none of the clauses evaluated to true and at least one conditional
Page 85

Chapter 3 Programming Functions 65
Conditional functions
If (age<12,"Young", a>12,"Old", 1,"Ageless");
For example, the following code sets X to Y if Y is less than 20. Otherwise, it sets X to 20.
X = If(Y<20,Y,20);
You can use this to recode ranges, for example:
row()=1; Age Group = If (Age<12,"Child",Age<18,"Teen","Adult");
You can put actions and assignments in the result clauses, and you do not have to return a result. For
example the following two are equivalent:
X = If(y<20,y,20);
If(y<20,x=y,x=20);
Similar conditionals are Choose and Match.
Match
Be careful to use
== for equality tests, not =. An If with an argument like name=value would assign the
value rather than test it.
You can use The Match function to make a sequence of equality comparisons without needing to rewrite
the value to be compared. The result of the first operand is compared to each of the succeeding even
operands, except the last. If they are equal, the value of the operand immediately after is returned. If nothing
matches, then the last operand is returned. For example:
SLabel = Match(SCode,
1,"Male",
2,"Female",
"unknown");
This would be equivalent to the following If expression:
SLabel = If(SCode==1,"Male",
SCode==2,"Female",
"unknown");
With more groups, the value of Match becomes more apparent:
dt=open("$SAMPLE_DATA/Big Class.JMP");
for each row(ageword=
match(age, 12, "twelve", 13, "thirteen", 14, "fourteen", 15, "fifteen", 16,
"sixteen", "seventeen");
show(age, ageword));
If a has integer values 1, 2, 3, ..., you can save even more typing by using Choose.
Page 86

66 Programming Functions Chapter 3
Conditional functions
Confusion alert! If and Match now handle missing values differently than in JMP
version 3.x (as do
result for
Match); now they return missing values, as discussed under “Missing
And and Or ). Previously missing values returned false (the “else”
Values,” p. 82.
Choose
The Choose function can be used to shorten certain recoding even more, provided the arguments are to be
tested against integers 1, 2, 3, and so forth. If the first argument evaluates to 1,
replacement value; if it is 2, the second, and so on. If the first argument evaluates to an integer out of range
(for example, 7 when only 5 replacement values are listed),
example:
SLabel = Choose(SCode,"Male","Female","Unknown");
Thus, if group is a column with values 1, 2, and 3, the following all accomplish the same task, replacing 1s
with “low,” 2s with “medium,” and 3s with “high.”
if(group==1, "low", group==2, "medium", group==3, "high");
g2=match(group, 1, "low", 2, "medium", 3, "high");
g3=choose(group, "low", "medium", "high");
Interpolate
Interpolate linearly interpolates the y-value corresponding to a given x-value between two points (x1,
y1), and (x2, y2).
The points can be specified as a list of points
For the v. 3 behavior, you can use
-MZ operators are used automatically when converting formulas from v. 3 data tables.
IfMZ and MatchMZ (and AndMZ and OrMZ). These
Choose returns the first
Choose returns the last replacement value. For
Interpolate(x, x1, y1, x2, y2, ...)
or as matrices containing the x- and y-values
Interpolate(x, xmat, ymat)
Suppose we wanted to approximate the exponential function by linear interpolation between integers, 0 to
5. The following would create the two vectors of values:
xgrid = (0::5);
yvalues = exp(xgrid);
show(xgrid, yvalues);
This produces the output
xgrid:[0 1 2 3 4 5]
yvalues:[1 2.718281828459045 7.38905609893065 20.08553692318767
54.59815003314424 148.4131591025766]
Page 87

Chapter 3 Programming Functions 67
Conditional functions
Figure 3.1 shows a plot of what the interpolation function would look like (dashed line), compared with
what the continuous version (solid line), which is what is being approximated.
Figure 3.1 Example of Interpolate
Step
The points must be arranged in ascending order. For example, Interpolate(2,1,1,3,3) returns 2.
However,
Step is like Interpolate except that it finds the corresponding y for a given x from a step-function fit
Interpolate(2,3,3,1,1) returns a missing value (.).
rather than a linear fit between points. That is, it returns the y-value corresponding to the greatest x-value
that is less than or equal to the x specified as the first argument.
Step(x, x1, y1, x2, y2, ...)
For example:
for(i=1,i<7,i++,print(step(i, 1,10, 3,30, 4.5,45, 7,70)));
10
10
30
30
45
45
As with Interpolate, the points must be in ascending order.
Page 88

68 Programming Functions Chapter 3
Controlling script execution
Controlling script execution
When you run a script, the Run Script command in the Edit menu changes to Stop Script. While a script
is executing, you can select this item (or type ESC on Windows or COMMAND-PERIOD on Macintosh)
to stop it. Many scripts execute more quickly than you can stop them.
Wait
Stopping a script manually stops the entire script completely. In contrast, the Wait command enables you
to pause script execution for a time and then continue running the script. This approach is sometimes
necessary for scripts intended for interactive use or demonstrations.
Wait enables you to slow down scripting playback by pausing the specified number of seconds before
continuing with the script. For example, this is a 15-second timer:
Wait(15);
Wait also yields to the system, so that system tasks can be run while waiting. This includes updating the
contents of the screen. Issuing a wait time of 0 (
any longer than needed to do these events. Waiting zero seconds is useful for allowing results to be displayed
right away; otherwise JMP waits for the script to end before yielding to the system to update windows.
Wait(0)) lets JMP to do other pending events, but not wait
Schedule
Schedule runs commands or entire scripts at the times that you specify. See the “Extending JMP” chapter.
JSL Data Structures
Besides numbers and strings, JSL provides several other data types variables can hold:
•Lists
•Matrices
• Associative Arrays
Lists
Lists are containers to store numerous items, potentially items of different type: numbers, text strings,
expressions, matrices, and even other lists. A list is just the function
for
List is to use curly braces. Thus the following two statements are equivalent:
A = List(1,2,B,sqrt(3));
A = {1,2,B,sqrt(3)};
When you define or evaluate a list, it just returns a copy of itself. It does not evaluate items inside the list.
For example, this step reveals that the list contains the variable B, not its current value:
List with arguments. The shorthand
Page 89

Chapter 3 Programming Functions 69
JSL Data Structures
B=7;show(A);
A = {1,2,B,Sqrt(3)}
Use Eval List if you want a list with all its items evaluated:
C = Eval List(A);
{1, 2, 7, 1.732050807568877}
Lists can also hold assignments ({a=1, b=2}), or function calls ({a(1), b(2)}). Remember, statements
such as these just return lists. If you want to evaluate the contents, use
assignList={a=1, b=3, c=5};
{a=1, b=3, c=5}
show(assignList);
assignList = {a = 1, b = 3, c = 5}
evallist(assignList);
{1, 3, 5}
show(a,b,c);
a = 1
b = 3
c = 5
show(assignList);
assignList = {a = 1, b = 3, c = 5}
h=function({x},x+2); i=function({x},x+3); k=function({x},x+4);
fnList={h(1), i(3), k(5)};
fnlist:{h(1), i(3), k(5)}
show(fnList);
fnList = {h(1), i(3), k(5)}
evallist(fnList);
{3, 6, 9}
show(h,i,k);
h = Function({x},x + 2)
i = Function({x},x + 3)
k = Function({x},x + 4)
show(fnList);
fnList = {h(1), i(3), k(5)}
Eval List.
Assignment
List assignment is powerful.
Note that any structure of a list is supported, as long as the arguments are conformable and ultimately
numeric. One-element lists are treated like scalars for conformability. For example,
{a,b,c} = {1,2,3}; //assigns 1 to a, 2 to b, 3 to c
{a,b,c}+=10; //adds 10 to each variable a, b, and c.
{{a},{b,c}}++; //increments a, b, and c by 1
{a,b,c}--; //decrements a, b, and c
mylist={1, log(2), e()^pi(), height[40]};
// stores the expressions in a list
a = {{{{{1, 2}, {3, 4}}, {5, {6, 7}}}, 8}, {9, 10}};
b = {{{{{10, 20}, {30, 40}}, {50, {60, 70}}}, 80}, {90, 100}};
Page 90

70 Programming Functions Chapter 3
JSL Data Structures
c = a + b; show(c);
d = a + 100; show(d);
e = sqrt(a); show(e);
results in the output
c = {{{{{11, 22}, {33, 44}}, {55, {66, 77}}}, 88}, {99, 110}}
d = {{{{{101, 102}, {103, 104}}, {105, {106, 107}}}, 108}, {109, 110}}
e = {{{{{1, 1.414213562373095}, {1.732050807568877, 2}}, {2.23606797749979,
{2.449489742783178, 2.645751311064591}}}, 2.82842712474619}, {3,
3.16227766016838}}
How many items?
To determine the number of items in a list, use the
Subscripts
Subscripts for lists extract the specified item(s) from a list. Subscripts can in turn be lists. Note that JSL
starts counting from 1, so the first element in a list is [1], not [0] as in some other languages.
You can also use subscripts to select or change items in a list.
When you have assignment lists or function lists, you can use a quoted name for the subscript:
You need to put the name in quotation marks, because otherwise JMP would try to evaluate it and use its
value, like this:
NItems function:
N = N Items(A);
a={"bob", 4, [1,2,3], {x,y,z}};
show(a[1]); // returns "bob"
show(a[{1,3}]); // returns {"bob",[1,2,3]}
a[2]=5; // changes the 4 to 5
c={1,2,3};
c[{1,2}]={4,4}; // changes c to {4,4,3}
c[{1,2}]=4; // equivalent
X={a(1), b(3), c(5)};
XX={a=1, b=3, c=5};
show(X["a"], XX["a"]);
X["a"] = 1
XX["a"] = 1
a=2;show(X[a],XX[a]);
X[a] = b(3)
XX[a] = b=3
Multiple left-side subscripts (for example, a[i][j] = value where a contains a list of things that are
subscriptable) are allowed in certain cases.
1. Each level except the outermost must be a list. So, in the above example,
a must be a list but a[i] can
be anything subscriptable.
Page 91

Chapter 3 Programming Functions 71
JSL Data Structures
2. Each subscript except the outermost must be a number. So, in the above example, i must be a number,
but
j could be a matrix or list of indices.
The subscripting can be done to any level of nesting. For example,
a[i][j][k][l][m][n] = 99;
Locating items in a list
To find values in a list, use the
Loc(list, value)
Loc function.
This returns a matrix of indices to the values in the list that are equal to value, where value and list
can be strings or numbers. If
Therefore,
NRow(Loc(list, value))>0 is equivalent to Contains(list, value)>0.
value is not found, the resulting matrix has zero rows and zero columns.
Note: Complete details about matrix manipulation are found in the “Matrices” chapter, including the
description of the equivalent
Loc command for matrices (which requires only one argument).
For example, given these lists:
nameList = {“Katie”, “Louise”, “Jane”, “Jane”};
numList = {2, 4, 6, 8, 8}
Loc(nameList, “Katie”)
Loc(nameList, “Erin”) returns [], an empty matrix, since there are no matches.
Loc(nameList, “Jane”) returns [3, 4]
Loc(nameList, 1) returns []. Note that the type mismatch is tolerated.
Loc(numList, 1) returns []
Loc(numList, 6) returns [3]
Loc(numList, 8)
returns [4, 5]
returns [1]
Here is a summary of the list operators:
Ta bl e 3 .1 Operators for working with lists
Operator Syntax Explanation
{}List List(a, b, c)
{a, b, c}
Constructs a list from a set of items. An item can be any
expression, including other lists. Items must be separated by
commas. Text strings should either be enclosed in double
quotation marks (
that variable.
N Items N Items(list)
Returns the number of elements in the list specified. Can be
assigned to a variable.
"") or stored in a variable and called as
Page 92

72 Programming Functions Chapter 3
JSL Data Structures
Ta bl e 3 .1 Operators for working with lists (Continued)
Operator Syntax Explanation
Is List Is List(arg)
[]Subscript list[i]
x = list[i]
list[i] = value
a[b,c]
Subscript(a,b,
c)
Assign
=
Add To
+
=
SubtractTo
-
MultiplyTo
=
DivideTo
*
Post
=
Increment
/
Post
=
Decrement
+
+
-
-
{list} = {list}
{list} –= value
{list} += {list}
...
Returns true (1) if arg is a classical list (in other words, one
that would result from the construction by
{items}) and returns false (0) otherwise. An empty list is still a
list, so
IsList({ }) returns true. If miss=., then
IsList(miss) returns false, not missing.
List(items) or
Subscripts for lists extract the ith item from the list. Subscripts
can in turn be lists or matrices.
If the target of an assignment operator is a list and the value
to be assigned is a list, then it assigns item by item. The
ultimate values in the left list must be L-values (in other
words, names capable of being assigned values).
Note: If you want to test equality of lists, use
==, not =.
Eval List Eval List(list)
Matrices
Matrices can be used to represent values in a data table as well as matrix algebra. See the “Matrices” chapter
for details.
Associative Arrays
An associative array associates unique keys with values, which might not be unique. Though associative
arrays are generally not ordered, JMP keys are returned in lexicographical order for the purpose of iteration
and serialization.
To create an empty associative array, use one of the following:
Returns a list of the evaluated expressions inside list; see
“Lists,” p. 68.
Page 93

Chapter 3 Programming Functions 73
JSL Data Structures
cary = [=>];
cary = Associative Array();
The keys and values can be any JSL objects. Items can be added and changed with subscripting:
cary["state"] = "NC";
cary["population"] = 116234;
cary["weather"] = "cloudy";
cary["population"] += 10;
cary["weather"] = "sunny";
cary["high schools"] = {"Cary", "Green Hope", "Panther Creek"};
Note that L-values in an associative array are just like any other L-value.
The default value determines the value of
default value and
map[key] causes an error much like list[-1] does. If a default value has been set, then
that value is returned. Besides the
constructor using
counts = ["a"=>10, "b"=>3, =>0]; // default value of 0
counts["c"] += 1; // ["a" => 10, "b" => 3, "c" => 1, => 0]
=>value without a key. For example:
map[key] when key is not in the map. Initially, maps have no
Set Default Value message, a default value can be set in the literal
Associative Array Constructors
map = [=>]; // empty associative array
map = [=>0]; // with default value
map = ["yes" => 0, "no" => 1]; // literal associative array
map = ["yes" => 0, "no" => 1, => 2]; // with default value
map = Associative Array(); // empty associative array
map = Associative Array(0); // with default value
map = Associative Array({{"yes", 0}, {"no", 1}}); // list containing 2-item
lists
map = Associative Array({{"yes", 0}, {"no", 1}}, 2); // with default value
map = Associative Array({"yes", "no"}, {0, 1}); // two lists, keys and values
map = Associative Array({"yes", "no"}, {0, 1}, 2); // with default value
map = Associative Array(:name, :height); // two column refs
map = Associative Array(:name, :height, .); // with default value
set = Associative Array({"yes", "no"}); // one list creates a set with
default value 0
set = Associative Array(:name); // one column ref creates a set with default
value 0
Working with associative arrays
To determine the number of keys that an associative array contains, use
associative array from earlier:
N Items(cary);
4
N Items. Using the cary
Page 94

74 Programming Functions Chapter 3
JSL Data Structures
There are several functions that can be used for associative arrays in addition to lists, strings, and
expressions.
Adding and deleting keys and values
Insert, Insert Into, Remove, Remove From, Reverse, and Reverse Into can all be used to add
key-value pairs or remove them from the associative array entirely.
given associative array with the key-value pair added or removed.
Insert and Remove return copies of the
Insert Into and Remove From add or
remove the key-value pairs directly from the given associative array.
Insert and Insert Into take three arguments: the associative array, a key, and a value.
newcary = Insert(cary, "time zone", "Eastern");
show(cary, newcary);
cary = Associative Array({
{"high schools",{"Cary", "Green Hope", "Panther Creek"}},
{"population", 116244},
{"state", "NC"},
{"weather", "sunny"}
})
newcary:Associative Array({
{"high schools", {"Cary", "Green Hope", "Panther Creek"}},
{"population", 116244},
{"state", "NC"},
{"time zone", "Eastern"},
{"weather", "sunny"}
})
Insert Into(cary, "county", "Wake");
show(cary);
cary = Associative Array({
{"county", "Wake"},
{"high schools", {"Cary", "Green Hope", "Panther Creek"}},
{"population", 116244},
{"state", "NC"},
{"weather", "sunny"}
})
Remove
and Remove From take two arguments: the associative array, and a key.
newcary = Remove(cary, "high schools")
show(cary, newcary);
cary = Associative Array({
{"county", "Wake"},
{"high schools", {"Cary", "Green Hope", "Panther Creek"}},
{"population", 116244},
{"state", "NC"},
{"weather", "sunny"}
})
newcary:["county" => "Wake", "population" => 116244, "state" => "NC",
"weather" => "sunny"]
Remove From(cary, "weather");
show(cary);
Page 95

Chapter 3 Programming Functions 75
JSL Data Structures
cary = Associative Array({
{"county", "Wake"},
{"high schools", {"Cary", "Green Hope", "Panther Creek"}},
{"population", 116244},
{"state", "NC"}
})
Insert Into
cary << Insert("county", "Wake");
Insert Into(cary, "county", "Wake");
and Remove From also have message equivalents. These two statements are equivalent.
Likewise, these two statements are equivalent:
cary << Remove("weather")
Remove From(cary, "weather")
Another message lets you set the default value:
cary << Set Default Value("Cary, NC")
Use <<Get Default Value to determine whether there is a default value set for an associative array, and if
so, what its value is. If there is no default value set,
Empty() is returned.
Obtaining information about an associative array’s contents
Contains can be used to determine whether a certain key is contained inside an associative array:
Contains(cary, “high schools”)
1
Contains(cary, “lakes”)
0
Several messages provide information about the associative array’s contents.
Use
<< Get Keys to obtain a list of all keys contained in an associative array.
cary <<Get Keys;
{"county", "high schools", "population", "state"}
Likewise, <<Get Values returns a list of all values:
cary <<Get Values;
{"Wake", {"Cary", "Green Hope", "Panther Creek"}, 116244, "NC"}
If you want only the values for certain keys, you can specify them as arguments:
cary <<Get Values({"state", "county"});
{"NC", "Wake"}
Note that the keys must be given as a list.
Similar to
<<Get Values is <<Get Value, which returns the value for a single key:
cary <<Get Value("population");
116244
Note that only one key can be specified, and it must not be in a list.
To obtain a list of all key-value pairs in an associative array, use
<<Get Contents:
Page 96

76 Programming Functions Chapter 3
JSL Data Structures
cary <<Get Contents;
{{"county", "Wake"},
{"high schools", {"Cary", "Green Hope", "Panther Creek"}},
{"population", 116244},
{"state", "NC"}}
Iterating through an associative array
To iterate through as associative array, use
from the associative array
currentkey = cary <<First;
total = N Items(cary);
for (i = 1, i <= total, i++,
);
Sets
A set is an application of an associative array in which all the keys have a value of 1 and non-keys have an
implicit value of 0.
To facilitate set usage, 1 is the default value for inserted keys if no value is provided:
map << insert("sample");
map["sample"];
If you construct an associative array from a list, then the default value is set to 0 for you. Otherwise, you
need to set the default value to 0 explicitly.
Graph Theory
Associative arrays can be used for graph theory data structures, such as the following directed graph
example:
<<First and <<Next. The following removes all key-value pairs
cary, leaving an empty associative array.
nextkey = cary<<Next(currentkey);
Remove From (cary, currentkey);
currentkey = nextkey;
1
g = Associative Array();
g[1] = Associative Array({1, 2, 4});
g[2] = Associative Array({1, 3});
g[3] = Associative Array({4, 5});
g[4] = Associative Array({4, 5});
g[5] = Associative Array({1, 2});
The following depth-first search JSL function can be used to traverse this map, or any other directed graph
expressed as a map:
dfs = Function( {ref, node, visited},
Local( {chnode, tmp},
Write( "Node: " || Char( node ) || ", " || Char( ref[node] << get contents
) || "\!N" );
visited[node] = 1;
Page 97

Chapter 3 Programming Functions 77
Character Functions
tmp = ref[node];
chnode = tmp << first;
While( !Is Missing( chnode ),
If( !visited[chnode],
visited = Recurse( ref, chnode, visited )
);
chnode = tmp << next( chnode );
);
visited
)
);
The first parameter is a reference to the map, the second is the node that you want to use as the starting
point, and the third is simply a vector that the function uses to keep track of nodes visited. To see how this
function works try the following:
dfs( g, 2, J( N Items( g << get keys ), 1, 0 ) );
Character Functions
This section shows how to use some of the more complex character functions that are described in the “JSL
Syntax Reference,” p. 439.
Concat
In the Concat function, expressions yielding names are treated like character strings, but globals that have
the name values are evaluated. The following example demonstrates that if you have a stored name value,
you need to either use
n = { abc };
c=n[1] || "def";
show(c);
//result is "abcdef"
m=expr(mno);
c = m || "xyz";
show(c);
//result is an error message that mno is unresolved
m = expr(mno);
c = Name Expr(m) || "xyz";
show(c);
//result is "mnoxyz"
m=char(expr(mno));
c=m || "xyz";
show(c);
//result is "mnoxyz"
Char before storing it in a global, or Name Expr on the global name.
Page 98

78 Programming Functions Chapter 3
Character Functions
Munger
Concat Items()
converts a list of string expressions into a single string, with each item separated by a
delimiter. If unspecified, the delimiter is a blank. Its syntax is
resultString = Concat Items ({list of strings}, <“delimiter string”>);
For example,
a = {“ABC”, “DEF”, “HIJ”};
result = Concat Items(a, “/”);
returns
“ABC/DEF/HIJ”
Alternatively,
result = Concat Items(a);
returns
“ABC DEF HIJ”
Munger works many different ways, depending on what you specify for its arguments:
Munger(string, offset, find | length, <replace>);
Ta bl e 3 .2 Munger behaviors for various types of arguments
Find, length, and replace arguments Example
If you specify a string as the find and specify no
replace string,
Munger returns the position (after
offset) of the first occurrence find string.
If you specify a positive integer as the length and
specify no replace string,
Munger returns the
characters from offset to offset + length.
If you specify a string as the find and specify a
replace string,
Munger replaces the first occurrence
after offset of text with replace.
If you specify a positive integer as the length and
specify a replace string,
Munger replaces the
characters from offset to offset + length with replace.
If you specify a positive integer as the length, and
offset + length exceeds the length of text, Munger
either returns text from offset to the end or replaces
that portion of text with the replace string, if it
exists.
Munger("the quick brown fox", 1,
"quick");
5
Munger("the quick brown fox",1,5);
"the q"
Munger("the quick brown fox", 1,
"quick", "fast");
"the fast brown fox"
Munger("the quick brown fox", 1, 5,
"fast");
"fastuick brown fox"
Munger("the quick brown fox",5,25);
"quick brown fox"
Munger("the quick brown fox",5,25,
"fast");
"the fast"
Page 99

Chapter 3 Programming Functions 79
Character Functions
Ta bl e 3 .2 Munger behaviors for various types of arguments (Continued)
Find, length, and replace arguments Example
Repeat
If you specify zero as the length and specify no
replace string,
Munger returns a blank string.
If you specify zero as the length and specify a
replace string, the string is inserted before the offset
position.
If you specify a negative integer as the length value
and specify no replace string,
Munger returns all
characters from the offset to the end of the string.
If you specify a negative integer for length and
specify a replace string,
Munger replaces all
characters from the offset to the end with the
Munger("the quick brown fox", 1,
0);
""
Munger("the quick brown fox", 1, 0,
"see ");
"see the quick brown fox"
Munger("the quick brown fox", 5,
-5);
"quick brown fox"
Munger("the quick brown fox", 5,
-5, "fast");
"the fast"
replace string.
The Repeat function makes copies of its first argument into a result. The second (and sometimes a third)
argument is the number of repeats, where 1 means a single copy.
If the first argument evaluates to a character value or list, the result is that many copies.
repeat("abc",2)
"abcabc"
repeat({"A"},2)
{"A","A"}
repeat({1,2,3},2)
{1,2,3,1,2,3}
If the first argument evaluates to a number or matrix, the result is a matrix. The second argument is the
number of row repeats, and a third argument can specify the number of column repeats. If only two
arguments are specified, the number of column repeats is 1.
repeat([1 2, 3 4],2,3)
[ 1 2 1 2 1 2,
3 4 3 4 3 4,
1 2 1 2 1 2,
3 4 3 4 3 4]
repeat(9,2,3)
[ 9 9 9,
9 9 9]
The repeat function is compatible with the function of the same name in the SAS/IML language, but is
incompatible with the SAS character DATA step function, which repeats one more time than this function.
Page 100

80 Programming Functions Chapter 3
Character Functions
Sequence
Sequence() corresponds to the Sequence function in the Formula Editor and is used to fill the cells in a
data table column. It takes four arguments and the last two are optional:
Sequence(from, to, stepsize, repeat)
From and to are not optional. They specify the range of values to place into the cells. If from = 4 and to
= 8
, the cells are filled with the values 4, 5, 6, 7, 8, 4, ...
Stepsize is optional. If you do not specify a stepsize, the default value is 1. Stepsize increments the values
in the range. If
8, 4, 6, ...
Repeat is optional. If you do not specify a Repeat, the default value is 1. Repeat specifies how many times
each value is repeated before incrementing to the next value. If
stepsize values, the cells are filled with the values 4, 4, 4, 6, 6, 6, 8, 8, 8, 4, ... If you specify a Repeat
value, you must also specify a Stepsize value.
The sequence is always repeated until each cell in the column is filled.
Example:
// Create a new data table
dt = New Table("Sequence Example");
stepsize = 2 with the above from and to values, the cells are filled with the values 4, 6,
repeat = 3 with the above from, to, and
// Add 2 columns and 50 rows
dt << New Column("Count to Five");
dt << New Column("Count to Seventeen by Fours"); dt << Add Rows (50);
/* Fill the first column with the data sequence 1, 2, 3, 4, 5, ...
Fill the second column with the data sequence 1, 1, 5, 5, 9, 9, 13, 13, 17, 17,
... */
for each row (
column(1)[ ] = Sequence(1,5);
column(2)[ ] = Sequence(1,17, 4, 2);
);
Since Sequence() is a formula function, you can also set a column's formula to use Sequence to fill the
column. This example creates a new column named “Formula Sequence” and adds a formula to it. The
formula is a sequence that fills the column with values between 25 and 29, incremented by 1, and repeated
twice (25, 25, 26, 26, 27, 27, 28, 28, 29, 29, 25, ...).
dt << new column("Formula Sequence", formula(Sequence(25, 29, 1, 2)));
Examples of Sequence results:
Sequence(1,5) produces 1,2,3,4,5,1,2,3,4,5,1, ...
Sequence(1,5,1,2) produces 1,1,2,2,3,3,4,4,5,5,1,1, ...
Sequence(10,50,10) produces 10,20,30,40,50,10, ...
10*Sequence(1,5,1) also produces 10,20,30,40,50,10, ...
 Loading...