

Page 1
Implementing Dashboard
®
Samples With SAS
Page 2

The correct bibliographic citation for this manual is as follows: SAS Institute Inc. 2006.
Implementing Dashboard Samples with SAS
Implementing Dashboard Samples with SAS
®
. Cary, NC: SAS Institute Inc.
®
Copyright © 2006, SAS Institute Inc., Cary, NC, USA
All rights reserved. Produced in the United States of America.
For a hard-copy book: No part of this publication may be reproduced, stored in a
retrieval system, or transmitted, in any form or by any means, electronic, mechanical,
photocopying, or otherwise, without the prior written permission of the publisher, SAS
Institute Inc.
For a Web download or e-book: Your use of this publication shall be governed by the
terms established by the vendor at the time you acquire this publication.
U.S. Government Restricted Rights Notice. Use, duplication, or disclosure of this
software and related documentation by the U.S. government is subject to the Agreement
with SAS Institute and the restrictions set forth in FAR 52.227-19 Commercial Computer
Software-Restricted Rights (June 1987).
SAS Institute Inc., SAS Campus Drive, Cary, North Carolina 27513.
1st printing, December 2006
SAS Publishing provides a complete selection of books and electronic products to help
customers use SAS software to its fullest potential. For more information about our
e-books, e-learning products, CDs, and hard-copy books, visit the SAS Publishing Web site
at support.sas.com/pubs or call 1-800-727-3228.
®
SAS
and all other SAS Institute Inc. product or service names are registered trademarks
or trademarks of SAS Institute Inc. in the USA and other countries. DataFlux and all
other DataFlux Corporation product or service names are registered trademarks or
trademarks of, or licensed to, DataFlux Corporation in the USA and other countries.
®
indicates USA registration.
Other brand and product names are registered trademarks or trademarks of their
respective companies.
Page 3

Contents
Chapter 1
What are Dashboards? 1
Creating Dashboards with SAS/GRAPH Software
Sample Dashboards
Delivering Dashboards to Users
References
Chapter 2
Downloading The Dashboard Samples
Working With the Sample Code
See Also
Chapter 3
Prerequisites for This Chapter
How to Register a New Stored Process
Chapter 4
Prerequisites for This Chapter
Overview: Displaying Dashboards in SAS Web Report Studio
Display the Output of a Single Indicator
Creating a Report That Displays the Output of One or More Indicators
Display the Output of a Complete Dashboard from a Single Stored Process
Refreshing the Data
Printing Indicators and Dashboards
4
Introduction to SAS/GRAPH Dashboard Samples 1
2
2
3
4
4
Downloading and Modifying The Dashboard Samples 5
5
5
7
4
Registering a New Stored Process 9
9
9
4
Displaying Dashboards in SAS Web Report Studio 13
13
14
25
25
14
15
24
Chapter 5
Prerequisites for This Chapter
Overview: Displaying Dashboards in the SAS Information Delivery Portal
Display a Dashboard in a WebDAV Content Portlet
Chapter 6
Prerequisites for This Chapter
Overview: Displaying Dashboards in the SAS Stored Processes Web Application
Display a Dashboard or Indicator 36
Navigate the SAS Stored Process Web Application 37
Modify the Execution Options for a Stored Process 39
References 40
4
Displaying Dashboards in the SAS Information Delivery Portal 27
27
29
4
Displaying Dashboards in the SAS Stored Process Web Application 35
35
27
Index 41
36
Page 4

iv
Page 5

CHAPTER
1
1
Introduction to SAS/GRAPH
Dashboard Samples
What are Dashboards?
Creating Dashboards with SAS/GRAPH Software
Sample Dashboards
Delivering Dashboards to Users
References
4
What are Dashboards?
A dashboard is a data visualization application that consolidates important
performance information and delivers it to decision-makers as a collection of concise
indicators. Like the gauges and warning lights on an automobile dashboard, the
following dashboard (Few 2006) enables the manager of a telephone sales organization
to monitor the performance of the team at a glance:
1
2
2
3
Page 6

2 Creating Dashboards with SAS/GRAPH Software
The display of an individual dashboard indicator can include both graphics and text.
The term indicator refers not only to the visual representation but also to the
underlying data source, range information, target values, and so forth. A collection of
indicators presented together comprises a dashboard.
4
Chapter 1
Creating Dashboards with SAS/GRAPH Software
The keys to creating effective dashboards are to have the appropriate performance
data available and to choose the appropriate indicators that convey each corresponding
performance measure. SAS software is a powerful tool for designing and constructing
dashboards because it provides tools for managing, analyzing, and summarizing data as
well as for presenting the results.
SAS/GRAPH software provides the flexibility to create virtually any type of chart or
plot required for a dashboard indicator. In addition to the graph types that can be
generated with its built-in procedures, SAS/GRAPH software provides an Annotate
facility that enables creative programmers to customize the standard graph types or to
create entirely new graph types that are not provided by the built-in procedures. Once
you have assembled the desired collection of indicators, you can use the GREPLAY
procedure in SAS/GRAPH software to arrange the indicators in any layout that you
desire.
Sample Dashboards
The SAS Customer Support Center Web site includes sample code that illustrates
some of the types of dashboard indicators and dashboards that you can create using
SAS/GRAPH software in conjunction with other SAS software. You can find these
samples at
http://support.sas.com/rnd/datavisualization/dashboards.
Some of the dashboard samples are built from multiple instances of a single type of
indicator:
slider chart indicator
shows a key value as a pointer on a bar that shows qualitative ranges. The pointer
can be highlighted to indicate items that need immediate attention. The sample
dashboard with slider chart indicators shows various measures of the performance
of an information technology department compared against ranges that represent
expected performance standards.
bullet graph indicator (Few 2006)
shows a key value as a bar against a background that shows qualitative ranges,
combined with a symbol that represents a target value. The sample dashboard
with bullet graph indicators shows various measures of the performance of a
business compared against ranges that represent expected performance standards
as well as against specific performance targets.
dial gauge indicator
shows a key value as pointer on a circular scale that represents a qualitative
range. The sample dashboard with dial meter indicators illustrates some of the
types of measures that are appropriate for representation with this indicator, such
as temperature and revolutions per minute.
bar chart indicator (with target marker)
Page 7

4
Delivering Dashboards to Users 3
shows a related group of key values as bars, along with symbols that represent
target values. The color of each bar represents a qualitative measure of the
corresponding value. In addition, pointers on each bar represent the target value
for the measure. The sample dashboard with bar chart indicators shows various
measures of the sales performance of a wine distributor compared against ranges
that represent expected performance standards as well as against specific
performance targets.
Note: This sample won an award for best depiction of data in a dashboard in
the 2005 Data Visualization Contest sponsored by DM Review magazine.
4
In addition to the samples that feature specific indicators, the following samples are
available that illustrate more complex dashboards that include multiple types of
indicators:
Telesales performance
shows indicators that monitor the real-time performance of a telephone sales team
or similar organization. The following measures are shown on the dashboard:
3
call wait time
3
call duration
3
abandoned calls
3
call volume
3
order volume
3
sales representative utilization
Note: This dashboard is an implementation of the example that originally
appeared on page 199 of Information Dashboard Design (Stephen Few 2006).
Web marketing analysis
shows indicators that support the analysis of customer data for an online merchant
or similar organization. The following measures are shown on the dashboard:
3
number of visitors (daily, monthly, and yearly)
3
number of registered visitors
3
number of orders of top-selling products
3
number of times top-selling products were viewed
3
products purchased together but not displayed together
3
products displayed together but not purchased together
3
other Web sites that provided referrals
Note: This dashboard is an implementation of the example that originally
appeared on page 201 of Information Dashboard Design (Stephen Few 2006).
Delivering Dashboards to Users
In order to be useful, dashboards must be readily available to the decision-makers
who rely on the information that they present. You have a wide variety of options for
delivering the dashboard indicators or complete dashboards that you create with
SAS/GRAPH software, including the following:
3
You can store the indicators and dashboards that you create with SAS/GRAPH
programs in standard graphics file formats so that they can be consumed by other
applications.
4
4
Page 8

4 References
4
Chapter 1
3
You can use the Output Delivery System (ODS) features in SAS/GRAPH software
to package the dashboards into HTML pages that can be sent to a Web server and
viewed with a browser. ODS HTML output also supports adding chart tips and
drill-down links on individual bars and other graphic elements in the indicators.
All of the SAS/GRAPH dashboard samples on the SAS Customer Support Center
Web site are designed to generate ODS HTML output.
3
You can use SAS Web Report Studio software to deliver dashboards in the form of
Web-based reports. For information on using SAS Web Report Studio software to
create dashboards from the sample indicators or to display the sample dashboards,
see Chapter 4, “Displaying Dashboards in SAS Web Report Studio,” on page 13.
3
You can use SAS Information Delivery Portal software with Base SAS 9.1.3
Service Pack 4 or later to deliver dashboards as portlets within the framework of a
corporate Web portal. For information on using SAS Information Delivery Portal
software to display the sample dashboards, see Chapter 5, “Displaying Dashboards
in the SAS Information Delivery Portal,” on page 27.
3
You can use the SAS Stored Process Web Application with Base SAS 9.1.3 Service
Pack 4 or later to provide users with online access to dashboards that are
generated by SAS/GRAPH code in stored processes. For information about using
the SAS Stored Process Web Application to display the sample dashboards, see
Chapter 6, “Displaying Dashboards in the SAS Stored Process Web Application,”
on page 35.
References
Few, Stephen. 2006. Information Dashboard Design. Sebastopol, CA: O’Reilly Media,
Inc.
Page 9

CHAPTER
2
5
Downloading and Modifying The
Dashboard Samples
Downloading The Dashboard Samples
Working With the Sample Code
Using Macro Variables to Customize Indicator and Dashboard Features
Modifying the Data for Indicators
Using the Annotate Facility to Add Information to Indicators
Using the GREPLAY Procedure to Position Indicators on the Dashboard 6
Customizing Drill-down Information for Dashboard Indicators
See Also
7
5
5
6
Downloading The Dashboard Samples
There are two ways to obtain the SAS code for the dashboard samples from the
Samples area of the SAS Customer Support Center Web site:
3
copy the code from the Full Code tab for the sample and paste it into the SAS
Program Editor window or into a file.
3
download the text file containing the code from the Downloads tab for the sample.
Three different versions of each dashboard sample are available:
3
code that can be submitted as a SAS program in interactive or batch mode
3
code that can be executed as a SAS stored process
3
code that can be used in a webDAV content portlet in the SAS Information
Delivery Portal.
5
6
6
The entire collection of dashboard samples, along with a copy of this document, can
also be downloaded as a single archive file from which you can extract the desired
sample files.
Note: In order to use the stored process or portlet versions of the samples, you must
first register metadata for each sample that you want to use. The registration process is
covered in Chapter 3, “Registering a New Stored Process,” on page 9.
Working With the Sample Code
Using Macro Variables to Customize Indicator and Dashboard Features
In the samples, the values that control features of the dashboards and indicators that
are most likely to be customized are assigned using SAS macro variables that are
4
Page 10

6 Modifying the Data for Indicators
defined at the beginning of each sample code. For example, in the slider chart indicator
dashboard, the following macro variable definitions control the colors of the three
segments of the slider bars:
%let light_red=cxFFC1C1;
%let light_yellow=cxFFFFAA;
%let light_green=cxB4EEB4;
You can change the colors of any of the segments on all the indicators in the dashboard
by changing the value of the corresponding macro variable.
For details of the features that can be customized by changing macro variable values,
see the comments in the beginning section of the code for each sample.
Modifying the Data for Indicators
Most of the indicators in these samples use SAS data sets as data sources. You can
modify the supplied data or adapt the sample code to use your own data sets instead.
Other data values are specified in macro calls that generate the indicators. For details
of the structure of the data sets and macro calls used in the samples, see the comments
in the sample code.
4
Chapter 2
Using the Annotate Facility to Add Information to Indicators
These indicator and dashboard samples rely heavily on the Annotate facility in
SAS/GRAPH software. The Annotate facility enables you to generate a special data set
of graphics commands from which you can produce custom graphics output. This
Annotate data set can be used to enhance graphs produced by other SAS/GRAPH
procedures— for example, to draw lines on or add text or symbols to a bar chart—or to
create entire graphs of types that the built-in SAS/GRAPH procedures cannot produce.
In order to change the appearance or behavior of the indicators in a sample, you
must understand how the Annotate facility works. To learn more about the
customizations that can be achieved with annotations, see Part 3, “The Annotate
Facility,” in
SAS/GRAPH Reference.
Using the GREPLAY Procedure to Position Indicators on the Dashboard
In these dashboard samples, individual indicators are not displayed as they are
created. Instead, they are stored in GRSEG catalog entries. The dashboards are
created by loading the catalog entries for the indicators into templates that define how
each entry is positioned. The GREPLAY procedure in SAS/GRAPH software is used
both to create the templates and to load the entries into the templates.
In order to add indicators to a sample or change the placement of indicators in a
sample, you must understand how GREPLAY templates work. To learn more about
GREPLAY templates and the GREPLAY procedure, see Chapter 43 , “The GREPLAY
Procedure,” in SAS/GRAPH Reference.
Customizing Drill-down Information for Dashboard Indicators
Because dashboard indicators typically provide a summarized view of a performance
measure, it is common for them to support a drill-down feature to provide more details
about the underlying data. In the sample dashboards, clicking on the bars and other
graphic elements in indicators will, in most cases, open an HTML page that can be used
Page 11

4
See Also 7
to provide more details. Hovering your mouse over a graphic element will show the
data values for the element.
You can use the HTML= parameter to create a drill-down link for an indicator that is
displayed by a local file or Web server, a WebDAV Display Portlet in the Portal, and in
stored processes that are displayed in the Portal or the Stored Process Web Application.
Drill-down links that are created with the HTML= parameter are ignored when the
indicator graphs are added to a SAS Web Report Studio report. However, you can add
links to existing Web pages or reports when you create the report that contains the
stored process for the indicator. You can create these links on images or text that you
add to the report when you create it, but you cannot add links to the indicators
themselves. These links can be used when the report is displayed in the SAS Web
Report Studio or the Portal.
See “Step 5: Beneath Each Indicator, Insert Text with Hyperlinks” on page 21.
As provided, all the sample indicators drill down to the same page (specified in the
hardcoded_drilldown
macro variable). In an actual dashboard, each element in an
indicator would typically have its own details page that you create programmatically
based on the data for the indicator.
See Also
Note: The default drill-down page, specified in the
hardcoded_drilldown
macro
variable assignment that can be found in the beginning section of each sample, is on the
SAS Customer Support Center Web site. If you do not have Internet access, you should
change that variable to point to an HTML file that is accessible at your location.
4
For more information on the features of SAS/GRAPH software used in the dashboard
samples, see SAS/GRAPH Reference, which is available from the Documentation
section of the SAS Customer Support Center Web site.
Page 12

8
Page 13

CHAPTER
3
9
Registering a New Stored
Process
Prerequisites for This Chapter
How to Register a New Stored Process
9
9
Prerequisites for This Chapter
The information in this chapter makes the following assumptions:
3
SAS Management Console and SAS Foundation Services, including BI Manager,
have been installed at your site.
3
The stored process code for the dashboards and indicators has been downloaded,
and the code has been saved in the source code repository on the SAS Stored
Process Server at your site. See Chapter 2, “Downloading and Modifying The
Dashboard Samples,” on page 5 for more information about how to download the
code.
3
You have write metadata permission for the metadata repository so that you can
register stored processes.
3
You have access to and know the location of the stored processes that you are
registering.
How to Register a New Stored Process
Before you can use a stored process, you must first register the metadata for the
stored process. The following steps describe how to register stored processes within the
context of these sample dashboards and indicators.
Note: Before you can register a stored process, a server must be defined for the
stored process to run on. For these examples, you need to use a SAS Stored Process
Server. You can use the Server Manager to define a stored process server. For more
information about how to define a server, see the Help for the Server Manager.
To register a new stored process:
1 From the SAS Management Console navigation tree, select the folder under BI
Manager in which you would like to create the new stored process.
Note: For SAS Web Report Studio, the stored process must be registered in the
foundation repository that will contain the reports that use the stored process.
Within that repository, the stored process must be registered in the
ReportStudio/
To create a new folder under BI Manager, navigate to where you want to put
the new folder. Select Actions
folder structure.
4
I
New Folder. The New Folder Wizard appears.
BIP Tree/
4
Page 14
10 How to Register a New Stored Process
Complete the wizard, and then navigate to the new folder before you proceed to
the next step.
2
Select ActionsINew Stored Process. The New Stored Process wizard appears.
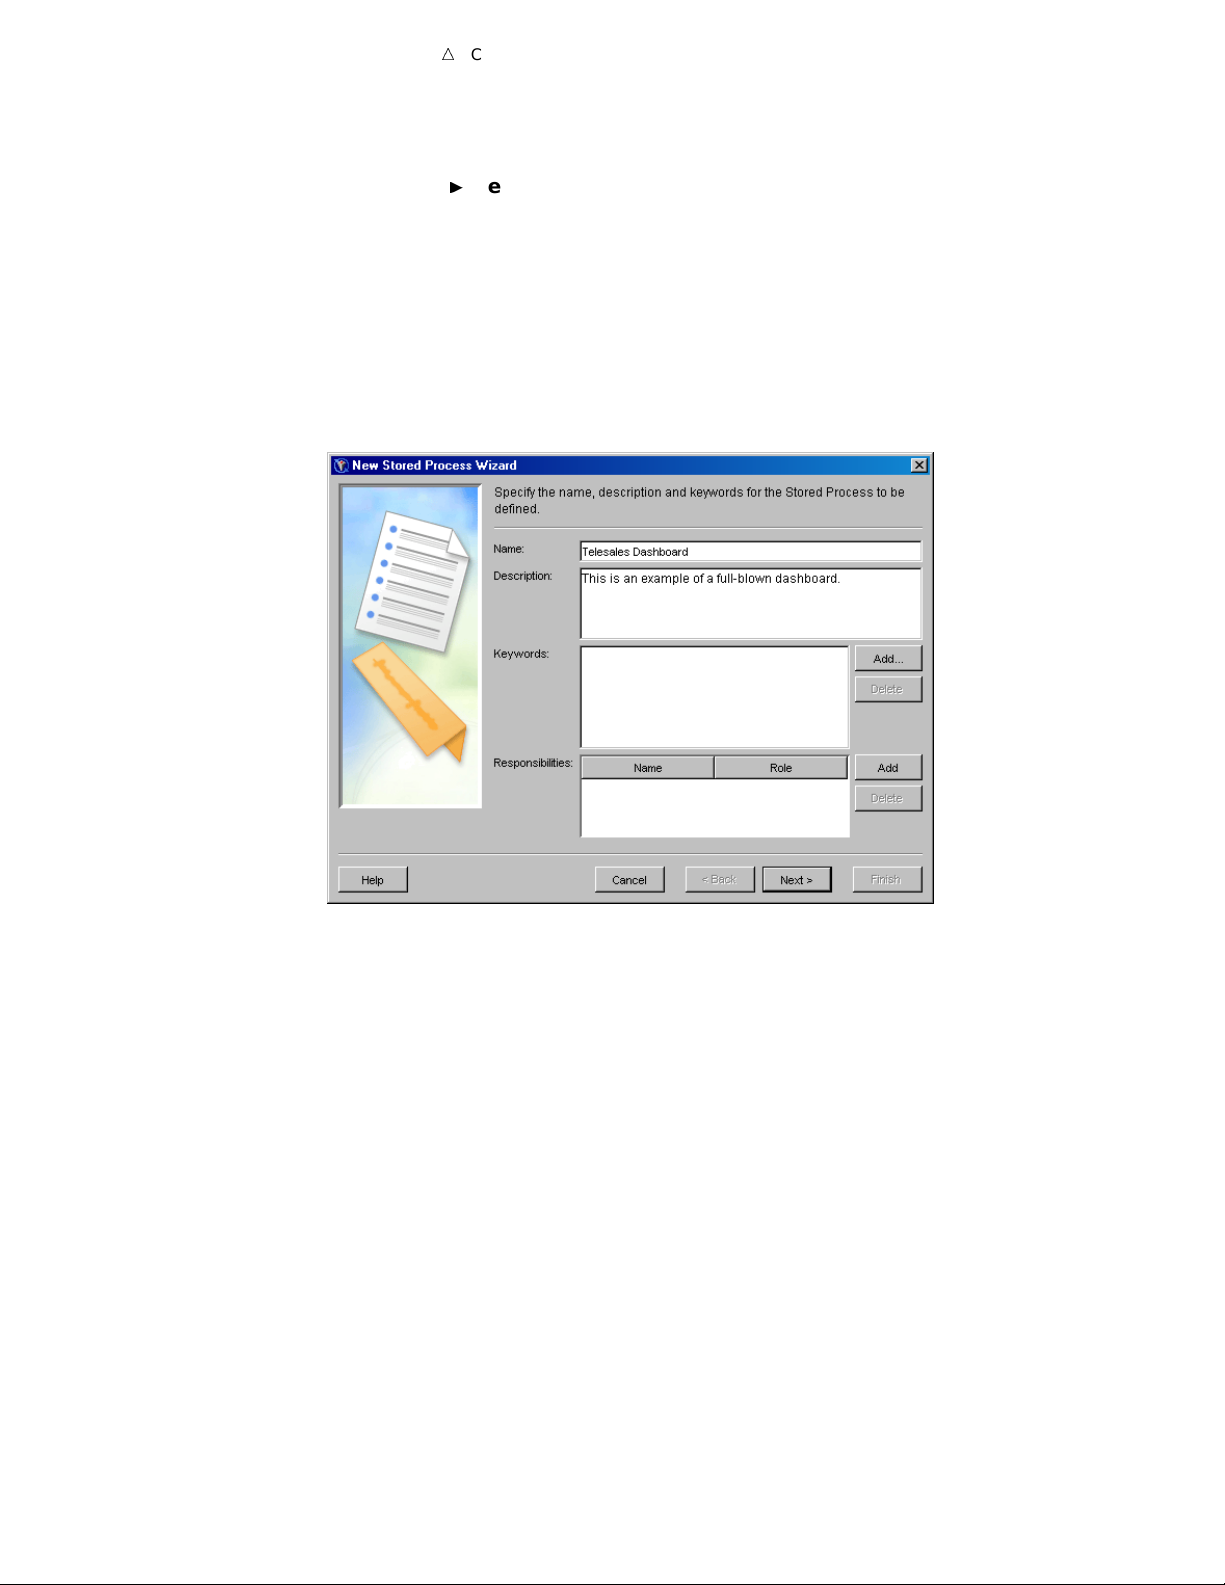
3
In the New Stored Process Wizard:
a
Enter a name for the stored process. Slashes, backslashes, and control
characters cannot be used in this field. Stored process names are limited to
60 characters, and must be unique within a folder. In this case, uniqueness is
defined to be case-insensitive.
b
Enter a description for the stored process. The description can contain up to
200 characters. This step is optional.
Display 3.1 New Stored Process Wizard —Name Specification
4
Chapter 3
c Click Next.
d Select a SAS Stored Process Server from the list.
e Select a source code repository from the list. A source code repository is a
location on the application server that contains stored process source code.
For more information about the source code repository, see the BI Manager
Help.
f Enter the name of the source code file for the stored process.
g Select the type of output from the list. For these examples, specify
Streaming as the stored process result type.
Page 15

Registering a New Stored Process
4
Display 3.2 New Stored Process Wizard —Execution Details
How to Register a New Stored Process 11
h Click Next.
i Click
Finish to register the new stored process.
Note: After you have registered the stored process, use the Stored Process
Properties dialog box to control access to the stored process. For more information, see
the BI Manager Help.
4
Page 16

12
Page 17

CHAPTER
4
13
Displaying Dashboards in SAS
Web Report Studio
Prerequisites for This Chapter
Overview: Displaying Dashboards in SAS Web Report Studio
Display the Output of a Single Indicator
Creating a Report That Displays the Output of One or More Indicators
Create a Report from an Open Indicator
Using Multiple Indicators to Create a Simple Dashboard Report 16
About the Example
Step 1: Insert the Indicators into the Report Layout
Step 2: Assign an Indicator to Each Placeholder Object
Step 3: Save Your Work
Step 4: Add a Header
Step 5: Beneath Each Indicator, Insert Text with Hyperlinks
Step 6: Insert a Footer 23
Step 7: Save Your Work 23
Step 8: View the Dashboard Report 23
Display the Output of a Complete Dashboard from a Single Stored Process 24
Refreshing the Data 25
Printing Indicators and Dashboards 25
Prerequisites for This Chapter
This chapter uses examples to explain how to perform the following tasks in SAS
Web Report Studio:
3
Select a stored process to view output for a single indicator.
3
Save a displayed indicator as part of a report.
3
Use multiple indicators to construct a simple dashboard report.
3
Select a stored process to view a dashboard that contains multiple indicators.
3
Print indicator and dashboard output.
13
14
14
15
15
16
17
19
20
20
21
Note: The examples in this chapter are based on SAS Web Report Studio 3.1.
However, you can use any version of SAS Web Report Studio to display the
dashboards.
If you want to complete the tasks by using your own indicators and dashboards, you
must meet the following requirements:
3
All necessary components of the SAS Intelligence Platform are installed and
configured at your site. The components must include the SAS Stored Process
Server. This server generates the output for the indicators and dashboards, which
are SAS Stored Processes.
4
Page 18

14 Overview: Displaying Dashboards in SAS Web Report Studio
3
The stored processes that you want to use have been registered in SAS metadata
as explained in Chapter 3, “Registering a New Stored Process,” on page 9.
3
You have logged on to SAS Web Report Studio with a user ID that has permission
to create reports.
3
You are familiar with using the SAS Web Report Studio application.
4
Chapter 4
Note: For more information about any of the tasks in this chapter, select Help
Contents from within SAS Web Report Studio.
4
Overview: Displaying Dashboards in SAS Web Report Studio
SAS Web Report Studio enables you to display the output of SAS Stored Processes. A
single stored process might produce output for an individual indicator or it might
produce a complete dashboard of indicators.
You can also combine individual indicators to create a dashboard report that includes
visual elements that are available in SAS Web Report Studio, such as headers, footers,
and text.
Display the Output of a Single Indicator
This example shows you how to view output from a single indicator simply by
selecting the stored process name from the Open dialog box in SAS Web Report Studio.
1 Select Report
In this example, the Slider Chart Indicator is stored with other indicators in a
folder named StoredProcesses.
Note: The name of the example folder does not imply that the folder must contain
only stored processes. A folder in SAS Web Report Studio can contain both stored
processes and reports. Stored processes are identified by this icon:
I
Open and navigate to the location where the indicator is stored.
I
.
4
Display 4.1 Open Dialog Box Showing the Contents of the StoredProcesses Folder
Note: You can also use the Report Management page to select the indicator
4
Page 19

4
Create a Report from an Open Indicator 15
2 Select the name of the indicator. For example, select Slider Chart Indicator
This sample indicator shows three ranges of data and a triangular marker that
points to the actual data value.
Display 4.2 Output for the Slider Chart Indicator Shown in the View Report View
.
3 (Optional) To view a SAS log for the indicator, select Help
When you open an indicator by using the method described in this topic, the data is
automatically refreshed. You can alsonot modify content.
However, when an indicator is saved as part of a report section, you can add visual
elements such as headers, footers, images, and text that are independent of the
indicator. You can also save the report so that the data in the report is manually
refreshed.
For more information, see “Creating a Report That Displays the Output of One or
More Indicators” on page 15.
I
View Log.
Creating a Report That Displays the Output of One or More Indicators
Create a Report from an Open Indicator
One way to include an indicator as part of a SAS Web Report Studio report is to
select Report
Report view (as shown in Display 4.2 on page 15). For a new report, either menu
selection opens the Save As dialog box.
Note: You can also save from the Edit Report view (which is discussed in “Step 1:
Insert the Indicators into the Report Layout” on page 17).
I
Save or ReportISave As when the output is displayed in the View
4
Page 20

16 Using Multiple Indicators to Create a Simple Dashboard Report
In the Save As dialog box, you name the new report, provide an optional description,
navigate to a storage location, and select options such as
the report from automatically displaying the most recent data, you can select
be manually refreshed
Display 4.3 A New, Manually Refreshed, Read-Only Indicator Report Named ’IT Expenses’
from the
4
Chapter 4
Type drop-down list.
Make read-only
. To prevent
Data can
The Slider Chart Indicator stored process continues to exist in addition to the newly
saved report named IT Expenses.
For information about how to save multiple indicators in a report, see “Using
Multiple Indicators to Create a Simple Dashboard Report” on page 16.
Using Multiple Indicators to Create a Simple Dashboard Report
About the Example
The topics in this section explain how to combine multiple indicators to create a
simple dashboard such as the one shown in Display 4.4 on page 17. The example uses
three indicators that are based on the Bar Chart Indicator from the samples library.
They are the Sales Revenue Indicator, the Profit Indicator, and the Market Share
Indicator. Besides output from the three indicators, the report contains the following
features:
3
A header with a company logo, static text, the report description as dynamic text,
and a dividing line between the header and the main report content.
3
Text beneath each indicator that includes a link to another report that contains
more details about the information in the associated indicator.
Page 21

4
Using Multiple Indicators to Create a Simple Dashboard Report 17
3
A footer that contains a confidentiality message and a link to the corporate Web
page for more information about company policy.
Display 4.4 A Simple Dashboard Report That Contains Output from Multiple Indicators
To begin creating this example, see “Step 1: Insert the Indicators into the Report
Layout” on page 17.
Step 1: Insert the Indicators into the Report Layout
In “Create a Report from an Open Indicator” on page 15, you learned how to save a
displayed indicator as part of a report. Another way to create reports that include
indicators is to use the tools in SAS Web Report Studio’s Edit Report view. When you
use the Edit Report view, your report can contain multiple indicators.
I
1 Select Report
New to access the Edit Report view.
Page 22

18 Using Multiple Indicators to Create a Simple Dashboard Report
Display 4.5 The Edit Report View as It Appears Before Content Has Been Added or Defined
4
Chapter 4
2 By default, the body grid has two columns, but, in this example, the three
indicators are side-by-side at the top of the report. To insert a third column on the
right, click
3 Click
(located on the vertical toolbar).
(located on the horizontal toolbar) three times to insert placeholder
objects into the first three cells in the top row of the body grid.
Page 23

4
Using Multiple Indicators to Create a Simple Dashboard Report 19
Display 4.6 The Layout with the Three Empty Placeholder Objects
Note: You can also click and drag the tool into each cell to insert a placeholder
object for a stored process.
4
Step 2: Assign an Indicator to Each Placeholder Object
To assign an indicator to a placeholder object, complete the following steps:
1
On the toolbar for the first placeholder object, click
Stored Process
2 Navigate to the folder that contains the indicator that you want to insert.
3
Select the indicator, and then click
to open the Insert a Stored Process dialog box.
OK. In this example, the Sales Revenue
Indicator is in the first cell.
4 Repeat steps 1 to 3 in order to select the second and third indicators. In this
example, the Profit Indicator is in the second cell and the Market Share Indicator
is in the third cell.
, and then select Edit
Page 24

20 Using Multiple Indicators to Create a Simple Dashboard Report
Display 4.7 The Layout with the Three Indicators Selected
4
Chapter 4
Step 3: Save Your Work
Before continuing, save the report.
I
1 Select Report
Note: Because this is a new report, Report
box.
4
2 Name the report. In this example, the report is named 2005 Sales Dashboard.
3 Type a description. This sample report has the following description:
This dashboard uses three bar charts with triangular markers to
graphically present three indicators for 2005 sales: revenue,
profit, and market share
4 Click OK.
Save to open the Save As dialog box.
I
Save opens the Save As dialog
.
Note: When creating a report, save your work frequently, especially after making
changes that require you to complete multiple steps.
4
Step 4: Add a Header
A header can contain one or more of the following elements: a banner image, static
text, hyperlinks, dynamic text, and a dividing line. In this example, the header includes
a banner image, both static and dynamic text, and a dividing line.
1 Click Header to open the Edit Header dialog box.
2 If images are available at your site, you can select one from the Banner drop-down
list. (Banner images are not available by default.) In this example, the header
contains an image named
3 In the text box, enter the static text, insert dynamic text for the report description,
and use the formatting tools until the text appears the way you want it to. The
text for this example is shown in Display 4.8 on page 21.
orionstarHeader.
Note: To insert the dynamic text, select
drop-down list and then click Insert.
text
Report Description from the Dynamic
4
Page 25

4
Using Multiple Indicators to Create a Simple Dashboard Report 21
4 Select the option to insert a horizontal line between the header and the report
content.
Display 4.8 This Header Contains a Banner Image, Static and Dynamic Text, and a Horizontal Line
5 Click OK.
Note: When the report is rendered, SAS Web Report Studio replaces
with the text that was entered in the
Description field in the Save As dialog box (see
“Step 3: Save Your Work” on page 20). If you change the description, the changes are
automatically included in the report the next time it is rendered. SAS Web Report
Studio has a variety of dynamic text options such as report author, report name, and
last saved date.
4
Step 5: Beneath Each Indicator, Insert Text with Hyperlinks
The sample dashboard includes text beneath each indicator. Each block of text
includes a link to another report that contains more detail about the associated
indicator.
Note: You must create the detailed report before you can create a link to it in SAS
Web Report Studio.
1
Click
bottom row of the body grid.
Note: You can also click and drag the
object for text.
2 On the toolbar for the first placeholder, click , and then select Edit Text to
open the Edit Text dialog box.
3 In the text box, type the text for the first indicator, and accept the default
formatting. The text for the Sales Revenue Indicator is shown in Display 4.9 on
page 22.
4
three times to insert placeholder objects into the last three cells in the
tool into each cell to insert a placeholder
4
Page 26

22 Using Multiple Indicators to Create a Simple Dashboard Report
4 To link to the detailed report, select the text that you want users to click on. In
Display 4.9 on page 22, the text
for the link.
Display 4.9 Text for the Sales Revenue Indicator
4
Chapter 4
Sales by Region and Representative
is used
5 Click
to open the Report Linking dialog box, and then complete the following
steps.
a Select the
Make text a link
option to enable the rest of the items in the
dialog box.
b
Select the target report, and then click
Display 4.10 The Target Report That Contains Details for the Sales Revenue Indicator Is Selected
OK to return to the Edit Text dialog box.
Page 27

4
Using Multiple Indicators to Create a Simple Dashboard Report 23
6 Click OK.
7
Repeat steps 2 through 6 in order to create the text and the links for the other two
indicators. In this example, the text for the Profit Indicator links to the Profit by
Subsidiary report, and the text for the Market Share Indicator links to the Market
Share by Product and Region report.
Step 6: Insert a Footer
Like headers, a footer can contain a banner image, static text, hyperlinks, dynamic
text, and a dividing line. In this example, the footer includes text, a hyperlink to a
company Web page, and a dividing line.
1 Click
2
3 Select the option to insert a horizontal line between the footer and the report
Display 4.11 The Footer with a Hyperlink to the Company’s Internal Web Page
Footer
to open the Edit Footer dialog box.
In the text box, enter the static text. In this example, the company Web page
address is typed in the form
www.abccorp.internal.com. SAS Web Report
Studio automatically converts the address to a hyperlink.
content.
4 Click OK.
Step 7: Save Your Work
Select ReportISave to save the final report.
Because the report has already been saved, the Save As dialog box does not appear
again.
Note: You also could click
View Report to preview the report before saving.
Step 8: View the Dashboard Report
To view the report, click View Report.
4
Page 28

24 Display the Output of a Complete Dashboard from a Single Stored Process
4
Chapter 4
Display the Output of a Complete Dashboard from a Single Stored
Process
One stored process can also produce a complete dashboard of indicators. The
dashboard shown in Display 4.12 on page 24 includes output from 17 bar chart
indicators. (Three of these indicators were used to create the simple dashboard shown
in Display 4.4 on page 17.)
1
Select ReportIOpen and navigate to the location where the dashboard is stored.
2 Select the name of the dashboard. For example, select
Display 4.12 A Complete Dashboard Produced from a Single Stored Process
Bar Chart Dashboard
.
As explained in “Step 5: Beneath Each Indicator, Insert Text with Hyperlinks” on
page 21, you could create a text link from this dashboard to another SAS Web Report
Studio report or to a Web page. For example, you could link to a URL address such as
the one described in “Display a Dashboard or Indicator” on page 36. This link could
take users to a version of the same dashboard that enables them to drill down to more
detailed data.
Note: Before you can create a text link, you must save the dashboard as a SAS Web
Report Studio report (for more information about saving, see “Step 3: Save Your Work”
on page 20).
4
Page 29

Refreshing the Data
The data displayed by the indicators on a dashboard are refreshed as follows:
3
If a stored process in the STP Web Application is used to display the data, the
displayed values are updated each time the STP is refreshed or opened.
3
If a SAS Web Report Studio report is used to display the data, the displayed
values are updated each time the report is refreshed or opened.
3
If a WebDAV Content Portlet is used to display the data, the displayed values are
updated when the portlet is recreated and sent to the WebDAV to replace the
existing content, and the user refreshes the Portal or logs back into it.
Printing Indicators and Dashboards
To print indicators and dashboards from SAS Web Report Studio, complete the
following steps:
1
Select ReportIPage Setup to open the Page Setup dialog box. Adjust page
settings such as margins and orientation, and then click
2 Select Report
to display a PDF file that you can print or save.
I
Print to open the Print dialog box. Click
4
Printing Indicators and Dashboards 25
OK.
Preview and Print
Page 30

26
Page 31

CHAPTER
5
27
Displaying Dashboards in the
SAS Information Delivery Portal
Prerequisites for This Chapter
Overview: Displaying Dashboards in the SAS Information Delivery Portal
Display a Dashboard in a WebDAV Content Portlet
Step 1: Add the Dashboard’s Output Files to the WebDAV Repository
Step 2: Create a WebDAV Content Portlet
Step 3: Add a Dashboard to the WebDAV Content Portlet 30
Step 4: Make the Dashboard Available to Portal Users
Use a Macro to Add Files to the WebDAV Repository (Optional)
Prerequisites for This Chapter
This chapter makes the following assumptions:
3
You are using SAS Information Delivery Portal 2.0 with SAS 9.1.3 Service Pack 4.
Note: In this chapter, the description of the portal’s graphical interface
corresponds to the SAS Information Delivery Portal 2.0 with Hot Fix
WEBINFRAKIT06 applied. However, that hot fix is not required in order to render
your dashboards in the portal.
Your deployment includes the Xythos WebFile Server (WFS). You must use Xythos
3
WFS to manage dashboard output in a WebDAV repository.
3
You have access to one or more sample SAS programs that generate dashboard
output. For information about the samples, see Chapter 2, “Downloading and
Modifying The Dashboard Samples,” on page 5.
3
You know how to start the SAS Information Delivery Portal. For information about
starting the portal and the servers on which it depends, see “Starting the Web
Applications” in the SAS Intelligence Platform: Web Application Administration
Guide, which can be found at
3
You are familiar with the SAS Information Delivery Portal. If you need
instructions on using the portal, click the
the portal page.
27
27
29
29
29
31
32
4
http://support.sas.com/913administration.
Help link in the upper right corner of
Overview: Displaying Dashboards in the SAS Information Delivery Portal
The SAS Information Delivery Portal enables you to display key performance
indicators as dashboards in portlets. Authorized portal users will then see the
dashboard indicators when they log on to the portal. Here is an example of a dashboard
that is displayed in a portlet labeled Dial Meters. The dashboard consists of four dial
indicators.
Page 32

28 Overview: Displaying Dashboards in the SAS Information Delivery Portal
Display 5.1 Sample Dashboard Indicators in a Portlet
4
Chapter 5
Users can click an indicator to drill down to an HTML page that contains more
information about the indicator. This HTML page is specified in the sample SAS
program that generates the dashboard output. By default, the indicators drill down to a
generic HTML page that is included with the samples.
Note: When you drill down to the HTML page, the new page loads into the same
browser window as the portal and replaces the portal page. The portal session is still in
effect, however. You can click the browser’s
Back button to return to the portal page.
The best way to present a dashboard in the portal is to display the dashboard in a
WebDAV content portlet. A WebDAV content portlet enables you to enforce security so
that only authorized users can see the dashboard contents. A WebDAV content portlet
also provides drill-down capability so that users can access any additional information
that you make available.
A WebDAV content portlet displays the contents of a specified HTML fragment that
is stored in the portal’s WebDAV repository. An HTML fragment is an HTML file that
does not include opening and closing HTML tags, HEAD tags, or BODY tags, and which
can be displayed successfully in the cell of an HTML table.
Note: As an alternative to displaying the dashboard in a WebDAV content portlet,
you can add a SAS Stored Process to a collection portlet. Users can then run the stored
process to generate dashboard output and view its output via the SAS Stored Process
Web application. Note that with this option, the dashboard is not displayed inside of a
portlet.
If you choose this option, then be sure to register the stored process in metadata. (See
Chapter 3, “Registering a New Stored Process,” on page 9.) With this option, you don’t
need Xythos WFS unless the stored process produces package results. For instructions
on adding content items to a collection portlet, see the portal’s online Help.
4
4
Page 33

4
Step 2: Create a WebDAV Content Portlet 29
Display a Dashboard in a WebDAV Content Portlet
Step 1: Add the Dashboard’s Output Files to the WebDAV Repository
To display a dashboard in a WebDAV content portlet, you first add the dashboard’s
HTML and GIF files to the WebDAV repository. Complete these steps:
1
Run the SAS program that generates the output that you want to display.
The filename for the SAS program should include the word “Portal.” For
example, you might run a program named
sliderDashPortal.sas. The programs targeted for the portal produce files that
are HTML fragments. These programs contain an ODS statement that is similar
to the following statement:
ODS HTML path=odsout body="&name..htm"
(title="Dial Meter Dashboard" no_top_matter no_bottom_matter)
style=minimal;
2
Add the output files to the WebDAV repository. See the Xythos documentation for
instructions on adding files.
dialMeterDashPortal.sas
or
Note: A macro is available that adds files to the WebDAV repository. For details
about using this macro, see “Use a Macro to Add Files to the WebDAV Repository
(Optional)” on page 32.
4
If you want the dashboard to be available to all portal users, then add the output
files to
sasdav/Public in the Xythos repository. If you want to limit the dashboard to a
group that is defined in metadata, then add the files to the folder for that group.
For example, you might add the output files to a folder named
sasdav/Sales in order
to make the dashboard available to a group named Sales that is defined in metadata.
Before members of this group can see the dashboard in the portal, the Sales group must
be granted Read and Inherit Read permissions on the WebDAV folder in Xythos.
Note: If you need to create a group in metadata, you can do so using SAS
Management Console. You must restart Xythos WFS before it can find the new group in
metadata.
4
Step 2: Create a WebDAV Content Portlet
After you have added the dashboard files to WebDAV, create a WebDAV content
portlet that will display the dashboard output. The procedure for creating a WebDAV
content portlet is the same as the procedure for creating other types of portlets, except
that you select a different value for the
Complete these steps to create a WebDAV content portlet:
1 Start the SAS Information Delivery Portal and log on.
If you want to share the portlet content so that other users can view it, you
should log on as a content administrator for the respective group. For more
information, see “Configure a Group Content Administrator” in the SAS
Intelligence Platform: Web Application Administration GuideYou can also log on as
the SAS Web Administrator, who is a content administrator for all groups.
2 Navigate to the page where you want to add the portlet.
3 Select
4 On the Edit Page Content page, click Add Portlets.
Options
I
Edit Content.
Portlet type
field.
Page 34

30 Step 3: Add a Dashboard to the WebDAV Content Portlet
4
Chapter 5
5 On the Create tab of the Add Portlets page, select WebDAV Content Portlet
as
the portlet type.
6 Enter descriptive information about the portlet:
Name
Short name that will appear in the title area at the top of the portlet.
Description
Short description that will appear with the portlet in search results.
Keywords
Single words that you or other users can use to search for this portlet. Use
spaces to separate keywords from one another.
Note: To ensure efficient searching, develop a standard list of keywords
and use these keywords consistently.
7
If you are a group content administrator, then you can specify a location (group)
4
with which to share the portlet. The group can be Public or some other group that
is specified in metadata. You must have WriteMetadata permission for the
respective group in metadata.
8
Click
Add.
A message appears, indicating that the portlet was added.
9
If you want to create additional portlets, repeat steps 5 through 8. When you are
finished creating new portlets, click
10 On the Edit Page Content page, specify where the new portlets are to appear on
Done.
the page:
3
If you are using a column layout, you can move the portlets to different
columns or to different positions within the columns.
3
If you are using a grid layout, specify where you want each portlet to appear
by selecting the portlet names in the drop-down boxes for the appropriate
cells. To span rows or columns, select the same portlet in adjoining cells.
For more information about specifying the layout of portlets, see the online Help.
11 Click
OK. The original page is displayed, with the new portlets added.
The new WebDAV content portlet contains a message that instructs you to edit the
portlet and select the HTML file that you want to display. You can now add a
dashboard to the portlet, as described in the next section.
Step 3: Add a Dashboard to the WebDAV Content Portlet
After you create a WebDAV content portlet, you must edit the portlet in order to
specify the path to the dashboard’s HTML file. The file must be stored in the portal’s
WebDAV repository in a folder that you are authorized to access. You can also specify a
link to additional detailed information.
To edit a WebDAV content portlet, complete these steps:
1 If you are not logged on to the SAS Information Delivery Portal, then log on now.
2 Navigate to the page that contains the portlet that you want to edit.
3 In the portlet’s title bar, click the Edit Contents icon .
4 On the Edit Portlet page, select the HTML fragment that you want to display. You
can take these actions:
3
Select a file in the list by clicking on the file’s name.
Page 35

4
Step 4: Make the Dashboard Available to Portal Users 31
3
Sort the items in the contents list by clicking on the appropriate column
heading. For example, click
3
Navigate to a different folder using one of the following methods:
3
To navigate to a folder that is at a higher level in the tree, click the down
arrow on the
3
To navigate to the folder at the next-highest level, click the
Location list box and then click the name of the folder.
Date Modified
to sort the items by date.
Up One
Level
3
To navigate to a subfolder of the current folder, click on a folder name in
icon .
the contents list.
5 If you want the portlet to display a link to additional detailed information, then in
the
Detail link
field, specify a SBIP URL for the item that contains the
information. You can link to content that is located in the WebDAV repository, or
you can link to content that is defined in SAS metadata.
To create the URL, follow these steps:
a
Use the Search tool to find the content item that you want to link to.
b
Copy the item’s path information from the
Location
column in the search
results.
For WebDAV content, the path begins with the name of the WebDAV
repository. The default repository name is
WebDAVDemo.
For content that is defined in SAS metadata, the path begins with the
name of the metadata repository. The default repository name is
c After the path, enter a slash (
/) followed by the content item’s name (from
Foundation.
the Name column in the search results).
d Place the following characters in front of the path:
sbip://
Note: The portal Web application uses the SAS Business Intelligence
Platform (SBIP) protocol as a default even if you do not specify it explicitly.
4
Here are some examples of SBIP URLs for various types of content items:
3
sbip://Foundation/Samples/Stored Processes/Sample: Shoe Sales
Graphics
3
sbip://Foundation/BIP Tree/ReportStudio/Maps/SalesEast
3
sbip://Foundation/BIP Tree/ReportStudio/Shared/Reports/
Sales.srx
3
sbip://WebDAVDemo/Users/sasdemo/detail.html
6 Click Save.
When the portlet appears, it will display the contents of the HTML fragment.
Step 4: Make the Dashboard Available to Portal Users
When you created the WebDAV content portlet, you had the option of sharing the
portlet with a group. If you didn’t share the portlet at that time, you can later edit the
portlet’s properties and specify a share location.
You can also share the page on which you added the portlet. When you share a page
that contains a portlet, you can specify whether you also want to share the portlet. For
instructions, see the portal’s online Help. Depending on the share type, group members
will either see the page the next time that they log on, or group members can search for
and add the page to their portals. For details about shared pages, see “Understanding
Page 36

32 Use a Macro to Add Files to the WebDAV Repository (Optional)
Pages and Page Templates” in the SAS Intelligence Platform: Web Application
Administration Guide.
After you create the portlet, you can edit the portlet as needed. Any changes that you
make to a shared portlet are seen by all users who can access the portlet.
Use a Macro to Add Files to the WebDAV Repository (Optional)
You can use a SAS macro to add the directory that contains your dashboard files to
the WebDAV repository.
The SAS macro, named
Integration Technologies; this product must be installed and licensed on the system
where the macro is run. (SAS Integration Technologies is included with the SAS
Information Delivery Portal.)
Complete these steps to use the macro:
1
Create a SAS program that invokes the
located in the dashboard download package. The macro is also included as an
attachment to the portal dashboard samples in the SAS Samples application.
2 In your SAS program, when you invoke
arguments that specify the files to be copied, the WebDAV location, and the
credentials that are required to write to that location.
Here is the syntax for the
copyToWebDAV, uses features that are included with SAS
4
Chapter 5
copyToWebDAV macro. The macro file is
copyToWebDAV, you must pass a set of
copyToWebDAV macro:
%copyToWebDAV (dirname, davloc, userid, passwd)
Here are descriptions of the parameters:
dirname Specify the full path of the directory that contains the files to be
added to the WebDAV repository. Enclose the path in single
quotation marks. For example:
’C:\dashboard\Dial_Meter’
Note: If the directory contains any subdirectories, they will
not be copied to the WebDAV repository.
4
davloc Specify the URL for the WebDAV location, enclosed in single
quotation marks. For example:
’http://<WebDAVHost>:8300/sasdav/Sales/dial_meters’
In this example, the macro creates a
sasdav/Sales
files in
C:\dashboard\Dial_Meter to that folder.
on the WebDAV server, and then copies all the
dial_meters
folder under
CAUTION:
Be sure to specify a unique location for the directory.
If the
location that you specify already exists on the WebDAV server,
then you will overwrite the existing files.
4
userid Specify the user ID that is used to connect to the WebDAV server,
enclosed in single quotation marks. If the WebDAV server runs on
a Windows system, then the user ID should be qualified with
either the domain name or the machine name. For example:
<Windows domain or machine>\saswbadm
The user ID that you specify must be authorized to write to the
WebDAV location that is specified for the davloc parameter. In
the example, saswbadm has write permissions for the
Sales
location on the WebDAV server.
sasdav/
Page 37

4
Use a Macro to Add Files to the WebDAV Repository (Optional) 33
passwd Specify the password that is used to authenticate the user that
you specified in the previous argument, enclosed in single
quotation marks. It is recommended that you encrypt the
password, but you are not required to do so.
Use SAS proprietary 32-bit encryption to encrypt passwords.
For example, to encrypt a password of
pswd123, you would submit
this code in the SAS Program Editor:
proc pwencode in=’pswd123’ method=sasenc;
run;
Here is a sample SAS program that includes and then invokes the
copyToWebDAV
%include "copyToWebDAV.sas";
%copyToWebDAV(’C:\dashboard\Dial_Meter’,
’http://localhost:8300/sasdav/Sales/dial_meters’,
’saswbadm’, ’{sasenc}4CE77C1519B5EBA351AAA7734A6CA437’);
3
Save and run the SAS program.
macro:
Page 38

34
Page 39

CHAPTER
6
35
Displaying Dashboards in the
SAS Stored Process Web
Application
Prerequisites for This Chapter
Overview: Displaying Dashboards in the SAS Stored Processes Web Application
Display a Dashboard or Indicator
Navigate the SAS Stored Process Web Application
Modify the Execution Options for a Stored Process
References 40
Prerequisites for This Chapter
The information in this chapter makes the following assumptions:
3
All necessary components of the SAS Intelligence Platform, including the Java
Runtime Environment (JRE) or Java Development Kit (JDK), a servlet container
(such as Apache Tomcat or BEA Weblogic), and the SAS Web Infrastructure Kit or
SAS Information Delivery Portal have been installed and configured at your site.
This sample has been tested using SAS 9.1.3 Service Pack 4. The SAS Stored
Process Server that contains the dashboard programs has been started.
3
The stored process code for the dashboards and indicators (for the example
discussed in this chapter, the file is named telesalesDashSTP.sas) has been
downloaded and saved in the source code repository on the SAS Stored Process
Server at your site. See Chapter 2, “Downloading and Modifying The Dashboard
Samples,” on page 5 for more information about how to download the code.
3
The stored processes have been registered at your site with SAS Management
Console. See Chapter 3, “Registering a New Stored Process,” on page 9 for more
information about how to register these sample stored processes.
3
You know how to log on to the SAS Stored Process Web Application, and you have
a valid user ID and a password. (You need to have metadata permission to register
and execute the stored process, and file system permissions to create the SAS
program.)
3
You are familiar with using the SAS Stored Process Web Application. For more
information about the SAS Stored Process Web Application, see the documentation
about SAS Stored Processes in the
Developer’s Guide
library9.html
3
You have access to and know the location of the Telesales Dashboard, which is the
example that is used in this chapter.
at http://support.sas.com/rnd/itech/library/
.
35
36
36
37
39
SAS Integration Technologies:
Page 40

36 Overview: Displaying Dashboards in the SAS Stored Processes Web Application
4
Chapter 6
Overview: Displaying Dashboards in the SAS Stored Processes Web
Application
SAS Stored Process Web Application enables you to display dashboards or key
performance indicators in a Web browser using stored processes. Here is an example of
a complex dashboard stored process that consists of several types of indicators (Few
2006, p. 199).
Display 6.1 Sample Dashboard in the SAS Stored Process Web Application
Display a Dashboard or Indicator
To use the SAS Stored Process Web Application to view output from a dashboard or
indicator, open a Web browser and enter the URL for this sample. You can specify input
parameters as a sequence of name/value pairs in a URL by using the query string
syntax. Each name in the query string is separated from the following value by an
equals (=). For example, the SAS Stored Process Web Application might have the
following URL:
http://server01.na.abc.com:8080/SASStoredProcess/
do?_program=/Users/jdoe/Telesales+Dashboard
The URL specifies your server, an absolute path to the SAS Stored Process Web
Application, and the query string (following the question mark character). In this
example,
parameter that specifies the metadata location and name of the stored process to be
executed.
There are special rules for the formatting of name/value pairs in a URL. Special
characters (most punctuation characters, including spaces) in a value must be URL
_program=/Users/jdoe/Telesales+Dashboard is the reserved input
Page 41

4
Navigate the SAS Stored Process Web Application 37
encoded. Spaces can be encoded as a plus (+) or %20. Other characters are encoded
using the %nn convention, where nn is the hexadecimal representation of the character
in the ASCII character set. In the previous example, the value
Telesales+Dashboard
Dashboard
. The space in the name is encoded as a plus (+). If your parameter values
actually identifies the stored process named
/Users/jdoe/
Telesales
might contain special characters, it is important that they are URL encoded.
The dashboard or indicator is displayed in the Web browser, as follows:
Display 6.2 Sample Dashboard in the SAS Stored Process Web Application
Navigate the SAS Stored Process Web Application
Instead of using the _PROGRAM variable, you can start with the application URL
for the SAS Stored Process Web Application and navigate to the stored process that
contains the dashboard or indicator that you want to display. Your application URL
might look like the following URL:
http://server01.na.abc.com:8080/SASStoredProcess/do
When you enter this URL, the SAS Stored Process Web Application welcome page is
displayed (if Welcome.htm is installed). The Welcome page might look like this:
Page 42

38 Navigate the SAS Stored Process Web Application
Display 6.3 Welcome Page for the SAS Stored Process Web Application
From this page, you can click List Available Stored Processes in order to display a
page that contains a tree view of metadata repositories, folders, and stored processes.
(You can also append the _ACTION variable with a value of INDEX
(_ACTION=INDEX) to the SAS Stored Process Web Application URL in order to display
this page. For example, the URL might be
SASStoredProcess/do?_action=index
tree view in order to view metadata for the stored process or to run the stored process.
A page with the tree view and metadata might look like this:
4
Chapter 6
http://server01.na.abc.com:8080/
.) You can then select a stored process in the
Display 6.4 Stored Process List and Summary Page
Click Execute to see the execution options. For more information about modifying
these options, see “Modify the Execution Options for a Stored Process” on page 39.
Page 43

4
Modify the Execution Options for a Stored Process 39
Click Execute
to run the stored process and display the dashboard or indicator in the
Web browser.
Modify the Execution Options for a Stored Process
You can modify the execution options for a stored process if you want to do things
like the following:
3
specify whether to open a new Web browser window to display the stored process
output.
3
show the SAS log, execution time, or execution trace with the stored process
output.
Note: The items in this list are just a few of the modifications you can make with
the execution options page. However, do not attempt to modify the ODS style, graphic
device, or output type for these dashboards and indicators. These options are set in the
SAS code for each sample.
To get to the execution options page, you can either navigate to it using the method
described in the previous section, or you can use the _PROGRAM variable along with
_ACTION=PROPERTIES in the URL. Multiple name/value pairs in the URL are
separated by ampersands (&). For example, the execution options page might have the
following URL:
http://server01.na.abc.com:8080/SASStoredProcess/
do?_program=/Users/jdoe/Telesales+Dashboard&_action=properties
4
Here is an example of what the execution options page looks like:
Display 6.5 Stored Process Execution Options Page
Page 44

40 References
References
4
Chapter 6
For more information about the other execution options on this page, see the
documentation about the SAS Stored Process Web Application in the
Technologies: Developer’s Guide
library/library9.html
.
at http://support.sas.com/rnd/itech/
When you are finished modifying the execution options, click
SAS Integration
Execute
to run the
stored process and display the dashboard or indicator in the Web browser.
Few, Stephen. 2006. Information Dashboard Design. Sebastopol, CA: O’Reilly Media,
Inc.
Page 45

Your Turn
If you have comments or suggestions about Implementing Dashboard Samples with
SAS
For comments about this book, please return the photocopy to
For suggestions about the software, please return the photocopy to
®
, please send them to us on a photocopy of this page, or send us electronic mail.
SAS Publishing
SAS Campus Drive
Cary, NC 27513
E-mail:
SAS Institute Inc.
Technical Support Division
SAS Campus Drive
Cary, NC 27513
E-mail:
yourturn@sas.com
suggest@sas.com
 Loading...