

Page 1

SAS® BI Dashboard 4.3
User's Guide
SAS® Documentation
Page 2

The correct bibliographic citation for this manual is as follows: SAS Institute Inc. 2010. SAS® BI
Dashboard 4.3: User’s Guide. Cary, NC: SAS Institute Inc.
SAS® BI Dashboard 4.3: User’s Guide
Copyright © 2010, SAS Institute Inc., Cary, NC, USA
ISBN 978-1-60764-777-5
All rights reserved. Produced in the United States of America.
For a hard-copy book: No part of this publication may be reproduced, stored in a retrieval system, or
transmitted, in any form or by any means, electronic, mechanical, photocopying, or otherwise, without
the prior written permission of the publisher, SAS Institute Inc.
For a Web download or e-book: Your use of this publication shall be governed by the terms
established by the vendor at the time you acquire this publication.
U.S. Government Restricted Rights Notice: Use, duplication, or disclosure of this software and related
documentation by the U.S. government is subject to the Agreement with SAS Institute and the
restrictions set forth in FAR 52.227-19, Commercial Computer Software-Restricted Rights (June 1987).
SAS Institute Inc., SAS Campus Drive, Cary, North Carolina 27513.
1st printing, November 2010
1st electronic book, November 2010
®
Publishing provides a complete selection of books and electronic products to help customers use
SAS
SAS software to its fullest potential. For more information about our e-books, e-learning products, CDs,
and hard-copy books, visit the SAS Publishing Web site at support.sas.com/publishing or call 1-800727-3228.
®
and all other SAS Institute Inc. product or service names are registered trademarks or trademarks
SAS
of SAS Institute Inc. in the USA and other countries. ® indicates USA registration.
Other brand and product names are registered trademarks or trademarks of their respective companies.
Page 3

Contents
What's New in the SAS BI Dashboard 4.3 . . . . . . . . . . . . . . . . . . . . . . . . . . . . . . . . . . . . v
PART 1 Information for All Users 1
Chapter 1 • Introduction . . . . . . . . . . . . . . . . . . . . . . . . . . . . . . . . . . . . . . . . . . . . . . . . . . . . . . . . . . . 3
Overview . . . . . . . . . . . . . . . . . . . . . . . . . . . . . . . . . . . . . . . . . . . . . . . . . . . . . . . . . . . . . . 3
Audience . . . . . . . . . . . . . . . . . . . . . . . . . . . . . . . . . . . . . . . . . . . . . . . . . . . . . . . . . . . . . . 3
Chapter 2 • General Information . . . . . . . . . . . . . . . . . . . . . . . . . . . . . . . . . . . . . . . . . . . . . . . . . . . . 5
The Workflow . . . . . . . . . . . . . . . . . . . . . . . . . . . . . . . . . . . . . . . . . . . . . . . . . . . . . . . . . . 5
Chapter 3 • Getting Started: The SAS Information Delivery Portal . . . . . . . . . . . . . . . . . . . . . . . . 9
Overview . . . . . . . . . . . . . . . . . . . . . . . . . . . . . . . . . . . . . . . . . . . . . . . . . . . . . . . . . . . . . . 9
Open the Portal and Log On . . . . . . . . . . . . . . . . . . . . . . . . . . . . . . . . . . . . . . . . . . . . . . . 9
Create a Page and Add It to Your Navigation Bar . . . . . . . . . . . . . . . . . . . . . . . . . . . . . 10
Add a SAS BI Dashboard Portlet to a Page . . . . . . . . . . . . . . . . . . . . . . . . . . . . . . . . . . 11
PART 2 Information for Dashboard Users 13
Chapter 4 • Working with the SAS BI Dashboard Portlet . . . . . . . . . . . . . . . . . . . . . . . . . . . . . . . 15
Select a Dashboard . . . . . . . . . . . . . . . . . . . . . . . . . . . . . . . . . . . . . . . . . . . . . . . . . . . . . 15
Specify Display Options . . . . . . . . . . . . . . . . . . . . . . . . . . . . . . . . . . . . . . . . . . . . . . . . . 16
Print a Dashboard or Indicator . . . . . . . . . . . . . . . . . . . . . . . . . . . . . . . . . . . . . . . . . . . . 16
Chapter 5 • Working with Dashboards and Indicators in the Dashboard Viewer . . . . . . . . . . . . 17
Overview . . . . . . . . . . . . . . . . . . . . . . . . . . . . . . . . . . . . . . . . . . . . . . . . . . . . . . . . . . . . . 17
Open a Dashboard or Indicator . . . . . . . . . . . . . . . . . . . . . . . . . . . . . . . . . . . . . . . . . . . . 17
Navigate in the Dashboard Viewer . . . . . . . . . . . . . . . . . . . . . . . . . . . . . . . . . . . . . . . . . 18
Display Options . . . . . . . . . . . . . . . . . . . . . . . . . . . . . . . . . . . . . . . . . . . . . . . . . . . . . . . 18
Print a Dashboard or Indicator . . . . . . . . . . . . . . . . . . . . . . . . . . . . . . . . . . . . . . . . . . . . 19
Create or Edit a Personal Indicator Alert . . . . . . . . . . . . . . . . . . . . . . . . . . . . . . . . . . . . 19
Manage Comments . . . . . . . . . . . . . . . . . . . . . . . . . . . . . . . . . . . . . . . . . . . . . . . . . . . . . 21
Work with Favorites . . . . . . . . . . . . . . . . . . . . . . . . . . . . . . . . . . . . . . . . . . . . . . . . . . . . 23
PART 3 Information for Dashboard Administrators 25
Chapter 6 • The Dashboard Designer Window . . . . . . . . . . . . . . . . . . . . . . . . . . . . . . . . . . . . . . . 27
Overview . . . . . . . . . . . . . . . . . . . . . . . . . . . . . . . . . . . . . . . . . . . . . . . . . . . . . . . . . . . . . 27
The Objects Pane . . . . . . . . . . . . . . . . . . . . . . . . . . . . . . . . . . . . . . . . . . . . . . . . . . . . . . 28
The Workspace . . . . . . . . . . . . . . . . . . . . . . . . . . . . . . . . . . . . . . . . . . . . . . . . . . . . . . . . 32
The Properties Pane . . . . . . . . . . . . . . . . . . . . . . . . . . . . . . . . . . . . . . . . . . . . . . . . . . . . 34
Page 4

iv Contents
Chapter 7 • Indicator Data . . . . . . . . . . . . . . . . . . . . . . . . . . . . . . . . . . . . . . . . . . . . . . . . . . . . . . . . 37
Overview . . . . . . . . . . . . . . . . . . . . . . . . . . . . . . . . . . . . . . . . . . . . . . . . . . . . . . . . . . . . . 37
Indicator Data Rules . . . . . . . . . . . . . . . . . . . . . . . . . . . . . . . . . . . . . . . . . . . . . . . . . . . . 38
Stored Process Indicator Data . . . . . . . . . . . . . . . . . . . . . . . . . . . . . . . . . . . . . . . . . . . . . 39
Defining Indicator Data . . . . . . . . . . . . . . . . . . . . . . . . . . . . . . . . . . . . . . . . . . . . . . . . . 40
Create or Edit Indicator Data . . . . . . . . . . . . . . . . . . . . . . . . . . . . . . . . . . . . . . . . . . . . . 42
Chapter 8 • Ranges . . . . . . . . . . . . . . . . . . . . . . . . . . . . . . . . . . . . . . . . . . . . . . . . . . . . . . . . . . . . . . 49
Create or Edit a Range . . . . . . . . . . . . . . . . . . . . . . . . . . . . . . . . . . . . . . . . . . . . . . . . . . 49
Chapter 9 • Indicators . . . . . . . . . . . . . . . . . . . . . . . . . . . . . . . . . . . . . . . . . . . . . . . . . . . . . . . . . . . 53
Overview . . . . . . . . . . . . . . . . . . . . . . . . . . . . . . . . . . . . . . . . . . . . . . . . . . . . . . . . . . . . . 54
Create or Edit an Indicator . . . . . . . . . . . . . . . . . . . . . . . . . . . . . . . . . . . . . . . . . . . . . . . 54
Indicator Displays . . . . . . . . . . . . . . . . . . . . . . . . . . . . . . . . . . . . . . . . . . . . . . . . . . . . . . 59
Chapter 10 • Dashboards . . . . . . . . . . . . . . . . . . . . . . . . . . . . . . . . . . . . . . . . . . . . . . . . . . . . . . . . 105
Overview . . . . . . . . . . . . . . . . . . . . . . . . . . . . . . . . . . . . . . . . . . . . . . . . . . . . . . . . . . . . 105
Dashboard Layout . . . . . . . . . . . . . . . . . . . . . . . . . . . . . . . . . . . . . . . . . . . . . . . . . . . . . 106
Indicator Interactions . . . . . . . . . . . . . . . . . . . . . . . . . . . . . . . . . . . . . . . . . . . . . . . . . . 106
Zooming . . . . . . . . . . . . . . . . . . . . . . . . . . . . . . . . . . . . . . . . . . . . . . . . . . . . . . . . . . . . 112
Create or Edit a Dashboard . . . . . . . . . . . . . . . . . . . . . . . . . . . . . . . . . . . . . . . . . . . . . . 112
Manage Dashboard Contents . . . . . . . . . . . . . . . . . . . . . . . . . . . . . . . . . . . . . . . . . . . . 114
Set Up Indicator Interactions . . . . . . . . . . . . . . . . . . . . . . . . . . . . . . . . . . . . . . . . . . . . 115
Controlling the Appearance of a Dashboard Using the Flow Containers . . . . . . . . . . 116
PART 4 Appendix 119
Appendix 1 • Indicator Role-Mapping Properties . . . . . . . . . . . . . . . . . . . . . . . . . . . . . . . . . . . . 121
Overview . . . . . . . . . . . . . . . . . . . . . . . . . . . . . . . . . . . . . . . . . . . . . . . . . . . . . . . . . . . . 123
Alphabetic List of Properties . . . . . . . . . . . . . . . . . . . . . . . . . . . . . . . . . . . . . . . . . . . . 123
Index . . . . . . . . . . . . . . . . . . . . . . . . . . . . . . . . . . . . . . . . . . . . . . . . . . . . . . . . 133
Page 5

What's New in the SAS BI Dashboard 4.3
Overview
The SAS BI Dashboard 4.3 has the following enhancements and new features:
• features for dashboard users
• features for dashboard administrators
v
Features for Dashboard Users
• You can run SAS BI Dashboard in a separate window (the dashboard viewer) rather
than in the SAS Information Delivery Portal.
When run in the dashboard viewer, the software offers more functionality than when
displayed in the SAS Information Delivery Portal.
• You can zoom in and view details in a dashboard.
• You can display multiple columns in zoomed-out view.
• You can create comments for a dashboard.
• You can create and manage personal favorites.
• The software offers new display types, such as waterfall chart, vector plot, and spark
lines in tables.
• The software can brush (interactively highlight) data within an indicator. Also,
indicators can interact with each other.
Features for Dashboard Administrators
• You create a dashboard interactively using drag-and-drop to add indicators to a
dashboard.
• The software saves files in a tree folder structure.
• You can search for existing dashboards and objects, and filter a search by a specific
type of object.
• You can more easily customize and size each indicator in a dashboard, as well as the
dashboard itself.
Page 6

vi What's New
• The software offers the ability to set up indicators so that they interact with each other
via events.
• You can open and view multiple dashboards on different tabs.
• You can optimize screen space when building indicators and dashboards.
• As you design a dashboard, you can preview different indicator display types to easily
decide which display is most appropriate for the data to be displayed.
• You can customize fonts, font colors, and font sizes in a dashboard.
Page 7

Part 1
1
Information for All Users
Chapter 1
Introduction . . . . . . . . . . . . . . . . . . . . . . . . . . . . . . . . . . . . . . . . . . . . . . . . . . . . . . 3
Chapter 2
General Information . . . . . . . . . . . . . . . . . . . . . . . . . . . . . . . . . . . . . . . . . . . . . . 5
Chapter 3
Getting Started: The SAS Information Delivery Portal . . . . . . . . . . . . . . 9
Page 8

2
Page 9
Chapter 1
Introduction
Overview . . . . . . . . . . . . . . . . . . . . . . . . . . . . . . . . . . . . . . . . . . . . . . . . . . . . . . . . . . . . . 3
Audience . . . . . . . . . . . . . . . . . . . . . . . . . . . . . . . . . . . . . . . . . . . . . . . . . . . . . . . . . . . . . 3
Overview
3
Audience
The SAS BI Dashboard enables users to use dashboards to monitor key performance
indicators that convey how well an organization is performing. Dashboards include
graphics, text, colors, and hyperlinks. Dashboards are created, maintained, and viewed
through an easy-to-use Web-based interface. All content is displayed in a role-based,
secure, customizable, and extensible environment. End users can customize how
information appears on their personal dashboards.
As is true for many SAS®9 applications, the users of the SAS BI Dashboard can be grouped
based on their skills and on whether they play a role in defining and managing the system.
The following table shows the three types of users of the SAS BI Dashboard:
User Description Example
Dashboard user The ultimate audience of
dashboards. This role views
dashboards and uses them as a
launching point for further
exploration and action.
Executives and employees
presented with dashboards as
part of their intranet home
page.
Page 10
4 Chapter 1 • Introduction
User Description Example
Dashboard administrator This role defines indicators
and dashboards. This role is
responsible for setting user
access to various dashboards
and for controlling the extent
to which dashboard users can
personalize the dashboards.
This role might also be
responsible for extending the
functionality of the SAS BI
Dashboard by creating custom
code.
IT support personnel This role installs the SAS BI
Dashboard and maintains its
setup, configuration, and
administration.
A business manager with some
SAS technical knowledge, or a
SAS consultant involved in the
initial implementation or
major overhauls of the SAS BI
Dashboard who works with
outside consultants and
corporate developers.
An IT person who is
responsible for supporting
application deployment and
maintenance on an
organization’s computer
network.
This guide is intended for dashboard users and dashboard administrators.
Page 11

Chapter 2
General Information
The Workflow . . . . . . . . . . . . . . . . . . . . . . . . . . . . . . . . . . . . . . . . . . . . . . . . . . . . . . . . . 5
Overview . . . . . . . . . . . . . . . . . . . . . . . . . . . . . . . . . . . . . . . . . . . . . . . . . . . . . . . . . . . 5
Dashboard Users . . . . . . . . . . . . . . . . . . . . . . . . . . . . . . . . . . . . . . . . . . . . . . . . . . . . . 5
Dashboard Administrators . . . . . . . . . . . . . . . . . . . . . . . . . . . . . . . . . . . . . . . . . . . . . 7
5
The Workflow
Overview
Dashboard Users
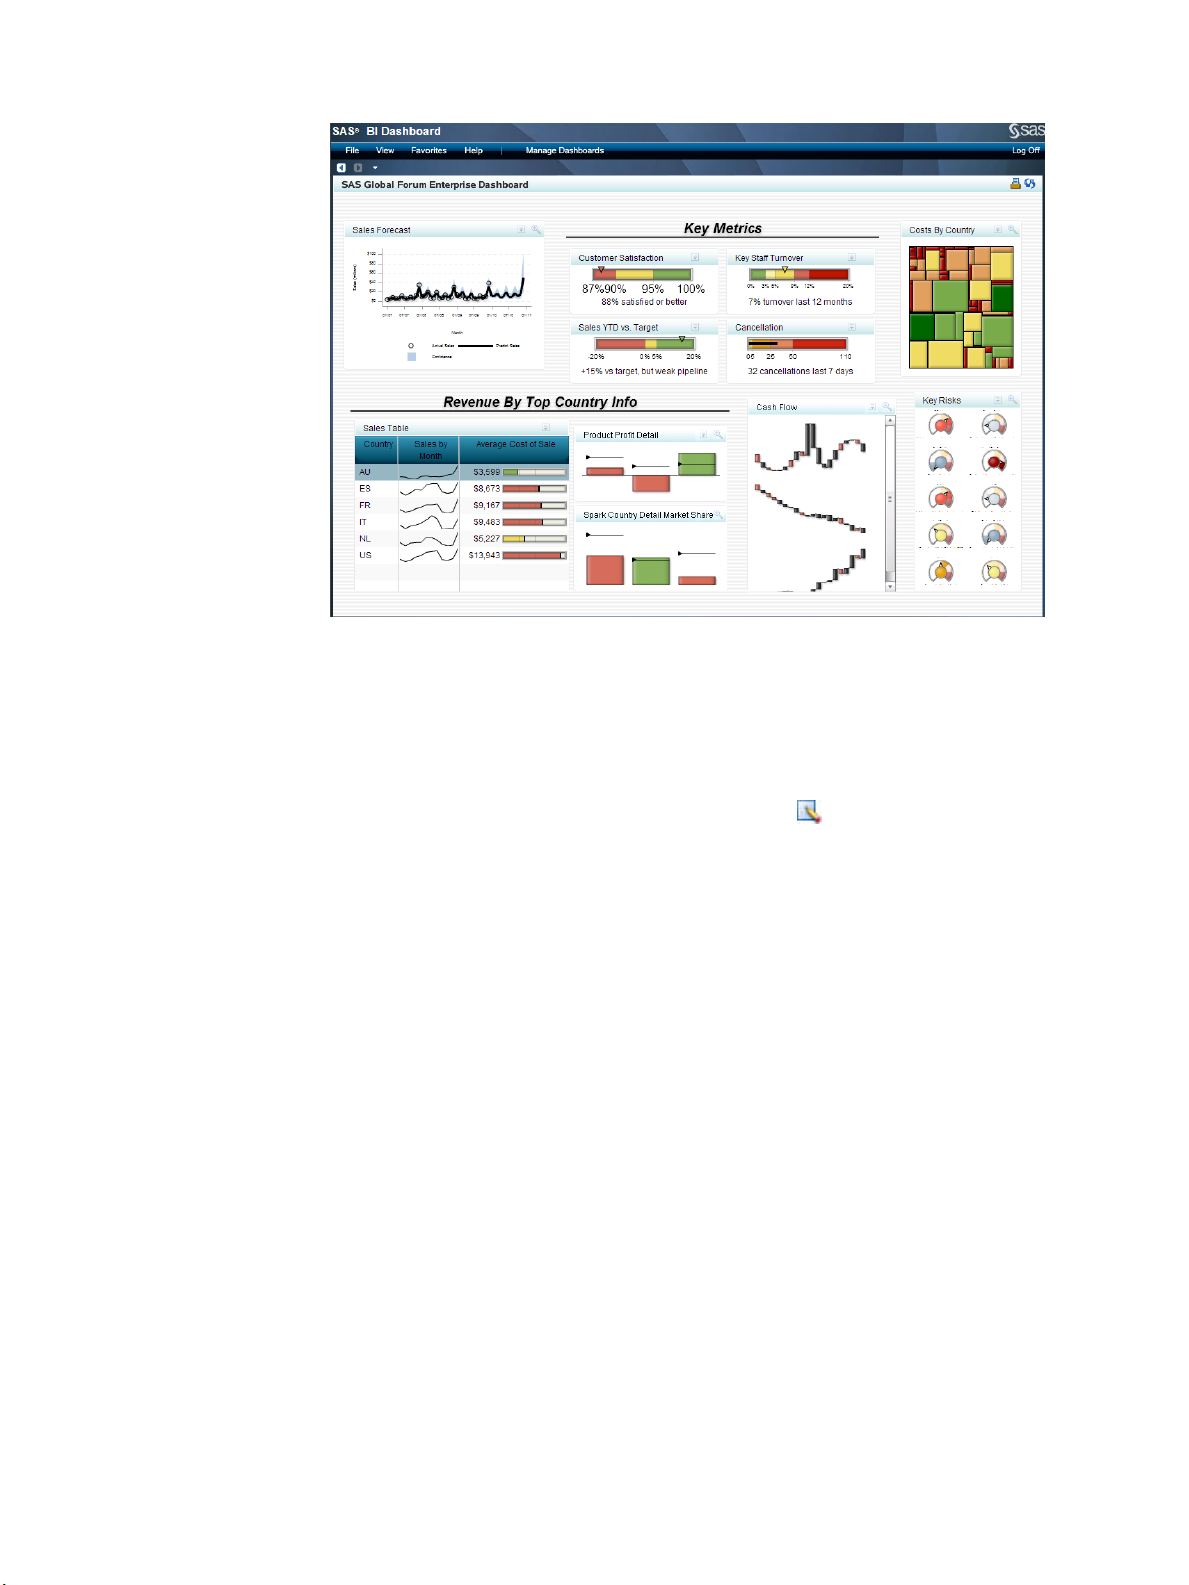
SAS BI Dashboard has two aspects: the dashboard viewer (used by dashboard users) and
the dashboard designer (used by dashboard administrators).
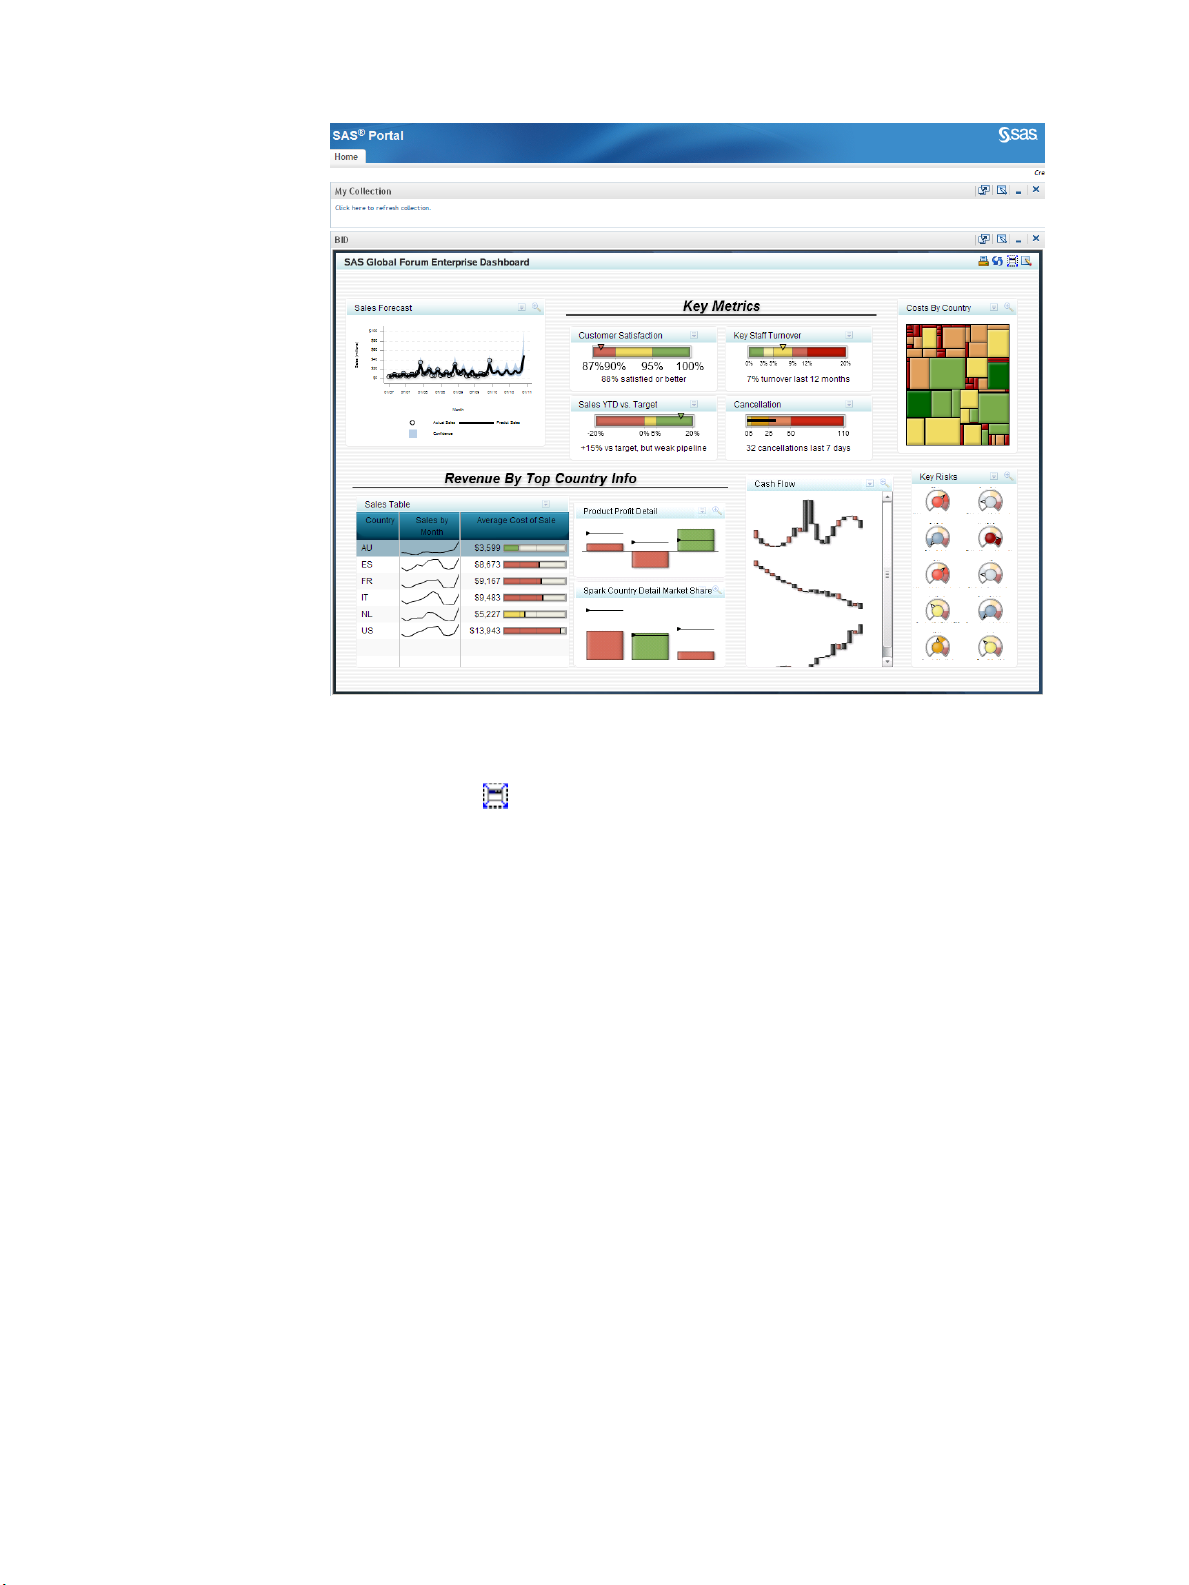
Generally, you access dashboards and SAS BI Dashboard from a SAS BI Dashboard portlet
within the SAS Information Delivery Portal. (For more information, see Chapter 3,
“Getting Started: The SAS Information Delivery Portal,” on page 9.)
Your role (dashboard user or dashboard administrator) determines the functions that are
available to you.
You can also start the dashboard viewer directly by using this URL within your browser:
http://<server>:<port>/SASBIDashboard.
As a dashboard user, you work with dashboards in the SAS BI Dashboard portlet.
Page 12
6 Chapter 2 • General Information
For more information about the SAS BI Dashboard portlet and selecting a dashboard, see
Chapter 4, “Working with the SAS BI Dashboard Portlet,” on page 15.
You can also click (in the upper right corner of a dashboard) to work with dashboards
in the dashboard viewer, which opens in a separate window.
Note: You might need to horizontally scroll within the SAS BI Dashboard portlet to see
the icon.
The dashboard viewer opens and displays the dashboard that was displayed in the SAS BI
Dashboard portlet.
Page 13
The Workflow 7
The dashboard viewer enables enhanced functionality. For more information, see Chapter
5, “Working with Dashboards and Indicators in the Dashboard Viewer,” on page 17.
Dashboard Administrators
As a dashboard administrator, you manage dashboards in the dashboard designer of the
SAS BI Dashboard. To start the dashboard designer, click in a dashboard in a SAS BI
Dashboard portlet, or click Manage Dashboards when displaying dashboards in the
dashboard viewer.
When you start the dashboard designer using either of the previous methods while viewing
a dashboard, the same dashboard is displayed in the dashboard designer so that you can
quickly modify it.
Page 14
8 Chapter 2 • General Information
When you start the dashboard designer using either of the previous methods while not
viewing a dashboard, a default page is displayed in the dashboard designer.
For more information, see Chapter 6, “The Dashboard Designer Window,” on page 27.
Page 15

Chapter 3
Getting Started: The SAS Information Delivery Portal
Overview . . . . . . . . . . . . . . . . . . . . . . . . . . . . . . . . . . . . . . . . . . . . . . . . . . . . . . . . . . . . . 9
Open the Portal and Log On . . . . . . . . . . . . . . . . . . . . . . . . . . . . . . . . . . . . . . . . . . . . . 9
Create a Page and Add It to Your Navigation Bar . . . . . . . . . . . . . . . . . . . . . . . . . . 10
Add a SAS BI Dashboard Portlet to a Page . . . . . . . . . . . . . . . . . . . . . . . . . . . . . . . . 11
9
Overview
The SAS BI Dashboard can be accessed from within the SAS Information Delivery Portal.
This guide assumes that you are familiar with the SAS Information Delivery Portal. If you
are not, see the online Help.
Open the Portal and Log On
To open the SAS Information Delivery Portal:
1.
Open your Web browser and point it to the portal's URL address.
To obtain the URL, contact your portal administrator.
2.
To identify yourself to the portal, log on with your user name and password.
If you do not have a user name and password, contact your system administrator to
obtain them.
The logon procedure varies depending on how your organization has installed the
portal. Use either the portal logon procedure or the Web server logon procedure, as
appropriate.
3.
If your organization uses the portal's logon feature, do the following:
a. Open your browser and point to the portal's URL.
Either a public page or the portal's logon page appears.
b. If a public page appears, click Log On in the banner.
c. On the logon page, enter your user name and password.
d. Click Log On.
Page 16
10 Chapter 3 • Getting Started: The SAS Information Delivery Portal
Your personal portal opens.
4.
If your organization uses a Web server to identify each user, do the following:
a. Use the Web server logon procedure specified for your organization.
The Web server logon procedure is different in each organization.
b. After you have logged on to the Web server, point your browser to the portal's URL.
Your personal portal opens.
Create a Page and Add It to Your Navigation Bar
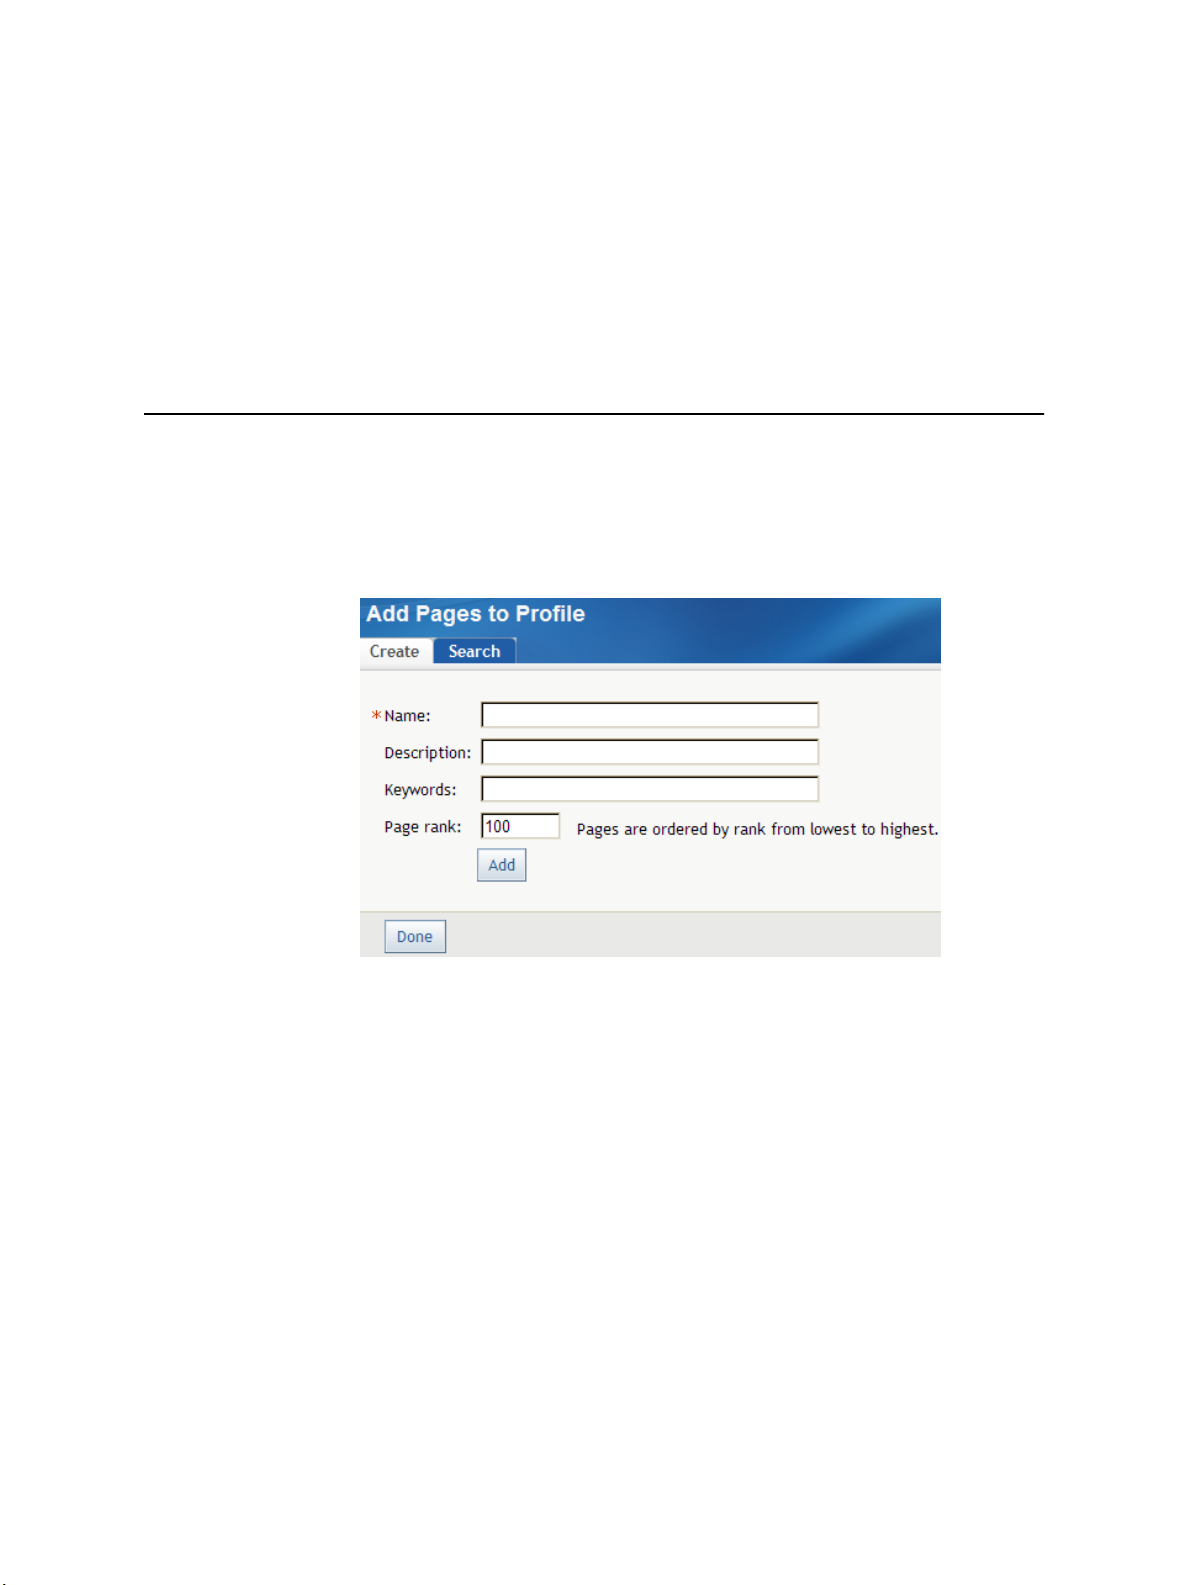
To create a new page and add it to your navigation bar:
1.
Click Customize ð Add Page.
The Add Pages to Profile page appears.
2.
On the Create tab, enter descriptive information about the page:
Name
is a short name that appears in the page's tab in the navigation bar.
Description
is a short description that appears with the page title in search results.
Keywords
are single words that you or other users can use to search for this page. Use spaces
to separate keywords from one another.
Note: To ensure efficient searching, develop a standard list of keywords and use
these keywords consistently.
Page rank
is a number that indicates the importance of this page as compared to other pages.
The default value is 100.
This number determines the order in which pages are listed in the navigation bar.
The pages are ordered by rank from lowest to highest. Pages with equal rank are
listed in the order in which they were created.
Page 17
Add a SAS BI Dashboard Portlet to a Page 11
Note: You can choose to override page ranks by explicitly defining the order of
pages.
Location (group) and Share type
are fields that appear only if you are a group content administrator. In these fields,
you can specify a group with which the page is to be shared and specify the share
type.
3.
Click Add.
A message appears, indicating that a new page was added.
4.
Click Done.
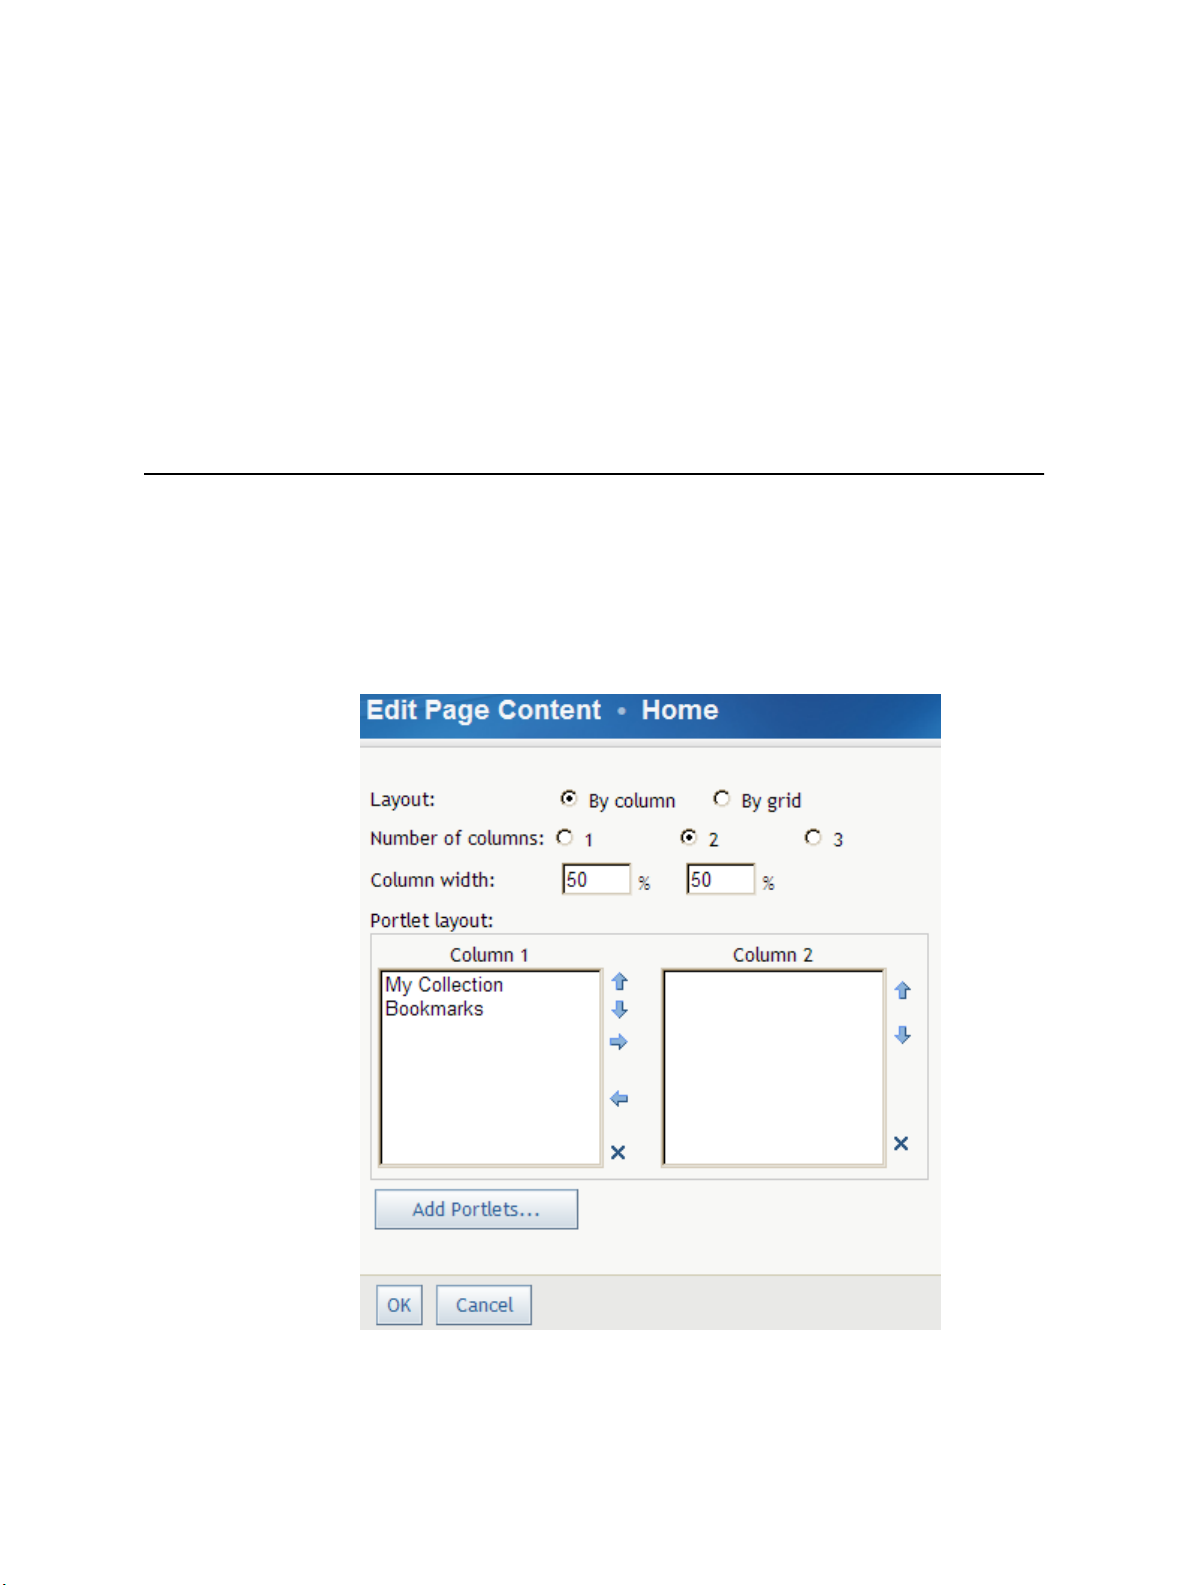
Add a SAS BI Dashboard Portlet to a Page
To add a SAS BI Dashboard portlet to a page:
1.
Navigate to the page that you want to add the portlet to.
2.
Click Customize ð Edit Page ð Edit Page Content.
The Edit Page Content page appears.
3.
Click Add Portlets.
The Add Portlets to Page page appears.
Page 18
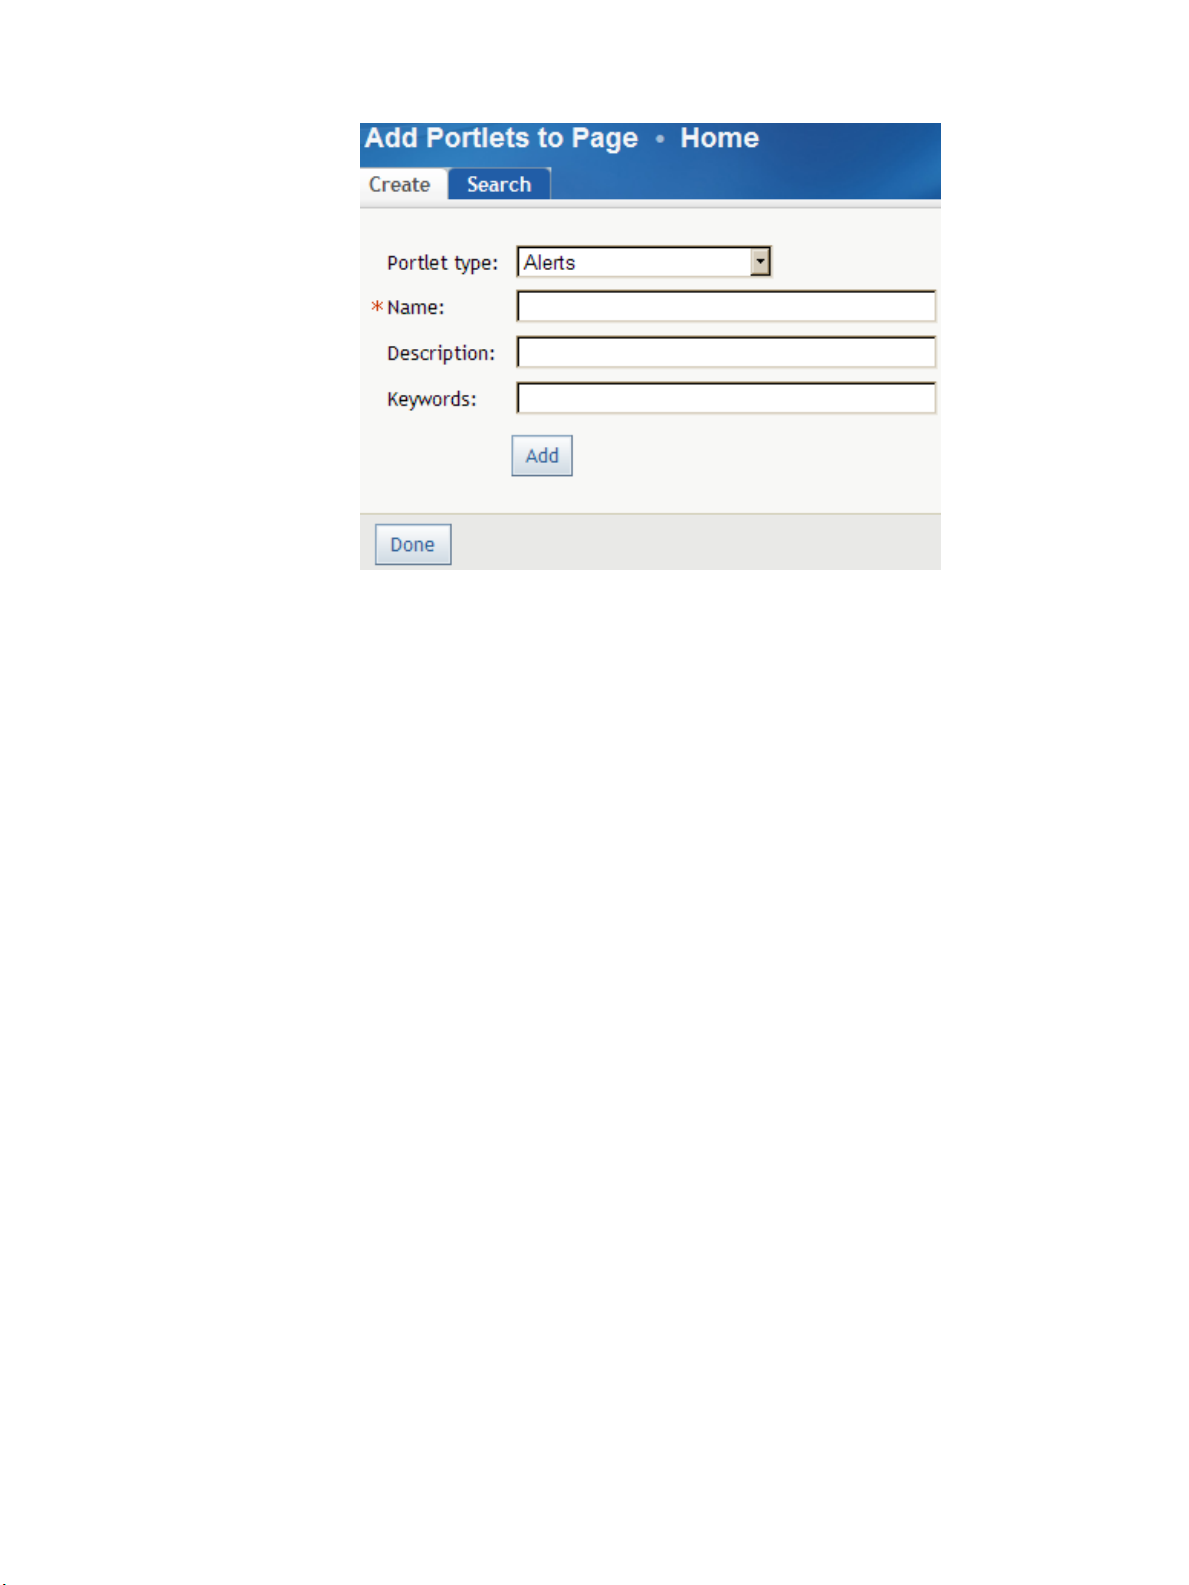
12 Chapter 3 • Getting Started: The SAS Information Delivery Portal
4.
From the Portlet type drop-down list, select SAS BI Dashboard Portlet.
5.
Type the name for the portlet and, if desired, the description and keywords.
6.
If you are a group content administrator, select a group with which the portlet is to be
shared from the Location (group) drop-down list.
7.
Click Add, and then Done.
8.
On the Edit Page Content page, click OK.
The original page is displayed, with the new portlet added.
9.
Select a dashboard or indicator.
For more information, see “Select a Dashboard” on page 15.
Page 19

Part 2
13
Information for Dashboard Users
Chapter 4
Working with the SAS BI Dashboard Portlet . . . . . . . . . . . . . . . . . . . . . . 15
Chapter 5
Working with Dashboards and Indicators in the Dashboard Viewer 17
Page 20

14
Page 21
Chapter 4
Working with the SAS BI Dashboard Portlet
Select a Dashboard . . . . . . . . . . . . . . . . . . . . . . . . . . . . . . . . . . . . . . . . . . . . . . . . . . . . 15
Specify Display Options . . . . . . . . . . . . . . . . . . . . . . . . . . . . . . . . . . . . . . . . . . . . . . . . 16
Specify the Dashboard Dimensions . . . . . . . . . . . . . . . . . . . . . . . . . . . . . . . . . . . . . 16
Refresh the Contents . . . . . . . . . . . . . . . . . . . . . . . . . . . . . . . . . . . . . . . . . . . . . . . . . 16
Print a Dashboard or Indicator . . . . . . . . . . . . . . . . . . . . . . . . . . . . . . . . . . . . . . . . . . 16
15
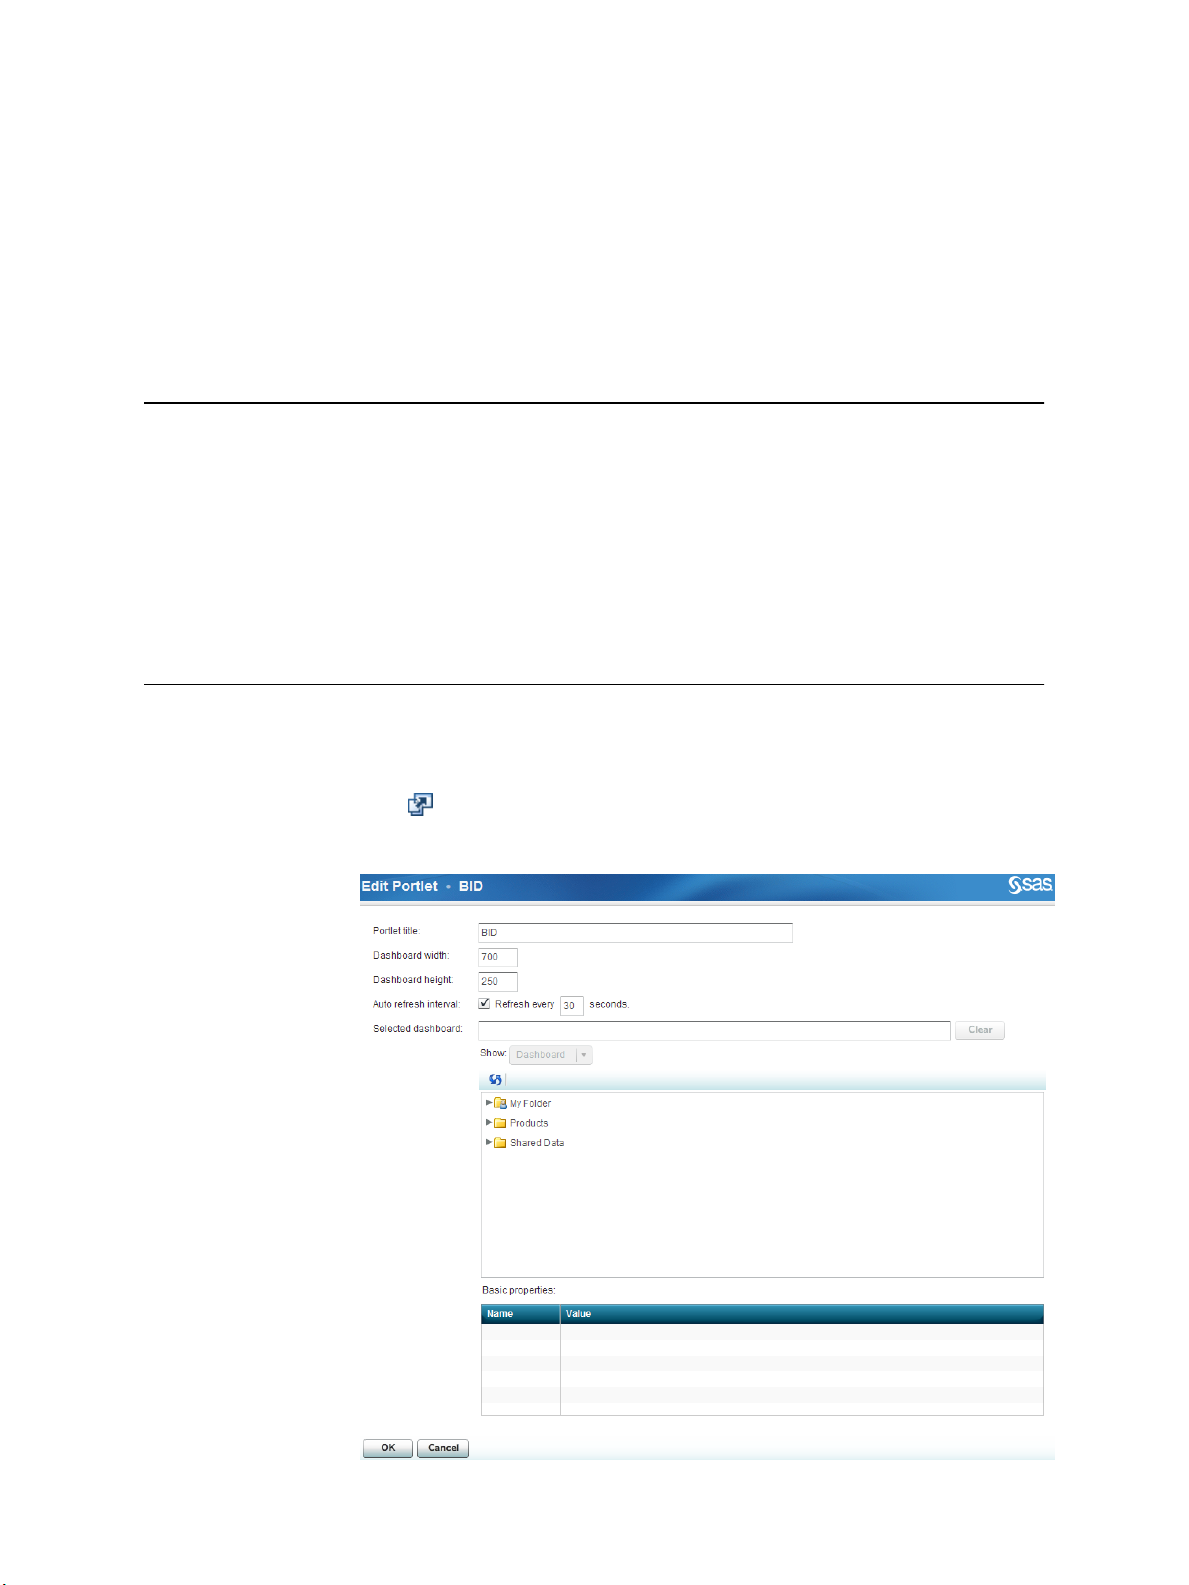
Select a Dashboard
To select a dashboard:
1.
Click .
The Edit Portlet page appears.
Page 22
16 Chapter 4 • Working with the SAS BI Dashboard Portlet
2.
From the tree, select a dashboard.
This list includes dashboards created by your organization.
Specify Display Options
Specify the Dashboard Dimensions
To specify the dashboard dimensions:
1.
Click .
The Edit Portlet page appears.
2.
Type values for the width and height.
Refresh the Contents
To manually refresh the contents of a SAS BI Dashboard portlet, click
To automatically refresh the contents:
1.
Click .
The Edit Portlet page appears.
2.
Next to Auto refresh interval, select the Refresh every check box, and then type a
value in the box.
Print a Dashboard or Indicator
To print a dashboard, click in the upper right corner of the dashboard.
To print an indicator, select Print Indicator from the indicator's Options menu.
.
Page 23

Chapter 5
Working with Dashboards and Indicators in the Dashboard Viewer
Overview . . . . . . . . . . . . . . . . . . . . . . . . . . . . . . . . . . . . . . . . . . . . . . . . . . . . . . . . . . . . 17
Open a Dashboard or Indicator . . . . . . . . . . . . . . . . . . . . . . . . . . . . . . . . . . . . . . . . . 17
Navigate in the Dashboard Viewer . . . . . . . . . . . . . . . . . . . . . . . . . . . . . . . . . . . . . . . 18
Display Options . . . . . . . . . . . . . . . . . . . . . . . . . . . . . . . . . . . . . . . . . . . . . . . . . . . . . . . 18
The Default View . . . . . . . . . . . . . . . . . . . . . . . . . . . . . . . . . . . . . . . . . . . . . . . . . . . 18
Refresh the Contents . . . . . . . . . . . . . . . . . . . . . . . . . . . . . . . . . . . . . . . . . . . . . . . . . 18
17
Overview
Print a Dashboard or Indicator . . . . . . . . . . . . . . . . . . . . . . . . . . . . . . . . . . . . . . . . . . 19
Create or Edit a Personal Indicator Alert . . . . . . . . . . . . . . . . . . . . . . . . . . . . . . . . . 19
Manage Comments . . . . . . . . . . . . . . . . . . . . . . . . . . . . . . . . . . . . . . . . . . . . . . . . . . . . 21
Work with Favorites . . . . . . . . . . . . . . . . . . . . . . . . . . . . . . . . . . . . . . . . . . . . . . . . . . . 23
You can display a dashboard or indicator in the dashboard viewer rather than in the SAS
Information Delivery Portal. Displaying a dashboard this way enables you to do the
following:
• create a larger dashboard with numerous interactive indicators
• personalize alerts
• add comments to an indicator
• create favorites
For more information, see “The Workflow” on page 5.
Open a Dashboard or Indicator
To open a dashboard or indicator, select File ð Open, and then navigate to the dashboard
or indicator.
In addition to indicators, this list includes dashboards created by your organization.
Page 24
18 Chapter 5 • Working with Dashboards and Indicators in the Dashboard Viewer
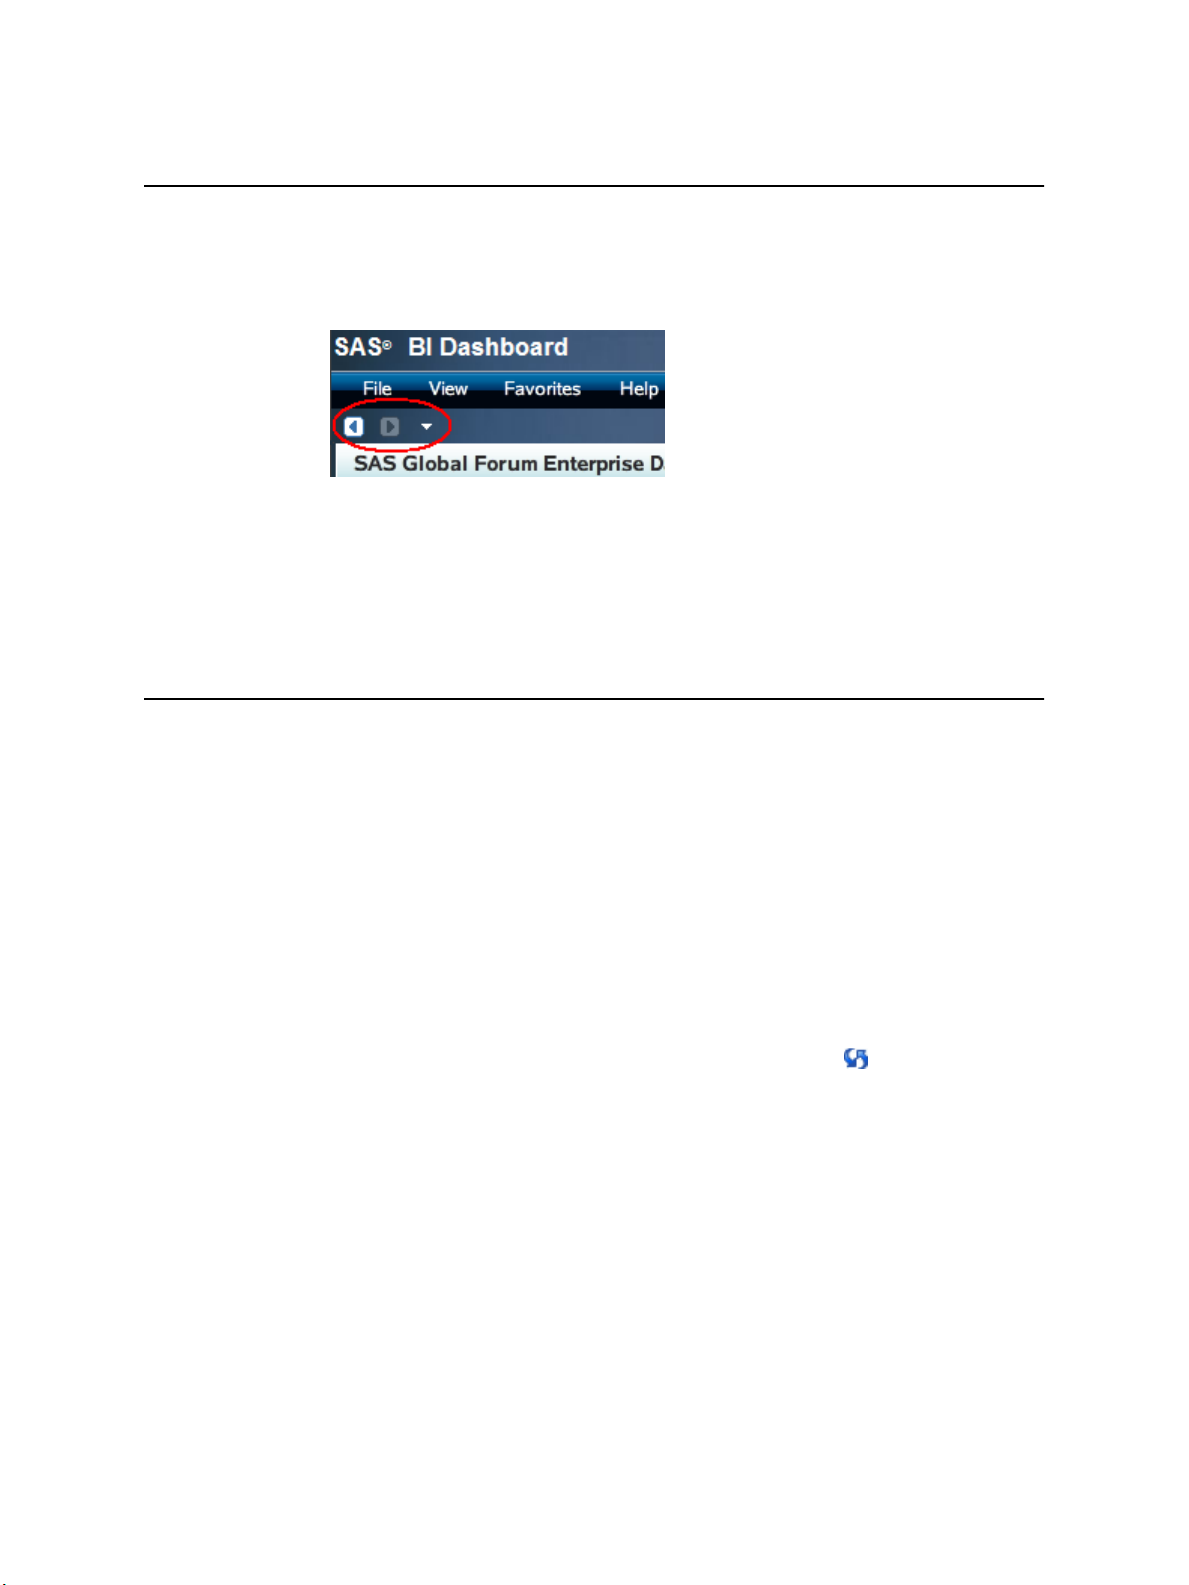
Navigate in the Dashboard Viewer
After you open a second dashboard or indicator, the navigation controls appear below the
menu bar.
These controls are also available when you select View ð Go To.
The navigation controls enable you to move backward and forward through the dashboards
and indicators that you have opened. The down arrow (history list) enables you to select
any opened dashboard or indicator, instead of moving through the opened items one at a
time.
Display Options
The Default View
By default, the dashboard viewer displays the last dashboard or indicator that was displayed
when the dashboard was closed. However, there might be times when you do not want to
display this dashboard or indicator.
To display no dashboard or indicator when the SAS BI Dashboard is first started, clear the
check box View ð Open the previously viewed dashboard by default.
Refresh the Contents
To manually refresh the contents of the dashboard viewer, click .
To automatically refresh the contents:
1.
Select View ð Set the automatic refresh interval.
The Refresh Interval dialog box appears.
Page 25
2.
Select the Automatic refresh check box, and then specify the time interval.
Print a Dashboard or Indicator
Create or Edit a Personal Indicator Alert 19
To print a dashboard, click in the upper right corner of the dashboard.
To print an indicator, select Print Indicator from the Options menu.
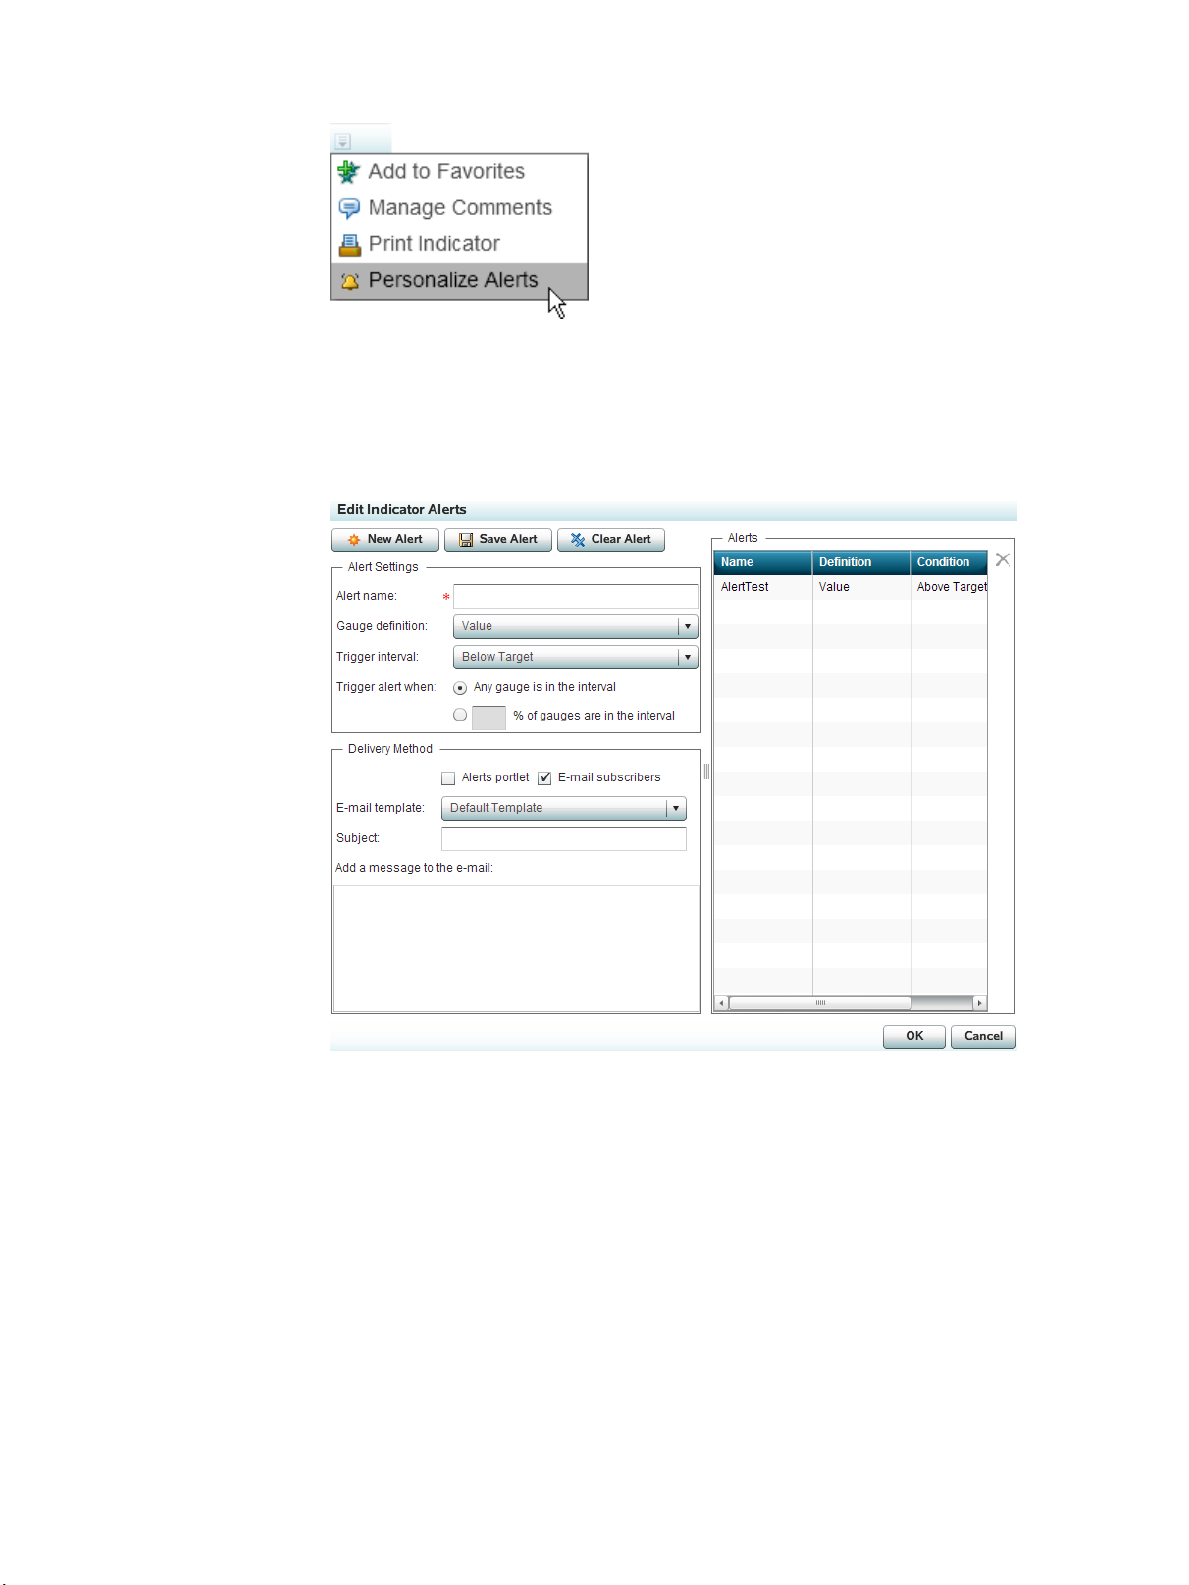
Create or Edit a Personal Indicator Alert
If a dashboard administrator has enabled personal alerts for an indicator, you can define a
personal indicator alert on the indicator. A personal indicator alert is sent only to you. This
is different from an indicator alert, which is sent to a list of one or more alert subscribers.
A personal alert is in addition to any alerts attached to an indicator that was created by a
dashboard administrator.
Note: The alerts shown on this page are only your personal indicator alerts. Indicator alerts
created by dashboard administrators are not shown.
To create or edit a personal indicator alert, from an indicator's Options menu, select
Personalize Alerts.
Page 26
20 Chapter 5 • Working with Dashboards and Indicators in the Dashboard Viewer
Note: If Personalize Alerts is not available, then the dashboard administrator has not
enabled personalization. If the Options menu is not available, the indicator is not being
displayed in a tile. Contact the dashboard administrator. For information about tiles,
see “Tiles” on page 33.
The Edit Indicator Alerts dialog box appears in a new window.
To create a personal indicator alert:
1.
Click New Alert.
2.
Type the name of the alert.
3.
From the Gauge definition and Trigger interval drop-down lists, select the gauge
definition and the interval to trigger the alert.
4.
Choose when to trigger the alert: Any gauge is in the interval or % of gauges are in
the interval.
5.
If you chose % of gauges are in the interval, type a percentage in the field next to the
check box.
6.
Select the delivery method for the alert: Alerts portlet or E-mail subscribers.
Note: You can select both.
Page 27
7.
(Optional) If you selected E-mail subscribers:
a. From the E-mail template drop-down list, select the e-mail template to use to
format the e-mail.
The items included in the list are controlled by the dashboard administrator.
b. Type the subject line and additional message to include in the e-mail.
To edit an indicator alert:
1.
From the Alerts table, select an alert.
The properties of the alert appear on the left side of the dialog box.
2.
Edit the properties.
To delete an alert, select one from the Alerts table, and then click .
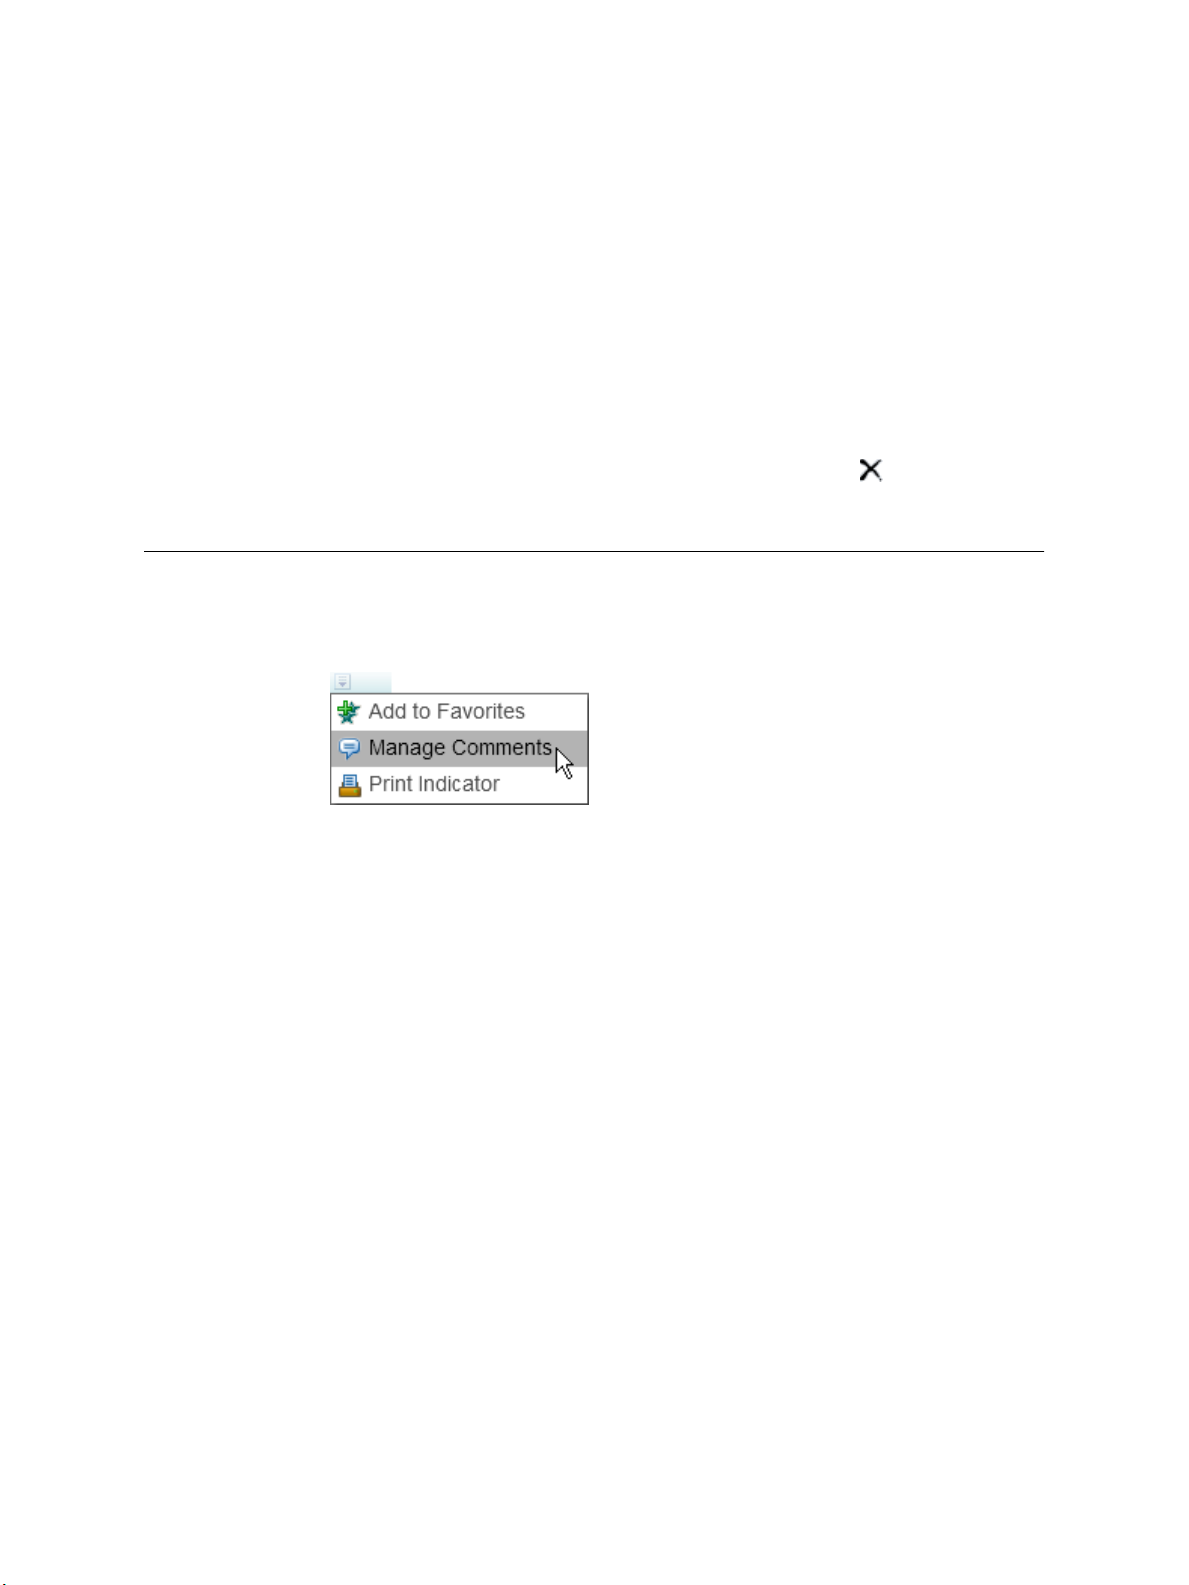
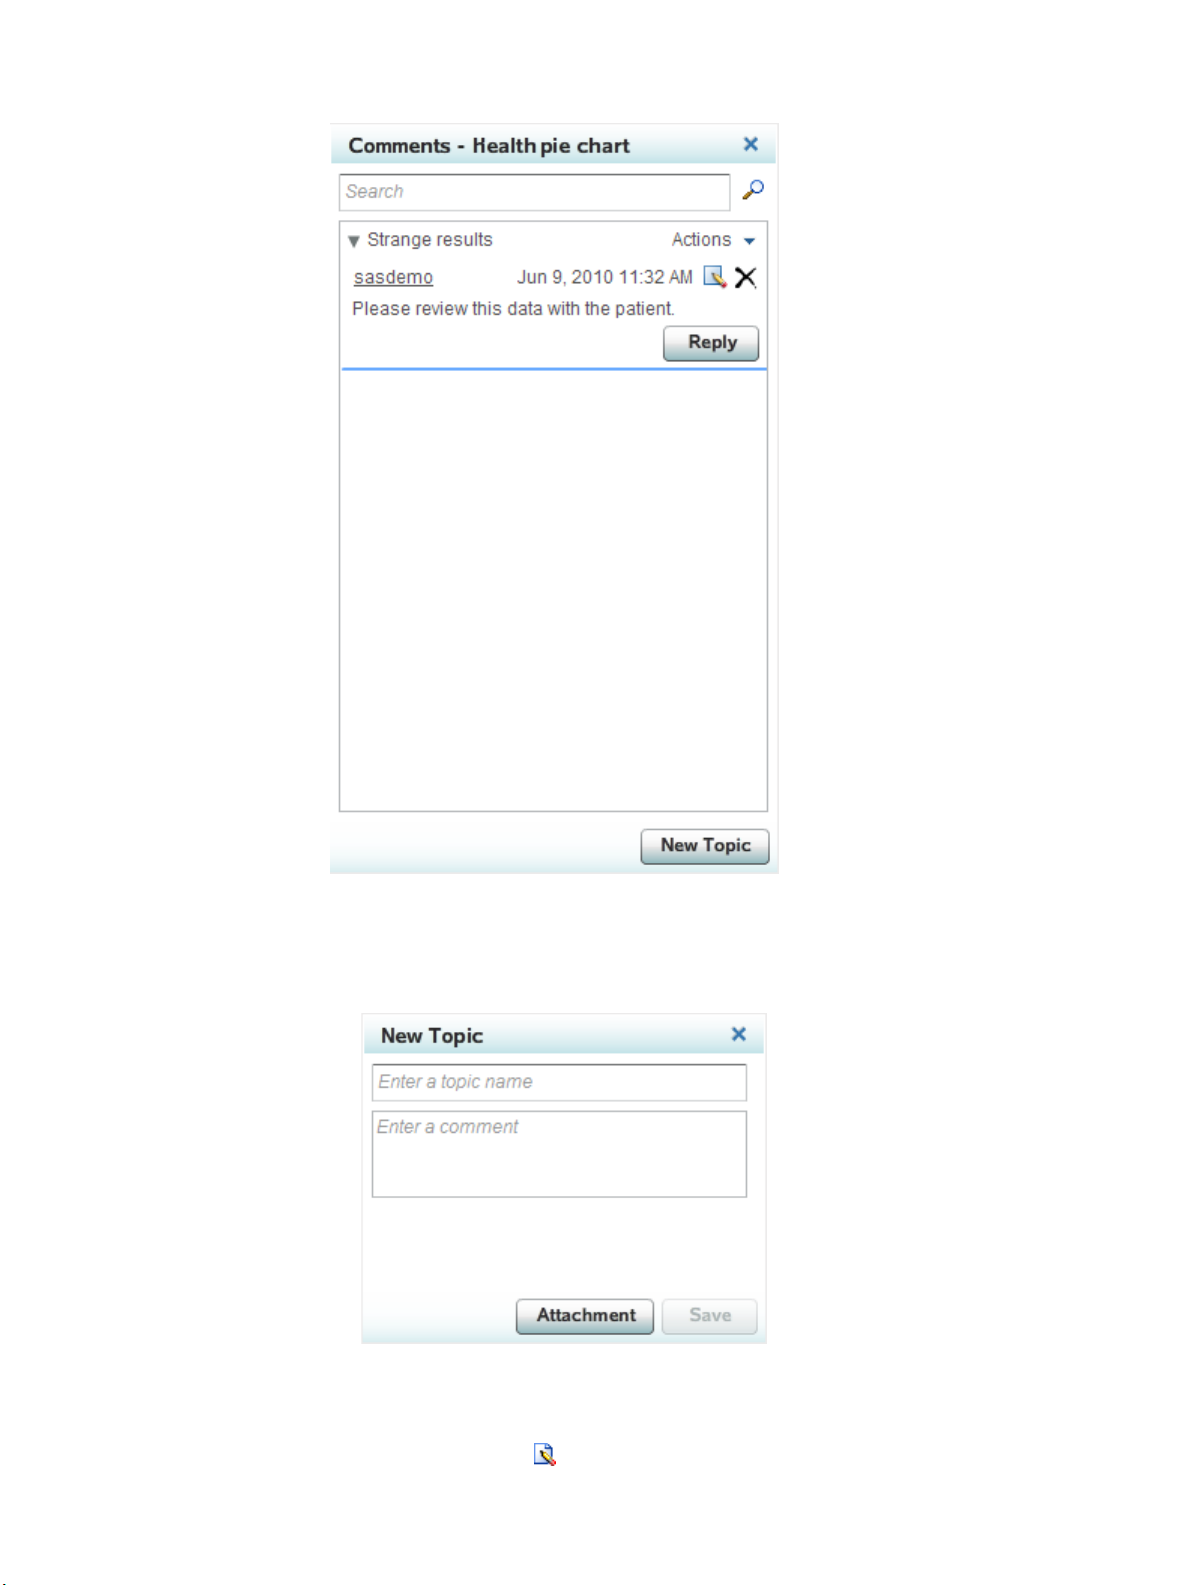
Manage Comments
To manage comments, select Manage Comments from an indicator's Options menu.
Manage Comments 21
The Comments dialog box appears.
Page 28
22 Chapter 5 • Working with Dashboards and Indicators in the Dashboard Viewer
To start a new topic:
1.
Click New Topic.
The New Topic dialog box appears.
2.
Type the topic name and comment.
3.
To attach a file, click Attachment, and navigate to the file.
To edit a comment, click , and then make changes to the comment.
Page 29
To delete a comment, click .
Note: Only users in the Comment Administrator role can edit and delete comments.
To reply to a comment, click Reply, and then type a comment.
To sort and filter the comments, select an option from the Actions menu.
Work with Favorites
To easily return to a dashboard or an indicator, you can add it to your favorites.
To add a dashboard to your favorites, select Favorites ð Add Dashboard to Favorites.
To add an indicator to your favorites, select Favorites ð Add Indicator to Favorites ð
<Name of indicator>.
To select a favorite, select one from the bottom area of the Favorites menu.
To manage your favorites:
1.
Select Favorites ð Manage Favorites.
The Manage Favorites dialog box appears.
Work with Favorites 23
2.
To create a folder in your favorites, click , and then name the folder.
3.
To rename a favorite or folder, click the item's name, and then type the name.
4.
To move a favorite or folder, drag the item.
Note: To drag an item into a folder, first expand the folder, and then drag the item into
the folder.
5.
To delete a favorite or folder, click the item's name, and then click .
Page 30

24 Chapter 5 • Working with Dashboards and Indicators in the Dashboard Viewer
Page 31

Part 3
25
Information for Dashboard Administrators
Chapter 6
The Dashboard Designer Window . . . . . . . . . . . . . . . . . . . . . . . . . . . . . . . . 27
Chapter 7
Indicator Data . . . . . . . . . . . . . . . . . . . . . . . . . . . . . . . . . . . . . . . . . . . . . . . . . . . 37
Chapter 8
Ranges . . . . . . . . . . . . . . . . . . . . . . . . . . . . . . . . . . . . . . . . . . . . . . . . . . . . . . . . . . 49
Chapter 9
Indicators . . . . . . . . . . . . . . . . . . . . . . . . . . . . . . . . . . . . . . . . . . . . . . . . . . . . . . . 53
Chapter 10
Dashboards . . . . . . . . . . . . . . . . . . . . . . . . . . . . . . . . . . . . . . . . . . . . . . . . . . . . 105
Page 32

26
Page 33

Chapter 6
The Dashboard Designer Window
Overview . . . . . . . . . . . . . . . . . . . . . . . . . . . . . . . . . . . . . . . . . . . . . . . . . . . . . . . . . . . . 27
The Objects Pane . . . . . . . . . . . . . . . . . . . . . . . . . . . . . . . . . . . . . . . . . . . . . . . . . . . . . 28
The Library View . . . . . . . . . . . . . . . . . . . . . . . . . . . . . . . . . . . . . . . . . . . . . . . . . . . 28
The Layout Templates View . . . . . . . . . . . . . . . . . . . . . . . . . . . . . . . . . . . . . . . . . . 32
The Static Content View . . . . . . . . . . . . . . . . . . . . . . . . . . . . . . . . . . . . . . . . . . . . . . 32
The Workspace . . . . . . . . . . . . . . . . . . . . . . . . . . . . . . . . . . . . . . . . . . . . . . . . . . . . . . . 32
Overview . . . . . . . . . . . . . . . . . . . . . . . . . . . . . . . . . . . . . . . . . . . . . . . . . . . . . . . . . . 32
Tiles . . . . . . . . . . . . . . . . . . . . . . . . . . . . . . . . . . . . . . . . . . . . . . . . . . . . . . . . . . . . . 33
Editing an Object . . . . . . . . . . . . . . . . . . . . . . . . . . . . . . . . . . . . . . . . . . . . . . . . . . . 33
Manipulating Objects . . . . . . . . . . . . . . . . . . . . . . . . . . . . . . . . . . . . . . . . . . . . . . . . 34
27
Overview
The Properties Pane . . . . . . . . . . . . . . . . . . . . . . . . . . . . . . . . . . . . . . . . . . . . . . . . . . . 34
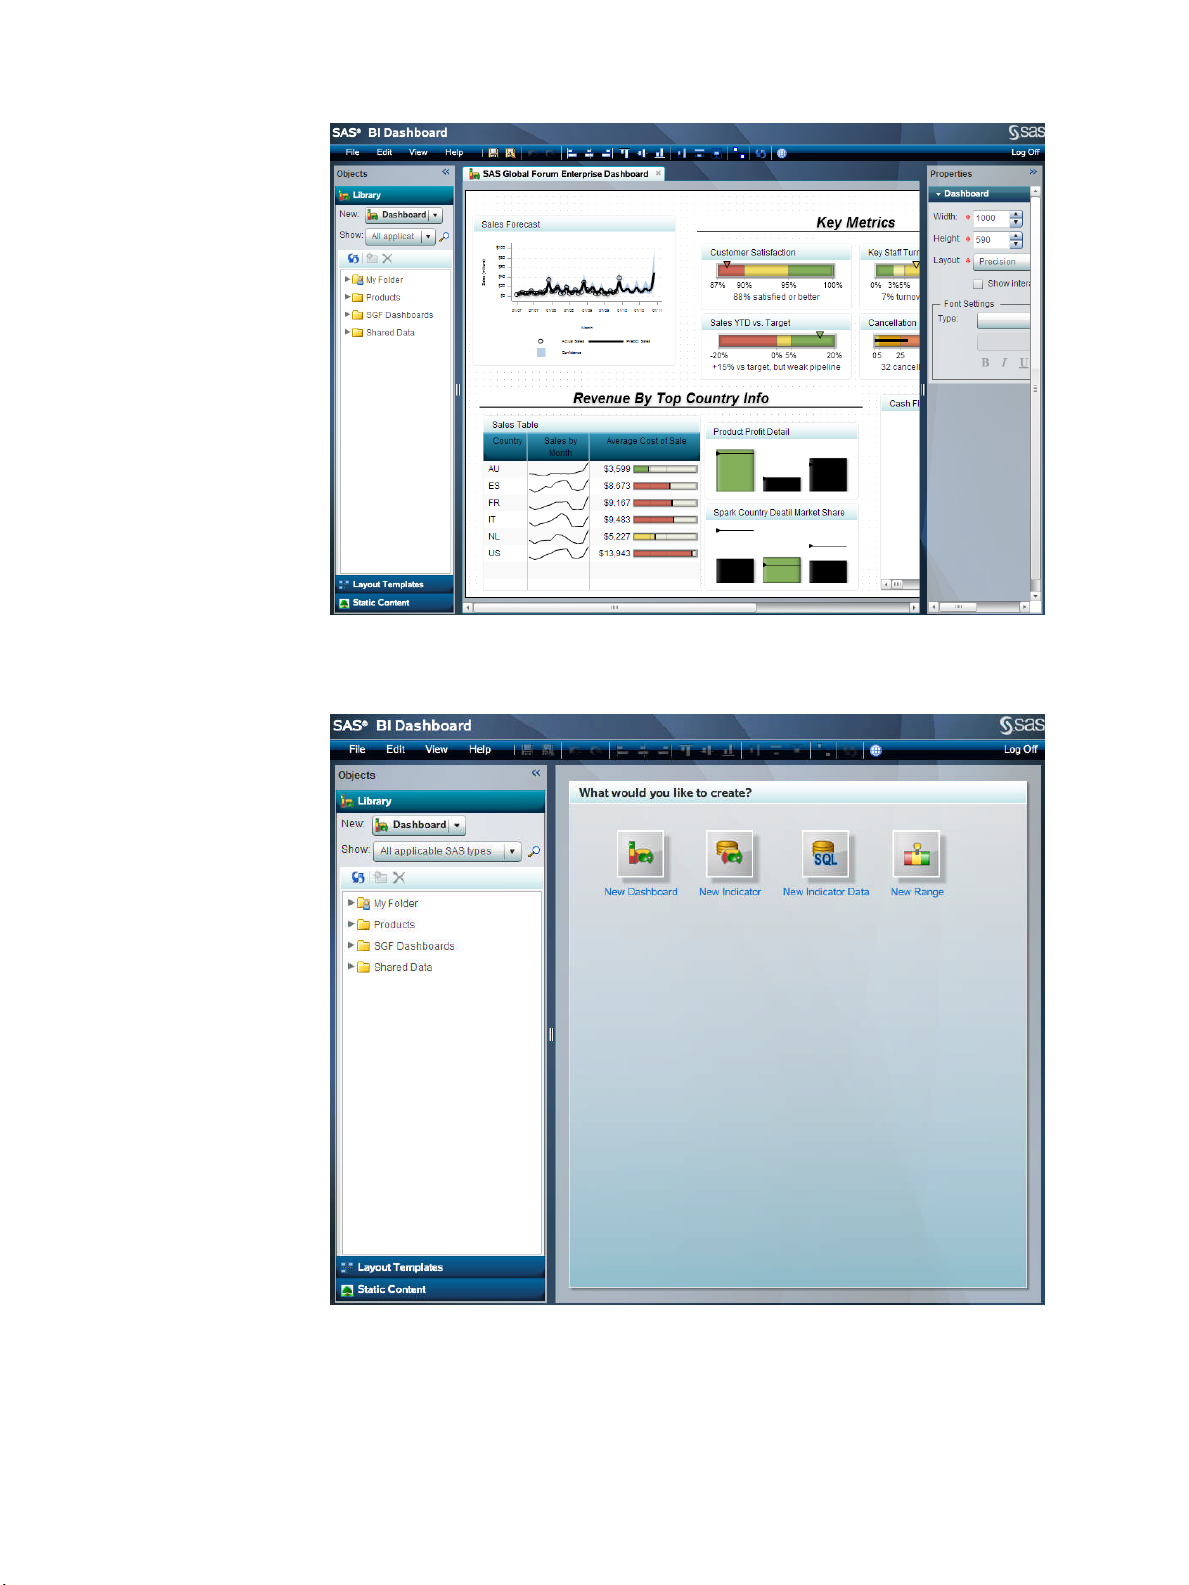
The dashboard designer window contains three areas (from left to right):
• the Objects pane (see “The Objects Pane” on page 28)
• the workspace (see “The Workspace” on page 32)
• the Properties pane (see “The Properties Pane” on page 34)
Page 34

28 Chapter 6 • The Dashboard Designer Window
CAUTION:
Do not refresh the browser window. If you refresh the browser window, any unsaved
dashboard content is lost.
The Objects Pane
The Library View
Overview
In addition to listing the dashboards, the Library view contains the objects that you
combine to create a dashboard:
• indicator data (see Chapter 7, “Indicator Data,” on page 37)
• ranges (see Chapter 8, “Ranges,” on page 49)
• indicators (see Chapter 9, “Indicators,” on page 53)
It also contains additional objects to control the display of information within a dashboard
and dashboards. For more information, see “The Layout Templates View” on page 32,
“The Static Content View” on page 32, and Chapter 10, “Dashboards,” on page 105.
You create a new object by selecting the type of object from the New drop-down list.
Page 35

The Objects Pane 29
The Library view contains a library tree in which you store the objects. To refresh the list,
click . To limit the library tree to display only a certain type of object, select the type of
object from the Show drop-down list.
To search for a saved object:
1.
Click .
The Search dialog box appears.
Page 36

30 Chapter 6 • The Dashboard Designer Window
2.
Type all or part of the object's name, and then choose whether to include object
descriptions and keywords in the search.
3.
(Optional) Select the type of object.
4.
Select the location, and then choose whether to include subfolders in the search.
5.
(Optional) Specify the creation or last modified data, and then click the calendar icons
to specify the date range.
6.
Click Search.
Any objects that are found appear in the table to the right.
7.
Select an object, and then click OK.
Organizing the Folders in the Library Tree
SAS BI Dashboard enables you to create folders and subfolders within the Library tree to
organize SAS BI Dashboard objects. This ability to organize SAS BI Dashboard objects
enables you to create folder structures that can be secured based on your business rules or
needs.
SAS recommends that you carefully consider how SAS BI Dashboard objects will be
stored, and then communicate that strategy to dashboard users.
Page 37

The Objects Pane 31
One strategy is to create a folder for each department in your organization. Each department
would then store their SAS BI Dashboard objects and other SAS objects (such as reports
and information maps) within the folder. Within a department’s folder, you should consider
how dashboard objects are related, and you should use a consistent folder structure that
enables dashboard users to more easily understand how various objects are associated.
For example, you could create a folder structure like this for the Finance department:
A similar, and less complex, strategy is to create a folder for each type of SAS BI Dashboard
object within each department:
Page 38

32 Chapter 6 • The Dashboard Designer Window
The Layout Templates View
The Layout Templates view contains objects that control the flow of the indicators that
are displayed in a dashboard.
The horizontal and vertical flow containers automatically flow (in the indicated direction)
the indicators that they contain. Wrapping occurs when the indicators exceed the container's
width or height.
The Static Content View
The Static Content view contains objects that display a label or an image. A label or an
image can be a link. For more information, see “Manage Dashboard Contents” on page
114.
The Workspace
Overview
The workspace is the place where you interactively work with the objects that make up a
dashboard. Each object is displayed on its own tab.
Page 39

Tiles
The Workspace 33
You can maximize the workspace by selecting View ð Maximize Workspace. You return
the workspace to its normal size by selecting View ð Expand Workspace Panels.
For a dashboard, which contains multiple objects, each object is displayed in a tile. When
you move the mouse pointer over the tile, sizing handles appear around the tile's borders
and a toolbar appears at the top left of the tile.
Editing an Object
Note: A dashboard administrator can choose to display an indicator without the tile.
To access the toolbar for an object, hover over the tile.
The toolbar buttons perform these actions:
Deletes the object.
Displays the object's properties.
Displays the indicator data properties. This button is available for indicators only.
Page 40

34 Chapter 6 • The Dashboard Designer Window
Displays the range properties. This button is available for indicators only.
When you edit the contents of a flow container, the Edit Flow Container dialog box appears.
From here you remove the objects within the container by moving the objects from the
Selected items list to the Available items list.
To edit the dimensions of an object within a flow container, select the object from the
Selected items list, and then edit the properties in the Properties area.
For more information about the flow containers, see “The Layout Templates View” on
page 32.
Manipulating Objects
To resize an object, drag the sizing handles that appear around the object's tile. You can
also edit the width and height in the Properties pane.
To move an object, drag the border of the object. You can also edit the left and top positions
in the Properties pane.
The Properties Pane
The Properties pane displays the properties for the selected object.
Page 41

The Properties Pane 35
However, indicator data and ranges do not display their properties in the Properties pane.
All of their properties are displayed on their tab.
Page 42

36 Chapter 6 • The Dashboard Designer Window
Page 43

Chapter 7
Indicator Data
Overview . . . . . . . . . . . . . . . . . . . . . . . . . . . . . . . . . . . . . . . . . . . . . . . . . . . . . . . . . . . . 37
Indicator Data Rules . . . . . . . . . . . . . . . . . . . . . . . . . . . . . . . . . . . . . . . . . . . . . . . . . . . 38
Stored Process Indicator Data . . . . . . . . . . . . . . . . . . . . . . . . . . . . . . . . . . . . . . . . . . . 39
Defining Indicator Data . . . . . . . . . . . . . . . . . . . . . . . . . . . . . . . . . . . . . . . . . . . . . . . . 40
Data Columns . . . . . . . . . . . . . . . . . . . . . . . . . . . . . . . . . . . . . . . . . . . . . . . . . . . . . . 40
Information Map Data Source . . . . . . . . . . . . . . . . . . . . . . . . . . . . . . . . . . . . . . . . . 41
37
Overview
Create or Edit Indicator Data . . . . . . . . . . . . . . . . . . . . . . . . . . . . . . . . . . . . . . . . . . . 42
Start to Create or Edit Indicator Data . . . . . . . . . . . . . . . . . . . . . . . . . . . . . . . . . . . . 42
Define an Information Map Data Source . . . . . . . . . . . . . . . . . . . . . . . . . . . . . . . . . 43
Define an SQL Query Data Source . . . . . . . . . . . . . . . . . . . . . . . . . . . . . . . . . . . . . 44
Define a Stored Process Data Source . . . . . . . . . . . . . . . . . . . . . . . . . . . . . . . . . . . . 45
Define a Table Data Source . . . . . . . . . . . . . . . . . . . . . . . . . . . . . . . . . . . . . . . . . . . 46
The SAS BI Dashboard indicator data object associates a data source with an indicator.
The core object is the indicator, and a dashboard is just a collection of indicators. An
indicator never has more than one set of indicator data (and is rarely used without indicator
data). Access to four types of data sources is supplied with the SAS BI Dashboard:
• SQL queries, which can access relational data
• information maps, which can access relational data and OLAP cubes
• tables, which can access data in a SAS data set that is registered in SAS metadata
• stored processes, which can access various types of data
Note: The SAS BI Dashboard administrator can add access to other data sources.
Before you create a dashboard, you must understand how to create indicator data.
Understanding the data flow in the SAS BI Dashboard is the key to building enterprise
dashboards that operate efficiently within your organization’s business intelligence system.
Unlike the flow of data in a report (which is usually relatively simple), the flow of data in
a dashboard can be very different. Consider the dashboard in your car. Although you see
a single representation of the state of the car, the state is actually a collection of different
types of data received by the dashboard. The fuel gauge receives data from the fuel tank,
the speedometer receives data from the wheels, the battery gauge receives data from the
Page 44

38 Chapter 7 • Indicator Data
battery, and so on. Like your car’s dashboard, a SAS BI Dashboard can have disparate data
sources.
Whereas a report created with SAS Web Report Studio might fill several screens with data
from a single information map, a dashboard might render data in a small display that is the
result of SQL and JDBC queries and information maps. A dashboard can also render the
output of stored processes that produce static images.
By using information maps and SQL queries to retrieve data, you are unconstrained with
how the data is laid out at the data set level. For example, you can use computed columns
and grouping in the indicator data. After you have the data configured, the lack of
constraints helps you to get initial dashboards set up quickly. But this same simplicity
means that data structure is not enforced.
Indicator Data Rules
Here are several rules to help you to create quicker and more efficient indicator data:
• Plan the indicator data by considering the indicator display types that will be used with
the indicator data and the required appearance of the desired end result.
For example, KPIs appear best with indicator data that produces summarized data with
a limited number of data rows. Indicator data with significant amounts of data, when
used to drive a KPI indicator display, causes the SAS BI Dashboard to try to produce
one KPI graphic representation for each row of data in the indicator data. Other indicator
display types, such as the bar chart, automatically summarize the data. In this case, it
might be appropriate to use indicator data that produces a larger number of data rows.
• To display a single gauge in an indicator, the indicator data must return a single row of
data.
• Create indicator data so that it executes quickly.
A single slow set of indicator data will slow the entire dashboard. Even when indicator
data returns only a single row of data, if it must first join tables that each contain
thousands of rows of data, the indicator data will not perform well.
• If the source data has too many rows, summarize the data.
Summarize data at the indicator data or data-model level. Do not rely on the indicator
display to perform the summary.
For an SQL query, you can summarize data using aggregation functions such as AVG()
and the distinct keyword.
Another summarization strategy is to summarize the data into a summary table. The
summary table is then used as the basis for the SQL query or as the base table for the
information map. The first illustration that follows shows the SAS BI Dashboard
indicator data using a query that combines data from multiple tables. The second
illustration shows the same two tables being summarized by an ETL program. The SAS
BI Dashboard indicator data then uses this summarized table.
Page 45

Product Returns
11.2%
Product Returns
11.2%
Indicator
Data
Summary Table
Data Tables
Data Tables
ETL
Indicator
Data
Stored Process Indicator Data 39
The first method is easier to set up and might result in more timely data, but the second
method is more flexible and will probably be more scalable. You can use a similar
strategy when creating information maps that will be used by the SAS BI Dashboard
indicator data.
• To display multiple gauges or a graph in an indicator, each numeric value should be
associated with a descriptive name.
After you define indicator data, you select the data fields to include in the indicator
display. For every numeric data field displayed in the indicator, you can select a data
field from the Category Label drop-down list to associate with the numeric value. This
associated data field is displayed with the gauge or the category value in a graph.
Stored Process Indicator Data
Use these general steps to create a SAS stored process for use with SAS BI Dashboard:
1.
Write the code for the stored process that does these things:
a. Creates a SAS data set in the SAS Work library
b. Publishes the data to a SAS Package file using the SAS Publishing Framework
c. Sets the macro variable _ARCHIVE_FULLPATH to the path of the archive file
that the stored process generates
2.
In SAS Management Console, register the stored process in the SAS metadata,
designate it as creating a package, and then specify the target data.
For more information about how to specify the target data, see the SAS Management
Console online Help.
3.
Save the stored process metadata registration.
Page 46

40 Chapter 7 • Indicator Data
The stored process is now ready to use in indicator data.
See Also
• “Define a Stored Process Data Source” on page 45
• “Custom Graph Display” on page 67
Defining Indicator Data
Data Columns
When you define indicator data, part of the information that you specify is the display
attributes for each data column that is retrieved.
When you define an SQL query data source, you create a query that retrieves data from the
data source. After you create the query, you submit the query for validation.
If the query is incorrect, the list is empty, and an error message is displayed.
Here is an explanation of the fields:
Column Name
is the name of the data column. You cannot modify this value.
In each type of display, Column Name is used as the default value for the names of
the Category Label, Label, and Property Alias.
Category Label
is the data column that contains the name that is displayed on a KPI gauge or graph.
Label
is the data column that contains the formatted value that is displayed. This format can
be a simple numeric value of a label.
An SQL query does not require this field. To create a formatted label at the bottom of
a gauge, create the label as a formatted string in the SQL query, and then define that
formatted string as the Label attribute.
Here is how Label appears in each type of display:
Display Type Appearance of Label
All graphical displays Displayed below each gauge and in tooltip text (to the
right of the colon). For line and bar charts, displayed as
the category for a given value.
Custom graph Not used.
Dynamic prompt Displayed in tooltip text.
Dynamic text Not used.
KPI Displayed below each gauge.
Spark table Displayed in the value column.
Page 47

Defining Indicator Data 41
Hyperlink
is the data column that contains hyperlinks.
In each type of display, hyperlinks are embedded in gauges or individual data points
in graphs.
Property Alias
is the text that replaces the value retrieved for Label.
Here is how Property Alias appears in each type of display:
Display Type Appearance of Property Alias
All graphical displays Displayed as the axis label and in tooltip text (to the left
of the colon).
Custom graph Not used.
Dynamic prompt Displayed in tooltip text.
Dynamic text Not used.
KPI Displayed as the axis label and in tooltip text (to the left
of the colon).
Spark table Displayed as the column heading.
Information Map Data Source
Overview
An information map data source easily aggregates data in such a flexible manner that a
single information map can drive several different dashboard indicators.
OLAP Information Maps
The data returned from an OLAP information map is flattened into a two-dimensional table
structure. You assign a role for each dimension when you define the data source. The roles
are Column, Row, and Slicer.
Note: You must assign the role of Row to at least one data column.
For dimensions with the role of Row, the levels of each hierarchy are the data fields. The
corresponding members of the level are the values of the data field, where the field name
is the label for the level. The other data fields are the columns that are typically seen in an
OLAP viewer. The field names for the data fields are the comma-delimited levels of the
dimensions with the role of Column, in the order of the dimensions with the role of Row.
You can use the grouping feature of the bar chart with reference lines display with an OLAP
information map to create a multi-dimensional display of data.
Page 48

42 Chapter 7 • Indicator Data
Create or Edit Indicator Data
Start to Create or Edit Indicator Data
To create or edit indicator data:
Note: You can also create or edit indicator data when you create or edit an indicator. For
more information, see “Create or Edit an Indicator” on page 54.
1.
In a dashboard portlet, click Manage Dashboards.
The SAS BI Dashboard appears in a new browser tab.
2.
To create indicator data:
a. In the Library view of the Objects pane, select Indicator Data from the New drop-
down list.
The Create Indicator Data dialog box appears.
b. Type the name, and then click OK.
3.
To edit indicator data, in the Library view of the Objects pane, navigate to a location
that contains indicator data, and then double-click the name.
Note: You can choose to display only indicator data in the library tree by selecting
Indicator data from the Show drop-down list.
Page 49

Create or Edit Indicator Data 43
4.
Define a data source.
For more information, see one of the following, and then return to this task:
• “Define an Information Map Data Source” on page 43
• “Define an SQL Query Data Source” on page 44
• “Define a Table Data Source” on page 46
• “Define a Stored Process Data Source” on page 45
5.
To associate a data point property with data columns in the data source, do the following
for each data point property:
a. From the Column Name column, select the check box next to each data point
property that you want to include in the display.
b. From the Category Label drop-down list, select a data column in the data source
that contains the category label or group variable.
If the data source contains a Name data column, this data column is selected
automatically for all data point properties.
c. From the Label drop-down list, select a data column in the data source that contains
the label for the data point property.
If you need a complicated label, such as one that concatenates data fields and static
text, create a data column in the data source to store the concatenation. Then type
the name to display for the data point property in the Property Alias field.
d. From the Hyperlink drop-down list, select a data column in the data source that
contains the hyperlink for the data point property.
e. In the Property Alias field, type the name to display for the data point property in
the column heading in the KPI table display.
Note: The KPI display ignores this value.
Define an Information Map Data Source
CAUTION:
The maximum number of rows returned by a relational information map data
source is 1,000.If the source data contains more than 1,000 rows, the information
shown by an indicator that uses the relational information map data source is probably
wrong. If possible, aggregate the data to reduce the number of rows to return.
To define an information map data source:
1.
Perform the first three steps of the task “Start to Create or Edit Indicator Data” on page
42.
2.
From the Data source drop-down list, select Information map.
The fields to define an information map data source appear.
Page 50
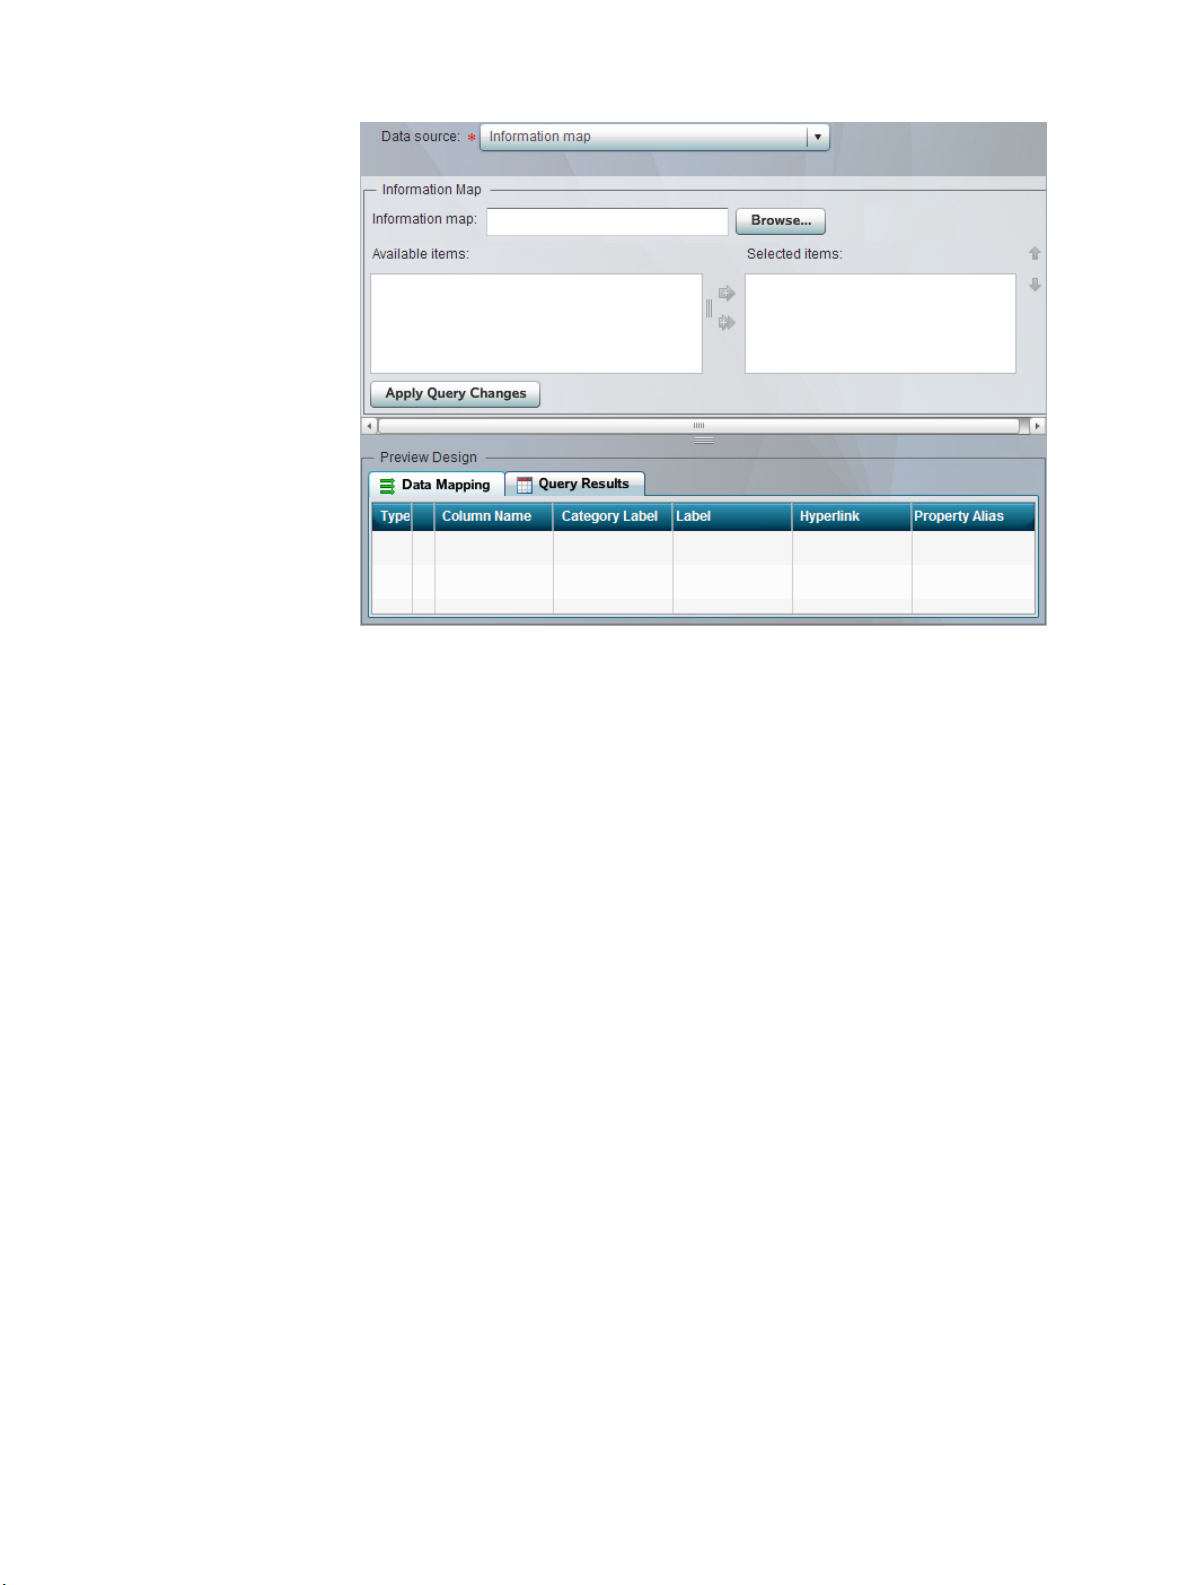
44 Chapter 7 • Indicator Data
3.
Next to the Information map field, click Browse.
The Open dialog box appears.
4.
Navigate to an information map, select it, and then click Open.
5.
Move data columns and filters between the Available items list and the Selected
items list by selecting one or more items and clicking the arrows between the lists.
A filter is moved under the Filters node. By default, a data column is moved under the
Column node. If the information map is based on an OLAP cube, the Selected item
list includes the nodes Row and Slicer. To use a data column in either of these roles,
select Row or Slicer before moving the data column from the Available list.
Note: To make available a filter that contains a user prompt, the prompt must have a
default value specified in SAS Information Map Studio.
6.
To move a data column between groups, click the name of a data column in the Selected
items list, and then move it up or down by clicking one of the arrows that are next to
the list.
7.
When the data columns are set, click Apply Query Changes.
8.
To view the data that is included in the indicator data, click the Query Results tab.
9.
Continue with step 5 of the task “Create or Edit Indicator Data” on page 42.
Define an SQL Query Data Source
To define an SQL query data source:
1.
Perform the first three steps of the task “Start to Create or Edit Indicator Data” on page
42.
2.
From the Data source drop-down list, select SQL query.
The fields to define an SQL query data source appear.
Page 51

3.
In the Query field, type the query code.
4.
Click Submit.
Create or Edit Indicator Data 45
5.
To view the data that is included in the indicator data, click the Query Results tab.
6.
Continue with step 5 of the task “Create or Edit Indicator Data” on page 42.
Define a Stored Process Data Source
To define a stored process data source:
1.
Perform the first three steps of the task “Start to Create or Edit Indicator Data” on page
42.
2.
From the Data source drop-down list, select Stored process.
The fields to define a stored process data source appear.
Page 52

46 Chapter 7 • Indicator Data
3.
Next to the Stored process field, click Browse.
The Open dialog box appears.
4.
Navigate to a stored process, select it, and then click Open.
5.
From the Published data set name drop-down list, select a data set.
6.
(Optional) Choose to have the SAS log added to the server log.
Selecting this option enables you to review this information later.
7.
Click Apply Changes.
8.
To view the data that is included in the indicator data, click the Query Results tab.
9.
Continue with step 5 of the task “Create or Edit Indicator Data” on page 42.
See Also
“Stored Process Indicator Data” on page 39
Define a Table Data Source
CAUTION:
The maximum number of rows returned by a table data source is 1,000.If the source
data contains more than 1,000 rows, the information shown by an indicator that uses
the table data source is probably wrong. If possible, aggregate the data to reduce the
number of rows to return.
To define a table data source:
1.
Perform the first three steps of the task “Start to Create or Edit Indicator Data” on page
42.
2.
From the Data source drop-down list, select Table.
The fields to define a table data source appear.
Page 53

3.
From the Table tree, select a table.
Create or Edit Indicator Data 47
The data columns in the table appear in the Available columns table.
4.
From the Available columns table, select the data columns to include in the indicator
data by selecting the check box at the end of a row.
5.
For each selected data column, select a method to summarize the data from the
Summary column.
6.
For each selected data column, choose whether to group the data by selecting the check
box in the Group By column.
7.
To specify additional filters, type the filter (using SQL syntax) into the Filters field.
Note: Do not type the key word where. This causes an error because where is
automatically supplied.
8.
Click Apply Query Changes.
9.
To view the data that is included in the indicator data, click the Query Results tab.
10.
Continue with step 5 of the task “Create or Edit Indicator Data” on page 42.
Page 54

48 Chapter 7 • Indicator Data
Page 55

Chapter 8
Ranges
Create or Edit a Range . . . . . . . . . . . . . . . . . . . . . . . . . . . . . . . . . . . . . . . . . . . . . . . . . 49
Start to Create or Edit a Range . . . . . . . . . . . . . . . . . . . . . . . . . . . . . . . . . . . . . . . . . 49
Define the Range . . . . . . . . . . . . . . . . . . . . . . . . . . . . . . . . . . . . . . . . . . . . . . . . . . . 50
Create or Edit a Range
49
Start to Create or Edit a Range
A range defines the measurement intervals by which a metric is evaluated, such as below
target, on target, and above target.
To create or edit a range:
1.
In a dashboard portlet, click Manage Dashboards.
The SAS BI Dashboard appears in a new browser tab.
2.
To create a range:
a. In the Library view of the Objects pane, select Range from the New drop-down
list.
Page 56

50 Chapter 8 • Ranges
3.
Define the Range
The Create a Range dialog box appears.
b. Type the name, and then click OK.
To edit a range, in the Library view of the Objects pane, navigate to a location that
contains a range, and then double-click the name.
Note: You can choose to display only ranges in the library tree by selecting Range
from the Show drop-down list.
To define the range:
1.
If needed, type a description.
2.
For each interval in the range, click Add Interval, type the interval value in the Upper
bound field, and then click OK.
The interval is added to the table of intervals. You can add the values in any order; the
software orders them correctly in the table.
Note: Valid input includes a sign, digits, and a locale-dependent decimal separator.
Page 57

Create or Edit a Range 51
3.
To define each interval:
a. For a static gauge, in the Code Interval column, select a code interval from the
drop-down list.
The available intervals depend on the gauge.
b. In the Relation column, select an operator from the drop-down list, and specify a
value in the adjacent Lower Value column.
c. In the Label column, type the label.
d. Click in the Color column and select a color.
e.
To delete an interval, click next to the interval.
f. To preview how the range will appear, select a gauge type from the Dynamic gauge
type drop-down list.
You can control which users can use the range. For more information, see the SAS
Management Console online Help.
Page 58

52 Chapter 8 • Ranges
Page 59

Chapter 9
Indicators
Overview . . . . . . . . . . . . . . . . . . . . . . . . . . . . . . . . . . . . . . . . . . . . . . . . . . . . . . . . . . . . 54
Create or Edit an Indicator . . . . . . . . . . . . . . . . . . . . . . . . . . . . . . . . . . . . . . . . . . . . . 54
53
Overview . . . . . . . . . . . . . . . . . . . . . . . . . . . . . . . . . . . . . . . . . . . . . . . . . . . . . . . . . . 54
Start to Create or Edit an Indicator . . . . . . . . . . . . . . . . . . . . . . . . . . . . . . . . . . . . . . 54
Define the General Properties . . . . . . . . . . . . . . . . . . . . . . . . . . . . . . . . . . . . . . . . . . 56
Define the Role-Mapping Properties . . . . . . . . . . . . . . . . . . . . . . . . . . . . . . . . . . . . 56
Define the User Personalization Properties . . . . . . . . . . . . . . . . . . . . . . . . . . . . . . . 57
Set Up the Links . . . . . . . . . . . . . . . . . . . . . . . . . . . . . . . . . . . . . . . . . . . . . . . . . . . . 57
Create or Edit an Indicator Alert . . . . . . . . . . . . . . . . . . . . . . . . . . . . . . . . . . . . . . . 58
Indicator Displays . . . . . . . . . . . . . . . . . . . . . . . . . . . . . . . . . . . . . . . . . . . . . . . . . . . . . 59
Bar Chart with Bullet Display . . . . . . . . . . . . . . . . . . . . . . . . . . . . . . . . . . . . . . . . . 59
Bar Chart with Reference Lines Display . . . . . . . . . . . . . . . . . . . . . . . . . . . . . . . . . 61
Bubble Plot Display . . . . . . . . . . . . . . . . . . . . . . . . . . . . . . . . . . . . . . . . . . . . . . . . . 64
Chart with Slider Prompt Display . . . . . . . . . . . . . . . . . . . . . . . . . . . . . . . . . . . . . . . 65
Clustered Bar Chart Display . . . . . . . . . . . . . . . . . . . . . . . . . . . . . . . . . . . . . . . . . . . 66
Custom Graph Display . . . . . . . . . . . . . . . . . . . . . . . . . . . . . . . . . . . . . . . . . . . . . . . 67
Dual Line Chart Display . . . . . . . . . . . . . . . . . . . . . . . . . . . . . . . . . . . . . . . . . . . . . . 69
Dynamic Prompt Display . . . . . . . . . . . . . . . . . . . . . . . . . . . . . . . . . . . . . . . . . . . . . 70
Dynamic Text Display . . . . . . . . . . . . . . . . . . . . . . . . . . . . . . . . . . . . . . . . . . . . . . . 71
Forecast Chart Display . . . . . . . . . . . . . . . . . . . . . . . . . . . . . . . . . . . . . . . . . . . . . . . 72
Interactive Displays . . . . . . . . . . . . . . . . . . . . . . . . . . . . . . . . . . . . . . . . . . . . . . . . . 73
KPI Display . . . . . . . . . . . . . . . . . . . . . . . . . . . . . . . . . . . . . . . . . . . . . . . . . . . . . . . 77
Line Chart with Reference Lines Display . . . . . . . . . . . . . . . . . . . . . . . . . . . . . . . . 81
Needle Plot Display . . . . . . . . . . . . . . . . . . . . . . . . . . . . . . . . . . . . . . . . . . . . . . . . . 83
Pie Chart Display . . . . . . . . . . . . . . . . . . . . . . . . . . . . . . . . . . . . . . . . . . . . . . . . . . . 84
Range Map Display . . . . . . . . . . . . . . . . . . . . . . . . . . . . . . . . . . . . . . . . . . . . . . . . . 85
Scatter Histogram Display . . . . . . . . . . . . . . . . . . . . . . . . . . . . . . . . . . . . . . . . . . . . 87
Scatter Plot Display . . . . . . . . . . . . . . . . . . . . . . . . . . . . . . . . . . . . . . . . . . . . . . . . . 88
Schedule Chart Display . . . . . . . . . . . . . . . . . . . . . . . . . . . . . . . . . . . . . . . . . . . . . . 90
Simple Bar Chart Display . . . . . . . . . . . . . . . . . . . . . . . . . . . . . . . . . . . . . . . . . . . . . 91
Spark Table Display . . . . . . . . . . . . . . . . . . . . . . . . . . . . . . . . . . . . . . . . . . . . . . . . . 92
Stacked Bar Chart Display . . . . . . . . . . . . . . . . . . . . . . . . . . . . . . . . . . . . . . . . . . . . 94
Targeted Bar Chart Display . . . . . . . . . . . . . . . . . . . . . . . . . . . . . . . . . . . . . . . . . . . 96
Tile Chart Display . . . . . . . . . . . . . . . . . . . . . . . . . . . . . . . . . . . . . . . . . . . . . . . . . . . 98
Vector Plot Display . . . . . . . . . . . . . . . . . . . . . . . . . . . . . . . . . . . . . . . . . . . . . . . . . . 99
Waterfall Chart Display . . . . . . . . . . . . . . . . . . . . . . . . . . . . . . . . . . . . . . . . . . . . . 101
Select a Gauge for an Indicator . . . . . . . . . . . . . . . . . . . . . . . . . . . . . . . . . . . . . . . 102
Page 60

54 Chapter 9 • Indicators
Overview
An indicator includes a title and a display. The display includes one or more data values,
a hyperlink (optional), and one or more gauges, a graph, or an image. Here is an example
of a KPI indicator:
The indicator title is Regional Sales KPIs. The names of the gauges, such as NW and NYC,
are the values of the data column specified by the Category Label field when the data
source was defined. The values, such as 10% and 35%, are the values of the data column
specified by the Label field. The hyperlink is not shown. For more information about where
these items of information appear in each type of display, see “Defining Indicator Data”
on page 40.
You select the display when you create or edit an indicator. For more information, see
“Create or Edit an Indicator” on page 54 and “Indicator Displays” on page 59.
Create or Edit an Indicator
Overview
There are six general steps to create or edit an indicator:
1.
Start to create or edit an indicator. (See page 54.)
2.
Define the general properties. (See page 56.)
3.
Define the role-mapping properties. (See page 56.)
4.
Define the user personalization properties. (See page 57.)
5.
Set up the links. (See page 57.)
6.
Create or edit an indicator alert. (See page 58.)
When you edit an indicator, you can perform any of the steps in any order.
Start to Create or Edit an Indicator
To start to create or edit an indicator:
1.
Click Manage Dashboards.
The dashboard designer appears.
Page 61

Create or Edit an Indicator 55
2.
To create an indicator:
a. In the Library view of the Objects pane, select Indicator from the New drop-
down list.
The Create an Indicator dialog box appears.
b. Type the name.
c. Select the display type.
Other controls might appear below the Indicator data field, based on the display
type that you select.
d. To select existing indicator data, click Browse next to the Indicator data field,
navigate to the indicator data, and then open it.
e. To create indicator data, click New next to the Indicator data field.
For more information, see step 2 of the task “Start to Create or Edit Indicator Data”
on page 42.
f. Click OK.
3.
To edit an indicator, in the Library view of the Objects pane, navigate to a location
that contains an indicator, and then double-click the name.
Note: You can choose to display only indicators in the library tree by selecting
Indicator from the Show drop-down list.
Page 62

56 Chapter 9 • Indicators
Define the General Properties
1.
Change the height and width by specifying values in the controls or by clicking the
indicator and dragging the resize handles.
The height and width values are in intervals of five pixels.
Note: For an interactive summary chart and detail chart display or an interactive
summary chart and detail plot display, the minimum legible dimensions are 380 x
450 pixels.
These height and width settings apply only when the indicator is displayed by itself,
not on a dashboard. When displayed on a dashboard, the indicator's height and width
are specified in the Object area of the Properties pane.
2.
Select the display type.
Other controls might appear, based on the display type that you select.
For information about gauges, see “Select a Gauge for an Indicator” on page 102.
3.
To select existing indicator data, click Browse next to the Indicator data field, navigate
to the indicator data, and then open it.
Note: You interact with range data, if available, in the same manner as the indicator
data.
4.
To create indicator data, click New next to the Indicator data field.
For more information, see step 2 of the task “Start to Create or Edit Indicator Data” on
page 42.
5.
To use existing indicator data, click Browse, navigate to the indicator data, and then
double-click the name.
6.
To edit the indicator data, click Edit.
For more information, see one of the following:
• “Define an Information Map Data Source” on page 43
• “Define an SQL Query Data Source” on page 44
• “Define a Table Data Source” on page 46
• “Define a Stored Process Data Source” on page 45
7.
To create indicator data, click New next to the Indicator data field.
For more information, see step 2 of the task “Start to Create or Edit Indicator Data” on
page 42.
8.
(Optional) Choose how to sort the displayed data.
Define the Role-Mapping Properties
The role-mapping properties determine which data is included in the display, how the data
is grouped, how the data is summarized, and so on.
The role-mapping properties that are available depend on the type of display that you select.
For a list of the role-mapping properties, see Appendix A1, “Indicator Role-Mapping
Properties,” on page 121.
Page 63

Define the User Personalization Properties
(Optional) Choose whether to allow users to manage alerts and whether to limit which email templates the user can select.
Set Up the Links
1.
Click at the top of the Properties pane.
The Set Up Link dialog box appears.
Create or Edit an Indicator 57
Note: You cannot set up links for these indicator display types: chart with slider
prompt, dynamic prompt, and dynamic text.
2.
From the Link type drop-down list, select the type of link.
3.
From the Link target drop-down list, select a window in which to open the link target.
4.
If you selected an external link, type the URL of the link in the Link field.
5.
If you selected a type other than an external link, click Browse next to the Link field,
and then select an item.
The available choices depend on the type of link.
6.
(Optional) To specify the parameters for the URL specified in the Link field that
supports parameters:
a.
Click
The Name and Data point lookup controls appear.
Note: If you select Web Report for the link type, the Name column is renamed
b. Type the name of the parameter, and then select the data point lookup associated
with the parameter.
The name must match the expected name exactly, including case.
The data point lookup is the data column that contains the parameter values.
.
Displayed Text.
Page 64

58 Chapter 9 • Indicators
c. Add as many parameters as needed.
d.
To delete a parameter, select a row and then click next to the row.
e. To order the parameters, select a parameter, and then click the arrow buttons next
to the parameter table.
Create or Edit an Indicator Alert
Overview
To create an indicator alert, click at the top of the Properties pane.
Note: The trigger interval for an indicator alert depends on a range. Therefore, you can
create an indicator alert only for an indicator that uses a display type that supports a
range.
The Edit Indicator Alerts dialog box appears.
To create an indicator alert:
1.
Click New Alert.
2.
Type the name of the alert.
3.
From the Gauge definition and Trigger interval drop-down lists, select the gauge
definition and the interval to trigger the alert.
4.
Choose when to trigger the alert: Any gauge is in the interval or % of gauges are in
the interval.
5.
If you chose % of gauges are in the interval, type a percentage in the field next to the
check box.
6.
Select the delivery method for the alert: Alerts portlet or E-mail subscribers.
Note: You can select both.
Page 65

Indicator Displays 59
7.
(Optional) If you selected E-mail subscribers:
a. From the E-mail template drop-down list, select the e-mail template to use to
format the e-mail.
b. Type the subject and additional message to include in the e-mail.
c.
Click next to the list of alert subscribers, and then select users and user groups.
For more information, see “Add Users and User Groups,” which follows.
d.
To remove a subscriber, select one from the list, and then click .
Add Users and User Groups
e. Type the text to search for in the Search field.
Partial text is valid. Wildcards are not supported.
f. Select the category (or both categories) to search.
g. Click Search.
A table appears with all entries that match the search criteria.
h. From the table, select the check box next to each entry that you want to add.
Note: You can also drag an entry from the table into the List of alert subscribers.
8.
To limit the number of alerts, select the Limit alerts on frequently changing
indicators check box, type a value, and then select a time interval.
To edit an indicator alert:
1.
From the Alerts table, select an alert.
The properties of the alert appear on the left side of the dialog box.
2.
Edit the properties.
To delete an alert, select one from the Alerts table, and then click
Indicator Displays
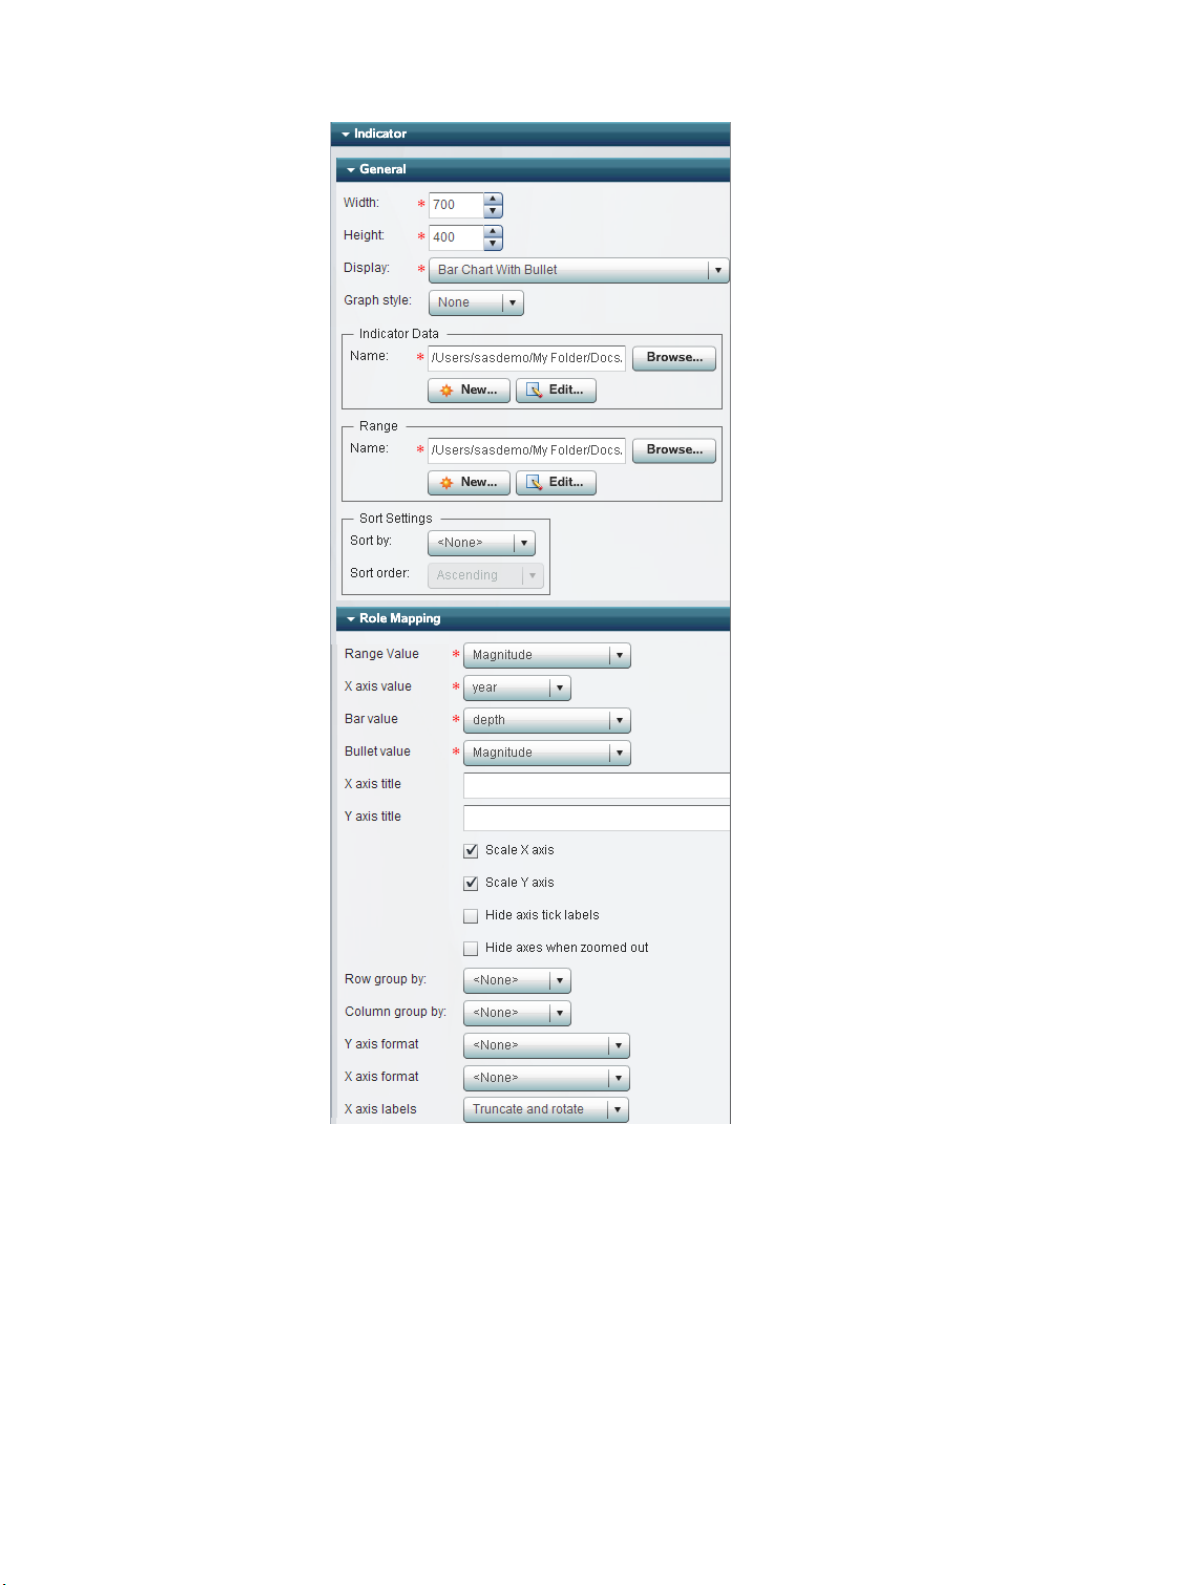
Bar Chart with Bullet Display
Here is an example of a bar chart with bullet display:
.
Page 66

60 Chapter 9 • Indicators
Here are the properties that created the display:
Page 67
Indicator Displays 61
Bar Chart with Reference Lines Display
The bar chart with reference lines display applies a range to a standard graph display such
as bar chart or line graph. Here is an example of a bar chart with reference lines display:
Page 68

62 Chapter 9 • Indicators
Here are the properties that created the display:
Page 69

Indicator Displays 63
For the best results, the indicator data should return only one value for each unique value
in the Category Label data column. If the indicator data returns only one value, the bar
chart with reference lines display does not need to aggregate the data. The category variable
is specified by the data column selected for the Category Label field when the data source
is defined.
If the bar chart with reference lines display does aggregate data, the bar chart with reference
lines displays data points at the average interval for each data series. The indexes of the
aggregated intervals are averaged to determine the interval to display and the color of the
bar.
If the bar chart with reference lines display does aggregate data, the bar chart with reference
lines does two things:
1.
It displays data points at the average interval for each data series.
Page 70
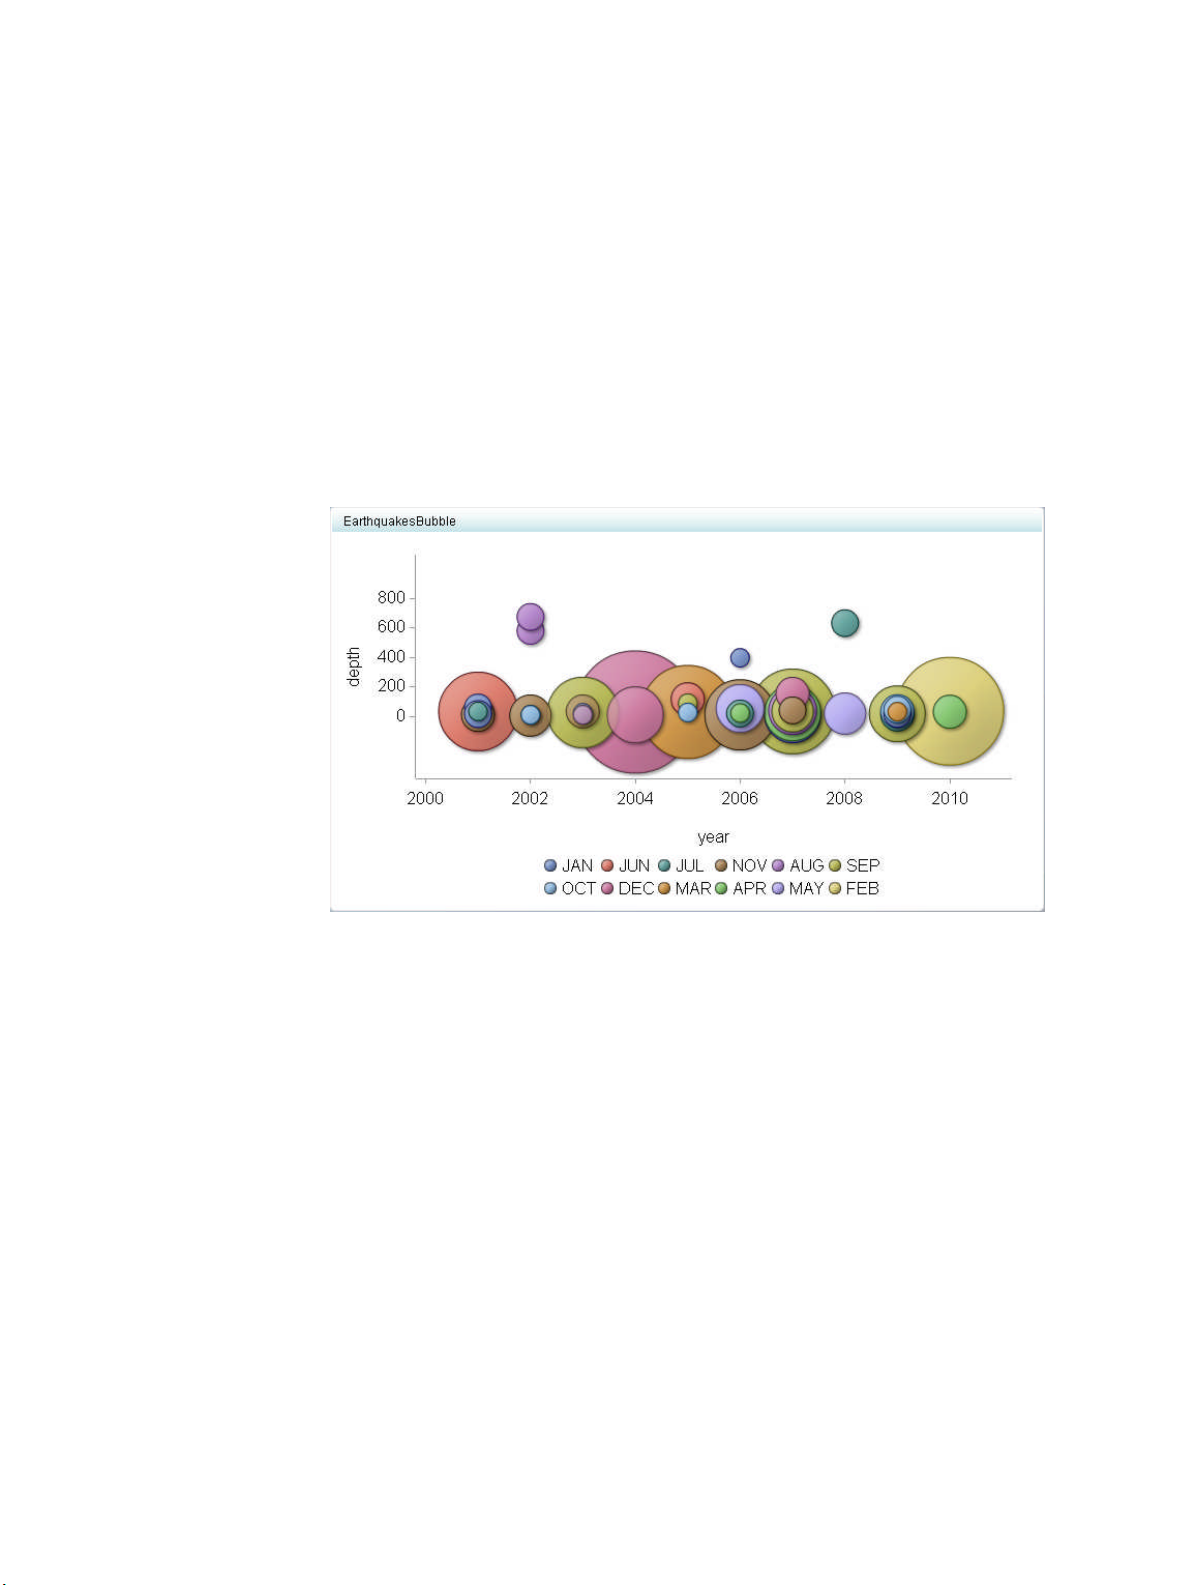
64 Chapter 9 • Indicators
2.
It averages the indexes of the aggregated intervals to determine the interval to display
and the color of the bar.
Here are some guidelines for using the bar chart with reference lines display:
• To display the average interval in a graph, the bar chart with reference lines is the easiest
method to use.
• The tooltip for each data series indicates that the displayed value is the average interval.
• To prevent aggregation by the bar chart with reference lines display, aggregate the data
at the indicator data level.
Bubble Plot Display
Here is an example of a bubble plot display:
Here are the properties that created the display:
Page 71

Indicator Displays 65
Chart with Slider Prompt Display
Here is an example of a chart with slider prompt display:
Page 72

66 Chapter 9 • Indicators
Here are the properties that created the display:
Clustered Bar Chart Display
Here is an example of a clustered bar chart display:
Here are the properties that created the display:
Page 73

Indicator Displays 67
Custom Graph Display
Overview
The custom graph display presents information from a variety of sources. The visual
representation is an image. The output of the graph display is specified by an external URL.
When you specify an image in the URL, you have the choice of using a proxy.
• If you do not choose to use a proxy, the image file must be in the same network domain
as the SAS BI Dashboard server.
Note: You can allow Adobe Flash to load images from other domains by creating a
• If you do choose to use a proxy, the image file must be accessible to the SAS middle
tier. Ensure that the SAS middle tier has the proper user credentials to access the URL.
For more information, see “Use proxy” on page 130.
Here is an example of a custom graph display:
cross-domain policy file in the root of the Web server. For more information, search
the Adobe Web site for “cross-domain policy file specification.”
Page 74

68 Chapter 9 • Indicators
Here are the properties that created the display:
Stored Processes
You can use a stored process with a custom graph display to produce a graphical display
that is not possible with the SAS BI Dashboard itself. To use a stored process, you must
Page 75

create a stored process that is appropriate for inclusion in a dashboard and then derive the
URL that renders the stored process output.
Use these guidelines to create a stored process:
• The output for the stored process must be set to streaming.
• The output should be small in size, perhaps no more than 300 X 300 pixels.
Conserving space in a dashboard is important so that dashboard users can get a broad
overview of disparate metrics. Although a stored process that renders a graph might
look good when it uses most of the window, the graph will displace all other information
in the dashboard. If you cannot communicate the data in a small amount of space and
users need to see other data in the same dashboard, consider using aggregation or
another technique to reduce the amount of data that the stored process renders. Consider
modifying the stored process in SAS Enterprise Guide to suppress the title and
footnotes, and use the minimal template for output.
To determine the URL for a stored process, use the Stored Process Web application.
Choose to use a proxy so that the proxy server detects from the URL that the target is a
stored process request. The proxy server then adds authentication for the current user to
the middle tier.
Dual Line Chart Display
Indicator Displays 69
Here is an example of a dual line chart display:
Here are the properties that created the display:
Page 76

70 Chapter 9 • Indicators
Dynamic Prompt Display
Here is an example of a dynamic prompt display:
Here are the properties that created the display:
Page 77

Indicator Displays 71
CAUTION:
If you select Combo box with gauge for the prompt type, then you must select a range. If
you select Combo box for the prompt type, then you cannot select a range.
Dynamic Text Display
Here is an example of a dynamic text display:
Here are the properties that created the display:
Ensure that each menu value is unique.Duplicate menu values cause unexpected
behavior.
Page 78

72 Chapter 9 • Indicators
With the dynamic text display, a range is optional. If you select a range, the range value's
text is colored based on the range interval colors.
Forecast Chart Display
Here is an example of a forecast chart display:
Here are the properties that created the display:
Page 79

Indicator Displays 73
Interactive Displays
Overview
The interactive displays enable dashboard users to interactively traverse large amounts of
detail data by sliding along a summary chart. Detail data can be easily compared using two
methods. In the first method, a column by which to group data is selected when the display
is defined. In the second method, the user selects different detail slices to compare while
viewing the display.
The interactive displays are as follows:
• the interactive summary and bar chart display
• the interactive summary and scatter plot display
• the interactive summary and targeted bar chart display
Setting up an interactive display is nearly identical to setting up a bar chart with reference
lines display. However, an interactive display has more options and uses data in a more
sophisticated way than the bar chart with reference lines display.
Page 80

74 Chapter 9 • Indicators
For the best results using the interactive displays, the indicator data must meet these
requirements:
• The indicator data must be suitable for a bar chart with reference lines.
Indicator data that returns a single row and that is suitable for a KPI display is not
suitable for an interactive display.
• The indicator data must contain one low-cardinality grouping column that is used to
summarize the data.
A low-cardinality grouping column is a column that has a small number of unique
values to group by.
• (Optional) To enable an interactive display to express forecasting data to business users,
the indicator data must contain a column for forecasted values, for lower confidence
values, and for upper confidence values.
An interactive bar chart display can summarize either the detail data expressed in the
detail charts or can summarize a different field of data.
At the indicator level, the setup of the interactive displays is essentially the same as for
other bar chart with reference lines, except that the use of data for the interactive
displays is more sophisticated. The only significant difference is that the interactive
displays support the concept of dependent ranges. A dependent range takes the value
of another range for the range definition. This scheme enables a data set generated by
the SAS Forecast Server to be useful to the SAS BI Dashboard and the interactive
displays without the need for complicated intermediary data transformations.
Interactive Summary and Bar Chart Display
Here is an example of an interactive summary and bar chart display:
Page 81

Here are the properties that created the display:
Indicator Displays 75
Interactive Summary and Scatter Plot Display
Here is an example of an interactive summary and scatter plot display:
Here are the properties that created the display:
Page 82

76 Chapter 9 • Indicators
Interactive Summary and Targeted Bar Chart Display
Here is an example of an interactive summary and targeted bar chart display:
Page 83

Here are the properties that created the display:
Indicator Displays 77
KPI Display
Overview
The KPI display shows a single KPI or multiple KPIs. For a single KPI, the display shows
the KPI associated with a single data value.
Here is an example of a KPI display:
Page 84

78 Chapter 9 • Indicators
Here are the properties that created the display:
Page 85

Indicator Displays 79
For multiple KPIs, the display shows one KPI for each data point that is in scope. For the
best results, aggregate related KPIs through a single set of indicator data so that a single
indicator configuration controls the display of all values.
Dynamic Gauges
In addition to the static gauges that are displayed in the software, you can choose a gauge
that is dynamic. A dynamic gauge is drawn by the software based on the type of gauge and
the data values in the gauge.
Here are examples of the dynamic gauges:
• Dynamic bullet bar (horizontal and vertical)
•
Page 86

80 Chapter 9
• Indicators
• Dynamic dial
• Dynamic slider (horizontal and vertical)
• Dynamic speedometer
• Dynamic traffic light (horizontal and vertical)
•
Page 87

• Dynamic thermometer (horizontal and vertical)
• Radial thermometer
Line Chart with Reference Lines Display
Here is an example of a line chart with reference lines display:
Indicator Displays 81
Page 88

82 Chapter 9 • Indicators
Here are the properties that created the display:
Page 89

Needle Plot Display
Here is an example of a needle plot display:
Indicator Displays 83
Here are the properties that created the display:
Page 90

84 Chapter 9 • Indicators
Pie Chart Display
Here is an example of a pie chart display:
Here are the properties that created the display:
Page 91

Range Map Display
Indicator Displays 85
The range map display shows graphs with results plotted on color-coded backgrounds that
are based on range definitions.
Here is an example of a range map display:
Page 92

86 Chapter 9 • Indicators
Here are the properties that created the display:
Page 93

Scatter Histogram Display
Here is an example of a scatter histogram display:
Indicator Displays 87
Here are the properties that created the display:
Page 94

88 Chapter 9 • Indicators
Scatter Plot Display
Here is an example of a scatter plot display:
Page 95

Here are the properties that created the display:
Indicator Displays 89
Page 96

90 Chapter 9 • Indicators
Schedule Chart Display
Here is an example of a schedule chart display:
Page 97

Here are the properties that created the display:
Indicator Displays 91
Simple Bar Chart Display
Here is an example of a simple bar chart display:
Page 98

92 Chapter 9 • Indicators
Here are the properties that created the display:
Spark Table Display
The spark table display shows data points in a table form, with one gauge per table row.
The table column headings are the names of the data fields.
SAS suggests that all non-numeric data columns are removed from the indicator data.
Page 99

Here is an example of a spark table display:
Here are the properties that created the display:
Indicator Displays 93
Note: To display the column properties, select a column in the data table.
Page 100

94 Chapter 9 • Indicators
If you have used SAS BI Dashboard in the past, the spark table display replaces the KPI
table display and the bar and trend display.
Stacked Bar Chart Display
Here is an example of a stacked bar chart display:
 Loading...