

Page 1

SAP BusinessObjects Project Systems
Rapid Mart XI 3.2, version for SAP
solutions - Business Guide
Version 12.2.0.0
Page 2

October 2009
Copyright
Trademarks
© Copyright 2009 SAP AG. All rights reserved.
No part of this publication may be reproduced or transmitted in any form or for any purpose
without the express permission of SAP AG. The information contained herein may be
changed without prior notice.
Some software products marketed by SAP AG and its distributors contain proprietary
software components of other software vendors.
All rights reserved. SAP, R/3, SAP NetWeaver, Duet, PartnerEdge, ByDesign, SAP Business
ByDesign, and other SAP products and services mentioned herein as well as their respective
logos are trademarks or registered trademarks of SAP AG in Germany and other countries.
Business Objects and the Business Objects logo, BusinessObjects, Crystal Reports, Crystal
Decisions, Web Intelligence, Xcelsius, and other Business Objects products and services
mentioned herein as well as their respective logos are trademarks or registered trademarks
of Business Objects S.A. in the United States and in other countries. Business Objects is an
SAP company.
All other product and service names mentioned are the trademarks of their respective
companies. Data contained in this document serves informational purposes only. National
product specifications may vary.
These materials are subject to change without notice. These materials are provided by SAP
AG and its affiliated companies ("SAP Group") for informational purposes only, without
representation or warranty of any kind, and SAP Group shall not be liable for errors or
omissions with respect to the materials. The only warranties for SAP Group products and
services are those that are set forth in the express warranty statements accompanying such
products and services, if any. Nothing herein should be construed as constituting an
additional warranty.
Page 3

Contents
Chapter 1 Introduction 1
What is a Rapid Mart? . . . . . . . . . . . . . . . . . . . . . . . . . . . . . . . . . . . . . . . . . 2
Rapid Marts packages accelerate Time to Value . . . . . . . . . . . . . . . . . 3
SAP BusinessObjects Rapid Marts packages architecture . . . . . . . . . . 4
About this document . . . . . . . . . . . . . . . . . . . . . . . . . . . . . . . . . . . . . . . . . . 5
Chapter 2 Overview 7
What you can do with this Rapid Mart . . . . . . . . . . . . . . . . . . . . . . . . . . . . . 8
Supported analyses . . . . . . . . . . . . . . . . . . . . . . . . . . . . . . . . . . . . . . . . . . 10
Dimensions available to support these analyses . . . . . . . . . . . . . . . . . 12
Related Rapid Marts . . . . . . . . . . . . . . . . . . . . . . . . . . . . . . . . . . . . . . . . . 12
Components shared with other SAP BusinessObjects Rapid Marts . . 12
Project Systems Rapid Mart schema . . . . . . . . . . . . . . . . . . . . . . . . . . . . . 14
Where the Rapid Mart fits in Project Activities . . . . . . . . . . . . . . . . . . . . . . 16
Chapter 3 Subject Areas 17
Projects (PS) Module Overview . . . . . . . . . . . . . . . . . . . . . . . . . . . . . . . . . 18
Work Breakdown Structure / Project Elements . . . . . . . . . . . . . . . . . . 21
Networks . . . . . . . . . . . . . . . . . . . . . . . . . . . . . . . . . . . . . . . . . . . . . . . 22
Activities . . . . . . . . . . . . . . . . . . . . . . . . . . . . . . . . . . . . . . . . . . . . . . . . 23
Network Relationships . . . . . . . . . . . . . . . . . . . . . . . . . . . . . . . . . . . . . 24
Production Resource Tools (PRT) Assignments . . . . . . . . . . . . . . . . . 25
Milestones . . . . . . . . . . . . . . . . . . . . . . . . . . . . . . . . . . . . . . . . . . . . . . 26
Project Costing . . . . . . . . . . . . . . . . . . . . . . . . . . . . . . . . . . . . . . . . . . . 26
Milestone Section . . . . . . . . . . . . . . . . . . . . . . . . . . . . . . . . . . . . . . . . . . . . 27
Rapid Mart Processing . . . . . . . . . . . . . . . . . . . . . . . . . . . . . . . . . . . . . 27
Rapid Mart Data . . . . . . . . . . . . . . . . . . . . . . . . . . . . . . . . . . . . . . . . . . 31
Network Order Section . . . . . . . . . . . . . . . . . . . . . . . . . . . . . . . . . . . . . . . . 32
Rapid Mart Processing . . . . . . . . . . . . . . . . . . . . . . . . . . . . . . . . . . . . . 33
SAP BusinessObjects Project Systems Rapid Mart XI 3.2 for SAP solutions Business Guide 3
Page 4

Contents
Rapid Mart data . . . . . . . . . . . . . . . . . . . . . . . . . . . . . . . . . . . . . . . . . . .36
Network Relationship Section . . . . . . . . . . . . . . . . . . . . . . . . . . . . . . . . . . . 38
Rapid Mart Processing . . . . . . . . . . . . . . . . . . . . . . . . . . . . . . . . . . . . .39
Rapid Mart data . . . . . . . . . . . . . . . . . . . . . . . . . . . . . . . . . . . . . . . . . . .42
Project Cost Summary Section . . . . . . . . . . . . . . . . . . . . . . . . . . . . . . . . . . 44
Rapid Mart Processing . . . . . . . . . . . . . . . . . . . . . . . . . . . . . . . . . . . . .45
Rapid Mart data . . . . . . . . . . . . . . . . . . . . . . . . . . . . . . . . . . . . . . . . . . .53
PRT Assignment Section . . . . . . . . . . . . . . . . . . . . . . . . . . . . . . . . . . . . . . 54
Rapid Mart processing . . . . . . . . . . . . . . . . . . . . . . . . . . . . . . . . . . . . .55
Rapid Mart data . . . . . . . . . . . . . . . . . . . . . . . . . . . . . . . . . . . . . . . . . . .60
Chapter 4 Reports 65
Milestone . . . . . . . . . . . . . . . . . . . . . . . . . . . . . . . . . . . . . . . . . . . . . . . . . . . 66
Reports . . . . . . . . . . . . . . . . . . . . . . . . . . . . . . . . . . . . . . . . . . . . . . . . .66
Recommended Table Joins . . . . . . . . . . . . . . . . . . . . . . . . . . . . . . . . . 70
Network (Production) Order . . . . . . . . . . . . . . . . . . . . . . . . . . . . . . . . . . . .73
Reports . . . . . . . . . . . . . . . . . . . . . . . . . . . . . . . . . . . . . . . . . . . . . . . . .73
Recommended Table Joins . . . . . . . . . . . . . . . . . . . . . . . . . . . . . . . . . 79
Network Relationship . . . . . . . . . . . . . . . . . . . . . . . . . . . . . . . . . . . . . . . . . 84
Reports . . . . . . . . . . . . . . . . . . . . . . . . . . . . . . . . . . . . . . . . . . . . . . . . .84
Recommended Table Joins . . . . . . . . . . . . . . . . . . . . . . . . . . . . . . . . . 86
Project Cost . . . . . . . . . . . . . . . . . . . . . . . . . . . . . . . . . . . . . . . . . . . . . . . . .89
Reports . . . . . . . . . . . . . . . . . . . . . . . . . . . . . . . . . . . . . . . . . . . . . . . . .89
Recommended Table Joins . . . . . . . . . . . . . . . . . . . . . . . . . . . . . . . . . 95
PRT Assignment . . . . . . . . . . . . . . . . . . . . . . . . . . . . . . . . . . . . . . . . . . . . 101
Reports . . . . . . . . . . . . . . . . . . . . . . . . . . . . . . . . . . . . . . . . . . . . . . . .101
Recommended Table Joins . . . . . . . . . . . . . . . . . . . . . . . . . . . . . . . . 104
Order Operation . . . . . . . . . . . . . . . . . . . . . . . . . . . . . . . . . . . . . . . . . . . . 109
Reports . . . . . . . . . . . . . . . . . . . . . . . . . . . . . . . . . . . . . . . . . . . . . . . .109
Recommended Table Joins . . . . . . . . . . . . . . . . . . . . . . . . . . . . . . . . 111
SAP Master Data Reports . . . . . . . . . . . . . . . . . . . . . . . . . . . . . . . . . . . . . 115
Data Discovery . . . . . . . . . . . . . . . . . . . . . . . . . . . . . . . . . . . . . . . . . .115
Data Auditing . . . . . . . . . . . . . . . . . . . . . . . . . . . . . . . . . . . . . . . . . . . .129
4 SAP BusinessObjects Project Systems Rapid Mart XI 3.2 for SAP solutions Business Guide
Page 5

Contents
Recommended table joins . . . . . . . . . . . . . . . . . . . . . . . . . . . . . . . . 130
SAP BusinessObjects Project Systems Rapid Mart XI 3.2 for SAP solutions Business Guide 5
Page 6

Contents
6 SAP BusinessObjects Project Systems Rapid Mart XI 3.2 for SAP solutions Business Guide
Page 7
Introduction
chapter
Page 8

Introduction
1
What is a Rapid Mart?
What is a Rapid Mart?
SAP BusinessObjects Rapid Marts packages are blueprints for building data
marts with SAP BusinessObjects technology:
• Data Services
• Universe Designer
• Web Intelligence.
Rapid Marts packages deliver jump-start ETL (extract, transform & load)
mappings, schema, and initial reporting content, accelerating the deployment
of BI (business intelligence) for enterprise applications from SAP, PeopleSoft,
Oracle, and Siebel.
Each Rapid Mart is designed to address the reporting needs of a specific
business area (or department) like accounting, sales, or purchasing. A
component-based framework allows conducting analysis across these
selected business areas by combining different packages within the same
source application suite.
Rapid Marts focus on basic standard configuration of the enterprise
applications. They are country and industry neutral templates meant to be
easily modified and extended to suit customer specific application
implementation and reporting needs.
Rapid Marts incorporate best practices, and provide easily modifiable
templates. With Rapid Marts total development time of a data mart solution is
greatly reduced.
Each customer situation is different. You will probably encounter one or more
of these:
• Customizations you have made to SAP solutions the Rapid Mart does not
cover.
• Standard SAP solutions data fields important for your specific business,
but not included in the Rapid Mart templates.
• Optimization and performance challenges unique to your environment.
• Reporting requirements not covered within the Rapid Mart template
reports.
Rapid Marts are flexible templates that you can adjust to account for these
unique situations. It is expected that some customization and optimization will
be needed to suit your individual environment. Rapid Marts are not an
out-of-the-box solution.
2 SAP BusinessObjects Project Systems Rapid Mart XI 3.2 for SAP solutions Business Guide
Page 9

BI tools and analytic tools can access Rapid Mart data through SQL queries.
Rapid Marts can be implemented individually, or in any combination, to form a
single platform that delivers the infrastructure for your company’s internal and
external information needs. They can also serve as a staging area for
enterprise analytic applications.
Rapid Marts provide your business with an accelerated time to value through
rapid BI deployments because you can implement them quickly and easily
customize them to meet specific analytic requirements.
Rapid Marts packages accelerate Time to Value
Rapid Marts are packaged data solutions that you can quickly deploy to
address specific areas of business analysis.
Available Rapid Marts packages for SAP solutions include:
Financial Suite:
• SAP BusinessObjects General Ledger Rapid Mart, version for SAP
solutions
• SAP BusinessObjects Accounts Payable Rapid Mart, version for SAP
solutions
• SAP BusinessObjects Accounts Receivable Rapid Mart, version for SAP
solutions
• SAP BusinessObjects Cost Center Rapid Mart, version for SAP solutions
Operational Suite:
• SAP BusinessObjects Inventory Rapid Mart, version for SAP solutions
• SAP BusinessObjects Purchasing Rapid Mart, version for SAP solutions
• SAP BusinessObjects Sales Rapid Mart, version for SAP solutions
Manufacturing Suite:
• SAP BusinessObjects Plant Maintenance Rapid Mart, version for SAP
solutions
• SAP BusinessObjects Production Planning Rapid Mart, version for SAP
solutions
• SAP BusinessObjects Project Systems Rapid Mart, version for SAP
solutions
Human Capital Management (HCM) Suite:
• SAP BusinessObjects Human Resources Rapid Mart, version for SAP
solutions
Introduction
What is a Rapid Mart?
1
SAP BusinessObjects Project Systems Rapid Mart XI 3.2 for SAP solutions Business Guide 3
Page 10
Introduction
1
What is a Rapid Mart?
You can combine multiple Rapid Marts packages into a single environment to
build the foundation for your data warehouse or use them as a staging area
for business intelligence applications.
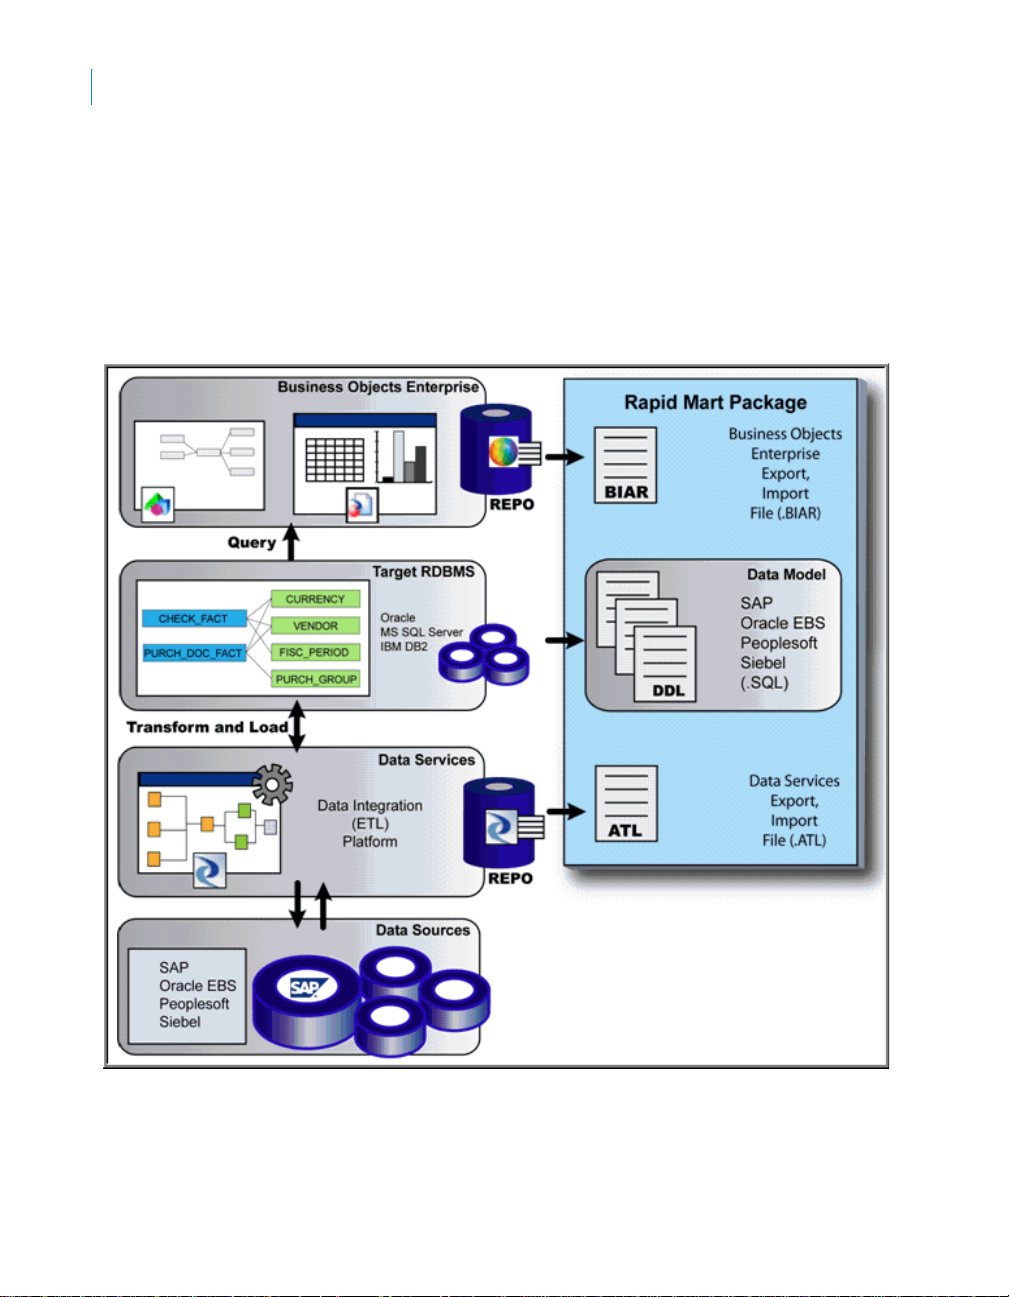
SAP BusinessObjects Rapid Marts packages architecture
Rapid Marts architecture is driven by SAP BusinessObjects technology.
Rapid Mart Architecture:
Rapid Marts packages include the following components:
4 SAP BusinessObjects Project Systems Rapid Mart XI 3.2 for SAP solutions Business Guide
Page 11

Introduction
About this document
• Data Movement Jobs - packaged source-to-target mappings and data
transformations. Each job is designed to perform initial and incremental
data movement;
• Data Model & Schema - set of data mart database objects designed with
dimensional data modeling approach. Rapid Marts packages for SAP
solutions has a single integrated data model. The schema are available
for Oracle, SQL Server IBM DB2, and Teradata;
• Semantic Layer (Universes) - SAP BusinessObjects metadata packages
for efficient query generation. There can be one or more universes per
Rapid Mart. Each universe is developed using Rapid Marts design
principles to ensure compatibility, code readability, and component
re-use. In addition, there is one Master universe for
development/maintenance of multiple use objects (like Customer,
Material, Currency, etc.);
• Reports (Samples) - set of 15-20 Web Intelligence reports per Rapid
Mart. They represent answers to mostly asked business questions (for
example, in the SAP BusinessObjects Sales Rapid Mart, version for SAP
solutions - 'What is the monthly Revenue trend by Division for this
year?'). The reports are developed using Rapid Mart color/layout
templates. Reports are examples of Web Intelligence best practice
development (trends, listing, guided analysis, roll ups and downs, etc.).
1
About this document
This document describes the SAP BusinessObjects Project Systems Rapid
Mart, version for SAP solutions. This document contains information for a
variety of users—information that helps you understand the use of the Rapid
Mart, the data in the Rapid Mart, the reports you can create with the Rapid
Mart, and how to use and update the Rapid Mart.
This document contains the following chapters:
• Chapter 2: Overview — Describes the business problems you can solve
and the types of analyses you can do with this Rapid Mart
• Chapter 3: Subject Areas — Contains detailed information about each
componentized section in the Rapid Mart, including the processes each
section captures
• Chapter 4: Reports — Provides examples of reports you can produce
SAP BusinessObjects Project Systems Rapid Mart XI 3.2 for SAP solutions Business Guide 5
Page 12

Introduction
1
About this document
6 SAP BusinessObjects Project Systems Rapid Mart XI 3.2 for SAP solutions Business Guide
Page 13
Overview
chapter
Page 14

Overview
2
Overview
Overview
This chapter describes the business problems you can solve with the SAP
BusinessObjects Project Systems Rapid Mart, version for SAP solutions and
the types of analyses you can do with this Rapid Mart. The information in this
chapter is useful for those who want a business-level overview of the Rapid
Mart and its benefits.
This chapter contains the following sections:
• What you can do with this Rapid Mart
• Supported analyses
• Related Rapid Marts
• Project Systems Rapid Mart schema
• Where the Rapid Mart fits in Project Activities
What you can do with this Rapid Mart
The SAP BusinessObjects Project Systems Rapid Mart, version for SAP
solutions supports analysis of project information entered within the Project
System (PS) module. Both large scale projects, such as building a factory,
and small-scale projects, such as organizing a trade fair, require precise
planning of the many detailed activities involved. The project manager has
the job of ensuring that the project is executed efficiently, on time, and within
budget - which he or she achieves by ensuring that the required resources
and funds are available as and when needed. The SAP BusinessObjects
Project Systems Rapid Mart, version for SAP solutions provides a framework
for monitoring projects progress, resources, costs and revenue.
The SAP BusinessObjects Project Systems Rapid Mart, version for SAP
solutions is made up of several componentized sections. Each section
supports a subject related to project analysis:
• Milestone Section — In general milestones are used to mark the
transition between various phases or departments. You can also use
Milestones for other tasks and functions in the Project System. You can
create milestones for activities and WBS elements. They can be used for
the following tasks:
• Milestone Trend Analysis
• Earned Value Analysis
• Billing Plan
8 SAP BusinessObjects Project Systems Rapid Mart XI 3.2 for SAP solutions Business Guide
Page 15

Overview
What you can do with this Rapid Mart
• Network Order Section — A network can represent the sequence of
activities in a project or the sequence of a single activity within a project.
You can graphically display various structural elements of a project and
their interdependencies in the Project System.
The essential components of a network are stored as Network Orders in
SAP solutions. The network order is a category of internal order. The
Activities of the network order are analogous to the operations on the
internal order.
• Network Relationship Section — There is usually a reason for a
specific sequence of activities in a network. For example, there may be
technical dependencies between individual activities. These
dependencies are represented by relationships in which one activity is
the predecessor or the successor of another activity.
• Project Cost Summary Section — You use Project Costing to plan,
monitor, and control project costs, thereby achieving comprehen sive cost
accounting.
Project Costing features include:
• Cost planning in various degrees of detail
• Automatic cost calculation wherever there are price and quantity
structures
• Funds management, effected by means of budget allocation
• Integration of project costs with Enterprise Controlling, such as
reconciliation with cost center accounting
• PRT Assignment Section — Unlike machines and fixed assets,
production resources and tools (PRTs) are movable (not stationary)
operating resources that are required to perform an activity and can be
used repeatedly. For example, PRTs include documents, engineering
drawings, and measurement instruments.
Chapter 3: Subject Areas discusses each of these sections in more detail and
how to link them together for a complete Project System Analysis solution.
2
SAP BusinessObjects Project Systems Rapid Mart XI 3.2 for SAP solutions Business Guide 9
Page 16

Overview
2
Supported analyses
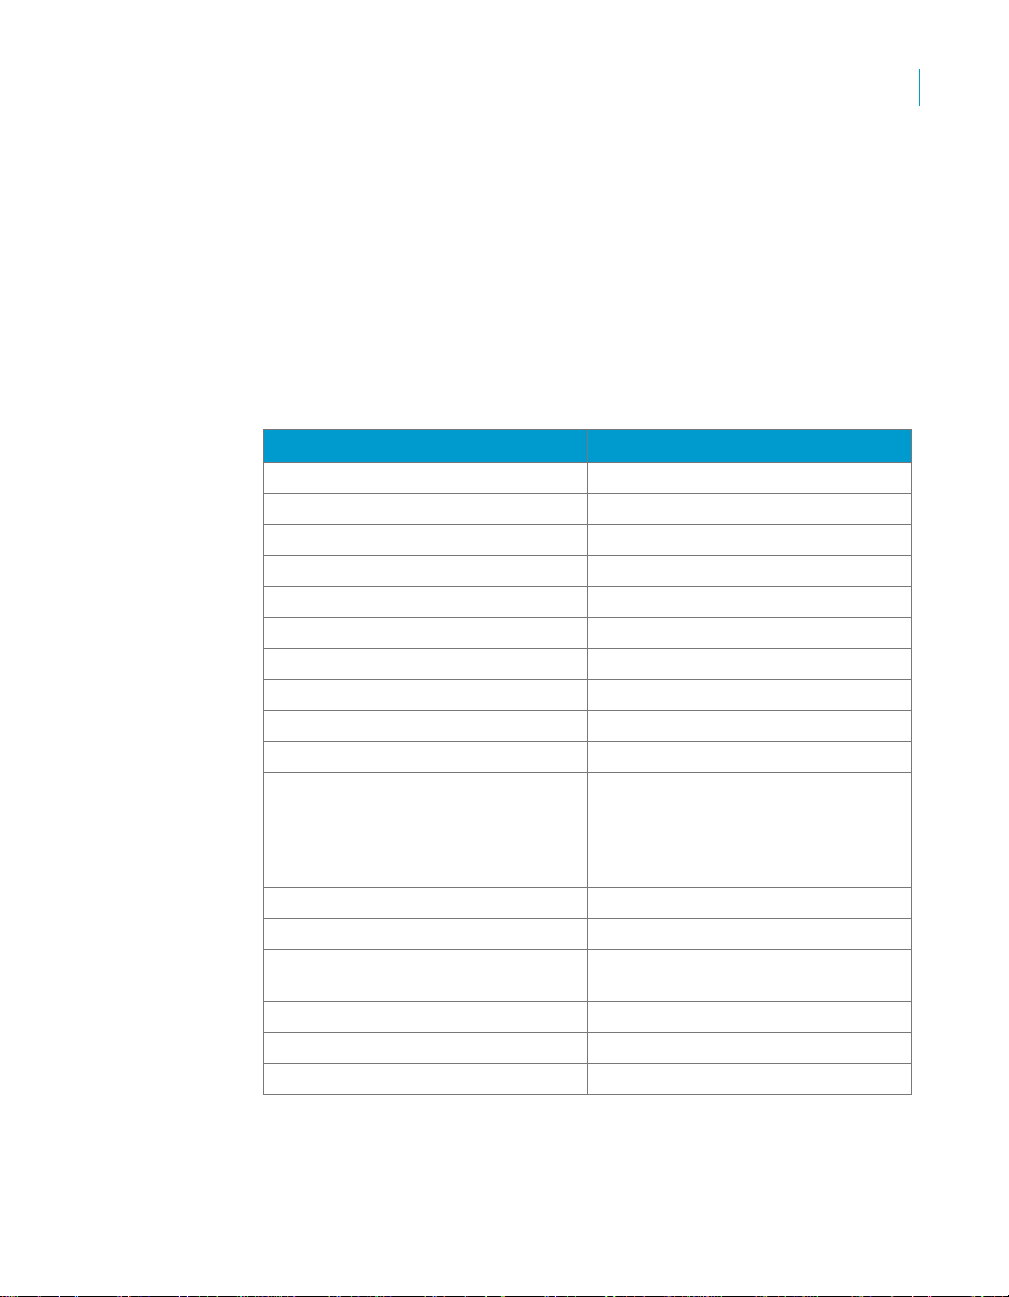
Supported analyses
The SAP BusinessObjects Project Systems Rapid Mart, version for SAP
solutions supports several types of analyses:
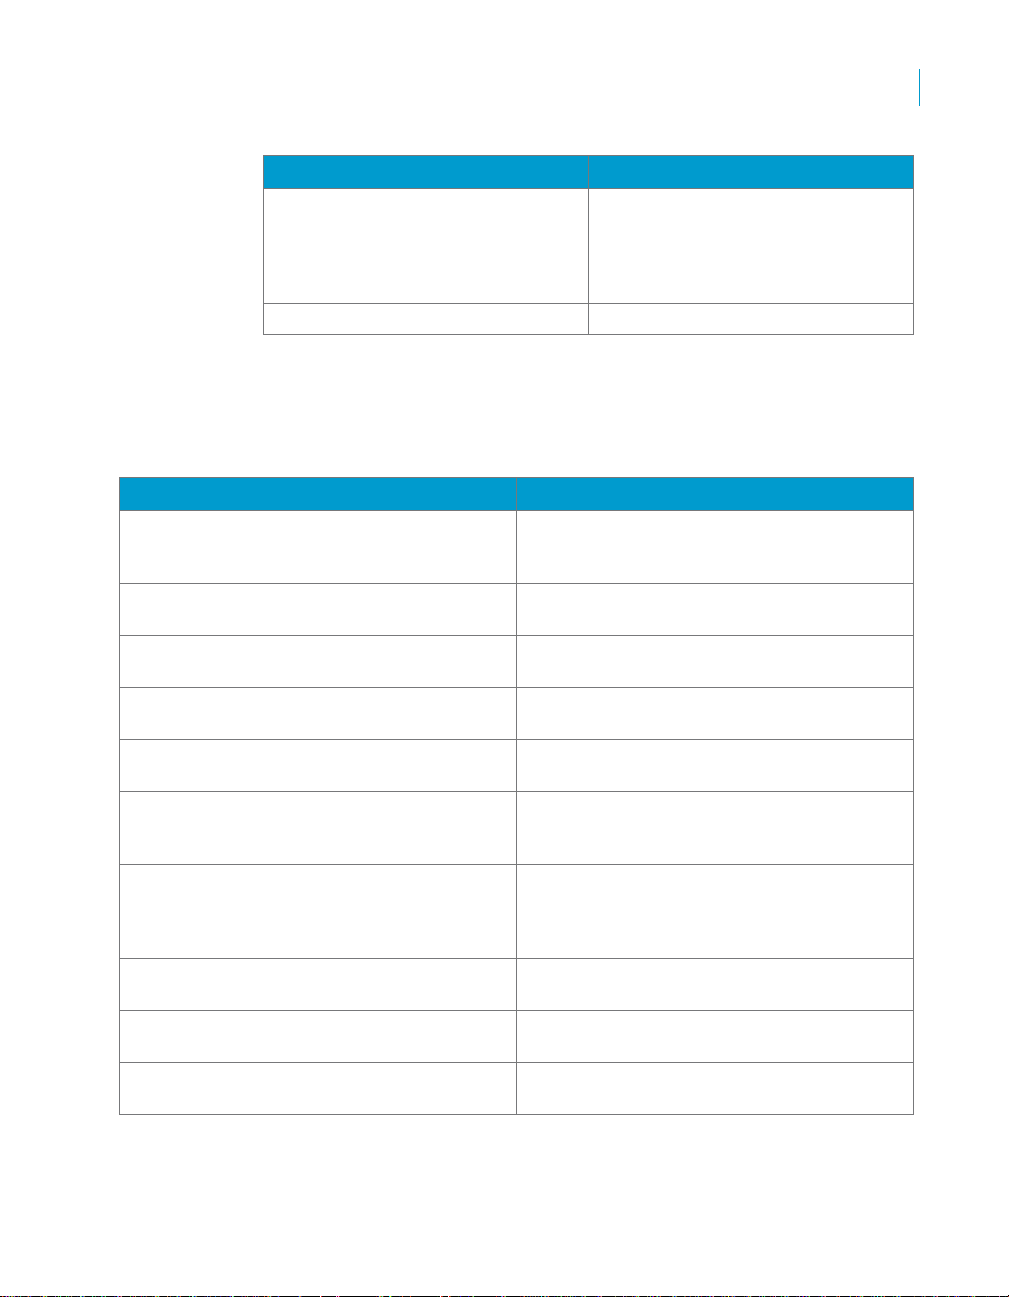
Business function Types of analysis Details available in the
Rapid Mart
Project Costing Project Balance Trend
Comparison
Project Balance Trend by
Period
Project Balance Variance
Trend
Project Cost YTD Trend
Analysis
Project Cost Period
Comparison
Displays the project balance
trend data for the selected
Company Code, Fiscal
Years, and Parent Project
Element.
View actual project balance
period trends for the
selected Company Code,
Parent Project Element, and
Fiscal Year-Period range.
Results are grouped by
Project Element Hierarchy
View Actual, Planned (or
Budget), Variance, and
Variance% period trends for
a specific Company Code,
Parent Project Element,
Fiscal Year, and Ledger
Version.
View Actual YTD trends for
a specific Company Code,
Parent Project Element,
Fiscal Year, and Ledger
Version.
View Actual, Planned (or
Budget), Variance Project
Element hierarchy
comparison for selected
Fiscal Year-Periods and
Ledger Version.
10 SAP BusinessObjects Project Systems Rapid Mart XI 3.2 for SAP solutions Business Guide
Page 17

Overview
Supported analyses
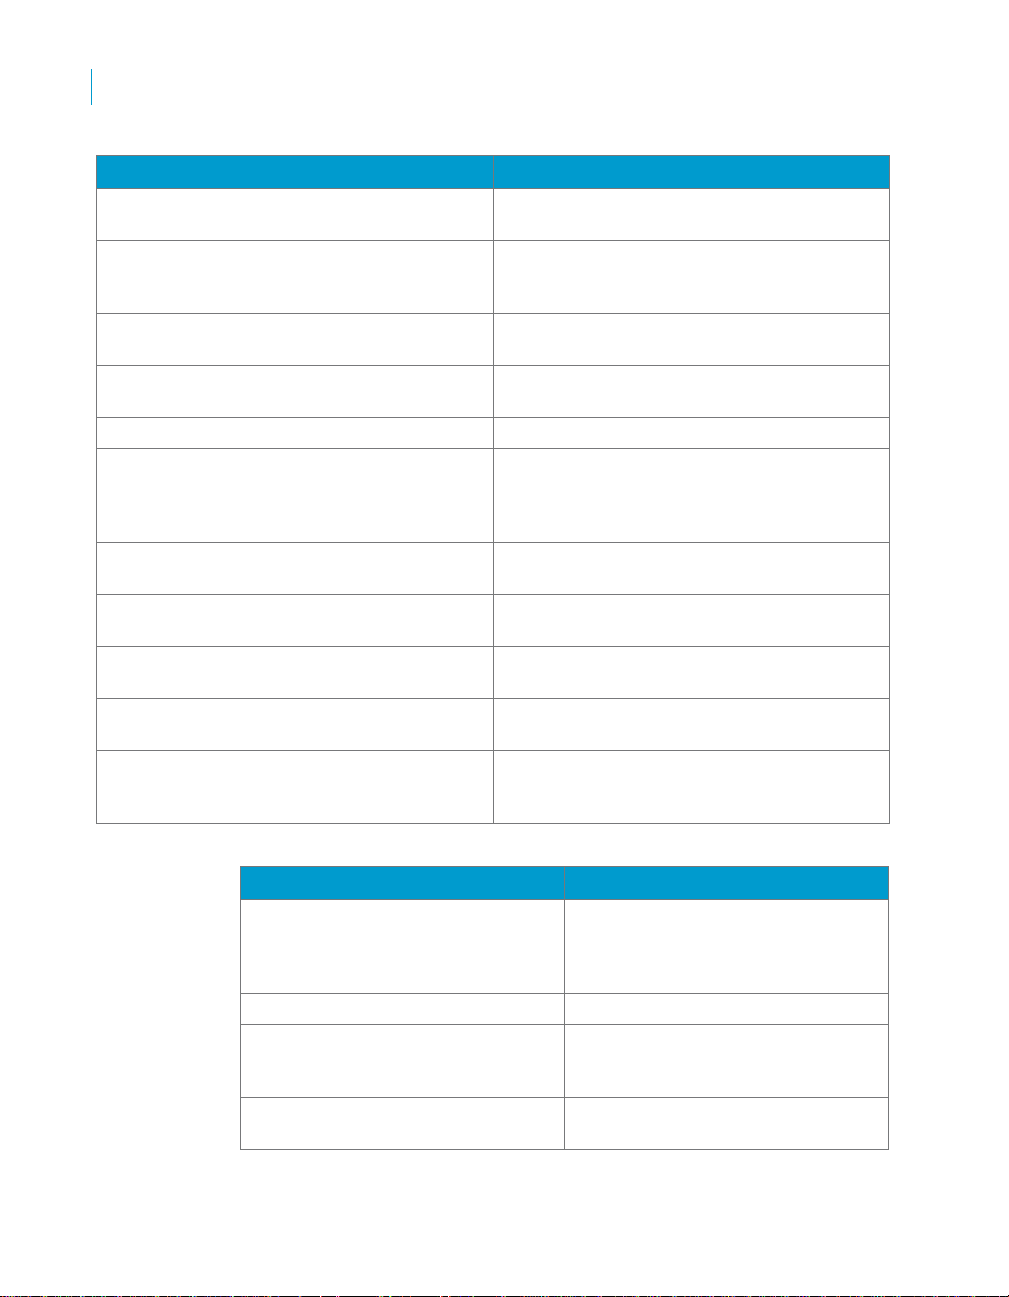
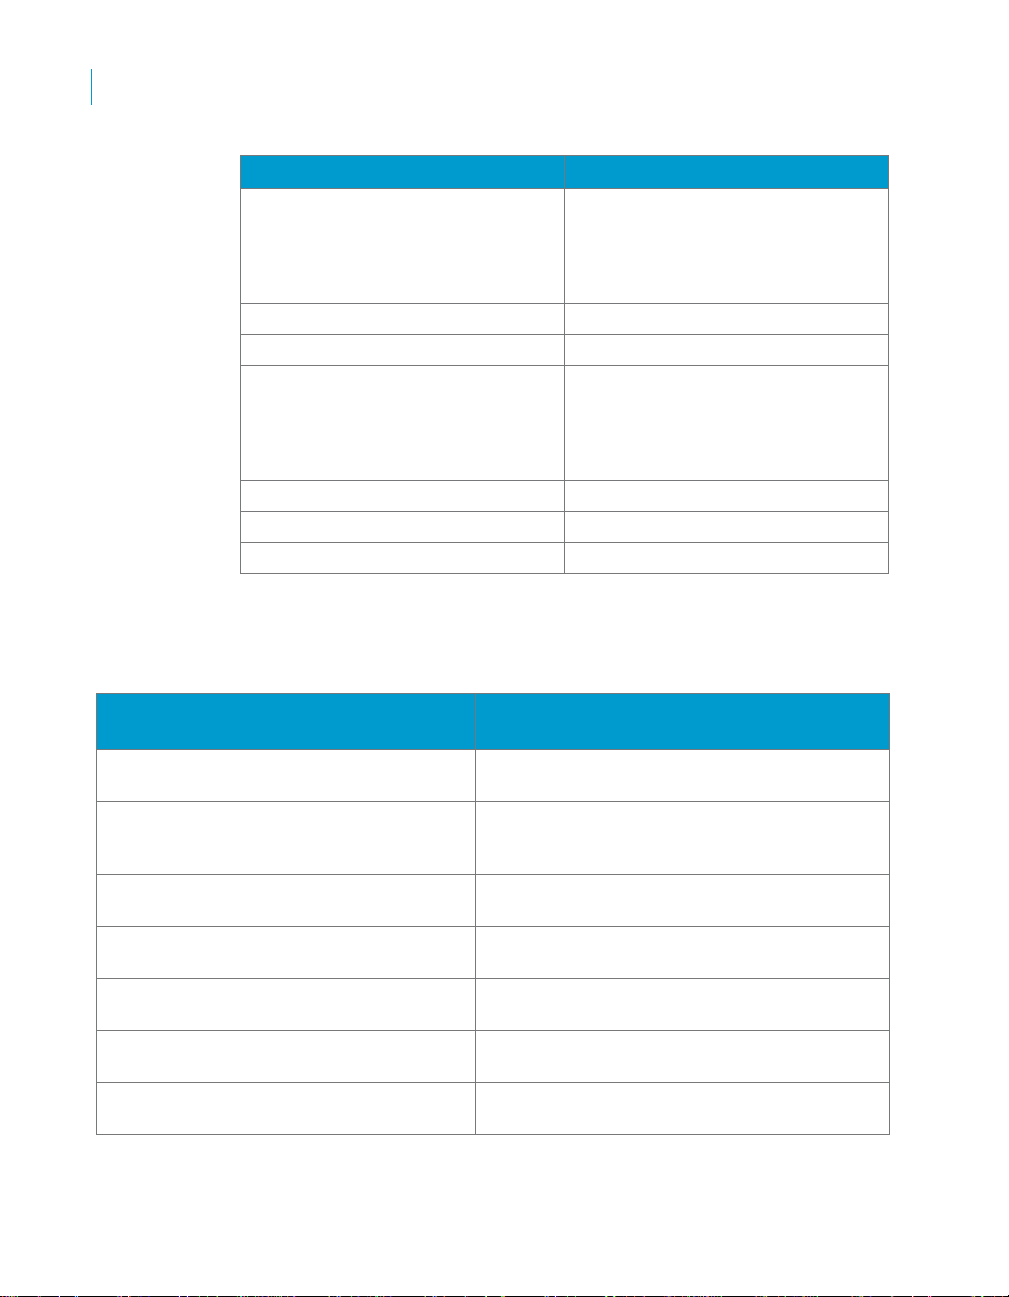
Business function Types of analysis Details available in the
Rapid Mart
Network Orders (Project
Orders)
Milestones Milestone Overview Displays Milestone
Network Relationships Network Relationship
Production Resource & Tools
(PRT)
Activity (Project Order
Operations)
Network Order Details View network (production)
order listing, network order
details, and trend by
Business Area for the
selected Plant and Calendar
Year.
Network Order Analysis View network (production)
order analysis for selected
Plant and Calendar Year.
View Summary, Trend by
Business Area, and Top 10
Materials.
information for the selected
Project (and Project
Elements).
Milestone Statistics View Milestone performance
statistics by Plant for the
selected Company Code.
View Network Relationship
Overview
PRT Assignment Listing View PRT assignments for
PRT Details View PRT details for the
Project Structure (Activity)
Planning
overview for the selected
Project (or Network - also
called Internal Order Id) and
Operation Numbers (also
called Activities).
the selected Operation
Routing Id.
selected PRT (by PRT
Name).
View project structure for
the selected Project Id.
2
SAP BusinessObjects Project Systems Rapid Mart XI 3.2 for SAP solutions Business Guide 11
Page 18

Overview
2
Related Rapid Marts
Dimensions available to support these analyses
Reporting dimensions available in the Rapid Mart include project, project
element, project element hierarchies, operations, work centers, capacities,
material master data, plant, storage location, currency, account assignment,
and time-related dimensions such as fiscal period, calendar date, month, and
quarter.
Related Rapid Marts
Components of the SAP BusinessObjects Project Systems Rapid Mart,
version for SAP solutions are related to other SAP BusinessObjects Rapid
Mart components, as follows:
• External procurement information, from purchase requisitions to
purchase orders, is included in the Purchasing SAP BusinessObjects
Purchasing Rapid Mart, version for SAP solutions.
• Revenue information resulting from sales orders can be found in the
Sales Analysis SAP BusinessObjects Sales Rapid Mart, version for SAP
solutions.
• Cost Center & Cost Element Accounting information is included in the
Cost Center SAP BusinessObjects Cost Center Rapid Mart, version for
SAP solutions.
Components shared with other SAP BusinessObjects Rapid Marts
The same components can be used in multiple Rapid Marts. For example, a
component that extracts information about materials bought, produced, and
sold is needed for a Rapid Mart that supports sales analysis and also for a
Rapid Mart that supports inventory analysis. Work flows that extract star
schema “dimensions” are components. You can add a component to any
Rapid Mart using a simple import procedure.
A Data Services job can include multiple instances of a component. For
example, each section includes all the required dimension components.
Therefore, a job with several sections may include several instances of a
particular dimension component. Components are set to execute only once
within a job. This “execute once” feature ensures that shared components do
not cause duplicate data extraction from SAP solutions. For more information
about the “execute once” feature, see the Data Integrator/Data Services
Designer Guide.
12 SAP BusinessObjects Project Systems Rapid Mart XI 3.2 for SAP solutions Business Guide
Page 19

Overview
Related Rapid Marts
Each of the sections listed in “What you can do with this Rapid Mart” on
page 8 are considered components. You can identify a component within a
Data Services job by a “C_” prefix before its name. For example, the
component that contains PRT (Project Resource / Tools) Assignments and
the associated reporting dimensions is named
C_PRTAssignmentSection_SAP.
2
SAP BusinessObjects Project Systems Rapid Mart XI 3.2 for SAP solutions Business Guide 13
Page 20
Overview
2
Project Systems Rapid Mart schema
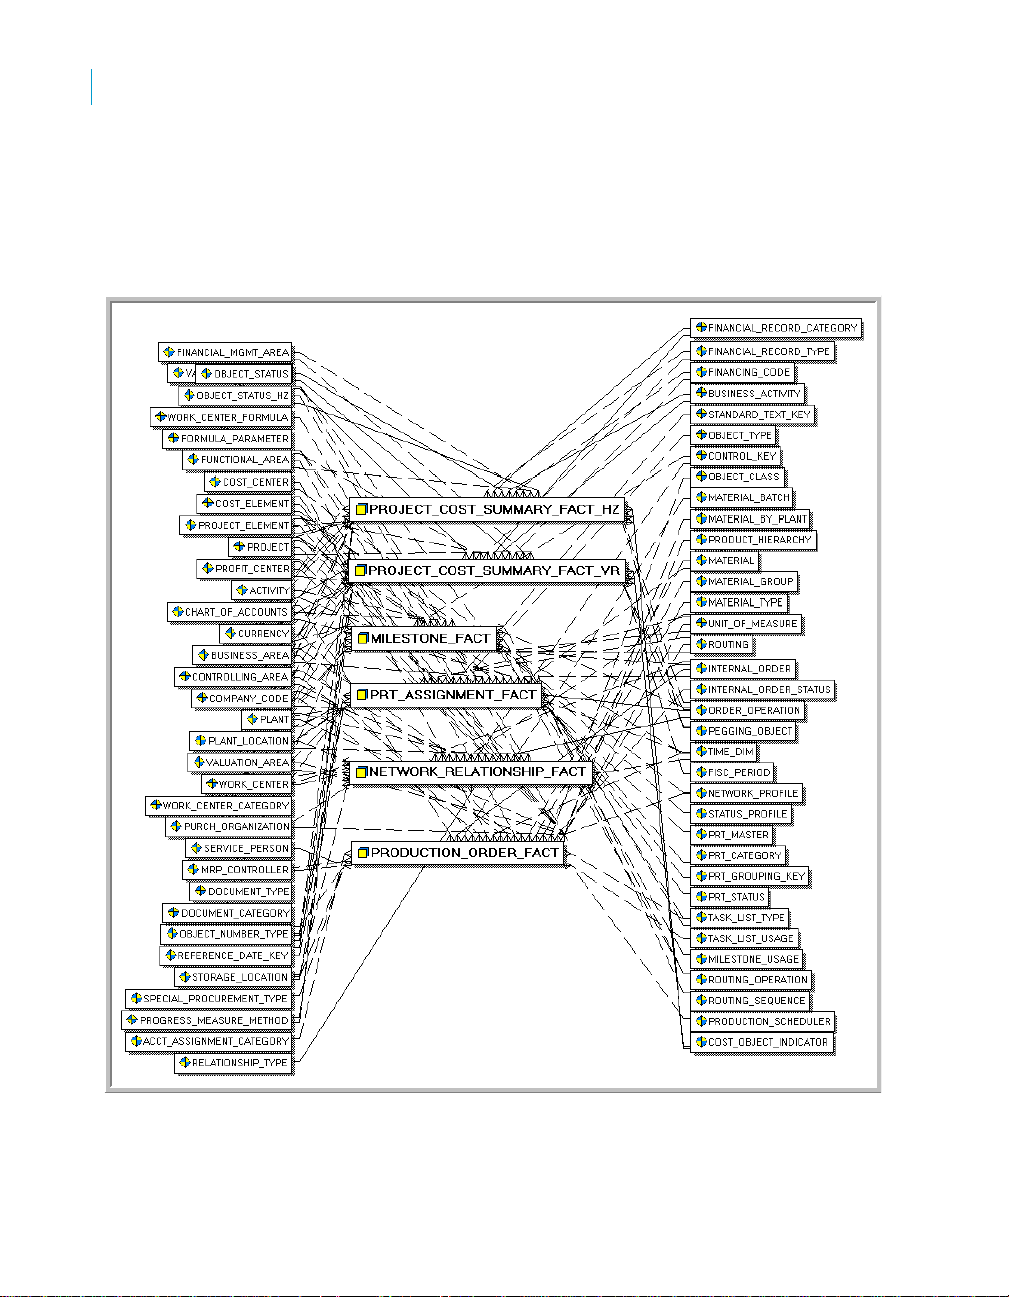
Project Systems Rapid Mart schema
The following diagram shows an overview of the SAP BusinessObjects
Project Systems Rapid Mart, version for SAP solutions presented as a Star
Schema.
14 SAP BusinessObjects Project Systems Rapid Mart XI 3.2 for SAP solutions Business Guide
Page 21
Overview
Project Systems Rapid Mart schema
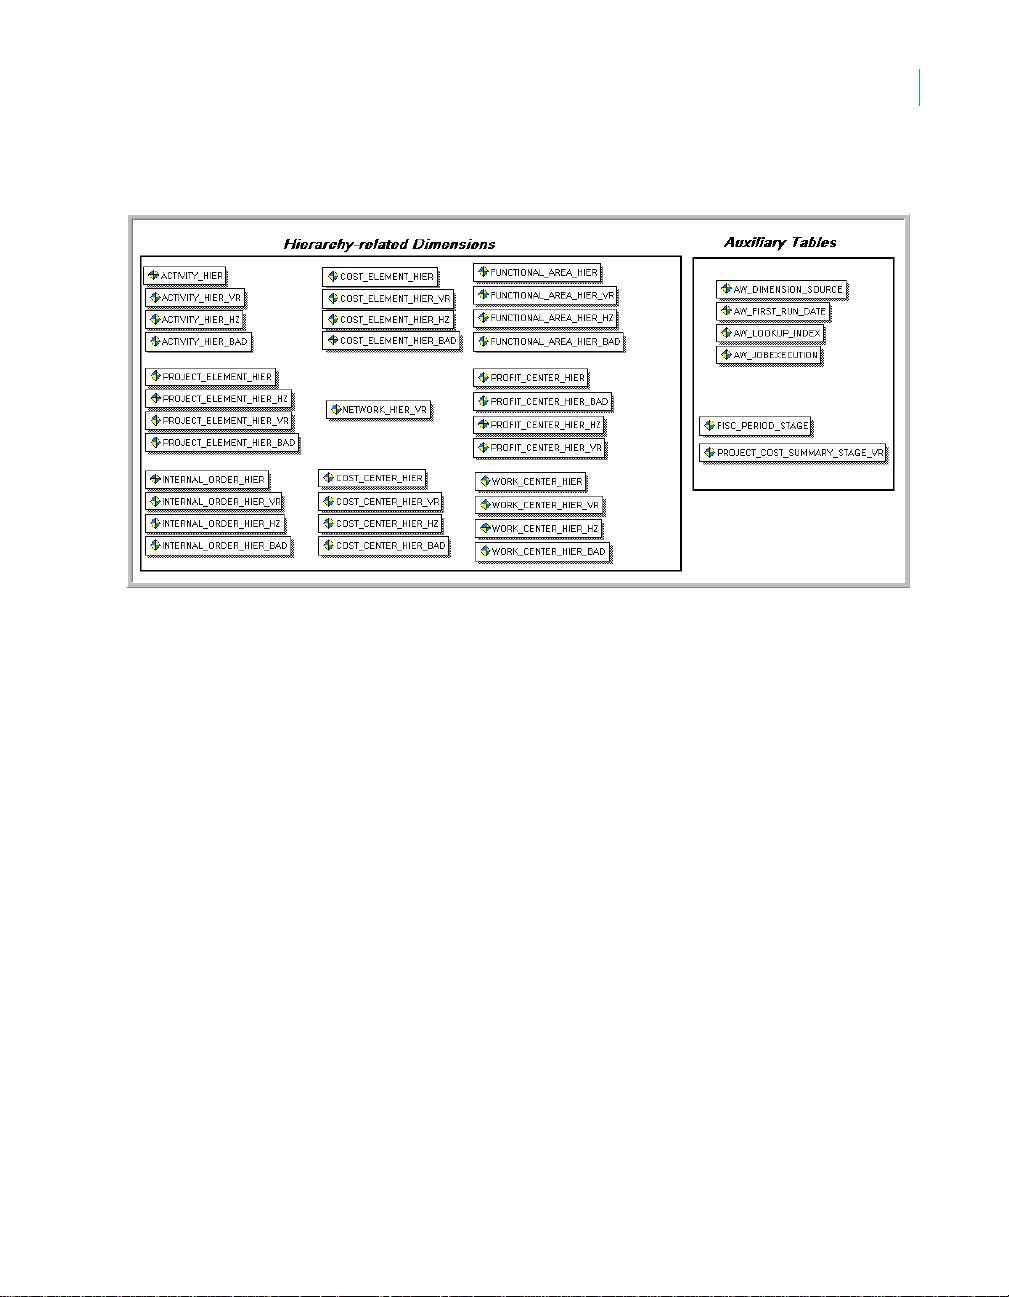
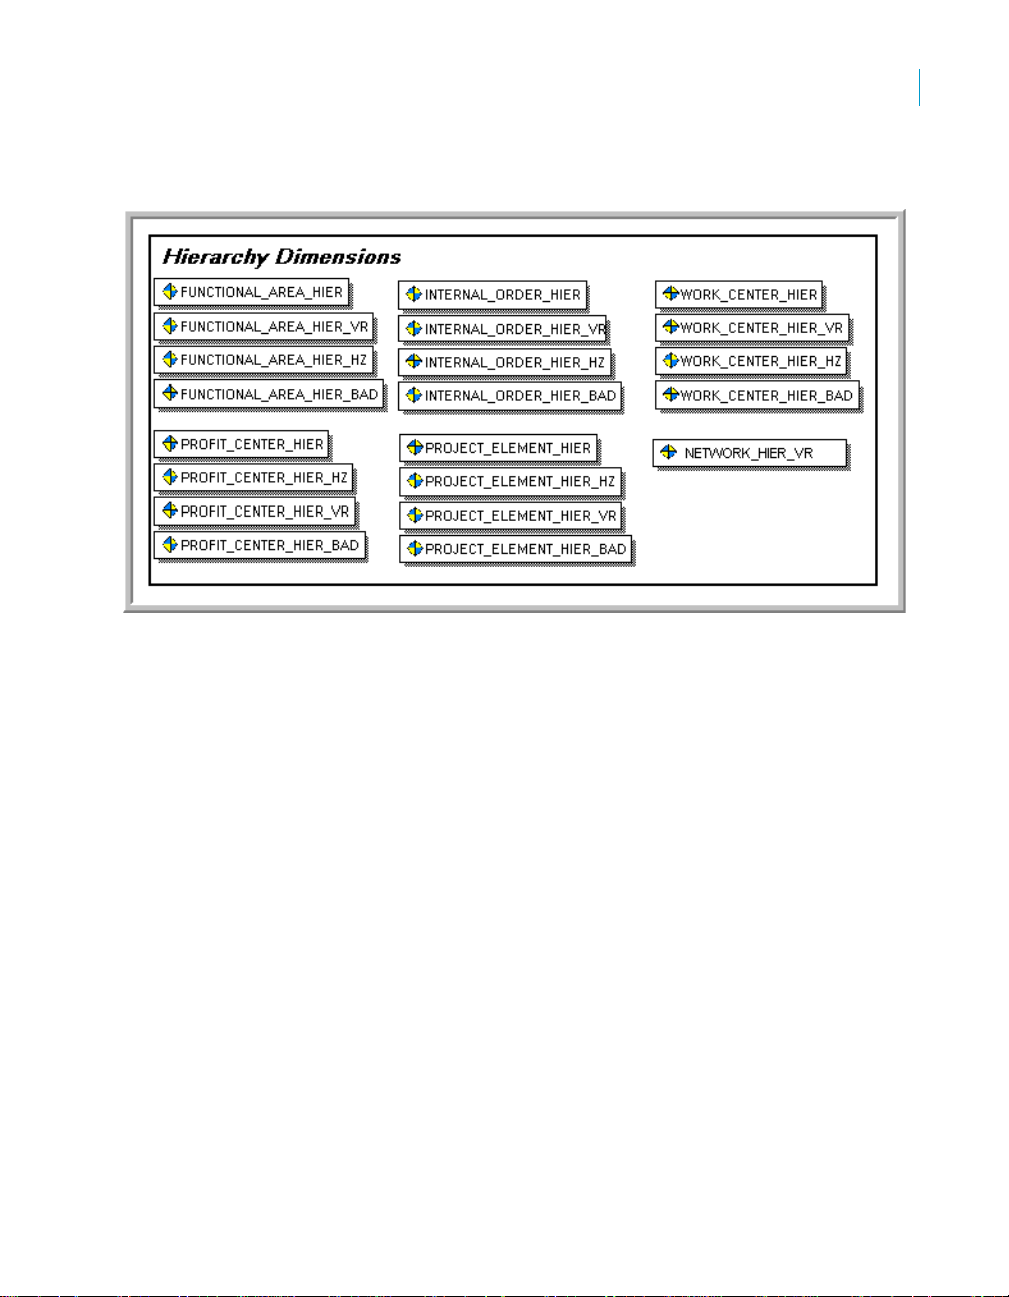
The additional diagram shows the associated hierarchy and auxiliary tables
used by the Rapid Mart.
The following chapter describes each component and reporting dimensions in
more detail.
2
SAP BusinessObjects Project Systems Rapid Mart XI 3.2 for SAP solutions Business Guide 15
Page 22
Overview
2
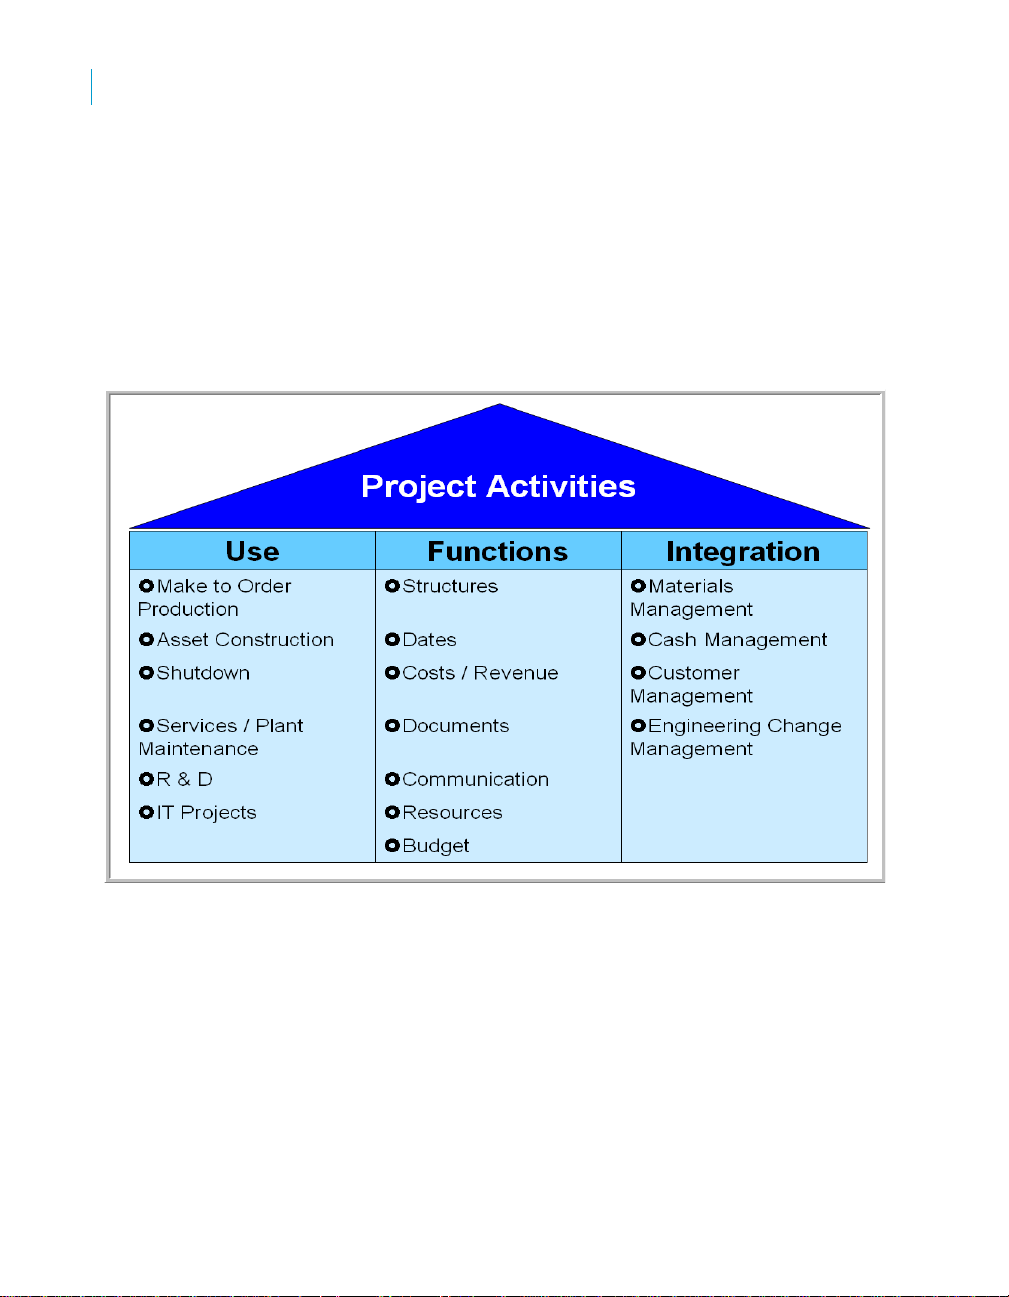
Where the Rapid Mart fits in Project Activities
Where the Rapid Mart fits in Project
Activities
The SAP BusinessObjects Project Systems Rapid Mart, version for SAP
solutions gives an overview of the functions and processes in SAP solutions
designed to support your Project related activities. It is intended for
decision-makers and personnel involved in developing and implementing
projects throughout your enterprise.
16 SAP BusinessObjects Project Systems Rapid Mart XI 3.2 for SAP solutions Business Guide
Page 23

Subject Areas
chapter
Page 24

Subject Areas
3
Overview
Overview
Each section in the SAP BusinessObjects Project Systems Rapid Mart,
version for SAP solutions pertains to a particular subject area. This chapter
describes each section and the processes each section captures. But first,
additional section “Projects (PS) Module Overview” defines the scope and
basic functionality within the SAP solutions Project System (PS) module
The information in this chapter is useful for readers who use the Rapid Mart to
design and support a real-time system, such as a Web application, and need
to understand the data in the Rapid Mart and how it relates to SAP solutions.
This chapter discusses:
• Projects (PS) Module Overview
• Milestone Section
• Network Order Section
• Network Relationship Section
• Project Cost Summary Section
• PRT Assignment Section
Projects (PS) Module Overview
Both large scale projects, such as building a factory, and small-scale projects,
such as organizing a trade fair, require precise planning of the many detailed
activities involved. The project manager has the job of ensuring that the
project is executed efficiently, on time, and within budget - which he or she
achieves by ensuring that the required resources and funds are available as
and when needed.
Projects are generally part of the internal processes of a comp any. To be able
to control all tasks in project execution, you need an organizational form that
is specific to the project and which is shared by all departments involved.
Before you can carry out a project in its entirety, the project goals must be
precisely described and the project activities to be carried out must be
structured. A clear, unambiguous project structure is the basis for successful
project planning, monitoring, and control.
You structure your project per the following points of view:
• By structures, using a work breakdown structure (WBS)
• By process, using individual activities (work packages)
Project managers usually distinguish between two types of project:
• Externally financed projects
18 SAP BusinessObjects Project Systems Rapid Mart XI 3.2 for SAP solutions Business Guide
Page 25

Subject Areas
Projects (PS) Module Overview
• Customer projects
• Internally financed projects
• Overhead cost projects
• Capital investment projects
The high degree of integration between the Project System (PS) and other
application components means that you can plan, execute, and account for
projects as part of your normal commercial procedures. This means the
Project System has constant access to data in all the departments involved in
the project.
The Project System guarantees close and constant monitoring of all aspects
of your project. This includes both technical and commercial aspects of the
project.
Each project starts with the definition and classification of the structures
required for processing and the incorporation of these into the existing
enterprise structure.
The Project System has no organizational structures of its own; you
incorporate it into the existing structure by making assignments to the
organizational units in Accounting and Logistics. It is this which enables the
Project System to present data clearly and in many different ways.
3
SAP BusinessObjects Project Systems Rapid Mart XI 3.2 for SAP solutions Business Guide 19
Page 26
Subject Areas
3
Projects (PS) Module Overview
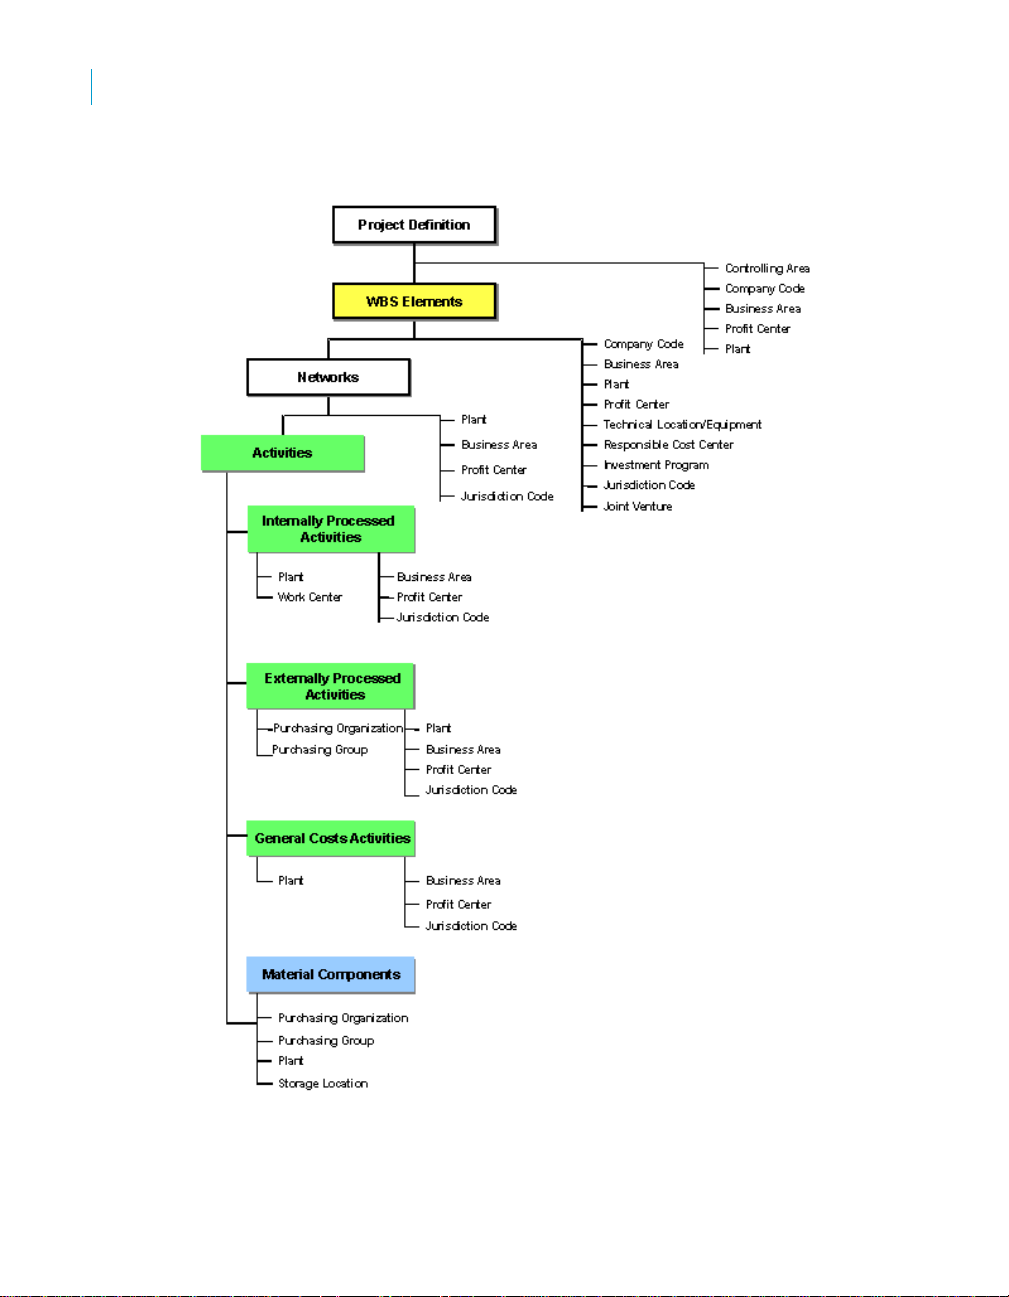
Project Structure Overview
20 SAP BusinessObjects Project Systems Rapid Mart XI 3.2 for SAP solutions Business Guide
Page 27

Subject Areas
Projects (PS) Module Overview
In the Rapid Mart, the various components of project structure are
represented:
• Projects - are represented in the Project Dimension.
• WBS Elements - are represented by the Project Element Dimension and
Project Element Hierarchy.
• Networks - are represented by Network Orders
• Activities - are represented by the Order Operations Dimension
• Material Components - are represented by the Material Dimension and
Material by Plant Dimension
• Many of the other items shown in the graphic above are also dimensions,
such as:
• Profit Center
• Company Code
• Business Area
• Plant
• Storage Location
• etc.
Additional Information on the more important components is given below:
3
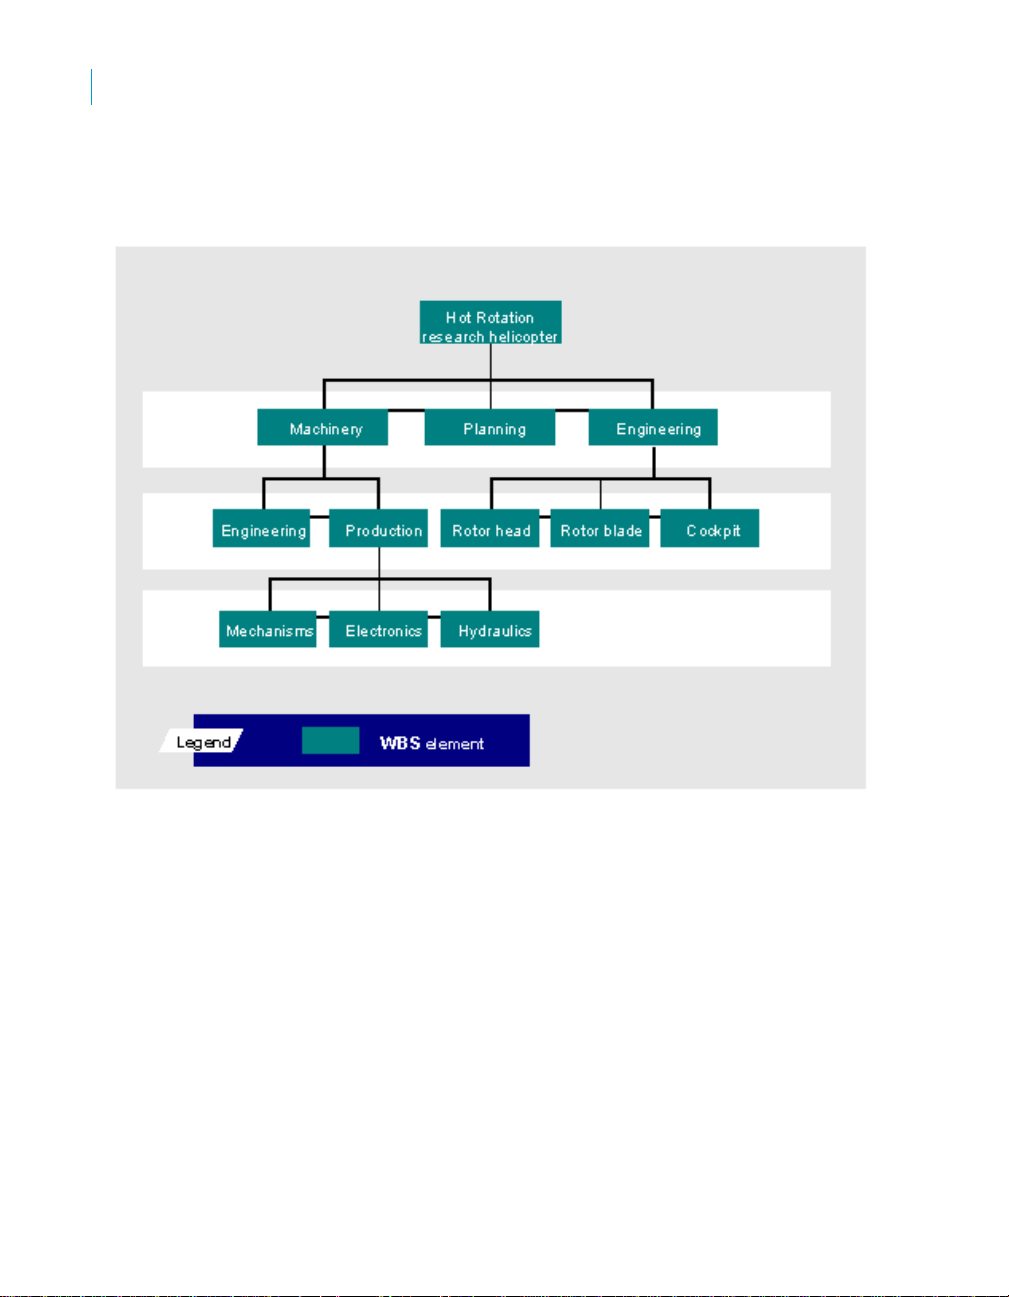
Work Breakdown Structure / Project Elements
The Work Breakdown Structure (WBS) is a model of the work to be performed
in a project organized in a hierarchical structure. These are also called the
Project Elements. The WBS is an important tool which helps you keep an
overview of the project:
• It forms the basis for organization and coordination in the project.
• It shows the amount of work, the time required, and the costs involved in
the project.
It is the functional basis for further planning steps in a project, such as
process planning, cost planning, scheduling, date and capacity planning, or
costing, as well as project control. The project structure can be represented
according to different criteria:
• By phase (logic-oriented)
• By function (function-oriented)
• By object (object-oriented)
In a work breakdown structure (WBS), you describe the individual tasks and
activities in the project as individual elements in a hierarchy.
SAP BusinessObjects Project Systems Rapid Mart XI 3.2 for SAP solutions Business Guide 21
Page 28
Subject Areas
3
Projects (PS) Module Overview
Depending on the phase of your project, you continue to break down the
tasks and activities in your project, step-by-step, until you reach the level of
detail necessary to carry it out.
The individual elements represent activities within the work breakdown
structure. The elements are called work breakdown structure elements (WBS
Elements) in the Project System. WBS elements can be:
• Tasks
• Partial tasks which are subdivided further
• Work packages
Networks
A network can represent the sequence of activities in a project or the
sequence of a single activity within a project. You can graphically display
various structural elements of a project and their interdependencies in the
Project System.
22 SAP BusinessObjects Project Systems Rapid Mart XI 3.2 for SAP solutions Business Guide
Page 29
Subject Areas
Projects (PS) Module Overview
The essential components of a network are stored as Network Orders in SAP
solutions. The network order is a category of internal order. The Activities of
the network order are analogous to the operations on the order.
The essential components of a network are:
• Activities
• Relationships between the activities
• Activities
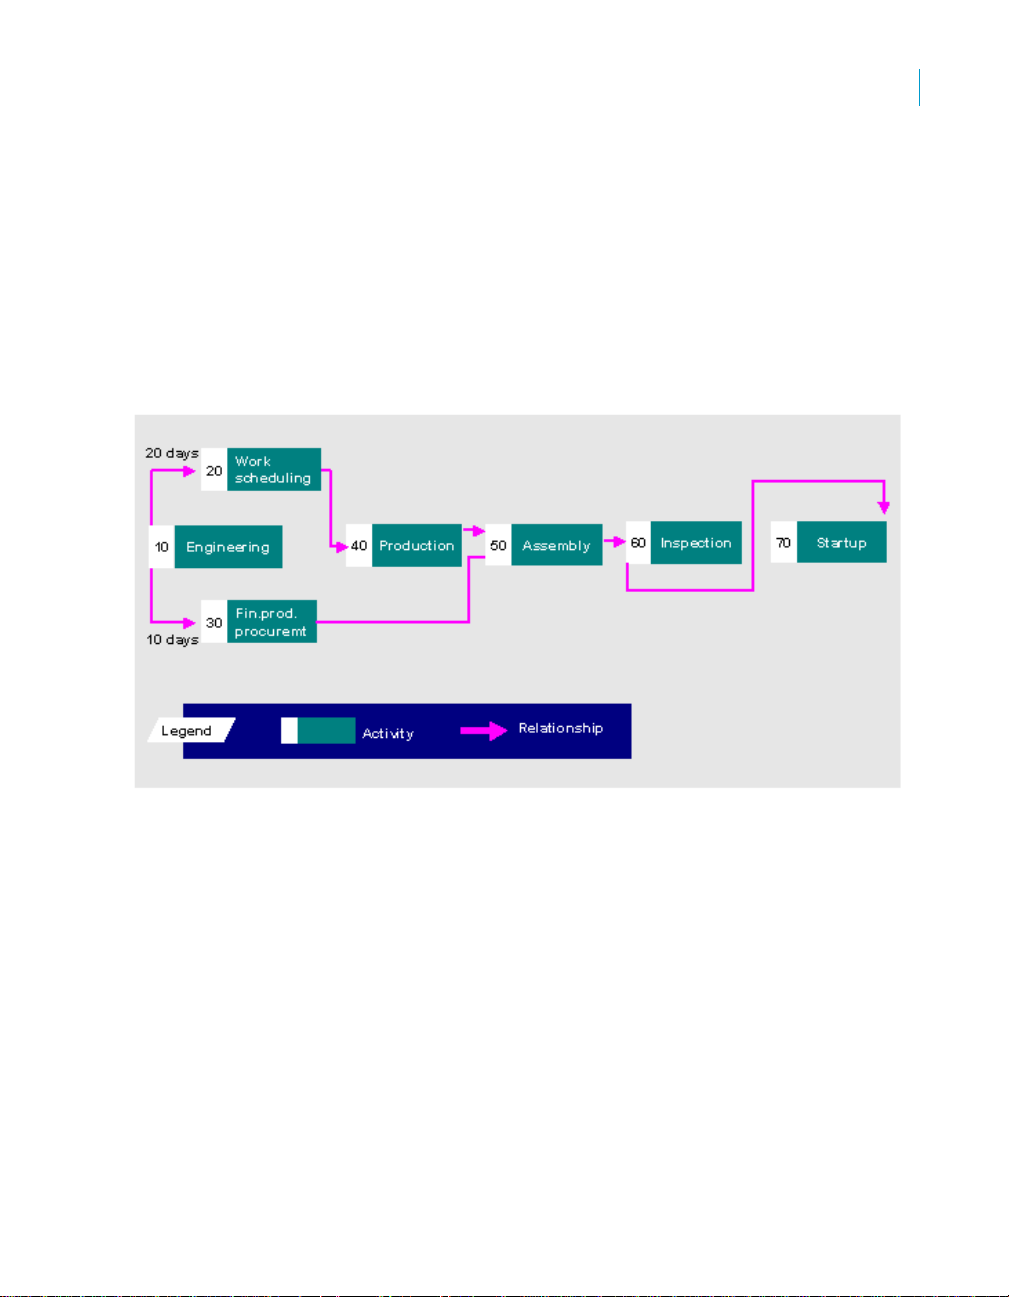
The following graphic shows you a network with activities and the different
types of relationships.
3
Activities
These are analogous to the operations on a network order. The most
important data describing an Activity in the Project System are:
• Work center in which the activity is to be carried out
• Duration of the activity
• Start and finish dates for the activity
• Resources required to carry out the activity
• Texts and documents describing the activity
SAP BusinessObjects Project Systems Rapid Mart XI 3.2 for SAP solutions Business Guide 23
Page 30

Subject Areas
3
Projects (PS) Module Overview
Network Relationships
There is usually a reason for a specific sequence of activities in a network.
For example, there may be technical dependencies between individual
activities. These dependencies are represented by relationships in which one
activity is the predecessor or the successor of another activity.
The relationship type specifies how the individual activities are linked with
each other:
• Finish - Start (FS) Relationship: Relationship between the finish of one
activity and the start of its successor.
• Start - Start (SS) Relationship: Relationship between the start of one
activity and the start of its successor.
• Finish - Finish (FF) Relationship: Relationship between the finish of
one activity and the finish of its successor.
24 SAP BusinessObjects Project Systems Rapid Mart XI 3.2 for SAP solutions Business Guide
Page 31

Projects (PS) Module Overview
• Start - Finish (SF) Relationship: Relationship between the start of one
activity and the finish of its successor.
in the Rapid Mart, these are represented in the Network Relationships
section.
Production Resource Tools (PRT) Assignments
Unlike machines and fixed assets, production resources and tools (PRTs) are
movable (not stationary) operating resources that are required to perform an
activity and can be used repeatedly. For example, PRTs include documents,
engineering drawings, and measurement instruments.
You can assign production resources/tools to internal and external activities.
You use the assignment to determine:
• The quantity
• The operating time
• The dates
of the PRTs required to carry out the activity.
There are several categories of production resources and tools in the SAP
solutions system. The category determines the characteristics and business
functions that a PRT can have. You can create production resources/tools
with the following categories:
• Material PRT - A material PRT has its own material master record with
the view “PRT”. A material PRT can be procured, that is, it can either be
purchased or produced. You can also keep it in stock and track both its
value and quantity.
• Miscellaneous PRT - A miscellaneous PRT has its own PRT master
record and can neither be procured nor kept in stock.
Subject Areas
3
SAP BusinessObjects Project Systems Rapid Mart XI 3.2 for SAP solutions Business Guide 25
Page 32

Subject Areas
3
Projects (PS) Module Overview
•
• Equipment PRT - An equipment PRT has its own equipment master
Milestones
In general milestones are used to mark the transition between various phases
or departments. You can also use Milestones for other tasks and functions in
the Project System. You can create milestones for activities and WBS
elements. They can be used for the following tasks:
• Milestone Trend Analysis (MTA) - a simple and effective method of
• Earned Value Analysis - using the milestone technique. Each milestone
• Billing Plan - A milestone is linked with a date in the billing plan. When
Document PRT - A document PRT has its own document info record,
(for example engineering drawings or NC programs).You can manage
these PRTs using the SAP solutions document management.
Note: In the Project System you can assign documents directly to
activities. Consequently you will not use this type of PRT very often.
record and has the full equipment functionality. This category is
particularly useful for those production resources or tools which you must
maintain yourself or which must be serviced at regular intervals. With the
equipment category, you can furnish proof of service or usage values for
the production resource/tool.
controlling dates in a project. The milestone dates on different report
dates are compared. In the graphical MTA chart you recognize trends
and delays immediately.
represents the portion of the work that is completed in an activity or in a
WBS element.
the milestone is reached, the actual date of the milestone is copied into
the billing plan.
Project Costing
You use this component to plan, monitor, and control project costs, thereby
achieving comprehensive cost accounting. The component is thoroughly
integrated with other components, such as:
• CO - Controlling
• FI - Financial Accounting
• PP - Production Planning and Control
• MM - Materials Management
The component contains the following functions:
• Cost planning in various degrees of detail
26 SAP BusinessObjects Project Systems Rapid Mart XI 3.2 for SAP solutions Business Guide
Page 33

• Automatic cost calculation wherever there are price and quantity
structures
• Funds management, effected by means of budget allocation
• Integration of project costs with Enterprise Controlling, such as
reconciliation with cost center accounting
In the Rapid Mart, the Project Costing Section details the costs associated
with a project.
Milestone Section
Milestones are used in the Project System to designate significant events or
the completion of a project phase.
• For progress analysis
• As release stop indicators
• To trigger predefined functions and workflow tasks
Technically speaking, a milestone is a date where the start and end times are
identical.
Milestones exist as a subset of a task list (or routing) and order operation
within SAP solutions. The source tables for Milestones in SAP solutions are:
• MLST - Milestone
• PLKO - Task list - header
• PLPO - Task list - operation/activity
• AFVC - Operation within an order
In the Rapid Mart, the target table is MILESTONE_FACT. We choose only the
task list and operation records that have a corresponding milestone record.
Subject Areas
Milestone Section
3
Rapid Mart Processing
The section captures the following dimensional attributes and their associated
dimension tables:
Attribute Name Dimension Tables
Activity & Hierarchy ACTIVITY, ACTIVITY_HIER,
ACTIVITY_HIER_HZ,
ACTIVITY_HIER_VR,
ACTIVITY_HIER_BAD
Chart Of Accounts CHART_OF_ACCOUNTS
Company Code COMPANY_CODE
SAP BusinessObjects Project Systems Rapid Mart XI 3.2 for SAP solutions Business Guide 27
Page 34

Subject Areas
3
Milestone Section
Attribute Name Dimension Tables
Control Key CONTROL_KEY
Controlling Area CONTROLLING_AREA
Cost Element & Hierarchy COST_ELEMENT,
COST_ELEMENT_HIER,
COST_ELEMENT_HIER_HZ,
COST_ELEMENT_HIER_VR,
COST_ELEMENT_HIER_BAD
Document Category DOCUMENT_CATEGORY
Internal Order & Hierarchy INTERNAL_ORDER,
INTERNAL_ORDER_HIER,
INTERNAL_ORDER_HIER_HZ,
INTERNAL_ORDER_HIER_VR,
INTERNAL_ORDER_HIER_BAD
Milestone Usage MILESTONE_USAGE
Network Profile NETWORK_PROFILE
Order Operation ORDER_OPERATION
Plant PLANT
Project PROJECT
Project Element & Hierarchy PROJECT_ELEMENT,
PROJECT_ELEMENT_HIER,
PROJECT_ELEMENT_HIER_HZ,
PROJECT_ELEMENT_HIER_VR,
PROJECT_ELEMENT_HIER_BAD
Purchasing Organization PURCH_ORGANIZATION
Reference Date Key REFERENCE_DATE_KEY
Routing ROUTING
Routing Operation ROUTING_OPERATION
Status Profile STATUS_PROFILE
Task List Type TASK_LIST_TYPE
Time Dimension TIME_DIM
Unit Of Measure UNIT_OF_MEASURE
28 SAP BusinessObjects Project Systems Rapid Mart XI 3.2 for SAP solutions Business Guide
Page 35
Subject Areas
Milestone Section
Attribute Name Dimension Tables
Work Center & Hierarchy WORK_CENTER,
WORK_CENTER_HIER,
WORK_CENTER_HIER_HZ,
WORK_CENTER_HIER_VR,
WORK_CENTER_HIER_BAD
Work Center Category WORK_CENTER_CATEGORY
Fact table Fields
The section contains the following measures.
Note: The focus is on reporting durations, therefore most measures are in
time units rather than monetary currency or quantities:
Column Name Description
DA YS_ACTL_DUR TN Number of Days between MLST.LST_ACTDT
- Actual date (Milestone met) and
MLST.DATEH - Milestone created on
DAYS_DIFF_FIXED_BASIC Number of Days between Fixed Basic and
Actual Milestone end
DA YS_DIFF_FIXED_FCST Number of Days between Fixed Forecast and
Actual Milestone end
DAYS_DIFF_SCHED_BASIC Number of Days between Scheduled Basic
and Actual Milestone end
DA YS_DIFF_SCHED_FCST Number of Days between Scheduled Forecast
and Actual Milestone end
DAYS_SCHED_DURTN Number of Days between MLST.TEDAT -
Scheduled milestone date (Basic) and
MLST.DATEH - Milestone created on
HOURS_ACTL_DURTN Number of Hours between
MLST.LST_ACTDT - Actual date (Milestone
met) and MLST.DATEH - Milestone created
on
HOURS_DIFF_FIXED_BASIC Number of Hours between Fixed Basic and
Actual Milestone end
HOURS_DIFF_FIXED_FCST Number of Hours between Fixed Forecast
and Actual Milestone end
HOURS_DIFF_SCHED_BASIC Number of Hours between Scheduled Basic
and Actual Milestone end
3
SAP BusinessObjects Project Systems Rapid Mart XI 3.2 for SAP solutions Business Guide 29
Page 36
Subject Areas
3
Milestone Section
Column Name Description
HOURS_DIFF_SCHED_FCST Number of Hours between Scheduled
Forecast and Actual Milestone end
HOURS_SCHED_DURTN Number of Hours between MLST.TEDAT -
Scheduled milestone date (Basic) and
MLST.DATEH - Milestone created on
PRCNT_COMPLETE MLST.LST_FERTG - Percentage of
completion (%)
PRCNT_OFFSET MLST.PRCNT - Percentage offset of
milestone to activity date
QTY_OFFSET MLST.DELTA - Offset for milestone date
SECS_ACTL_DURTN Number of Seconds between
MLST.LST_ACTDT - Actual date (Milestone
met) and MLST.DATEH - Milestone created
on
SECS_DIFF_FIXED_BASIC Number of Seconds between Fixed Basic and
Actual Milestone end
SECS_DIFF_FIXED_FCST Number of Seconds between Fixed Forecast
and Actual Milestone end
SECS_DIFF_SCHED_BASIC Number of Seconds between Scheduled
Basic and Actual Milestone end
SECS_DIFF_SCHED_FCST Number of Seconds between Scheduled
Forecast and Actual Milestone end
SECS_SCHED_DURTN Number of Seconds between MLST.TEDAT -
Scheduled milestone date (Basic) and
MLST.DATEH - Milestone created on
Additionally, several “flags” are employed to capture milestone status:
COLUMN_NAME COMMENTS
COMPLETE_FLAG Calculated based on
MLST.LST_FERTG - Percentage of
completion (%) - if 100% then 1, else
0
CURRENT_FLAG 1- the record is current
FUNCTION_FLAG MLST.KZ_WFLOW - Indicator:
Milestone is used for milestone
functions
LATEST_DATE_FLAG MLST.LATED- Indicator: Latest
dates
30 SAP BusinessObjects Project Systems Rapid Mart XI 3.2 for SAP solutions Business Guide
Page 37
COLUMN_NAME COMMENTS
OFFSET_TO_FINISH_FLAG MLST.DLTAS - Ind: Reference for
PROGRESS_ANALYSIS_FLAG MLST.KZ_LSTWR - Milestone
RELEASE_STOP_FLAG MLST.KZ_FRMST - Release stop
SALES_DOC_DATE_FLAG MLST.KZ_FAKTP - Milestone is
TREND_ANALYSIS_FLAG MLST.KZ_TREND - Milestone
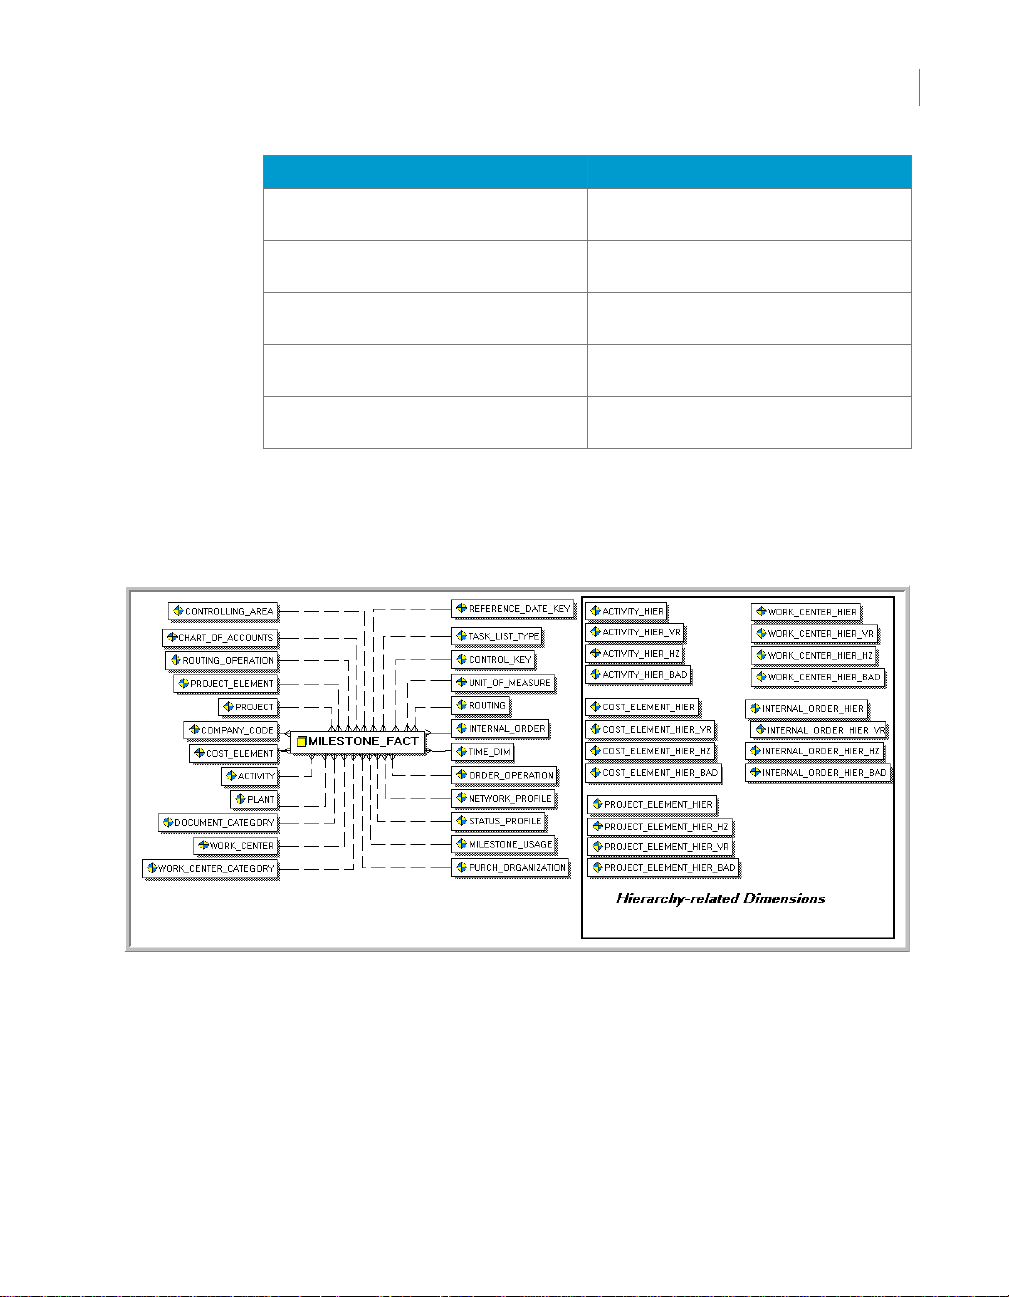
Rapid Mart Data
The following diagram shows the tables in the Milestone section organized as
a Star Schema:
Subject Areas
Milestone Section
offset (start/finish activity date)
relevant for progress analysis
indicator
relevant for date in sales document
relevant for trend analysis
3
With the tables in this section, you can analyze milestones along several
dimensions:
• Activity & Hierarchy
• Chart Of Accounts
• Company Code
• Control Key
• Controlling Area
SAP BusinessObjects Project Systems Rapid Mart XI 3.2 for SAP solutions Business Guide 31
Page 38

Subject Areas
3
Network Order Section
•
Cost Element & Hierarchy
• Document Category
• Internal Order & Hierarchy
• Milestone Usage
• Network Profile
• Order Operation
• Plant
• Project
• Project Element & Hierarchy
• Purchasing Organization
• Reference Date Key
• Routing
• Routing Operation
• Status Profile
• Task List Type
• Time Dimension
• Unit Of Measure
• Work Center & Hierarchy
• Work Center Category
Typical queries for this section include:
• What milestones are due on my project by month for the next year?
• Which milestones have I missed?
• How late or early are we hitting our milestones?
• Compare the percent of milestones “on-time” for one project with another .
• Which Project Elements (WBS) are consistently associated with missed
milestones?
Network Order Section
A network order is a special type of production order used for Projects in the
SAP solutions system.
Network orders are a shared component. They are used in the following
Rapid Marts:
• SAP BusinessObjects Production Planning Rapid Mart, version for SAP
solutions - Extracts only Order Category “10” (Standard Production
Orders).
32 SAP BusinessObjects Project Systems Rapid Mart XI 3.2 for SAP solutions Business Guide
Page 39

• SAP BusinessObjects Project Systems Rapid Mart, version for SAP
solutions - Extracts only Order Category “20” (Network Orders)
There is more information on how this shared component is used in Chapter
8: Technical Implementation of this user guide.
Network orders are source from these SAP solutions tables:
• AUFK - Order master data
• AFKO - Order header data PP orders
• AFPO - Order item
The target table for Production Orders is:
• PRODUCTION_ORDER_FACT
Rapid Mart Processing
The section captures the following dimensional attributes and their associated
dimension tables:
Attribute Name Dimension Tables
Account Assignment Category ACCT_ASSIGNMENT_CATEGORY
Business Area BUSINESS_AREA
Company Code COMPANY_CODE
Controlling Area CONTROLLING_AREA
Cost Center & Hierarchy COST_CENTER,
Cost Element & Hierarchy COST_ELEMENT,
Document Type DOCUMENT_TYPE &
Functional Area & Hierarchy FUNCTIONAL_AREA,
Subject Areas
Network Order Section
COST_CENTER_HIER,
COST_CENTER_HIER_HZ,
COST_CENTER_HIER_VR,
COST_CENTER_HIER_BAD
COST_ELEMENT_HIER,
COST_ELEMENT_HIER_HZ,
COST_ELEMENT_HIER_VR,
COST_ELEMENT_HIER_BAD
DOCUMENT_CATEGORY
FUNCTIONAL_AREA_HIER,
FUNCTIONAL_AREA_HIER_HZ,
FUNCTIONAL_AREA_HIER_VR,
FUNCTIONAL_AREA_HIER_BAD
3
SAP BusinessObjects Project Systems Rapid Mart XI 3.2 for SAP solutions Business Guide 33
Page 40

Subject Areas
3
Network Order Section
Attribute Name Dimension Tables
Internal Order & Hierarchy INTERNAL_ORDER,
INTERNAL_ORDER_HIER,
INTERNAL_ORDER_HIER_HZ,
INTERNAL_ORDER_HIER_VR,
INTERNAL_ORDER_HIER_BAD
Internal Order Status INTERNAL_ORDER_STATUS
Material Batch MATERIAL_BATCH
Material By Plant MATERIAL_BY_PLANT
Material Group MATERIAL_GROUP
Material Type MATERIAL_TYPE
Material, Product Hierarchy MATERIAL,
PRODUCT_HIERARCHY
Monetary Currency CURRENCY
MRP Controller MRP_CONTROLLER
Object Class OBJECT_CLASS
Object Number Type OBJECT_NUMBER_TYPE
Object Status & Hierarchy OBJECT_STATUS,
OBJECT_STATUS_HZ
Plant PLANT
Plant Location PLANT_LOCATION
Profit Center & Hierarchy PROFIT_CENTER,
PROFIT_CENTER_HIER,
PROFIT_CENTER_HIER_HZ,
PROFIT_CENTER_HIER_VR,
PROFIT_CENTER_HIER_BAD
Project PROJECT
Project Element & Hierarchy PROJECT_ELEMENT,
PROJECT_ELEMENT_HIER,
PROJECT_ELEMENT_HIER_HZ,
PROJECT_ELEMENT_HIER_VR,
PROJECT_ELEMENT_HIER_BAD
Purchasing Organization PURCH_ORGANIZATION
Routing ROUTING
Service Person SERVICE_PERSON
Special Procurement Type SPECIAL_PROCUREMENT_TYPE
34 SAP BusinessObjects Project Systems Rapid Mart XI 3.2 for SAP solutions Business Guide
Page 41

Attribute Name Dimension Tables
Storage Location STORAGE_LOCATION
Task List Type TASK_LIST_TYPE
Task List Usage TASK_LIST_USAGE
Time Dimension TIME_DIM
Unit Of Measure UNIT_OF_MEASURE
Valuation Area VALUATION_AREA
Fact Table Fields
Important measures for Production Orders are both quantity and time
oriented:
Column Name Description
DA YS_COMPLT_ACTL Number of Days to actually complete
DAYS_COMPLT_BASIC Number of Days to Basic complete a
DAYS_COMPLT_FCST Number of Forecast Days to com-
DAYS_COMPLT_SCHED Number of Days scheduled to com-
DAYS_GR_PROCESS AFPO.WEBAZ -Goods receipt pro-
DA YS_RELEASE_ACTL Number of Days to actually release a
DAYS_RELEASE_SCHED Number of Days scheduled to
HOURS_COMPLT_BASIC Number of Hours to Basic complete a
HOURS_COMPLT_FCST Number of Forecast Hours to com-
HOURS_COMPLT_SCHED Number of Hours scheduled to com-
MINS_COMPLT_ACTL Number of Minutes to actually com-
MINS_COMPL T_BASIC Number of Minutes to Basic complete
Subject Areas
Network Order Section
a service order (Calculated)
service order (Calculated)
plete a service order (Calculated)
plete a service order (Calculated)
cessing time in days
service order (Calculated)
release a service order (Calculated)
service order (Calculated)
plete a service order (Calculated)
plete a service order (Calculated)
plete a service order (Calculated)
a service order (Calculated)
3
SAP BusinessObjects Project Systems Rapid Mart XI 3.2 for SAP solutions Business Guide 35
Page 42

Subject Areas
3
Network Order Section
Rapid Mart data
Column Name Description
MINS_COMPLT_FCST Number of Forecast Minutes to com-
plete a service order (Calculated)
MINS_COMPLT_SCHED Number of Minutes scheduled to
complete a service order (Calculated)
QTY AFPO.PSMNG - Order item quantity
QTY_PROD AFPO.WEMNG - Quantity of goods
produced and received for the order
item
QTY_SCRAP AFPO.PSAMG - Scrap quantity in
item
The following diagram shows the tables in the Network order section
organized as a Star Schema.
36 SAP BusinessObjects Project Systems Rapid Mart XI 3.2 for SAP solutions Business Guide
Page 43

Subject Areas
Network Order Section
Additionally, these hierarchies are associated with Network orders:
With the tables in this section you can analyze Network Orders along several
dimensions:
• Account Assignment Category
• Business Area
• Company Code
• Controlling Area
• Cost Center & Hierarchy
• Cost Element & Hierarchy
• Document Type
• Functional Area & Hierarchy
• Internal Order & Hierarchy
• Internal Order Status
• Material Batch
• Material By Plant
• Material Group
• Material Type
• Material, Product Hierarchy
• Monetary Currency
• MRP Controller
• Object Class
3
SAP BusinessObjects Project Systems Rapid Mart XI 3.2 for SAP solutions Business Guide 37
Page 44

Subject Areas
3
Network Relationship Section
•
Object Number Type
• Object Status & Hierarchy
• Plant
• Plant Location
• Profit Center & Hierarchy
• Project
• Project Element & Hierarchy
• Purchasing Organization
• Routing
• Service Person
• Special Procurement Type
• Storage Location
• Task List Type
• Task List Usage
• Time Dimension
• Unit Of Measure
• Valuation Area
Typical queries for this section include:
• What is the average time to complete a network order?
• Is one plant faster at completing network orders than another?
• Which network orders have the lowest / highest on-time completion?
• Are my network orders for a certain functional area evenly distributed
between plants?
• Which Projects have the greatest / lowest shares of network orders in a
given plant?
Network Relationship Section
A way of describing the link between the start and finish points of two
activities in a network. Relationships determine the sequence of activities.
The SAP solutions system includes the following relationships:
• SS relationship (Start - Start)
• FF relationship (Finish - Finish)
• SF relationship (Start - Finish)
• FS relationship (Finish - Start)
38 SAP BusinessObjects Project Systems Rapid Mart XI 3.2 for SAP solutions Business Guide
Page 45

A Network Relationship is a way of linking related Order Operations by one
of the four methods described above.
Network Relationships are sourced from these SAP solutions tables:
• AFAB - Network - Relationships
• AFVC - Operation within an order
The target table for Network Relationships is:
• NETWORK_RELATIONSHIP_FACT
Rapid Mart Processing
The section captures the following dimensional attributes and their associated
dimension tables:
Attribute Name Dimension Tables
Business Area BUSINESS_AREA
Company Code COMPANY_CODE
Control Key CONTROL_KEY
Controlling Area CONTROLLING_AREA
Functional Area & Hierarchy FUNCTIONAL_AREA,
Internal Order & Hierarchy INTERNAL_ORDER,
MRP Controller MRP_CONTROLLER
Object Status OBJECT_STATUS,
Order Operation ORDER_OPERATION
Plant PLANT
Plant Location PLANT_LOCATION
Profit Center & Hierarchy PROFIT_CENTER,
Subject Areas
Network Relationship Section
FUNCTIONAL_AREA_HIER,
FUNCTIONAL_AREA_HIER_HZ,
FUNCTIONAL_AREA_HIER_VR,
FUNCTIONAL_AREA_HIER_BAD
INTERNAL_ORDER_HIER,
INTERNAL_ORDER_HIER_HZ,
INTERNAL_ORDER_HIER_VR,
INTERNAL_ORDER_HIER_BAD
OBJECT_STATUS_HZ
PROFIT_CENTER_HIER,
PROFIT_CENTER_HIER_HZ,
PROFIT_CENTER_HIER_VR,
PROFIT_CENTER_HIER_BAD
3
SAP BusinessObjects Project Systems Rapid Mart XI 3.2 for SAP solutions Business Guide 39
Page 46

Subject Areas
3
Network Relationship Section
Attribute Name Dimension Tables
Project PROJECT
Project Element & Hierarchy PROJECT_ELEMENT,
PROJECT_ELEMENT_HIER,
PROJECT_ELEMENT_HIER_HZ,
PROJECT_ELEMENT_HIER_VR,
PROJECT_ELEMENT_HIER_BAD
Purchasing Organization PURCH_ORGANIZATION
Relationship Type RELATIONSHIP_TYPE
Storage Location STORAGE_LOCATION
Time Dimension TIME_DIM
Unit Of Measure UNIT_OF_MEASURE
Valuation Area VALUATION_AREA
Work Center Category WORK_CENTER_CATEGORY
Work Center & Hierarchy WORK_CENTER,
WORK_CENTER_HIER,
WORK_CENTER_HIER_HZ,
WORK_CENTER_HIER_VR,
WORK_CENTER_HIER_BAD
Fact Table Fields
Important measures for Network Relationships are time oriented
COLUMN_NAME COMMENTS
DAYS_DURTN_EARLST Number of Days for Network Relationship
based on Earliest start/end dates
DAYS_DURTN_LATEST Number of Days for Network Relationship
based on Latest start/end dates
DAYS_DURTN_MAX Max Number of Days for Network
Relationship. Calculated as difference
between latest end date and earliest start
date
DAYS_DURTN_MIN Min Number of Days for Network
Relationship. Calculated as difference
between earliest end date and latest start
date
HOURS_DURTN_EARLST Number of Hours for Network Relationship
based on Earliest start/end dates
40 SAP BusinessObjects Project Systems Rapid Mart XI 3.2 for SAP solutions Business Guide
Page 47

Subject Areas
Network Relationship Section
COLUMN_NAME COMMENTS
HOURS_DURTN_LATEST Number of Hours for Network Relationship
based on Latest start/end dates
HOURS_DURTN_MAX Max Number of Hours for Network
Relationship. Calculated as difference
between latest end date and earliest start
date
HOURS_DURTN_MIN Min Number of Hours for Network
Relationship. Calculated as difference
between earliest end date and latest start
date
MAX_INTERVAL_FLAG AFAB.MIMAX - Indicates whether maximum
time interval will be considered
MINS_DURTN_EARLST Number of Minutes for Network Relationship
based on Earliest start/end dates
MINS_DURTN_LATEST Number of Minutes for Network Relationship
based on Latest start/end dates
MINS_DURTN_MAX Max Number of Minutes for Network
Relationship. Calculated as difference
between latest end date and earliest start
date
MINS_DURTN_MIN Min Number of Minutes for Network
Relationship. Calculated as difference
between earliest end date and latest start
date
QTY_INTERVAL AFAB.DAUER - Time interval between
relationships
SECS_DURTN AFAB.DAUTM - Relationship duration (in
seconds) as result of scheduling
3
SAP BusinessObjects Project Systems Rapid Mart XI 3.2 for SAP solutions Business Guide 41
Page 48

Subject Areas
3
Network Relationship Section
Rapid Mart data
The following diagram shows the tables in the Network Relationship section
as a Star Schema:
42 SAP BusinessObjects Project Systems Rapid Mart XI 3.2 for SAP solutions Business Guide
Page 49
Subject Areas
Network Relationship Section
Additionally, the following dimensions are associated with Network
Relationships:
With the tables in this section you can analyze Network Relationships along
several dimensions:
• Business Area
• Company Code
• Control Key
• Controlling Area
• Functional Area & Hierarchy
• Internal Order & Hierarchy
• MRP Controller
• Object Status
• Order Operation
• Plant
• Plant Location
• Profit Center & Hierarchy
• Project
• Project Element & Hierarchy
• Purchasing Organization
• Relationship Type
3
SAP BusinessObjects Project Systems Rapid Mart XI 3.2 for SAP solutions Business Guide 43
Page 50

Subject Areas
3
Project Cost Summary Section
•
Storage Location
• Time Dimension
• Unit Of Measure
• Valuation Area
• Work Center Category
• Work Center & Hierarchy
Typical queries for this section include:
• How are the operations within a given project linked to form a Network?
• Are there any dependencies (network relationships) missing in my
project?
• Which tasks (operations) are late because their predecessor task was
completed late?
• Which predecessor and successor tasks have the same Project
Elements (WBS) associate to them?
Project Cost Summary Section
Use Project Costing to plan, monitor, and control project costs, thereby
achieving comprehensive cost accounting.
Project Costing features include:
• Cost planning in various degrees of detail
• Automatic cost calculation wherever there are price and quantity
structures
• Funds management, effected by means of budget allocation
• Integration of project costs with Enterprise Controlling, such as
reconciliation with cost center accounting.
Project Costs are sourced from these SAP solutions tables:
• RPSCO - Project info database: Costs, revenues, finances
• AFVC - Operation within an order
• PROJ - Project definition
• PRPS - Project Element or WBS Element Master Data
The target tables for Project Costs are:
• PROJECT_COST_SUMMARY_FACT_HZ - Cost data in horizontal
format. That is, one row for each fiscal year with 16 columns for each
measure, one for each fiscal period in the year.
44 SAP BusinessObjects Project Systems Rapid Mart XI 3.2 for SAP solutions Business Guide
Page 51
• PROJECT_COST_SUMMARY_STAGE_VR - Staging table for Costs in
vertical format. Not actually used for queries in the target database.
• PROJECT_COST_SUMMARY_FACT_VR - Cost data in vertical format.
That is, one row for each fiscal year and fiscal period. There are 16 rows
per fiscal year, one for each fiscal period. Each row has individual
measures for the single fiscal period.
Rapid Mart Processing
The section captures the following dimensional attributes and their associated
dimension tables:
Attribute Name Dimension Tables
Business Activity BUSINESS_ACTIVITY
Business Area BUSINESS_AREA
Company Code COMPANY_CODE
Controlling Area CONTROLLING_AREA
Cost Object Indicator COST_OBJECT_INDICATOR
Financial Management Area FINANCIAL_MGMT_AREA
Financial Record Category FINANCIAL_RECORD_CATEGORY
Financial Record Type FINANCIAL_RECORD_TYPE
Financing Code FINANCING_CODE
Fiscal Period FISC_PERIOD
Functional Area & Hierarchy FUNCTIONAL_AREA,
Monetary Currency CURRENCY
Object Number Type OBJECT_NUMBER_TYPE
Object Status OBJECT_STATUS,
Order Operation ORDER_OPERATION
Pegging Object PEGGING_OBJECT
Plant PLANT
Subject Areas
Project Cost Summary Section
FUNCTIONAL_AREA_HIER,
FUNCTIONAL_AREA_HIER_HZ,
FUNCTIONAL_AREA_HIER_VR,
FUNCTIONAL_AREA_HIER_BAD
OBJECT_STATUS_HZ
3
SAP BusinessObjects Project Systems Rapid Mart XI 3.2 for SAP solutions Business Guide 45
Page 52
Subject Areas
3
Project Cost Summary Section
Fact Table Fields
Attribute Name Dimension Tables
Profit Center & Hierarchy PROFIT_CENTER,
PROFIT_CENTER_HIER,
PROFIT_CENTER_HIER_HZ,
PROFIT_CENTER_HIER_VR,
PROFIT_CENTER_HIER_BAD
Progress Measure Method PROGRESS_MEASURE_METHOD
Project PROJECT
Project Element & Hierarchy PROJECT_ELEMENT,
PROJECT_ELEMENT_HIER,
PROJECT_ELEMENT_HIER_HZ,
PROJECT_ELEMENT_HIER_VR,
PROJECT_ELEMENT_HIER_BAD
Purchasing Organization PURCH_ORGANIZATION
Valuation Area VALUATION_A REA
Variance Category VARIANCE_CATEGORY
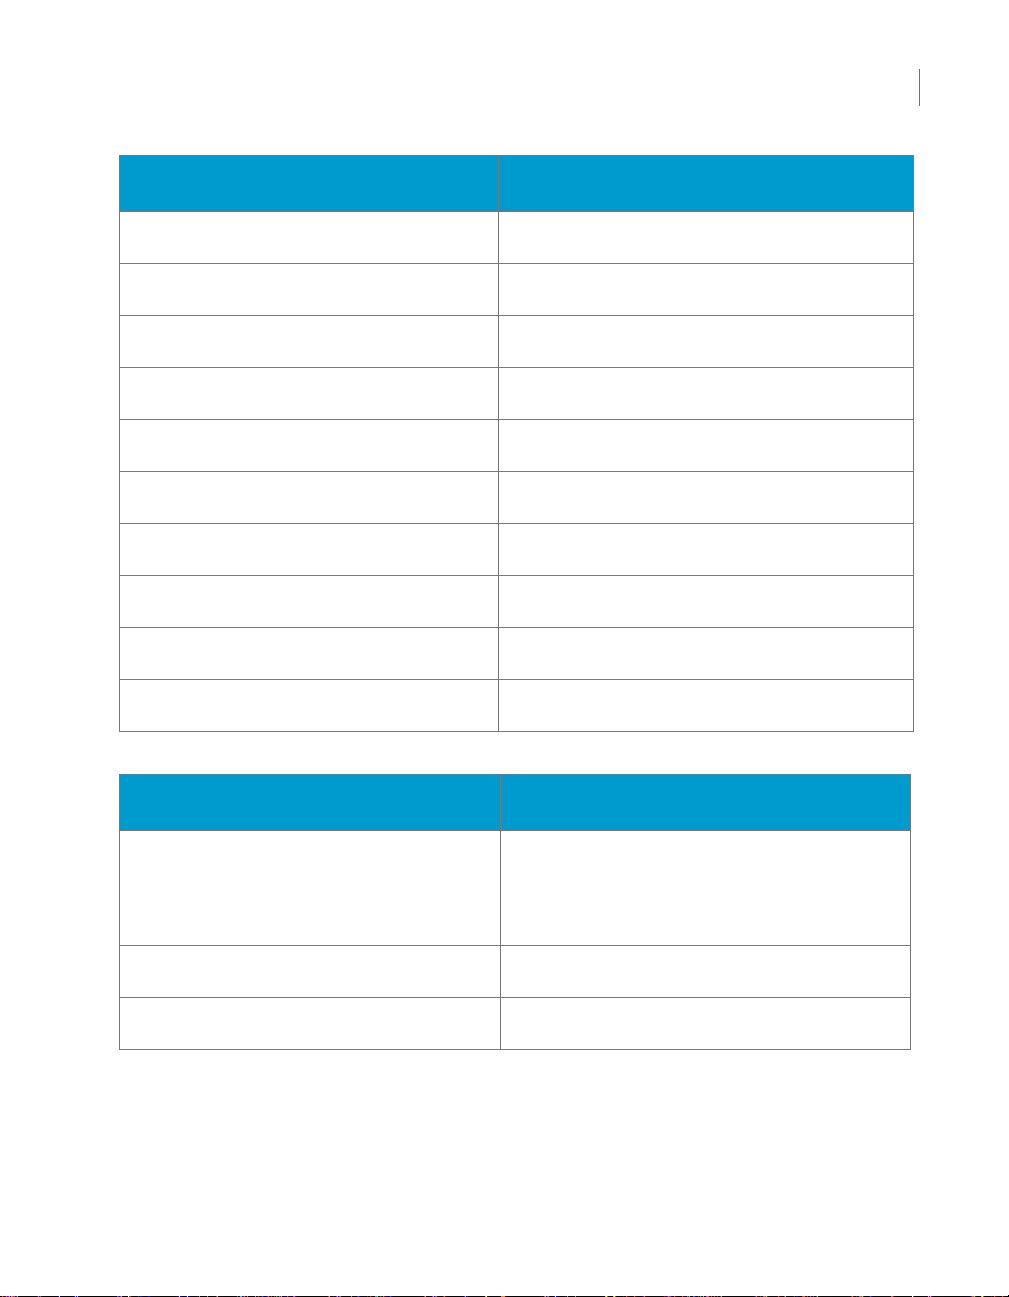
Important measures for Project Cost Summary are:
PROJECT_COST_SUMMARY_FACT_HZ:
PROJECT_COST_SUMMARY_FACT_HZ
Column Name
AMT_CR_PER00_LOC RPSCO.WLP00 - PTD Credit value in Ledger
AMT_CR_PER00_TRX RPSCO.WTP00 - PTD Credit value in
AMT_CR_PER01_LOC RPSCO.WLP01 - PTD Credit value in Ledger
AMT_CR_PER01_TRX RPSCO.WTP01 - PTD Credit value in
AMT_CR_PER02_LOC RPSCO.WLP02 - PTD Credit value in Ledger
AMT_CR_PER02_TRX RPSCO.WTP02 - PTD Credit value in
AMT_CR_PER03_LOC RPSCO.WLP03 - PTD Credit value in Ledger
46 SAP BusinessObjects Project Systems Rapid Mart XI 3.2 for SAP solutions Business Guide
Description
(Local) currency (Adjusting Year begin period)
transactional currency (Adjusting year begin
period)
(Local) currency (Adjusting Year begin period)
transactional currency
(Local) currency (Adjusting Year begin period)
transactional currency
(Local) currency (Adjusting Year begin period)
Page 53

Subject Areas
Project Cost Summary Section
3
PROJECT_COST_SUMMARY_FACT_HZ
Column Name
AMT_CR_PER03_TRX RPSCO.WTP03 - PTD Credit value in
AMT_CR_PER04_LOC RPSCO.WLP04 - PTD Credit value in Ledger
AMT_CR_PER04_TRX RPSCO.WTP04 - PTD Credit value in
AMT_CR_PER05_LOC RPSCO.WLP05 - PTD Credit value in Ledger
AMT_CR_PER05_TRX RPSCO.WTP05 - PTD Credit value in
AMT_CR_PER06_LOC RPSCO.WLP06 - PTD Credit value in Ledger
AMT_CR_PER06_TRX RPSCO.WTP06 - PTD Credit value in
AMT_CR_PER07_LOC RPSCO.WLP07 - PTD Credit value in Ledger
AMT_CR_PER07_TRX RPSCO.WTP07 - PTD Credit value in
AMT_CR_PER08_LOC RPSCO.WLP08 - PTD Credit value in Ledger
AMT_CR_PER08_TRX RPSCO.WTP08 - PTD Credit value in
AMT_CR_PER09_LOC RPSCO.WLP09 - PTD Credit value in Ledger
AMT_CR_PER09_TRX RPSCO.WTP09 - PTD Credit value in
AMT_CR_PER10_LOC RPSCO.WLP10 - PTD Credit value in Ledger
AMT_CR_PER10_TRX RPSCO.WTP10 - PTD Credit value in
AMT_CR_PER11_LOC RPSCO.WLP11 - PTD Credit value in Ledger
AMT_CR_PER11_TRX RPSCO.WTP11 - PTD Credit value in
AMT_CR_PER12_LOC RPSCO.WLP12 - PTD Credit value in Ledger
Description
transactional currency
(Local) currency (Adjusting Year begin period)
transactional currency
(Local) currency (Adjusting Year begin period)
transactional currency
(Local) currency (Adjusting Year begin period)
transactional currency
(Local) currency (Adjusting Year begin period)
transactional currency
(Local) currency (Adjusting Year begin period)
transactional currency
(Local) currency (Adjusting Year begin period)
transactional currency
(Local) currency (Adjusting Year begin period)
transactional currency
(Local) currency (Adjusting Year begin period)
transactional currency
(Local) currency (Adjusting Year begin period)
SAP BusinessObjects Project Systems Rapid Mart XI 3.2 for SAP solutions Business Guide 47
Page 54

Subject Areas
3
Project Cost Summary Section
PROJECT_COST_SUMMARY_FACT_HZ
Column Name
AMT_CR_PER12_TRX RPSCO.WTP12 - PTD Credit value in
AMT_CR_PER13_LOC RPSCO.WLP13 - PTD Credit value in Ledger
AMT_CR_PER13_TRX RPSCO.WTP13 - PTD Credit value in
AMT_CR_PER14_LOC RPSCO.WLP14 - PTD Credit value in Ledger
AMT_CR_PER14_TRX RPSCO.WTP14 - PTD Credit value in
AMT_CR_PER15_LOC RPSCO.WLP15 - PTD Credit value in Ledger
AMT_CR_PER15_TRX RPSCO.WTP15 - PTD Credit value in
AMT_CR_PER16_LOC RPSCO.WLP16 - PTD Credit value in Ledger
AMT_CR_PER16_TRX RPSCO.WTP169 - PTD Credit value in
AMT_CR_QTR01_LOC RPSCO.WLP00 through 03 - Quarter Credit
AMT_CR_QTR01_TRX RPSCO.WTP00 through 03 - Quarter Credit
AMT_CR_QTR02_LOC RPSCO.WLP04 through 06 - Quarter Credit
AMT_CR_QTR02_TRX RPSCO.WTP04 through 06 - Quarter Credit
AMT_CR_QTR03_LOC RPSCO.WLP07 through 09 - Quarter Credit
AMT_CR_QTR03_TRX RPSCO.WTP07 through 09 - Quarter Credit
AMT_CR_QTR04_LOC RPSCO.WLP10 through 16 - Quarter Credit
AMT_CR_QTR04_TRX RPSCO.WTP10 through 16 - Quarter Credit
AMT_CR_YTD_LOC RPSCO.WLP00 through 16 - Quarter Credit
Description
transactional currency
(Local) currency (Adjusting Year begin period)
transactional currency
(Local) currency (Adjusting Year begin period)
transactional currency
(Local) currency (Adjusting Year begin period)
transactional currency
(Local) currency (Adjusting Year begin period)
transactional currency
(QTD) value in Ledger (Local) currency
value in transactional currency
(QTD) value in Ledger (Local) currency
value in transactional currency
(QTD) value in Ledger (Local) currency
value in transactional currency
(QTD) value in Ledger (Local) currency
value in transactional currency
value in Ledger (Local) currency
48 SAP BusinessObjects Project Systems Rapid Mart XI 3.2 for SAP solutions Business Guide
Page 55

Subject Areas
Project Cost Summary Section
3
PROJECT_COST_SUMMARY_FACT_HZ
Column Name
AMT_CR_YTD_TRX RPSCO.WTP00 through 16 - Quarter Credit
AMT_DR_PER00_LOC RPSCO.WLP00 - PTD Debit value in Ledger
AMT_DR_PER00_TRX RPSCO.WTP00 - PTD Debit value in
AMT_DR_PER01_LOC RPSCO.WLP01 - PTD Debit value in Ledger
AMT_DR_PER01_TRX RPSCO.WTP01 - PTD Debit value in
AMT_DR_PER02_LOC RPSCO.WLP02 - PTD Debit value in Ledger
AMT_DR_PER02_TRX RPSCO.WTP02 - PTD Debit value in
AMT_DR_PER03_LOC RPSCO.WLP03 - PTD Debit value in Ledger
AMT_DR_PER03_TRX RPSCO.WTP03 - PTD Debit value in
AMT_DR_PER04_LOC RPSCO.WLP04 - PTD Debit value in Ledger
AMT_DR_PER04_TRX RPSCO.WTP04 - PTD Debit value in
AMT_DR_PER05_LOC RPSCO.WLP05 - PTD Debit value in Ledger
AMT_DR_PER05_TRX RPSCO.WTP05 - PTD Debit value in
AMT_DR_PER06_LOC RPSCO.WLP06 - PTD Debit value in Ledger
AMT_DR_PER06_TRX RPSCO.WTP06 - PTD Debit value in
AMT_DR_PER07_LOC RPSCO.WLP07 - PTD Debit value in Ledger
AMT_DR_PER07_TRX RPSCO.WTP07 - PTD Debit value in
Description
value in transactional currency
(Local) currency (Adjusting Year begin period)
transactional currency (Adjusting Year begin
period)
(Local) currency (Adjusting Year begin period)
transactional currency
(Local) currency (Adjusting Year begin period)
transactional currency
(Local) currency (Adjusting Year begin period)
transactional currency
(Local) currency (Adjusting Year begin period)
transactional currency
(Local) currency (Adjusting Year begin period)
transactional currency
(Local) currency (Adjusting Year begin period)
transactional currency
(Local) currency (Adjusting Year begin period)
transactional currency
SAP BusinessObjects Project Systems Rapid Mart XI 3.2 for SAP solutions Business Guide 49
Page 56

Subject Areas
3
Project Cost Summary Section
PROJECT_COST_SUMMARY_FACT_HZ
Column Name
AMT_DR_PER08_LOC RPSCO.WLP08 - PTD Debit value in Ledger
AMT_DR_PER08_TRX RPSCO.WTP08 - PTD Debit value in
AMT_DR_PER09_LOC RPSCO.WLP09 - PTD Debit value in Ledger
AMT_DR_PER09_TRX RPSCO.WTP09 - PTD Debit value in
AMT_DR_PER10_LOC RPSCO.WLP10 - PTD Debit value in Ledger
AMT_DR_PER10_TRX RPSCO.WTP10 - PTD Debit value in
AMT_DR_PER11_LOC RPSCO.WLP11 - PTD Debit value in Ledger
AMT_DR_PER11_TRX RPSCO.WTP11 - PTD Debit value in
AMT_DR_PER12_LOC RPSCO.WLP12 - PTD Debit value in Ledger
AMT_DR_PER12_TRX RPSCO.WTP12 - PTD Debit value in
AMT_DR_PER13_LOC RPSCO.WLP13 - PTD Debit value in Ledger
AMT_DR_PER13_TRX RPSCO.WTP13 - PTD Debit value in
AMT_DR_PER14_LOC RPSCO.WLP14 - PTD Debit value in Ledger
AMT_DR_PER14_TRX RPSCO.WTP14 - PTD Debit value in
AMT_DR_PER15_LOC RPSCO.WLP15 - PTD Debit value in Ledger
AMT_DR_PER15_TRX RPSCO.WTP15 - PTD Debit value in
AMT_DR_PER16_LOC RPSCO.WLP16 - PTD Debit value in Ledger
AMT_DR_PER16_TRX RPSCO.WTP16 - PTD Debit value in
Description
(Local) currency (Adjusting Year begin period)
transactional currency
(Local) currency (Adjusting Year begin period)
transactional currency
(Local) currency (Adjusting Year begin period)
transactional currency
(Local) currency (Adjusting Year begin period)
transactional currency
(Local) currency (Adjusting Year begin period)
transactional currency
(Local) currency (Adjusting Year begin period)
transactional currency
(Local) currency (Adjusting Year begin period)
transactional currency
(Local) currency (Adjusting Year begin period)
transactional currency
(Local) currency (Adjusting Year begin period)
transactional currency
50 SAP BusinessObjects Project Systems Rapid Mart XI 3.2 for SAP solutions Business Guide
Page 57
Subject Areas
Project Cost Summary Section
3
PROJECT_COST_SUMMARY_FACT_HZ
Column Name
AMT_DR_QTR01_LOC RPSCO.WLP00 through 03 - Quarter Debit
AMT_DR_QTR01_TRX RPSCO.WTP00 through 03 - Quarter Debit
AMT_DR_QTR02_LOC RPSCO.WLP04 through 06 - Quarter Debit
AMT_DR_QTR02_TRX RPSCO.WTP04 through 06 - Quarter Debit
AMT_DR_QTR03_LOC RPSCO.WLP07 through 09 - Quarter Debit
AMT_DR_QTR03_TRX RPSCO.WTP07 through 09 - Quarter Debit
AMT_DR_QTR04_LOC RPSCO.WLP10 through 16 - Quarter Debit
AMT_DR_QTR04_TRX RPSCO.WTP10 through 16 - Quarter Debit
AMT_DR_YTD_LOC RPSCO.WLP00 through 16 - Quarter Debit
AMT_DR_YTD_TRX RPSCO.WTP00 through 16 - Quarter Debit
PROJECT_COST_SUMMARY_FACT_VR
Description
(QTD) value in Ledger (Local) currency
(QTD) value in transactional currency
(QTD) value in Ledger (Local) currency
(QTD) value in transactional currency
(QTD) value in Ledger (Local) currency
(QTD) value in transactional currency
(QTD) value in Ledger (Local) currency
(QTD) value in transactional currency
value in Ledger (Local) currency
value in transactional currency
PROJECT_COST_SUMMARY_FACT_HZ
Column Name
AMT_CR_LOC RPSCO-WLP01 through WLP16 - Period
AMT_CR_QTD_LOC RPSCO-WLP01 through WLP16 through 16 -
AMT_CR_QTD_TRX RPSCO-WTP01 through WTP16 through 16 -
Description
Credit value in Ledger (Local) currency. For
Period 01 - cumulative of Per 00 and Per 01;
for Per 12 - cumulative of Per 12 through Per
16
QTD Credit value in Ledger (Local) currency
QTD Credit value in Transactional currency
SAP BusinessObjects Project Systems Rapid Mart XI 3.2 for SAP solutions Business Guide 51
Page 58

Subject Areas
3
Project Cost Summary Section
PROJECT_COST_SUMMARY_FACT_HZ
Column Name
AMT_CR_TRX RPSCO-WTP01 through WTP16 - Period
AMT_CR_YTD_LOC RPSCO-WLP01 through WLP16 - YTD Credit
AMT_CR_YTD_TRX RPSCO-WTP01 through WTP16 - YTD Credit
AMT_DR_LOC RPSCO-WLP01 through WLP16 - Period Debit
AMT_DR_QTD_LOC RPSCO-WLP01 through WLP16 - QTD Debit
AMT_DR_QTD_TRX RPSCO-WTP01 through WTP16 - QTD Debit
AMT_DR_TRX RPSCO-WTP01 through WTP16 - Period
AMT_DR_YTD_LOC RPSCO-WLP01 through WLP16 - YTD Debit
AMT_DR_YTD_TRX RPSCO-WTP01 through WTP16 - YTD Debit
AMT_PER_BEGIN_LOC RPSCO-WLP01 through WLP16 - Period
AMT_PER_BEGIN_TRX RPSCO-WTP01 through WTP16 - Period
AMT_PER_ROLLING_LOC Rolling Total Balance - Ledger (Local) Currency
AMT_PER_ROLLING_TRX Rolling Total Balance - Transaction Currency
AMT_PTD_LOC Period Beginning Balance - Ledger (Local)
AMT_PTD_TRX Period Beginning Balance - Transaction
Description
Credit value in Transactional currency. For
Period 01 - cumulative of Per 00 and Per 01;
for Per 12 - cumulative of Per 12 through Per
16
value in Ledger (Local) currency
value in Transactional currency
value in Ledger (Local) currency . For Period 01
- cumulative of Per 00 and Per 01; for Per 12 cumulative of Per 12 through Per 16
value in Ledger (Local) currency
value in Transactional currency
Debit value in Transactional currency. For
Period 01 - cumulative of Per 00 and Per 01;
for Per 12 - cumulative of Per 12 through Per
16
value in Ledger (Local) currency
value in Transactional currency
begin balance value in Ledger (Local) currency
begin balance value in Transactional currency
Currency
Currency
52 SAP BusinessObjects Project Systems Rapid Mart XI 3.2 for SAP solutions Business Guide
Page 59

Rapid Mart data
The following diagram shows the tables in the Project Cost Summary section
as a Star Schema:
Subject Areas
Project Cost Summary Section
3
With the tables in this section you can analyze Project Costs along several
dimensions:
• Business Activity
• Business Area
• Company Code
• Controlling Area
• Cost Object Indicator
• Financial Management Area
• Financial Record Category
• Financial Record Type
• Financing Code
• Fiscal Period
• Functional Area & Hierarchy
• Monetary Currency
SAP BusinessObjects Project Systems Rapid Mart XI 3.2 for SAP solutions Business Guide 53
Page 60

Subject Areas
3
PRT Assignment Section
•
Object Number Type
• Object Status
• Order Operation
• Pegging Object
• Plant
• Profit Center & Hierarchy
• Progress Measure Method
• Project
• Project Element & Hierarchy
• Purchasing Organization
• Valuation Area
• Variance Category
Typical queries for this section include:
• What costs has my project incurred year-to-date?
• How are certain projects performing vs. budget (actual vs. planned)?
• Which Profit Centers are incurring the most project related costs this year
by fiscal period?
• What is the trend in project costs month-to-month for each Project (WBS)
Element?
PRT Assignment Section
Unlike machines and fixed assets, production resources and tools (PRTs) are
movable (not stationary) operating resources that are required to perform an
activity and can be used repeatedly. For example, PRTs include documents,
engineering drawings, and measurement instruments.
In SAP solutions, the PRT’s are assigned to an order operation.
The PRT Assignment section extracts operation level data from these SAP
solutions tables:
• AFVC - Operation within an order
• AFFH - PRT assignment data for the work order
• CRFH - CIM production resource/tool master data
The section stores the data in the fact table
• PRT_ASSIGNMENT_FACT
54 SAP BusinessObjects Project Systems Rapid Mart XI 3.2 for SAP solutions Business Guide
Page 61

Rapid Mart processing
The section captures the following dimensional attributes and their associated
dimension tables
Attribute Dimension Tables
Activity & Hierarchy ACTIVITY, ACTIVITY_HIER,
Business Area BUSINESS_AREA
Chart Of Accounts CHART_OF_ACCOUNTS
Company Code COMPANY_CODE
Control Key CONTROL_KEY
Controlling Area CONTROLLING_AREA
Cost Center & Hierarchy COST_CENTER,
Cost Element & Hierarchy COST_ELEMENT,
Functional Area & Hierarchy FUNCTIONAL_AREA,
Internal Order & Hierarchy INTERNAL_ORDER,
Material, Product Hierarchy MATERIAL,
MRP Controller MRP_CONTROLLER
Object Number Type OBJECT_NUMBER_TYPE
Subject Areas
PRT Assignment Section
ACTIVITY_HIER_HZ,
ACTIVITY_HIER_VR,
ACTIVITY_HIER_BAD
COST_CENTER_HIER,
COST_CENTER_HIER_HZ,
COST_CENTER_HIER_VR,
COST_CENTER_HIER_BAD
COST_ELEMENT_HIER,
COST_ELEMENT_HIER_HZ,
COST_ELEMENT_HIER_VR,
COST_ELEMENT_HIER_BAD
FUNCTIONAL_AREA_HIER,
FUNCTIONAL_AREA_HIER_HZ,
FUNCTIONAL_AREA_HIER_VR,
FUNCTIONAL_AREA_HIER_BAD
INTERNAL_ORDER_HIER,
INTERNAL_ORDER_HIER_HZ,
INTERNAL_ORDER_HIER_VR,
INTERNAL_ORDER_HIER_BAD
PRODUCT_HIERARCHY
3
SAP BusinessObjects Project Systems Rapid Mart XI 3.2 for SAP solutions Business Guide 55
Page 62

Subject Areas
3
PRT Assignment Section
Attribute Dimension Tables
Object Status OBJECT_STATUS,
OBJECT_STATUS_HZ
Object Type OBJECT_TYPE
Order Operation ORDER_OPERATION
Plant PLANT
Plant Location PLANT_LOCATION
Profit Center PROFIT_CENTER
Profit Center & Hierarchy PROFIT_CENTER_HIER,
PROFIT_CENTER_HIER_HZ,
PROFIT_CENTER_HIER_VR,
PROFIT_CENTER_HIER_BAD
Project PROJECT
Project Element & Hierarchy PROJECT_ELEMENT,
PROJECT_ELEMENT_HIER,
PROJECT_ELEMENT_HIER_HZ,
PROJECT_ELEMENT_HIER_VR,
PROJECT_ELEMENT_HIER_BAD
PRT Category PRT_CATEGORY
PRT Grouping Key PRT_GROUPING_KEY
PRT Master PRT_MASTER
PRT Status PRT_STATUS
Purchasing Organization PURCH_ORGANIZATION
Reference Date Key REFERENCE_DATE_KEY
Routing ROUTING
Routing Operation ROUTING_OPERATION
Routing Sequence ROUTING_SEQUENCE
Standard Text Key STANDARD_TEXT_KEY
Storage Location STORAGE_LOCATION
Task List Type TASK_LIST_TYPE
Time Dimension TIME_DIM
Unit Of Measure UNIT_OF_MEASURE
Valuation Area VALUATION_AREA
56 SAP BusinessObjects Project Systems Rapid Mart XI 3.2 for SAP solutions Business Guide
Page 63

Subject Areas
PRT Assignment Section
Attribute Dimension Tables
Work Center & Hierarchy WORK_CENTER,
WORK_CENTER_HIER,
WORK_CENTER_HIER_HZ,
WORK_CENTER_HIER_VR,
WORK_CENTER_HIER_BAD
Work Center Category WORK_CENTER_CATEGORY
Work Center Formula WORK_CENTER_FORMULA,
FORMULA_PARAMETER
Fact Table Fields
Important measures for PRT Assignments are both quantity and time oriented
Column Name Description
ACTL_USG_VALUE AFFH.EWIST - Actual usage value for
production resource/tool
DAYS_DURTN_ACTL Actual Number of Days for Network
Relationship. Calculated as difference
between actual end date and start date
(UOM_ID = TAG in IDES)
DAYS_DURTN_EARLST Number of Days for Network Relationship
based on Earliest start/end dates (UOM_ID =
TAG in IDES)
DAYS_DURTN_LATEST Number of Days for Network Relationship
based on Latest start/end dates (UOM_ID =
TAG in IDES)
DAYS_DURTN_MAX Max Number of Days for Network
Relationship. Calculated as difference
between latest end date and earliest start date
(UOM_ID = TAG in IDES)
DAYS_DURTN_MIN Min Number of Days for Network
Relationship. Calculated as difference
between earliest end date and latest start date
(UOM_ID = TAG in IDES)
HOURS_DURTN_ACTL Actual Number of HOURS for Network
Relationship. Calculated as difference
between actual end date and start date
(UOM_ID = HUR in IDES)
HOURS_DURTN_EARLST Number of Hours for Network Relationship
based on Earliest start/end dates (UOM_ID =
HUR in IDES)
3
SAP BusinessObjects Project Systems Rapid Mart XI 3.2 for SAP solutions Business Guide 57
Page 64

Subject Areas
3
PRT Assignment Section
Column Name Description
HOURS_DURTN_LATEST Number of HOURS for Network Relationship
based on Latest start/end dates (UOM_ID =
HUR in IDES)
HOURS_DURTN_MAX Max Number of Hours for Network
Relationship. Calculated as difference
between latest end date and earliest start date
(UOM_ID = HUR in IDES)
HOURS_DURTN_MIN Min Number of Hours for Network
Relationship. Calculated as difference
between earliest end date and latest start date
(UOM_ID = HUR in IDES)
MINS_DURTN_ACTL Actual Number of Mins for Network
Relationship. Calculated as difference
between actual end date and start date
(UOM_ID = MIN in IDES)
MINS_DURTN_EARLST Number of Mins for Network Relationship
based on Earliest start/end dates (UOM_ID =
MIN in IDES)
MINS_DURTN_LATEST Number of Mins for Network Relationship
based on Latest start/end dates (UOM_ID =
MIN in IDES)
MINS_DURTN_MAX Max Number of Mins for Network
Relationship. Calculated as difference
between latest end date and earliest start date
(UOM_ID = MIN in IDES)
MINS_DURTN_MIN Min Number of Mins for Network Relationship.
Calculated as difference between earliest end
date and latest start date (UOM_ID = MIN in
IDES)
PLAN_USG_VALUE AFFH.EWSOL - Total planned usage value of
production resource/tool
QTY_DURTN AFFH.DAUFL - Duration of PRT usage
QTY_OFFSET_END AFFH.OFFSTE - Offset to finish of production
resource/tool usage
QTY_OFFSET_START AFFH.OFFSTB - Offset to start of production
resource/tool usage
QTY_PRT_CHECKOUT AFFH.MGAUS - Quantity of checked-out
production resources/tools
58 SAP BusinessObjects Project Systems Rapid Mart XI 3.2 for SAP solutions Business Guide
Page 65
Subject Areas
PRT Assignment Section
Column Name Description
QTY_PRT_CONFIRM AFFH.MGIST - Confirmed quantity of
production resource/tool
QTY_PRT_PLAN AFFH.MGSOL - Total planned quantity of
production resource/tool
QTY_PRT_REMAIN AFFH.MGRSTEH - Remaining quantity of the
production resource/tool
QTY_PRT_STD AFFH.MGVGW - Standard value for the PRT
quantity
REMAIN_USG_VALUE AFFH.EWRST - Remaining usage value of
the production resource/tool
STD_USG_VALUE AFFH.EWVGW - Standard usage value for
production resources/tools
3
SAP BusinessObjects Project Systems Rapid Mart XI 3.2 for SAP solutions Business Guide 59
Page 66

Subject Areas
3
PRT Assignment Section
Rapid Mart data
The following diagram shows the tables in the PRT Assignment section as a
Star Schema.
60 SAP BusinessObjects Project Systems Rapid Mart XI 3.2 for SAP solutions Business Guide
Page 67

Subject Areas
PRT Assignment Section
Additionally, the following hierarchies are available for PRT Assignments:
3
With the tables in this section you can analyze PRT Assignments along
several dimensions:
• Activity & Hierarchy
• Business Area
• Chart Of Accounts
• Company Code
• Control Key
• Controlling Area
• Cost Center & Hierarchy
• Cost Element & Hierarchy
• Functional Area & Hierarchy
SAP BusinessObjects Project Systems Rapid Mart XI 3.2 for SAP solutions Business Guide 61
Page 68

Subject Areas
3
PRT Assignment Section
•
Internal Order & Hierarchy
• Material, Product Hierarchy
• MRP Controller
• Object Number Type
• Object Status
• Object Type
• Order Operation
• Plant
• Plant Location
• Profit Center
• Profit Center & Hierarchy
• Project
• Project Element & Hierarchy
• PRT Category
• PRT Grouping Key
• PRT Master
• PRT Status
• Purchasing Organization
• Reference Date Key
• Routing
• Routing Operation
• Routing Sequence
• Standard Text Key
• Storage Location
• Task List Type
• Time Dimension
• Unit Of Measure
• Valuation Area
• Work Center & Hierarchy
• Work Center Category
• Work Center Formula
Typical queries for this section include:
• Which are the top 10 PRT’s are assigned by Project?
• Are Operations (Project Activities) using a specific PRT finishing on
schedule?
62 SAP BusinessObjects Project Systems Rapid Mart XI 3.2 for SAP solutions Business Guide
Page 69

Subject Areas
PRT Assignment Section
• Which Work Centers have critical PRT’s for my project?
• What is the total amount of time a certain PRT was used on my project
this month?
3
SAP BusinessObjects Project Systems Rapid Mart XI 3.2 for SAP solutions Business Guide 63
Page 70

Subject Areas
3
PRT Assignment Section
64 SAP BusinessObjects Project Systems Rapid Mart XI 3.2 for SAP solutions Business Guide
Page 71

Reports
chapter
Page 72

Reports
4
Overview
Overview
You can use the SAP BusinessObjects Project Systems Rapid Mart, version
for SAP solutions to produce many kinds of reports. This chapter provides
examples of reports you could produce. The information in this chapter is
useful for those who analyze and produce reports with the Rapid Mart data.
This chapter provides a sample report and the recommended joins for each
componentized section in the Rapid Mart:
• Milestone
• Network (Production) Order
• Network Relationship
• Project Cost
• PRT Assignment
• Order Operation
SAP Master Data Reports are also described at the end of this chapter . These
reports are common across all Rapid Marts and are intended for hierarchy
discovery and record validation.
Note: All report SQL is located in the Rapid Mart installation directory under
"\Sample\DML".
Milestone
Milestones are used in the Project System to designate significant events or
the completion of a project phase. Milestone data can be used to create
listings, high-level statistics by Company (or other dimension), and even
trending reports.
Reports
Milestone allows for a variety of trend and high level analysis. Below is a list
of the reports included here for analysis:
• Milestone Overview
• Milestone Statistics
Milestone Overview
This report displays Milestone information for the selected Project (and
Project Elements). Provides information similar to SAP Transactions: CN53N
and CJ20N (display WBS element milestones).
66 SAP BusinessObjects Project Systems Rapid Mart XI 3.2 for SAP solutions Business Guide
Page 73
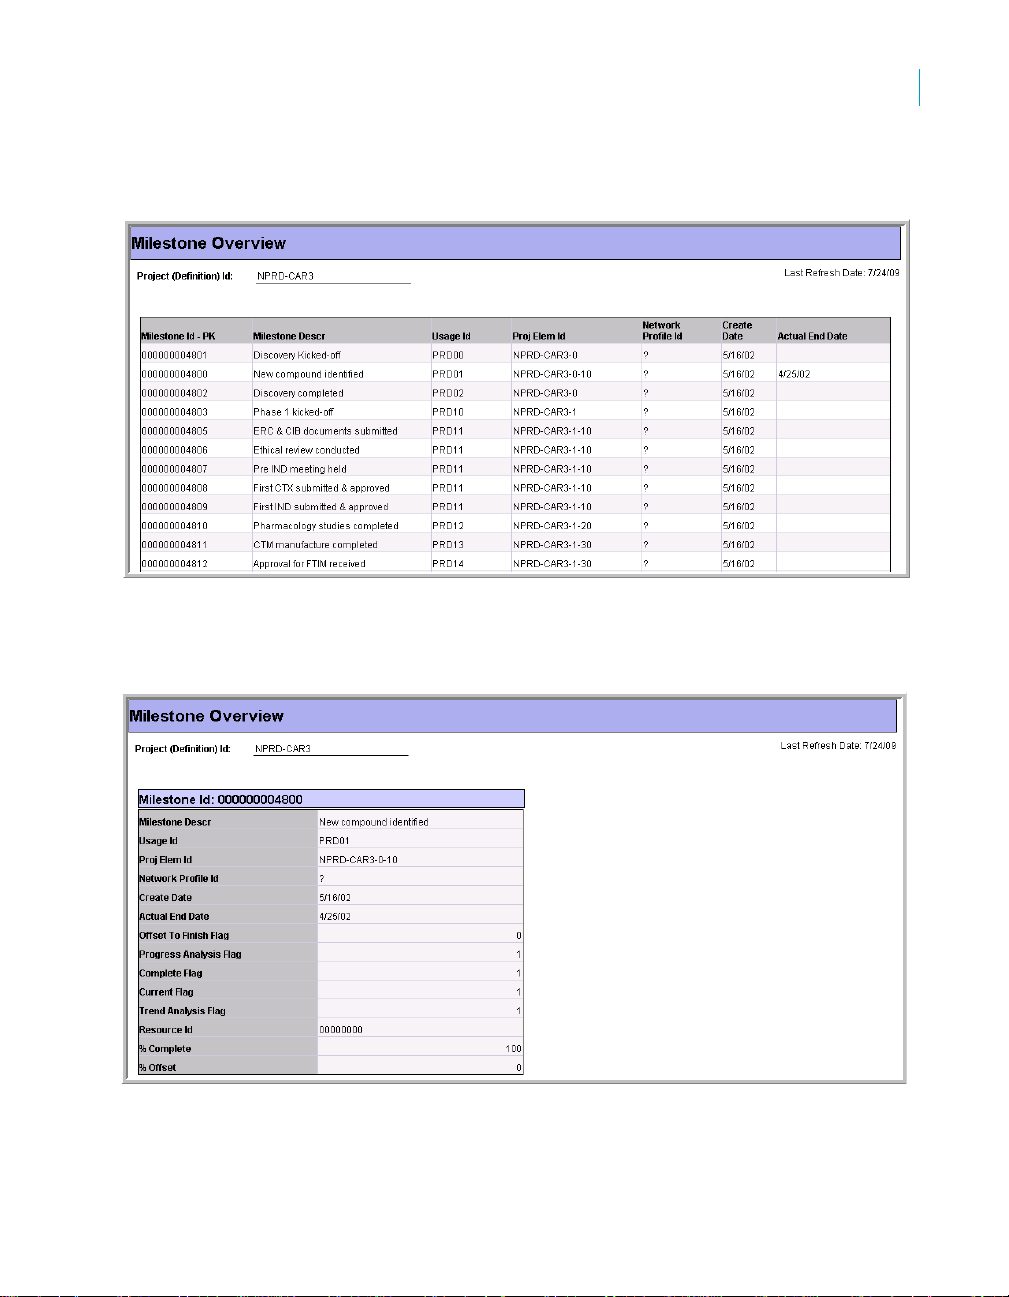
Overview
View milestone listing for the specified Project Id.
Details
View Milestone details by Milestone Id section.
Reports
Milestone
4
SAP BusinessObjects Project Systems Rapid Mart XI 3.2 for SAP solutions Business Guide 67
Page 74

Reports
4
Milestone
Milestone Statistics
Calculations
• Actual End Date = =If(FormatDate([Actl End Date]; [Default Date
Format])=[Default Date Text]; ""; [Actl End Date])
• Default Date Format = "MM/dd/yyyy"
• Detault Date Text = "01/01/1900"
Report SQL
All report SQL is located in the Rapid Mart installation directory under
"\Sample\DML".
View Milestone performance statistics by Plant for the selected Company
Code.
Summary
View milestone summary statistics for the specified Company Code. View
data as trend (Actual vs Scheduled Duratoin) and in tabular format by Plant
Name..
68 SAP BusinessObjects Project Systems Rapid Mart XI 3.2 for SAP solutions Business Guide
Page 75

Top 10 Projects by Variance %
View Top 10 Projects by milestone count and Variance %.
Reports
Milestone
4
Calculations
• Variance % = If([MILESTONE - Days Actl Duration] <> 0; [MILESTONE -
Days Diff Actl Scheduled]/[MILESTONE - Days Actl Duration]; 0)
• Default Date Format = "MM/dd/yyyy"
• Detault Date Text = "01/01/1900"
Report SQL
All report SQL is located in the Rapid Mart installation directory under
"\Sample\DML".
SAP BusinessObjects Project Systems Rapid Mart XI 3.2 for SAP solutions Business Guide 69
Page 76

Reports
4
Milestone
Recommended Table Joins
To an alyze Milestone data you will need to create joins between the fact and
dimension tables as follows:
Fact Table Dimension Table Join Expression
MILESTONE_FACT ACTIVITY MILESTONE_FACT.ACTIVITY_ID=ACTI
VITY.ACTIVITY_ID and
MILESTONE_FACT.CTRL_AREA_ID=A
CTIVITY.CTRL_AREA_ID
MILESTONE_FACT ACTIVITY_HIER_HZ MILESTONE_FA CT.CTRL_AREA_ID=A
CTIVITY_HIER_HZ.CTRL_AREA_ID and
MILESTONE_FACT.ACTIVITY_ID=ACTI
VITY_HIER_HZ.ACTIVITY_ID
MILESTONE_FACT ACTIVITY_HIER_VR MILESTONE_FACT.CTRL_AREA_ID =
ACTIVITY_HIER_VR.CTRL_AREA_ID
and MILESTONE_F ACT.ACTIVITY_ID =
ACTIVITY_HIER_VR.CHILD_ID
MILESTONE_FACT CHART_OF_ACCOUNTSCHART_OF_ACCOUNTS.CHART_OF_
ACCT_ID=MILESTONE_FACT.CHART_
OF_ACCT_ID
MILESTONE_FACT COMPANY_CODE COMPANY_CODE.CMPNY_CODE_ID=
MILESTONE_FACT.CMPNY_CODE_ID
MILESTONE_FACT CONTROL_KEY MILESTONE_FACT.CTRL_KEY_ID=CO
NTROL_KEY.CTRL_KEY_ID
MILESTONE_FACT CONTROLLING_AREA CONTROLLING_AREA.CTRL_AREA_ID
=MILESTONE_FACT.CTRL_AREA_ID
MILESTONE_FACT COST_ELEMENT MILESTONE_FACT.CHART_OF_ACCT_
ID=COST_ELEMENT.CHART_OF_ACC
T_ID and
MILESTONE_FACT.COST_ELEM_ID=C
OST_ELEMENT.COST_ELEM_ID
MILESTONE_FACT COST_ELEMENT_HIE
R_HZ
MILESTONE_FACT.COST_ELEM_ID=C
OST_ELEMENT_HIER_HZ.COST_ELE
M_ID and
MILESTONE_FACT.CHART_OF_ACCT_
ID=COST_ELEMENT_HIER_HZ.CHART
_OF_ACCT_ID
70 SAP BusinessObjects Project Systems Rapid Mart XI 3.2 for SAP solutions Business Guide
Page 77

Reports
Milestone
Fact Table Dimension Table Join Expression
MILESTONE_FACT COST_ELEMENT_HIE
R_VR
MILESTONE_FACT DOCUMENT_CATEGORYDOCUMENT_CATEGORY.DOC_CATEG
MILESTONE_FACT INTERNAL_ORDER MILESTONE_FACT.INTERNAL_ORDER
MILESTONE_FACT INTERNAL_ORDER_HI
ER_HZ
MILESTONE_FACT INTERNAL_ORDER_HI
ER_VR
MILESTONE_FACT MILESTONE_USAGE MILESTONE_USAGE.USAGE_ID =
MILESTONE_FACT NETWORK_PROFILE NETWORK_PROFILE.GROUP_APPLIC
MILESTONE_FACT ORDER_OPERATION ORDER_OPERATION.OPERATN_ROU
MILESTONE_FACT PLANT PLANT.PLANT_ID=MILESTONE_FACT.
MILESTONE_FACT PROJECT MILESTONE_FACT.PROJ_ID=PROJEC
MILESTONE_FACT PROJECT_ELEMENT MILESTONE_FACT.PROJ_ELEM_ID=P
MILESTONE_FACT.CHART_OF_ACCT_
ID=COST_ELEMENT_HIER_VR.CHART
_OF_ACCT_ID and
MILESTONE_FACT.COST_ELEM_ID=C
OST_ELEMENT_HIER_VR.CHILD_ID
_ID=MILESTONE_FACT.DOC_CATEG_I
D and
DOCUMENT_CATEGORY.DIM_SRC_ID
=MILESTONE_FACT.DIM_SRC_ID_DO
CCTG
_ID=INTERNAL_ORDER.INTERNAL_O
RDER_ID
MILESTONE_FACT.INTERNAL_ORDER
_ID=INTERNAL_ORDER_HIER_HZ.INT
ERNAL_ORDER_ID
MILESTONE_FACT.INTERNAL_ORDER
_ID=INTERNAL_ORDER_HIER_VR.CHI
LD_ID
MILESTONE_FACT.USAGE_ID
TN_ID=MILESTONE_FACT.GROUP_AP
PLICTN_ID and
NETWORK_PROFILE.NETWORK_PRO
FILE_ID=MILESTONE_FACT.NETWOR
K_PROFILE_ID
TING_ID=MILESTONE_FACT.OPERATN
_ROUTING_ID and
ORDER_OPERATION.OPERATN_SEQ_
ID=MILESTONE_FACT.OPERATN_SEQ
_ID
PLANT_ID
T.PROJ_ID
ROJECT_ELEMENT.PROJ_ELEM_ID
4
SAP BusinessObjects Project Systems Rapid Mart XI 3.2 for SAP solutions Business Guide 71
Page 78

Reports
4
Milestone
Fact Table Dimension Table Join Expression
MILESTONE_FACT PROJECT_ELEMENT_
HIER_HZ
MILESTONE_FACT PROJECT_ELEMENT_
HIER_VR
MILESTONE_FACT PURCH_ORGANIZATIONPURCH_ORGANIZATION.PURCH_ORG
MILESTONE_FACT REFERENCE_DATE_KEYMILESTONE_FACT.DATE_KEY_ID=REF
MILESTONE_FACT ROUTING ROUTING.ROUTING_ID=MILESTONE_
MILESTONE_FACT ROUTING_OPERATIONROUTING_OPERATION.GROUP_TYPE
MILESTONE_FACT STATUS_PROFILE STATUS_PROFILE.STATUS_PROFILE_I
MILESTONE_FACT TASK_LIST_TYPE TASK_LIST_TYPE.GROUP_TYPE_ID=
MILESTONE_FACT TIME_DIM TIME_DIM.CALENDAR_DATE=MILEST
MILESTONE_FACT UNIT_OF_MEASURE UNIT_OF_MEASURE.UOM_ID=MILEST
MILESTONE_FACT WORK_CENTER MILESTONE_FACT.PLANT_ID=WORK_
MILESTONE_FACT.PROJ_ELEM_ID=P
ROJECT_ELEMENT_HIER_HZ.PROJ_E
LEM_ID
MILESTONE_FACT.PROJ_ELEM_ID=P
ROJECT_ELEMENT_HIER_VR.CHILD_I
D
_ID=MILESTONE_FACT.PURCH_ORG_
ID
ERENCE_DATE_KEY.DATE_KEY_ID
and
MILESTONE_FACT.DIM_SRC_ID_DTKE
Y=REFERENCE_DATE_KEY.DIM_SRC_
ID
FACT.ROUTING_ID
_ID=MILESTONE_FACT.GROUP_TYPE
_ID and
ROUTING_OPERATION.GROUP_ID=MI
LESTONE_FACT.GROUP_ID and
ROUTING_OPERATION.GROUP_NODE
_ID=MILESTONE_FACT.GROUP_NODE
_ID
D=MILESTONE_FACT.STATUS_PROFIL
E_ID
MILESTONE_FACT.GROUP_TYPE_ID
ONE_FACT.CREATE_DATE
ONE_FACT.UOM_ID_OFFSET
CENTER.PLANT_ID and
MILESTONE_FACT.WORK_CNTR_ID=
WORK_CENTER.WORK_CNTR_ID
72 SAP BusinessObjects Project Systems Rapid Mart XI 3.2 for SAP solutions Business Guide
Page 79

Fact Table Dimension Table Join Expression
MILESTONE_FACT WORK_CENTER_CAT
EGORY
MILESTONE_FACT WORK_CENTER_HIER
_HZ
MILESTONE_FACT WORK_CENTER_HIER
_VR
Additional joins between dimension and hierarchy tables are shown in
“Recommended table joins” on page 27 for master reports.
MILESTONE_FACT.WORK_CNTR_CAT
EG_ID=WORK_CENTER_CATEGORY.
WORK_CNTR_CATEG_ID
MILESTONE_FACT.WORK_CNTR_ID=
WORK_CENTER_HIER_HZ.WORK_CN
TR_ID and
MILESTONE_FACT.PLANT_ID=WORK_
CENTER_HIER_HZ.PLANT_ID
MILESTONE_FACT.WORK_CNTR_ID=
WORK_CENTER_HIER_VR.CHILD_ID
AND
MILESTONE_FACT.PLANT_ID=WORK_
CENTER_HIER_VR.PLANT_ID
Network (Production) Order
A network order is a special type of production order used for Projects in the
SAP Applications system.
Reports
Network (Production) Order
4
Reports
Network order is suited to detail, trend, and high level analysis. Below is a list
of the reports included here for analysis:
• Network Order Details
• Network Order Analysis
Network Order Details
View network (production) order listing, network order details, and trend by
Business Area for the selected Plant and Calendar Year.
SAP BusinessObjects Project Systems Rapid Mart XI 3.2 for SAP solutions Business Guide 73
Page 80
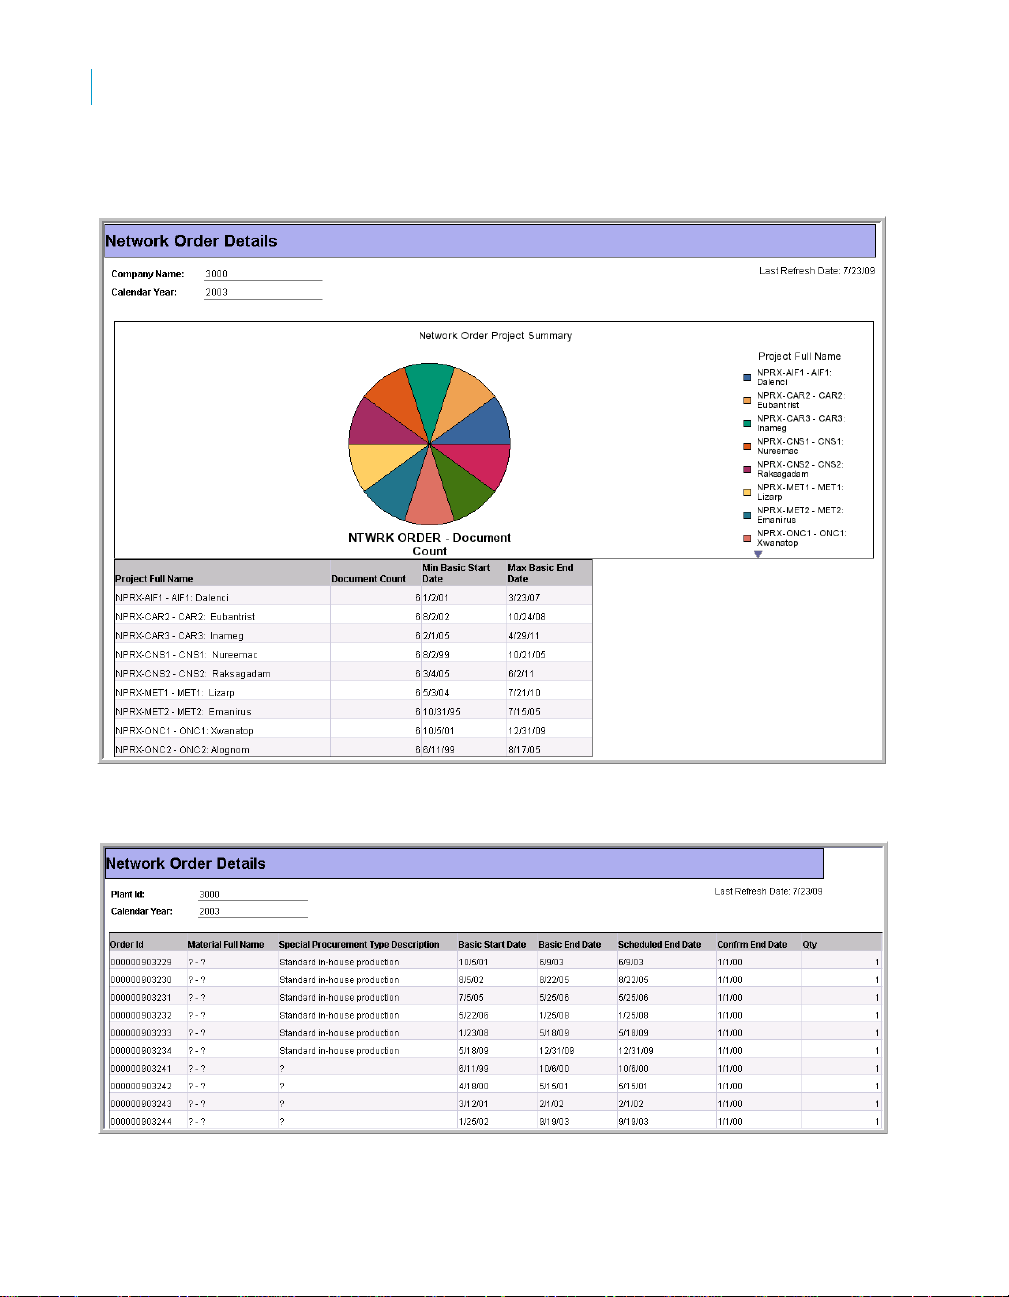
Reports
4
Network (Production) Order
Project Summary
View Network Order summary statistics by Project..
Listing
View network order listing by Order Id..
74 SAP BusinessObjects Project Systems Rapid Mart XI 3.2 for SAP solutions Business Guide
Page 81

Details
View network order details by Order Id..
Calculations
• Max Basic End Date = Max([Basic End Date])
• Min Basic End Date = Min([Basic End Date])
Network Order Analysis
View network (production) order analysis for selected Plant and Calendar
Year. View Summary, Trend by Business Area, and Top 10 Materials.
Reports
Network (Production) Order
4
SAP BusinessObjects Project Systems Rapid Mart XI 3.2 for SAP solutions Business Guide 75
Page 82
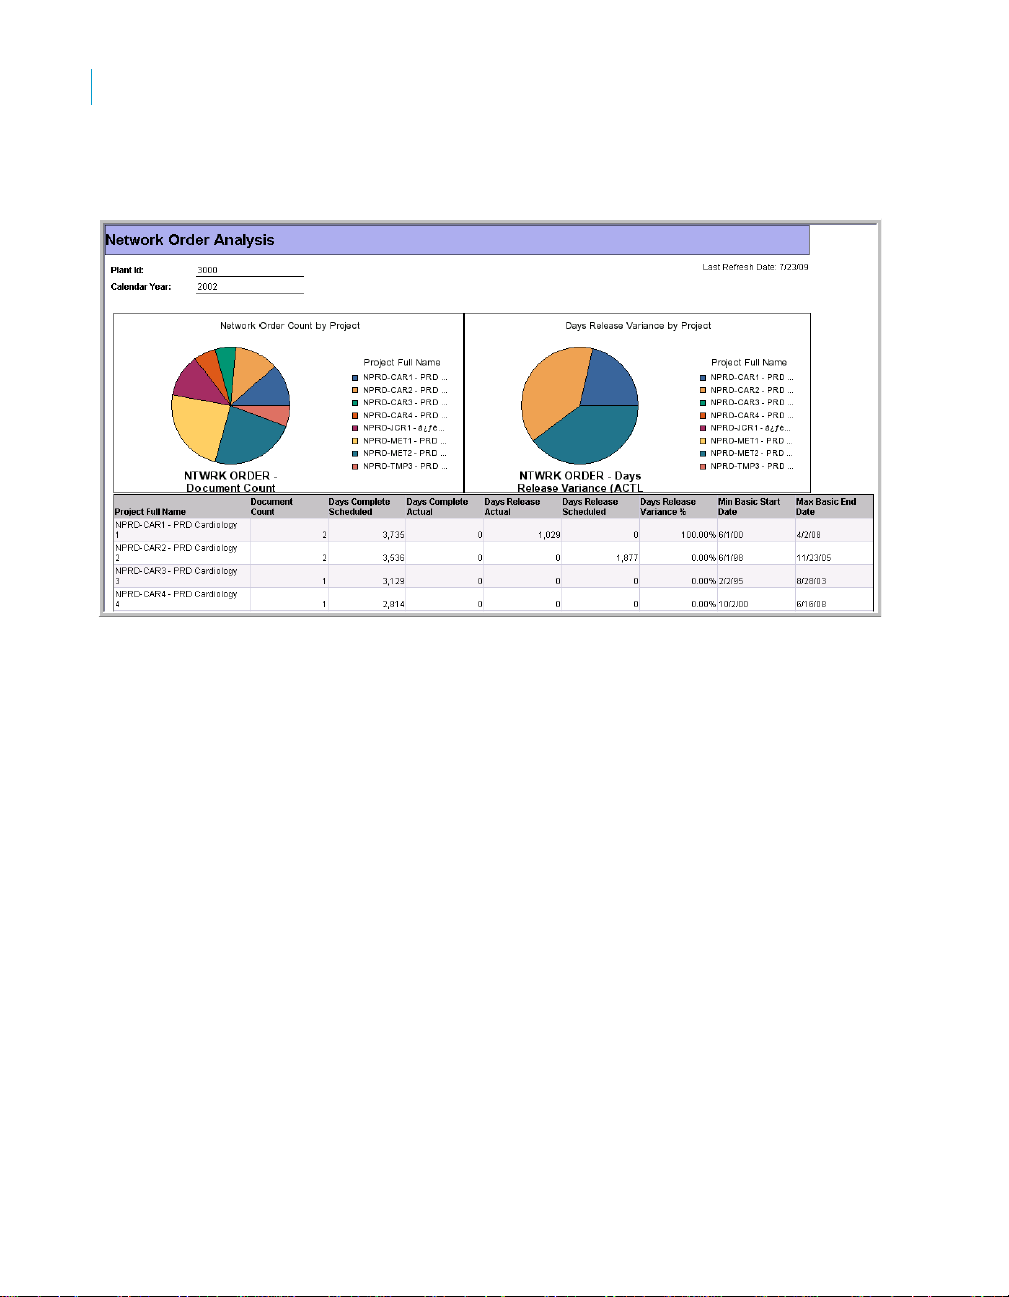
Reports
4
Network (Production) Order
Summary
View network order summary statistics..
76 SAP BusinessObjects Project Systems Rapid Mart XI 3.2 for SAP solutions Business Guide
Page 83
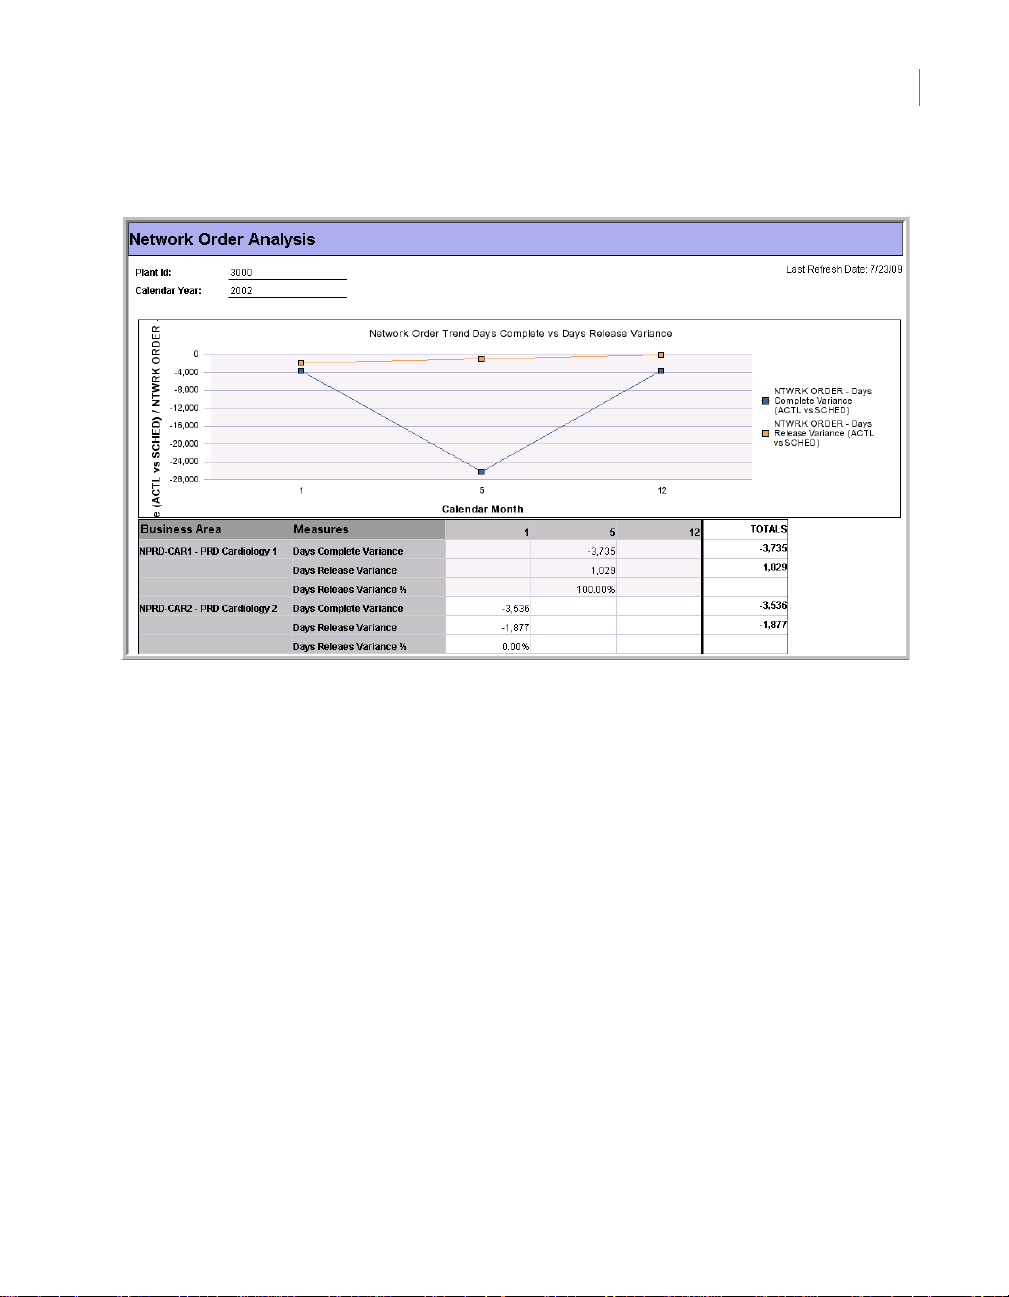
Trend by Project
View network order trends by Business Area.
Reports
Network (Production) Order
4
SAP BusinessObjects Project Systems Rapid Mart XI 3.2 for SAP solutions Business Guide 77
Page 84
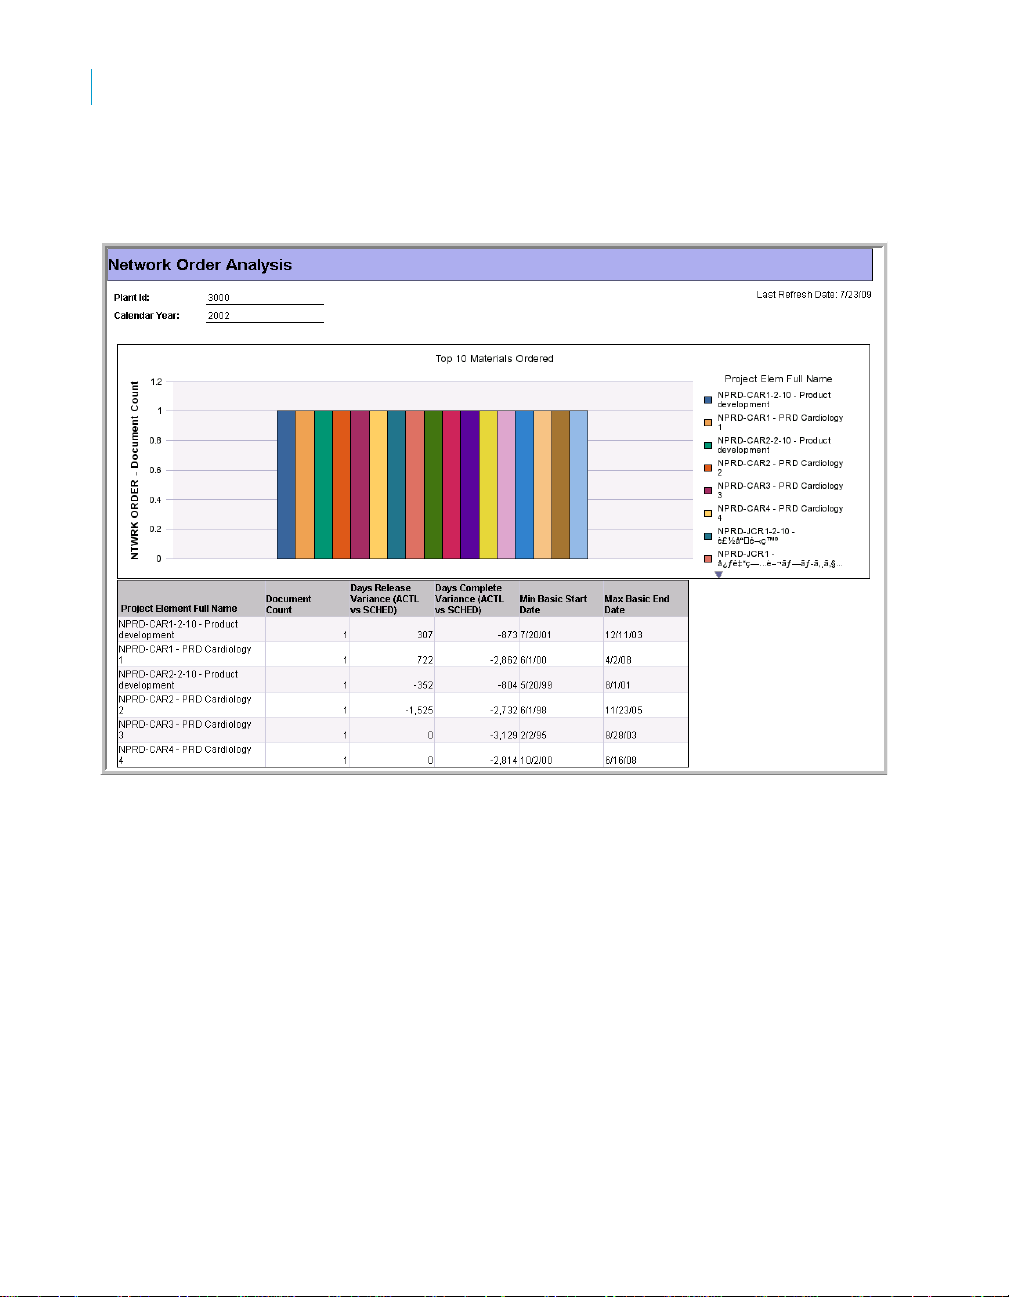
Reports
4
Network (Production) Order
Top 10 Project Elements
View Top 10 Project Elements based on count of network orders. Uses Web
Intelligence ranking feature..
Calculations
• Days Release Variance % = If([NTWRK ORDER - Days Release
Actual]<> 0; [NTWRK ORDER - Days Release Variance (ACTL vs
SCHED)]/[NTWRK ORDER - Days Release Actual]; 0)
• Max Basic End Date = Max([Basic End Date])
• Min Basic End Date = Min([Basic End Date])
78 SAP BusinessObjects Project Systems Rapid Mart XI 3.2 for SAP solutions Business Guide
Page 85

Reports
Network (Production) Order
Recommended Table Joins
To analyze Netowrk (Production) Order data you will need to create joins between
the fact and dimension tables as follows:
Fact Table Dimension Table Join Expression
MATERIAL PRODUCT_HIERARCHYMATERIAL.PROD_HIER_ID=PRODUCT
_HIERARCHY.PROD_HIER_ID
PRODUCTION_ORDE
R_FACT
PRODUCTION_ORDE
R_FACT
PRODUCTION_ORDE
R_FACT
PRODUCTION_ORDE
R_FACT
PRODUCTION_ORDE
R_FACT
PRODUCTION_ORDE
R_FACT
PRODUCTION_ORDE
R_FACT
PRODUCTION_ORDE
R_FACT
ACCT_ASSIGNMENT_
CATEGORY
BUSINESS_AREA BUSINESS_AREA.BUS_AREA_ID=PRO
CHART_OF_ACCOUNTSCHART_OF_ACCOUNTS.CHART_OF_
COMPANY_CODE COMPANY_CODE.CMPNY_CODE_ID=
CONTROLLING_AREA CONTROLLING_AREA.CTRL_AREA_ID
COST_CENTER PRODUCTION_ORDER_FACT.CTRL_A
COST_CENTER_HIER
_HZ
COST_CENTER_HIER
_VR
ACCT_ASSIGNMENT_CATEGORY.ACC
T_ASSIGN_CATEG_ID=PRODUCTION_
ORDER_FACT.ACCT_ASSIGN_CATEG
_ID
DUCTION_ORDER_FACT.BUS_AREA_I
D
ACCT_ID=PRODUCTION_ORDER_FAC
T.CHART_OF_ACCT_ID
PRODUCTION_ORDER_FACT.CMPNY_
CODE_ID
=PRODUCTION_ORDER_FACT.CTRL_
AREA_ID
REA_ID=COST_CENTER.CTRL_AREA_
ID AND
PRODUCTION_ORDER_FACT.COST_C
NTR_ID=COST_CENTER.COST_CNTR
_ID
PRODUCTION_ORDER_FACT.CTRL_A
REA_ID=COST_CENTER_HIER_HZ.CT
RL_AREA_ID and
PRODUCTION_ORDER_FACT.COST_C
NTR_ID=COST_CENTER_HIER_HZ.CO
ST_CNTR_ID
PRODUCTION_ORDER_FACT.CTRL_A
REA_ID=COST_CENTER_HIER_VR.CT
RL_AREA_ID and
PRODUCTION_ORDER_FACT.COST_C
NTR_ID=COST_CENTER_HIER_VR.CH
ILD_ID
4
SAP BusinessObjects Project Systems Rapid Mart XI 3.2 for SAP solutions Business Guide 79
Page 86

Reports
4
Network (Production) Order
Fact Table Dimension Table Join Expression
PRODUCTION_ORDE
R_FACT
PRODUCTION_ORDE
R_FACT
PRODUCTION_ORDE
R_FACT
PRODUCTION_ORDE
R_FACT
PRODUCTION_ORDE
R_FACT
PRODUCTION_ORDE
R_FACT
PRODUCTION_ORDE
R_FACT
PRODUCTION_ORDE
R_FACT
PRODUCTION_ORDE
R_FACT
COST_ELEMENT PRODUCTION_ORDER_FACT.CHART_
OF_ACCT_ID=COST_ELEMENT.CHAR
T_OF_ACCT_ID and
PRODUCTION_ORDER_FACT.COST_E
LEM_ID=COST_ELEMENT.COST_ELE
M_ID
COST_ELEMENT_HIE
R_HZ
COST_ELEMENT_HIE
R_VR
CURRENCY CURRENCY.CURR_ID=PRODUCTION_
DOCUMENT_TYPE DOCUMENT_TYPE.DOC_CATEG_ID=P
FUNCTIONAL_AREA PRODUCTION_ORDER_FACT.FUNCTN
FUNCTIONAL_AREA_
HIER_HZ
FUNCTIONAL_AREA_
HIER_VR
INTERNAL_ORDER PRODUCTION_ORDER_FACT.INTERN
PRODUCTION_ORDER_FACT.COST_E
LEM_ID=COST_ELEMENT_HIER_HZ.C
OST_ELEM_ID and
PRODUCTION_ORDER_FACT.CHART_
OF_ACCT_ID=COST_ELEMENT_HIER_
HZ.CHART_OF_ACCT_ID
PRODUCTION_ORDER_FACT.CHART_
OF_ACCT_ID=COST_ELEMENT_HIER_
VR.CHART_OF_ACCT_ID and
PRODUCTION_ORDER_FACT.COST_E
LEM_ID=COST_ELEMENT_HIER_VR.C
HILD_ID
ORDER_FACT.CURR_ID
RODUCTION_ORDER_FACT.DOC_CAT
EG_ID and
DOCUMENT_TYPE.DOC_TYPE_ID=PR
ODUCTION_ORDER_FACT.DOC_TYPE
_ID and
DOCUMENT_TYPE.DIM_SRC_ID=PRO
DUCTION_ORDER_FACT.DIM_SRC_ID
_DOCTYP
L_AREA_ID=FUNCTIONAL_AREA.FUN
CTNL_AREA_ID
PRODUCTION_ORDER_FACT.FUNCTN
L_AREA_ID=FUNCTIONAL_AREA_HIE
R_HZ.FUNCTNL_AREA_ID
PRODUCTION_ORDER_FACT.FUNCTN
L_AREA_ID=FUNCTIONAL_AREA_HIE
R_VR.CHILD_ID
AL_ORDER_ID=INTERNAL_ORDER.IN
TERNAL_ORDER_ID
80 SAP BusinessObjects Project Systems Rapid Mart XI 3.2 for SAP solutions Business Guide
Page 87

Fact Table Dimension Table Join Expression
PRODUCTION_ORDE
R_FACT
PRODUCTION_ORDE
R_FACT
PRODUCTION_ORDE
R_FACT
PRODUCTION_ORDE
R_FACT
PRODUCTION_ORDE
R_FACT
PRODUCTION_ORDE
R_FACT
PRODUCTION_ORDE
R_FACT
PRODUCTION_ORDE
R_FACT
PRODUCTION_ORDE
R_FACT
PRODUCTION_ORDE
R_FACT
INTERNAL_ORDER_HI
ER_HZ
INTERNAL_ORDER_HI
ER_VR
INTERNAL_ORDER_S
TATUS
MATERIAL PRODUCTION_ORDER_FACT.MATERI
MATERIAL_BATCH PRODUCTION_ORDER_FACT.BATCH_I
MATERIAL_BY_PLANT PRODUCTION_ORDER_FACT.MATERI
MATERIAL_GROUP PRODUCTION_ORDER_FACT.MTRL_G
MATERIAL_TYPE PRODUCTION_ORDER_FACT.MTRL_T
MRP_CONTROLLER PRODUCTION_ORDER_FACT.MRP_CT
PRODUCTION_ORDE
R_FACT
PRODUCTION_ORDER_FACT.INTERN
AL_ORDER_ID=INTERNAL_ORDER_HI
ER_HZ.INTERNAL_ORDER_ID
PRODUCTION_ORDER_FACT.INTERN
AL_ORDER_ID=INTERNAL_ORDER_HI
ER_VR.CHILD_ID
PRODUCTION_ORDER_FACT.DOC_TY
PE_ID=INTERNAL_ORDER_STATUS.D
OC_TYPE_ID and
PRODUCTION_ORDER_FACT.ORDER_
STATUS_ID=INTERNAL_ORDER_STAT
US.ORDER_STATUS_ID
AL_ID=MATERIAL.MATERIAL_ID
D=MATERIAL_BATCH.BATCH_ID and
PRODUCTION_ORDER_FACT.MATERI
AL_ID=MATERIAL_BATCH.MATERIAL_I
D and
PRODUCTION_ORDER_FACT.PLANT_I
D=MATERIAL_BATCH.PLANT_ID
AL_ID=MATERIAL_BY_PLANT.MATERI
AL_ID and
PRODUCTION_ORDER_FACT.PLANT_I
D=MATERIAL_BY_PLANT.PLANT_ID
RP_ID=MATERIAL_GROUP.MTRL_GRP
_ID
YPE_ID=MATERIAL_TYPE.MTRL_TYP
E_ID
RLLER_ID=MRP_CONTROLLER.MRP_
CTRLLER_ID and
PRODUCTION_ORDER_FACT.PLANT_I
D=MRP_CONTROLLER.PLANT_ID
PRODUCTION_ORDER_FACT.DOC_CA
TEG_ID='20'
Reports
Network (Production) Order
4
SAP BusinessObjects Project Systems Rapid Mart XI 3.2 for SAP solutions Business Guide 81
Page 88

Reports
4
Network (Production) Order
Fact Table Dimension Table Join Expression
PRODUCTION_ORDE
R_FACT
PRODUCTION_ORDE
R_FACT
PRODUCTION_ORDE
R_FACT
PRODUCTION_ORDE
R_FACT
PRODUCTION_ORDE
R_FACT
PRODUCTION_ORDE
R_FACT
PRODUCTION_ORDE
R_FACT
PRODUCTION_ORDE
R_FACT
PRODUCTION_ORDE
R_FACT
NETWORK_PROFILE PRODUCTION_ORDER_FACT.GROUP
_APPLICTN_ID=NETWORK_PROFILE.
GROUP_APPLICTN_ID and
PRODUCTION_ORDER_FACT.NETWO
RK_PROFILE_ID=NETWORK_PROFILE
.NETWORK_PROFILE_ID
OBJECT_CLASS PRODUCTION_ORDER_FACT.OBJ_CL
ASS_ID=OBJECT_CLASS.OBJ_CLASS
_ID
OBJECT_NUMBER_TYPEPRODUCTION_ORDER_FACT.OBJ_NU
M_TYPE_ID=OBJECT_NUMBER_TYPE
.OBJ_NUM_TYPE_ID
OBJECT_STATUS_HZ PRODUCTION_ORDER_FACT.OBJ_ID=
OBJECT_STATUS_HZ.OBJ_ID
PLANT PLANT.PLANT_ID=PRODUCTION_ORD
ER_FACT.PLANT_ID
PLANT_LOCATION PLANT_LOCATION.PLANT_ID=PRODU
CTION_ORDER_FACT.PLANT_ID and
PLANT_LOCATION.LOCATN_ID=PROD
UCTION_ORDER_FACT.LOCATN_ID
PRODUCT_HIERARCHYPRODUCTION_ORDER_FACT.PROD_H
IER_ID=PRODUCT_HIERARCHY.PROD
_HIER_ID
PRODUCTION_SCHED
ULER
PROFIT_CENTER PRODUCTION_ORDER_FACT.CTRL_A
PRODUCTION_ORDER_FACT.PLANT_I
D =
PRODUCTION_SCHEDULER.PLANT_I
D AND
PRODUCTION_ORDER_FACT.PROD_S
CHEDLER_ID=PRODUCTION_SCHED
ULER.PROD_SCHEDLER_ID
REA_ID=PROFIT_CENTER.CTRL_ARE
A_ID and
PRODUCTION_ORDER_FACT.PROFIT
_CNTR_ID=PROFIT_CENTER.PROFIT_
CNTR_ID
82 SAP BusinessObjects Project Systems Rapid Mart XI 3.2 for SAP solutions Business Guide
Page 89

Fact Table Dimension Table Join Expression
PRODUCTION_ORDE
R_FACT
PRODUCTION_ORDE
R_FACT
PRODUCTION_ORDE
R_FACT
PRODUCTION_ORDE
R_FACT
PRODUCTION_ORDE
R_FACT
PRODUCTION_ORDE
R_FACT
PRODUCTION_ORDE
R_FACT
PRODUCTION_ORDE
R_FACT
PRODUCTION_ORDE
R_FACT
PRODUCTION_ORDE
R_FACT
PRODUCTION_ORDE
R_FACT
PROFIT_CENTER_HIE
R_HZ
PROFIT_CENTER_HIE
R_VR
PROJECT PRODUCTION_ORDER_FACT.PROJ_I
PROJECT_ELEMENT PRODUCTION_ORDER_FACT.PROJ_E
PROJECT_ELEMENT_
HIER_HZ
PROJECT_ELEMENT_
HIER_VR
PURCH_ORGANIZATIONPURCH_ORGANIZATION.PURCH_ORG
ROUTING ROUTING.ROUTING_ID=PRODUCTION
SERVICE_PERSON SERVICE_PERSON.PERSON_ID=PRO
SPECIAL_PROCUREM
ENT_TYPE
STORAGE_LOCATION STORAGE_LOCATION.STORAGE_LOC
PRODUCTION_ORDER_FACT.CTRL_A
REA_ID=PROFIT_CENTER_HIER_HZ.C
TRL_AREA_ID and
PRODUCTION_ORDER_FACT.PROFIT
_CNTR_ID=PROFIT_CENTER_HIER_H
Z.PROFIT_CNTR_ID
PRODUCTION_ORDER_FACT.CTRL_A
REA_ID=PROFIT_CENTER_HIER_VR.
CTRL_AREA_ID and
PRODUCTION_ORDER_FACT.PROFIT
_CNTR_ID=PROFIT_CENTER_HIER_V
R.CHILD_ID
D=PROJECT.PROJ_ID
LEM_ID=PROJECT_ELEMENT.PROJ_E
LEM_ID
PRODUCTION_ORDER_FACT.PROJ_E
LEM_ID=PROJECT_ELEMENT_HIER_H
Z.PROJ_ELEM_ID
PRODUCTION_ORDER_FACT.PROJ_E
LEM_ID=PROJECT_ELEMENT_HIER_V
R.CHILD_ID
_ID=PRODUCTION_ORDER_FACT.PU
RCH_ORG_ID
_ORDER_FACT.ROUTING_ID
DUCTION_ORDER_FACT.PERSON_ID_
RESP
PRODUCTION_ORDER_FACT.SPECL_
PROCUREMNT_TYPE_ID=SPECIAL_P
ROCUREMENT_TYPE.SPECL_PROCU
REMNT_TYPE_ID
ATN_ID=PRODUCTION_ORDER_FACT.
STORAGE_LOCATN_ID
Reports
Network (Production) Order
4
SAP BusinessObjects Project Systems Rapid Mart XI 3.2 for SAP solutions Business Guide 83
Page 90

Reports
4
Network Relationship
Fact Table Dimension Table Join Expression
PRODUCTION_ORDE
R_FACT
PRODUCTION_ORDE
R_FACT
PRODUCTION_ORDE
R_FACT
PRODUCTION_ORDE
R_FACT
PRODUCTION_ORDE
R_FACT
OBJECT_STATUS_HZ OBJECT_STATUS OBJECT_STATUS_HZ.OBJ_ID=OBJEC
Additional joins between dimension and hierarchy tables are shown in
“Recommended table joins” on page 27 for master reports.
TASK_LIST_TYPE TASK_LIST_TYPE.GROUP_TYPE_ID=P
RODUCTION_ORDER_FACT.GROUP_T
YPE_ID
TASK_LIST_USAGE TASK_LIST_USAGE.GROUP_USG_ID=
PRODUCTION_ORDER_FACT.GROUP
_USG_ID
TIME_DIM TIME_DIM.CALENDAR_DATE=PRODU
CTION_ORDER_FACT.CREATE_DATE
UNIT_OF_MEASURE UNIT_OF_MEASURE.UOM_ID=PRODU
CTION_ORDER_FACT.UOM_ID
VALUATION_AREA VALUATION_AREA.VALUATN_AREA_ID
=PRODUCTION_ORDER_FACT.VALUA
TN_AREA_ID
T_STATUS.OBJ_ID
Network Relationship
Network relationships describe the link between the start and finish points of
two activities in a network and determine the sequence of activities.
Reports
Network order is suited to detail, trend, and high level analysis. Below is a list
of the reports included here for analysis:
• Network Relationship Overview
Network Relationship Overview
View Network Relationship overview for the selected Project (or Network also called Internal Order Id) and Operation Numbers. Network relationship
display using SAP transaction CN23.
84 SAP BusinessObjects Project Systems Rapid Mart XI 3.2 for SAP solutions Business Guide
Page 91

Reports
Network Relationship
Overview
View overview of Project operations for the given network.
Details
Detailed view of project operations based. Analyze data by Parent Operation
activity number.
4
Calculations
• Successor Flag = If([Operation Num]=[Parent Operation Num]; ""; "X")
Report SQL
• All report SQL is located in the Rapid Mart installation directory under
"\Sample\DML".
SAP BusinessObjects Project Systems Rapid Mart XI 3.2 for SAP solutions Business Guide 85
Page 92

Reports
4
Network Relationship
Recommended Table Joins
To an alyze Network Relationship data you will need to create joins between the
fact and dimension tables as follows:
Fact Table Dimension Table Join Expression
NETWORK_RELATION
SHIP_FACT
NETWORK_RELATION
SHIP_FACT
NETWORK_RELATION
SHIP_FACT
NETWORK_RELATION
SHIP_FACT
NETWORK_RELATION
SHIP_FACT
NETWORK_RELATION
SHIP_FACT
NETWORK_RELATION
SHIP_FACT
NETWORK_RELATION
SHIP_FACT
NETWORK_RELATION
SHIP_FACT
NETWORK_RELATION
SHIP_FACT
NETWORK_RELATION
SHIP_FACT
BUSINESS_AREA BUSINESS_AREA.BUS_AREA_ID=NET
WORK_RELATIONSHIP_FACT.BUS_AR
EA_ID
COMPANY_CODE COMPANY_CODE.CMPNY_CODE_ID=
NETWORK_RELATIONSHIP_FACT.CM
PNY_CODE_ID
CONTROL_KEY NETWORK_RELATIONSHIP_FACT.CTR
L_KEY_ID=CONTROL_KEY.CTRL_KEY
_ID
CONTROLLING_AREA CONTROLLING_AREA.CTRL_AREA_ID
=NETWORK_RELATIONSHIP_FACT.CT
RL_AREA_ID
FUNCTIONAL_AREA NETWORK_RELATIONSHIP_FACT.FUN
CTNL_AREA_ID=FUNCTIONAL_AREA.
FUNCTNL_AREA_ID
FUNCTIONAL_AREA_
HIER_HZ
FUNCTIONAL_AREA_
HIER_VR
INTERNAL_ORDER NETWORK_RELATIONSHIP_FACT.INT
INTERNAL_ORDER_HI
ER_HZ
INTERNAL_ORDER_HI
ER_VR
MRP_CONTROLLER NETWORK_RELATIONSHIP_FACT.MR
NETWORK_RELATIONSHIP_FACT.FUN
CTNL_AREA_ID=FUNCTIONAL_AREA_
HIER_HZ.FUNCTNL_AREA_ID
NETWORK_RELATIONSHIP_FACT.FUN
CTNL_AREA_ID=FUNCTIONAL_AREA_
HIER_VR.CHILD_ID
ERNAL_ORDER_ID=INTERNAL_ORDE
R.INTERNAL_ORDER_ID
NETWORK_RELATIONSHIP_FACT.INT
ERNAL_ORDER_ID=INTERNAL_ORDE
R_HIER_HZ.INTERNAL_ORDER_ID
NETWORK_RELATIONSHIP_FACT.INT
ERNAL_ORDER_ID=INTERNAL_ORDE
R_HIER_VR.CHILD_ID
P_CTRLLER_ID=MRP_CONTROLLER.
MRP_CTRLLER_ID and
NETWORK_RELATIONSHIP_FACT.PLA
NT_ID=MRP_CONTROLLER.PLANT_ID
86 SAP BusinessObjects Project Systems Rapid Mart XI 3.2 for SAP solutions Business Guide
Page 93

Fact Table Dimension Table Join Expression
NETWORK_RELATION
SHIP_FACT
NETWORK_RELATION
SHIP_FACT
NETWORK_RELATION
SHIP_FACT
NETWORK_RELATION
SHIP_FACT
NETWORK_RELATION
SHIP_FACT
NETWORK_RELATION
SHIP_FACT
NETWORK_HIER_VR NETWORK_RELATIONSHIP_FACT.REL
ATIONSHIP_TYPE_ID=NETWORK_HIE
R_VR.RELATIONSHIP_TYPE_ID and
NETWORK_RELATIONSHIP_FACT.OPE
RATN_ROUTING_ID_PAR=NETWORK_
HIER_VR.OPERATN_ROUTING_ID_PA
RENT and
NETWORK_RELATIONSHIP_FACT.OPE
RATN_SEQ_ID_PAR=NETWORK_HIER
_VR.OPERATN_SEQ_ID_PARENT and
NETWORK_RELATIONSHIP_FACT.OPE
RATN_ROUTING_ID=NETWORK_HIER
_VR.OPERATN_ROUTING_ID_CHILD
and
NETWORK_RELATIONSHIP_FACT.OPE
RATN_SEQ_ID=NETWORK_HIER_VR.
OPERATN_SEQ_ID_CHILD
OBJECT_STATUS_HZ NETWORK_RELATIONSHIP_FACT.OBJ
_ID=OBJECT_STATUS_HZ.OBJ_ID
ORDER_OPERATION ORDER_OPERATION.OPERATN_ROU
TING_ID=NETWORK_RELATIONSHIP_
FACT.OPERATN_ROUTING_ID and
ORDER_OPERATION.OPERATN_SEQ_
ID=NETWORK_RELATIONSHIP_FACT.
OPERATN_SEQ_ID
PLANT PLANT.PLANT_ID=NETWORK_RELATI
ONSHIP_FACT.PLANT_ID
PLANT_LOCATION PLANT_LOCATION.PLANT_ID=NETWO
RK_RELATIONSHIP_FACT.PLANT_ID
AND
PLANT_LOCATION.LOCATN_ID=NETW
ORK_RELATIONSHIP_FACT.LOCATN_I
D
PROFIT_CENTER NETWORK_RELATIONSHIP_FACT.CTR
L_AREA_ID=PROFIT_CENTER.CTRL_
AREA_ID and
NETWORK_RELATIONSHIP_FACT.PRO
FIT_CNTR_ID=PROFIT_CENTER.PROF
IT_CNTR_ID
Reports
Network Relationship
4
SAP BusinessObjects Project Systems Rapid Mart XI 3.2 for SAP solutions Business Guide 87
Page 94

Reports
4
Network Relationship
Fact Table Dimension Table Join Expression
NETWORK_RELATION
SHIP_FACT
NETWORK_RELATION
SHIP_FACT
NETWORK_RELATION
SHIP_FACT
NETWORK_RELATION
SHIP_FACT
NETWORK_RELATION
SHIP_FACT
NETWORK_RELATION
SHIP_FACT
NETWORK_RELATION
SHIP_FACT
NETWORK_RELATION
SHIP_FACT
NETWORK_RELATION
SHIP_FACT
NETWORK_RELATION
SHIP_FACT
NETWORK_RELATION
SHIP_FACT
NETWORK_RELATION
SHIP_FACT
PROFIT_CENTER_HIE
R_HZ
PROFIT_CENTER_HIE
R_VR
PROJECT NETWORK_RELATIONSHIP_FACT.PRO
PROJECT_ELEMENT PROJECT_ELEMENT.PROJ_ELEM_ID=
PROJECT_ELEMENT_
HIER_HZ
PROJECT_ELEMENT_
HIER_VR
PURCH_ORGANIZATIONPURCH_ORGANIZATION.PURCH_ORG
RELATIONSHIP_TYPE RELATIONSHIP_TYPE.RELATIONSHIP
STORAGE_LOCATION STORAGE_LOCATION.STORAGE_LOC
TIME_DIM TIME_DIM.CALENDAR_DATE=NETWO
UNIT_OF_MEASURE UNIT_OF_MEASURE.UOM_ID=NETWO
VALUATION_AREA VALUATION_AREA.VALUATN_AREA_ID
NETWORK_RELATIONSHIP_FACT.CTR
L_AREA_ID=PROFIT_CENTER_HIER_
HZ.CTRL_AREA_ID and
NETWORK_RELATIONSHIP_FACT.PRO
FIT_CNTR_ID=PROFIT_CENTER_HIER
_HZ.PROFIT_CNTR_ID
NETWORK_RELATIONSHIP_FACT.CTR
L_AREA_ID=PROFIT_CENTER_HIER_
VR.CTRL_AREA_ID and
NETWORK_RELATIONSHIP_FACT.PRO
FIT_CNTR_ID=PROFIT_CENTER_HIER
_VR.CHILD_ID
J_ID=PROJECT.PROJ_ID
NETWORK_RELATIONSHIP_FACT.PRO
J_ELEM_ID
NETWORK_RELATIONSHIP_FACT.PRO
J_ELEM_ID=PROJECT_ELEMENT_HIE
R_HZ.PROJ_ELEM_ID
NETWORK_RELATIONSHIP_FACT.PRO
J_ELEM_ID=PROJECT_ELEMENT_HIE
R_VR.CHILD_ID
_ID=NETWORK_RELATIONSHIP_FACT.
PURCH_ORG_ID
_TYPE_ID=NETWORK_RELATIONSHIP
_FACT.RELATIONSHIP_TYPE_ID
ATN_ID=NETWORK_RELATIONSHIP_F
ACT.STORAGE_LOCATN_ID
RK_RELATIONSHIP_FACT.EARLST_ST
ART_DATE
RK_RELATIONSHIP_FACT.UOM_ID
=NETWORK_RELATIONSHIP_FACT.VA
LUATN_AREA_ID
88 SAP BusinessObjects Project Systems Rapid Mart XI 3.2 for SAP solutions Business Guide
Page 95

Reports
Project Cost
Fact Table Dimension Table Join Expression
NETWORK_RELATION
SHIP_FACT
NETWORK_RELATION
SHIP_FACT
NETWORK_RELATION
SHIP_FACT
NETWORK_RELATION
SHIP_FACT
OBJECT_STATUS_HZ OBJECT_STATUS OBJECT_STATUS_HZ.OBJ_ID=OBJEC
WORK_CENTER NETWORK_RELATIONSHIP_FACT.PLA
NT_ID=WORK_CENTER.PLANT_ID and
NETWORK_RELATIONSHIP_FACT.WO
RK_CNTR_ID=WORK_CENTER.WORK
_CNTR_ID
WORK_CENTER_CAT
EGORY
WORK_CENTER_HIER
_HZ
WORK_CENTER_HIER
_VR
NETWORK_RELATIONSHIP_FACT.WO
RK_CNTR_CATEG_ID=WORK_CENTE
R_CATEGORY.WORK_CNTR_CATEG_I
D
NETWORK_RELATIONSHIP_FACT.WO
RK_CNTR_ID=WORK_CENTER_HIER_
HZ.WORK_CNTR_ID and
NETWORK_RELATIONSHIP_FACT.PLA
NT_ID=WORK_CENTER_HIER_HZ.PLA
NT_ID
NETWORK_RELATIONSHIP_FACT.WO
RK_CNTR_ID=WORK_CENTER_HIER_
VR.CHILD_ID AND
NETWORK_RELATIONSHIP_FACT.PLA
NT_ID=WORK_CENTER_HIER_VR.PLA
NT_ID
T_STATUS.OBJ_ID
4
Additional joins between dimension and hierarchy tables are shown in
“Recommended table joins” on page 27 for master reports.
Project Cost
Project Costing is used to plan, monitor, and control project costs, thereby
achieving comprehensive cost accounting.
Reports
Project Cost is suited to a variety of cost detail, trend, and summary analysis.
Below is a list of the reports included here for analysis:
• Project Balance Trend Comparision
• Project Balance Trend by Period
• Project Balance Variance Trend
• Project Cost YTD Trend Analysis
SAP BusinessObjects Project Systems Rapid Mart XI 3.2 for SAP solutions Business Guide 89
Page 96
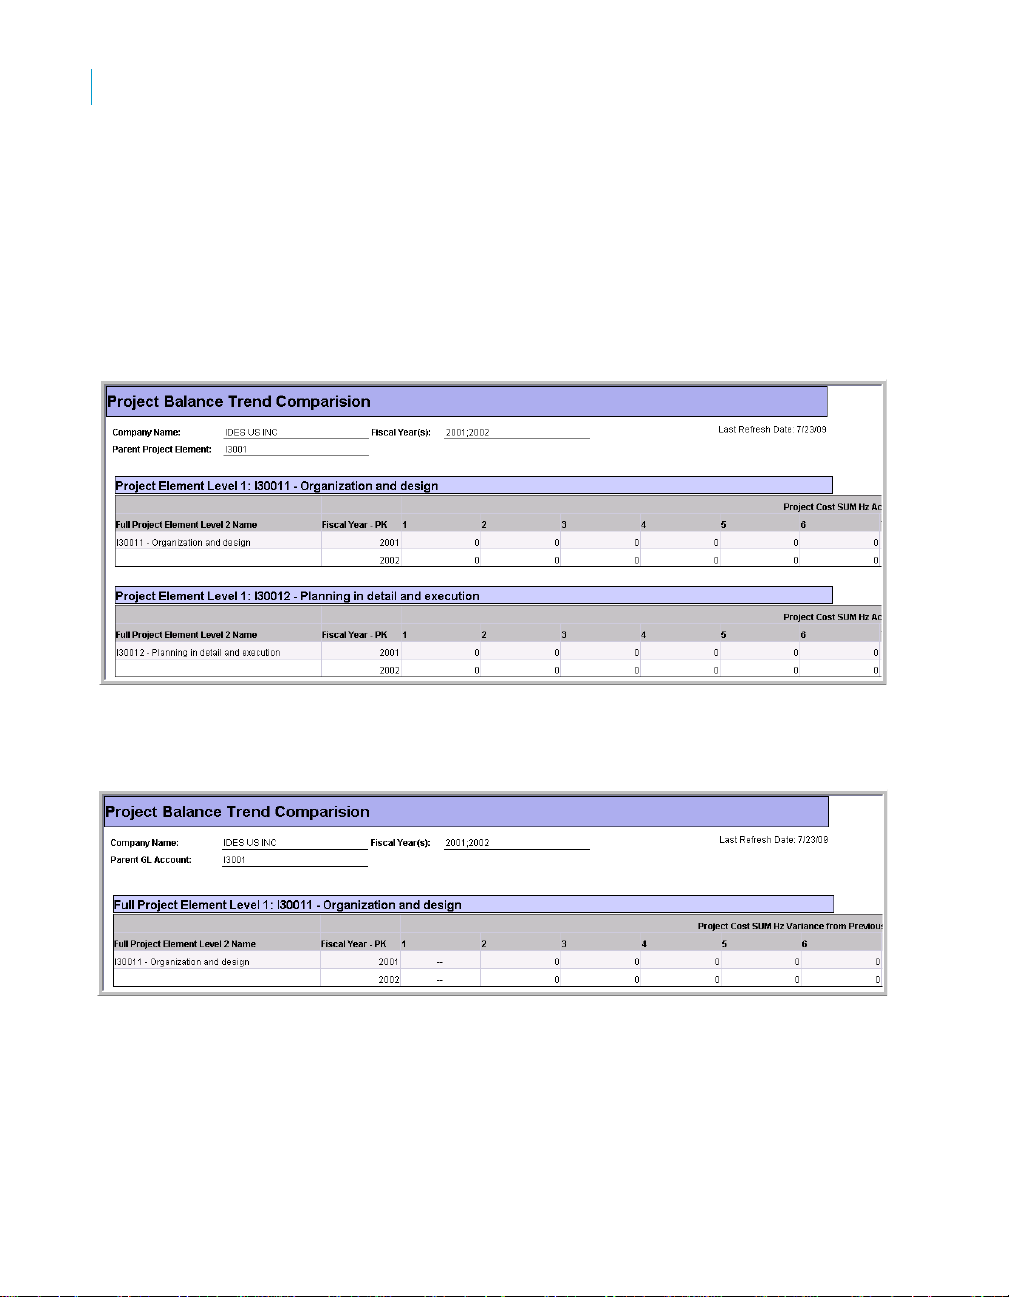
Reports
4
Project Cost
•
Project Cost Period Comparison
Project Balance Trend Comparision
Displays the project balance trend data for the selected Company Code,
Fiscal Years, and Parent Project Element.
Actual Balance Trend
View trend comparison (between fiscal years) for actual project summary
costs by project element.
Variance Previous Period
View trend comparison (between fiscal years) for actual project summary
costs by project element.
Calculations
• Variance From Previous Period calculations are all similar to:
Period 2 = [PROJ COST SUM Hz Actual PTD Balance Per 02
LOC]-[PROJ COST SUM Hz Actual PTD Balance Per 01 LOC]
90 SAP BusinessObjects Project Systems Rapid Mart XI 3.2 for SAP solutions Business Guide
Page 97
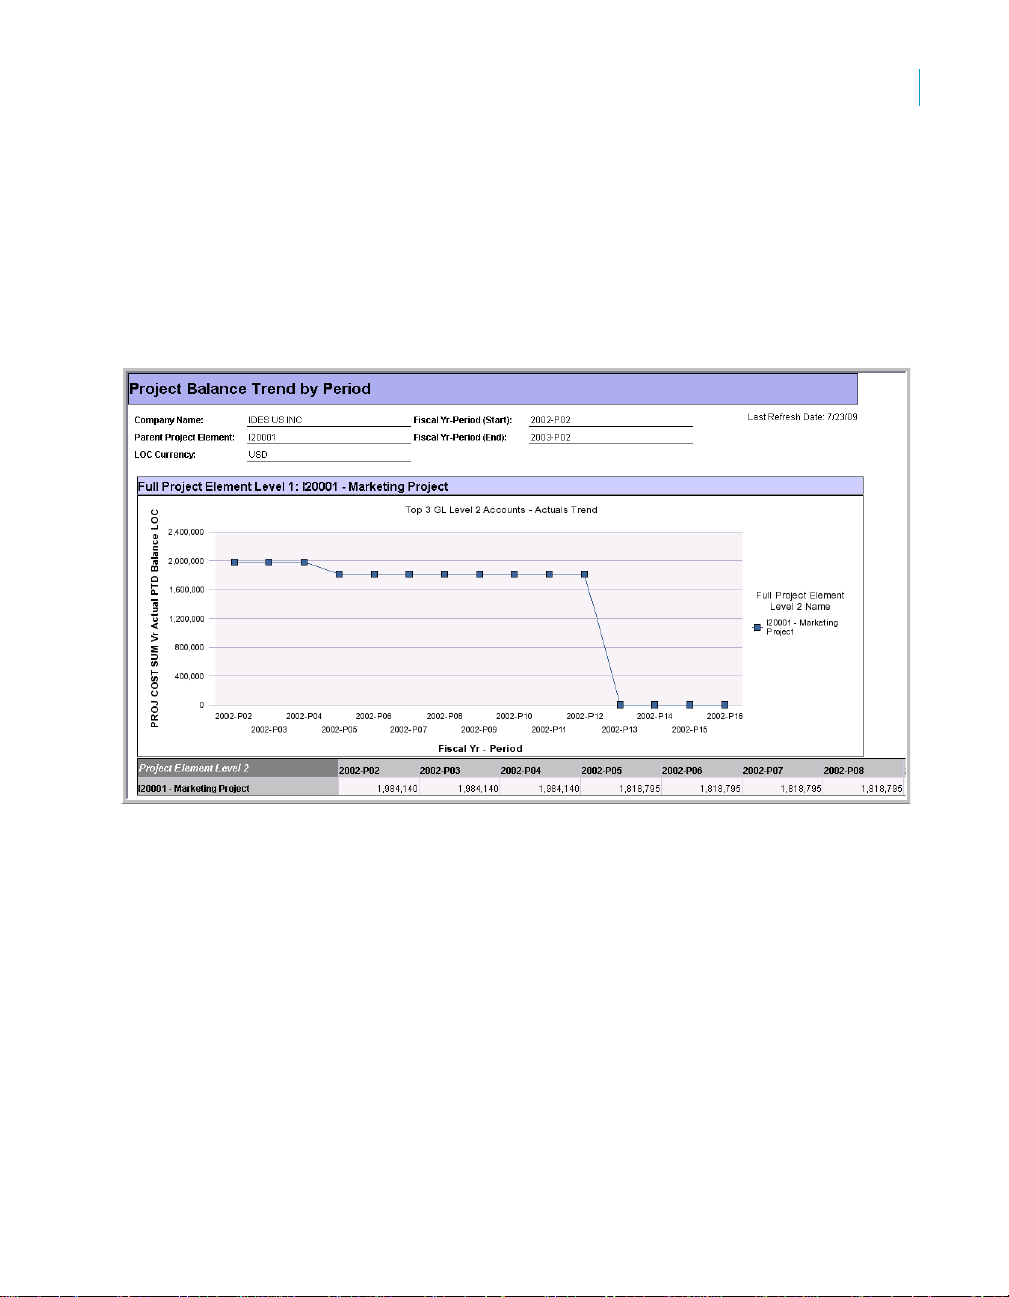
Report SQL
All report SQL is located in the Rapid Mart installation directory under
"\Sample\DML".
Project Balance Trend by Period
View actual project balance period trends for the selected Company Code,
Parent Project Element, and Fiscal Year-Period range. Results are grouped
by Project Element Hierarchy.
Reports
Project Cost
4
Report SQL
All report SQL is located in the Rapid Mart installation directory under
"\Sample\DML".
SAP BusinessObjects Project Systems Rapid Mart XI 3.2 for SAP solutions Business Guide 91
Page 98

Reports
4
Project Cost
Project Balance Variance Trend
View Actual, Planned (or Budget), V ariance, and Variance % period trends for
a specific Company Code, Parent Project Element, Fiscal Year, and Ledger
Version.
Calculations
• Actual = [PROJ COST SUM Vr Actual PTD Balance LOC]
• Budget = [PROJ COST SUM Vr Budget PTD Balance LOC]
• Variance = [PROJ COST SUM Vr Actual PTD Balance LOC]-[PROJ
COST SUM Vr Budget PTD Balance LOC]
• Variance % = If([Actual] <> 0; [Variance]/[Actual]; If([Actual]= 0 And
[Variance]=0; 0;1))
Report SQL
All report SQL is located in the Rapid Mart installation directory under
"\Sample\DML".
92 SAP BusinessObjects Project Systems Rapid Mart XI 3.2 for SAP solutions Business Guide
Page 99
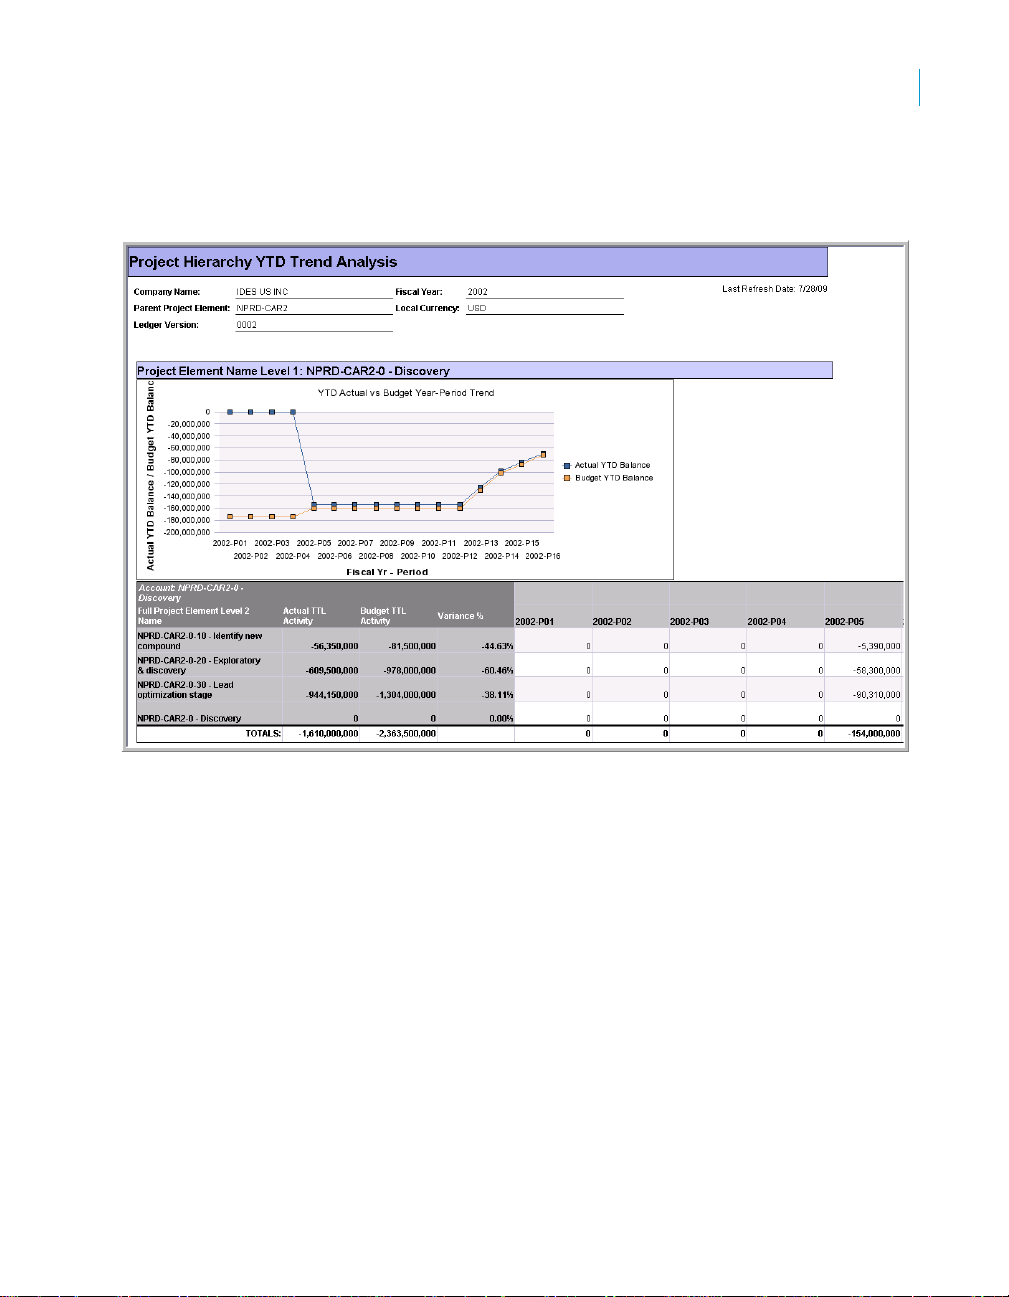
Project Cost YTD Trend Analysis
View Actual YTD trends for a specific Company Code, Parent Project
Element, Fiscal Year, and Ledger Version.
Reports
Project Cost
4
Calculations
• Actual YTD Balance = PROJ COST SUM Vr Actual YTD Balance LOC]
• Balance Variance = [PROJ COST SUM Vr Actual YTD Balance
LOC]-[PROJ COST SUM Vr Budget YTD Balance LOC]
• Budget YTD Balance = [PROJ COST SUM Vr Budget YTD Balance LOC]
• Variance % = If([PROJ COST SUM Vr Actual YTD Balance LOC] <> 0;
[Balance Variance]/[PROJ COST SUM Vr Actual YTD Balance LOC];
If([PROJ COST SUM Vr Actual YTD Balance LOC]=0 And [Balance
Variance]<>0; 1; 0))
Report SQL
All report SQL is located in the Rapid Mart installation directory under
"\Sample\DML".
SAP BusinessObjects Project Systems Rapid Mart XI 3.2 for SAP solutions Business Guide 93
Page 100

Reports
4
Project Cost
Project Cost Period Comparison
View Actual, Planned (or Budget), Variance Project Element hierarchy
comparison for selected Fiscal Year-Periods and Ledger Version.
Calculations
• Actuals = [PROJ COST SUM Vr Actual PTD Balance LOC]
• Budget = [PROJ COST SUM Vr Budget PTD Balance LOC]
• Variance = [Actuals]-[Budget]
• Variance % = If([Actuals] <> 0; [Variance]/[Actuals]; If([Actuals]<> 0 And
[Variance] = 0; 1; 0))
Report SQL
All report SQL is located in the Rapid Mart installation directory under
"\Sample\DML".
94 SAP BusinessObjects Project Systems Rapid Mart XI 3.2 for SAP solutions Business Guide
 Loading...