

Page 1

Desktop Intelligence Access and
Analysis Guide
BusinessObjects Enterprise XI 3.1
Page 2

Copyright
© 2008 Business Objects, an SAP company. All rights reserved. Business Objects
owns the following U.S. patents, which may cover products that are offered and
licensed by Business Objects: 5,295,243; 5,339,390; 5,555,403; 5,590,250;
5,619,632; 5,632,009; 5,857,205; 5,880,742; 5,883,635; 6,085,202; 6,108,698;
6,247,008; 6,289,352; 6,300,957; 6,377,259; 6,490,593; 6,578,027; 6,581,068;
6,628,312; 6,654,761; 6,768,986; 6,772,409; 6,831,668; 6,882,998; 6,892,189;
6,901,555; 7,089,238; 7,107,266; 7,139,766; 7,178,099; 7,181,435; 7,181,440;
7,194,465; 7,222,130; 7,299,419; 7,320,122 and 7,356,779. Business Objects and
its logos, BusinessObjects, Business Objects Crystal Vision, Business Process
On Demand, BusinessQuery, Cartesis, Crystal Analysis, Crystal Applications,
Crystal Decisions, Crystal Enterprise, Crystal Insider, Crystal Reports, Crystal
Vision, Desktop Intelligence, Inxight and its logos , LinguistX, Star Tree, Table
Lens, ThingFinder, Timewall, Let There Be Light, Metify, NSite, Rapid Marts,
RapidMarts, the Spectrum Design, Web Intelligence, Workmail and Xcelsius are
trademarks or registered trademarks in the United States and/or other countries
of Business Objects and/or affiliated companies. SAP is the trademark or registered
trademark of SAP AG in Germany and in several other countries. All other names
mentioned herein may be trademarks of their respective owners.
Third-party
Contributors
Business Objects products in this release may contain redistributions of software
licensed from third-party contributors. Some of these individual components may
also be available under alternative licenses. A partial listing of third-party
contributors that have requested or permitted acknowledgments, as well as required
notices, can be found at: http://www.businessobjects.com/thirdparty
2008-09-03
Page 3

Contents
Introduction to Desktop Intelligence 17Chapter 1
What is Desktop Intelligence?...................................................................18
Demo materials and samples....................................................................21
Upgrading from earlier versions of Desktop Intelligence...........................21
The Repository..........................................................................................21
Folders and Categories.............................................................................21
Introduction to Accessing Data with Desktop Intelligence 25Chapter 2
Where does the data come from?........................................................18
Presenting and analyzing data.............................................................19
Sharing information..............................................................................19
Security................................................................................................20
Keeping a document's data up-to-date................................................20
Folders.................................................................................................22
Categories............................................................................................22
There are 2 types of folders:................................................................22
There are two types of Categories:......................................................22
What data sources are available?.............................................................26
How do you access data sources?......................................................26
Can all Desktop Intelligence users build data providers?....................28
Who sets up database connections?...................................................29
Restrictive connections........................................................................30
Can you combine data from different sources in one report?..............31
Workflows for accessing data....................................................................31
Building a data provider when you create a new document.................31
Building a query in an existing document.............................................33
Desktop Intelligence Access and Analysis Guide 3
Page 4

Contents
Editing data providers...........................................................................34
Using the repository...................................................................................36
Exporting to the repository.........................................................................37
To Export a document to the Repository..............................................37
Creating a New Folder.........................................................................37
Exporting to a Category........................................................................38
To place a file in a Category.................................................................38
To schedule export of a document.......................................................38
Managing Categories.................................................................................40
To manage your Categories.................................................................40
To Add a category to the list of categories...........................................40
To Delete a category from the list of categories...................................41
To Edit a category.................................................................................41
Importing from the repository.....................................................................41
To import a document from a folder in the repository ..........................41
Retrieving different instances of a given document.............................42
Sending documents from Desktop Intelligence.........................................42
To send documents to users and groups from Desktop Intelligence.....43
To send documents by email with Desktop Intelligence.......................43
Sending documents from Desktop Intelligence.........................................44
Building Queries on Universes 45Chapter 3
Overview....................................................................................................46
What is a universe?..............................................................................46
Who is responsible for creating universes?.........................................46
What are universe queries?.................................................................47
Demonstration materials......................................................................47
Building a basic query on a universe.........................................................49
Displaying the query panel...................................................................49
Building a query in the Query Panel and running the query.................51
Saving the definition of a query............................................................54
4 Desktop Intelligence Access and Analysis Guide
Page 5

Contents
Building a more powerful query.................................................................54
Defining scope of analysis....................................................................55
Applying conditions..............................................................................57
Applying sorts.......................................................................................60
Setting options and running a query....................................................61
Running a query on a different universe....................................................62
To run a query on a different universe..................................................62
Building Queries with Other Types of Data Provider 65Chapter 4
Overview....................................................................................................66
Using free-hand SQL.................................................................................66
Creating a report using free-hand SQL................................................66
Editing a free-hand SQL script.............................................................68
Creating or editing a connection for free-hand SQL.............................68
Creating a report showing sales by store and category.......................70
Creating interactive reports using free-hand SQL................................71
Restrictions on free-hand SQL scripts.................................................75
Using stored procedures............................................................................75
What are stored procedures?...............................................................76
How do you use stored procedures in Desktop Intelligence?..............76
Restrictions on stored procedures.......................................................76
Using a stored procedure to retrieve data............................................76
Using personal data files...........................................................................78
What are the benefits of using personal data files?.............................78
Creating a report using a personal data file.........................................79
Using Visual Basic for Applications procedures........................................81
To write a VBA data provider................................................................81
To create a report using a VBA data provider......................................82
Accessing an Outlook inbox using VBA...............................................82
Using XML files..........................................................................................86
What is XML?.......................................................................................86
Desktop Intelligence Access and Analysis Guide 5
Page 6

Contents
Creating a report using an XML file......................................................88
To set the location of XML files.............................................................90
Combining Data from Different Sources 91Chapter 5
Overview....................................................................................................92
Which data sources are available?............................................................92
Including data from different data sources in the same report..................92
Which data providers can you combine in one report?........................93
Using separate data providers for separate blocks in one report.........93
Displaying data from separate data providers in the same block.........95
Basing a data provider on an existing data provider.................................97
To base a data provider on an existing data provider..........................97
Prompts and linking..............................................................................97
Linking data providers................................................................................98
What situations require you to link data providers?.............................98
Deleting the link between data providers...........................................101
Managing Data Providers 103Chapter 6
Overview..................................................................................................104
Renaming data providers........................................................................104
Why rename data providers?.............................................................105
To rename data providers...................................................................106
Getting statistics on data providers.........................................................106
To get statistics on data providers......................................................106
Purging and deleting data providers........................................................107
To purge or delete a data provider.....................................................107
Using data providers efficiently................................................................107
Reports showing revenue by country and resort, revenue by country.108
6 Desktop Intelligence Access and Analysis Guide
Page 7

Contents
Introduction to Data Analysis 109Chapter 7
Overview..................................................................................................110
On-report analysis...................................................................................110
Desktop Intelligence drill mode................................................................111
Slice and dice mode................................................................................111
Analyzing Data in Drill Mode 113Chapter 8
Overview..................................................................................................114
What is drill mode?.............................................................................114
How does drill mode work?................................................................114
Hierarchies.........................................................................................115
Using drill mode.......................................................................................116
To switch to drill mode........................................................................116
Drilling down.......................................................................................117
Displaying different values in the Drill toolbar....................................118
Drilling up...........................................................................................118
Undoing drill actions...........................................................................118
Drilling across.....................................................................................119
Drilling on charts......................................................................................120
To drill on charts.................................................................................120
Drilling on multiple hierarchies.................................................................120
To drill on multiple hierarchies............................................................121
To drill up on multiple hierarchies.......................................................121
Getting a different view of your data........................................................121
Changing the data in tables as you drill.............................................122
Using the Drill toolbar.........................................................................124
Analyzing measures in drill mode............................................................126
To expand a measure.........................................................................127
To collapse a measure.......................................................................127
Desktop Intelligence Access and Analysis Guide 7
Page 8

Contents
Making copies of reports while you work.................................................128
To make a copy of a report.................................................................128
Extending analysis...................................................................................128
To expand the scope of analysis........................................................128
Drilling through to the database to bring in new data.........................129
Bringing in new data using filters.......................................................129
Drilling using custom hierarchies.............................................................131
Editing hierarchies..............................................................................131
Creating hierarchies...........................................................................133
Qualifying data for hierarchies.................................................................133
To requalify local variables and formulas...........................................134
To requalify variables..........................................................................134
To requalify user objects.....................................................................135
Printing from drill mode............................................................................135
To insert Drill toolbar contents as a title.............................................135
To print a report from drill mode.........................................................136
Setting options for working in drill mode..................................................136
To set options for drill mode...............................................................136
Slice and Dice Mode 137Chapter 9
Overview..................................................................................................138
Working in slice-and-dice mode...............................................................138
To display the Slice and Dice Panel:..................................................138
Working with master/detail reports in slice and dice mode................139
To undo a master/detail report............................................................141
Deactivating sections of master/detail reports...................................142
Positioning data horizontally in slice-and-dice mode.........................144
Working with crosstabs and 3-D matrix charts...................................144
Displaying and removing data in Slice-and-Dice Mode......................148
Deleting, renaming and resetting blocks in Slice and Dice mode......148
To transform blocks in Slice-and-Dice mode......................................149
8 Desktop Intelligence Access and Analysis Guide
Page 9

Contents
Applying further modifications in slice and dice mode.......................149
Filtering and Ranking Data 153Chapter 10
Overview..................................................................................................154
Limiting the data displayed......................................................................154
To insert a filter...................................................................................154
Managing filters..................................................................................155
Creating more complex filters.............................................................158
Ignoring filters.....................................................................................159
Ordering data...........................................................................................160
Sorting data........................................................................................160
To sort months correctly.....................................................................162
Managing multiple sorts.....................................................................163
Using ranking to view the top and bottom values....................................164
To apply a ranking on report data.......................................................165
Managing ranking with filters and sorts..............................................168
Hiding columns and rows of data............................................................168
To hide columns and rows of data......................................................168
Highlighting data......................................................................................169
To create an alerter............................................................................169
Switching alerters off and on..............................................................171
Working with existing alerters.............................................................172
Customizing Queries on Universes 175Chapter 11
Overview..................................................................................................176
Creating user objects...............................................................................176
Why create a user object?..................................................................176
What does a user object consist of?..................................................177
What are the restrictions on user objects?.........................................177
How can an end-user share user objects with other users?..............178
Desktop Intelligence Access and Analysis Guide 9
Page 10

Contents
Creating, editing and deleting user objects........................................178
To create a time hierarchy for a user object.......................................181
Applying complex conditions on queries.................................................181
To benefit from complex conditions: Which customers made reservations
for 2001 and 2002?............................................................................182
To apply a complex condition on a query...........................................183
Tips for applying complex conditions.................................................187
To edit complex conditions.................................................................190
To delete complex conditions.............................................................190
Applying a condition with a calculation...............................................190
Examining the SQL............................................................................194
Applying a condition with a subquery.................................................194
Subqueries and calculations..............................................................197
Using an existing query in a condition.....................................................198
To return list of resorts/revenues where resort country revenue >
$1000000...........................................................................................198
Applying groups of conditions..................................................................199
Organizing groups of conditions.........................................................199
AND and OR......................................................................................200
Order of precedence..........................................................................201
To apply groups of conditions.............................................................202
To delete groups of conditions............................................................203
Building combined queries......................................................................203
To build a combined query.................................................................203
Restrictions on combined queries......................................................205
Using SQL from Desktop Intelligence queries...................................207
Using and Customizing Lists of Values 209Chapter 12
Overview..................................................................................................210
What is a list of values?...........................................................................210
How are lists of values created?..............................................................210
10 Desktop Intelligence Access and Analysis Guide
Page 11

Contents
Customizing lists of values in Desktop Intelligence.................................210
Editing lists of values...............................................................................211
Example: To show cities and regions in a list of cities........................211
Assigning personal data to a list of values..............................................212
To assign personal data from a text file..............................................212
To assign personal data from an Excel file.........................................213
To assign personal data from a dBase file.........................................214
To display, refresh and purge lists of values............................................214
Creating Calculations 217Chapter 13
Overview..................................................................................................218
Calculations.............................................................................................218
To add simple calculations to reports.................................................218
Count and Count All...........................................................................220
Making calculations on dimension and detail objects........................220
Calculation examples.........................................................................221
Converting to and from Euros..................................................................223
What is the euro?...............................................................................223
Displaying the euro symbol................................................................224
How does the conversion work?........................................................224
Conversion errors...............................................................................224
Displaying currency formats in Desktop Intelligence..........................225
To convert to euros.............................................................................225
To convert from euros.........................................................................226
Displaying rounding errors.................................................................226
Conversion rates................................................................................227
Triangulation.......................................................................................230
Overview 231Chapter 14
Who should read this chapter..................................................................232
Desktop Intelligence Access and Analysis Guide 11
Page 12

Contents
What's in this chapter..............................................................................232
Introduction to contexts and extended syntax 233Chapter 15
Semantically-dynamic calculations..........................................................234
Understanding input and output contexts................................................234
How Desktop Intelligence defines input and output contexts.............235
Using your understanding of input and output contexts..........................237
Viewing the extended syntax of a formula..........................................239
Viewing extended syntax by using the Formula Bar..........................239
Viewing extended syntax by using the Define As Variable command.239
Using extended syntax for advanced calculations 241Chapter 16
Defining calculation contexts with extended syntax................................242
How to define input and output contexts.................................................244
Syntax for input and output contexts.......................................................244
To add an input and output context to a formula................................244
Reset contexts.........................................................................................245
How to define reset contexts..............................................................246
To define a reset context:...................................................................246
Using reset contexts in crosstabs......................................................246
Syntax for combining reset, input and output contexts......................248
Modifying contexts with the operators ForEach and ForAll.....................248
Getting the same result: ForAll City vs. In Region.............................249
Using the Rank function and extended syntax...................................250
Defining contexts with keywords........................................................253
Quick reference.......................................................................................257
Frequently used terms........................................................................257
Calculation contexts...........................................................................260
Context operators...............................................................................262
Keywords............................................................................................262
12 Desktop Intelligence Access and Analysis Guide
Page 13

Contents
Calculation Troubleshooting 265Chapter 17
Overview..................................................................................................266
#COMPUTATION.....................................................................................266
#COMPUTATION in cumulative aggregations...................................266
#COMPUTATION in non-aggregate formulas....................................270
#MULTIVALUE.........................................................................................271
#MULTIVALUE in aggregations..........................................................272
#MULTIVALUE in break headers and footers....................................274
#######...................................................................................................279
#ALERTER..............................................................................................279
#DICT.ERROR.........................................................................................280
To fix this problem:.............................................................................280
To avoid #DICT.ERROR.....................................................................281
#DIV/0......................................................................................................281
To fix this problem:.............................................................................282
#ERROR..................................................................................................282
To fix this problem..............................................................................282
#IERR......................................................................................................283
#IERR in a formula combining measures and dimensions................283
#IERR in an aggregation containing a complex formula....................284
#IERR in a formula using WHERE.....................................................285
#OVERFLOW..........................................................................................285
#SYNTAX.................................................................................................285
#UNKNOWN............................................................................................286
To fix this problem..............................................................................287
Tips and tricks..........................................................................................287
Formulas, Local Variables and Functions 291Chapter 18
Overview..................................................................................................292
Desktop Intelligence Access and Analysis Guide 13
Page 14

Contents
Formulas..................................................................................................292
Why use formulas?.............................................................................292
Creating formulas...............................................................................293
Displaying the Formula Bar................................................................293
Displaying the Formula Editor............................................................294
Using the Formula Editor....................................................................294
Guidelines on the syntax to use in formulas......................................296
Local variables.........................................................................................296
Why use local variables?....................................................................297
How to recognize local variables........................................................297
Creating a local variable.....................................................................297
Transforming a formula into a local variable......................................298
Creating local variables by grouping values............................................299
To display revenue per semester.......................................................300
To rename a variable..........................................................................300
Adding grouped values to a drill hierarchy.........................................302
Managing formulas and local variables...................................................302
Inserting local variables and formulas in a report...............................302
To edit formulas..................................................................................302
To edit local variables.........................................................................303
To delete formulas and local variables...............................................303
Functions.................................................................................................304
Using Functions..................................................................................305
Using the function help.......................................................................306
Function equivalents in Microsoft Excel..................................................307
Aggregate function equivalents..........................................................307
Numeric function equivalents.............................................................308
Character function equivalents...........................................................310
Date function equivalents...................................................................312
More examples of using formulas............................................................312
14 Desktop Intelligence Access and Analysis Guide
Page 15

Contents
To create the variable to calculate a three-week rolling average for sales
revenue..............................................................................................313
Launching Desktop Intelligence with the Run Command 325Chapter 19
Overview..................................................................................................326
To use the Run command........................................................................326
Run command options.......................................................................326
Specifying BOUSER, BOPASS and Other Variables.........................328
Desktop Intelligence and Visual Basic for Applications 331Chapter 20
Overview..................................................................................................332
What is a macro?...............................................................................332
What is an add-in?.............................................................................332
Using macros...........................................................................................333
To run a macro...................................................................................333
Using add-ins...........................................................................................334
To install an add-in.............................................................................335
Using an add-in..................................................................................335
To uninstall an add-in.........................................................................335
Exchanging add-ins with other users.................................................336
Converting scripts to macros...................................................................336
To convert a script..............................................................................336
Using the Visual Basic editor...................................................................337
To open the Visual Basic Editor..........................................................337
Desktop Intelligence Access and Analysis Guide 15
Page 16

Contents
Overview 339Chapter 21
Syntax 341Chapter 22
Options 343Chapter 23
Help Message 347Chapter 24
Error messages 349Chapter 25
Get More Help 351Appendix A
Index 355
16 Desktop Intelligence Access and Analysis Guide
Page 17
Introduction to Desktop Intelligence
1
Page 18

Introduction to Desktop Intelligence
1
What is Desktop Intelligence?
What is Desktop Intelligence?
Desktop Intelligence is an integrated query, reporting and analysis solution
for business professionals that allows you to access the data in your corporate
databases directly from your desktop and present and analyze this information
in a Desktop Intelligence document.
Desktop Intelligence makes it easy to access this data, because you work
in familiar business terms and not technical database terms like SQL.
Once you've used Desktop Intelligence to access data, you can present the
information in reports as tables, or as sophisticated dynamic documents with
drillable charts.
Where does the data come from?
Desktop Intelligence makes it easy to access data from your corporate
database because it has a business-intelligent, semantic layer that isolates
you from the technical issues of the database. This semantic layer is called
a universe. A universe maps to data in the database, using everyday terms
that describe your business environment. This means you can select exactly
the data that interests you using your own business terminology.
In your company or organization, universes are created by a universe
designer, using Business Objects Designer. The designer then makes
universes available to you and other users, to access data from the database
through an intuitive, user-friendly interface.
Universes are made up of classes and objects.
Objects are elements that map to a set of data from a relational database
using business terms. These objects allow you to retrieve data for your
documents.
Classes are logical groupings of objects.
Using this interface, you build a Desktop Intelligence using an editor called
the Query Panel, by adding and organizing objects from a universe. Objects
are elements that map to a set of data from a relational database in terms
that pertain to your business situation. When you run the query, Desktop
18 Desktop Intelligence Access and Analysis Guide
Page 19

Intelligence connects to the database and retrieves the data mapped to the
objects you selected.
A query is a type of data provider. The data provider contains the data you
have chosen to retrieve from the data source. Using this data set, you can
build interactive reports.
Desktop Intelligence lets you access data from a wide range of sources: from
relational and multidimensional databases, from packaged applications, from
personal data documents, and, using Microsoft Visual Basic for Applications
procedures, from virtually any source.
Presenting and analyzing data
Once you have the data you need, you can present it in a number of ways.
You can present it in a simple table.
Alternatively, you can create sophisticated reports containing large amounts
of data, organized and formatted to make it easy to go directly to pertinent
information.
Introduction to Desktop Intelligence
What is Desktop Intelligence?
1
You can add images and embedded objects and format your documents to
high presentation standards.
On-report analysis allows you to switch your business perspective by dragging
and dropping data, insert on-report calculations or drill into a report for
detailed information.
Sharing information
You can quickly and easily share the documents you have created with other
users in your company, either by sending them directly to selected individuals
or groups, or by Exporting them to the repository as Folders or Categories.
When you distribute documents in these different ways, you use the Desktop
Intelligence repository. The repository stores the documents you send so
that other users can retrieve and view them. It also stores information about
the documents it stores, such as name of sender, date, and also which users
in the company have the right to retrieve and view a document.
Desktop Intelligence Access and Analysis Guide 19
Page 20

Introduction to Desktop Intelligence
1
What is Desktop Intelligence?
You can Import documents that other users have sent, using WebIntelligence
documents which you can open and view in Desktop Intelligence. You can
also use InfoView to send documents for scheduled processing.
Note:
For information on sending, retrieving, printing, publishing and scheduling
documents, see the InfoView User's Guide. You can open an electronic
version of this guide directly from the Desktop Intelligence Help menu.
Security
The repository is set up and administered by the Business Objects
administrator who grants all user rights.
The Business Objects administrator does the following:
• defines he parts of the Desktop Intelligence interface you can access
• restricts the availability of Desktop Intelligence functionality, such as
access to certain menu commands
• defines your database connection
• defines the universes you can access for creating and editing queries
The rights accorded to each user define the user's profile. This profile-based
security system allows a single document to be distributed to many users -with end users having access only to the information they are authorized to
see.
Keeping a document's data up-to-date
Databases are regularly updated with new data. A document generated at
a given point in time reflects the data as it existed at that time, but it may be
inaccurate now. Desktop Intelligence lets you update the data in a document
while keeping the same presentation and formatting, either manually, or
automatically at specified times. When you update a document, Desktop
Intelligence reconnects to the database, and retrieves the updated data. This
is called a document.
20 Desktop Intelligence Access and Analysis Guide
Page 21

Introduction to Desktop Intelligence
Demo materials and samples
Demo materials and samples
To help you get up and running with Desktop Intelligence, demonstration
databases, universes and sample reports are included in the Desktop
Intelligence demo kit. There are two demonstration universes, Island Resorts
Marketing and eFashion. The examples in this user's guide are based on
eFashion and Island Resorts Marketing.
The eFashion demo database contains retail data from a clothing chain. It
tracks 211 products (663 product color variations), sold over 13 stores in the
US, over three years. The Island Resorts Marketing universe is described
in more detail in the section on Demonstration Materials.
Upgrading from earlier versions of Desktop Intelligence
For users who are upgrading from an earlier version of Desktop Intelligence,
previously known as BusinessObjects.
1
Documents created in BusinessObjects from 5.1 to 6.5 are fully compatible
with Desktop Intelligence.
The Repository
Desktop Intelligence uses the repository to secure access to your data
warehouse and to provide an infrastructure for distributing documents to be
shared with others.
You select the documents you want to import from or export to Desktop
Intelligence.
Folders and Categories
The Repository organizes documents into Folders and Categories in an
orderly system that permits easy access for you and others working with
documents.
Desktop Intelligence Access and Analysis Guide 21
Page 22

Introduction to Desktop Intelligence
1
Folders and Categories
Folders
Folders are the physical place where documents are stored.
Only one document with a given name may be placed in a folder or category.
It is possible to place documents in several categories.
If necessary, change the name of the document or give it a number to place
it in the same folder or category.
Shortcuts and copies may be placed in other folders or categories.
Your Repository is organized into Folders and Categories to help you organize
your documents. It is possible to create or delete sub-folders.
Make sure that your document is saved before you export it to the repository.
You are able to browse the Folders structure or the Categories structure.
Categories
Categories are used for classifying information regardless of its storage
location.
There are 2 types of folders:
• My Folders with 2 sub-folders
• Favorites (Generally reserved for often used documents)
• Inbox (Generally reserved for documents received from other users
• Public Folders (For shared documents.)
There are two types of Categories:
• Corporate Categories
22 Desktop Intelligence Access and Analysis Guide
Page 23

• Personal Categories
Introduction to Desktop Intelligence
Folders and Categories
1
Desktop Intelligence Access and Analysis Guide 23
Page 24

Introduction to Desktop Intelligence
Folders and Categories
1
24 Desktop Intelligence Access and Analysis Guide
Page 25

Introduction to Accessing Data with Desktop Intelligence
2
Page 26

Introduction to Accessing Data with Desktop Intelligence
2
What data sources are available?
What data sources are available?
Desktop Intelligence lets you access data from a wide range of sources. You
can access data from a number of sources:
• Universes
• Personal Data Files
• Stored Procedures
• Freehand SQL Server
• XML Data Provider
• VBA Data Provider
How do you access data sources?
Desktop Intelligence lets you access data through a graphical user interface.
You need no technical knowledge of the underlying data structures to get
the information you want. What you do need, however, is knowledge of your
business. To access a data source with Desktop Intelligence, you build a
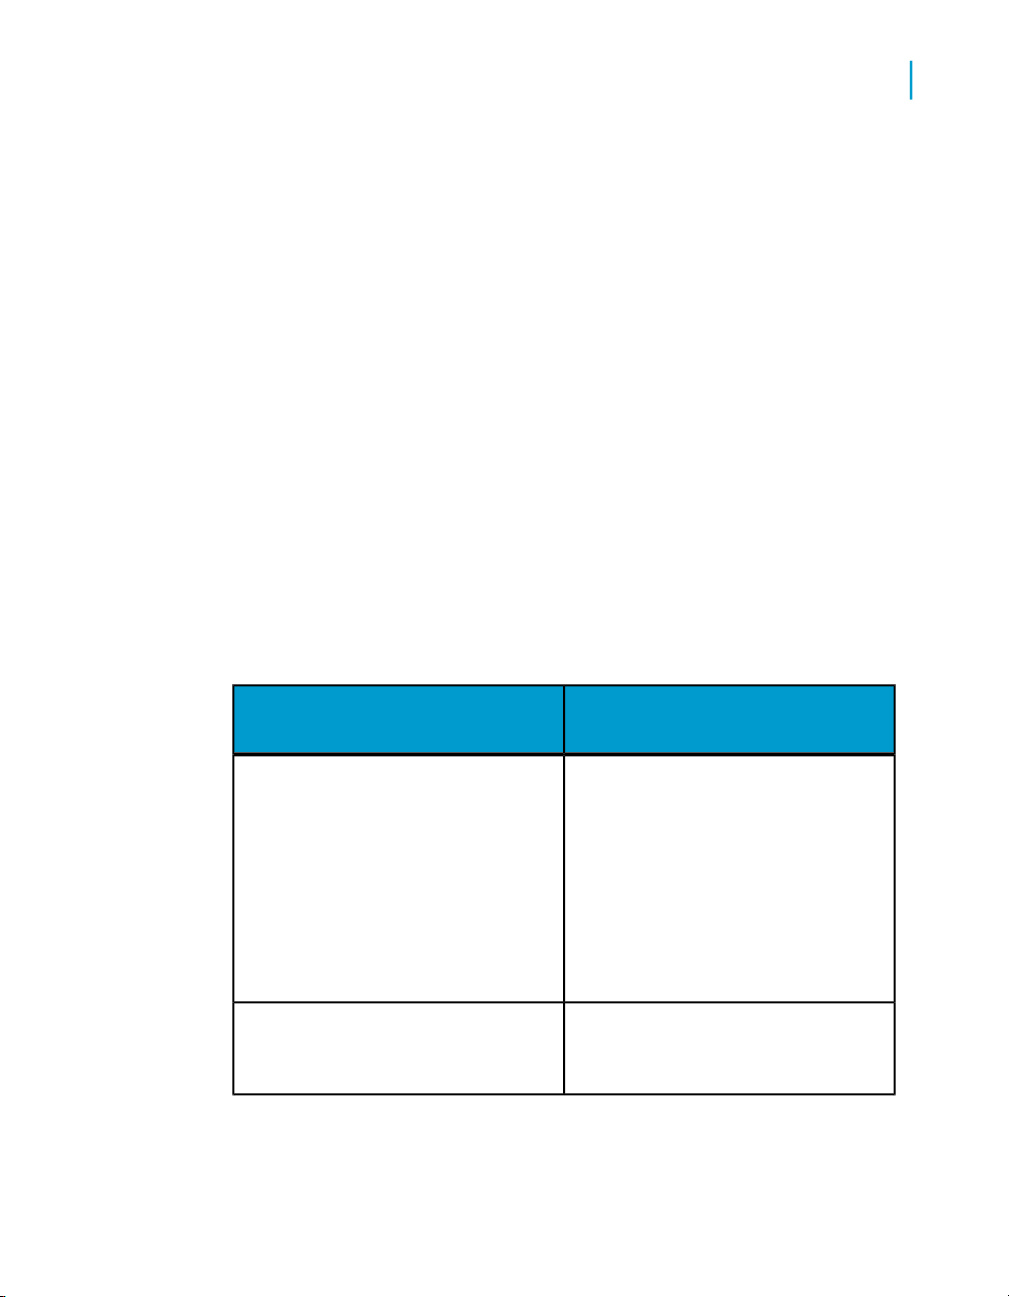
data provider.
The types of data provider that Desktop Intelligence supports are described
in the table below:
26 Desktop Intelligence Access and Analysis Guide
Page 27

Universes
Personal data files
Introduction to Accessing Data with Desktop Intelligence
What data sources are available?
CD InstallDescriptionData provider
A universe consists of
classes and objects that
represent the parts of a
database that contain
the data you need, in
everyday language that
is meaningful to you. In
a query on a universe,
you select the objects,
such as Customer
Name, Year, or Region.
You can retrieve data
from Excel, dBASE and
text files.
Yes
Yes
2
Stored procedures
You can only use stored
procedures if your supervisor or IS department
has provided them, and
if the RDBMS at your
site supports them.
A stored procedure is an
SQL (Structured Query
Language) script, saved
and executable on your
database.
Desktop Intelligence Access and Analysis Guide 27
Yes
Page 28

Introduction to Accessing Data with Desktop Intelligence
2
What data sources are available?
Free-hand SQL
You can use free-hand
SQL if you are familiar
with SQL, which is the
language used to interact with relational
databases. In free-hand
SQL, you open or write
a SQL script, which you
then run against the
database.
CD InstallDescriptionData provider
Yes
Only in 2-tier mode
XML Data provider
VBA Data provider
You can retrieve data
from XML files
Procedures written in
Microsoft Visual Basic
for Applications (VBA)
enable you to retrieve
data from almost any
data source.
Yes
Yes
Can all Desktop Intelligence users build data providers?
Your Desktop Intelligence supervisor can restrict access to certain types of
data providers, or even certain objects within a universe. As a result, you
might be able to build queries on universes but no other type of data provider,
and then be able to use only certain objects in the universe.
The way the supervisor sets up access to data providers and other Desktop
Intelligence features depends entirely upon the query and reporting needs
of your organization.
28 Desktop Intelligence Access and Analysis Guide
Page 29
Introduction to Accessing Data with Desktop Intelligence
By default, all Desktop Intelligence users can refresh data providers to get
the latest information from their database.
Who sets up database connections?
To access and retrieve data from a database, you need a database
connection. For example, if your company or organization stores its corporate
data in an Informix database, someone somewhere has to make Desktop
Intelligence "talk" to this data source.
In most cases, you, the Desktop Intelligence end user, do not have to concern
yourself with setting up database connections. Thus, Desktop Intelligence
lets you get the information you need, without technical knowledge of what's
going on behind the scenes.
This does not mean that power users cannot define their own database
connections. For example, in free-hand SQL, you can define a connection,
write an SQL script, then run the script against the connection you created.
The following table describes who sets up database connections for the
various Desktop Intelligence data providers.
What data sources are available?
2
Queries on universes
Stored procedures
Who sets it up?Data provider
The universe designer sets up the
connection in the universe, so the
connection is hidden when you build
or edit queries.
Note:
The supervisor may modify the existing
connection or assign a new connection
to the universe
The supervisor creates the connection to access a stored procedure.
Desktop Intelligence Access and Analysis Guide 29
Page 30

Introduction to Accessing Data with Desktop Intelligence
2
What data sources are available?
Free-hand SQL
Personal data files and XML files
VBA procedures
Who sets it up?Data provider
In free-hand SQL, you can create
your own connection to the database.
Once you have created the connection, you can make it available to
other users.
When you access data in a personal
data file or XML file, you select the
file and in doing so, you "connect" to
it. This is not a technical task, it's just
a question of selecting the right file
A VBA procedure runs a VBA macro
that retrieves data for your Desktop
Intelligence report. The person who
creates the macro defines the connection to the data source in the macro
code.
Restrictive connections
If you are working with a universe that is set up with a restrictive connection,
you need to supply the database username and password to run a query.
This username/password is not the one that you use to log onto Desktop
Intelligence; it is the username/password of the underlying database (for
example an SQL Server database) that the universe accesses. This database
normally remains hidden, but the universe designer can set up a restrictive
connection to add an extra layer of security. Depending on the type of
restrictive connection, you need to supply the database username and
password in some or all of the following situations:
• When you first run a query (for more information on running a query, see
"Building a query in the Query Panel and running the query.".
30 Desktop Intelligence Access and Analysis Guide
Page 31

Introduction to Accessing Data with Desktop Intelligence
Workflows for accessing data
• When you refresh a query (for more information on refreshing a query,
see Refreshing Desktop Intelligence Documents in chapter 1 of the
Desktop Intelligence User's Guide: Report Techniques and Formatting.
• When you parse a query to test its validity (for more information on parsing
a query, see "Usin SQL from Desktop Intelligence queries."
If you do not know your database username and password, see your Desktop
Intelligence administrator.
Can you combine data from different sources in one report?
Yes. With Desktop Intelligence, you can build powerful reports with data from
corporate databases that you can access using queries on data providers
such as universes and free-hand SQL, and data from your own files such
as spreadsheets and text files.
2
Workflows for accessing data
There are two basic workflows for building data providers to access your
data in Desktop Intelligence. You can build a data provider for two reasons:
• to create a new document
• to work with an existing document.
Also with an existing document, you can obtain a different set of results by
editing a data provider.
The following sections explain these different workflows.
Building a data provider when you create a new document
Building a data provider when you create a new document is a typical way
of using Desktop Intelligence. You create the document in order to see your
business data; to do that, you have to build a data provider to access data
from a data source.
Desktop Intelligence Access and Analysis Guide 31
Page 32

Introduction to Accessing Data with Desktop Intelligence
2
Workflows for accessing data
To help you build a data provider when you create a new document, Desktop
Intelligence launches the New Report Wizard when you start the application
for the first time.
To build a new data provider using the wizard
1. Run the New Report Wizard on the Standard toolbar.
2. Select an option for the report layout.
3. Click Begin.
The Specify Data Access dialog box appears.
4. Make a selection depending on how you want to build your query (use
the Choices element to wrap the following list:
• To build a query on a universe, click Universe, then Next.
• To build a query based on a stored procedure, free-hand SQL, personal
data file, XML file, or VBA procedure, click Others, then select a data
source from the list, then click Finish.
• To build a query on a universe using the Query Panel, click Universe,
then Finish.
If you selected Others in the previous step, a dialog box appears to let
you build your data provider and retrieve the data for your report.
If you selected Universe and clicked Finish, the Query Panel appears. In
the Query Panel, you can view all the classes and objects in the universe
you selected, and use these to build your query. For more information, refer
to "Displaying the Query Panal." (ts_note: Make this a related-link.)
Setting a default type of data provider for new documents
Do you always use the same type of data provider when you create new
documents? If so, you can set an option so that the type of data provider
you always use will be preselected in the New Report Wizard. This means
that you will not have to select the type of data provider you want every time
you create a document.
If you always use queries on universes, you can also select the default
universe to use.
32 Desktop Intelligence Access and Analysis Guide
Page 33

Introduction to Accessing Data with Desktop Intelligence
Workflows for accessing data
To set a default type of data provider:
1. Click Options on the Tools menu.
2. Click the New Document tab.
3. Click Invoke the New Report Wizard with the following settings.
4. In the Data Access group box, select the type of data provider you want
to use.
• Use a Default Universe lets you select the universe you want.
• Use a Different Data Provider lets you select a data provider type from
the drop-down list.
5. Click OK to close the dialog box.
Building a query in an existing document
You don't have to create a new document every time you want to see new
data in Desktop Intelligence. You can build data providers inside existing
documents. This feature enables you not only to see more data that comes
from the same source as the document's initial query, but also to combine
data from different sources in the same report.
2
Your company's sales information is stored in your corporate database, which
you access by running a query on a universe in Desktop Intelligence. You
already have a Desktop Intelligence document containing this information.
You keep your quarterly targets in a Microsoft Excel spreadsheet and you
want to compare the corporate figures with your personal data.
To compare the corporate figures with your personal data
1. Open the document containing the corporate data.
2. Click New Data Provider
3. Click Access new data in a different way.
4. Click Personal data files.
5. Click Finish.
Desktop Intelligence Access and Analysis Guide 33
Page 34

Introduction to Accessing Data with Desktop Intelligence
2
Workflows for accessing data
6. In the dialog box that appears, browse to the Excel file that contains your
personal data.
7. Click Run.
Desktop Intelligence makes the data from the spreadsheet available in
your report.
To build a data provider inside an existing document
1. Click New Data Provider on the Data menu.
2. Follow the wizard to select the type of data provider you want.
3. Build the data provider.
4. Click Run.
Desktop Intelligence retrieves the data, making it available in the
document.
Tip: If you want to see the new data as soon as Desktop Intelligence has
retrieved it, use the Table, Crosstab or Chart commands on the Insert menu,
then follow the wizard to access the data you want.
Editing data providers
Editing a data provider means changing its definition in order to bring new
or different data to the document you are working on. It's often quicker and
easier to edit a data provider than to build a new one.
Example: Adding regional information to an existing document
You're working in a document with sales figures by year, but you need
some regional information to complete the picture. Rather than building a
new query, which means creating multiple data providers in the same
document,
To add result objects to the existing data provider:
1. Click Edit Data Provider on the Data menu.
34 Desktop Intelligence Access and Analysis Guide
Page 35

Introduction to Accessing Data with Desktop Intelligence
In the Query Panel, add the objects you want (for example Region, City)
to the Result Objects box. You do this by double-clicking each object's
icon in the Classes and Objects list.
2. Click Run.
Desktop Intelligence returns the new data to the report, and, provided
that your data is displayed in a table, the new columns automatically
appear.
Other reasons for editing a data provider
Other reasons for editing a data provider include the following:
• You want to restrict the volume of data returned by setting conditions or
maximum number of rows.
• You want the data to be sorted in a given order at the query level.
To edit a data provider
Workflows for accessing data
2
1. Click Edit Data Provider on the Data menu.
2. The next step depends on whether or not the document contains more
than one data provider.
Then...If the document con-
tains...
Click OK.One data provider
More than one data
provider
3. Edit then run the data provider.
Desktop Intelligence returns the new data set to your report.
Select the data provider you want to edit, then
click OK.
Desktop Intelligence Access and Analysis Guide 35
Page 36

Introduction to Accessing Data with Desktop Intelligence
2
Using the repository
To cancel a data provider
Cancelling a data provider means interrupting the data provider while it is
fetching data to create or refresh a report.
1. To cancel a data provider, press the Esc key.
The Interrupted Execution dialog box appears on your screen.
2. Select which results you want to view in the report:
be created by the data provider
you were running,
ThenIf you
Click Continue the execution.Want to view the results that will
Want to view the partial results
created by the data provider
when you interrupted the execution,
ated by the data provider when
you interrupted the execution,
Want to view the results of the
previous execution,
Using the repository
Documents are placed in Folders and Categories in the repository
See "The Repository".
Click Stop the execution and keep
the partial results .
When you have partial results in a
report, the Partial Results notification appears in the status bar.
Click Discard the results.Want to discard the results cre-
Click Keep the results of the pre-
vious execution.
36 Desktop Intelligence Access and Analysis Guide
Page 37

Introduction to Accessing Data with Desktop Intelligence
Exporting to the repository
When you create a document, before you can Export it to the Repository for
the first time save the document and Export it to an existing folder or create
a new folder.
Folders contain actual copies of your files, while Categories simply point to
documents.
To Export a document to the Repository
1. With a saved document open in your Desktop Intelligence Administrator.
2. Click Export to Repository in the File menu.
Browse to the folder where you want to export your document, or create
a new folder.
3. Highlight the folder where you want to export the document.
4. Click Add.
Exporting to the repository
2
If your document has the correct name...
5. Click OK.
6. Click OK again.
7. Enter the summary information.
8. Click OK.
9. Click Replace.
If you do not click Replace, the export is aborted.
10. Click OK.
Creating a New Folder
When you export a document to a folder you must place it in an existing
folder or create a new folder.
Desktop Intelligence Access and Analysis Guide 37
Page 38

Introduction to Accessing Data with Desktop Intelligence
2
Exporting to the repository
To create a new Folder
1. Click Export to Repository.
2. Highlight the file where you want to create your folder.
3. Click New.
4. Type the name of the folder.
5. Click OK.
Exporting to a Category
Save files to your local disk before exporting them to the repository for the
first time. It is best to export the document to a folder before exporting it to
a category.
To place a file in a Category
1. Open your file in the Desktop Intelligence Administrator.
2. Click Export to Repository in the File menu.
3. Click Categories at the bottom of the Dialog Box.
4. Activate the Category where you want to send your document.
You can check more than one Categories.
5. Click OK.
6. Click Add.
To schedule export of a document
1. Click File > Export to Repository.
2. In the "Export" box, click Browse, and then locate and add the documents
you want to send.
To remove documents from the Document(s) to Send list, select the
documents to remove and click Remove.
3. Select a repository folder to which to send the document.
38 Desktop Intelligence Access and Analysis Guide
Page 39

Introduction to Accessing Data with Desktop Intelligence
Exporting to the repository
Click New to create a new repository folder.•
• Click Delete to delete an empty repository folder (you cannot delete
a folder that is not empty).
4. If desired, click Categories to associate categories with the document
or Clear to clear the list.
5. Click Schedule.
6. In the "Send Document to Broadcast Agent" box, click the "General" tab
and select your general options.
DescriptionOption
2
Formats
Caching Option
Specify the
Printer
7. Click the "Change Schedule" tab to select scheduling options.
Object will run
8. Click the "Distribution" tab to select distribution options.
All choices except Default Enterprise Location give you the following
options:
Choose from the available formats in which to publish the
document.
Choose whether or not to publish the document in the
repository cache for efficient access, and the format. You
can choose one or more of the available formats.
Click Default Printer and either Enable or Printing Options
to specify printing options.
DescriptionOption
Choose the publication frequency.Run
Choose further options depending on the frequency you
selected under Run.
Desktop Intelligence Access and Analysis Guide 39
Page 40

Introduction to Accessing Data with Desktop Intelligence
2
Managing Categories
DescriptionOption
Cleanup instance after
scheduling
Use the Job Server's defaults
Further options when Job
Server defaults are not
used
Managing Categories
When exporting a document to the repository, it is also possible to create a
new category, delete an existing category, or rename one.
To manage your Categories
1. Open your file in the Desktop Intelligence Administrator.
2. Click Export to Repository in the File menu.
3. Click Categories at the bottom of the dialog box.
4. Click Manage.
5. Browse to the category you want to manage.
6. Activate the category.
• Add a Category
After the scheduled publication, the published
instance will be deleted.
Distribution will be according to default values
set for the Job Server.
If the Job Server default values are not used,
you need to specify values depending on the
distribution location selected.
• Delete a category
• Edit a category
To Add a category to the list of categories
With the Send to dialog box open:
1. Click Categories at the bottom of the dialog box.
2. Click Manage.
40 Desktop Intelligence Access and Analysis Guide
Page 41

Introduction to Accessing Data with Desktop Intelligence
Importing from the repository
3. Activate the category you want to manage.
4. Click Add.
To Delete a category from the list of categories
1. Open your file in the Desktop Intelligence Administrator.
2. Click Export to Repository in the File menu.
3. Click Categories at the bottom of the dialog box.
4. Click Manage.
5. Browse to the category you want to delete.
6. Activate the category.
7. Click Delete.
To Edit a category
1. Open your file in the Desktop Intelligence Administrator.
2. Click Export to Repository in the File menu.
3. Click Categories at the bottom of the dialog box.
4. Click Manage.
5. Browse to the file you want to edit or rename.
6. Click Edit.
2
The right to create or delete a folder is controlled by the server. If you receive
an error message, see your server administrator.
Importing from the repository
You can import from folders or categories.
To import a document from a folder in the repository
1. Choose folders or categories at the bottom left of the Browse Categories
box.
2. Click Import from Repository in the File Menu.
Desktop Intelligence Access and Analysis Guide 41
Page 42

Introduction to Accessing Data with Desktop Intelligence
2
Sending documents from Desktop Intelligence
3. Browse to the document you want to import.
4. Select the document.
5. Select Open on retrieval.
6. Click Retrieve.
Retrieving different instances of a given document
If you have more than one instance of a file, the Retrieve instances button
is activated.
Select the file you want to Import to the Repository.
Note:
• Instances are placed in folders using InfoView.
• Scheduling options are accessed from InfoView.
If the Retrieve Instances button is available, there is more than one instance
of the document..
To choose an Instance of a document
1. Click the Retrieve Instance button.
2. Choose an instance of the document.
3. Click Retrieve.
Sending documents from Desktop
Intelligence
You can send Desktop Intelligence documents either to other users of the
Business Objects deployment or to other individuals via email.
Other users of the Business Objects deployment must have appropriate
rights in order to access the document. If they do not, or if they are not a part
of the Business Objects deployment and receive the document via email,
the document must have been saved with the Save for all users option
selected in order for them to have access to the document.
42 Desktop Intelligence Access and Analysis Guide
Page 43

Introduction to Accessing Data with Desktop Intelligence
Sending documents from Desktop Intelligence
To send documents to users and groups from Desktop Intelligence
1. Click File > Send To > Users.
2. In the Send documents to users box, click Browse, and then locate and
add the document you want to send.
The document appears in the Document(s) to Send list. If a document
was already open in Desktop Intelligence, it appears by default.
3. In the "Send documents to users" box, click To.
4. In the "Select Users and Groups" box, click Groups to see groups of
users or Users to see individual users.
You can refresh the list by clicking Refresh.
5. Select one or more in the list.
Use Ctrl+click for multiple selection.
6. Click Add to add your selection to the Document Recipients list.
You can choose an option, Groups or Users, add users to the Document
Recipients, and then do the same with the other option.
2
7. To remove users or groups from the Document Recipients list, select
them and click Remove.
8. Click OK.
The selected documents are sent to the Business Objects inbox of the
document recipients.
To send documents by email with Desktop Intelligence
You must have an email client on your machine that is configured to open
new emails with a valid email account. If the recipient is not a user of the
Business Objects deployment with the appropriate rights to read the
document, you must first save the document with the Save for all users
option selected.
1. Open a Desktop Intelligence document.
2. Click File > Send To > Send to Mail.
Desktop Intelligence Access and Analysis Guide 43
Page 44

Introduction to Accessing Data with Desktop Intelligence
2
Sending documents from Desktop Intelligence
An empty email is opened by your email client. The Desktop Intelligence
document is attached to the email.
3. Specify the desired recipient and subject, add a message if desired, and
then send the email.
The email with the attached document is sent to the email address you
specified.
Sending documents from Desktop
Intelligence
You can send Desktop Intelligence documents either to other users of the
Business Objects deployment or to other individuals via email.
Other users of the Business Objects deployment must have appropriate
rights in order to access the document. If they do not, or if they are not a part
of the Business Objects deployment and receive the document via email,
the document must have been saved with the Save for all users option
selected in order for them to have access to the document.
44 Desktop Intelligence Access and Analysis Guide
Page 45

Building Queries on Universes
3
Page 46

Building Queries on Universes
3
Overview
Overview
This chapter is about accessing data using Desktop Intelligence native
technology: building queries on universes.
What is a universe?
Desktop Intelligence universes make it easy to access data because they
contain objects of data in business terms that are familiar to you. What's
more, you need no knowledge of the database structure, or of database
technology, to be able to create powerful reports with data that is relevant
to your work.
Universes provide the business-intelligent, semantic layer that isolates you
from the complexities of the database. A universe maps to data in the
database in everyday terms that describe your business situation.
Universes are made up of classes and objects. For example, the objects in
a human resources universe would be Names, Addresses, Salaries. Classes
are logical groupings of objects. Each class has a meaningful name, such
as Vacation (for objects pertaining to employee vacations). Each object maps
to data in the database and enables you to retrieve data for your reports.
Who is responsible for creating universes?
In your company or organization, universes are created by a universe
designer, who works with an application called Designer. The designer then
makes universes available to you and other users at your site, so that you
can access the data you want from the database.
Two demo universes that map to demo databases are delivered with Desktop
Intelligence. A full description of these is provided in Demonstration materials
on page 47 below.
46 Desktop Intelligence Access and Analysis Guide
Page 47

What are universe queries?
Universe queries enable you to retrieve data from a database via a universe.
You build a query to bring data to a report, either when you create the report
or when you want to view new data.
When you build a query, you select objects from a universe, then run the
query. Desktop Intelligence connects to the database, and retrieves the data
mapped by the objects you selected. Desktop Intelligence retrieves this data
by executing an SQL query against the database; Desktop Intelligence
generates this SQL according to the objects you select. SQL stands for
Structured Query Language; it is the query language understood (in various
dialects) by all relational databases.
Note:
SQL queries generated by Desktop Intelligence cannot exceed 65,536
characters in length.
Building Queries on Universes
Overview
3
Demonstration materials
Several demonstration databases, and their accompanying universes and
reports are included in the Desktop Intelligence package. They are installed
with Desktop Intelligence, and used in the examples in this guide. The
databases are compatible with Microsoft Access 2000. The Desktop
Intelligence CD also includes generic SQL scripts and data files to allow a
database administrator to build the databases on any RDBMS.
Island Resorts Marketing
The Island Resorts Marketing universe accesses data in the club.mdb
database. It is designed for an imaginary tour operator that runs beach clubs
in different resorts around the world. You use it to retrieve data on sales and
reservations for resorts and customers, over time. The illustration below
shows the universe's classes and objects as they appear in Desktop
Intelligence.
Because universes provide a business-intelligent semantic layer between
you and the database, the names of the classes and objects in the
Desktop Intelligence Access and Analysis Guide 47
Page 48

Building Queries on Universes
3
Overview
demonstration universe are self-explanatory. For example, the Resort class
contains objects that map to data on resorts:
• The Resort object retrieves the names of the company's resorts.
• The Service object retrieves data for the types of services in each resort:
accommodation, food and drinks, recreation.
• The Service Line object retrieves data for the types of service in each
resort, for example family suite (for accommodation), restaurant (for food
and drinks).
For more information on classes and the different types of objects you find
in Desktop Intelligence, refer to Classes and sub-classes on page 48 and
Dimension objects, measure objects and detail objects on page 48.
Classes and sub-classes
The demonstration universe contains five classes: Resort, Customer, Sales,
Reservations and Measures. The purpose of classes is to provide logical
groupings of objects. For example, the Customer class contains objects that
you map to data on customers in the database.
The Customer class contains a sub-class, which is entitled Sponsor. A
sub-class is to a class what a sub-folder is to a folder.
Dimension objects, measure objects and detail objects
When creating universes, universe designers define and qualify objects. The
qualification of an object reveals how it can be used in analysis in reports.
An object can be qualified as a dimension, a detail, or a measure. Each type
of object serves a different purpose:
Measure objects are semantically dynamic: the values they return depend
on the objects they are used with. For example, if you include Resort and
Revenue in a query, revenue per resort is calculated. If you include Customer
and Revenue, revenue per customer is calculated, and so on.
48 Desktop Intelligence Access and Analysis Guide
Page 49

Building Queries on Universes
Building a basic query on a universe
eFashion
The eFashion demo database contains retail data from a clothing chain. It
tracks 211 products (663 product color variations), sold over 13 stores in the
US, over three years. It contains approximately 90,000 rows of data.
Building a basic query on a universe
You can bring data to a report by building a query on a universe. You
complete this task in the Query Panel, a graphical interface that enables you
to build a query by dragging and dropping objects from the universe. The
Query Panel is illustrated in Displaying the query panel on page 49.
There are three steps in building a basic query on a universe.
• Display the query panel
• Build the query in the Query Panel and run the query
• Save the query definition
3
Displaying the query panel
How you display the Query Panel depends on whether you're creating a new
document or building a new query inside an existing document. You can use
the following commands and toolbar buttons.
to create a new document,
to edit a query or other type of data
provider in the current document,
Desktop Intelligence Access and Analysis Guide 49
ThenIf you want
click the New Report Wizard button
(Standard toolbar).
click Edit Data Provider on the Data
menu.
Page 50

Building Queries on Universes
3
Building a basic query on a universe
ThenIf you want
to create a new query or other type
of data provider in the current document,
If you need more information, refer to "Workflows for accessing data."
The Query Panel displays the contents of your Desktop Intelligence universe
and lets you select data with simple mouse clicks.
In the Classes and Objects tree on the left side of the screen, display is as
follows:
• Classes appear as folders.
• Objects appear as cubes (for dimensions), spheres (for measures), or
pyramids (for details).
The button on the bottom left, under the Classes and Objects tree, with an
icon showing the different kinds of objects, is selected by default and controls
display of the universe's classes and objects.
The button to its right displays the universe's predefined conditions.
The search box next to these buttons lets you type a search string to search
for objects in the universe.
click New Data Provider on the Data
menu.
The Options button enables you to set options before running the query, for
example to specify a maximum number of rows.
The Result Objects box displays the objects that are included in the query.
The Conditions box displays the conditions limiting the data returned by the
query.
The Save and Close button lets you save the query you have defined without
running it. You can run it later on by using the Refresh command.
When you click View, the raw data retrieved by the query appears in the
Data Manager. From the Data Manager, you can edit, accept or cancel the
query.
50 Desktop Intelligence Access and Analysis Guide
Page 51

When you click Run, the query connects to the database and the data
appears in the report.
To display the query panel
You've launched Desktop Intelligence for the first time and the New Report
Wizard appears. You use the wizard to display the Query Panel for the Island
Resorts Marketing universe.
1. In the New Report Wizard, click Begin.
The Specify Data Access dialog box appears, with the Universe option
already selected.
2. Click Next.
The Select a Universe dialog box appears.
3. Click Island Resorts Marketing:
4. Click Finish.
The Query Panel appears with the classes of the Island Resorts Marketing
universe is displayed.
Building Queries on Universes
Building a basic query on a universe
3
Building a query in the Query Panel and running the query
Building and running a query includes the following steps:
• Display all the objects that you can include in a query
• Include objects in a query
• Remove objects from a query
• Change the order of objects in a query
• Run the query
Steps 2, 3, and 4 are not always sequential. For example, you can include
objects in a query, remove some of them, and then include other objects.
Desktop Intelligence Access and Analysis Guide 51
Page 52

Building Queries on Universes
3
Building a basic query on a universe
Displaying the objects that you can include in a query
In the Query Panel, the Classes and Objects box presents the classes,
sub-classes and objects of the universe that you are using. Objects represent
the data that you can retrieve via the universe. Classes are logical groupings
of objects. Classes can also contain sub-classes, as folders can contain
sub-folders.
When the Query Panel appears, only the universe's classes are visible. Click
the + plus to the left of a class icon to view the class's objects and
sub-classes.
Searching for objects
You can search for an object by typing its name in the search box. Desktop
Intelligence opens the object folder and selects the object. This is a useful
feature if your universe is large with many objects.
Including objects in a query
When you include an object in the query, you instruct Desktop Intelligence
to retrieve the data for that object from the database. For example, to display
revenue by resort in your report, you include the Revenue and Resort objects
in the query.
You include an object in a query by placing it in the Result Objects box. There
are three ways of doing this. You can:
• Click an icon in the Classes and Objects list, then drag it to the Result
Objects box.
• Double-click an object in the Classes and Objects list.
• Click a class folder and drag it to the Result Objects box. All the objects
in the class appear in the Result Objects box.
Once you have placed objects in the Result Objects box, you have built a
basic query.
52 Desktop Intelligence Access and Analysis Guide
Page 53

Building a basic query on a universe
To remove objects from a query
1. In the Result Objects box, click the icon of the object you want to remove.
2. Drag the icon to the Classes and Objects list.
3. Press the Delete key, or right-click the icon and click Delete.
To change the order of the objects in a query
The order in which the objects appear in the Result Objects box determines
the order in which the data will appear in the report.
1. Click an object in the Result Objects box.
2. To change the object's position, drag the icon to the left or or right.
3. To swap the icon's position with that of another object in the Result Objects
box, press Shift while dragging the object icon until it is above the icon
of the other object, then release the mouse button.
Running the query
Building Queries on Universes
3
Once you have built the query you want, you click Run to have the query
retrieve the data from the database.
Example: to build a query in the Query Panel and run the query
You have displayed the Query Panel for the Island Resorts Marketing
universe and want to move objects from the Classes and Objects box to the
Result Objects box to build your query.
1. Click the + sign next to the Resort class, the Sales class and the Measures
class.
Doing this reveals the objects in each class.
2. Double-click the objects you want. For example, to find out yearly revenue
in each resort, double-click Resort, Year, and, in the Measures class,
Revenue.
3. Click Run.
Desktop Intelligence Access and Analysis Guide 53
Page 54

Building Queries on Universes
3
Building a more powerful query
Desktop Intelligence retrieves the data for Resort, Year and Revenue
and displays this in a new document.
Note: If the universe designer has set the up the universe with a restrictive
connection, Desktop Intelligence prompts you to enter your database
username and password before retrieving the data. For more information on
restrictive connections, see "Restrictive connections."
Saving the definition of a query
You can build a query without having to run it right away. This feature lets
you:
• save a query so that you can continue defining it at a later stage
• save a query that you have finished defining, but that you do not want to
run right away, for example because you know network traffic is heavy
To save the definition of a query
1. Build a query by moving objects into the Result Objects and Conditions
boxes in the Query Panel.
2. Click Save and Close.
The result objects from the query appear as column headings. You then
refresh the query in order to view the data.
Building a more powerful query
You build a simple query by adding objects to the Query Panel. The
procedures described in the following sections enable you to build a more
powerful query by controlling the data that your queries retrieve. You can:
• define scope of analysis, which means that you retrieve data that you will
later use for analysis in the report
• limit the query results to data that satisfies conditions
• sort data, for example alphabetically
• retrieve a specified number of rows of data
54 Desktop Intelligence Access and Analysis Guide
Page 55

• eliminate duplicate rows of data from the query result
Note:
All the above tasks are easy to perform for non-technical end users. In
"Customizing Queries on Universes," you can find information on more
powerful query building procedures that are designed for advanced users.
Defining scope of analysis
Analysis means looking at data from different viewpoints and on different
levels of detail. In reports, you can use scope of analysis to ensure that the
data included in your report can be displayed at the appropriate level of detail
for your analysis. Setting a scope of analysis allows you to work in drill mode,
which enables you to display data in progressively greater detail.
"Scope of analysis" means a subset of data, returned by a query, that you
will use for analysis in your report. The data for your scope of analysis does
not appear in the report until you decide that you want to use it in analysis
The scope of analysis you can define depends on hierarchies in the universe.
A hierarchy, which the designer sets up when creating the universe, consists
of dimension objects ranked from "less detailed" to "more detailed". The
objects that belong to hierarchies are the ones you can use to define scope
of analysis.
Building Queries on Universes
Building a more powerful query
3
To view the hierarchies in the universe you are working with, click the Scope
of Analysis button on the Query Panel toolbar. The Scope of Analysis dialog
box appears. In it:
• A check appears next to objects that are included in the scope of analysis.
• Hierarchies are represented by folders.
• You can click the + sign to the left of the hierarchy's folder to view the
objects it contains.
Note:
If a universe contains no hierarchies, Desktop Intelligence uses its classes
as hierarchies by default.
Desktop Intelligence Access and Analysis Guide 55
Page 56

Building Queries on Universes
3
Building a more powerful query
Defining default scope of analysis
Once you include one object that belongs to a hierarchy in a query, you can
define a default scope of analysis that includes other objects at other levels
from the same hierarchy. Including more levels in your scope of analysis
allows you to view lower levels of detail in your analysis. For example, the
Resort object belongs to the Resort hierarchy. Once you include Resort in
a query, you can automatically include the Service Line and Service objects
in your scope of analysis because these objects also belong to the Resort
hierarchy.
To use this feature, first insert an object from a hierarchy in the Result Objects
box. Then, click the arrow on the Scope of Analysis list box on the Query
Panel toolbar.
This list enables you to include one, two or three objects from the hierarchy
in your scope of analysis. For example, if you insert Resort in the Result
Objects box, then click One Level Down, your scope of analysis contains
the object below Resort (Service Line) in the Resort hierarchy. Click the
option that corresponds to the number of objects you want to include in your
scope of analysis. This option is now active in the Scope of Analysis list box.
When you run the query, the report displays the data for the objects that you
included in the Result Objects box of the Query Panel. The data for the
objects in your scope of analysis is not displayed, but it is available for use
in analysis.
To define scope of analysis manually
Instead of using the default method described in the previous section, you
can manually select the dimension objects you want.
1. Click the Scope of Analysis button in the Query Panel toolbar.
The Scope of Analysis dialog box appears.
2. Click inside the checkbox of each object you want to include in your scope
of analysis.
3. Click OK to return to the Query Panel.
56 Desktop Intelligence Access and Analysis Guide
Page 57

The Scope of Analysis list box on the Query Panel toolbar displays
"Custom Level", which indicates that you manually defined your scope
of analysis.
Tip:
You can select all the objects in a hierarchy by clicking the hierarchy check
box in the Scope of Analysis dialog box.
Applying conditions
A condition is a way of limiting the data that a query returns. Here's a simple
example of limiting query results by using a condition.
The Resort object retrieves five values: Australian Reef, Bahamas Beach,
French Riveria, Hawaiian Club and Royal Caribbean.
You can apply a condition on the Resort object to stipulate that you want to
retrieve the data for only the Bahamas Beach and Royal Caribbean resorts
only.
Building Queries on Universes
Building a more powerful query
3
In Desktop Intelligence, you can set three types of conditions on a query:
DescriptionCondition
When universe designers build universes, they can create predefined
conditions for you to use. For example, the Island Resort Marketing universe contains predefined conditions
such as Year 2002, which lets you
Predefined conditions
Desktop Intelligence Access and Analysis Guide 57
obtain reservations for 2002 only.
You can apply one or more predefined conditions when you build a
query. However, you can neither
delete predefined conditions from a
universe, nor can you edit their definition.
Page 58

Building Queries on Universes
3
Building a more powerful query
Simple conditions
Complex conditions
DescriptionCondition
Enable you to limit data returned by
a result object. For example, you can
find out about certain customers by
applying a simple condition on the
Customer object, then selecting the
customer names that appear in a dialog box.
Enable you to limit the query results
by any object in the universe.
For more information on complex
conditions, refer to "Applying complex
conditions on queries."
To apply a predefined condition
1. Click Predefined Conditions below the Classes and Objects box in the
Query Panel.
The Predefined Conditions box replaces the Classes and Objects box.
2. Double-click the predefined condition you want to apply.
The condition appears in the Conditions box.
When you run the query, only the data corresponding to the predefined
condition appears in the report.
For information on using two or more conditions in the same query, refer to
"Using an existing query in a condition".
To remove a predefined condition
1. Click the condition's icon in the Conditions box.
2. Press the Delete key.
58 Desktop Intelligence Access and Analysis Guide
Page 59

To apply your own simple condition
Before you can apply a simple condition on an object, you must include the
object in the query.
1. Click the object icon in the Result Objects box.
2. Click the Simple Condition button on the toolbar.
The list of values for the object is retrieved from the database, and appears
in the List of Values dialog box.
3. Hold down the Ctrl key on your keyboard, click the values you want the
object to retrieve, then click OK.
The condition appears in the Conditions box.
When you run the query, only the data corresponding to the value(s) you
selected will appear in the report.
To select different values for a simple condition
Building Queries on Universes
Building a more powerful query
3
Once you have applied a simple condition on an object in a query, you can
modify it by selecting different values for the object to return.
1. In the Conditions box of the Query Panel, click the value(s) that appear(s)
on the right-hand side of the condition.
2. The Classes and Objects box becomes the Operands box.
3. Double-click the Show list of values operand.
4. The object's list of values appears in the List of Values dialog box.
5. If you want to select more values for the condition, hold down the Ctrl key
and then, in the List of Values dialog box, click each value that you want
the object to retrieve.
6. Click any selected values that you do not want the object to retrieve, and
click OK.
To delete a simple condition
1. Click the condition in the Conditions box
2. Press the Delete key.
Desktop Intelligence Access and Analysis Guide 59
Page 60

Building Queries on Universes
3
Building a more powerful query
Applying sorts
Sorts control the order in which data appears: ascending or descending. For
example, you can apply a sort on a measure object so that its data appears
in ascending order, from lowest to highest values.
The following table summarizes the order in which data appears:
DatesNumbersText
past to presentlowest to highestA-ZAscending
present to pasthighest to lowestA-ZDescending
To apply a sort on an object
1. Click an object in the Result Objects box.
2. Click the Sort button on the toolbar.
3. A sort icon appears below the object icon in the Result Objects box.
To remove a sort
There are two ways of doing this:
1. Click the sort icon, then press the Delete key.
2. Alternatively, drag the sort icon from the object in the Result Objects box
to the Classes and Objects list, where you release your mouse button.
In both cases, the sort icon disappears from the object in the Result
Objects box.
To invert a sort
• Double-click the sort icon below the object.
60 Desktop Intelligence Access and Analysis Guide
Page 61

Building Queries on Universes
Building a more powerful query
The arrow in the sort icon appears the other way up, to indicate that you
have inverted the sort.
Sorts and free-hand SQL
If you apply a sort on a query and then use the SQL statement generated
by the query to create a new report, the SQL statement will ignore the sort.
You need to either adjust the order of the columns in the SQL statement to
create the report you want or modify the order of the columns in the report
itself.
To define sort priority and apply transparent sorts
When you apply more than one sort on a query, you may want to define sort
priority. You can also apply transparent sorts (sorts on objects that are not
result objects) provided that the database at your site supports this feature.
• To define sort priority or apply transparent sorts, click Manage Sorts on
the Query Panel toolbar.
3
The Sorts dialog box appears.
To find out more about these tasks, click Help in the Sorts dialog box.
Setting options and running a query
Before running a query, you can set options that enable you to:
• Specify the number of rows of data that you want the query to return. The
Default Value option corresponds to the maximum number of rows that
the universe designer specified for queries on the current universe, in the
Designer module.
• Eliminate duplicate rows of data. This feature is useful if you think that
the query will return many rows containing the same data.
• Retrieve no data when you run the query. In this case, Desktop Intelligence
generates the query SQL but does not connect to the database. The
names of the objects included in the query appear as column headings
in the report.
Desktop Intelligence Access and Analysis Guide 61
Page 62

Building Queries on Universes
3
Running a query on a different universe
This option is useful if you want to save the query you have built, but
refresh it at an off-peak time.
To set options, then run a query
1. Click Options in the Query Panel.
The Query Options dialog box appears.
2. Click No Duplicate Rows if you want to eliminate duplicate rows of data
from the query result.
3. To obtain a partial result, you can:
• Click 10 rows or 20 rows.
• Enter a number of rows in the Other field. You can use the arrows to
raise or lower the value.
4. Click Do Not Retrieve Data if you do not want the query to connect to
the database when you run it.
When you refresh the query, this option will automatically switch off,
meaning that the query will connect to the database and the data will
appear in the report.
5. Click OK to return to the Query Panel.
Once you are satisfied with the query you have built, click Run.
The query connects to the database and retrieves the data you specified.
The report that appears displays the data for the objects that you placed
in the Result Objects box in the Query Panel.
Running a query on a different universe
Desktop Intelligence allows you to run a query on one universe and then run
the same query on a different universe. By doing this, you can test your query
on a pilot universe before applying it to your real data.
To run a query on a different universe
1. Open the report containing the query.
62 Desktop Intelligence Access and Analysis Guide
Page 63

Building Queries on Universes
Running a query on a different universe
2. Click View Data on the Data menu.
The Data Manager dialog box opens.
3. Choose the query you want to use in the Data Providers list.
4. Click the Definition tab.
5. Click the button to the right of the current universe name.
6. In the dialog box that appears, select the universe you want to use.
7. Cick OK.
8. Click the Results tab.
9. Click Refresh.
10. Click OK to close the Data Manager.
3
Desktop Intelligence Access and Analysis Guide 63
Page 64

Building Queries on Universes
Running a query on a different universe
3
64 Desktop Intelligence Access and Analysis Guide
Page 65

Building Queries with Other Types of Data Provider
4
Page 66

Building Queries with Other Types of Data Provider
4
Overview
Overview
This chapter explains how to create reports using data providers other than
Desktop Intelligence universes. In addition to universes, you can build reports
using free-hand SQL, stored procedures, personal data files, Visual Basic
for Applications (VBA) procedures and XML files.
Using free-hand SQL
SQL is the native query and reporting language understood by relational
database management systems (RDBMSs). When you create a report based
on a Desktop Intelligence universe, the universe generates the SQL that is
passed to the server, thus shielding you from the complexities of SQL queries.
Alternatively, using free-hand SQL, you can interact directly with the database
by creating the SQL yourself.
Creating a report using free-hand SQL
When you create a report using free-hand SQL, you can:
• write a new script or open an existing script
• define lists of values and prompts
• create a new connection to the database or use an existing one
• view raw data before it appears in the report
• parse the script for SQL errors
• save any changes you make to a file
To create a report using free-hand SQL
Click the New Report Wizard button on the Standard toolbar.
The New Report Wizard appears.
1. Select an option for the report layout, then click Next.
66 Desktop Intelligence Access and Analysis Guide
Page 67

Building Queries with Other Types of Data Provider
Using free-hand SQL
The Specify Data Access dialog box appears.
2. Under Others, select Free-hand SQL from the list box, then click Finish.
The Free-hand SQL editor appears.
3. The next step depends on what you want to do.
Then...If you want
to...
Type the script, then go to the next step.Write a new
SQL script
4
Open an existing script
4. Click the Parse button to check the script for SQL errors.
Desktop Intelligence runs the SQL against the database and displays any
error message that the database returns. NOTE: Desktop Intelligence
does not execute COMPUTE and ORDER BY clauses in free-hand SQL
statements.
5. To make a connection to the database:
• Select a connection in the Connection list box, or
•
Create a new connection. (See Creating or editing a connection for
free-hand SQL on page 68).
6. Click Build Hierarchies and Start in Drill Mode if you want to perform
drill-down analysis as soon as the data appears in the report.
7. Click View if you want to see the raw data that the script retrieves.
The Data Manager dialog appears with the raw data in the Results tab.
8. Click OK to close the Data Manager dialog box.
9. Click Run.
In the Free-Hand SQL editor, click Open, then use the
dialog box that appears to locate the SQL script file.
The data retrieved by the SQL query appears in the report.
Desktop Intelligence Access and Analysis Guide 67
Page 68

Building Queries with Other Types of Data Provider
4
Using free-hand SQL
Editing a free-hand SQL script
To get different results from a free-hand SQL script that you have already
run, all you have to do is edit the script then re-run it.
To edit a free-hand SQL script
1. Open the report containing data from the free-hand SQL script, then click
Edit Data Provider on the Data menu.
The Free-Hand SQL dialog box appears.
2. Make the changes to the script. As you work, you can:
• Click Parse to check for SQL errors.
• Click View to see the raw data that the script retrieves.
• Click Save to save the changes you make.
• Click Run.
Desktop Intelligence retrieves the new data and displays it in the report.
Creating or editing a connection for free-hand SQL
To retrieve data using free-hand SQL, you need to define a connection to
your database in Desktop Intelligence. This is not the case when you run
queries on universes because the required connection is stored in the
universe.
Using the free-hand SQL editor to create and edit connections
You create and edit connections for free-hand SQL in the free-hand SQL
editor.
To create a connection
1. Click Create a New Connection.
68 Desktop Intelligence Access and Analysis Guide
Page 69

Building Queries with Other Types of Data Provider
Using free-hand SQL
The Add a Connection dialog box appears.
2. Choose the driver that you will use to connect to the database, then click
OK.
The Connection Properties dialog box appears. This box varies according
to the database driver you selected.
3. Type a name for the connection in the Name box and select the RDBMS
from the Database Engine list box.
4. Type the username, password and database/data source name in the
Login Parameters box.
5. In the Type list box, select Personal or Shared.
• Personal means that only you can use the connection.
• Shared means that other users can use the connection.
6. Click Test to check that the connection is correctly defined. If you receive
an error message, check the parameters you have entered and try again.
If you still cannot successfully create a database connection, see your
database administrator.
4
To edit a connection
You can edit any connection after you have created it. To do this:
1. In the Free-Hand SQL dialog box, select the connection from the
Connections list box, then click Edit Connection.
The Connection Properties dialog box appears.
2. Make your modifications to the connection.
3. Click Test to ensure that the modified connection is still valid.
You can now:
• Click Run to run a script against the connection.
• Click View to see the raw data that the query retrieves.
• Click Cancel to save the connection for future use.
Desktop Intelligence Access and Analysis Guide 69
Page 70

Building Queries with Other Types of Data Provider
4
Using free-hand SQL
Creating a report showing sales by store and category
This section gives an example of a simple report created using free-hand
SQL.
To create an eFashion report that shows sales by store and category in Florida
1. Start Desktop Intelligence
2. Click New Report Wizard.
3. Select an option for the report layout, then click Next.
4. Select Free-hand SQL. You now need to create a connection to the
Microsoft Access eFashion database. To do this:
5. Click Create New Connection.
The Add a Connection dialog box opens.
6. Select ODBC drivers from the list of drivers and click OK.
The Connection Properties dialog box opens.
Type 'eFashion' in the Name box, select 'eFashion' from the Data Source
Name list box, select 'MS Access 2000' from the Database Engine list
box, then click OK.
The eFashion connection you have just created now appears as the
current connection in the Connection box.
7. Type the following SQL in the Free-Hand SQL dialog box:
SELECT ol.shop_name as shop_name,
al.category as category,
FROM outlet_lookup ol INNER JOIN (shop_facts sf INNER
JOIN article_lookup al
ON sf.article_id = al.article_id)
WHERE state = 'Florida'
GROUP BY ol.shop_name, al.category
8. Click Run.
Desktop Intelligence generates the report.
70 Desktop Intelligence Access and Analysis Guide
SUM (sf.quantity_sold) as quantity_sold
ON ol.shop_id = sf.shop_id
Page 71

Building Queries with Other Types of Data Provider
Using free-hand SQL
Creating interactive reports using free-hand SQL
This section gives an example of a free-hand SQL script that includes a
Desktop Intelligence prompt. When you run a report containing a prompt
Desktop Intelligence displays a dialog box in which you specify one or more
parameters to be passed to the report query. The report then returns data
based on your input. Prompts are a Desktop Intelligence rather than an SQL
feature, but the Desktop Intelligence free-hand SQL data provider allows
you to incorporate them into an SQL query.
Creating a prompt with a list of values for a free-hand SQL script
A prompt is a question that requires users to select values when they run
queries. In this way, users filter the query to get the data that is pertinent to
them.
In addition, a prompt can display a list of values; the user can select from
this list rather than typing directly into the prompt.
4
Syntax for prompts and lists of values in free-hand SQL.
You define a prompt and its list of values by including the @prompt function
in the SQL WHERE clause. The syntax of the function is as follows:
@prompt ('prompt','data type',{'value1','value2',
etc.},mono/multi,free/constrained)
The following table describes each function component:
Desktop Intelligence Access and Analysis Guide 71
Page 72

Building Queries with Other Types of Data Provider
4
Using free-hand SQL
@prompt
The @prompt function,
which can take up to
five arguments. The only mandatory argument
is 'prompt'. If you omit
an argument, Desktop
Intelligence supplies its
default value. Even If
you omit an argument,
you must still include the
commas that precede
and follow it. Thus, the
syntax for a prompt in
which only the first argument is specified is as
follows:
DefaultDescriptionArgument
N/A
@prompt('Which
year?',,,,)
The text that appears in
the prompt box when
you run the report. This
argument takes a char-
prompt
72 Desktop Intelligence Access and Analysis Guide
acter string enclosed in
quotes, for example
'Select a customer or
customers'
None
Page 73

data type
value1,
value2...
Building Queries with Other Types of Data Provider
Using free-hand SQL
DefaultDescriptionArgument
The type of data that the
prompt returns (character, number or date).
This argument can be
one of the following
three values enclosed
in quotes:
'A' for character data
'N' for numeric data
'D' for date data
The list of values displayed when you run
the report. The list can
consist of up to 256
character strings enclosed in single quotes,
for example:
'London','New
York','Paris'
'A'
N/A
4
If you do not include this
argument you will have
to type values directly
into the prompt.
Desktop Intelligence Access and Analysis Guide 73
Page 74

Building Queries with Other Types of Data Provider
4
Using free-hand SQL
mono/multi
free/constrained
Specifies whether the
user can select one or
multiple entries from the
list of values. This argument takes one of two
values:
mono, which prevents
multiple selection
multi, which allows multiple selection
Determines whether
users can enter values
directly. This argument
takes one of the following parameters:
free - user can enter
values directly
DefaultDescriptionArgument
mono
constrained
constrained - user must
select values from the
list of values
To create a prompted eFashion report on sales by state, store and category
1. Click New Report Wizard.
2. Select an option for the report layout, then click Next.
3. Choose 'free-hand SQL' from the Others list box, then click Next.
The Free-Hand SQL dialog box appears.
74 Desktop Intelligence Access and Analysis Guide
Page 75

Building Queries with Other Types of Data Provider
Using stored procedures
4.
If necessary, create a connection to the eFashion database (see Creating
a report showing sales by store and category on page 70 for an
explanation of how to do this).
5. Type the following SQL into the Free-Hand SQL dialog box:
SELECT ol.shop_name as shop_name,
FROM outlet_lookup ol INNER JOIN (shop_facts sf INNER
JOIN article_lookup al
ON sf.article_id = al.article_id)
WHERE state = @prompt ('Choose a state', 'A', {'Califor
nia', 'Illinois', 'Florida'},multi,constrained)
GROUP BY ol.shop_name, al.category
6. Click Run.
The Enter or Select Values dialog box appears.
7. Click Values.
The List of Values dialog box appears.
8. Select a state or states from the list and click OK.
al.category as category,
SUM (sf.quantity_sold) as quantity_sold
ON ol.shop_id = sf.shop_id
4
Desktop Intelligence generates the report based on the states you
selected.
Restrictions on free-hand SQL scripts
The types of SQL script that you are allowed to run as free-hand SQL are
determined by your Desktop Intelligence administrator. If you attempt to run
a script for which you do not have permission, you will receive an error
message. Typically, you are able to run scripts that contain only one SELECT
statement. See your Desktop Intelligence administrator if you need to run
scripts that are more complex or that make changes to database data.
Using stored procedures
This section describes stored procedures and explains how to use them to
bring data to your Desktop Intelligence reports.
Desktop Intelligence Access and Analysis Guide 75
Page 76

Building Queries with Other Types of Data Provider
4
Using stored procedures
What are stored procedures?
Stored procedures are SQL scripts—ranging from simple to extremely
complex —that are stored as executable code in an RDBMS. They can
receive arguments and return data.
How do you use stored procedures in Desktop Intelligence?
In Desktop Intelligence, stored procedures are data providers like universes
or free-hand SQL. In the New Report Wizard, you select the stored procedure
that you want to use. When you run the report you enter data for any input
parameters that the procedure has and the procedure returns data to Desktop
Intelligence which Desktop Intelligence presents as a report.
Restrictions on stored procedures
• The Desktop Intelligence supervisor grants access to the database or
account where stored procedures are located.
• Not all RDBMSs support stored procedures. Consult your database guide
to see if yours does.
• COMPUTE, PRINT, OUTPUT or STATUS statements contained in stored
procedures are not executed.
Using a stored procedure to retrieve data
This section demonstrates how to retrieve data into a Desktop Intelligence
report using a stored procedure. The following example uses a stored
procedure that returns data from the eFashion database running on Microsoft
SQL Server. The procedure takes the state and article name as input
parameters and returns a list of shops within the state and their total sales
of articles with names similar to the one specified. The query in the stored
76 Desktop Intelligence Access and Analysis Guide
Page 77

Building Queries with Other Types of Data Provider
procedure is as follows (@state and @article are parameters passed to
the procedure):
SELECT ol.shop_name,
al.article_label,
SUM (sf.quantity_sold) as total_sold
FROM outlet_lookup ol INNER JOIN (
shop_facts SF INNER JOIN article_lookup al
ON sf.article_id = al.article_id )
ON ol.shop_id = sf.shop_id
WHERE ol.state = @state
AND al.article_label LIKE '%' + @article + '%'
GROUP BY ol. shop_name,
al.article_label
To create a report showing article sales by state
1. Click the New Report wizard button on the Standard toolbar.
The New Report Wizard appears.
2. Select an option for the report layout, then click Next.
The Specify Data Access dialog box appears.
Using stored procedures
4
3. Click Others, then select Stored procedures from the list.
4. Click Next, then select a connection.
5. Click Next, then choose the stored procedure.
6. Click Finish.
The Stored Procedure Editor appears.
If the stored procedure has input parameters, supply values for each
parameter by typing its value in the Values box.
For each parameter:
Then...If you want...
To reuse the value you typed the
next time you run the report
Desktop Intelligence Access and Analysis Guide 77
Select Use this value in the Next
Execution dropdown
Page 78

Building Queries with Other Types of Data Provider
4
Using personal data files
Then...If you want...
Desktop Intelligence to prompt you
for a value the next time you run
the report
7. Click Run.
Desktop Intelligence runs the stored procedure and places its data in a
report.
Select Prompt me for a value in the
Next Execution list
Using personal data files
The Personal Data File data provider allows you to access data in Microsoft
Excel spreadsheets, dBASE files, and text files.
What are the benefits of using personal data files?
The main benefits of using personal data files are as follows:
• You can display corporate data next to personal data in the same report.
For example, you can compare your company budget (corporate data)
with your own running costs (personal data). You can obtain such a report
by building a query to retrieve the corporate data, then by inserting a new
table that displays data from a personal data file.
• If you have no connection to a remote database or if there is no RDBMS
at your site, you can use personal data files as your only data source.
• You can use Desktop Intelligence reporting and analysis features to work
on data that comes from other applications.
78 Desktop Intelligence Access and Analysis Guide
Page 79

Building Queries with Other Types of Data Provider
Using personal data files
Creating a report using a personal data file
Creating a report from a personal data file is a two-stage procedure:
• Specify the personal data file that you want to use for the report. This is
described under To select the personal data file for the report on page 79.
• Set options that depend on the type of file you selected in the first stage.
For example, the options to set for a spreadsheet are different from those
for a text file.
To select the personal data file for the report
To use the New Report Wizard to get to the personal data file containing the
data you need:
1. Click New Report Wizard on the Standard toolbar.
The New Report Wizard appears.
4
2. Select an option for the report layout, then click Next.
The Specify Data Access dialog box appears.
3. Under Others, click Personal data files, then click Finish:
The Access Personal Data dialog box appears.
4. Click Browse to locate the file that contains the data you want.
The Open a File to Access Personal Data dialog box appears.
When you have located the file and closed the dialog box, the path to the
file appears in the Name field of the Access Personal Data dialog box.
The Format field displays the format of the file you selected.
The options in the dialog box are now specific to the file type you are
working with.
If you have selected a dBASE file, no further options are available so click
Run.
Set the options you want:
Desktop Intelligence Access and Analysis Guide 79
Page 80

Building Queries with Other Types of Data Provider
4
Using personal data files
Applies ToThen...If you want to...
Show the first line of
the file as column
headers in the report
Create drill hierarchies
and open the report in
drill mode. (Desktop
Intelligence can do this
only if the dimensions
in your report have a
hierarchical structure,
for example Year,
Quarter, Month
Specify the delimiter in
a text file
Select the worksheet
containing the data you
want
Select First row con-
tains column names
Select Build hierarchies and start in drill
mode
Select Tabulation,
Space or Character.
(If you select Character, you need to enter
the character that delimits the data.)
Select the worksheet
from the Sheet Name
list
All files
All files
Text Files (.asc; .prn;
.txt; .csv)
Microsoft Excel (.xls)
Select data from all
fields in a worksheet
Select data from a
range of cells in a
worksheet)
80 Desktop Intelligence Access and Analysis Guide
Type the range (for example A3:R25) in the
Range Definition box
Microsoft Excel (.xls)Select All Fields
Microsoft Excel (.xls)
Page 81

Building Queries with Other Types of Data Provider
Using Visual Basic for Applications procedures
Applies ToThen...If you want to...
4
Select data from a
named range in a
worksheet
5. Click Run.
The data from the personal data file appears in the report.
Select the range in the
Range Name list
Microsoft Excel (.xls)
Using Visual Basic for Applications
procedures
A VBA data provider is a powerful and flexible tool for accessing external
data. Very often you will want to access automation servers through VBA to
retrieve their proprietary data. VBA allows you to retrieve data from various
sources: ADO, DAO, RDO, Application Object Models, EDK and low-level
APIs.
To create a VBA data provider, you write a VBA procedure that takes the
interface DpVBA Interface as a parameter. You can write this procedure from
within the VBA environment of Desktop Intelligence. The DpVBAInterface is
the interface to the VBA data provider Automation object which is described
in detail in the Desktop Intelligence Developer Guide.
To write a VBA data provider
1. Create a connection to the data source.
2. Create a data cube.
3. Set the data cube dimensions.
4. Populate the cube with data from the data source.
Once the data cube is populated, you can generate a report based on this
data in Desktop Intelligence.
Desktop Intelligence Access and Analysis Guide 81
Page 82

Building Queries with Other Types of Data Provider
4
Using Visual Basic for Applications procedures
To create a report using a VBA data provider
1. Click New Report Wizard on the Standard toolbar.
The New Report Wizard appears.
2. Select an option for the report layout, then click Next.
The Specify Data Access dialog box appears.
3. Under Others, click Visual Basic for Applications procedures, then
click Finish.
The Access Data From VBA dialog box appears.
4. Select the subroutine and click Run.
Desktop Intelligence generates the report.
Accessing an Outlook inbox using VBA
This example shows how to generate a report based on the contents of an
Outlook inbox.
To reference the Outlook object library
1. Click Macros on the Tools menu.
2. Click Visual Basic Editor.
The Visual Basic editor appears.
3. Click References on the Tools menu.
The References dialog box appears.
4. Select the Microsoft Outlook Object Library and click OK.
To enter the code of the VBA data provider.
1. Click New Report Wizard on the Standard toolbar.
The New Report Wizard appears.
82 Desktop Intelligence Access and Analysis Guide
Page 83

Building Queries with Other Types of Data Provider
Using Visual Basic for Applications procedures
2. Select an option for the report layout.
3. Click Next.
The Specify Data Access dialog box appears.
4. Click Visual Basic for Applications procedures under Others.
5. Click Finish.
The Access Data from VBA dialog box appears.
6. Type Outlook for the subroutine name.
7. Click Create.
The Visual Basic editor opens with a skeleton subroutine.
8. Type the following code:
Public Sub Outlook(dpInterface As DpVBAInterface)
Dim olkApp As Outlook.Application
Dim nspNameSpace As NameSpace
4
Dim objInboxFolder As Object
Dim objMail As Object
Dim oCube As DpVBACube
Dim sName(10) As String
Dim oColumns As DpVBAColumns
Set olkApp = CreateObject("Outlook.Application")
Set nspNameSpace = olkApp.GetNamespace("MAPI")
Set objInboxFolder = nspNameSpace.GetDefaultFolder(olFolderInbox)
dpInterface.UserString(1) = "User String for Outlook Data Provider"
Set oCube = dpInterface.DpVBACubes.Item(1)
Set oColumns = oCube.DpVBAColumns
oColumns.SetNbColumns (7)
Desktop Intelligence Access and Analysis Guide 83
Page 84

Building Queries with Other Types of Data Provider
4
Using Visual Basic for Applications procedures
Dim oCol As DpVBAColumn
Dim row As Integer
Dim col As Integer
Dim sColName(7) As String
sColName(1) = "From"
sColName(2) = "To"
sColName(3) = "Cc"
sColName(4) = "Subject"
sColName(5) = "Size"
sColName(6) = "Created"
sColName(7) = "Received"
Dim oColData(7) As Variant
'Loop through 10 rows in the inbox and assign values to the 7 columns
'in each row.
For row = 1 To 10
'Get the row's data.
Set objMail = objInboxFolder.Items.Item(row)
oColData(1) = objMail.SenderName
oColData(2) = objMail.To
oColData(3) = objMail.CC
oColData(4) = objMail.Subject
oColData(5) = objMail.Size
oColData(6) = objMail.CreationTime
84 Desktop Intelligence Access and Analysis Guide
Page 85

Building Queries with Other Types of Data Provider
Using Visual Basic for Applications procedures
oColData(7) = objMail.ReceivedTime
'Loop throug the columns.
For col = 1 To 7
Set oCol = oColumns.Item(col)
'Set the column name and data type on the first iteration.
If row = 1 Then
oCol.Name = sColName(col)
'First 5 columns are strings, last 2 are dates.
If col < 6 Then
oCol.Type = boCharacterObject
Else
oCol.Type = boDateObject
End If
4
End If
oCol.Qualification = boDimension
oCol.Item(row) = oColData(col)
Next col
Next row
dpInterface.CheckDataIntegrity (boCheckAll)
End Sub
9. Click Compile on the Debug menu to compile the project.
10. Click Close
11. Click Return to Desktop Intelligence on the File menu to return to Desktop
Intelligence.
12. Click Run.
Desktop Intelligence Access and Analysis Guide 85
Page 86

Building Queries with Other Types of Data Provider
4
Using XML files
Desktop Intelligence generates the report.
Using XML files
This section describes how to use XML as a Desktop Intelligence data
provider.
What is XML?
XML is a text-based data format that structures data in elements or tags.
XML files are similar to the HTML files used to build pages on the World
Wide Web. The principal difference is that, whereas the set of HTML elements
is limited to those used to describe the structure of a Web page, an XML file
can contain any elements, depending on its application.
Here is an example of an XML file containing data from the Island Resorts
Marketing database:
<?xml version="1.0" encoding="UTF-8"?>
<Resorts>
<Resort>
<Country>France</Country>
<ResortName>French Riviera</ResortName>
<ServiceLine>Accomodation</ServiceLine>
<Revenue>563250</Revenue>
</Resort>
<Resort>
<Country>France</Country>
<ResortName>French Riviera</ResortName>
<ServiceLine>Food and Drinks</ServiceLine>
<Revenue>107400</Revenue>
86 Desktop Intelligence Access and Analysis Guide
Page 87

Building Queries with Other Types of Data Provider
</Resort>
<Resort>
<Country>France</Country>
<ResortName>French Riviera</ResortName>
<ServiceLine>Recreation</ServiceLine>
<Revenue>164770</Revenue>
</Resort>
<Resort>
<Country>US</Country>
<ResortName>Bahamas Beach</ResortName>
<ServiceLine>Accomodation</ServiceLine>
<Revenue>67364</Revenue>
</Resort>
Using XML files
4
<Resort>
<Country>US</Country>
<ResortName>Bahamas Beach</ResortName>
<ServiceLine>Food and Drinks</ServiceLine>
<Revenue>169680</Revenue>
</Resort>
<Resort>
<Country>US</Country>
<ResortName>Bahamas Beach</ResortName>
<ServiceLine>Recreation</ServiceLine>
<Revenue>128100</Revenue>
</Resort>
Desktop Intelligence Access and Analysis Guide 87
Page 88

Building Queries with Other Types of Data Provider
4
Using XML files
</Resorts>
XML files can store many different types of data. This manual could be stored
as XML, as could the data in a relational database. Database-like XML, such
as the bookstore data above, is the only XML that is meaningful as a
datasource for Desktop Intelligence.
Creating a report using an XML file
Creating an XML-based report involves two steps:
• building an XML filter
• building the report
To build the XML filter
When you build an XML filter you choose the elements in the XML file that
you want to be available for inclusion in your report.
1. Click New Report Wizard.
2. Select a layout option.
3. Click Begin.
4. Click Others and select XML Data Provider from the Others box.
5. Click Next.
6. In the Select an XML Filter step, click New.
The Create XML Filter dialog box appears.
7. Click Load XML (the first button at the top, with an open folder icon), then
use the Open dialog to navigate to and select the XML file.
The structure of the XML file appears in the Structure box.
To reload the XML, click Refresh. To display the values of an element,
select the element in the structure box and click Display Sample Values.
8. Select the elements to be included in the Structure box.
Some XML elements do not contain data; they act as a container for other
elements." Resorts" is an example of such an element in this file. It is not
meaningful to include such elements in a report. If you do, their values
88 Desktop Intelligence Access and Analysis Guide
Page 89

appear as <element_name> + '_' + number . If you include the Resorts
element in a Desktop Intelligence report, it appears as Resorts_00001,
Resorts_000002.
9. Edit the object names, qualifications and data types in the Variables box.
10. Click Save.
The Save XML Filter As dialog box appears.
11. Type a filter name in the New Filter Name text box
12. Click OK.
The filter appears in the list of XML filters.
To build an XML report
You build reports based on XML using the XML filters that you have defined.
1. Click New Report Wizard.
2. Select a layout option.
3. Click Begin.
4. Click Others.
5. Select XML data provider from the Others box.
6. Click Begin.
7. Select the filter in the list of filters.
8. Click Finish.
Building Queries with Other Types of Data Provider
Using XML files
4
The XML Query Panel appears, showing the elements you selected when
you built the filter available for inclusion in the report.
9. Double-click the elements that you want to include in the repor.
10. Click Run.
Desktop Intelligence generates the report.
Desktop Intelligence Access and Analysis Guide 89
Page 90

Building Queries with Other Types of Data Provider
4
Using XML files
To set the location of XML files
When you create an XML filter, Desktop Intelligence creates a file with the
filter definition. You can tell Desktop Intelligence where to store XML filter
files and XML files.
1. Click Options on the Tools menu.
The Options dialog box appears.
2. Select the File Locations tab.
3. Select XML Sources to change the location of XML source files.
4. Select XML Filters to change the location of XML filter files.
5. Click Change.
The Browse for Folder dialog box appears.
6. Use the Browse for Folder dialog box to select the folder where you want
the files to be stored.
7. Click OK to close the Browse for Folder dialog box.
8. Click OK to close the Options dialog box.
90 Desktop Intelligence Access and Analysis Guide
Page 91

Combining Data from Different Sources
5
Page 92

Combining Data from Different Sources
5
Overview
Overview
The data you need might not all come from the same source. For example,
you might have business objectives in a corporate database and personal
data that you store in a spreadsheet. Desktop Intelligence enables you to
combine data from different sources in the same report.
This chapter explains:
• the different data sources you can use
• how to include data from different sources in the same report
• when Desktop Intelligence automatically links data from different sources,
and when you have to make the link yourself
Which data sources are available?
Desktop Intelligence lets you access data from a wide range of sources. You
can access data from:
• relational databases (RDBMS), such as ORACLE and Microsoft SQL
Server
• text files and spreadsheets
• packaged applications such as SAP.
• almost any data source using Microsoft Visual Basic for Applications
(VBA) procedures
• XML files
Including data from different data sources in the same report
You access data sources in Desktop Intelligence by building data providers
for the data sources. To include data from different sources in the same
report, you display data from different data providers. For example, if you
want to display data from a Sybase database and a Microsoft Excel file in
the same report, you could retrieve the data from the Sybase database by
92 Desktop Intelligence Access and Analysis Guide
Page 93

Combining Data from Different Sources
Including data from different data sources in the same report
building a query or by using a stored procedure and retrieve the data from
Excel by accessing a personal data file. Desktop Intelligence supports the
following types of data providers:
• queries on universes
• stored procedures
• free-hand SQL
• personal data files
• VBA procedures
• SAP
• XML
Which data providers can you combine in one report?
You can combine data from any Desktop Intelligence-supported data provider
with data from any other Desktop Intelligence-supported data provider in a
single report. For example, in a report that displays data from a query on a
universe, you can build a new query on a different universe. You can also
use a different type of data provider: a stored procedure, a free-hand SQL
script, or a personal data file.
5
Using separate data providers for separate blocks in one report
You can display data from separate data providers in one block or separate
blocks in a Desktop Intelligence report. To display data from separate data
providers in one block, you first create a separate block with the separate
data provider and then combine data from the blocks.
To create a separate block in a report using a separate data provider
1. Open a report.
2. Click Table (or Crosstab or Chart) on the Insert menu. Your choice
depends on the type of block you want to insert.
Desktop Intelligence Access and Analysis Guide 93
Page 94

Combining Data from Different Sources
5
Including data from different data sources in the same report
3. With your mouse, draw a rectangle where you want the new block to
appear.
4. When you release the mouse button, a wizard appears. Which wizard
(New Table, New Crosstab, or New Chart) appears depends on the
command you clicked on the Insert menu.
5. To use a separate data provider, click Access new data in a different
way, then click Next. The New Table wizard with Access new data in
a different way selected appears.
6. Click Begin.
The Specify Data Access screen appears.
7. Select the type of data provider you want to use, then click Finish. The
editor for the data provider appears.
8. Define and run the data provider.
Desktop Intelligence can automatically link data providers. It will prompt
you to link the new data provider with the existing data provider if:
• No common dimension exists between them. Common dimensions
are dimensions with the same name occurring in the same universe.
Dimensions called Year that occur in a universe and an Excel
spreadsheet are not common. Desktop Intelligence will prompt you to
link them.
and
• The new block is in a section.
The new data appears in the new block.
Further information
For further information on linking data providers, refer to Linking data
providers on page 98.
94 Desktop Intelligence Access and Analysis Guide
Page 95

Combining Data from Different Sources
Including data from different data sources in the same report
Displaying data from separate data providers in the same block
Once you have created a separate block in a report from a separate data
provider and you manually or Desktop Intelligence automatically has linked
the data providers, you can display data from the separate data providers in
one block. You can do any of the following:
ThenIf you
5
Want to display data in an existing
table or crosstab,
Want to display data in an existing
chart,
Want to display data in any type of
existing block,
use the Pivot tab in the Table Format
dialog box.
use the Pivot tab in the Chart Format
dialog box.
use the Slice and Dice Panel.
Which variables from linked data providers can you display?
Compatibility rules determine which variables from separate data providers
can be combined in the same block. When you cannot include a variable in
a block, it appears dimmed and italicized.
You can use the common dimension from either data provider. Most often,
you can use measures from both data providers in the same block.
To display data in an existing table or crosstab
1. Click inside the table or crosstab that you want to modify with data from
another data provider.
2. Click Table or Crosstab on the Format menu.
Desktop Intelligence Access and Analysis Guide 95
Page 96

Combining Data from Different Sources
5
Including data from different data sources in the same report
3. In the Table Format dialog box, click the Pivot tab.
4. In the Used Variables box, click the folder that represents where you want
to display the data: Columns, Rows, Body.
5. In the Available Variables box, click the variable you want to add, then
click Add.
6. Click OK.
To display data in an existing chart
1. Click inside the chart that you want to modify with data from another data
provider.
2. Click Chart on the Format menu.
3. In the Chart Format dialog box, click the Pivot tab.
4. In the Used Variables box, click the folder that represents the axis where
you want to display the data: Columns, Rows, Body.
5. In the Available Variables box, click the variable you want to add, then
click Add.
6. Click OK.
In 2-D charts, all the variables are located in the X-Axis and Y-Axis folders.
In 3-D matrix charts, the variables are located in all three folders: X-Axis,
Y-Axis, and Z-Axis.
To add data in slice and dice mode
1. With a report open, click Slice and Dice to display the Slice and Dice
Panel.
2. Variables for all the blocks in the report are displayed in the Available
Variables box.
3. Drag the icon of the variable you want to add to the report from the
Available Variables box and drop it either in the Section box or in the
Block Structure box.
4. Repeat the previous step for other variables you want to add.
5. Click Apply.
96 Desktop Intelligence Access and Analysis Guide
Page 97

Combining Data from Different Sources
Basing a data provider on an existing data provider
Basing a data provider on an existing data
provider
You can base new data providers on existing data providers that use
universes, or personal data providers.
To base a data provider on an existing data provider
1. Click Table (or Crosstab or Chart) on the Insert menu. Your choice
depends on the type of block you want to insert.
2. With your mouse, draw a rectangle where you want the new block to
appear.
3. When you release the mouse button, a wizard appears. Which wizard
(New Table, New Crosstab, or New Chart) appears depends on the
command you clicked on the Insert menu.
4. Click Use an existing query to build a new one. (This option is not
available if your report does not already contain at least one data provider
based on a universe, or a personal data provider.
5
A list of data providers currently in the document appears.
5. Select a data provider and click Finish.
The Query Panel appears showing the definition of the data provider you
selected.
6. Modify the query in the query panel, then click Run.
7. The table, chart or crosstab based on the new query appears in the report.
Prompts and linking
Because prompt name are unique throughout a report, a data provider based
on an existing data provider contains prompts with names in the form
<prompt_name>_<prompt_number> if the original data provider had prompts.
For example, if the original data provider contained a prompt called Which
Country?, the copied prompt in the new data provider is called Which
Country?_1.
Desktop Intelligence Access and Analysis Guide 97
Page 98

Combining Data from Different Sources
5
Linking data providers
If the original data provider was linked to another data provider (see Linking
data providers on page 98 for details on linking data providers), the link is
not preserved in the new data provider.
Linking data providers
Linking data providers enables data from different sources to be computed
in the same table, crosstab, or chart in a report.
What situations require you to link data providers?
Desktop Intelligence automatically links data providers with a common
dimension. Two dimensions in separate data providers are common when
they belong to the same universe and have the same name. Desktop
Intelligence prompts you to link data providers if there is no common
dimension between the data providers.
If you simply want to add columns of data to a report, use the Edit Data
Provider command on the Data menu instead of building a new query. This
method lets you add result objects to the initial query; Desktop Intelligence
automatically inserts the new columns of data in the report or creates a new
report.
Example: Desktop Intelligence prompts you to link data providers
Here's an example scenario where Desktop Intelligence prompts you to
link data providers:
•
You create a new document by running a query on a universe.
•
You format the report as a master/detail, using for example the Year
dimension.
•
You want to compare yearly revenue with your sales targets, so you
insert a new table in the Year section.
•
Rather than inserting data from the document, or using the universe you
ran the first query on, you pull in data from the spreadsheet that contains
your personal targets.
•
Even though the spreadsheet contains the Year column, Desktop
Intelligence prompts you to link the personal data file with the query
98 Desktop Intelligence Access and Analysis Guide
Page 99

Combining Data from Different Sources
Linking data providers
already in the report, because you're inserting the new data in a section
that's generated by the query data.
Which dimension should act as the link?
It is necessary that the dimension you use to link data providers be the same
type (numeric or alphanumeric) in both data providers. If not, two rows of
data will appear for the linked object when you create a table that uses the
object. Additionally you should use only dimensions that return the same
type of values. It doesn't make sense to create a link between dimensions
with totally different lists of values (Year and Region, for example).
To link data providers when you're inserting a new block
1. Click Table, Crosstab or Chart on the Insert menu.
2. In the Wizard that appears, click Access new data in a different way,
then click Begin.
3. The Specify Data Access dialog box appears.
4. Select the type of data provider you want to run, then click Finish.
5. Build and run the data provider.
6. Desktop Intelligence displays a dialog box which prompts you to link the
new data provider with the data in the report.
7. Select the linking dimension from the new data provider by clicking an
icon in the Dimensions box.
8. Select the report's section master by clicking an icon in the Master(s) in
the Report box.
9. The dimension you clicked in the Dimensions box appears below the
dimension in the Master(s) in the Report box:
10. Click OK.
5
The new data appears in the report. Measures are automatically
calculated.
Note:
If the Links Between Data Provider and Report dialog box appears, and you
click OK or Cancel without creating a link, you will obtain a Cartesian product.
A Cartesian product is a report result that returns each row from the first data
Desktop Intelligence Access and Analysis Guide 99
Page 100

Combining Data from Different Sources
5
Linking data providers
provider joined to every row from the second. If the first data provider has
100 rows and the second 50, the Cartesian product contains 5000 rows.
Linking existing data providers
The procedure above describes how to link data providers when you're
bringing new data to a report section. But what if you find yourself in the
following situation?
• Your report contains two tables - one from a universe, the other from a
personal data file.
• There's no link between the tables because when you inserted the second
table, you simply placed it alongside the existing table without having
previously linked their data providers.
• You now want to create the master/detail format, which is possible
because the tables share a dimension with the same name and same
type.
To link existing data providers
1. Open the document containing the data providers you want to link.
2. Click View Data on the Data menu.
The Data Manager appears.
3. In the Data Providers box, click the dimension you are going to use as
the link between the data providers.
4. Click the Definition tab, then click Link To.
The Define Link Between Dimensions dialog box appears. It lists the
dimensions you can use to link the two data providers.
5. Click the dimension you want to use as the link.
The symbol next to the dimension name now changes to indicate that the
dimension is the link between two data providers. This symbol will also
now appear when you click the dimension in the Data Manager.
6. Click OK to close the dialog box, then click OK in the Data Manager.
100 Desktop Intelligence Access and Analysis Guide
 Loading...