

SAP Business objects Enterprise XI 3.0 Using Functions, Formulas and Calculations in Web Intelligence

Using Functions, Formulas and
Calculations in Web Intelligence
BusinessObjects Enterprise XI 3.0

Copyright
© 2008 Business Objects, an SAP company. All rights reserved. Business Objects
owns the following U.S. patents, which may cover products that are offered and
licensed by Business Objects: 5,295,243; 5,339,390; 5,555,403; 5,590,250;
5,619,632; 5,632,009; 5,857,205; 5,880,742; 5,883,635; 6,085,202; 6,108,698;
6,247,008; 6,289,352; 6,300,957; 6,377,259; 6,490,593; 6,578,027; 6,581,068;
6,628,312; 6,654,761; 6,768,986; 6,772,409; 6,831,668; 6,882,998; 6,892,189;
6,901,555; 7,089,238; 7,107,266; 7,139,766; 7,178,099; 7,181,435; 7,181,440;
7,194,465; 7,222,130; 7,299,419; 7,320,122 and 7,356,779. Business Objects and
its logos, BusinessObjects, Business Objects Crystal Vision, Business Process
On Demand, BusinessQuery, Cartesis, Crystal Analysis, Crystal Applications,
Crystal Decisions, Crystal Enterprise, Crystal Insider, Crystal Reports, Crystal
Vision, Desktop Intelligence, Inxight and its logos , LinguistX, Star Tree, Table
Lens, ThingFinder, Timewall, Let There Be Light, Metify, NSite, Rapid Marts,
RapidMarts, the Spectrum Design, Web Intelligence, Workmail and Xcelsius are
trademarks or registered trademarks in the United States and/or other countries
of Business Objects and/or affiliated companies. SAP is the trademark or registered
trademark of SAP AG in Germany and in several other countries. All other names
mentioned herein may be trademarks of their respective owners.
Third-party
Contributors
Business Objects products in this release may contain redistributions of software
licensed from third-party contributors. Some of these individual components may
also be available under alternative licenses. A partial listing of third-party
contributors that have requested or permitted acknowledgments, as well as required
notices, can be found at: http://www.businessobjects.com/thirdparty
2008-09-03

Contents
About this guide 7Chapter 1
Using standard and custom calculations 9Chapter 2
Using standard and custom calculations in your reports...........................10
Understanding calculation contexts 23Chapter 3
What are calculation contexts?..................................................................24
Default calculation contexts.......................................................................27
Modifying the default calculation context with extended syntax................34
Standard calculations...........................................................................10
Using formulas to build custom calculations........................................11
Working with functions.........................................................................13
The input context..................................................................................24
The output context................................................................................25
Default contexts in a vertical table........................................................29
Default contexts in a horizontal table...................................................30
Default contexts in a crosstab..............................................................30
Default contexts in a section................................................................32
Default contexts in a break...................................................................33
Extended syntax operators...................................................................35
Web Intelligence extended syntax keywords.......................................38
Web Intelligence functions, operators and keywords 49Chapter 4
Web Intelligence functions.........................................................................50
Aggregate functions.............................................................................50
Using Functions, Formulas and Calculations in Web Intelligence 3

Contents
Character functions..............................................................................78
Date and Time functions......................................................................97
Data Provider functions......................................................................109
Document functions............................................................................122
Logical functions.................................................................................131
Numeric functions...............................................................................140
Misc functions.....................................................................................163
Web Intelligence function and formula operators....................................181
Mathematical operators......................................................................182
Conditional operators.........................................................................182
Logical operators................................................................................183
Function-specific operators................................................................186
Extended syntax operators.................................................................194
Web Intelligence extended syntax keywords...........................................198
The Block keyword.............................................................................199
The Body keyword..............................................................................200
The Break keyword............................................................................201
The Report keyword...........................................................................202
The Section keyword..........................................................................203
How Web Intelligence rounds and truncates numbers............................204
Troubleshooting Web Intelligence formulas 207Chapter 5
Formula error and information messages................................................208
#COMPUTATION...............................................................................208
#CONTEXT........................................................................................208
#DATASYNC......................................................................................209
#DIV/0................................................................................................209
#INCOMPATIBLE...............................................................................210
#MULTIVALUE...................................................................................210
#OVERFLOW.....................................................................................210
#PARTIALRESULT.............................................................................211
4 Using Functions, Formulas and Calculations in Web Intelligence

Contents
#RANK...............................................................................................211
#RECURSIVE....................................................................................211
#SECURITY.......................................................................................212
#SYNTAX...........................................................................................212
#TOREFRESH...................................................................................213
#UNAVAILABLE.................................................................................213
#ERROR............................................................................................213
Calculating values with smart measures 215Chapter 6
Smart measures defined..........................................................................216
Grouping sets and smart measures........................................................216
How Web Intelligence manages grouping sets..................................217
Smart measures and the scope of analysis.............................................218
Smart measures and SQL.......................................................................218
Grouping sets and the UNION operator.............................................218
Smart measures and formulas................................................................221
Smart measures and dimensions containing formulas......................221
Smart measures in formulas..............................................................222
Smart measures and filters......................................................................222
Smart measures and filters on dimensions........................................222
Smart measures and drill filters..........................................................223
Comparing values using Web Intelligence functions 225Chapter 7
Comparing values using the Previous function.......................................226
Comparing values using the RelativeValue function...............................226
Slicing dimensions and the RelativeValue function............................228
Slicing dimensions and sections........................................................230
Order of slicing dimensions................................................................232
Slicing dimensions and sorts..............................................................234
Using RelativeValue in crosstabs.......................................................236
Using Functions, Formulas and Calculations in Web Intelligence 5

Contents
Get More Help 237Appendix A
Index 241
6 Using Functions, Formulas and Calculations in Web Intelligence

About this guide
1

About this guide
1
The Using Functions, Formulas and Calculations in Web Intelligence guide
provides detailed information on the advanced calculation capabilities in Web
Intelligence. It also provides a syntax reference to the Web Intelligence
functions and operators.
The guide presents this information generically, without reference to the Web
Intelligence interface. For information on how to work with calculation-related
features in your Web Intelligence documents (for example, how to add a
variable or a formula to a report), see Performing On-Report Analysis With
Web Intelligence, Building Reports with the Java Report Panel and Web
Intelligence Rich Client User's Guide.
8 Using Functions, Formulas and Calculations in Web Intelligence

Using standard and custom calculations
2

Using standard and custom calculations
2
Using standard and custom calculations in your reports
Using standard and custom calculations
in your reports
You can use standard calculation functions to make quick calculations on
the data in Web Intelligence reports. If standard calculations are not sufficient
for your needs, you can use the Web Intelligence formula language to build
custom calculations.
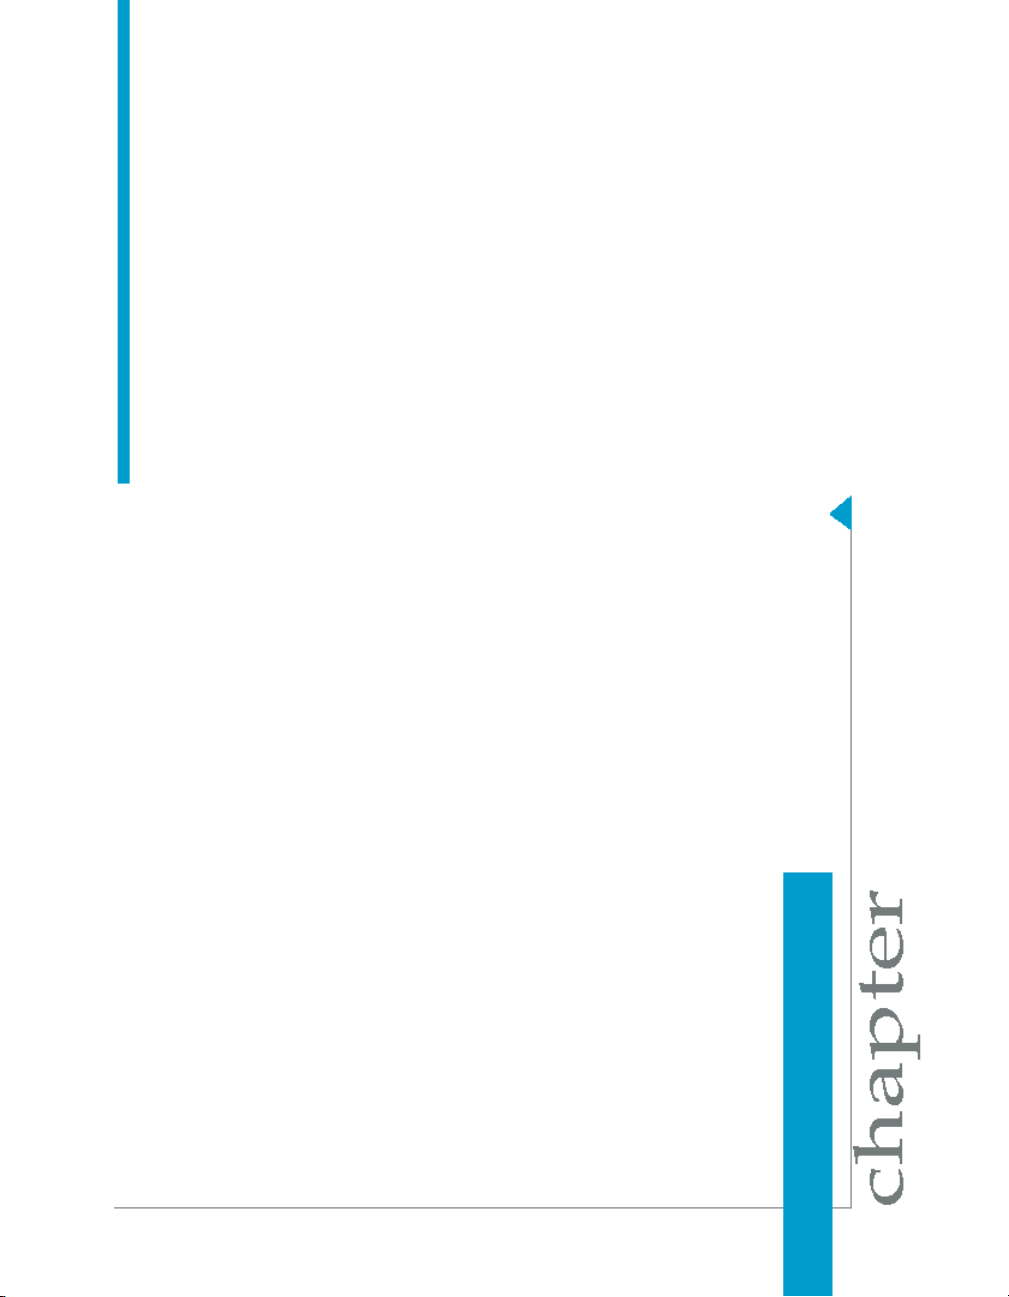
Standard calculations
You can use standard calculation functions to make quick calculations on
the data in Web Intelligence reports. The following standard calculations are
available:
DescriptionCalculation
Sum
Count
Minimum
Maximum
Calculates the sum of the selected data.
Counts all rows for a measure object
or count distinct rows for a dimension
or detail object.
Calculates the average of the data.Average
Displays the minimum value of the selected data.
Display the maximum value of the selected data.
10 Using Functions, Formulas and Calculations in Web Intelligence

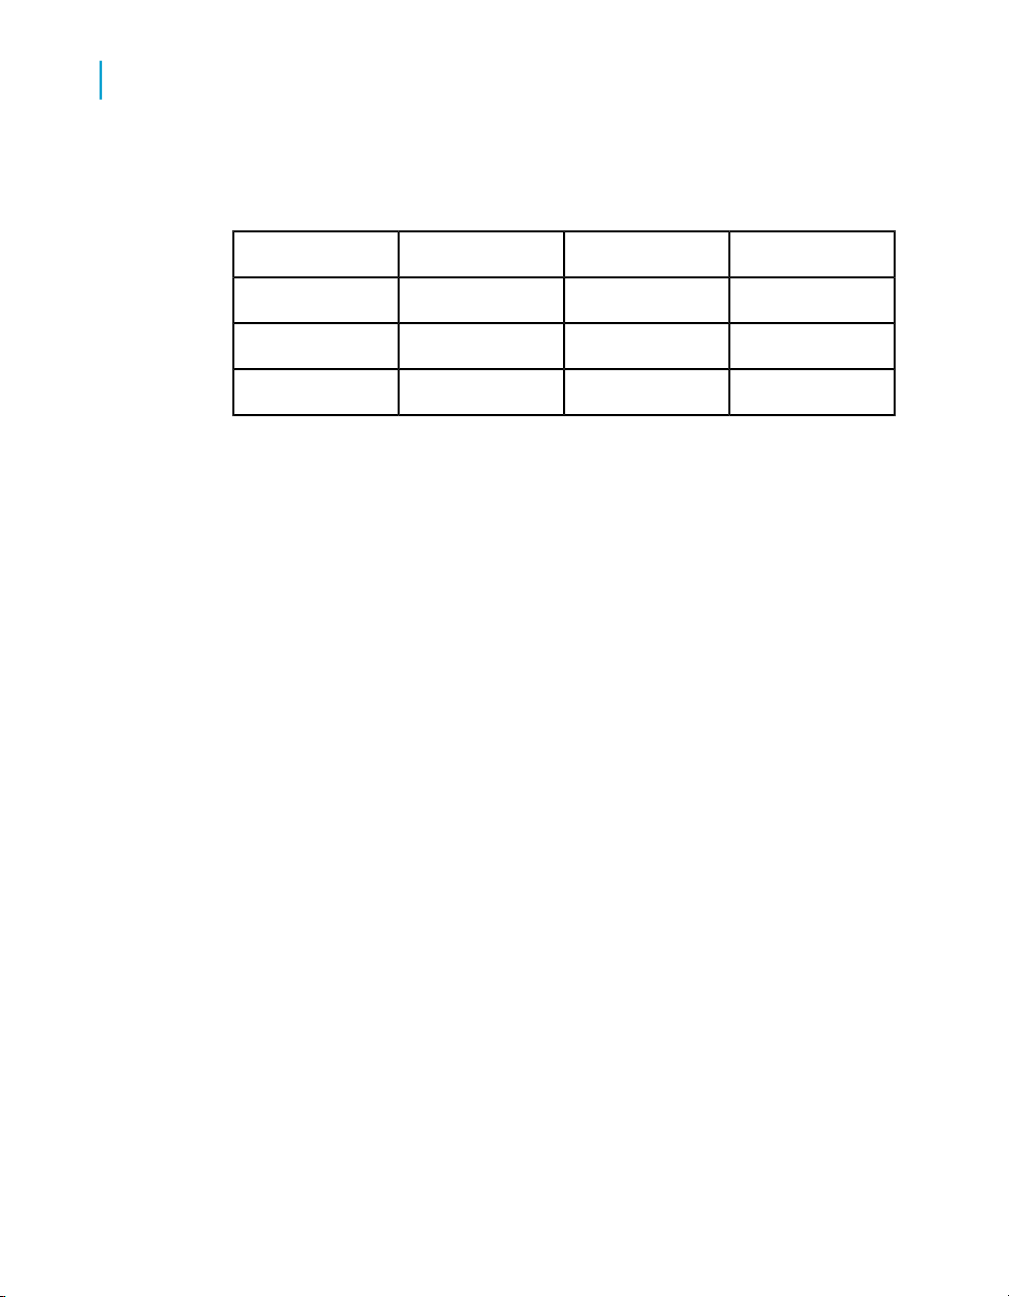
Percentage
Default
Using standard and custom calculations
Using standard and custom calculations in your reports
DescriptionCalculation
Displays the selected data as a percentage of the total. The results of the percentage are displayed in an additional
column or row of the table.
Note:
Percentages are calculated for the selected measure compared to the total
results for that measure on the table or
break. To calculate the percentage of
one measure compared to another
measure, you need to build a custom
calculation.
Applies the default aggregation function
to a standard measure, or the database
aggregation function to a smart measure.
2
When you apply a standard calculation to a table column, the calculation
result appears in a footer in the column. Web Intelligence adds a footer for
the result of each calculation if you apply multiple calculations to the same
column.
Using formulas to build custom calculations
Custom calculations allow you to add additional calculations to your report
beyond its base objects and the standard calculations provided by Web
Intelligence.
You add a custom calculation by writing a formula that Web Intelligence
evaluates when you run the report. A formula can consist of base report
variables, functions, operators and calculation contexts.
A custom calculation is a formula that can consist of report objects, functions
and operators. Formulas have a calculation context that you can specify
explicitly if you choose.
Using Functions, Formulas and Calculations in Web Intelligence 11

Using standard and custom calculations
2
Using standard and custom calculations in your reports
Example: Showing average revenue per sale
If you have a report with Sales Revenue and Number Sold objects and you
want to add revenue per sale to the report. The calculation [Sales Rev
enue]/[Number Sold] gives this value by dividing the revenue by the
number of items sold in order to give the revenue per item.
Related Topics
• What are calculation contexts? on page 24
Using variables to simplify formulas
If a formula is complex you can use variables to simplify it. By using variables
you break a complex formula down into manageable parts and make it much
easier to read, as well as making building formulas much less error-prone.
You can use previously-created variables in a formula in exactly the same
way as you use other report objects. Variables appear in the formula editor
under the “Variables? folder.
You can type this variable name into a formula or drag the variable to the
Formula toolbar as you would for any report object.
Example: Create a formula to return a statistical variance
Variance is a statistical term. The variance of a set of values measures the
spread of those values around their average. Web Intelligence has the
function Var() that calculates the variance in one step, but manual calculation
of variance provides a good example of how to simplify a complex formula
using variables. To calculate the variance manually you need to:
• calculate the average number of items sold
• calculate the difference between each number of items sold and the average,
then square this value
• add up all these squared differences
• divide this total by the number of values - 1
12 Using Functions, Formulas and Calculations in Web Intelligence

Using standard and custom calculations
Using standard and custom calculations in your reports
You have a report showing numbers of items sold by quarter and you want
to include the variance. Without the use of variables to simplify it, this
formula is as follows:
Sum((([Quantity sold] - Average([Quantity sold] ForEach
[Quarter]) In Report)*([Quantity sold] - Average([Quantity
sold] ForEach [Quarter]) In Report)) In [Quarter])/(Count
([Quantity sold] ForEach [Quarter]) - 1)
This formula is clearly unwieldy. By using variables you can simplify it to:
Sum ([Difference Squared])/[Number of Observations] - 1)
which is much easier to understand. This simplified version of the formula
gives you a high-level view of what the formula is doing, rather than plunging
you into the confusing details. You can then examine the formulas of the
variables referenced in the high-level formula to understand its component
parts.
For example, the formula references the variable Difference Squared, which
itself references the variable Average Sold. By examining the formulas of
Difference Squared and Average sold, you can drill down into the formula
to understand the details of what it is doing.
2
Working with functions
A custom calculation sometimes contains report objects only, for example
[Sales Revenue]/[Number of Sales]. Calculations can also include
functions in addition to report objects.
A function receives zero or more values as input and returns output based
on those values. For example, the Sum function totals all the values in a
measure and outputs the result. The formula Sum([Sales Revenue]) outputs
a total of sales revenues. In this case, the function input is the Sales Revenue
measure and the output is the total of all Sales Measures.
Related Topics
• Web Intelligence function and formula operators on page 181
• Web Intelligence functions on page 50
Using Functions, Formulas and Calculations in Web Intelligence 13

Using standard and custom calculations
2
Using standard and custom calculations in your reports
Including functions in cells
The text in report cells always begins with ‘=’ . Literal text appears in quotation
marks, while formulas appear without quotation marks. For example, the
formula Average([Revenue]) appears in a cell as =Average([Revenue]).
The text “Average Revenue?" appears as ="Average Revenue?"
You can use text alone in a cell, or mix formulas and text by using the ‘+’
operator. If you want a cell to display the average revenue preceded by the
text “Average Revenue:", the cell text is as follows: ="Average Revenue:
" + Average([Revenue])
Note the space at the end of the text string so that the text and the value are
not placed directly side-by-side in the cell.
Function syntax
To use a function you need to know its name, how many input values it
requires and the data types of these input values. You also need to know
the type of data that the function outputs.
For example, the Sum function takes a numerical object as input (for example
a measure showing sales revenue) and outputs numeric data (the sum of
all the values of the measure object).
Here is the syntax of the Abs function:
num Abs(number)
This syntax tells you that the Abs function takes a single number as input
and returns a number as output.
The Formula Editor displays the function syntax when you select the function.
Examples of functions
Example: Showing prompt input with the UserResponse function
You have a report showing Year, Quarter and Sales revenue. The State
object also appears in the report data, although it is not displayed. When
14 Using Functions, Formulas and Calculations in Web Intelligence

Using standard and custom calculations
Using standard and custom calculations in your reports
the user runs the report they are presented with a prompt and they must
choose a state. You want to show the state that they have chosen in the
report title. If your data provider is called “eFashion? and the text in the
prompt is “Choose a State?, the formula for the title is:
"Quarterly Revenues for " + UserResponse( "eFashion";"Choose
a State")
The report is as follows:
2
Example: Calculating a percentage using the Percentage function
Web Intelligence has the Percentage function for calculating percentages.
This function calculates the percentage of a number in relation to its
surrounding context. For example, the following table shows revenues by
year and quarter. The percentage column contains the formula Percentage
([Sales Revenue]).
Using Functions, Formulas and Calculations in Web Intelligence 15

Using standard and custom calculations
2
Using standard and custom calculations in your reports
In this case the function calculates each revenue as a percentage of the
total revenue. The surrounding context is the total revenue; this is the only
revenue figure that is relevant outside the breakdown by year and quarter
in the table.
If the report is split into sections by year, the surrounding context outside
the table becomes the total revenue in the section.
If the Percentage cell is placed outside the table but still inside the section,
the surrounding context becomes the total revenue. In this case the
Percentage function calculates the total revenue for the section as a
percentage of the total overall revenue.
16 Using Functions, Formulas and Calculations in Web Intelligence

Using standard and custom calculations
Using standard and custom calculations in your reports
Example: Calculating a percentage using the Sum function
2
You can gain more control over the context in which a percentage is
calculated by using the Sum function rather than the Percentage function.
If you divide one figure in a set of figures by the total of those figures, you
get its percentage of the total; for example, the formula [Sales
Revenue]/Sum([Sales Revenue]) gives the sales revenue as a percentage
of the total revenue.
In the following table the Percentage of Total column has the formula:
[Sales revenue]/(Sum([Sales revenue] In Report))
and the Percentage of Year column has the formula:
[Sales revenue]/(Sum([Sales revenue] In Section))
Using Functions, Formulas and Calculations in Web Intelligence 17

Using standard and custom calculations
2
Using standard and custom calculations in your reports
These formulas take advantage of the extended syntax keywords Report
and Section to instruct the Sum function to calculate the overall total revenue
and yearly revenue respectively.
Related Topics
• Modifying the default calculation context with extended syntax on page 34
Simplifying a variance formula with variables
Variance is a statistical term. The variance of a set of values measures the
spread of those values around their average. Web Intelligence has the
function Var() that calculates the variance in one step, but manual calculation
of variance provides a good example of how to simplify a complex formula
using variables. To calculate the variance manually you need to:
• calculate the average number of items sold
• calculate the difference between each number of items sold and the
average, then square this value
• add up all these squared differences
• divide this total by the number of values - 1
You have a report showing numbers of items sold by quarter and you want
to include the variance. Without the use of variables to simplify it, this formula
is as follows:
Sum((([Quantity sold] - Average([Quantity sold] ForEach [Quar
ter]) In Report)*([Quantity sold] - Average([Quantity sold]
ForEach [Quarter]) In Report)) In [Quarter])/(Count ([Quantity
sold] ForEach [Quarter]) - 1)
which is clearly unwieldy.
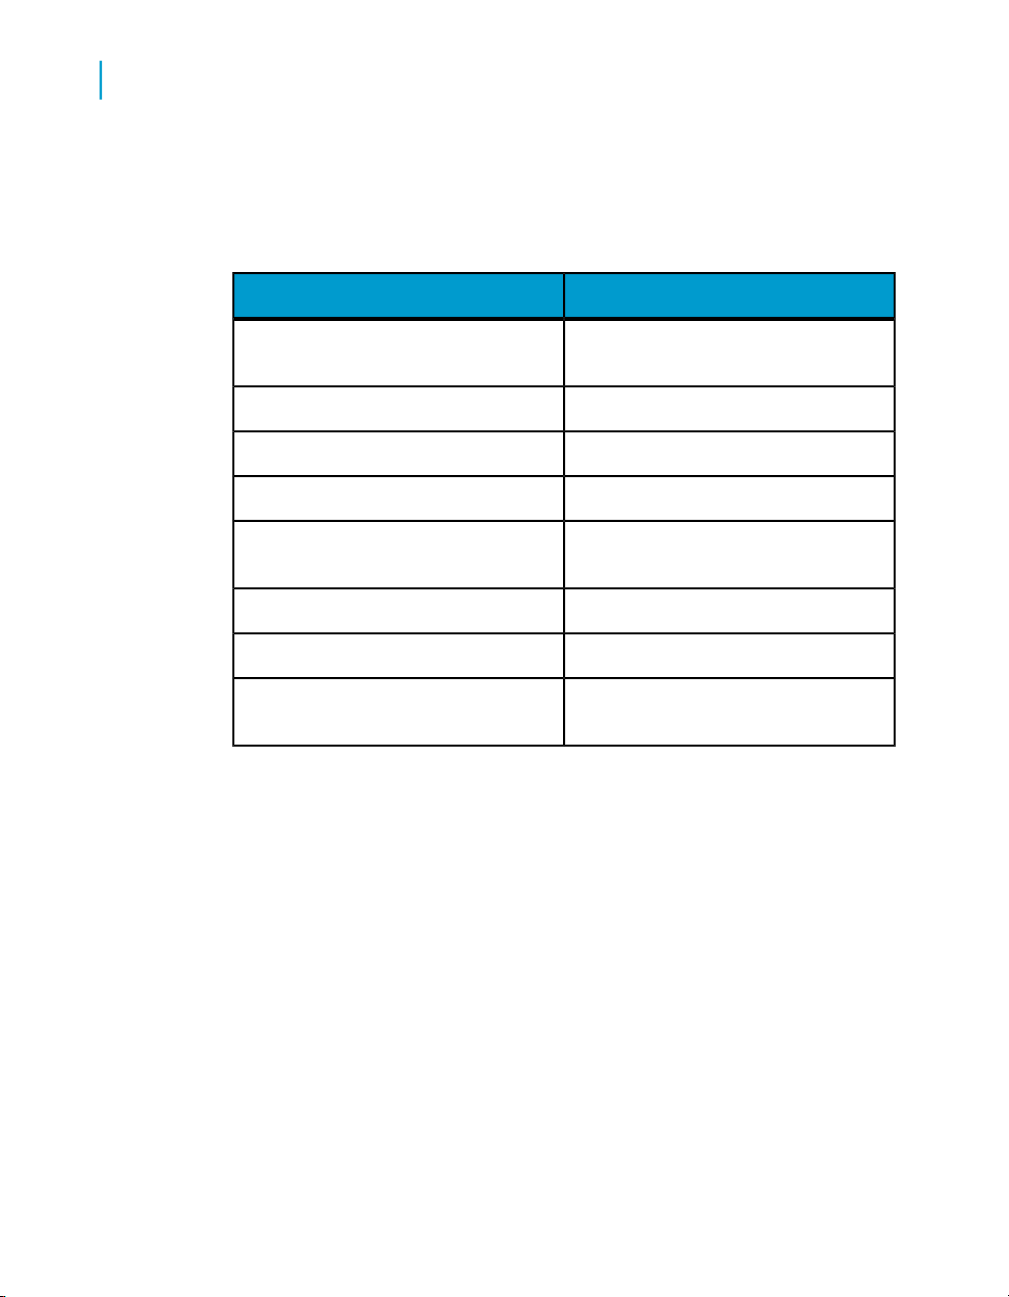
Creating the variance formula
There are several steps involved in creating a variance formula. You
encapsulate each of these steps in a variable. The variables you create are:
• average number of items sold
• number of observations (that is, the number of separate values of the
number of items sold)
• difference between an observation and the average, squared
18 Using Functions, Formulas and Calculations in Web Intelligence

Using standard and custom calculations
Using standard and custom calculations in your reports
• sum of these differences divided by the number of observations - 1
The variable formulas are as follows:
FormulaVariable
2
Average Sold
Number of Observations
Difference Squared
Variance
The final formula is now
Sum ([Difference Squared])/[Number of Observations] - 1)
which is much easier to understand. This simplified version of the formula
gives you a high-level view of what the formula is doing, rather than plunging
you into the confusing details. You can then examine the formulas of the
variables referenced in the high-level formula to understand its component
parts.
For example, the formula references the variable Difference Squared, which
itself references the variable Average Sold. By examining the formulas of
Difference Squared and Average sold, you can drill down into the formula
to understand the details of what it is doing.
Average([Quantity Sold] In ([Quarter]))
In Report
Count([Quantity Sold] In ([Quarter])) In
Report
Power(([Quantity sold] - [Average
Sold]);2)
Sum([Difference Squared] In ([Quarter]))/([Number of Observations] - 1)
Web Intelligence function and formula operators
Operators link the various components in a formula. Formulas can contain
mathematical, conditional, logical, function-specific or extended syntax
operators.
Using Functions, Formulas and Calculations in Web Intelligence 19

Using standard and custom calculations
2
Using standard and custom calculations in your reports
Mathematical operators
Mathematical operators are familiar from everyday arithmetic. There are
addition (+), subtraction (-), multiplication (*), division (/) operators that allow
you to perform mathematical operations in a formula. The formula [Sales
Revenue] - [Cost of Sales]contains a mathematical operator, in this
case subtraction.
Note:
When used with character strings, the ‘+’ operator becomes a string
concatenation operator. That is, it joins character strings. For example, the
formula “John" + “ Smith" returns "John Smith".
Conditional operators
Conditional operators determine the type of comparison to be made between
values.
DescriptionOperator
Equal to=
Greater than>
Less than<
Greater than or equal to>=
Less than or equal to<=
Not equal to<>
You use conditional operators with the If function, as in:
If [Revenue]>10000 Then "High" Else "Low"
which returns “High" for all rows where the revenue is greater than or equal
to 10000 and “Low" for all other rows.
Logical operators
The Web Intelligence logical operators are And, Or, Not, Between and Inlist.
Logical operators are used in boolean expressions, which return True or
False.
20 Using Functions, Formulas and Calculations in Web Intelligence

Context operators
Context operators form part of extended calculation syntax. Extended syntax
allows you to define which dimensions a measure or formula takes into
account in a calculation.
Function-specific operators
Some Web Intelligence functions can take specific operators as arguments.
For example, the Previous function can take the Self operator.
All functions use ) and ( to enclose function arguments. Functions that accept
multiple parameters use ; to separate the parameters.
Using standard and custom calculations
Using standard and custom calculations in your reports
2
Using Functions, Formulas and Calculations in Web Intelligence 21

Using standard and custom calculations
Using standard and custom calculations in your reports
2
22 Using Functions, Formulas and Calculations in Web Intelligence

Understanding calculation contexts
3

Understanding calculation contexts
3
What are calculation contexts?
What are calculation contexts?
The calculation context is the data that a calculation takes into account to
generate a result. Web Intelligence, this means that the value given by a
measure is determined by the dimensions used to calculate the measure.
A report contains two kinds of objects:
• Dimensions represent business data that generate figures. Store outlets,
years or regions are examples of dimension data. For example, a store
outlet, a year or a region can generate revenue: we can talk about revenue
by store, revenue by year or revenue by region.
• Measures are numerical data generated by dimension data. Examples
of measure are revenue and number of sales. For example, we can talk
about the number of sales made in a particular store.
Measures can also be generated by combinations of dimension data. For
example, we can talk about the revenue generated by a particular store in
2005.
The calculation context of a measure has two components:
• the dimension or list of dimensions that determine the measure value
• the part of the dimension data that determines the measure value
The calculation context has two components:
• The input context
• The output context
Related Topics
• The input context on page 24
• The output context on page 25
The input context
The input context of a measure or formula is the list of dimensions that feed
into the calculation.
The list of dimensions in an input context appears inside the parentheses of
the function that outputs the value. The list of dimensions must also be
24 Using Functions, Formulas and Calculations in Web Intelligence

Understanding calculation contexts
What are calculation contexts?
enclosed in parentheses (even if it contains only one dimension) and the
dimensions must be separated by semicolons.
Example: Specifying an input context
In a report with Year sections and a block in each section with Customer
and Revenue columns, the input contexts are:
Input contextReport part
YearSection header and block footers
Year, CustomerRows in the block
In other words, the section headers and block footers show aggregated
revenue by Year, and each row in the block shows revenue aggregated by
Year and Customer (the revenue generated by that customer in the year
in question).
When specified explicitly in a formula, these input contexts are:
Sum ([Revenue] In ([Year]))
3
Sum ([Revenue] In ([Year];[Customer]))
That is, the dimensions in the input context appear inside the parentheses
of the function (in this case, Sum) whose input context is specified.
The output context
The output context causes the formula to output a value is if it is placed in
the footer of a block containing a break.
Example: Specifying an output context
The following report shows revenue by year and quarter, with a break on
year, and the minimum revenue calculated by year:
Using Functions, Formulas and Calculations in Web Intelligence 25

Understanding calculation contexts
3
What are calculation contexts?
What if you want to show the minimum revenue by year in a block with no
break? You can do this by specifying the output context in a formula. In this
case, the formula looks like this:
Min ([Revenue]) In ([Year])
That is, the output context appears after the parentheses of the function
whose output context you are specifying. In this case, the output context
tells Web Intelligence to calculate minimum revenue by year.
If you add an additional column containing this formula to the block, the
result is as follows:
26 Using Functions, Formulas and Calculations in Web Intelligence

Understanding calculation contexts
Default calculation contexts
You can see that the Min By Year column contains the minimum revenues
that appear in the break footers in the previous report.
Notice that in this example, the input context is not specified because it is
the default context (Year, Quarter) for the block. In other words, the output
context tells Web Intelligence which revenue by year and quarter to output.
In full, with both input and output formulas explicitly specified, the formula
looks like this:
Min ([Sales Revenue] In([Year];[Quarter])) In ([Year])
3
Explained in words, this formula tells Web Intelligence to “calculate revenues
by year by quarter, then output the smallest of these revenues that occurs
in each year?.
What would happen if you did not specify the output context in the Min by
Year column? In this case, these figures would be identical to the figures
in the Sales Revenue column. Why? Remember that the default context in
a block includes the dimensions in that block. The minimum revenue by
year by quarter is the same as the revenue by year by quarter simply,
because there is only one revenue for each year/quarter combination.
Default calculation contexts
Depending on where you place a measure or formula, Web Intelligence
assigns a default calculation context to the measure.
Using Functions, Formulas and Calculations in Web Intelligence 27

Understanding calculation contexts
3
Default calculation contexts
Measures are semantically dynamic. This means that the figures returned
by a measure depend on the dimensions with which it is associated. This
combination of dimensions represents the calculation context.
Web Intelligence associates a default context with a measure depending on
where the measure is placed. You can change this default context with
extended syntax. In other words, you can determine the set of dimensions
used to generate a measure. This is what is meant by defining the calculation
context.
Example: Default contexts in a report
This example describes the default calculation context of the measures in
a simple report. The report shows revenue generated by customers and is
split into sections by year.
Total:80002005
RevenueCustomer
1000Harris
3000Jones
4000Walsh
8000Total:
Report total: 8000
The table below lists the calculation context of the measures in this report:
20000Report total
28 Using Functions, Formulas and Calculations in Web Intelligence
ContextValueMeasure
Total of all revenue in the
report
Year8000Section header total

Related Topics
• What are calculation contexts? on page 24
• Modifying the default calculation context with extended syntax on page 34
Default contexts in a vertical table
A vertical table is a standard report table with headers at the top, data going
from top to bottom and footers at the bottom. The default contexts in a down
table are:
Understanding calculation contexts
Default calculation contexts
ContextValueMeasure
Year;Customer1000, 3000, 4000Customer total
Year8000Block footer total
3
When the calculation is
in the...
Header
Body of the block
Footer
Using Functions, Formulas and Calculations in Web Intelligence 29
The dimensions and
measures used to generate the body of the block
The dimensions and
measures used to generate the current row
The dimensions and
measures used to generate the body of the block
The output context isThe input context is
All the data is aggregated then the calculation
function returns a single
value
The same as the input
context
All the data is aggregated
then the calculation function returns a single value

Understanding calculation contexts
3
Default calculation contexts
Example: Default contexts in a vertical table
The following table shows the default contexts in a vertical table:
Default contexts in a horizontal table
A horizontal table is like a vertical table turned on its side. Headers appear
at the left, data goes left to right and footers appear at the right. The default
contexts for a horizontal table are the same as those for a vertical table.
Default contexts in a crosstab
A crosstab displays data in a matrix with measures appearing at the
intersections of dimensions. The default contexts in a crosstab are:
The calculation is in
the...
The dimensions and
Header
30 Using Functions, Formulas and Calculations in Web Intelligence
measures used to generate the body of the block.
The output context is...The input context is...
All the data is aggregated, then the calculation
function returns a single
value.

Understanding calculation contexts
Default calculation contexts
3
The calculation is in
the...
Body of the block
Footer
VBody footer
HBody Footer
The dimensions and
measures used to generate the body of the block.
The dimensions and
measures used to generate the body of the block.
The dimensions and
measures used to generate the current column.
The dimensions and
measures used to generate the current row.
Same as footer.VFooter
The output context is...The input context is...
The same as the input
context.
All the data is aggregated, then the calculation
function returns a single
value.
All the data is aggregated, then the calculation
function returns a single
value.
All the data is aggregated, then the calculation
function returns a single
value.
All the data is aggregated, then the calculation
function returns a single
value.
All the data is aggregat-
Same as footer.HFooter
Example: Default contexts in a crosstab
ed, then the calculation
function returns a single
value.
The following report shows the default contexts in a crosstab:
Using Functions, Formulas and Calculations in Web Intelligence 31

Understanding calculation contexts
3
Default calculation contexts
Default contexts in a section
A section consists of a header, body and footer. The default contexts in a
section are:
The calculation is in
the...
The dimensions and
Body
Example: Default contexts in a section
The following report shows the default contexts in a crosstab:
measures in the report,
filtered to restrict the data
to the section data.
The output context is...The input context is...
All the data is aggregated, then the calculation
function returns a single
value.
32 Using Functions, Formulas and Calculations in Web Intelligence

Understanding calculation contexts
Default calculation contexts
3
Default contexts in a break
A break consists of a header, body and footer. The default contexts in a
break are:
Using Functions, Formulas and Calculations in Web Intelligence 33

Understanding calculation contexts
3
Modifying the default calculation context with extended syntax
The calculation is in
the...
Header
Footer
Example: Default contexts in a break
The following report shows the default contexts in a break:
Current instance of the
break.
Current instance of the
break.
The output context is...The input context is...
All the data is aggregated, then the calculation
function returns a single
value.
All the data is aggregated, then the calculation
function returns a single
value.
Modifying the default calculation context
with extended syntax
Extended syntax uses context operators that you add to a formula or measure
to specify its calculation context. A measure or formula context consists of
its input context and output context.
34 Using Functions, Formulas and Calculations in Web Intelligence

Modifying the default calculation context with extended syntax
Extended syntax operators
You specify input and output contexts explicitly with context operators. The
following table lists the context operators:
Understanding calculation contexts
3
DescriptionOperator
In
ForAll
The ForAll and ForEach operators are useful when you have a default context
with many dimensions. It is often easier to add or subtract from the context
using ForAll and ForEach than it is to specify the list explicitly using In.
In context operator
The In context operator specifies dimensions explicitly in a context.
Example: Using In to specify the dimensions in a context
In this example you have a report showing Year and Sales Revenue. Your
data provider also contains the Quarter object but you do not include this
dimension in the block. Instead, you want to include an additional column
to show the maximum revenue by quarter in each year. Your report looks
like this:
Specifies an explicit list of dimensions
to use in the context.
Adds dimensions to the default contextForEach
Removes dimensions from the default
context
Using Functions, Formulas and Calculations in Web Intelligence 35

Understanding calculation contexts
3
Modifying the default calculation context with extended syntax
You can see where the values in the Max Quarterly Revenue column come
from by examining this block in conjunction with a block that includes the
Quarter dimension:
The Max Quarterly Revenue column shows the highest quarterly revenue
in each year. For example, Q4 has the highest revenue in 2002, so the Max
Quarterly Revenue shows Q4 revenue on the row showing 2002.
Using the In operator, the formula for Max Quarterly Revenue is
Max ([Sales Revenue] In ([Year];[Quarter])) In ([Year])
This formula tells Web Intelligence to calculate the maximum sales revenue
for each (Year,Quarter) combination, then output this figure by year.
Note:
Because the default output context of the block is Year, you do not need to
specify the output context explicitly in this formula.
36 Using Functions, Formulas and Calculations in Web Intelligence

ForEach context operator
The ForEach operator adds dimensions to a context.
Example: Using ForEach to add dimensions to a context
The following table shows the maximum revenue for each Quarter in a
report which contains the Quarter dimension but does not include it in the
block:
It is possible to create a formula for the Max Quarterly Revenue column
that does not include the ForEach operator:
Max ([Sales Revenue] In ([Year];[Quarter])) In ([Year])
Understanding calculation contexts
Modifying the default calculation context with extended syntax
Max Quarterly RevenueSales revenueYear
2660699.508096123.602001
4186120.0013232246.002002
4006717.5015059142.802003
3
Using the ForEach context operator, you can achieve the same result with
the following formula:
Max ([Sales Revenue] ForEach ([Quarter])) In ([Year])
Why? Because the Year dimension is the default input context in the block.
By using the ForEach operator, you add the Quarter dimension to the context,
giving an input context of ([Year];[Quarter]).
ForAll context operator
The ForAll context operator removes dimensions from a context.
Example: Using ForAll to remove dimensions from a context
You have a report showing Year, Quarter and Sales Revenue and you want
to add a column that shows the total revenue in each year, as shown in the
following block:
Using Functions, Formulas and Calculations in Web Intelligence 37

Understanding calculation contexts
3
Modifying the default calculation context with extended syntax
To total revenues by year the input context needs to be (Year); by default
it is (Year; Quarter). Therefore, you can remove Quarter from the input
context by specifying ForAll ([Quarter]) in the formula, which looks like this:
Sum([Sales Revenue] ForAll ([Quarter]))
Note that you can use the In operator to achieve the same thing; in this
case the formula is:
Sum([Sales Revenue] In ([Year]))
This version of the formula explicitly specifies Year as the context, rather
than removing Quarter to leave Year.
Web Intelligence extended syntax keywords
Extended syntax keywords are a form of shorthand that allows you to refer
to dimensions in extended syntax without specifying those dimensions
explicitly. This helps future-proof reports; if formulas do not contain
hard-coded references to dimensions, they will continue to work even if
dimensions are added to or removed from a report.
There are five extended syntax keywords: Report, Section, Break, Block and
Body.
38 Using Functions, Formulas and Calculations in Web Intelligence

The Report keyword
The following table describes the data referenced by the Report keyword
depending on where it is placed in a report:
Understanding calculation contexts
Modifying the default calculation context with extended syntax
References this data...When placed in...
All data in the reportA block
All data in the reportA block break (header or footer)
3
A section (header, footer, or outside a
block)
Example: The Report keyword
You have a report showing Year, Quarter and Sales revenue. The report
has a column, Report Total, that shows the total of all revenue in the report.
All data in the report
All data in the reportOutside any blocks or sections
The formula for the Report Total column is Sum([Sales revenue]) In Report.
Without the Report keyword, this column would duplicate the figures in the
Sales Revenue column because it would use the default output context
([Year];[Quarter]).
Using Functions, Formulas and Calculations in Web Intelligence 39

Understanding calculation contexts
3
Modifying the default calculation context with extended syntax
The Section keyword
The following table describes the data referenced by the Section keyword
depending on where it is placed in a report
References this data...When placed in...
All data in the sectionA block
All data in the sectionA block break (header or footer)
A section (header, footer, or outside a
block)
Example: The Section keyword
You have a report showing Year, Quarter, and Sales revenue.
The report has a section based on Year. The Section Total column has the
formula:
Sum ([Sales Revenue]) In Section
The figure in the Section Total column is the total revenue for 2001, because
the section break occurs on the Year object. Without the Section keyword
this column would duplicate the figures in the Sales revenue column,
because it would use the default output context ([Year];[Quarter]).
All data in the section
Not applicableOutside any blocks or sections
40 Using Functions, Formulas and Calculations in Web Intelligence

The Break keyword
The following table describes the dimensions referenced by the Break
keyword depending on where it is placed in a report:
Understanding calculation contexts
Modifying the default calculation context with extended syntax
References this data...When placed in...
3
A block
A block break (header or footer)
A section (header, footer, or outside a
block)
Example: The Break keyword
You have a report showing Year, Quarter and Sales revenue.
The report has break on Year. The Break Total column has the formula:
Sum ([Sales Revenue]) In Break
Data in the part of a block delimited by
a break
Data in the part of a block delimited by
a break
Not applicable
Not applicableOutside any blocks or sections
Without the Break keyword this column would duplicate the figures in the
Sales revenue column, because it would use the default output context
([Year];[Quarter]).
Using Functions, Formulas and Calculations in Web Intelligence 41

Understanding calculation contexts
3
Modifying the default calculation context with extended syntax
The Block keyword
The following table describes the dimensions referenced by the Block keyword
depending on where it is placed in a report: The Block keyword often
encompasses the same data as the Section keyword. The difference is that
Block accounts for filters on a block whereas Section ignores them.
References this data...When placed in...
A block
A block break (header or footer)
A section (header, footer, or outside a
block)
Example: The Block keyword
You have a report showing Year, Quarter and Sales revenue. The report
has a section based on Year. The block is filtered to exclude the third and
fourth quarters.
Data in the whole block, ignoring
breaks, respecting filters
Data in the whole block, ignoring
breaks, respecting filters
Not applicable
Not applicableOutside any blocks or sections
42 Using Functions, Formulas and Calculations in Web Intelligence

Understanding calculation contexts
Modifying the default calculation context with extended syntax
3
The Yearly Average column has the formula
Average([Sales revenue] In Section)
and the First Half Average column has the formula
Average ([Sales revenue]) In Block
You can see how the Block keyword takes account of the filter on the block.
The Body keyword
The following table describes the dimensions referenced by the Body keyword
depending on where it is placed in a report:
References this data...When placed in...
Data in the blockA block
Using Functions, Formulas and Calculations in Web Intelligence 43

Understanding calculation contexts
3
Modifying the default calculation context with extended syntax
References this data...When placed in...
Data in the blockA block break (header or footer)
A section (header, footer, or outside a
block)
Example: The Body keyword
You have a report showing Year, Quarter and Sales revenue, with a break
on Year. The report has a section based on Year and a break on Quarter.
The Body column has the formula
Sum ([Sales Revenue]) In Body
The totals in the Body column are the same as those in the Sales revenue
column because the Body keyword refers to the data in the block. If you
were to remove the Month object, the figures in the Block column would
change to correspond with the changed figures in the Sales revenue column.
If you were to place the formula in the report footer it would return the total
revenue for the block.
Data in the section
Data in the reportOutside any blocks or sections
BodySales revenueQuarterYear
2,660,699.52,660,700Q12001
2,279,0032,279,003Q2
1,367,840.71,367,841Q3
1,788,580.41,788,580Q4
8,096,123.62001
Using keywords to make reports generic
Extended syntax keywords future-proof your report against changes. If you
refer to data explicitly (by specifying dimensions using In, ForEach or ForAll)
44 Using Functions, Formulas and Calculations in Web Intelligence

Understanding calculation contexts
Modifying the default calculation context with extended syntax
your reports might return unexpected data if dimensions are added or
removed. The following example illustrates this.
Example: Using the Report keyword to display percentages
In this example you have a block that contains Year, Quarter and Sales
revenue objects. You want to display revenues by year and quarter, and
the percentage of the total revenue in the report that each individual revenue
represents, as shown:
3
The formula for the Percentage of Total column is:
([Sales revenue]/(Sum([Sales revenue]) In Report)) * 100
In a block, the Report includes all data in a report, so this formula could be
written:
([Sales revenue]/Sum([Sales revenue] ForAll ([Year];[Quar
ter]))) * 100
This formula tells Web Intelligence to remove Year and Quarter from the
output context; in other words, to calculate a grand total, because there are
no other dimensions in the report. The formula then divides each revenue
by the grand total to give its percentage of the total.
Although you can use ForAll in this situation, it is much better to use the
Report keyword. Why? What if the Month dimension were subsequently
added to the report? The version of the formula that uses the Report
Using Functions, Formulas and Calculations in Web Intelligence 45

Understanding calculation contexts
3
Modifying the default calculation context with extended syntax
keyword still calculates each percentage correctly, but the version that
explicitly specifies the Year and Quarter dimensions is now wrong:
46 Using Functions, Formulas and Calculations in Web Intelligence

Understanding calculation contexts
Modifying the default calculation context with extended syntax
Why is this? The problem lies in:
Sum ([Sales Revenue] ForAll ([Year];[Quarter))
When Year and Quarter were the only dimensions in the report, this was
equivalent to “a grand total of all revenues". Once you add the Month
dimension, this expression removes Year and Quarter from the default
output context, but leaves Month.
The formula now has a “break" on month. In other words, on every row
where Month is 1, this expression now means “the total revenue of all month
1s". In every row where Month is 2, it means “the total revenue of all month
2s". As a result, the percentages are not the percentages you expect.
3
Using Functions, Formulas and Calculations in Web Intelligence 47

Understanding calculation contexts
Modifying the default calculation context with extended syntax
3
48 Using Functions, Formulas and Calculations in Web Intelligence
Web Intelligence functions, operators and keywords
4
Web Intelligence functions, operators and keywords
4
Web Intelligence functions
Web Intelligence functions
Web Intelligence divides functions into the following categories:
DescriptionCategory
Aggregate
Data Provider
Misc
Aggregate functions
Average
Aggregates data (for example by summing or averaging a set of values)
Manipulates character stringsCharacter
Returns date or time dataDate and Time
Returns data about a documentDocument
Returns data about a document’s data
provider
Returns TRUE or FALSELogical
Returns numeric dataNumeric
Functions that do not fit into the above
categories
Description
Returns the average value of a measure
Function Group
Aggregate
50 Using Functions, Formulas and Calculations in Web Intelligence

Web Intelligence functions, operators and keywords
Syntax
num Average(measure;[IncludeEmpty])
Input
Web Intelligence functions
RequiredTypeDescriptionParameter
YesMeasureAny measuremeasure
4
Count
IncludeEmpty
Notes
• You can use extended syntax context operators with Average.
• You can specify IncludeEmpty as the second argument to the function.
When you specify this argument, the function takes empty (null) rows into
consideration in the calculation.
Examples
If the [Sales Revenue] measure has the values 41569, 30500, 40000 and
50138, Average([Sales Revenue]) returns 40552.
Related Topics
• IncludeEmpty operator on page 189
the calculation
KeywordIncludes empty rows in
No
(Empty rows excluded
by default)
Description
Returns the number of values in a dimension or measure
Function Group
Aggregate
Using Functions, Formulas and Calculations in Web Intelligence 51

Web Intelligence functions, operators and keywords
4
Web Intelligence functions
Syntax
integer Count(dimension|measure;[IncludeEmpty];[Distinct|All])
Input
ter
RequiredTypeDescriptionParame-
YesDimen-
NoKeywordIncludes empty values in the calculationIn-
NoKeywordIncludes distinct values only (default for di-
sion|measure
cludeEmpty
Distinct|All
Notes
Any dimension or measuredimen-
sion or
measure
mensions) or all values (default for measures) in the calculation
• You can use extended syntax context operators with Count.
• You can specify IncludeEmpty as the second argument to the function.
When you specify this argument, the function takes empty (null) rows into
consideration in the calculation.
• The Distinct/All parameter is optional. If you do not specify this
parameter, the default values are Distinct for dimensions and All for
measures.
Examples
Count("Test") returns 1
Count([City];Distinct) returns 5 if there are 5 different cities in a list of
cities, even if there are more than 5 rows in the list due to duplication.
Count([City];All) returns 10 if there are 10 cities in a list of cities, even
though some are duplicated.
Count ([City];IncludeEmpty) returns 6 if there are 5 cities and one blank
row in a list of cities.
52 Using Functions, Formulas and Calculations in Web Intelligence

First
Web Intelligence functions, operators and keywords
Related Topics
• IncludeEmpty operator on page 189
• Distinct/All operators on page 188
Description
Returns the first value in a data set
Function Group
Aggregate
Syntax
input_type First(dimension|measure)
Input
Web Intelligence functions
4
RequiredTypeDescriptionParameter
dimension|measure
Notes
• When placed in a break footer, First returns the first value in the in the
break.
• When placed a a section footer, First returns the first value in the section.
Examples
When placed in a table footer, First([Revenue]) returns the first value of
[Revenue] in the table.
Any dimension or
measure
Using Functions, Formulas and Calculations in Web Intelligence 53
measure
YesDimension or

Web Intelligence functions, operators and keywords
4
Web Intelligence functions
Interpolation
Description
Calculates empty measure values by interpolation
Function Group
Numeric
Syntax
num Interpolation(measure;[PointToPoint|Linear];[NotOn
Break];[Row|Col])
Input
ter
RequiredTypeDescriptionParame-
PointToPoint|Linear
NotOnBreak
Notes
The interpolation method:
• PointToPoint - point-to-point inter-
polation
• Linear - linear regression with least
squares interpolation
calculation on block and section breaks
• Interpolation is particularly useful when you create a line graph on a
measure that contains missing values. By using the function you ensure
that the graph plots a continuous line rather than disconnected lines and
points.
54 Using Functions, Formulas and Calculations in Web Intelligence
Keyword
YesMeasureAny measuremeasure
No
(PointToPoint
is default)
NoKeywordPrevents the function from resetting the
NoKeywordSets the calculation directionRow|Col

Web Intelligence functions, operators and keywords
Web Intelligence functions
• Linear regression with least squares interpolation calculates missing
values by calculating a line equation in the form f(x) = ax + b that passes
as closely as possible through all the available values of the measure.
• Point-to point interpolation calculates missing values by calculating a line
equation in the form f(x) = ax + b that passes through the two adjacent
values of the missing value.
• The sort order of the measure impacts the values returned by Interpo
lation.
• You cannot apply a sort or a ranking to a formula containing Interpola
tion.
• If there is only one value in the list of values, Interpolation uses this
value to supply all the missing values.
• Filters applied to an interpolated measure can change the values returned
by Interpolation depending on which values the filter impacts.
Examples
Interpolation([Value]) supplies the following missing values using the
default point-to-point interpolation method:
4
Related Topics
• Linear operator on page 189
• PointToPoint operator on page 190
Using Functions, Formulas and Calculations in Web Intelligence 55
Interpolation([Value])ValueDay
1212Monday
1414Tuesday
15Wednesday
1616Thursday
17Friday
18Saturday
1919Sunday

Web Intelligence functions, operators and keywords
4
Web Intelligence functions
Last
Description
Returns the last value in a dimension or measure
Function Group
Aggregate
Syntax
input_type Last(dimension|measure)
Input
RequiredTypeDescriptionParameter
Max
dimension|measure
Notes
• When placed in a break footer, Last returns the last value in the in the
break.
• When placed a a section footer, Last returns the last value in the section.
Examples
When placed in a table footer, First([Revenue]) returns the first value of
[Revenue] in the table.
Description
Returns the largest value in a dimension or measure
Any dimension or
measure
measure
YesDimension or
56 Using Functions, Formulas and Calculations in Web Intelligence

Web Intelligence functions, operators and keywords
Function Group
Aggregate
Syntax
input_type Max(dimension|measure)
Input
Web Intelligence functions
RequiredTypeDescriptionParameter
4
Median
dimension|measure
Notes
You can use extended syntax context operators with Max.
Examples
If the Sales revenue measure has the values 3000, 60034 and 901234,
Max([Sales Revenue]) returns 901234.
If the City dimension has the values "Aberdeen" and "London", Max ([City])
returns "London".
Description
Returns the median (middle value) of a measure
Function Group
Any dimension or
measure
measure
YesDimension or
Aggregate
Syntax
num Median(measure)
Using Functions, Formulas and Calculations in Web Intelligence 57

Web Intelligence functions, operators and keywords
4
Web Intelligence functions
Input
Notes
If the set of numbers has an even number of values, Median takes the
average of the middle two values.
Examples
Median([Revenue]) returns 971,444 if [Revenue] has the values 835420,
971444, and 1479660.
Min
Description
RequiredTypeDescriptionParameter
YesMeasureAny measuremeasure
Returns the smallest value in a dimension or measure
Function Group
Aggregate
Syntax
any_type Min(dimension|measure)
Input
dimension|measure
Notes
You can use extended syntax context operators with Min.
58 Using Functions, Formulas and Calculations in Web Intelligence
Any dimension or
measure
measure
RequiredTypeDescriptionParameter
YesDimension or

Mode
Web Intelligence functions, operators and keywords
Web Intelligence functions
Examples
If the Sales revenue measure has the values 3000, 60034 and 901234,
Min([Sales Revenue]) returns 3000.
If the City dimension has the values Aberdeen and London,
Min([City])returns "Aberdeen".
Description
Returns the most frequently-occuring value in a data set
Function Group
Aggregate
Syntax
input_type Mode(dimension|measure)
4
Input
RequiredTypeDescriptionParameter
dimension|measure
Notes
• Mode returns null if the data set does not contain one value that occurs
more frequently than all the others.
Examples
Mode([Revenue]) returns 200 if [Revenue] has the values 100, 200, 300,
200.
Mode([Country]) returns the most frequently-occuring value of [Country].
measure
Using Functions, Formulas and Calculations in Web Intelligence 59
YesMeasureAny dimension or

Web Intelligence functions, operators and keywords
4
Web Intelligence functions
Percentage
Description
Expresses a measure value as a percentage of its embedding context
Function Group
Aggregate
Syntax
num Percentage(measure;[Break];[Row|Col])
Input
RequiredTypeDescriptionParameter
YesMeasureAny measuremeasure
Break
breaks
Row|Col
tion
Examples
In the following table, the Percentage column has the formula Percent
age([Sales Revenue])
60 Using Functions, Formulas and Calculations in Web Intelligence
NoKeywordAccounts for table
NoKeywordSets the calculation direc-
PercentageSales RevenueYear
1010002001
5050002002
4040002003
10010000Sum:

Web Intelligence functions, operators and keywords
Web Intelligence functions
By default the embedding context is the measure total in the table. You can
make the function take account of a break in a table by using the optional
Break argument. In this case the default embedding context becomes the
table section.
In the following table, the Percentage column has the formula Percent
age([Sales Revenue];Break)
PercentageSales RevenueQuarterYear
101000Q12001
202000Q2
505000Q3
202000Q4
10010000Sum:2001
4
PercentageSales RevenueQuarterYear
202000Q12002
202000Q2
505000Q3
101000Q4
10010000Sum:2002
You can use the Percentage function across columns or rows; you can
specify this explicitly using the optional Row|Col argument. For example, in
the following crosstab, the Percentage column has the formula Percentage
([Sales Revenue];Row)
Using Functions, Formulas and Calculations in Web Intelligence 61

Web Intelligence functions, operators and keywords
4
Web Intelligence functions
Percentile
Q1
cent
age
Description
Q2Per
cent
age
Returns the nth percentile of a measure
Function Group
Numeric
Syntax
num Percentile(measure;percentile)
Q3Per
cent
age
Q4Per
Per
cent
age
2020005050002020001010002001
1010005050002020002020002002
Input
percentile
a decimal
Notes
The nth percentile is a number that is greater than or equal to n% of the
numbers in a set. You express n% in the form 0.n.
62 Using Functions, Formulas and Calculations in Web Intelligence
RequiredTypeDescriptionParameter
YesMeasureAny measuremeasure
YesNumberA percentage expressed as

Product
Web Intelligence functions, operators and keywords
Web Intelligence functions
Examples
If [measure] has the set of numbers (10;20;30;40;50), Percentile([mea
sure];0.3) returns 22, which is greater than or equal to 30% of the numbers
in the set.
Description
Multiplies the values of a measure
Function Group
Aggregate
Syntax
num Product(measure)
4
Input
Examples
Product([Measure]) returns 30 if [Measure] has the values 2, 3, 5.
RunningAverage
Description
Returns the running average of a measure
Function Group
Aggregate
RequiredTypeDescriptionParameter
YesMeasureAny measuremeasure
Using Functions, Formulas and Calculations in Web Intelligence 63

Web Intelligence functions, operators and keywords
4
Web Intelligence functions
Syntax
num RunningAverage(measure;[Row|Col];[IncludeEmpty];[re
set_dims])
Input
RequiredTypeDescriptionParameter
YesMeasureAny measuremeasure
NoKeywordSets the calculation directionRow|Col
IncludeEmpty
culation
reset_dims
specified dimensions
Notes
• You can use extended syntax context operators with RunningAverage.
• You can set the calculation direction with the Row and Col operators.
• If you apply a sort on the measure referenced by RunningAverage, Web
Intelligence applies the sort to the measure first, then calculates the
running average.
• You must always place dimensions in parentheses even if there is only
one dimension in the list of reset dimensions.
• When you specify a set of reset dimensions you must separate them with
semi-colons.
• RunningAverage does not automatically reset the average after a block
break or new section.
Examples
RunningAverage([Revenue]) returns these results in the following table:
NoKeywordIncludes empty values in the cal-
NoDimension listResets the calculation on the
64 Using Functions, Formulas and Calculations in Web Intelligence
Running AverageRevenueResortCountry
835,4201,479,660Hawaiian ClubUS
1,225,552971,444Bahamas BeachUS

Web Intelligence functions, operators and keywords
Web Intelligence functions
1,095,508835,420French RivieraFrance
RunningAverage([Revenue];([Country])) returns these results in the
following table:
Running AverageRevenueResortCountry
835,4201,479,660Hawaiian ClubUS
1,225,552971,444Bahamas BeachUS
835,420835,420French RivieraFrance
Related Topics
• IncludeEmpty operator on page 189
• Row/Col operators on page 191
4
RunningCount
Description
Returns the running count of a number set
Function Group
Aggregate
Syntax
num RunningCount(dimension|measure;[Row|Col];[IncludeEmpty];[re
set_dims])
Using Functions, Formulas and Calculations in Web Intelligence 65

Web Intelligence functions, operators and keywords
4
Web Intelligence functions
Input
RequiredTypeDescriptionParameter
YesDimension or
NoKeywordSets the calculation directionRow|Col
NoKeywordIncludes empty values in the cal-
NoDimension listResets the calculation on the
sion|measure
IncludeEmpty
reset_dims
Notes
Any dimension or measuredimen-
measure
culation
specified dimensions
• You can use extended syntax context operators with RunningCount.
• You can set the calculation direction with the Row and Col operators.
• If you apply a sort on the measure referenced by RunningCount, Web
Intelligence applies the sort to the measure first, then calculates the
running count.
• You must always place dimensions in parentheses even if there is only
one dimension in the list of reset dimensions.
• When you specify a set of reset dimensions you must separate them with
semi-colons.
• RunningCount does not automatically reset the count after a block break
or new section.
Examples
RunningCount([Revenue]) returns these results in the following table:
RunningCount([Revenue];([Country])) returns these results in the
following table:
66 Using Functions, Formulas and Calculations in Web Intelligence
Running CountRevenueResortCountry
11,479,660Hawaiian ClubUS
2971,444Bahamas BeachUS
3835,420French RivieraFrance

RunningMax
Web Intelligence functions, operators and keywords
Web Intelligence functions
Related Topics
• IncludeEmpty operator on page 189
• Row/Col operators on page 191
• IncludeEmpty operator on page 189
• IncludeEmpty operator on page 189
Description
Returns the running maximum of a dimension or measure
4
Running CountRevenueResortCountry
11,479,660Hawaiian ClubUS
2971,444Bahamas BeachUS
1835,420French RivieraFrance
Function Group
Aggregate
Syntax
input_type RunningMax(dimension|measure;[Row|Col];[reset_dims])
Input
RequiredTypeDescriptionParameter
YesDimension or
NoKeywordSets the calculation directionRow|Col
sion|measure
Any dimension or measuredimen-
measure
Using Functions, Formulas and Calculations in Web Intelligence 67

Web Intelligence functions, operators and keywords
4
Web Intelligence functions
RequiredTypeDescriptionParameter
reset_dims
specified dimensions
Notes
• You can use extended syntax context operators with RunningMax.
• You can set the calculation direction with the Row and Col operators.
• If you apply a sort on the measure referenced by RunningMax, Web
Intelligence applies the sort to the measure first, then calculates the
running maximum.
• You must always place dimensions in parentheses even if there is only
one dimension in the list of reset dimensions.
• When you specify a set of reset dimensions you must separate them with
semi-colons.
• RunningMax does not automatically reset the max after a block break or
new section.
Examples
RunningMax([Revenue]) returns these results in the following table:
NoDimension listResets the calculation on the
Running MaxRevenueResortCountry
835,420835,420French RivieraFrance
Related Topics
• IncludeEmpty operator on page 189
• Row/Col operators on page 191
68 Using Functions, Formulas and Calculations in Web Intelligence
971,444971,444Bahamas BeachUS
1,479,6601,479,660Hawaiian ClubUS

RunningMin
Web Intelligence functions, operators and keywords
Web Intelligence functions
Description
Returns the running minimum of a dimension or measure
Function Group
Aggregate
Syntax
input_type RunningMin(dimension|measure;[Row|Col];[reset_dims])
Input
RequiredTypeDescriptionParameter
4
Any dimension or measuredimension|de-
tail|measure
reset_dims
specified dimensions
Notes
• You can use extended syntax context operators with RunningMin.
• You can set the calculation direction with the Row and Col operators.
• If you apply a sort on the measure referenced by RunningMin, Web
Intelligence applies the sort to the measure first, then calculates the
running minimum.
• You must always place dimensions in parentheses even if there is only
one dimension in the list of reset dimensions.
• When you specify a set of reset dimensions you must separate them with
semi-colons.
• RunningMin does not automatically reset the minimum after a block break
or new section.
measure
YesDimension or
NoKeywordSets the calculation directionRow|Col
NoDimension listResets the calculation on the
Using Functions, Formulas and Calculations in Web Intelligence 69
Web Intelligence functions, operators and keywords
4
Web Intelligence functions
Examples
RunningMin([Revenue]) returns these results in the following table:
Related Topics
• IncludeEmpty operator on page 189
• Row/Col operators on page 191
RunningProduct
Running MaxRevenueResortCountry
835,420835,420French RivieraFrance
835,420971,444Bahamas BeachUS
835,4201,479,660Hawaiian ClubUS
Description
Returns the running product of a measure
Function Group
Aggregate
Syntax
num RunningProduct(measure;[Row|Col];[reset_dims])
70 Using Functions, Formulas and Calculations in Web Intelligence

Input
Web Intelligence functions, operators and keywords
Web Intelligence functions
RequiredTypeDescriptionParameter
YesMeasureAny measuremeasure
NoKeywordSets the calculation directionRow|Col
4
reset_dims
specified dimensions
Notes
• You can use extended syntax context operators with RunningProduct.
• You can set the calculation direction with the Row and Col operators.
• If you apply a sort on the measure referenced by RunningProduct, Web
Intelligence applies the sort to the measure first, then calculates the
running poduct.
• You must always place dimensions in parentheses even if there is only
one dimension in the list of reset dimensions.
• When you specify a set of reset dimensions you must separate them with
semi-colons.
• RunningProduct does not automatically reset the product after a block
break or new section.
Examples
RunningProduct([Number of guests]) returns these results in the following
table:
NoDimension listResets the calculation on the
Running ProductNumber of guestsCityCountry of origin
66KobeJapan
244OsakaJapan
5,784241ChicagoUS
RunningProduct([Number of guests];([Country of origin])) returns
these results in the following table:
Using Functions, Formulas and Calculations in Web Intelligence 71

Web Intelligence functions, operators and keywords
4
Web Intelligence functions
Related Topics
• IncludeEmpty operator on page 189
• Row/Col operators on page 191
RunningSum
Description
Returns the running sum of a measure
Running ProductNumber of guestsCityCountry of origin
66KobeJapan
244OsakaJapan
5784241ChicagoUS
Function Group
Aggregate
Syntax
num RunningSum(measure;[Row|Col];[reset_dims])
Input
reset_dims
specified dimensions
Notes
• You can use extended syntax context operators with the RunningSum.
72 Using Functions, Formulas and Calculations in Web Intelligence
RequiredTypeDescriptionParameter
YesMeasureAny measuremeasure
NoKeywordSets the calculation directionRow|Col
NoDimension listResets the calculation on the

Web Intelligence functions, operators and keywords
Web Intelligence functions
• You can set the calculation direction with the Row and Col operators.
• If you apply a sort on the measure referenced by the RunningSum function,
Web Intelligence applies the sort to the measure first, then calculates the
running sum.
• You must always place dimensions in parentheses even if there is only
one dimension in the list of reset dimensions.
• When you specify a set of reset dimensions you must separate them with
semi-colons.
• RunningSum does not automatically reset the sum after a block break or
new section.
Example
RunningSum([Revenue]) returns these results in the following table:
Running SumRevenueResortCountry
835,420835,420French RivieraFrance
1,806,864971,444Bahamas BeachUS
4
3,286,5241,479,660Hawaiian ClubUS
RunningSum([Revenue];([Country])) returns these results in the following
table:
Running SumRevenueResortCountry
835,420835,420French RivieraFrance
971,444971,444Bahamas BeachUS
2,451,1041,479,660Hawaiian ClubUS
Related Topics
• IncludeEmpty operator on page 189
• Row/Col operators on page 191
Using Functions, Formulas and Calculations in Web Intelligence 73

Web Intelligence functions, operators and keywords
4
Web Intelligence functions
StdDev
Description
Returns the standard deviation of a measure
Function Group
Aggregate
Syntax
num StdDev(measure)
Input
RequiredTypeDescriptionParamter
YesMeasureAny measuremeasure
Notes
The standard deviation is a measure of the statistical dispersion in a set of
numbers. It is calculated by:
• finding the average of the set of numbers
• subtracting the average from each number in the set and squaring the
difference
• summing all these squared differences
• dividing this sum by (number of numbers in the set - 1)
• finding the square root of the result
Examples
If measure has the set of values (2, 4, 6, 8) StdDev([measure]) returns
2.58.
Related Topics
• Var on page 76
74 Using Functions, Formulas and Calculations in Web Intelligence

StdDevP
Web Intelligence functions, operators and keywords
Web Intelligence functions
Description
Returns the population standard deviation of a measure
Function Group
Aggregate
Syntax
num StdDevP(measure)
Input
4
RequiredTypeDescriptionParamter
YesMeasureAny measuremeasure
Notes
The population standard deviation is a measure of the statistical dispersion
in a set of numbers. It is calculated by:
• finding the average of the set of numbers;
• subtracting the average from each number in the set and squaring the
difference;
• summing all these squared differences;
• dividing this sum by (number of numbers in the set);
• finding the square root of the result.
You can use extended syntax context operators with StdDevP.
Examples
If measure has the set of values (2, 4, 6, 8) StdDevP([measure]) returns
2.24.
Using Functions, Formulas and Calculations in Web Intelligence 75

Web Intelligence functions, operators and keywords
4
Web Intelligence functions
Sum
Description
Returns the sum of a measure
Function Group
Aggregate
Syntax
num Sum(measure)
Input
RequiredTypeDescriptionParamter
YesMeasureAny measuremeasure
Notes
You can use extended syntax context operators with Sum.
Examples
If the Sales Revenue measure has the values 2000, 3000, 4000, and 1000,
Sum([Sales Revenue]) returns 10000.
Var
Description
Returns the variance of a measure
Function Group
Aggregate
76 Using Functions, Formulas and Calculations in Web Intelligence

Web Intelligence functions, operators and keywords
Web Intelligence functions
Syntax
num Var(measure)
Input
RequiredTypeDescriptionParamter
YesMeasureAny measuremeasure
Notes
The variance is a measure of the statistical dispersion in a set of numbers.
It is calculated by:
• finding the average of the set of numbers
• subtracting the average from each number in the set and squaring the
difference
• summing all these squared differences
• dividing this sum by (number of numbers in the set - 1)
The variance is the square of the standard deviation.
4
VarP
You can use extended syntax context operators with Var.
Examples
If measure has the set of values (2, 4, 6, 8) Var([measure]) returns 6.67.
Related Topics
• StdDev on page 74
Description
Returns the population variance of a measure
Function Group
Aggregate
Using Functions, Formulas and Calculations in Web Intelligence 77

Web Intelligence functions, operators and keywords
4
Web Intelligence functions
Syntax
num VarP(measure)
Input
Notes
The population variance is a measure of the statistical dispersion in a set of
numbers. It is calculated by:
• finding the average of the set of numbers
• subtracting the average from each number in the set and squaring the
difference
• summing all these squared differences
• dividing this sum by (number of numbers in the set)
The population variance is the square of the population standard deviation.
RequiredTypeDescriptionParamter
YesMeasureAny measuremeasure
You can use extended syntax context operators with VarP.
Examples
If measure has the set of values (2, 4, 6, 8) VarP([measure]) returns 5.
Related Topics
• StdDevP on page 75
Character functions
Asc
Description
Returns the ASCII value of a character
78 Using Functions, Formulas and Calculations in Web Intelligence

Web Intelligence functions, operators and keywords
Web Intelligence functions
Function Group
Character
Syntax
int Asc(string)
Input
RequiredTypeDescriptionParameter
YesStringAny stringstring
Notes
If string contains more than one character, the function returns the ASCII
value of the first character in the string.
Examples
4
Char
Asc("A") returns 65.
Asc("ab") returns 97.
Asc([Country]) returns 85 when the value of [Country] is "US".
Description
Returns the character associated with an ASCII code
Function Group
Character
Syntax
string Char(ascii_code)
Using Functions, Formulas and Calculations in Web Intelligence 79

Web Intelligence functions, operators and keywords
4
Web Intelligence functions
Input
Notes
If number is a decimal, the function ignores the decimal part.
Example
s
Char(123) returns "{".
Concatenation
Description
RequiredTypeDescriptionParameter
YesNumberAn ASCII codeascii_code
Concatenates (joins) two character strings
Function Group
Character
Syntax
string Concatenation(first_string;second_string)
Input
Notes
You can also use the '+' operator to concatenate strings.
80 Using Functions, Formulas and Calculations in Web Intelligence
RequiredTypeDescriptionParameter
YesStringThe first stringfirst_string
YesStringThe second stringsecond_string

Fill
Web Intelligence functions, operators and keywords
Web Intelligence functions
"First " + "Second" returns "First Second".
"First " + "Second" + " Third" returns "First Second Third".
Examples
Concatenation("First ";"Second") returns "First Second".
Concatenation("First ";Concatenation("Second ";"Third")) returns
"First Second Third".
Description
Builds a string by repeating a string n times
Function Group
Character
4
Syntax
string Fill(repeating_string;num_repeats)
Input
num_repeats
peats
Examples
Fill ("New York";2) returns "New York New York".
Using Functions, Formulas and Calculations in Web Intelligence 81
RequiredTypeDescriptionParameter
YesStringThe repeating stringrepeating_string
YesNumberThe number of re-

Web Intelligence functions, operators and keywords
4
Web Intelligence functions
FormatDate
Description
Formats a date according to a specified format
Function Group
Character
Syntax
string FormatDate(date;format_string)
Input
RequiredTypeDescriptionParameter
YesDateThe date to formatdate
format_string
ply
Notes
• The format of the output is dependent on the date format applied to the
cell.
• The color formatting strings (for example: [Red], [Blue] and so on ) cannot
be applied to FormatDate.
Examples
FormatDate(CurrentDate();"dd/MM/yyyy") returns "15/12/2005" if the
current date is 15 December 2005.
FormatNumber
Description
Formats a number according to a specified format
82 Using Functions, Formulas and Calculations in Web Intelligence
YesStringThe format to ap-

Web Intelligence functions, operators and keywords
Function Group
Character
Syntax
string FormatNumber(number;format_string)
Input
Web Intelligence functions
RequiredTypeDescriptionParameter
4
HTMLEncode
number
mat
Notes
• The format of the output is dependent on the number format applied to
the cell.
• The color formatting strings (for example: [Red], [Blue] and so on ) cannot
be applied to FormatNumber.
Examples
FormatNumber([Revenue];"#,##.00") returns 835,420.00 if [Revenue] is
835,420.
Description
Applies HTML encoding rules to a string
YesNumberThe number to for-
YesStringThe format to applyformat_string
Function Group
Character
Syntax
string HTMLEncode(html)
Using Functions, Formulas and Calculations in Web Intelligence 83

Web Intelligence functions, operators and keywords
4
Web Intelligence functions
Input
Examples
HTMLEncode("http://www.businessobjects.com") returns
"http%3A%2F%2Fwww%2Ebusinessobjects%2Ecom ".
InitCap
Description
Capitalizes the first letter of a string
Function Group
RequiredTypeDescriptionParamter
YesStringAn HTML stringhtml
Character
Syntax
string InitCap(string)
Input
string
ize
Examples
InitCap("we hold these truths to be self-evident") returns "We
hold these truths to be self-evident".
84 Using Functions, Formulas and Calculations in Web Intelligence
RequiredTypeDescriptionParameter
YesStringThe string to capital-

Left
Web Intelligence functions, operators and keywords
Description
Returns the leftmost characters of a string
Function Group
Character
Syntax
string Left(string;num_chars)
Input
Web Intelligence functions
RequiredTypeDescriptionParameter
YesstringThe input stringstring
4
LeftPad
num_chars
from the left
Examples
Left([Country];2) returns "Fr" if [Country] is "France".
Description
Pads a string on its left with another string
Function Group
Character
Syntax
string LeftPad(padded_string;length;left_string)
Using Functions, Formulas and Calculations in Web Intelligence 85
YesnumberThe number of characters to return
Web Intelligence functions, operators and keywords
4
Web Intelligence functions
Input
RequiredTypeDescriptionParameter
YesStringThe original stringpadded_string
YesNumberThe length of the output stringlength
LeftTrim
left_string
padded_string
Notes
• If length is less than the length of left_string and padded_string
combined, left_string is truncated.
• If length is less than or equal to the length of padded_string, the function
returns padded_string.
• If length is greater than the lengths of padded_string and left_string
combined, left_string is repeated or partially repeated enough times
to fill out the length.
Examples
LeftPad("York";8;"New ") returns "New York"
LeftPad("York";6;"New ") returns "NeYork"
LeftPad("York";11;"New ") returns "New NewYork"
LeftPad("New ";2;"York") returns "New".
YesStringThe string to be added to the left of
Description
Trims the leading spaces from a string
Function Group
Character
86 Using Functions, Formulas and Calculations in Web Intelligence

Web Intelligence functions, operators and keywords
Syntax
string LeftTrim(trimmed_string)
Input
Web Intelligence functions
RequiredTypeDescriptionParameter
4
Length
trimmed_string
trimmed
Examples
LeftTrim([Country]) returns "France" if [Country] is " France".
Description
Returns the number of characters in a string
Function Group
Character
Syntax
int Length(string)
Input
YesStringThe string to be
Examples
Length([Last Name]) returns 5 if [Last Name] is "Smith".
Using Functions, Formulas and Calculations in Web Intelligence 87
RequiredTypeDescriptionParameter
YesStringThe input stringstring

Web Intelligence functions, operators and keywords
4
Web Intelligence functions
Lower
Description
Converts a string to lower case
Function Group
Character
Syntax
string Lower(string)
Input
RequiredTypeDescriptionParameter
Match
string
lower case
Examples
Lower("New York") returns "new york".
Description
Determines whether a string matches a pattern
Function Group
Character
Syntax
bool Match(test_string;pattern)
YesStringThe string to be converted to
88 Using Functions, Formulas and Calculations in Web Intelligence
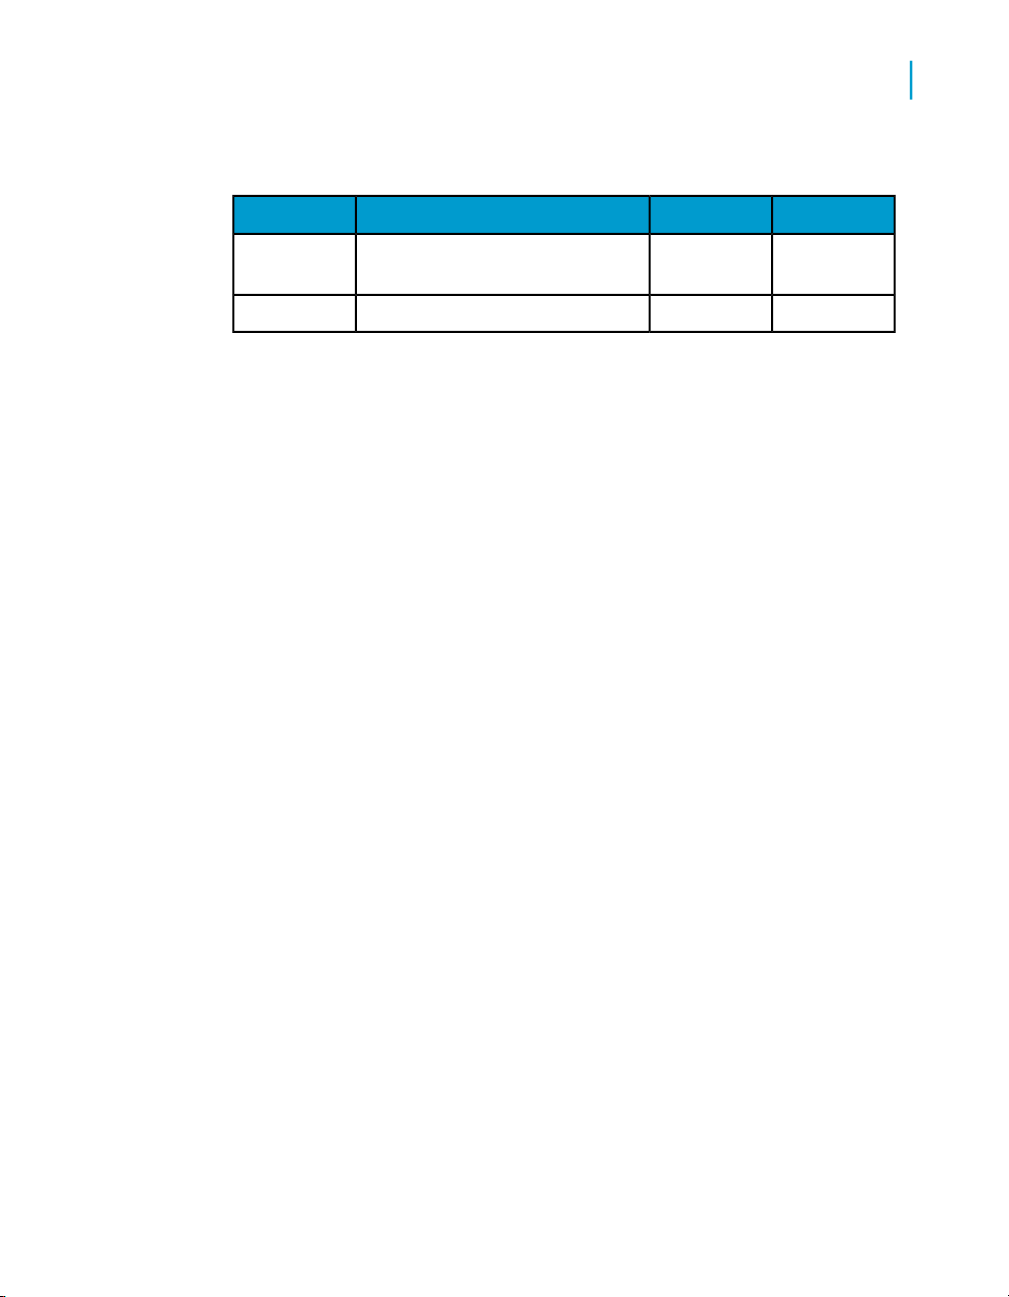
Input
Web Intelligence functions, operators and keywords
Web Intelligence functions
RequiredTypeDescriptionParamter
4
Pos
test_string
text pattern
Notes
• The pattern can contain the wildcards "*" (replaces any set of characters)
or "?" (replaces any single character).
Examples
Match([Country];"F*") returns True if [Country} is "France".
Match([Country];"?S?") returns True if [Country] is "USA".
Match("New York";"P*") returns False.
Description
Returns the starting position of a text pattern in a string
YesstringThe string to be tested against the
YesstringThe text patternpattern
Function Group
Character
Syntax
int Pos(test_string;pattern)
Using Functions, Formulas and Calculations in Web Intelligence 89

Web Intelligence functions, operators and keywords
4
Web Intelligence functions
Input
RequiredTypeDescriptionParamter
Replace
test_string
text pattern
Notes
• If the pattern occurs more than once, Pos returns the position of the first
occurrence.
Examples
Pos("New York";"Ne") returns 1.
Pos("New York, New York";"Ne") returns 1.
Pos("New York"; "York") returns 5.
Description
Replaces part of a string with another string
YesstringThe string to be tested for the
YesstringThe text patternpattern
Function Group
Character
Syntax
string Replace(replace_in;replaced_string;replace_with)
90 Using Functions, Formulas and Calculations in Web Intelligence

Input
Web Intelligence functions, operators and keywords
Web Intelligence functions
RequiredTypeDescriptionParameter
4
Right
replace_in
replaced
placed_string
replace_with
placed_string
Examples
Replace("New YORK";"ORK";"ork") returns "New York".
Description
Returns the rightmost characters of a string
Function Group
Character
YesstringThe string in which the text is
YesstringThe text to be replacedre-
YesstringThe text that replaces re
Syntax
string Right(string;num_chars)
Using Functions, Formulas and Calculations in Web Intelligence 91

Web Intelligence functions, operators and keywords
4
Web Intelligence functions
Input
RequiredTypeDescriptionParameter
YesstringAny stringstring
RightPad
num_chars
from the right
Examples
Right([Country];2) returns "ce" if [Country] is "France".
Description
Pads a string on its right with another string
Function Group
Character
Syntax
string RightPad(padded_string;length;right_string)
Input
YesnumberThe number of characters to return
right_string
of padded_string
Notes
• If length is less than the length of right_string and padded_string
combined, right_string is truncated.
92 Using Functions, Formulas and Calculations in Web Intelligence
RequiredTypeDescriptionParameter
YesStringThe original stringpadded_string
YesNumberThe length of the output stringlength
YesStringThe string to be added to the right
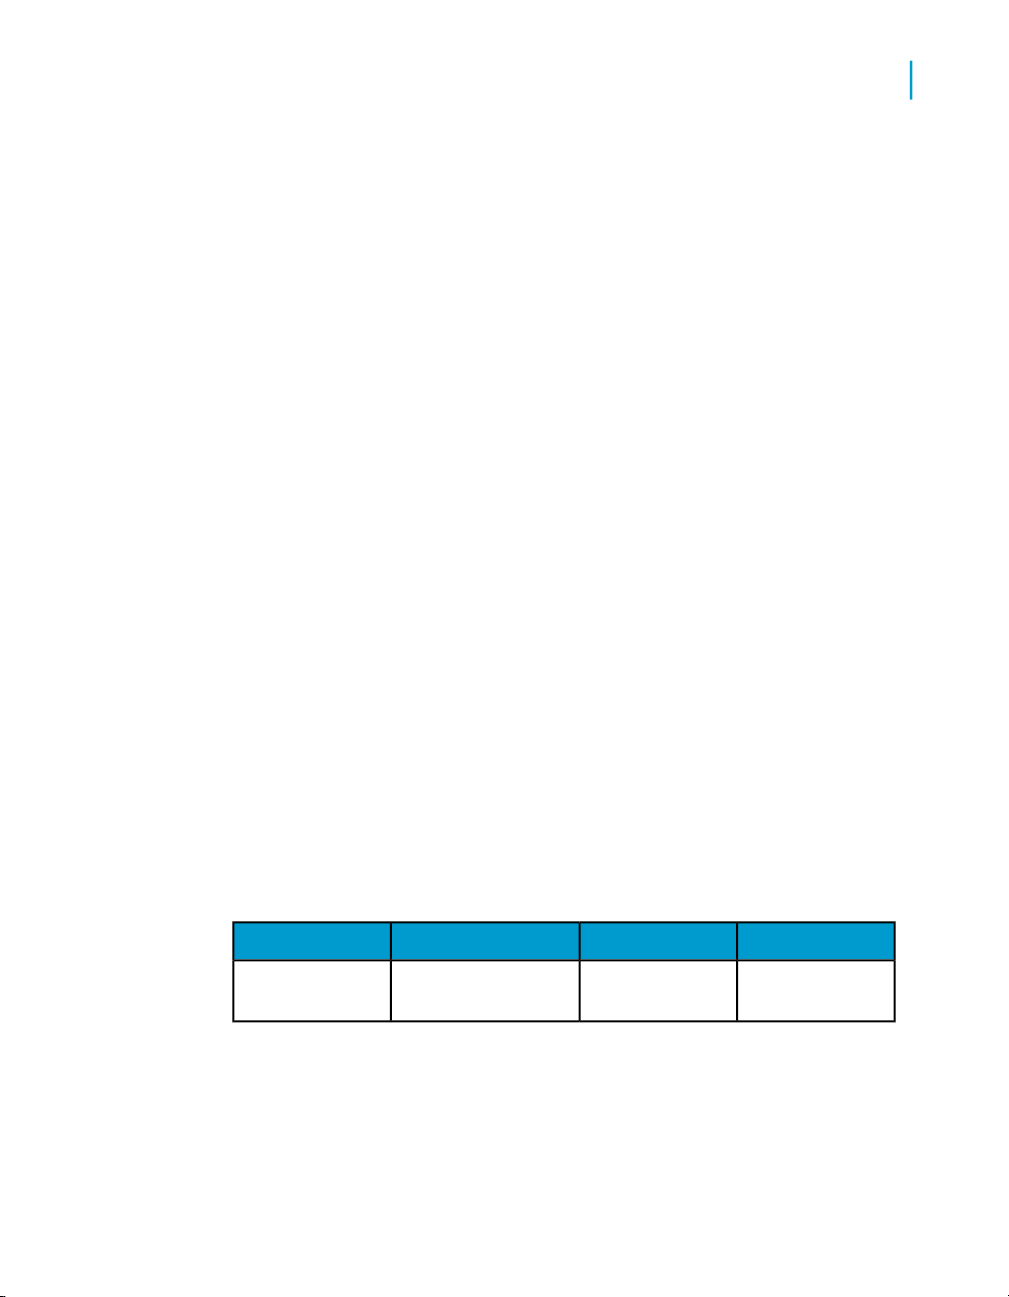
RightTrim
Web Intelligence functions, operators and keywords
Web Intelligence functions
• If length is less than or equal to the length of padded_string, the function
returns padded_string.
• If length is greater than the lengths of padded_string and right_string
combined, right_string is repeated or partially repeated enough times
to fill out the length.
Examples
RightPad("New ";8;"York") returns "New York"
RightPad("New ";6;"York") returns "New Yo"
RightPad("New ";11;"York") returns "New YorkYor"
RightPad("New ";2;"York") returns "New".
Description
4
Trims the trailing spaces from a string
Function Group
Character
Syntax
string RightTrim(trimmed_string)
Input
RequiredTypeDescriptionParameter
trimmed_string
trimmed
Examples
RightTrim([Country]) returns "France" if [Country] is "France ".
Using Functions, Formulas and Calculations in Web Intelligence 93
YesStringThe string to be

Web Intelligence functions, operators and keywords
4
Web Intelligence functions
Substr
Description
Returns part of a string
Function Group
Character
Syntax
string SubStr(string;start;length)
Input
RequiredTypeDescriptionParameter
YesStringAny stringstring
start
tracted string
length
string
Examples
SubStr("Great Britain";1;5) returns "Great".
SubStr("Great Britain";7;7) returns "Britain".
Trim
Description
Trims the leading and trailing spaces from a string
94 Using Functions, Formulas and Calculations in Web Intelligence
YesNumberThe start position of the ex-
YesNumberThe length of the extracted

Function Group
Character
Syntax
string Trim(trimmed_string)
Input
Web Intelligence functions, operators and keywords
Web Intelligence functions
RequiredTypeDescriptionParameter
4
Upper
string
trimmed
Examples
Trim(" Great Britain ") returns "Great Britain".
Description
Converts a string to upper case
Function Group
Character
Syntax
string Upper(string)
YesStringThe string to be
Using Functions, Formulas and Calculations in Web Intelligence 95

Web Intelligence functions, operators and keywords
4
Web Intelligence functions
Input
RequiredTypeDescriptionParameter
UrlEncode
string
verted
Examples
Upper("New York") returns "NEW YORK".
Description
Applies URL encoding rules to a string
Function Group
Character
Syntax
string UrlEncode(html)
Input
YesStringThe string to be con-
html
coded
Examples
UrlEncode("http://www.businessobjects.com") returns
"http%3A%2F%2Fwww%2Ebusinessobjects%2Ecom".
96 Using Functions, Formulas and Calculations in Web Intelligence
RequiredTypeDescriptionParameter
YesStringThe URL to be en-

WordCap
Web Intelligence functions, operators and keywords
Description
Capitalizes the first letter of all the words in a string
Function Group
Character
Syntax
string WordCap(string)
Input
Web Intelligence functions
RequiredTypeDescriptionParameter
4
string
ized
Examples
WordCap("Sales revenue for March") returns "Sales Revenue For March".
Date and Time functions
CurrentDate
Description
Returns the current date formatted according to the regional settings
Function Group
Date and Time
YesStringThe string to be capital-
Using Functions, Formulas and Calculations in Web Intelligence 97

Web Intelligence functions, operators and keywords
4
Web Intelligence functions
Syntax
date CurrentDate()
Examples
CurrentDate() returns 10 September 2002 if the date is 10 September
2002.
CurrentTime
Description
Returns the current time formatted according to the regional settings
Function Group
Date and Time
Syntax
time CurrentTime()
Examples
CurrentTime returns 11:15 if the current time is 11:15.
DayName
Description
Returns the day name in a date
Function Group
Date and Time
Syntax
string DayName(date)
98 Using Functions, Formulas and Calculations in Web Intelligence

Input
Examples
DayName([Reservation Date]) returns "Saturday' when the date in
[Reservation Date] is 15 December 2001 (which is a Saturday).
Note
The input date must be a variable. You cannot specify the date directly, as
in DayName("07/15/2001").
DayNumberOfMonth
Description
Web Intelligence functions, operators and keywords
Web Intelligence functions
RequiredTypeDescriptionParameter
YesDateThe input datedate
4
Returns the day number in a month
Function Group
Date and Time
Syntax
int DayNumberOfMonth(date)
Input
RequiredTypeDescriptionParameter
YesDateThe input datedate
Examples
DayNumberOfMonth([Reservation Date]) returns 15 when the date in
[Reservation Date] is 15 December 2001.
Using Functions, Formulas and Calculations in Web Intelligence 99

Web Intelligence functions, operators and keywords
4
Web Intelligence functions
DayNumberOfWeek
Description
Returns the day number in a week
Function Group
Date and Time
Syntax
int DayNumberOfWeek(date)
Input
RequiredTypeDescriptionParameter
YesDateThe input datedate
Notes
Web Intelligence treats Monday as the first day of the week.
Examples
DayNumberOfWeek([Reservation Date]) returns 1 when the date in
[Reservation Date] is 2 May 2005 (which is a Monday).
DayNumberOfYear
Description
Returns the day number in a year
Function Group
Date and Time
100 Using Functions, Formulas and Calculations in Web Intelligence
 Loading...