


Performing on-report analysis with
Web Intelligence
BusinessObjects Enterprise XI 3.0

Copyright
© 2008 Business Objects, an SAP company. All rights reserved. Business Objects
owns the following U.S. patents, which may cover products that are offered and
licensed by Business Objects: 5,295,243; 5,339,390; 5,555,403; 5,590,250;
5,619,632; 5,632,009; 5,857,205; 5,880,742; 5,883,635; 6,085,202; 6,108,698;
6,247,008; 6,289,352; 6,300,957; 6,377,259; 6,490,593; 6,578,027; 6,581,068;
6,628,312; 6,654,761; 6,768,986; 6,772,409; 6,831,668; 6,882,998; 6,892,189;
6,901,555; 7,089,238; 7,107,266; 7,139,766; 7,178,099; 7,181,435; 7,181,440;
7,194,465; 7,222,130; 7,299,419; 7,320,122 and 7,356,779. Business Objects and
its logos, BusinessObjects, Business Objects Crystal Vision, Business Process
On Demand, BusinessQuery, Cartesis, Crystal Analysis, Crystal Applications,
Crystal Decisions, Crystal Enterprise, Crystal Insider, Crystal Reports, Crystal
Vision, Desktop Intelligence, Inxight and its logos , LinguistX, Star Tree, Table
Lens, ThingFinder, Timewall, Let There Be Light, Metify, NSite, Rapid Marts,
RapidMarts, the Spectrum Design, Web Intelligence, Workmail and Xcelsius are
trademarks or registered trademarks in the United States and/or other countries
of Business Objects and/or affiliated companies. SAP is the trademark or registered
trademark of SAP AG in Germany and in several other countries. All other names
mentioned herein may be trademarks of their respective owners.
Third-party
Contributors
Business Objects products in this release may contain redistributions of software
licensed from third-party contributors. Some of these individual components may
also be available under alternative licenses. A partial listing of third-party
contributors that have requested or permitted acknowledgments, as well as required
notices, can be found at: http://www.businessobjects.com/thirdparty
2008-09-03

Contents
About Web Intelligence 13Chapter 1
How Web Intelligence performs business intelligence over the web.........14
How Web Intelligence performs business intelligence offline....................14
Interacting with Web Intelligence reports...................................................14
Creating and editing Web Intelligence documents....................................16
Accessing Web Intelligence from InfoView 19Chapter 2
To log in to InfoView...................................................................................20
To log out of InfoView................................................................................21
Web Intelligence InfoView options.............................................................21
Viewing and printing Web Intelligence reports.....................................15
Drilling on Web Intelligence reports......................................................15
Performing on-report analysis..............................................................15
Web Intelligence Query - HTML...........................................................16
Web Intelligence Java Report Panel....................................................17
Web Intelligence Rich Client................................................................17
Web Intelligence HTML Report Panel..................................................18
Web Intelligence document creation and viewing options...................21
To set Web Intelligence drill options.....................................................24
Web Intelligence locale options............................................................26
Web Intelligence viewing modes 31Chapter 3
To switch between viewing modes............................................................32
Draft mode............................................................................................32
Page mode...........................................................................................32
PDF mode............................................................................................32
Performing on-report analysis with Web Intelligence 3

Contents
Quick Display mode.............................................................................33
To select Enhanced Viewing mode......................................................35
Working with reports 37Chapter 4
Organizing reports.....................................................................................38
To insert a new report...........................................................................38
To duplicate a report.............................................................................38
To move a report..................................................................................38
To delete a report.................................................................................39
To rename a report ..............................................................................39
Defining the page layout of reports............................................................39
To set report margins............................................................................39
To set the page orientation of reports...................................................39
To select the report paper size.............................................................40
To include report page headers and footers.........................................40
To include report page numbers...........................................................40
To add and format a report title............................................................41
To include cells with predefined or custom formulas in reports............42
Including images in reports........................................................................42
To select an image to display on a report background.........................42
To insert an image in a free-standing cell in a report...........................43
Answering prompts....................................................................................44
To enter values to answer a prompt.....................................................44
To enter dates to answer a prompt.......................................................45
Merging dimensions from multiple data providers 47Chapter 5
Merged dimensions defined......................................................................48
When to merge dimensions.......................................................................48
Choosing which dimensions to merge.......................................................48
Creating, editing and deleting merged dimensions...................................49
4 Performing on-report analysis with Web Intelligence

Contents
To merge dimensions in Web Intelligence............................................49
To merge dimensions automatically in Web Intelligence......................49
To edit a merged dimension in Web Intelligence..................................50
To delete a merged dimension in Web Intelligence..............................50
Understanding the effects of merged dimensions.....................................50
Synchronizing data providers with different aggregation levels...........51
Detail objects and merged dimensions................................................52
Incompatible objects and merged dimensions.....................................54
Filtering merged dimensions................................................................55
Drilling on merged dimensions.............................................................57
Filtering reports 59Chapter 6
Report filters defined..................................................................................60
Types of report filter..............................................................................60
Query filters and report filters compared...................................................61
Report filter operators................................................................................61
Equal To operator.................................................................................61
Not Equal To operator..........................................................................61
Different From operator........................................................................61
Greater Than operator..........................................................................62
Greater Than Or Equal To operator......................................................62
Less Than operator..............................................................................62
Less Than Or Equal To operator..........................................................62
Between operator.................................................................................62
Not Between operator..........................................................................63
In List operator.....................................................................................63
Not In List operator...............................................................................63
Is Null operator.....................................................................................63
Is Not Null operator..............................................................................64
Creating, editing and deleting report filters................................................64
To create a report filter in Web Intelligence..........................................64
Performing on-report analysis with Web Intelligence 5

Contents
To view the report filters in a Web Intelligence report...........................64
To edit a report filter in a Web Intelligence report.................................65
To edit one dimension in a report filter in Web Intelligence..................65
To delete a report filter in Web Intelligence..........................................65
To create simple report filters...............................................................66
Combining and nesting report filters..........................................................67
The AND and OR operators.................................................................67
To combine report filters in Web Intelligence........................................67
To nest report filters in Web Intelligence..............................................68
To change the order of nested report filters in Web Intelligence..........69
Drilling on report data 71Chapter 7
What is drill?..............................................................................................72
Scope of analysis.................................................................................73
Drill paths and hierarchies....................................................................75
To start and end drill mode in Web Intelligence.........................................76
Retrieving more levels of data to the report...............................................76
To drill out of the scope of analysis......................................................76
To choose a drill path when more than one is available............................77
Drilling on dimensions in tables and sections............................................78
Drilling down.........................................................................................78
Drilling up.............................................................................................80
Drilling by..............................................................................................81
Drilling on measures in tables and sections..............................................83
To drill down on a measure value.........................................................83
To drill up on a measure value.............................................................84
Synchronizing drill across multiple tables and charts................................84
Drilling on charts........................................................................................85
Drilling on dimensions via chart axes...................................................85
Drilling on measures in charts..............................................................86
Drilling on axis legends........................................................................89
6 Performing on-report analysis with Web Intelligence

Contents
Using filters when you drill.........................................................................89
To change a filter value on the Drill toolbar..........................................90
To add or remove a drill filter ...............................................................90
Saving reports with drill filters....................................................................91
Refreshing data in a drilled report with prompts........................................91
Drilling with query drill................................................................................91
Query drill defined................................................................................91
Drilling down with query drill.................................................................93
Drilling up with query drill.....................................................................93
Query drill and drill snapshots..............................................................94
Query drill and other reports based on the same data provider...........94
Displaying data in tables 95Chapter 8
Tables in Web Intelligence.........................................................................96
Table types in Web Intelligence.................................................................96
Vertical table.........................................................................................96
Horizontal table....................................................................................97
Crosstab...............................................................................................97
Forms...................................................................................................98
Creating, editing and removing tables.......................................................99
To insert a table....................................................................................99
To name a table..................................................................................100
To change the table type using Turn To.............................................100
To change the table type using drag and drop...................................100
To move columns in a table................................................................100
To remove a column from a table.......................................................101
To remove a row from a table.............................................................101
To add a column to a table.................................................................101
To add a row to a table.......................................................................101
To move columns in a crosstab..........................................................102
To add objects to a table....................................................................102
Performing on-report analysis with Web Intelligence 7

Contents
To clear table or cell contents.............................................................102
To remove a table...............................................................................102
Formatting tables and table cells.............................................................103
To copy formatting using the Format Painter.....................................103
To set cell height and width................................................................103
To format text in table cells.................................................................104
To align cell values.............................................................................105
To merge cells....................................................................................105
To format numbers and dates.............................................................105
To align a table or cell on a report page.............................................105
To format table borders......................................................................106
To set the cell background color.........................................................106
To insert an image in a table..............................................................107
To display a skin in a table.................................................................107
To layer tables and cells.....................................................................107
Determining how tables display data.......................................................108
Showing or hiding empty tables, rows or columns.............................108
Aggregating duplicate rows................................................................109
To avoid page breaks in tables...........................................................109
To view, activate and deactivate alerters............................................109
To filter data in a table........................................................................110
Using sections to group data 111Chapter 9
Grouping information with sections.........................................................112
Creating and removing sections and subsections...................................114
To create a section from a table cell in Web Intelligence...................114
To add a section based on object available in the document in Web
Intelligences.......................................................................................115
Creating subsections in Web Intelligence..........................................115
To include sections in the Navigation Map.........................................115
To remove a section in Web Intelligence............................................116
8 Performing on-report analysis with Web Intelligence

Contents
Formatting sections.................................................................................116
To select a background color for a section in Web Intelligence.........116
To display an image on a section background in Web Intelligence.....117
To display a skin on a section background in Web Intelligence.........118
To set the page layout for a section in Web Intelligence....................119
Displaying data in free-standing cells 121Chapter 10
Free-standing cells defined.....................................................................122
To insert a free-standing cell in Web Intelligence....................................123
Displaying data in charts 125Chapter 11
Creating charts........................................................................................126
Chart types in Web Intelligence...............................................................126
Bar charts...........................................................................................126
Line charts..........................................................................................127
Area charts.........................................................................................127
Pie charts...........................................................................................128
Radar, polar and scatter charts..........................................................128
3D charts............................................................................................129
2D charts............................................................................................129
Adding, copying and removing charts.....................................................130
To insert a blank chart and allocate data to the axes.........................130
To duplicate a chart............................................................................131
To turn a table into a chart..................................................................131
To remove a chart from a report.........................................................131
To name a chart..................................................................................131
Positioning charts....................................................................................132
To position a chart on the report page................................................132
Changing the chart type...........................................................................132
To change the chart type using TurnTo..............................................132
Performing on-report analysis with Web Intelligence 9

Contents
To change the chart type using drag and drop...................................132
Formatting charts.....................................................................................133
To select a 2D or 3D look for a chart..................................................133
To show, format or hide axis labels....................................................133
To show, format or hide the axis grid..................................................133
To select the data color......................................................................134
To show values on pie charts as percentages...................................134
To select the style and color of a chart border...................................134
To remove the border of a chart.........................................................135
To select the background color of a chart..........................................135
To show or hide chart walls and floors...............................................135
To insert and format a chart title.........................................................136
To set the page layout of charts.........................................................136
To show, hide, position and format chart legends..............................136
Displaying and formatting chart data..................................................137
Linking to other documents 141Chapter 12
Linking to other documents.....................................................................142
Cell text defined as a hyperlink..........................................................142
A hyperlink associated with a cell......................................................143
A link to another document in the CMS..............................................145
Working with hyperlinks...........................................................................150
To link to another document from a hyperlink....................................150
To edit a hyperlink..............................................................................151
To delete a hyperlink..........................................................................151
Formatting hyperlink colors................................................................151
URL Reporting using openDocument .....................................................152
Structuring an openDocument URL ..................................................152
openDocument parameter overview .................................................155
Contextual report linking ....................................................................173
10 Performing on-report analysis with Web Intelligence

Contents
Working with documents 177Chapter 13
To create a Web Intelligence document from InfoView............................178
To delete a Web Intelligence document from InfoView............................178
Saving documents...................................................................................178
To save a new Web Intelligence document in InfoView.....................178
To save a Web Intelligence document as a PDF file..........................179
To save a Web Intelligence document as an Excel spreadsheet.......179
To save a Web Intelligence document as a CSV file..........................180
Automatic saving and recovery..........................................................181
Printing Web Intelligence documents......................................................183
To print a Web Intelligence report.......................................................184
Web Intelligence document properties....................................................184
To view and set Web Intelligence document properties.....................186
Get More Help 187Appendix A
Index 191
Performing on-report analysis with Web Intelligence 11

Contents
12 Performing on-report analysis with Web Intelligence

About Web Intelligence
1

About Web Intelligence
1
How Web Intelligence performs business intelligence over the web
How Web Intelligence performs business
intelligence over the web
Web Intelligence provides business users an easy to use interactive and
flexible user interface for building and analyzing reports on corporate data
over the web, on secured intranets and extranets. The Web Intelligence
software is installed by your administrator on a web server on your corporate
network.
To use Web Intelligence from your local computer, you log into the business
intelligence portal InfoView via your Internet browser. Then, depending on
your security profile, you can interact with the reports in corporate documents
or edit or build your own documents using a Web Intelligence report panel
or query panel.
How Web Intelligence performs business intelligence offline
Web Intelligence can be used offline as Web Intelligence Rich Client, a
standalone Microsoft Windows application, equivalent to the Java Report
Panel, that you can install on your computer. Web Intelligence Rich Client
lets you continue to work with Web Intelligence (WID) documents when you
are unable to connect to a CMS, when you want to perform calculations
locally rather than on the server, and when you want to work with Web
Intelligence documents without installing a CMS or application server.
Web Intelligence Rich Client can also be used when connected to a CMS.
Interacting with Web Intelligence reports
Depending on your security profile and on how Web Intelligence is deployed
across your organization, you can view, analyze, or enhance and modify the
data displayed on reports.
14 Performing on-report analysis with Web Intelligence

About Web Intelligence
Interacting with Web Intelligence reports
Viewing and printing Web Intelligence reports
Once logged into the business intelligence portal InfoView, you can access
Web Intelligence documents and view reports. Onscreen navigation is made
easy with page-to-page navigation buttons and a document map that allows
you to jump from section to section or report to report.
The same document can provide the information adapted to each user due
to prompts that request each user, who opens the document, to specify the
data they want to return to the reports.
When you print reports, Web Intelligence automatically generates a copy of
reports in Portable Document Format (PDF) format for optimum print quality.
Drilling on Web Intelligence reports
Drilling on Web Intelligence reports enables you to analyze the detailed data
behind the displayed results. You can turn the report you are viewing into a
drillable report or drill on a duplicate of the original report to retain a version
of the results before your drill analysis.
1
Once you have found the information you need, you can save a snapshot
of the drilled report to share the results of your analysis with other Web
Intelligence users, or save the document in Excel or Portable Document
(PDF) format to print or email to other business contacts.
Performing on-report analysis
Viewing Web Intelligence reports in Interactive view format enables you to
enhance reports and fine-tune the data reports contain, to highlight the
information that most interests you on demand.
On-Report Analysis is designed for:
• users who need to build queries and then want to build reports
• report consumers who need to manipulate the reports created by others
With On-Report Analysis you can:
Performing on-report analysis with Web Intelligence 15

About Web Intelligence
1
Creating and editing Web Intelligence documents
• view document metadata to understand the data behind reports and see
how reports are structured and filtered
• filter and sort results
• add new tables and charts
• add formulas and create variables
• format and change the layout of charts and tables
• slice and dice results by adding other data to charts and tables
Note:
On-report analysis of Web Intelligence reports in Interactive view format is
only available if your administrator has deployed Web Intelligence in JSP
mode.
Creating and editing Web Intelligence
documents
You can create or edit Web Intelligence documents using several tools:
•
Web Intelligence Query - HTML on page 16
•
Web Intelligence Java Report Panel on page 17
•
Web Intelligence Rich Client on page 17
•
Web Intelligence HTML Report Panel on page 18
Web Intelligence Query - HTML
Designed for users requiring a pure HTML environment to build queries,
Web Intelligence Query – HTML offers the ability to define the data content
of documents on multiple data sources. You can use Query – HTML to create
new documents from scratch or edit the queries in documents created using
any of the other Web Intelligence tools.
Used together with On-Report Analysis, Query – HTML provides a complete
solution for building queries and designing powerful reports in a pure HTML
environment. Once you have run the queries to generate a standard report,
you can leverage Web Intelligence On-Report Analysis features to format
multiple reports, add formulas, and create variables.
16 Performing on-report analysis with Web Intelligence

Creating and editing Web Intelligence documents
Note:
Web Intelligence Query – HTML and On-Report Analysis in Interactive view
format are only available, if your administrator has deployed Web Intelligence
in JSP mode.
Web Intelligence Java Report Panel
The Java Report Panel is designed for users who need more flexibility with
designing report layout and defining formulas and variables. A graphical
Formula Editor enables you to build formulas rapidly using drag-and-drop.
Note:
The Web Intelligence Java Report Panel is available if your administrator
has deployed Web Intelligence in ASP mode and if your administrator has
deployed Web Intelligence in JSP mode.
Web Intelligence Rich Client
About Web Intelligence
1
Web Intelligence Rich Client is a locally installed Microsoft Windows
application that lets you work with Web Intelligence (WID) documents that
are stored locally or in a CMS.
When working without a CMS connection you can work on your local machine
with either CMS-secured or unsecured documents.
Web Intelligence Rich Client is based on the Web Intelligence Java Report
Panel and provides equivalent document creation, editing, formatting, printing
and saving capabilities.
There are a number of reasons for using Web Intelligence Rich Client to
work with WID documents:
• You want to work with Web Intelligence documents but you are unable
to connect to a CMS (while traveling, for example).
• You want to improve calculation performance: Web Intelligence Rich
Client performs calculations locally, rather than on the server, and local
calculations can perform better than server calculations.
• You want to work with Web Intelligence documents without installing a
CMS or application server.
Performing on-report analysis with Web Intelligence 17

About Web Intelligence
1
Creating and editing Web Intelligence documents
Web Intelligence HTML Report Panel
Designed for users who need to build basic reports, the HTML Report Panel
provides query and report features in a simple wizard-like interface. Each
document is based on a single data source and can contain multiple reports,
displaying different subsets of information.
In addition, the HTML Report Panel is 508 compliant and can be customized
for specialized deployments.
Note:
The Web Intelligence HTML Report Panel is only available if your
administrator has deployed Web Intelligence in JSP mode.
18 Performing on-report analysis with Web Intelligence

Accessing Web Intelligence from InfoView
2

Accessing Web Intelligence from InfoView
2
To log in to InfoView
You access Web Intelligence reports and set global Web Intelligence options
from InfoView, the corporate business intelligence portal.
To log in to InfoView
Before you can use InfoView and Web Intelligence you need the following
information:
• a URL to the InfoView server
• the InfoView server name and port number
• your login and password
• your authentication, which controls the InfoView resources available to
you
Contact your adminstrator for these details if you do not already know them.
Note:
By default the InfoView server name and authentification method are not
displayed on the InfoView logon page. You need to supply this information
only if your administrator has made these options visible.
You access Web Intelligence by using your web browser to log into InfoView,
the corporate business intelligence portal. Once you are in InfoView, you
can analyze and enhance Web Intelligence reports.
1. Launch your web browser.
2. Point your browser to the InfoView bookmark or URL.
The InfoView login page appears.
3. If the System box is blank, type the name of the InfoView server followed
by a colon (:), and then type the port number.
4. In the Username box, type your user name.
5. In the Password box, type your password.
6. In the Authentication box, select the authentication provided to you by
your administrator.
7. Click Log On.
The InfoView home page appears.
20 Performing on-report analysis with Web Intelligence

Accessing Web Intelligence from InfoView
To log out of InfoView
To log out of InfoView
When you finish using InfoView or Web Intelligence you need to log out,
instead of simply closing your web browser.
Logging out of InfoView ensures that any preferences you modified during
your InfoView session are saved. It also lets your administrator track how
many users are logged into the system at any given time and thus optimize
InfoView and Web Intelligence performance.
• Click Log Out.
The login page appears. You are logged out of InfoView
Web Intelligence InfoView options
Web Intelligence document creation and viewing options
2
You can set your Web Intelligence options to determine how you create,
view and interact with documents using Web Intelligence.
You create documents using a query editor to build the query to retrieve the
document data. After the query returns the data to the document, you can
view and interact with the data.
Performing on-report analysis with Web Intelligence 21

Accessing Web Intelligence from InfoView
2
Web Intelligence InfoView options
Advanced
DescriptionDocument creation option
You create documents using the
Java Report Panel, a Java applet
than launches in your Web browser.
The Java Report Panel is a combined query building, report editing
and data analysis environment. If
you choose Advanced as your
document creation option, you also
use the Java Report Panel for
working with the data returned by
the query. The Select a default
view format option is not taken into
account.
The Java Report Panel provides
the richest feature set of all Web
Intelligence query building, report
editing and data analysis environments.
Interactive
Desktop
Web Accessibility
22 Performing on-report analysis with Web Intelligence
You build queries using Query HTML, an HTML-based query editor.
You build queries, edit reports and
analyze data using Web Intelligence Rich Client, a standalone
version of the Java Report Panel
that runs outside your web browser.
You create documents using the
HTML Report Panel, a 508-compliant
query-building and report-viewing
environment.

Accessing Web Intelligence from InfoView
Web Intelligence InfoView options
You can use the following view formats to view and interact with existing
Web Intelligence documents, or documents that you have just created using
a query editor:
DescriptionView format
Use Web (HTML) format when you
Web
Interactive
want to open reports, answer prompts,
navigate reports, and/or perform drill
analysis.
Use Interactive format when you
want to apply filters, sorts, calculations, modify formatting and data
displayed on tables and charts,
and/or perform drill analysis.
Use Interactive format if you are using Query – HTML to define queries,
and you want to format reports based
on those queries and add formulas
and variables.
2
Interactive view format is only available if your administrator has deployed Web Intelligence in JSP
mode.
PDF
Use PDF mode when you want to view
static reports.
To select the Web Intelligence query editor
1. Click the Preferences button on the InfoView toolbar.
2. Click Web Intelligence Preferences to display the Web Intelligence
options.
3. Select the query editor beneath Select a default creation/editing tool.
4. Click OK.
Performing on-report analysis with Web Intelligence 23

Accessing Web Intelligence from InfoView
2
Web Intelligence InfoView options
To select the Web Intelligence view format
You can select different view formats for Web Intelligence documents
depending on how you want to interact with the information displayed on the
reports. You select your Web Intelligence view options in InfoView. When
you modify your view options, the new settings are implemented the next
time you open a Web Intelligence document.
1. Click the Preferences button on the InfoView toolbar.
2. Click Web Intelligence Preferences to display the Web Intelligence
options.
3. In the Select a view format section, select the view format.
To select a default universe for new documents
1. Click Preferences on the Infoview toolbar.
2. ClickWeb Intelligence Preferences to display the Web Intelligence
options.
3. Click Browse beneath Select a default universe and browse to the
universe you want to select as the default.
To set Web Intelligence drill options
Drilling on reports lets you look deeper into data to discover the details behind
a good or bad summary result displayed on a table, chart, or section. Before
you begin a drill session, you can set your drill options in InfoView to specify
how reports will change each time you drill.
1. Click Preferences on the Infoview toolbar.
2. Click Web Intelligence Preferences to display the Web Intelligence
options.
3. Select the drill options under Drill options and Start drill session.
24 Performing on-report analysis with Web Intelligence

Hide drill toolbar option
When you drill on a value displayed on a report, the Drill toolbar appears
and displays the value on which you drilled. The value displayed on the
toolbar filters the results displayed on the drilled report.
For example, if you drill on year 2001, the results displayed on the drilled
table are Q1, Q2, Q3, and Q4 for year 2001. This means that the quarterly
values you drilled to are filtered by 2001.
Note:
If the drilled report includes dimensions from multiple queries, a ToolTip
appears when you rest your cursor on the value displayed on the filter. The
ToolTip displays the name of the query and the dimension for the value.
The Drill toolbar allows you to select alternative values on the same level,
in order to filter the results differently. For example, if you use the Drill toolbar
illustrated above to select “2002,? the results displayed on the drilled table
would be Q1, Q2, Q3, and Q4 for year 2002.
You can opt to hide the Drill toolbar when you start drill mode. The Drill
toolbar is only useful if you want to select filters during your drill session.
Accessing Web Intelligence from InfoView
Web Intelligence InfoView options
2
Prompt when drill requires additional data option
When you drill the results displayed on a Web Intelligence report, you may
want to drill to higher- or lower-level information that isn’t included in the
scope of analysis for the document. When this is the case, Web Intelligence
needs to run a new query to retrieve the additional data from the data source.
Since queries on large selections of data may take a long time to be
completed, you can choose to be prompted with a message every time a
new query is necessary. The prompt message asks you whether you want
to run the additional query or not. In addition, the prompt lets you apply filters
to the extra dimensions you include in the new query. This means you can
restrict the size of the query to only the data necessary for your analysis.
You need permission from your administrator to drill out of the scope of
analysis during a drill session.
Performing on-report analysis with Web Intelligence 25

Accessing Web Intelligence from InfoView
2
Web Intelligence InfoView options
Synchronize drill on report blocks option
When you select the Sychronize drill on all report blocks option, the display
of all blocks changes to correspond with your drill actions. For example, if
you drill down on a block from year to quarter, and your report also contains
a chart showing data by year, the chart display also changes to display data
by quarter.
If you do not select the option, only the drilled block changes in response to
drill actions.
Start drill session option
The Start drill session option controls how Web Intelligence behaves when
you start drill mode.
Start drill session on existing report option
When you select Start drill session on existing report, the current report
becomes drillable when you start drill mode. When you end drill mode, the
report displays the drilled values.
Start drill session on a duplicate report option
When you select Start drill on a duplicate report, Web Intelligence creates
a duplicate of the current report when you start drill mode, and you drill on
the duplicate. This allows you to compare the results of the original report
with the results you discover during your drill analysis.
Web Intelligence locale options
The locale determines how a Web Intelligence document displays data. It
affects, for example, the formatting of numbers and the default sort order.
Three locale settings combine to determine how Web Intelligence displays
data:
26 Performing on-report analysis with Web Intelligence

Accessing Web Intelligence from InfoView
Web Intelligence InfoView options
DescriptionLocale
2
Product locale
Document locale
Preferred viewing locale
Related Topics
• To permanently associate a locale with a document on page 28
The product locale
The product locale is the locale that InfoView uses by default. You set the
product locale in the Infoview General preferences.
To set the product locale
1. Click Preferences on the main InfoView toolbar.
2. Click General to display the general options.
3. Select the product locale from the Product locale list.
The locale in which InfoView displays
data by default.
The locale associated with a particular
Web Intelligence document. When you
save a document, the document locale
becomes the current product locale or
the preferred viewing locale.
You can permanently associate a locale with a document.
The locale in which you choose to view
documents
The document locale
The document locale is the locale associated with a particular document. By
default, the document takes the product locale when you save a document,
or the preferred viewing locale if this is different from the product locale and
your settings give the preferred viewing locale priority. The document retains
this locale until the next time it is saved, when it again takes either the product
locale or the preferred viewing locale.
Performing on-report analysis with Web Intelligence 27

Accessing Web Intelligence from InfoView
2
Web Intelligence InfoView options
Note:
The GetContentLocale Web Intelligence function returns the document
locale.
Related Topics
• To permanently associate a locale with a document on page 28
To display data using the document locale
1. Click Web Intelligence Preferences to display the Web Intelligence
options.
2. Click Use the document locale to format the data beneath When
viewing a document.
The preferred viewing locale
The preferred viewing locale is the locale that you choose to dislay data. The
preferred viewing locale overrides the product locale if it is different from the
product locale and your settings give the preferred viewing locale priority.
To set the preferred viewing locale
1. Click Preferences on the main InfoView toolbar.
2. Click General to display the general options.
3. Select the preferred viewing locale from the Preferred viewing locale
list.
4. Click Web Intelligence Preferences to display the Web Intelligence
options.
5. If you want data to be formatted using the preferred viewing locale, click
Use my Preferred Viewing Locale to format the data beneath When
viewing a document.
To permanently associate a locale with a document
1. In Web Intelligence Interactive, select Document > Properties from the
menu to display the" Document Properties" dialog box.
2. Select Permanent regional formatting.
3. Save the document.
28 Performing on-report analysis with Web Intelligence

Accessing Web Intelligence from InfoView
Web Intelligence InfoView options
The current document locale is associated permanently with the document
and overrides the product locale and the preferred viewing locale.
2
Performing on-report analysis with Web Intelligence 29

Accessing Web Intelligence from InfoView
Web Intelligence InfoView options
2
30 Performing on-report analysis with Web Intelligence

Web Intelligence viewing modes
3

Web Intelligence viewing modes
3
To switch between viewing modes
To switch between viewing modes
You can view Web Intelligence reports in different modes depending on how
you want to work with data and how you want the data to appear.
1. In Web Intelligence Interactive, select the report tab of the report you
want to view.
2. Click the arrow next to the View button on the main toolbar above the
report.
3. Select the viewing mode.
Web Intelligence Interactive displays the report in the selected viewing
mode.
4. In the Java Report Panel, use Switch Page/Quick Display on the
Reporting toolbar to alternate between Page mode and Quick Display
mode.
Draft mode
Draft mode displays just the tables, reports, and free standing cells in reports.
Use Draft mode when you want to focus on analyzing results, add calculations
or formulas, or add breaks or sorts to tables to organize results.
Page mode
Page mode displays the page layout of reports, including page margins,
headers, and footers.
Use Page mode when you want to fine-tune the formatting of tables and
charts and the layout of report pages.
PDF mode
PDF mode displays the report in PDF format.
32 Performing on-report analysis with Web Intelligence

Use PDF mode when you want to view the report in PDF format or print the
report from within Adobe® Acrobat® Reader®.
Quick Display mode
Quick Display mode is the default display mode in Web Intelligence. It is a
pagination mode that is based on the data, rather than the physical size of
report pages. Quick Display mode displays just the tables, reports, and free
standing cells in reports and displays a maximum number of records vertically
and horizontally, depending on the Quick Display settings. Quick Display
mode also specifies the minimum page width and height and the amount of
padding around the edges of the report.
Because Quick display mode retricts the number of horizontal and vertical
rows, a report might not contain all possible data.
Use Quick Display mode when you want to focus on analyzing results, add
calculations or formulas, or add breaks or sorts to tables to organize results.
The Quick Display mode properties are configurable either by your
administrator in the CMC, or directly in Web Intelligence.
Web Intelligence viewing modes
To switch between viewing modes
3
Property
cal records
zontal records
width
height
NotesWhere
configured
CMCMaximum verti-
CMCMaximum hori-
CMCMinimum page
CMCMinimum page
CMCRight padding
Performing on-report analysis with Web Intelligence 33

Web Intelligence viewing modes
3
To switch between viewing modes
Property
configured
CMCBottom padding
Vertical records
per page
Horizontal
records per
page
Other notes:
• Table headers and footers do not count as rows.
• Free standing cells and charts do not count as rows.
• Section cells do not count as rows when the section is not empty.
• Sections cells count as vertical rows when the section is empty.
• The Avoid Page Break in Block option has no effect in Quick Display
mode
Web Intelligence
Web Intelligence
NotesWhere
• Impacts horizontal tables and crosstabs only
• Horizontal tables are never cut vertically
• The number of rows in a horizontal table is
ignored in vertical records calculation
• Impacts vertical tables, forms and crosstabs
only
• The number of rows in a vertical table is ig-
nored in horizontal records calculation
To change Quick Display mode settings in Web Intelligence
You can change the number of horizontal and vertical records per page in
Quick Display mode in Web Intelligence.
1. In the Java Report Panel, set the Page Content > Vertical Records per
page and Page Content > Horizontal Records per page properties.
2. In Web Intelligence Interactive, right-click the report background, select
Format Report to display the "Format Report" dialog box, and set the
Number of vertical records per page and Number of horizontal
records per page in the General tab.
3. As a shortcut, vou can also use the icons on the Page Navigation toolbar
(Java Report Panel) or main toolbar (Web Intelligence Interactive) to
increase or decrease these settings by increments of 50.
34 Performing on-report analysis with Web Intelligence

To select Enhanced Viewing mode
Your administrator can define minimum page margins, headers and footers
that are applied only when you view reports onscreen. This means that the
maximum amount of information on report pages is visible when you view
reports via your computer screen. To apply the page definition set up by your
administrator you need to select Enhanced Viewing mode.
1. Select Document > Properties (in Web Intelligence Interactive) or
right-click a report and select Document Properties (in the Java Report
Panel).
2. Select Enhanced viewing mode.
Web Intelligence viewing modes
To switch between viewing modes
3
Performing on-report analysis with Web Intelligence 35

Web Intelligence viewing modes
To switch between viewing modes
3
36 Performing on-report analysis with Web Intelligence
Working with reports
4

Working with reports
4
Organizing reports
Organizing reports
To insert a new report
1. With a Web Intelligence document open, right-click the report tab of the
report after which you want to insert a new report.
The contextual menu appears.
2. Select Insert.
A blank report appears after the report you selected. Web Intelligence
numbers the report according to where it is located in the document.
To duplicate a report
1. With a Web Intelligence document open, right-click the report tab of the
report after which you want to insert a new report.
The contextual menu appears.
2. Select Duplicate.
Web Intelligence inserts a duplicate of the report into the document.
To move a report
1. With a Web Intelligence document open, right-click the report tab of the
report after which you want to insert a new report.
The contextual menu appears.
2. Select Move.
A sub-menu appears. You can select where you want to move the report
here.
3. Click the appropriate option.
• To move the report to the beginning of the document, click First.
• To move the report before the selected report, click Previous.
• To move the report after the selected report, click Next.
• To move the report to the end of the document, click Last.
38 Performing on-report analysis with Web Intelligence

To delete a report
1. With a Web Intelligence document open, right-click the report tab of the
report after which you want to insert a new report.
The contextual menu appears.
2. Select Remove.
To rename a report
1. Double-click the report tab and type the new report name on the report
tab, or:
2. Right-click an empty area of the report and click Format Report to display
the "Format Report" dialog box.
3. Type the report name in the Name box on the General tab, then click
OK.
Working with reports
Defining the page layout of reports
4
Defining the page layout of reports
To set report margins
1. Right-click an empty area of the report and click Format Report to display
the Format Report dialog box.
2. Click the Layout Properties tab
3. In the Margins section, type the measurement you want for the Top,
Bottom, Left and Right margins.
4. Click OK.
To set the page orientation of reports
1. Right-click an empty area of the report and click Format Report to display
the Format Report dialog box.
2. Click the Layout Properties tab.
Performing on-report analysis with Web Intelligence 39

Working with reports
4
Defining the page layout of reports
3. In the Orientation section, click the arrow next to the list box, and then
select Portrait or Landscape as appropriate:
4. Click OK.
To select the report paper size
1. Right-click an empty area of the report and click Format Report to display
the Format Report dialog box.
2. Click the Layout Properties tab.
3. In the Page size section, click the arrow next to the list box, and then
select the appropriate page size.
To include report page headers and footers
1. Right-click an empty area of the report and click Format Report to display
the Format Report dialog box.
2. Click the General tab.
3. To include a page header, select Show header, and then type the height
you want for the header into the text box.
4. To include a page header, select Show footer, and then type the height
you want for the footer into the text box.
5. To define a background color for the header or footer, click the arrow next
to Background color, and then either select a predefined color or click
More colors... to define a custom color, and then click OK.
6. Click OK.
To include report page numbers
1. To display the Document Properties pane, click the Show left pane
arrow at the top left of the report.
2. Click the arrow to the right of the drop-down list box, then select Chart
and Table Types.
3. Select the appropriate page number cell from the Page Number Cells
folder and drag it onto the report.
• To display the page number of the current report page (for example
1), select Page Number.
40 Performing on-report analysis with Web Intelligence

• To display the page number of the current report page over the total
number of pages in the report (for example 1/50), select Page
Number/Total Pages.
• To display the total number of pages in the current report (for example
50), select Total Number of Pages.
To add and format a report title
1. To display the Document Properties pane, click the Show left pane
arrow at the top left of the report.
2. Click the arrow to the right of the drop-down list box, then select Chart
and Table Types.
3. Select the Blank Cell format from the Formula and Text Cells folder
and drag it onto the area of the report page where you want to display
the report title.
The blank cell appears on the report
4. Right-click the cell and select Format > Cell .
The "Format Cells" dialog box appears.
Working with reports
Defining the page layout of reports
4
5. Click the General tab.
6. Type the title you want to give the report into the Name text box
7. In the Size section, specify the width and height of the report title cell and
select Wrap text, if you want to continue the title onto the next line.
8. To format how the text and cell background appears, click the Font tab,
and then select the appropriate settings.
9. To format how the borders around the page number cell appear, click the
Border tab, and then select the appropriate settings for borders.
You can apply the same colors and styles to all borders in the Setting
applied to all borders section. You can also apply specific colors and
styles to one or multiple borders using the options in the Settings per
border section.
10. To align the page number text on the cell, click the Alignment tab, and
then specify the appropriate horizontal and vertical alignment settings.
11. Click OK.
Performing on-report analysis with Web Intelligence 41

Working with reports
4
Including images in reports
To include cells with predefined or custom formulas in reports
1. To display the Document Properties pane, click the Show left pane
arrow at the top left of the report.
2. Click the arrow to the right of the drop-down list box, then select Chart
and Table Types.
3. Select the formula cell you want to include on the report from the Formula
and Text Cells folder and drag it onto the report.
The cell appears on the report with the predefined or custom formula.
Including images in reports
To select an image to display on a report background
1. Right click the report and select Format Report on the menu to display
the "Format Report" dialog box.
2. Click the Appearance tab.
3. Select Image from URL and type the URL to specify the image using a
URL.
4. Select Image from file, click Add then browse to the image to select an
image from the file system.
5. Click the arrow to the right of the Display drop-down list box, and then
select how you want the image to be displayed.
6. Align the image using the Position drop-down lists.
Note:
The availability of the lists depends on the option chosen in the Display
list.
7. Click OK.
Specifying an image URL
There are two ways to specify an image URL in Web Intelligence:
42 Performing on-report analysis with Web Intelligence

Working with reports
Including images in reports
• If the image file has been installed by your administrator in the images
directory on the BusinessObjects Enterprise server (located at <INSTALL
DIR>\Images), type boimg:// followed by the file name (for example,
boimg:// efashion_logo.gif).
• If the image file is located on another web server, type the URL (for
example, http://www.internal.businesscompany.com/images/com
pany_logo.gif).
To insert an image in a free-standing cell in a report
1. To display the Document Properties pane, click the Show left pane
arrow at the top left of the report.
2. Click the arrow to the right of the drop-down list box, then select Chart
and Table Types.
3. Select Blank Cell from the Formula and Text Cells folder and drag it
onto the report.
4. Right-click the cell and click Format > Cell to display the Format Cell
dialog box.
5. Click the Appearance tab.
6. Select Image from URL and type the URL to specify the image using a
URL.
7. Select Image from file, click Add then browse to the image to select an
image from the file system.
8. Click the arrow to the right of the Display drop-down list box, and then
select how you want the image to be displayed.
9. Align the image using the Position drop-down lists.
4
Note:
The availability of the lists depends on the option chosen in the Display
list.
10. Click OK.
Performing on-report analysis with Web Intelligence 43

Working with reports
4
Answering prompts
Image display options
DescriptionOption
Normal
Stretch (PDF only)
Tile
Note:
The size of the image is defined when the image is created. You cannot
modify the size of the image using Web Intelligence.
Answering prompts
Displays the image once at the top left
of the report, section, table, or cell.
Stretches the image over the entire report area.
Note:
this option is only applied when you
view or save the report as a PDF file.
Repeats the image vertically and horizontally.
Repeat the image horizontally across.Horizontal tile
Repeat the image vertically downward.Vertical tile
To enter values to answer a prompt
1. With a report in a Web Intelligence document open, click Refresh Data
on the right of the main toolbar above the report.
The "Prompts" dialog box appears.
2. Select a prompt question.
If the prompts are organized hierarchically in a tree, you need to select
the prompt at the lowest level of the hierarchy first. This type of prompt
is referred to as a cascading prompt.
44 Performing on-report analysis with Web Intelligence

Working with reports
Answering prompts
The values you can choose are listed in the pane on the lower left.
If the list of values is not available, click Refresh values to display it. The
list of values now appears together with the date on which it was last
refreshed.
If the prompt has been answered previously, the values selected the last
time appear in the prompt answer pane on the right. You can either leave
those values selected or use << to remove them.
The options you see when you answer prompts depend on (1) whether
this is the first time the results have been refreshed or not and (2) the
properties set for the prompts when they were created.
3. Select the values from the list of choices in the pane on the left, for which
you want to view results, or type the values into the text box, and click
the >> to add them to the prompt answer box on the right.
If you type multiple values, you need to separate each value with a
semi-colon (;). For example: Florida;Texas.
4. Click Run Query.
Web Intelligence retrieves the data for the values you specified, and
returns the results to the reports.
4
Note:
If the prompt is optional, click Run Query without supplying a value. Web
Intelligence ignores the prompt.
To enter dates to answer a prompt
1. With a report in a Web Intelligence document open, click Refresh Data
on the right of the main toolbar above the report.
The "Prompts" dialog box appears.
2. To select a date, click the arrow to the right of the text box, select a date
from the popup calendar, and then click >> to add the date you selected
to the list on the right.
If the prompt has been answered previously, the values selected the last
time appear in the prompt answer pane on the right. You can either leave
those values selected or use << to remove them.
3. If the prompt allows you to select multiple dates, and you want to view
results for more than one date, repeat the previous step.
Performing on-report analysis with Web Intelligence 45

Working with reports
4
Answering prompts
4. Click Run Query.
Web Intelligence retrieves the data for the values you specified, and
returns the results to the reports.
Note:
If the prompt is optional, click Run Query without supplying a value. Web
Intelligence ignores the prompt.
46 Performing on-report analysis with Web Intelligence

Merging dimensions from multiple data providers
5

Merging dimensions from multiple data providers
5
Merged dimensions defined
Merged dimensions defined
You can include multiple data providers in a Web Intelligence document.
You often need to synchronize the data returned by these data providers.
You do this by incorporating common dimensions into a merged dimension.
Merged dimensions and data synchronization were introduced in Web
Intelligence XI R2. They enormously increase the power and flexibility of
Web Intelligence by allowing you to synthesise data from different sources
in the same report, rather than simply including the data.
For example, if you have one database that contains detailed customer
information and another database that contains sales data, you can
synchronize the two data sources around the customer.
When to merge dimensions
You merge dimensions when your report draws related data from different
data providers. For example, you have a report showing revenue and sales
targets. The report contains sections based on the year, and each section
shows revenue and sales targets. If revenue and sales target data comes
from two different data providers, Web Intelligence does not know that it is
related. You tell Web Intelligence that the data is related by merging the two
data providers on the common dimension, year.
When you merge dimensions, Web Intelligence creates a new dimension
that contains all the values from the original dimensions that make up the
merged dimension. You use this dimension in reports as you use any other
report object. You can add report objects from all the data providers
synchronized through the merged dimension in the same block as the merged
dimension.
Choosing which dimensions to merge
The only restriction that Web Intelligence imposes on merged dimensions
is that they must be of the same data type: for example, character data. But
it does not make sense to merge unrelated dimensions even when their data
types are the same. For example, it does not make sense to merge a
48 Performing on-report analysis with Web Intelligence

Merging dimensions from multiple data providers
Creating, editing and deleting merged dimensions
dimension containing customer names with a dimension containing sales
regions.
Merged dimensions often have the same name in both data sources, but
this is not obligatory. It can make sense to merge dimensions with different
names if they contain related data.
To merge dimensions correctly you need to be aware of the semantics of
the data (what the data refers to) in the different data sources. The dimension
data types and names are an approximate guide only to dimensions’ suitability
for merging.
Creating, editing and deleting merged
dimensions
To merge dimensions in Web Intelligence
1. Select the group of dimensions from different data providers that you
want to merge in the Available Objects section of the Left Panel by holding
down the Ctrl key as you select the dimensions.
2. Click Merge at the top of the Left Panel.
5
Web Intelligence creates a merged dimension with the same name,
description, qualification and data type as the first dimension you selected.
The original dimensions that make up the merged dimension appear
beneath it when you expand the merged dimension.
If you select any of these original dimensions, Merge/Unmerge is
unavailable.
To merge dimensions automatically in Web Intelligence
You can set Web Intelligence to merge dimensions automatically under the
following circumstances:
• The dimensions have the same name
• The dimensions have the same data type
Performing on-report analysis with Web Intelligence 49

Merging dimensions from multiple data providers
5
Understanding the effects of merged dimensions
• The dimensions are in the same universe
1. With a Web Intelligence document open, click the arrow next to Document
on the main toolbar above the report.
2. Select Properties.
The "Document Properties" dialog box appears.
3. Select Auto-merge dimensions.
To edit a merged dimension in Web Intelligence
1. Right-click the merged dimension in the Available Objects section of the
Left Panel then select Edit Properties on the menu to display the "Create
Merged Dimension" dialog box.
2. Type the merged dimension name in the Merged Dimension Name in
the Merged Dimension dialog box.
3. Type the description in the "Description" box.
4. Select the dimension that provides default properties for the merged
dimension in the "Source Dimension" dialog box.
To delete a merged dimension in Web Intelligence
1. Select the merged dimension in the Available Objects section of the Left
Panel.
The Merge button at the top of the Left Panel becomes the Unmerge
button when you select a merged dimension.
2. Click Unmerge.
Understanding the effects of merged
dimensions
Data synchronization through merged dimensions adds enormous power to
Web Intelligence. Merged dimensions also have implications for the results
that Web Intelligence displays in certain situations. You need to understand
these implications to work effectively with merged dimensions and
synchronized data.
50 Performing on-report analysis with Web Intelligence
Merging dimensions from multiple data providers
Understanding the effects of merged dimensions
Synchronizing data providers with different aggregation levels
You can synchronize data providers with different aggregation levels. This
can have implications for the way in which Web Intelligence calculates
measures.
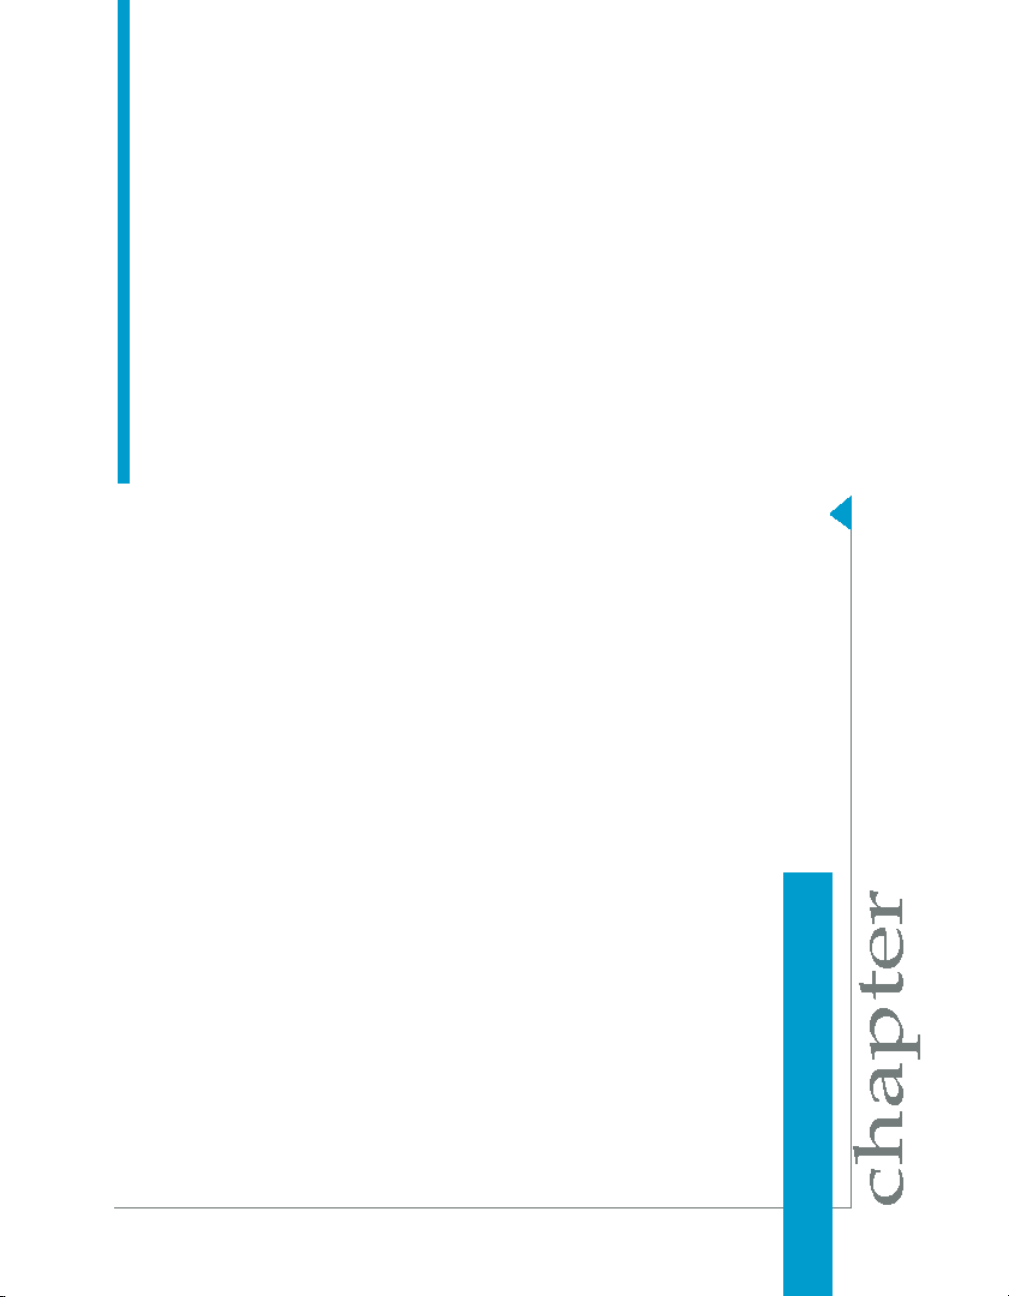
Example: Synchronizing data providers with different aggregation levels
In this example you have two data providers as follows:
RevenueYearCustomer
15002004Jones
20002005Jones
12002005Smith
5
Number of salesCustomer
12Jones
10Smith
If you merge the two data providers and the table properties Avoid
duplicate rows aggregation and Show rows with empty dimension
values are unchecked, Web Intelligence returns the following:
Number of salesRevenueYearCustomer
1215002004Jones
1212002005Jones
1012002005Smith
Performing on-report analysis with Web Intelligence 51

Merging dimensions from multiple data providers
5
Understanding the effects of merged dimensions
Web Intelligence cannot determine the number of sales per year for
customer Jones because the data provider that stores the number of sales
does not break them down by year. Web Intelligence therefore reproduces
the total number of sales on each row.
Note:
Although the Number of Sales values are duplicated, if you add a standard
calculation to the bottom of the column (for example a Sum or Average
calculation), the result is correct.
One way of adressing this issue is to add the dimensions to the second
data provider that allow Web Intelligence to calculate to the appropriate
level of data. If this is not possible, you must be aware of any situations
where Web Intelligence cannot aggregate the data to the necessary level
of detail.
Detail objects and merged dimensions
Detail objects are associated with dimensions and provide additional
information about the dimension.
Web Intelligence XI R2 requires a one-to-one relationship between
dimensions and details (this means that a detail object can have one value
only for each value of its associated dimension) and does not take detail
objects into account when synchronizing data. The following example
illustrates why this is necessary.
Previous versions of Web Intelligence, as well as Desktop Intelligence and
BusinessObjects, allow a one-to-many relationship between dimensions and
details. If you migrate a report created using any of these products and the
detail object contains multiple values, Web Intelligence places the
#MULTIVALUE error in the detail cell.
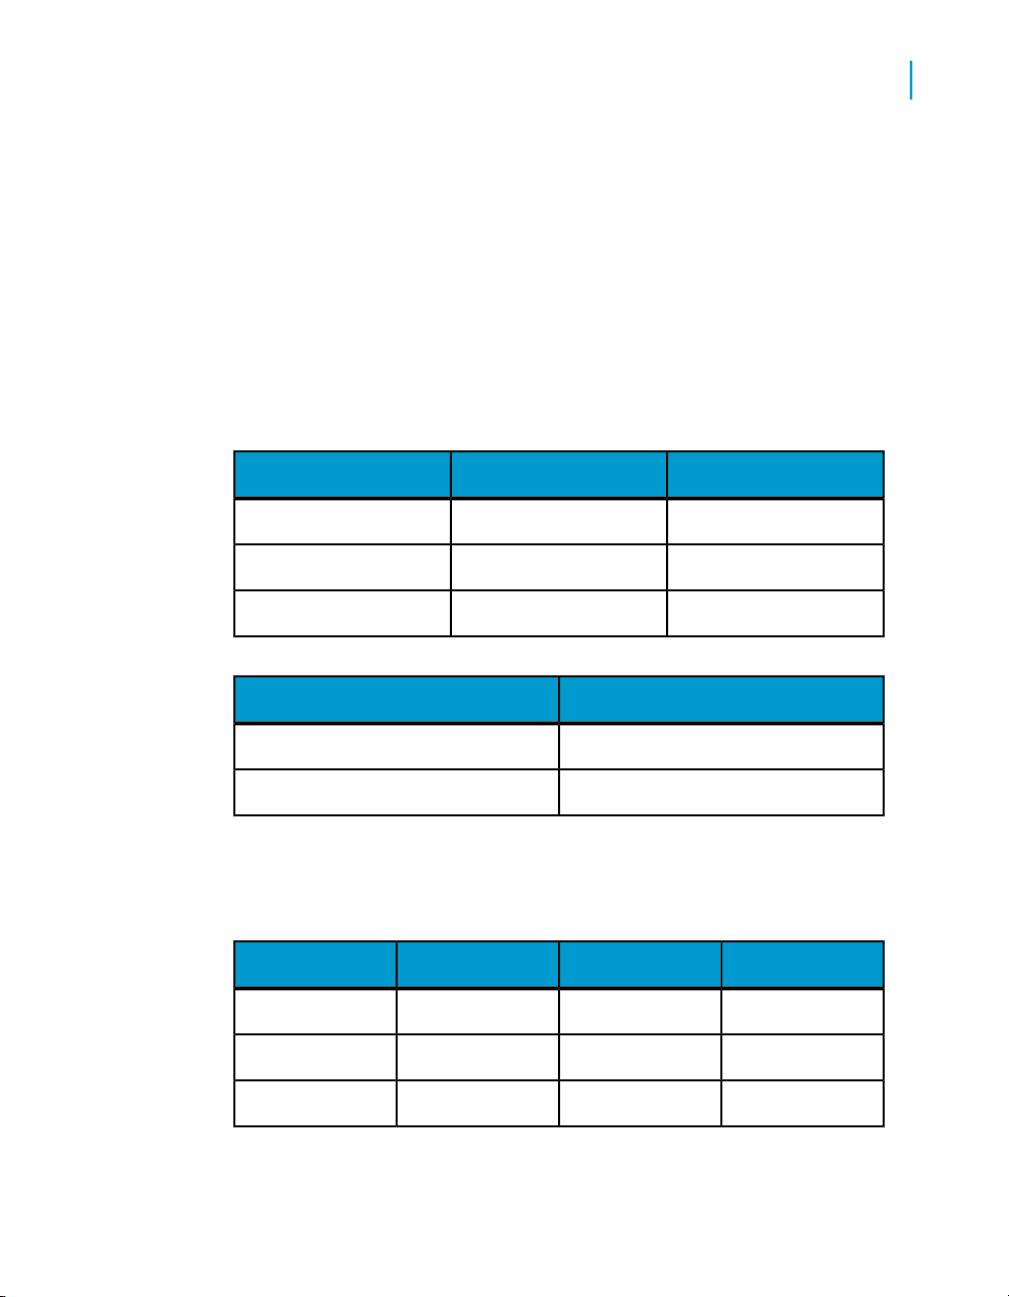
Example: Synchronizing data providers with detail objects
In this example you have two data providers, and [Address] is a detail object
related to [Customer]:
52 Performing on-report analysis with Web Intelligence
Merging dimensions from multiple data providers
Understanding the effects of merged dimensions
RevenueAddressCustomer
10000LondonJohn
15000LiverpoolPaul
Telephone NumberCustomer
1234John
5678Paul
If you create a merged Customer dimension to synchronize the data
providers, and Address can have more than one value for each customer,
the result is ambiguous because there is no common value around which
Web Intelligence can synchronize the data.
For example, Paul might have addresses in Liverpool and London, which
means that there is no unique ‘Paul’ row with which Web Intelligence can
synchronize Paul's telephone number. Paul has a different telephone
number for each address, and Web Intelligence does not know which
address to associate with the telephone number:
5
Telephone NumberAddressCustomer
1234LondonJohn
5678#MULTIVALUEPaul
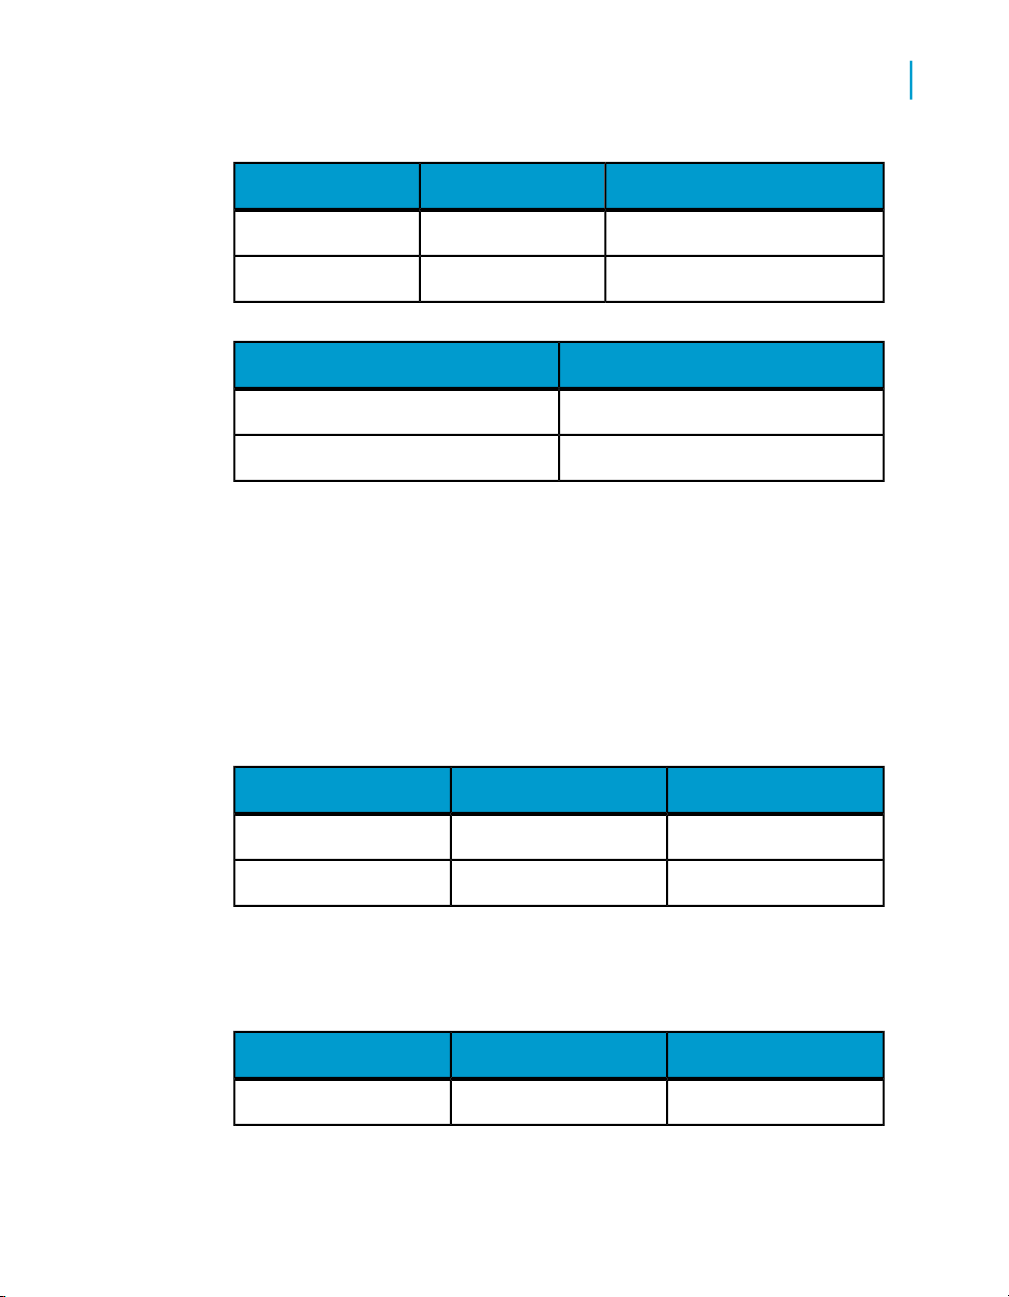
If the relationship between Customer and Address is one-to-one, Web
Intelligence can ignore Address in the synchronization. This removes the
ambiguity:
Telephone NumberAddressCustomer
1234LondonJohn
Performing on-report analysis with Web Intelligence 53

Merging dimensions from multiple data providers
5
Understanding the effects of merged dimensions
Telephone NumberAddressCustomer
5678LiverpoolPaul
Incompatible objects and merged dimensions
As a general rule, Web Intelligence does not allow you to place dimensions
from different data providers in the same table. This is to avoid Cartesian
products (the display of all possible combinations of values from unrelated
objects) or other ambiguous results, depending on the universe structure.
You can always place measures from different data providers in a table. Web
Intelligence calculates the measure depending on what dimensions are
available. For example, if you place a measure in a table that contains no
dimensions from the same data provider as the measure, Web Intelligence
displays its total value in the table.
You can place a merged dimension in a table as long as the table contains
other dimensions from a data provider that participates in the merge. You
can also place details from different data providers in a table, as long as the
details are associated with dimensions that participate in a merged dimension.
In certain situations, it can be valid to place a dimension from another data
provider in a table, even when Web Intelligence does not permit this. This
occurs when the incompatible dimension has a one-to-one or one-to many
relationship with a dimension already in the table. The important point is that
there is only one value of the incompatible dimension associated with the
dimension in the table (one-to-one). On the other hand, the same value of
the incompatible dimension can be associated with multiple values of the
dimension in the table (one-to-many).
In the table below, the relationship between Address and Name conforms
to these rules: Address has a one-to-one or one-to-many association with
Name. There is no one-to-many association in the other direction, between
Name and Address (one name with more than one address):
54 Performing on-report analysis with Web Intelligence

Merging dimensions from multiple data providers
Understanding the effects of merged dimensions
Incompatible dimension (Address)Dimension in table (Name)
LondonJohn
LondonPaul
LiverpoolGeorge
In this case the universe design is incorrect - the incompatible dimension
(Address) should be defined as a detail of the dimension in the table (Name).
If you encouter this situation, see your Business Objects administrator and
ask for a redesign of the universe.
If it is not practical to change the universe, create a variable at the report
level. Define this variable as a detail, associate it with the dimension in the
table, and supply the name of the incompatible dimension as the variable
definition. The variable simply returns the same values as the incompatible
dimension. Because it is defined as a detail of the dimension in the table,
Web Intelligence allows you to place it in the same table as the dimension.
5
Filtering merged dimensions
Merging dimensions has implications for the way in which Web Intelligence
applies filters.
Note:
You cannot apply a filter a on merged dimension. You apply filters on the
dimensions that make up the merged dimension.
Report filters and merged dimensions
When you apply a report filter to a dimension that is part of a merged
dimension, Web Intelligence applies the filter to all data providers that are
synchronized through the merged dimension.
Example: Filtering a merged dimension
In this example you have a report with the following data providers, which
are merged on the Country dimension
Performing on-report analysis with Web Intelligence 55
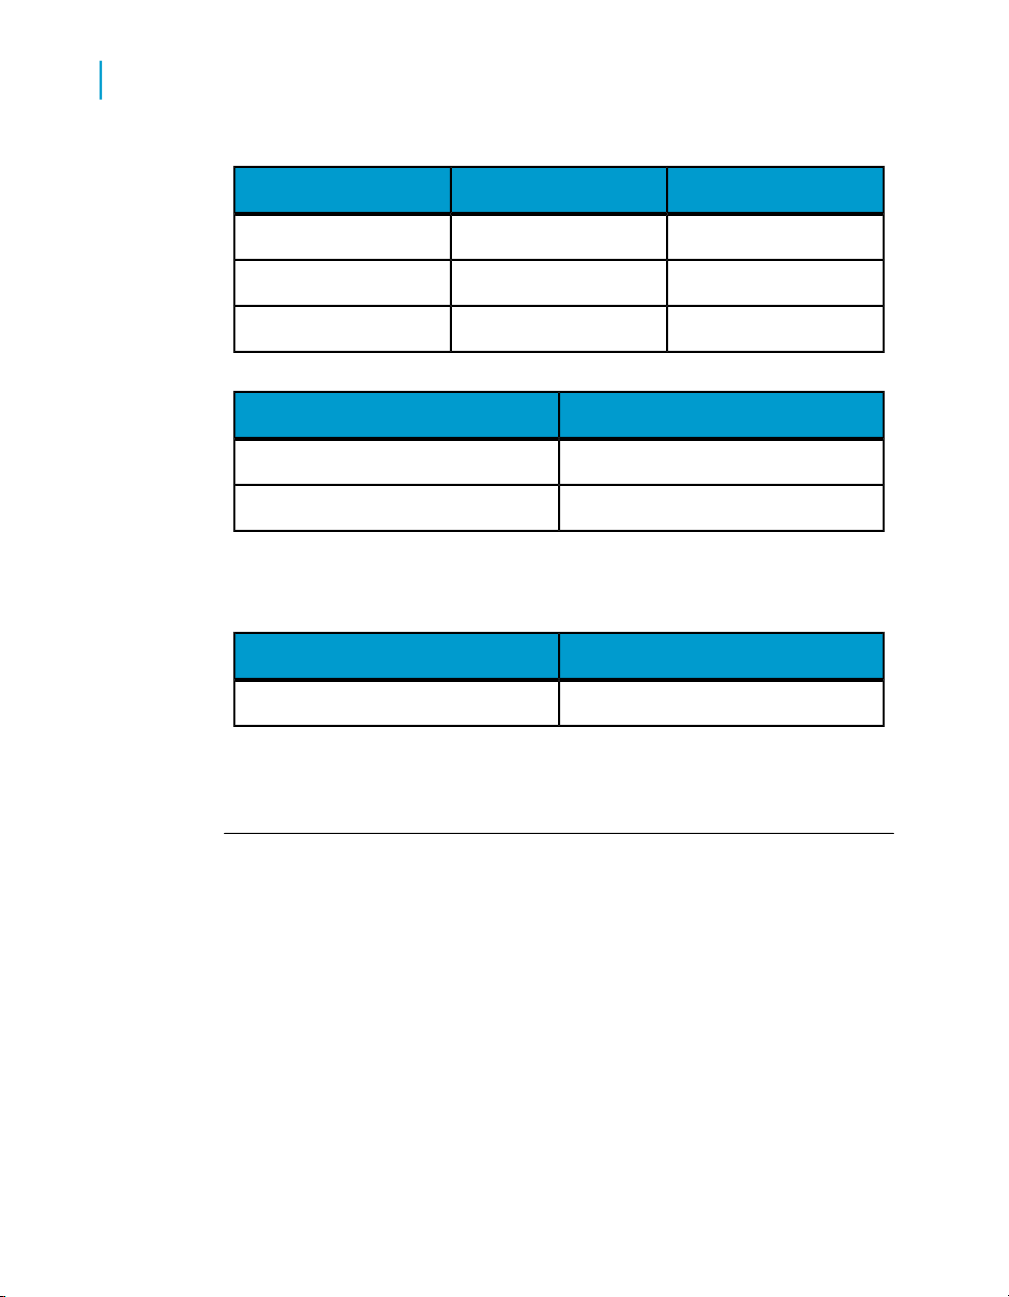
Merging dimensions from multiple data providers
5
Understanding the effects of merged dimensions
If you apply the filter Country=?US? to the first block, Web Intelligence
also filters the second block to give the following result:
RevenueResortCountry
835,420French RivieraFrance
971,444Bahamas BeachUS
1,479,660Hawaiian ClubUS
Future GuestsCountry
46France
56US
If the Country dimensions are not merged the second block is unaffected
by the filter.
Section filters and merged dimensions
When a dimension that is part of a merged dimension is set as a section
header, any filter applied to the section also applies to blocks from
synchronized data providers within the section.
Related Topics
• Filtering a merged dimension on page 55
56 Performing on-report analysis with Web Intelligence
Future GuestsCountry
56US

Merging dimensions from multiple data providers
Understanding the effects of merged dimensions
Block filters and merged dimensions
When you apply a block filter to a dimension that is part of a merged
dimension, Web Intelligence applies the filter to the block. Web Intelligence
does not apply the filter to other data providers synchronized through the
merged dimension.
Drilling on merged dimensions
When you merge dimensions, the new merged dimension belongs to the
hierarchies of all dimensions involved in the merge.
5
Performing on-report analysis with Web Intelligence 57

Merging dimensions from multiple data providers
Understanding the effects of merged dimensions
5
58 Performing on-report analysis with Web Intelligence

Filtering reports
6

Filtering reports
6
Report filters defined
Report filters defined
You can filter reports to limit the results that are displayed to specific
information that interests you. For example, you can limit the displayed results
to information for a specific customer or a sales period. The data you filter
out remains within the Web Intelligence document; it is simply not displayed
in the report tables or charts. This means you can change or remove report
filters in order to view the hidden values, without modifying the query definition
behind the document.
You can apply different filters to different parts of a report. For example, you
can limit the results in the entire report to a specific product line and then
limit results in a table or chart further to focus on results for a specific region
or customer profile.
To create a report filter, you need to specify three elements:
• a filtered object
• an operator
• a value(s)
You can include multiple filters in a report.
Types of report filter
There are three types of report filter in Web Intelligence:
• Standard report filters (available in all forms of Web Intelligence).
Standard report filters are the most flexible type of report filter. They can
use any filter operator and can filter on single values or lists of values.
• Quick filters (available in the Java Report Panel and Web Intelligence
Rich Client).
Quick filters provide an easy way to create filters using the Equal To
operator. They can filter on single values or lists of values.
• Simple report filters (available in the Web Intelligence HTML viewer, the
Java Report Panel and Web Intelligence Rich Client).
Simple report filters provide an easy way to create filters using the Equal
To operator. They can filter on single values only.
60 Performing on-report analysis with Web Intelligence

Filtering reports
Query filters and report filters compared
Query filters and report filters compared
You can apply filters at two levels within a document:
• query filters – these filters are defined on the query; they limit the data
retrieved from the data source and returned to the Web Intelligence
document.
• report filters – these filters limit the values displayed on reports, tables,
charts, sections within the document, but they don’t modify the data that
is retrieved from the data source; they simply hide values at the report
level.
Report filter operators
Equal To operator
Use the Equal to operator to obtain data equal to a value.
6
For example, to return data for the US only, create the filter "County Equal
To US".
Not Equal To operator
Use the Not Equal To operator to obtain data not equal to a value.
For example, to return data for all countries except the US create the filter
"County Not Equal To US".
Different From operator
Use the Different From operator to retrieve data different from a value.
For example, to retrieve data for all quarters execpt Q4, create the filter
[Quarter] Different From "Q4"
Performing on-report analysis with Web Intelligence 61

Filtering reports
6
Report filter operators
Greater Than operator
Use the Greater Than operator to retrieve data greater than a value.
For example, to retrieve data for customers aged over 60, create the filter
"[Customer Age] Greater than 60".
Greater Than Or Equal To operator
Use the Greater Than Or Equal To operator to retrieve data greater than or
equal to a value.
For example, to retrieve data for revenue starting from $1.5M, create the
filter "[Revenue] Greater than or equal to 1500000".
Less Than operator
Use the Less Than operator to retrieve data lower than a value.
For example, to retrieve data for exam grades lower than 40, create the filter
"[Exam Grade] Less Than 40".
Less Than Or Equal To operator
Use the Less Than Or Equal To operator to retrieve data less than or equal
to a value.
For example, to retrieve data for customers whose age is 30 or less, create
the filter "[Age] Less Than Or Equal To 30".
Between operator
Use the Between operator to retrieve data between and including two values.
62 Performing on-report analysis with Web Intelligence

For example, to retrieve data for weeks starting at week 25 and finishing at
36 (including week 25 and week 36), create the filter "[Week] Between 25
and 36".
Not Between operator
Use the Not Between operator to retrieve data outside the range of two
values.
For example; to retrieve data for all the weeks of the year, except for and
not including weeks 25 through 36, create the filter "[Week] Not between 25
and 36".
In List operator
Use the In List operator to retrieve data corresponding to values in a list of
values.
Filtering reports
Report filter operators
6
For example, to retrieve data for the US, UK and Japan only, create the filter
[Country] In List ("US";"UK";"Japan").
Not In List operator
Use the Not In List operator to retrieve data that does not correspond to
multiple values.
For example, if you do not want to retrieve data for the US, UK and Japan,
create the filter [Country] Not In ("US";"UK";"Japan").
Is Null operator
Use the Is Null operator to retrieve data for which there are no values in the
database.
For example, to retrieve customers without children (the children column in
the database has no value), create the filter [Children] Is Null.
Performing on-report analysis with Web Intelligence 63

Filtering reports
6
Creating, editing and deleting report filters
Is Not Null operator
Use the Is Not Null operator to return data for which there is a value in the
database.
For example, to return customers with children, create the filter [Children] Is
not Null.
Creating, editing and deleting report
filters
To create a report filter in Web Intelligence
1. Select the report element (for example a table or section) you want to
filter. To filter the entire report, click outside all tables, sections and charts.
2. Click the arrow to the right of the Filter button on the Reporting toolbar
and click Add Filter.
The "Filter" dialog box appears
3. Select the operator you wish to use in the filter from the drop-down list.
4. Select the values that you wish to use in the filter and click >> to add
them to the list of filter values
5. To remove a value from the filter, select the value in the list of filter values,
then click <<.
6. Click OK to close the dialog box and apply the report filter.
To view the report filters in a Web Intelligence report
1. Display the Document Structure and Filters pane by selecting Left
panel from the View menu then selecting Document Structure and
Filters at the bottom of the Left panel.
2. The Document Structure and Filters displays the overview of the filters
in the report.
64 Performing on-report analysis with Web Intelligence

Filtering reports
Creating, editing and deleting report filters
To edit a report filter in a Web Intelligence report
1. Display the Document Structure and Filters pane by selecting Left
panel from the View menu then selecting Document Structure and
Filters at the bottom of the Left panel.
2. Navigate to the filter in the Document Structure and Filters pane,
right-click it and select Edit Filter to display the Filter Editor.
3. Edit the filter using the Filter Editor.
To edit one dimension in a report filter in Web Intelligence
1. Display the Document Structure and Filters pane by selecting Left
panel from the View menu then selecting Document Structure and
Filters at the bottom of the Left panel.
2. Select the filtered dimension in the Document Structure and Filters
pane.
3. Click Edit.
The Filter Editor appears.
6
4. Use the Filter Editor to edit the filter.
To delete a report filter in Web Intelligence
1. Display the Document Structure and Filters overview by selecting Left
Panel from the View menu then selecting Document Structure and
Filters at the bottom of the Left Panel.
2. Select the filter you want to remove
3. Click Remove or right-click the filter and select Remove Filter.
You can also remove individual parts of the filter by selecting the
dimension, detail or measure individually then clicking Remove or clicking
the arrow to the right of Apply Filter on the Reporting toolbar, then
selecting Remove Filter.
Performing on-report analysis with Web Intelligence 65

Filtering reports
6
Creating, editing and deleting report filters
To create simple report filters
The Report Filter toolbar provides a quick method for adding simple report
filters to reports.
Simple report filters have the form <report_object>=<value>. They can
contain the "=" operator only and can filter on a single value only.
For more complex filters, use quick filters (which can contain the "=" or "Inlist"
operators) or standard report filters (which can contain any operator).
Note:
You also use the Report Filter toolbar when drilling on reports. In the context
of Drill, the Report Filter toolbar is known as the Drill toolbar.
1. Click Show/hide Report Filter toolbar on the main menu to display the
toolbar.
2. In Web Intelligence HTML, click the icon on the toolbar and select the
object on which you want to filter from the menu.
You can add multiple objects to the toolbar to create multiple filters.
3. In the Java Report Panel or Web Intelligence Rich Client, drag the object
on which you want to filter to the toolbar.
You can add multiple objects to the toolbar to create multiple filters.
4. Select the value on which you want to filter from the drop down list of
values.
Web Intelligence filters the report on the value of the object you selected.
For example, if you selected "US" from the list of values of the Country
object, Web Intelligence filters the report to exclude all rows where Country
does not have the value "US".
5. To remove a filter, select it and click Delete.
66 Performing on-report analysis with Web Intelligence

Filtering reports
Combining and nesting report filters
Combining and nesting report filters
The AND and OR operators
You use the AND and OR operators to combine and nest query filters or
report filters. When you use AND to combine filters, Web Intelligence displays
only the data that matches the criteria in both the filters linked by the operator.
When you use OR, Web Intelligence returns the data that matches the criteria
in either one of the filters linked by the operator.
You can mix the AND and OR operators when combining and nesting filters.
For example, you can link three filters in the relationship (Filter1 OR Filter2)
AND Filter3. In this case, Web Intelligence first restricts the data by the
conditions in either Filter1 or Filter2. Web Intelligence then compares this
data with the condition in Filter3 and returns only the data that corresponds
to this condition.
6
To combine report filters in Web Intelligence
1. Display the Document Structure and Filters overview by selecting Left
panel from the View menu then selecting Document Structure and
Filters from the drop down list at the top of the Left panel.
2. Select the table that you want to filter in the Document Structure and
Filters overview.
3. Click Add Filter.
The Filter Editor appears.
4. Select the dimension, detail or measure that you want to include in the
filter, then click >> or drag the filter to the Filter pane to add it to the filter.
5. To remove a dimension, detail or measure from the filter, select it in the
Filter pane, then click << or drag the dimension, detail or measure back
to the Available Objects pane.
6. Select the dimension, detail or measure in the Filter pane.
7. Select the operator that you want to use with the dimension, detail or
measure from the drop down list of operators.
Performing on-report analysis with Web Intelligence 67

Filtering reports
6
Combining and nesting report filters
8. Type the value or values that you want to associate with the operator or
click Values to display the Quick Filter dialog box that you use to select
the values by which to filter.
9. Click Update Filter.
The filter on the dimension, detail or measure is updated in the Filter
pane. For example, if you filtered the Country dimension to return only
those rows where the country is ‘US’, the text reads ‘Country Equal To
US’.
10. Repeat from step 4 for all dimensions, details and measures that you
want to include in the filter.
When you add multiple dimensions, details or measures, Web Intelligence
links them by default with the AND operator. To toggle between AND and
OR, double click the operator.
Related Topics
• The AND and OR operators on page 67
To nest report filters in Web Intelligence
When you nest filters you set up an order of precedence between them. Web
Intelligence executes the first filter in the order or precedence, then applies
subsequent filters. (Country = ‘US’ AND Resort = ‘Bahamas Beach’) OR
(Revenue > 500000) is an example of combined and nested filters. Web
Intelligence filters according to the nested filter Country = US AND Resort =
Bahamas Beach (which is also an example of a combined filter) then applies
this filter along with the combined filter Revenue > 500000.
1. Create the initial filter.
2. Select the dimension in the initial filter. (Select any of the dimensions or
operators in the initial filter if it is a combined filter.)
3. Click Add Nested Filter.
Web Intelligence adds a nested OR operator to the initial filter.
4. Select the OR operator.
5. Double click the OR operator to change it to AND if you want your nested
filter to be linked to the initial filter by an AND operator.
6. Select the dimension(s) that you want to appear in the nested filter and
click >>, or drag them to the right of the operator that links the nested
filter to the initial filter.
68 Performing on-report analysis with Web Intelligence

Filtering reports
Combining and nesting report filters
To change the order of nested report filters in Web Intelligence
1. Select a dimension, detail or measure in the filter.
2. Click Move up or Move down to change the place of the dimension,
detail or measure.
6
Performing on-report analysis with Web Intelligence 69

Filtering reports
Combining and nesting report filters
6
70 Performing on-report analysis with Web Intelligence

Drilling on report data
7

Drilling on report data
7
What is drill?
What is drill?
You use drill to analyze the results displayed in reports. Drilling on reports
lets you look deeper into your data to discover the details behind a good or
bad summary result displayed in tables, charts, or sections.
Example: Why did sales of accessories, outwear, and overcoats rise in
Q3?
You work for a US national fashion retail chain, and are in charge of sales
of accessories, outerwear and overcoat clothing lines in western states.
You see that revenue is much higher for Q3 than the other quarters.
To understand why, you drill down to look at the factors behind the result.
72 Performing on-report analysis with Web Intelligence
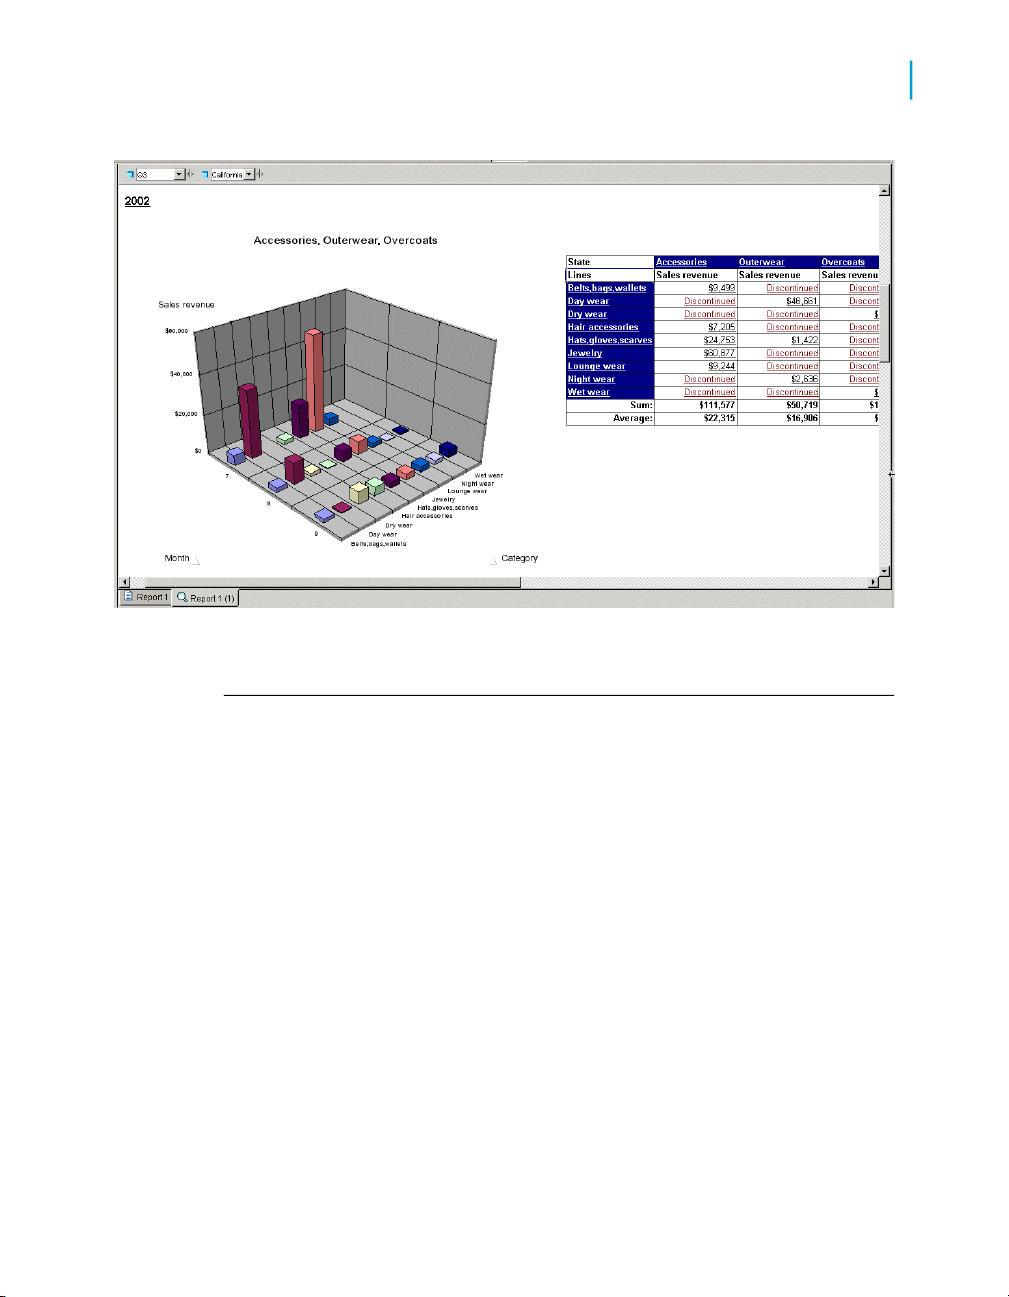
Drilling on report data
What is drill?
7
You see that jewelry sales escalated in July (month #7).
Scope of analysis
The scope of analysis for a query is extra data that you can retrieve from the
database to give more details on the results returned by each of the objects
in a query. This extra data does not appear in the initial result report, but it
remains available in the data cube, so you can pull this data in to the report
to allow you to access more detail at any time. This process of refining the
data to lower levels of detail is called drilling down on an object.
In the universe, the scope of analysis corresponds to the hierarchical levels
below the object selected for a query. For example, a scope of analysis of
one level down for the object Year, would include the object Quarter, which
appears immediately under Year.
You can set this level when you build a query. It allows objects lower down
the hierarchy to be included in the query, without them appearing in the
Results Objects pane. The hierarchies in a universe allow you to choose
your scope of analysis, and correspondingly the level of drill available.
Performing on-report analysis with Web Intelligence 73

Drilling on report data
7
What is drill?
In the Java Report Panel and in Web Intelligence Rich Client, you can also
create a custom scope of analysis by selecting specific dimensions for the
Scope of Analysis pane.
Note:
You cannot set the scope of analysis when working in query drill mode
because this drill mode causes Web Intelligence to modify the scope
dynamically in response to drill actions.
Levels of scope of analysis
You can set the following levels for scope of analysis:
None
• One level down
• Two levels down
• Three levels down
DescriptionLevel
Only the objects that appear in the
Results Objects pane are included in
the query.
For each object in the Result Objects
pane, one, two, or three objects lower
down the hierarchy tree are included
in the query. The data from these objects is stored in the cube until you add
them to the document.
Custom
Note:
This option is available in the Java
Report Panel and in Web Intelligence
Rich Client only.
Including a scope of analysis in a document increases the document size
significantly. This is because the data necessary for the scope you specify
is saved with the document, even though it is not visible in the reports unless
you start drill mode and drill down to the data to display the corresponding
values.
74 Performing on-report analysis with Web Intelligence
All objects added manually to the
Scope of Analysis panel are included
in the query.

In order to minimize the size of documents and optimize performance, we
recommend that you only include a scope of analysis in documents where
you are certain that users will need to drill.
We suggest the following method because it will be easier for you to set the
scope of analysis seeing the hierarchy of the classes and objects.
Drill paths and hierarchies
When you analyze data in drill mode, you move along a drill path. These
paths are based on the dimension hierarchies set by the designer of the
universe. Universe designers organize objects in classes in a hierarchy with
the most summary objects at the top and the most detailed at the bottom.
So if you want to make a high-level report, you know that your query should
include objects at the top of the list. If you want to see more detailed
information, you can then switch to Drill mode and drill down on each
dimension value displayed in the reports.
For example, if the data from [Quarter] did not sufficiently explain a result,
you could drill down to [Month] or [Week], depending on how the universe
designer set up the hierarchy. When you drill to a different level, measures,
such as a [Revenue] or [Margin], are recalculated accordingly.
Drilling on report data
What is drill?
7
Drill paths usually follow the same hierarchy order as the classes on a
universe. For example, a class called Time typically includes the [Year]
dimension at the top of the class, followed by the [Quarter], [Month], and
[Week] dimensions. The hierarchies for drill within the Time hierarchy typically
follow the same order, because users want to drill annual results to analyze
details for quarter, month, and so on. However, the universe designer can
also define custom hierarchies.
Note:
A dimension can belong to several hierarchies. When you drill a result on a
dimension that belongs to more than one hierarchy, Web Intelligence prompts
you to select the drill path.
To view drill hierarchies
1. Open a document in Edit mode.
2. Verify you are in Query View.
Performing on-report analysis with Web Intelligence 75

Drilling on report data
7
To start and end drill mode in Web Intelligence
3. Click the Data tab.
4. Click the Hierarchies radio button.
To start and end drill mode in Web
Intelligence
1. Click Drill on the main toolbar.
A hyperlink appears on each drillable result.
2. Click Drill again to end drill mode.
Retrieving more levels of data to the report
When you are drilling a Web Intelligence report, you may want to drill up or
down to a dimension that lies outside the scope of analysis defined for the
document. To return the additional data, Web Intelligence must run a new
query that includes the additional dimension(s) you specify. This is called
extending the scope of analysis.
You can extend the scope of analysis during your drill sessions only if your
security profile allows you to do so. Your security profile is controlled by your
BusinessObjects Enterprise administrator.
If your Drill options are not set to display the Extend the Scope of Analysis
prompt message during drill, you will not be given the option to select filters
if you drill beyond the data already available in the document. In this case,
Web Intelligence immediately runs a new query and returns data for all the
values on the dimensions you are drilling.
To drill out of the scope of analysis
1. Hold your mouse cursor over a dimension value that is at the end of the
scope of analysis.
A ToolTip informs you that a new query is necessary to return the
additional data to the document.
2. Drill on the dimension.
76 Performing on-report analysis with Web Intelligence

Drilling on report data
To choose a drill path when more than one is available
If your Drill options are set for Web Intelligence to prompt you when a
drill action requires a new query, the Extend the Scope of Analysis dialog
box appears.
The dialog box lists the dimensions in the hierarchy above and below the
drilled value. The dimensions already included in the document are
checked. The dialog box also displays the filters that you can select to
filter the new query.
3. Select the check boxes next to the dimensions you want to drill.
4. Select the check boxes next to the filters you want to use to filter the
query.
5. Click OK.
Web Intelligence runs a new query and returns the additional data to the
document and the results for the dimension you drilled to appear on the
table.
To choose a drill path when more than
one is available
7
A dimension can belong to multiple hierarchies. When you drill down on such
a dimension value, Web Intelligence does not know which drill path to follow.
You must define the drill path.
Note:
If the dimension value you choose to drill on is the result of a previous drill,
the drill path is already known. Therefore you do not need to select a drill
path.
1. Drill on the dimension.
The "Select Drill Path" dialog box appears. The dialog box lists the
dimensions in the hierarchy above and below the drilled value. A check
box appears next to each dimensions below the current dimension you
are drilling, so that you can select which of these dimensions you want
to retrieve from the database, in order to continue your drill action. The
dialog box also displays the filters that you can select to filter the new
query.
2. Select the path you want to drill.
3. Click OK.
Performing on-report analysis with Web Intelligence 77

Drilling on report data
7
Drilling on dimensions in tables and sections
Drilling on dimensions in tables and
sections
Dimensions typically represent character-type data, such as customer or
business names, and dates. Web Intelligence makes calculations based on
the dimensions in a report. For example, if you create a report that calculates
a region’s total sales revenue for a given year, Web Intelligence calculates
the [Sales revenue] measure based on the two dimensions: [State] and
[Year].
When you drill on a dimension to see the more data behind the displayed
result, the sales revenue is calculated according to the values to which you
drill. If you drill on [Year] in the above example, Web Intelligence calculates
and displays sales revenue by state and quarter, because [Quarter] is the
next dimension in the time hierarchy below [Year].
Note:
You cannot drill on detail objects.
Drilling down
You drill down to see the lower-level data that makes up the summary results
displayed on reports. This helps explain why high or low results occurred.
Example: Using drill analysis to find out why sales decreased dramatically
in 2003
In this example, you receive a report that shows sales revenue results for
the accessories line at the eFashion retail store. The following crosstab
shows that the Accessories line decreased in 2003.
To analyze more precisely when the decrease occurred, you drill down on
the cell value 2003, to view the detailed data for each quarter.
78 Performing on-report analysis with Web Intelligence

Drilling on report data
Drilling on dimensions in tables and sections
When you drill down on the cell value 2003, a filter appears in the Drill
toolbar to show that the quarterly values you have drilled to are filtered for
the year 2003. The drilled chart clearly shows that the problem arose in Q4
of 2003.
To find out which of the of the categories within the Accessories line was
responsible for the drop in revenue, you drill down again on the cell value
Accessories.
7
The drilled crosstab shows which categories were responsible for low
revenue in Q4.
Note:
If you try to drill to a dimension that is already displayed in another column or
row of the same table, Web Intelligence automatically displays the next available
dimension in the drill path.
Performing on-report analysis with Web Intelligence 79

Drilling on report data
7
Drilling on dimensions in tables and sections
To drill down on a dimension value in a table or section cell
1. Verify you are in Drill mode
2. On a table or section cell, place your pointer over the dimension value
on which you want to drill.
A ToolTip appears, showing the next dimension in the drill path. If the
drilled report includes dimensions from multiple data providers, the ToolTip
displays the name of the query and the dimension for the value.
3. Click the value.
The drilled table or section displays data one dimension level down. The
Drill toolbar, at the top of the report, displays the values from which you
drilled. These values filter the values displayed on the drilled table.
Drilling up
You drill up on a dimension value to see how the more detailed data
aggregates to a higher-level result. For example, you may have drilled down
on Year to examine data for each quarter. If you want to see how this data
aggregates to yearly results, you can drill up.
When you drill up on a dimension value, you move along the drill path from
lower- to higher-level data. For example, you may have drilled down on [Year]
to [Quarter]. If you drill up on [Quarter], you return to [Year].
You can only drill up on a dimension value if you have previously drilled down
to that dimension, or you have defined the appropriate drill path in the scope
of analysis.
To drill up on a dimension value
1. Verify you are in Drill mode.
2. On a table or section cell, right-click the dimension value on which you
want to drill up, then on the shortcut menu click Drill up , or click the Drill
Up icon next to the dimension value you want to drill up.
If the table is a crosstab without headers that display the names of the
dimensions on the table, then the Drill Up icon appears next to each value
from which you can drill up.
80 Performing on-report analysis with Web Intelligence

Drilling by
When you drill down or up, you move through a hierarchy one dimension at
a time. However, you can get another view of the data by slicing it in a
different way, and then look at the data in other hierarchies. To do this, you
drill by the other dimensions that interest you.
Note:
You can only Drill by to a dimension that is included in the scope of analysis
of the document.
Example: Drilling by the Products hierarchy to slice sales revenue results
by product
You work as regional manager for California in a retail clothing store, and
have been sent the following report that shows quarterly sales revenue by
state:
Drilling on report data
Drilling on dimensions in tables and sections
The report now displays data one dimension level up. The filters that
filtered the value you drilled up from, are removed from the Drill toolbar.
7
You are only interested in analyzing the results in the state of California.
In addition, you want to analyze the sales revenue broken down by each
product line you sell. To drill on California data, you place your pointer on
the table cell that says California.
Performing on-report analysis with Web Intelligence 81
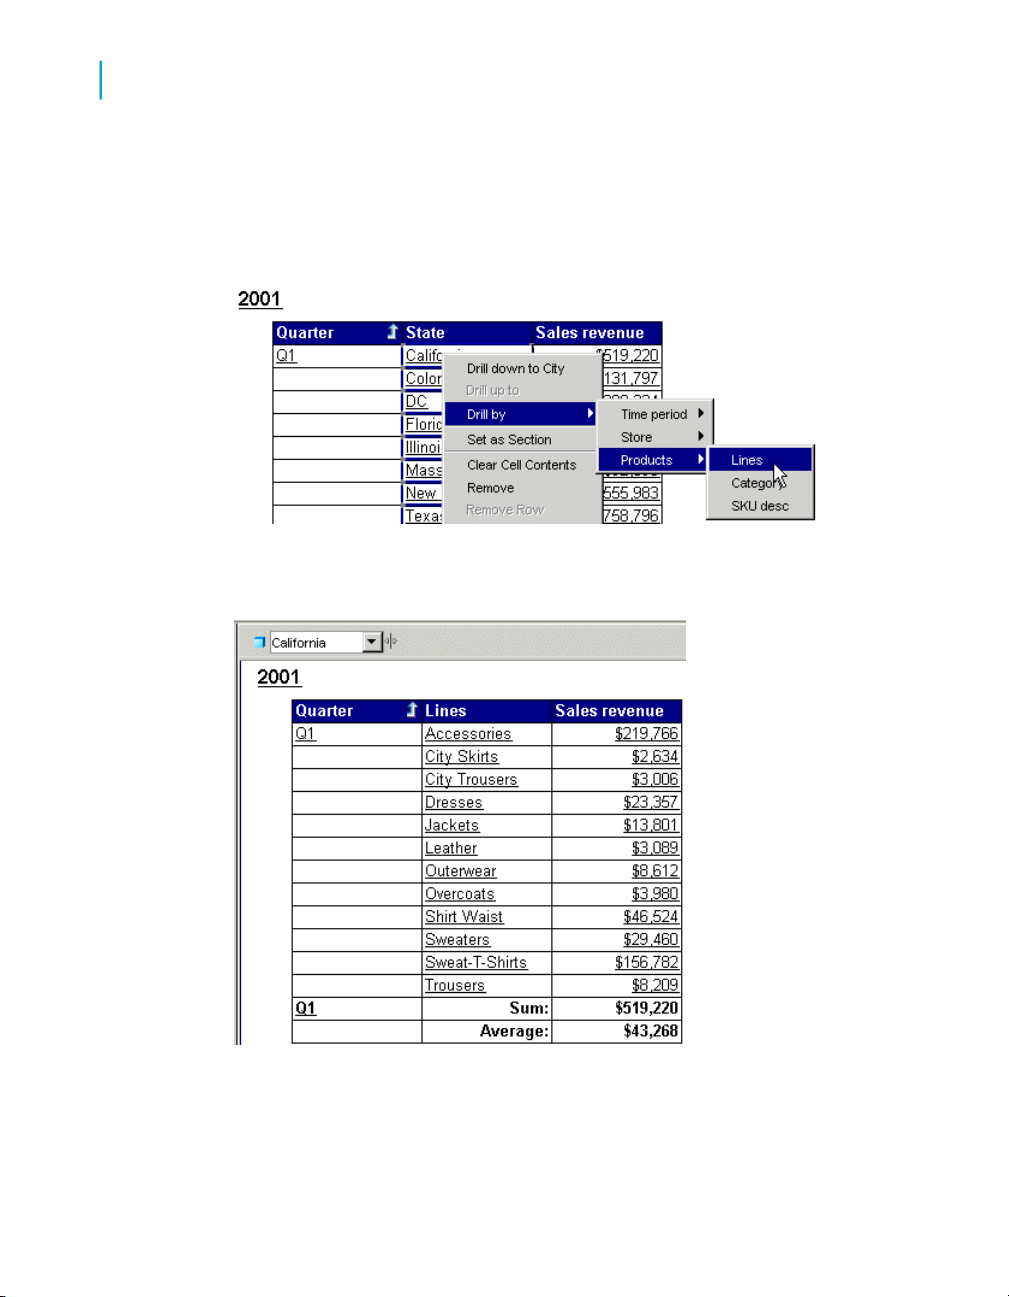
Drilling on report data
7
Drilling on dimensions in tables and sections
If you drilled down now, however, you would drill to results for each city
within California, because [City] is the dimension below [State]. Instead,
you select Drill by from the drill menu and then you navigate through the
dimensions on the Products hierarchy by selecting the sub-menus until you
reach the [Lines] dimension.
The drilled report displays the detailed sales revenue results for each
product line sold in California.
82 Performing on-report analysis with Web Intelligence

Drilling on report data
Drilling on measures in tables and sections
To drill by a dimension value
1. Verify you are in Drill mode.
2. On a table or section cell, right-click the dimension value you want to drill
by.
A shortcut menu appears, displaying the available drill paths.
3. Place your pointer on Drill by, then on the class to which you want to
drill.
4. Click the dimension to which you want to drill.
The report now displays data for the dimension to which you drilled.
Drilling on measures in tables and
sections
7
When you drill on a measure value, Web Intelligence performs the drill action
one level down for each related dimension in the block and displays the new
measure calculation for the displayed dimensions.
Example: Drill on annual sales revenue results to see the breakdown by
city and quarter
For example, you drill down on the year 2003 sales revenue value for
California, which is displayed on a crosstab that shows sales revenue by
year in by state.
The drilled report displays sales revenue by quarter by city for California –
the state on which you drilled.
To drill down on a measure value
1. Verify you are in Drill mode.
2. Place your pointer over the measure value on which you want to drill.
Performing on-report analysis with Web Intelligence 83

Drilling on report data
7
Synchronizing drill across multiple tables and charts
A ToolTip appears, displaying the next dimension(s) in each related drill
path
3. Click the measure value.
Your report now displays data one dimension level down. The table
headers display the names of the dimensions you drilled to and the drill
up arrow, which indicates you can drill back up to the summary results if
wished. The Drill toolbar displays the values that filter the results displayed
on the drilled table or section.
To drill up on a measure value
1. Verify you are in Drill mode.
2. Right-click the measure value on which you want to drill up, then click the
Drill up option on the shortcut menu, or click the Drill Up icon next to the
measure value you want to analyze.
The drilled table now displays data one dimension level up.
Synchronizing drill across multiple tables
and charts
A Web Intelligence report can contain several tables or charts. The generic
term used to refer to tables and charts in this guide is a block. There are two
ways to drill on a report with multiple blocks:
• drill simultaneously on each block in the report the contains the drilled
dimension
• drill on only the current block of data
You set how Web Intelligence performs drill on reports with the Synchronize
drill on report blocks option.
If you set Web Intelligence to synchronize drilling across a report, you drill
on each block in the report containing that drilled dimension. The next
dimension in the drill path replaces the previous dimension in all blocks of
the report.
If you set Web Intelligence not to synchronize drilling on all blocks in a report,
the next dimension in the drill path replaces the previous dimension only in
the current block of the report.
84 Performing on-report analysis with Web Intelligence

Related Topics
• Synchronize drill on report blocks option on page 26
Drilling on charts
Drilling down, up, or by on a chart, provides you with a graphical explanation
for why summary results are particularly high or low.
You can drill on:
• dimensions – by drilling on chart axes
• dimensions – by drilling on the chart legend
• measures – by drilling on the data bars or markers in the body of the chart
You cannot Drill by dimensions on chart axes. However, you can Drill by
dimensions on chart legends.
Related Topics
• Drilling on axis legends on page 89
Drilling on report data
Drilling on charts
7
Drilling on dimensions via chart axes
On 2D charts, you can drill on dimensions via the X-Axis. On 3D charts, you
can drill on dimensions via the X-Axis and the Z-Axis. Charts can contain
one or multiple dimensions on a single axis. When an axis contains multiple
dimensions, each possible combination of the dimension values appear on
the axis (this is sometimes referred to as a cartesian product).
In the 2D bar chart illustrated below, the X-axis includes the [Year] and
[Quarter] dimensions. Each bar on the chart shows the values for one
combination of year and quarter; for example, 2001/Q1, 2001/Q2, and so
on.
Performing on-report analysis with Web Intelligence 85

Drilling on report data
7
Drilling on charts
When you drill on an axis value with multiple dimensions, the drilled results
are filtered by both dimensions. For example, in the chart illustrated above,
if you drill down on 2001/Q1 to the next level of data for [Month], the results
displayed on the drilled chart are those for the months in Q1 of 2001.
To drill on a chart axis
1. Verify you are in Drill mode.
2. Place your pointer over the dimension value on which you want to drill.
3. If you want to drill down on the dimension value, click the value. If you
want to drill up on the dimension value, right-click the value then select
Drill Up. If you want to drill down on the dimension value, right-click the
value then select Drill Down. If you want to drill by the dimension value,
right-click the value then select Drill By
Note:
Drill by is not available if the axis has multiple dimensions.
Drilling on measures in charts
You can drill on the measures displayed on the following types of chart:
• bar charts – by drilling on the bars
• line and radar line charts – by drilling on the data markers
86 Performing on-report analysis with Web Intelligence

Drilling on report data
Drilling on charts
• pie chart – by drilling on the segments
When you drill on measures, Web Intelligence performs the drill action on
each dimension displayed on the chart axes. The new measure calculations
displayed on the bars or data markers on the drilled chart, correspond to the
lower- or higher-level dimensions to which you drilled. The chart axis labels
display the names of the drilled dimensions.
Example: Analyze detailed information for the sales revenue measure on
a chart
For example, this 3D bar chart displays values for the [State] dimension on
the X-Axis and displays values for the [Lines] dimension on the Z-Axis. This
means that the chart bars display values for sales revenue per state per
line.
7
As the example below shows, when you drill down on the bar for “City
Trousers? in “California? you also drill down from [State] to [City] on the
X-Axis and from [Lines] to [Category] on the Y-Axis.
The drilled chart displays sales revenue per city per category for the “City
Trousers? clothing line.
Performing on-report analysis with Web Intelligence 87

Drilling on report data
7
Drilling on charts
To drill on a measure in a chart
1. Verify you are in Drill mode.
2. Place your pointer on the measure value on which you want to drill.
On charts, each measure is represented by a bar (on bar charts) or by a
data marker (on a line charts and radar line charts).
3. If you want to drill down on the measure value, click the bar or data
marker. If you want to drill up on the measure value, right-click the bar or
data marker, and then click Drill up.
Limitations when drilling measures on charts
When you drill on charts that are not bar charts, Web Intelligence may perform
the drill action only on certain dimensions instead of performing the drill action
on all of the dimensions on the chart axes. When you drill on measures in
the following chart types, Web Intelligence only performs the drill action on
the values in the axis legend:
• area charts – 2D, 3D, and stacked
• radar and scatter charts – all types
Note:
You cannot drill on measures in 3D surface charts.
88 Performing on-report analysis with Web Intelligence

Drilling on axis legends
You can drill on charts via the chart legend whenever the legend lists the
dimensions displayed on the chart. When the chart legend lists the measures
displayed on the chart, drilling on the legend is not possible.
Drilling on a legend is useful, if you are working with a pie chart, because
the axis labels, which display the names of the dimensions represented by
each pie segment, are not often displayed.
Note:
You can only Drill by on a chart legend, if there is a single dimension on the
axis.
To drill on an axis legend
1. Verify you are in Drill mode.
2. Place your pointer over the value on which you want to drill.
3. To drill down the dimension value, click the color associated with the
value. To drill up the dimension value, right-click the color associated with
the value, then click Drill up ; or click the Drill Up icon. To drill by the
dimension value, right-click the color associated with the value, then click
Drill by .
Drilling on report data
Using filters when you drill
7
Using filters when you drill
When you drill on a dimension or measure value in a table or chart, Web
Intelligence filters the drilled results by the dimension or measure you drilled
on. The filter is applied to all of the results displayed on the drilled report.
Filters appear as list boxes in the Drill toolbar. Each list box contains the
values associated with that filter. You select the data displayed in a table or
chart by choosing the appropriate values from the list boxes.
Note:
You can also use the Drill toolbar outside Drill mode to quickly add simple
report filters to reports. In this context the toolbar is known as the Report
Filter toolbar.
Performing on-report analysis with Web Intelligence 89

Drilling on report data
7
Using filters when you drill
Example: Filtering drilled reports by different US states
For example, if you drill down on a table cell displaying “California,? to
view results for cities in California, Web Intelligence filters the values in the
entire report for California and only displays results for California in the
report.
By changing the value of each filter, you can then see data for other values
on the drilled dimension. For example, you can select Colorado in the filter
on State.
Note:
If the drilled report includes dimensions from multiple data providers, a ToolTip
appears when you rest your cursor on the value displayed on the filter. The
ToolTip displays the name of the query and the dimension for the value.
Related Topics
• To create simple report filters on page 66
To change a filter value on the Drill toolbar
1. Verify you are in Drill mode.
2. In the Drill toolbar, click the drop-down arrow relating to the dimension
you want to filter.
3. Click the value you want.
To add or remove a drill filter
1. Verify you are in Drill mode.
2. Drag the dimension containing the values around which you want to filter
your report and drop it onto the Drill toolbar.
A list box for the new filter appears on the Drill toolbar. You can select a
value from the list of values to filter the results displayed on the drilled
table, chart, or report.
3. To remove a drill filter, drag the dimension away from the Drill toolbar.
90 Performing on-report analysis with Web Intelligence

Drilling on report data
Saving reports with drill filters
Saving reports with drill filters
When you save a document with reports in drill mode, Web Intelligence
maintains any filters that have been generated during drill. When you open
a document saved in drill mode, Web Intelligence displays the Drill toolbar
on the drilled reports showing the filters generated during the last drill session.
Note:
Documents saved in drill mode take longer to open than documents saved
in results mode.
Refreshing data in a drilled report with prompts
Some Web Intelligence reports contain prompts. When you refresh the
document, the prompt(s) require(s) you to specify the value(s) you want to
retrieve from the database and return to the report(s) in the document. For
example, a prompt can require you to specify a year, for which you want to
retrieve data. This drilled report shows values for Year 2003 – the year
selected for the prompt.
7
If the drilled report is filtered for Year 2003, and you then refresh the document
and select year 2002 to answer the prompt, Web Intelligence retrieves results
for 2002 instead of 2003. The drilled report then displays values for 2002.
Drilling with query drill
Query drill defined
You can set Web Intelligence to drill in query drill mode, which behaves
differently from the standard drill mode described so far in this chapter. When
you activate query drill, Web Intelligence drills by modifying the underlying
query (adding and removing dimensions and query filters) in addition to
applying drill filters.
Performing on-report analysis with Web Intelligence 91

Drilling on report data
7
Drilling with query drill
Example: Drilling down from month to week
In this example, Month is the lowest dimension currently available in the
query from a time hierarchy, and Week is the dimension immediately below
it in the hierarchy.
If you drill down on Month = January, three things happen:
• Web Intelligence adds Week to the query scope of analysis.
• Web Intelligence adds a query filter to restrict Month to January.
• Web Intelligence adds a drill filter to restrict Month to January.
If you drill up from Week to Month, the process is reversed:
• Web Intelligence removes Week from the query scope of analysis.
• Web Intelligence removes the query filter.
• Web Intelligence removes the drill filter.
Note:
Drill filters are not strictly necessary in query drill mode. Web Intelligence applies
them for consistency with standard drill mode. For example, the DrillFilters
function returns the correct value in query drill mode because Web Intelligence
applies drill filters to match the query filters.
When do you use query drill?
You use query drill when your report contains aggregate measures calculated
at the database level. It is designed in particular to provide a drill mode
adapted to databases such as Oracle 9i OLAP, which contain aggregate
functions that Web Intelligence either does not support, or cannot calculate
accurately at the report level during a drill session.
The kinds of aggregate functions that are candidates for drilling in query drill
mode are: percentages, distinct counts, ranks, standard deviations and
variances, running aggregates, lead and lag functions. Because query drill
modifies the query at each drill operation, it ensures that these aggregates
are recalculated by the server each time you drill.
Query drill is also useful for reducing the amount of data that Web Intelligence
must store locally during a drill session. Because query drill reduces the
scope of analysis when you drill up, Web Intelligence is able to purge
unecessary data.
92 Performing on-report analysis with Web Intelligence

To activate query drill in Web Intelligence
1. Click Document > Properties on the main toolbar to display the
"Document Properties" dialog box.
2. Select Use query drill.
Drilling down with query drill
When you drill down, query drill behaves similarly to standard drill at the
point where the data moves outside the scope of analysis.
When Web Intelligence filters a drilled dimension in query drill mode it does
so by adding a query filter in addition to a drill filter. For example, if you drill
on Year=2001, Web Intelligence adds a filter at the query level to restrict the
Year dimension to 2001. For this reason, the only value that appears in the
drill toolbar for the drilled dimension is the value on which you drilled (in this
case 2001). This is different from standard drill mode, in which all values of
the dimension are visible in the toolbar. As a result, you cannot change filter
values in query drill mode (for example, drill on Year=2001 then switch to
Year=2003) as you can in standard drill mode.
Drilling on report data
Drilling with query drill
7
Because query drill automatically extends the scope of analysis, you can
use it only if your BusinessObjects XI administrator has granted you the the
right to drill outside the scope. See your administrator for more details.
Drilling up with query drill
When you drill up, query drill removes dimensions from the query. For
example, if you drill up from Month to Quarter, Web Intelligence removes
Month from the query. This has two consequences:
• Query drill is incompatible with drill snapshots.
• Web Intelligence does not allow you to drill up beyond any dimension
that appears as one of the report objects. For example, if your report
displays Year, Quarter and Revenue, you cannot drill up from Quarter to
Year because this would remove quarter from the list of report objects.
Performing on-report analysis with Web Intelligence 93

Drilling on report data
7
Drilling with query drill
Related Topics
• Query drill and drill snapshots on page 94
Query drill and drill snapshots
Do not use drill snapshots when working in query drill mode, because query
drill means that snapshots cannot be guaranteed to stay the same.
In query drill mode, snapshots change when you drill up beyond a dimension
that you included in a snapshot. Because the drill up removes the dimension
from the underlying query, it also removes the dimension from the snapshot.
Query drill and other reports based on the same data provider
If your document contains other reports that contain dimensions on which
you drill in query drill mode, these reports are affected because the query
drill modifies the dimensions they contain.
You can avoid this (at the cost of retrieving duplicate data into Web
Intelligence) by creating a new data provider and rebuilding the other report
against it. Now when you drill in query drill mode, the other report remains
unaffected.
Example: Drilling on a dimension that appears in another report
If you have two reports based on a query that contains Year, Quarter and
Sales Revenue, and you use query drill to drill down to Year = 2001 on the
first report, Web Intelligence also filters the data for Year in the second
report to include 2001 only.
94 Performing on-report analysis with Web Intelligence

Displaying data in tables
8
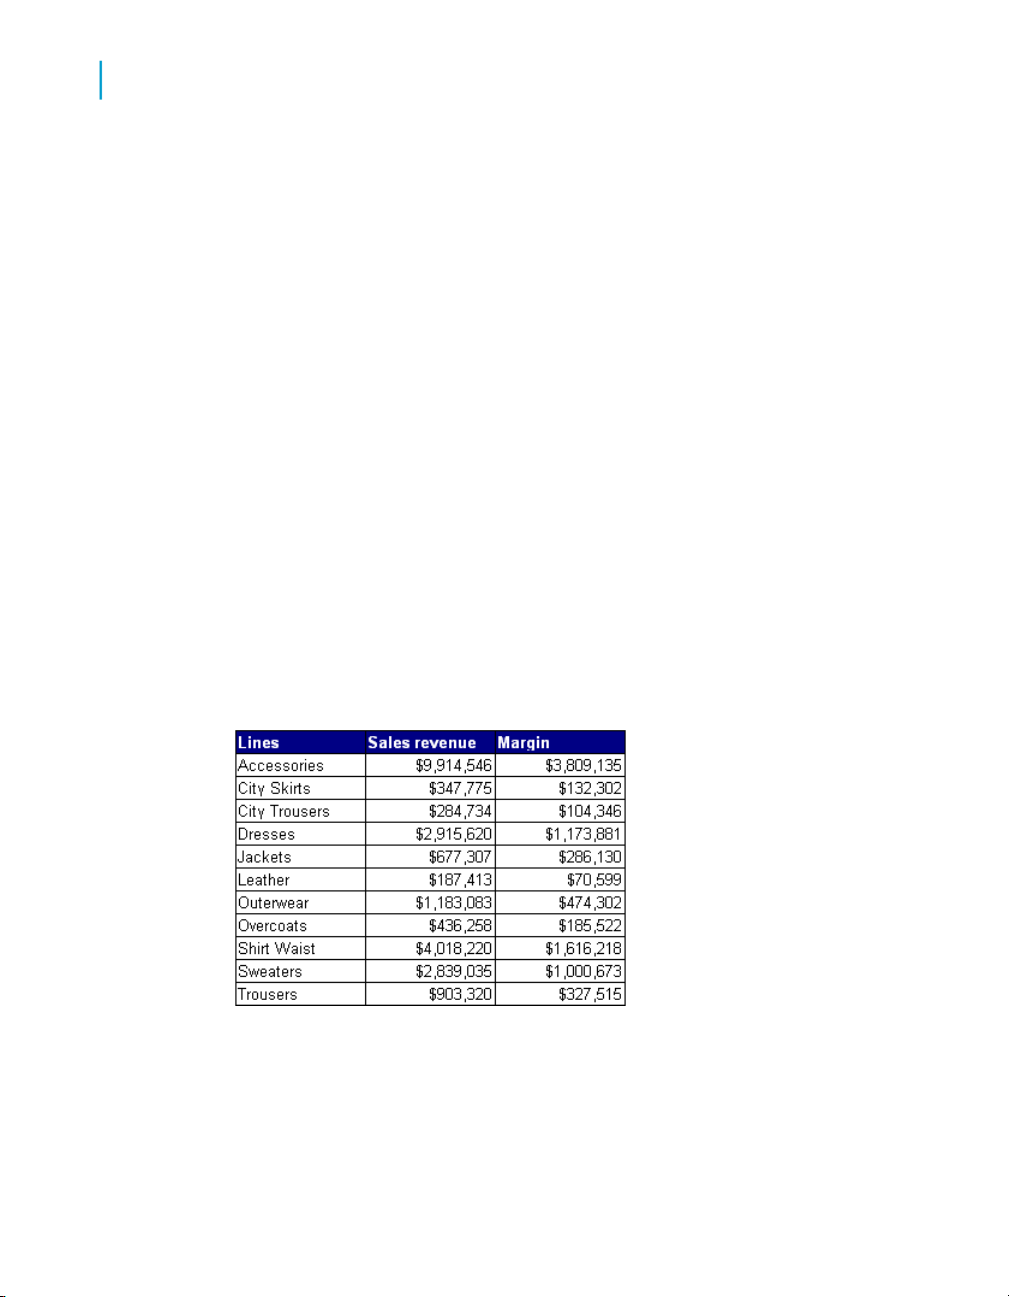
Displaying data in tables
8
Tables in Web Intelligence
Tables in Web Intelligence
When you create a new document and run the query the first time to display
the results, Web Intelligence generates a report that includes all of the results
in a vertical table. You can modify how the table is organized, remove or add
data, change the table type to display the results differently or insert other
tables. You can also insert free standing cells to display results in a single
cell.
Table types in Web Intelligence
A Web Intelligence report displays results in a block. You can format the
block as a specific type of table.
Vertical table
Vertical tables display header cells at the top of the table and the
corresponding data in columns. By default, the header cells display the names
of the dimensions, details, and measures included in the table. The body
cells display the corresponding values.
96 Performing on-report analysis with Web Intelligence
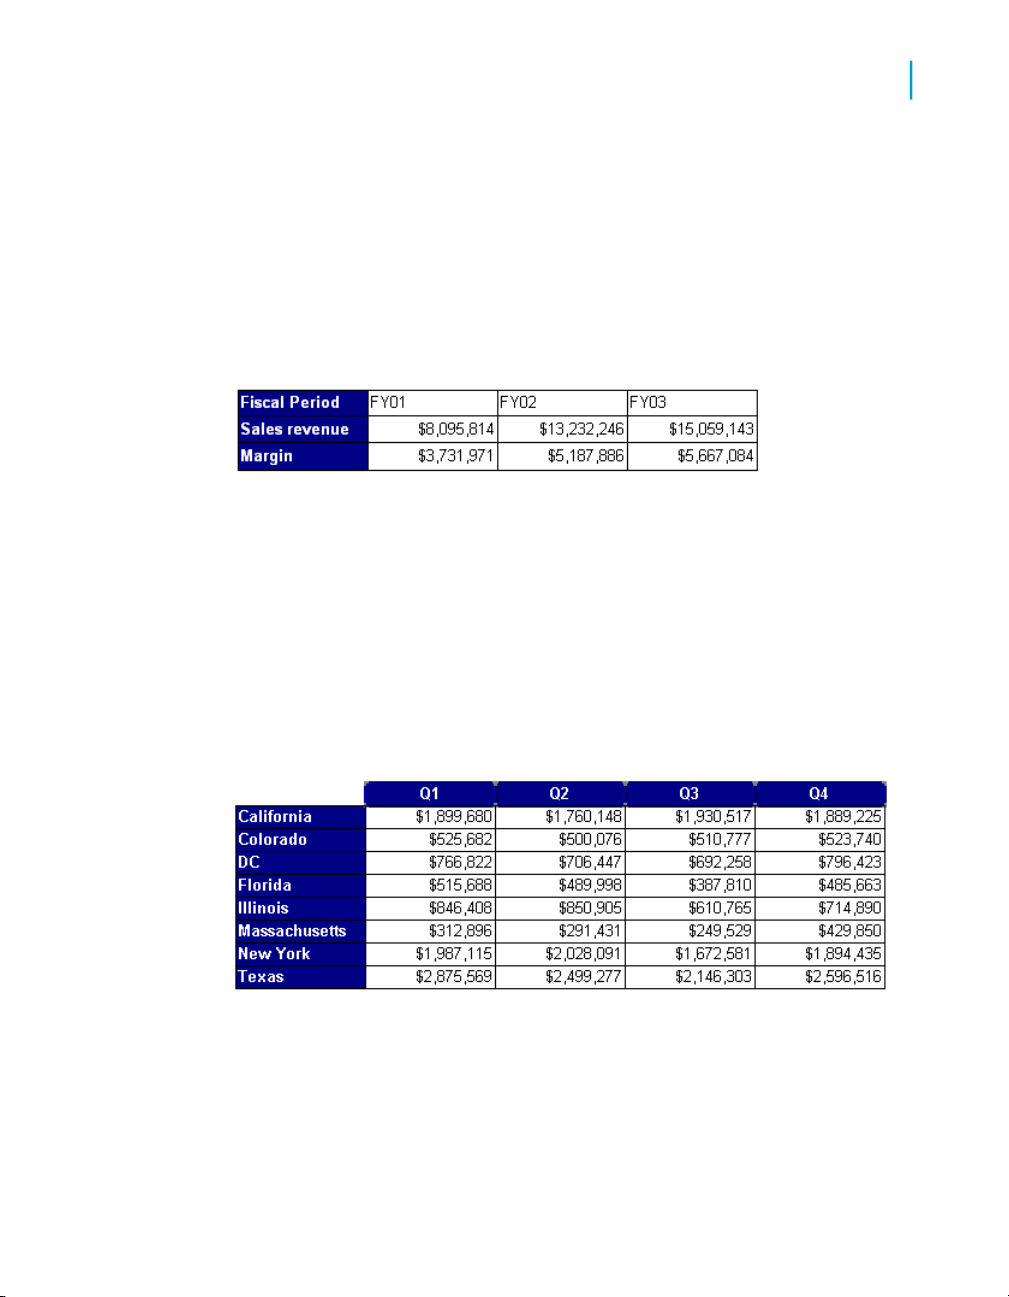
Horizontal table
Horizontal tables display header cells at the left of the table and the
corresponding data in rows. By default, the header cells display the names
of the dimensions, details, and measures included in the table. The body
cells display the corresponding values.
Crosstab
Crosstabs display values for dimensions across the top axis and on the left
axis. The body displays the values of a measure that correspond to the
cross-section of the dimensions. For example, this crosstab displays values
for [Quarter] across the top axis and displays values for [State] on the left
axis. The body displays values that [Sales Revenue] for each quarter in each
state.
Displaying data in tables
Table types in Web Intelligence
8
You can include multiple dimensions in crosstabs. For example, this crosstab
displays two dimensions. The values for the [Sales Revenue] measure are
values each state by quarter for each line.
Performing on-report analysis with Web Intelligence 97

Displaying data in tables
8
Table types in Web Intelligence
When you create crosstabs that include a dimension(s) in the body, the body
cell values are calculated according to a multi-dimensional data model. The
values displayed in the body are calculated according to all of the coordinates
on the table axes, whether or not there is a row for the specific coordinate
in the SQL result.
Forms
Forms are useful in your report if you want to display detailed information
per customer, product, or partner. For example, a form is a useful way of
displaying individual customer records with information such as the customer
account, name, address, and so on.
Forms are also useful for formatting address labels for envelopes.
98 Performing on-report analysis with Web Intelligence
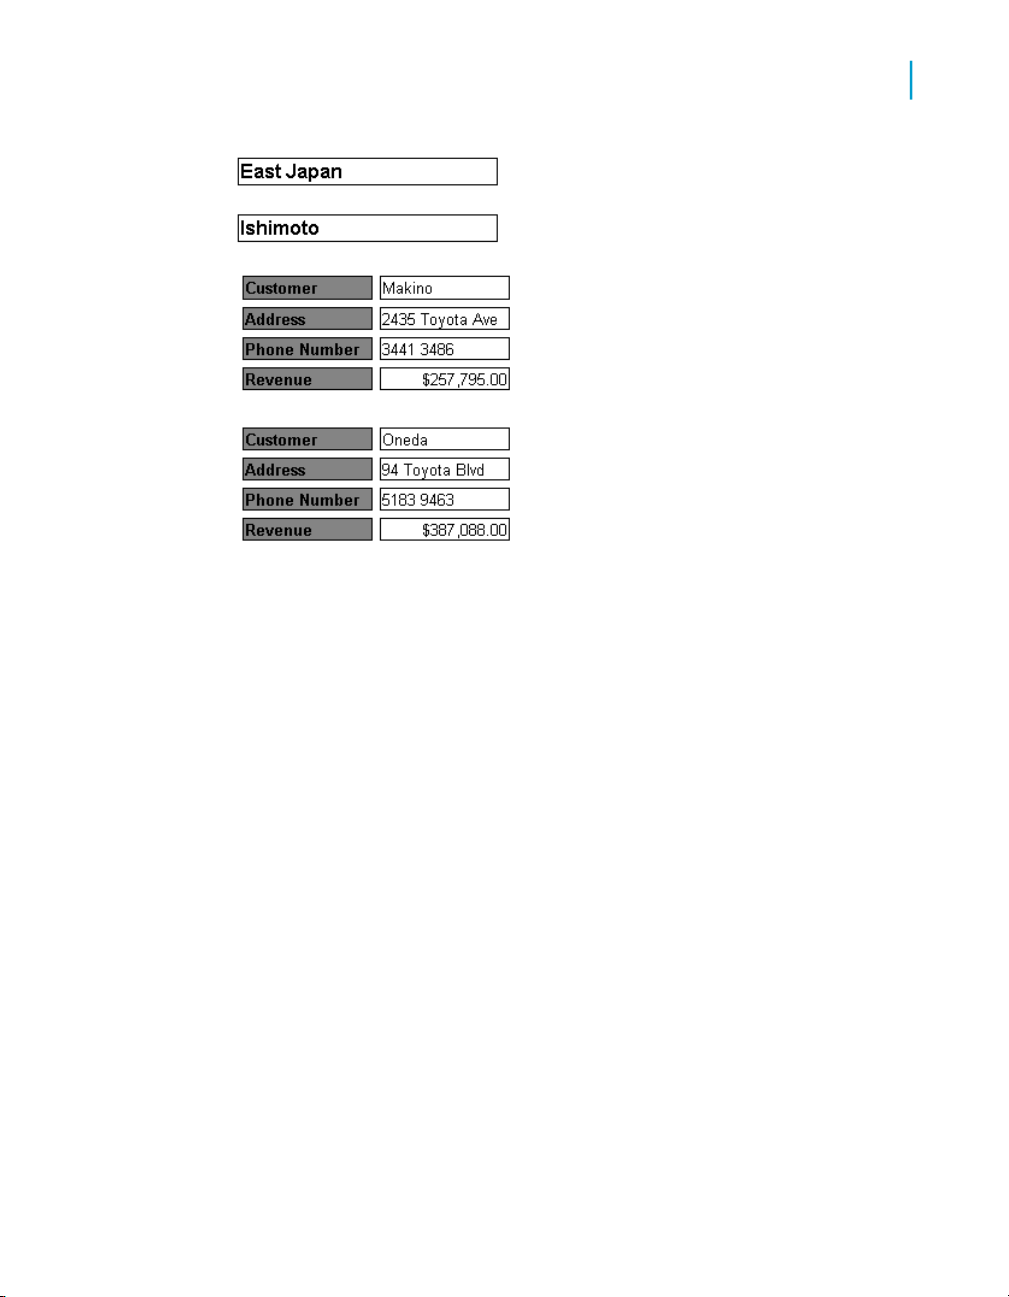
Displaying data in tables
Creating, editing and removing tables
Creating, editing and removing tables
8
To insert a table
1. To display the Document Properties pane, click the Show left pane
arrow at the top left of the report.
2. Select Chart and Table Types from the drop down list in the Document
Properties pane.
The Left panel now displays all the types of tables, charts and free
standing cells that you can add to the report.
3. Select the table type that you want to add to the report in the Left panel
and drag the table onto the report.
4. Right-click the table in the report, select Insert from the menu, then select
New column or New row to add rows or columns to the table.
5. Select Available Objects from the drop-down list at the top of the left
panel.
6. Drag the object that you want to associate with a column to the column
in the report table.
The column is populated with the data from the report object.
Performing on-report analysis with Web Intelligence 99

Displaying data in tables
8
Creating, editing and removing tables
7. Continue dragging objects to table columns until you have associated
objects with all columns.
To name a table
1. Select the table, right click, select Format from the menu and then select
Table from the sub menu.
2. Select the General tab on the "Format Table" dialog box.
3. Type the table name in the Name box.
To change the table type using Turn To
1. Right-click inside the table and select Turn table to from the menu.
The "Turn To" dialog box appears.
2. Make sure that Tables is selected in the left pane.
3. Select the type of table to which you want to change the current table in
the Available Formats area on the right.
4. Click OK.
Web Intelligence changes the table to the type you selected.
To change the table type using drag and drop
1. Make sure that the Document Properties pane is displayed to the left
of the selected report. To display the Document Properties pane, click
the Show left pane arrow at the top left of the report.
2. Select Chart and Table Types from the drop down list at the top of the
Left panel.
3. Select the table type to which you want to change the existing table and
drag it over the existing table.
To move columns in a table
1. Right-click in the table, select Format from the menu, then select Table.
The "Format Table" dialog box appears.
100 Performing on-report analysis with Web Intelligence
 Loading...