

Page 1

Data Services Management Console:
Metadata Reports Guide
BusinessObjects Data Services XI 3.1 (12.1.1)
Page 2

Copyright
© 2008 Business Objects, an SAP company. All rights reserved. Business Objects
owns the following U.S. patents, which may cover products that are offered and
licensed by Business Objects: 5,295,243; 5,339,390; 5,555,403; 5,590,250;
5,619,632; 5,632,009; 5,857,205; 5,880,742; 5,883,635; 6,085,202; 6,108,698;
6,247,008; 6,289,352; 6,300,957; 6,377,259; 6,490,593; 6,578,027; 6,581,068;
6,628,312; 6,654,761; 6,768,986; 6,772,409; 6,831,668; 6,882,998; 6,892,189;
6,901,555; 7,089,238; 7,107,266; 7,139,766; 7,178,099; 7,181,435; 7,181,440;
7,194,465; 7,222,130; 7,299,419; 7,320,122 and 7,356,779. Business Objects and
its logos, BusinessObjects, Business Objects Crystal Vision, Business Process
On Demand, BusinessQuery, Cartesis, Crystal Analysis, Crystal Applications,
Crystal Decisions, Crystal Enterprise, Crystal Insider, Crystal Reports, Crystal
Vision, Desktop Intelligence, Inxight and its logos , LinguistX, Star Tree, Table
Lens, ThingFinder, Timewall, Let There Be Light, Metify, NSite, Rapid Marts,
RapidMarts, the Spectrum Design, Web Intelligence, Workmail and Xcelsius are
trademarks or registered trademarks in the United States and/or other countries
of Business Objects and/or affiliated companies. SAP is the trademark or registered
trademark of SAP AG in Germany and in several other countries. All other names
mentioned herein may be trademarks of their respective owners.
Third-party
Contributors
Business Objects products in this release may contain redistributions of software
licensed from third-party contributors. Some of these individual components may
also be available under alternative licenses. A partial listing of third-party
contributors that have requested or permitted acknowledgments, as well as required
notices, can be found at: http://www.businessobjects.com/thirdparty
2008-11-28
Page 3

Contents
Introduction 7Chapter 1
Welcome to Data Services..........................................................................8
Introduction to Metadata Reports..............................................................14
Getting Started 17Chapter 2
Requirements............................................................................................18
Adding Metadata Integrator.......................................................................18
Repository reporting tables and views.......................................................19
About the Management Console...............................................................22
Impact and Lineage Analysis Reports 25Chapter 3
Welcome................................................................................................8
Documentation set for Data Services.....................................................8
Accessing documentation....................................................................11
Business Objects information resources..............................................12
Logging in.............................................................................................23
Management Console navigation.........................................................24
Navigation..................................................................................................26
To increase the java heap memory in Windows...................................28
To increase the java heap memory in UNIX.........................................28
Analysis options.........................................................................................29
Table-level and column-level analysis.......................................................35
Impact and Lineage Analysis Settings control panel.................................36
Settings tab..........................................................................................36
Refresh Usage Data tab.......................................................................36
Business Objects Connections tab......................................................38
Data Services Management Console: Metadata Reports Guide 3
Page 4

Contents
About tab..............................................................................................40
Operational Dashboard Reports 41Chapter 4
Dashboards home page............................................................................42
Job execution statistics..............................................................................43
Current (snapshot) pie chart.................................................................43
Historical (trend) bar chart....................................................................45
Job Execution Duration..............................................................................45
Configuring the Job Execution Duration dashboard.............................46
Current (snapshot) speedometer.........................................................47
Historical (trend) line chart...................................................................51
Data Validation Dashboard Reports 53Chapter 5
Configuring Data Validation dashboards...................................................54
Creating functional areas.....................................................................55
To create functional areas....................................................................55
Creating business rules........................................................................57
To create business rules.......................................................................57
Enabling data validation statistics collection........................................60
Viewing Data Validation dashboards.........................................................60
Functional area view..................................................................................61
Functional area pie chart......................................................................61
History line chart...................................................................................63
Business rule view.....................................................................................63
Validation rule view....................................................................................65
Validation rule bar chart........................................................................65
History line chart...................................................................................66
Sample data view......................................................................................66
Sample data table................................................................................67
History line chart...................................................................................67
4 Data Services Management Console: Metadata Reports Guide
Page 5

Contents
Data Validation dashboards Settings control panel...................................67
Repository tab......................................................................................68
Functional area tab...............................................................................68
Business rule tab..................................................................................68
Auto Documentation Reports 69Chapter 6
Navigation..................................................................................................70
To search for a specific object..............................................................71
Repository............................................................................................72
Project..................................................................................................72
Job........................................................................................................72
Work flow..............................................................................................73
Data flow..............................................................................................73
Generating documentation for an object...................................................75
To print Auto Documentation for an object................................................75
Auto Documentation Settings control panel..............................................76
Data Quality Reports 77Chapter 7
Lists of available reports............................................................................80
List of reports by job..................................................................................81
Data Quality Reports Settings control panel..............................................83
Report options...........................................................................................83
Descriptions of Reports.............................................................................84
USA CASS report: USPS Form 3553...................................................84
NCOALink Processing Summary Report.............................................86
Canadian SERP report: Statement of Address Accuracy....................89
Australian AMAS report: Address Matching Processing Summary......91
New Zealand Statement of Accuracy (SOA) report.............................93
Address Information Codes Sample report..........................................95
Address Information Code Summary report.........................................97
Data Services Management Console: Metadata Reports Guide 5
Page 6

Contents
Address Validation Summary report...................................................101
Address Type Summary report...........................................................103
Address Standardization Sample report............................................105
Address Quality Code Summary report.............................................107
Best Record Summary report.............................................................111
Match Contribution report...................................................................113
Match Criteria Summary report..........................................................117
Match Source Statistics Summary report...........................................119
Match Duplicate Sample report..........................................................122
US Addressing Report........................................................................124
US Regulatory Locking Report...........................................................127
Index 131
6 Data Services Management Console: Metadata Reports Guide
Page 7

Introduction
1
Page 8

Introduction
1
Welcome to Data Services
Welcome to Data Services
Welcome
Data Services XI Release 3 provides data integration and data quality
processes in one runtime environment, delivering enterprise performance
and scalability.
The data integration processes of Data Services allow organizations to easily
explore, extract, transform, and deliver any type of data anywhere across
the enterprise.
The data quality processes of Data Services allow organizations to easily
standardize, cleanse, and consolidate data anywhere, ensuring that end-users
are always working with information that's readily available, accurate, and
trusted.
Documentation set for Data Services
You should become familiar with all the pieces of documentation that relate
to your Data Services product.
What this document providesDocument
Documentation Map
Release Summary
Release Notes
Getting Started Guide
Installation Guide for Windows
8 Data Services Management Console: Metadata Reports Guide
Information about available Data Services books,
languages, and locations
Highlights of key features in this Data Services release
Important information you need before installing and
deploying this version of Data Services
An introduction to Data Services
Information about and procedures for installing Data
Services in a Windows environment.
Page 9

Introduction
Welcome to Data Services
What this document providesDocument
1
Installation Guide for UNIX
Advanced Development Guide
Designer Guide
Integrator's Guide
Management Console: Administrator
Guide
Management Console: Metadata Reports Guide
Migration Considerations Guide
Information about and procedures for installing Data
Services in a UNIX environment.
Guidelines and options for migrating applications including information on multi-user functionality and
the use of the central repository for version control
Information about how to use Data Services Designer
Information for third-party developers to access Data
Services functionality. Also provides information about
how to install, configure, and use the Data Services
Adapter for JMS.
Information about how to use Data Services Administrator
Information about how to use Data Services Metadata
Reports
Information about:
• Release-specific product behavior changes from
earlier versions of Data Services to the latest release
• How to migrate from Data Quality to Data Services
Performance Optimization Guide
Reference Guide
Data Services Management Console: Metadata Reports Guide 9
Information about how to improve the performance
of Data Services
Detailed reference material for Data Services Designer
Page 10

Introduction
1
Welcome to Data Services
Technical Manuals
What this document providesDocument
A compiled “master” PDF of core Data Services books
containing a searchable master table of contents and
index:
•
Getting Started Guide
•
Installation Guide for Windows
•
Installation Guide for UNIX
•
Designer Guide
•
Reference Guide
•
Management Console: Metadata Reports Guide
•
Management Console: Administrator Guide
•
Performance Optimization Guide
•
Advanced Development Guide
•
Supplement for J.D. Edwards
•
Supplement for Oracle Applications
•
Supplement for PeopleSoft
•
Supplement for Siebel
•
Supplement for SAP
Tutorial
A step-by-step introduction to using Data Services
In addition, you may need to refer to several Adapter Guides and
Supplemental Guides.
What this document providesDocument
Salesforce.com Adapter
Interface
Supplement for J.D. Edwards
Supplement for Oracle Applications
Supplement for PeopleSoft
10 Data Services Management Console: Metadata Reports Guide
Information about how to install, configure, and use the Data
Services Salesforce.com Adapter Interface
Information about license-controlled interfaces between Data
Services and J.D. Edwards World and J.D. Edwards OneWorld
Information about the license-controlled interface between Data
Services and Oracle Applications
Information about license-controlled interfaces between Data
Services and PeopleSoft
Page 11

Introduction
Welcome to Data Services
What this document providesDocument
1
Supplement for SAP
Supplement for Siebel
Information about license-controlled interfaces between Data
Services, SAP ERP, and SAP BI/BW
Information about the license-controlled interface between Data
Services and Siebel
Accessing documentation
You can access the complete documentation set for Data Services in several
places.
Accessing documentation on Windows
After you install Data Services, you can access the documentation from the
Start menu.
1. Choose Start > Programs > BusinessObjects XI 3.1 >
BusinessObjects Data Services > Data Services Documentation.
Note:
Only a subset of the documentation is available from the Start menu. The
documentation set for this release is available in LINK_DIR\Doc\Books\en.
2. Click the appropriate shortcut for the document that you want to view.
Accessing documentation on UNIX
After you install Data Services, you can access the online documentation by
going to the directory where the printable PDF files were installed.
1. Go to LINK_DIR/doc/book/en/.
2. Using Adobe Reader, open the PDF file of the document that you want
to view.
Data Services Management Console: Metadata Reports Guide 11
Page 12

Introduction
1
Welcome to Data Services
Accessing documentation from the Web
You can access the complete documentation set for Data Services from the
Business Objects Customer Support site.
1.
Go to http://help.sap.com.
2. Cick Business Objects at the top of the page.
You can view the PDFs online or save them to your computer.
Business Objects information resources
A global network of Business Objects technology experts provides customer
support, education, and consulting to ensure maximum business intelligence
benefit to your business.
Useful addresses at a glance:
ContentAddress
12 Data Services Management Console: Metadata Reports Guide
Page 13
Introduction
Welcome to Data Services
ContentAddress
1
Customer Support, Consulting, and Education
services
http://service.sap.com/
Data Services Community
https://www.sdn.sap.com/irj/sdn/businessob
jects-ds
Forums on SCN (SAP Community Network)
https://www.sdn.sap.com/irj/sdn/businessob
jects-forums
Blueprints
http://www.sdn.sap.com/irj/boc/blueprints
Information about Customer Support programs,
as well as links to technical articles, downloads,
and online forums. Consulting services can
provide you with information about how Business Objects can help maximize your business
intelligence investment. Education services can
provide information about training options and
modules. From traditional classroom learning
to targeted e-learning seminars, Business Objects can offer a training package to suit your
learning needs and preferred learning style.
Get online and timely information about Data
Services, including tips and tricks, additional
downloads, samples, and much more. All content is to and from the community, so feel free
to join in and contact us if you have a submission.
Search the Business Objects forums on the
SAP Community Network to learn from other
Data Services users and start posting questions
or share your knowledge with the community.
Blueprints for you to download and modify to fit
your needs. Each blueprint contains the necessary Data Services project, jobs, data flows, file
formats, sample data, template tables, and
custom functions to run the data flows in your
environment with only a few modifications.
Data Services Management Console: Metadata Reports Guide 13
Page 14

Introduction
1
Introduction to Metadata Reports
http://help.sap.com/
ContentAddress
Business Objects product documentation.Product documentation
Documentation mailbox
documentation@businessobjects.com
Supported platforms documentation
https://service.sap.com/bosap-support
Send us feedback or questions about your
Business Objects documentation. Do you have
a suggestion on how we can improve our documentation? Is there something that you particularly like or have found useful? Let us know,
and we will do our best to ensure that your
suggestion is considered for the next release
of our documentation.
Note:
If your issue concerns a Business Objects
product and not the documentation, please
contact our Customer Support experts.
Get information about supported platforms for
Data Services.
In the left panel of the window, navigate to
Documentation > Supported Platforms >
BusinessObjects XI 3.1. Click the BusinessObjects Data Services link in the main window.
Introduction to Metadata Reports
This guide describes how to use the Data Services Web-based metadata
reporting tools. You can easily browse, analyze, and produce reports on the
metadata in your repositories.
Metadata Reports provides five applications for exploring your metadata.
• Impact and Lineage Analysis Reports—Allows you to easily browse,
analyze, and produce reports on the metadata for your Data Services
jobs as well as for other Business Objects applications associated with
Data Services
14 Data Services Management Console: Metadata Reports Guide
Page 15

Introduction
Introduction to Metadata Reports
• Operational Dashboard Reports—Provides several standard graphical
dashboards that allow you to evaluate your job execution performance
at a glance
• Data Validation Dashboard Reports—Provide feedback that allows
business users to quickly review, assess, and identify potential
inconsistencies or errors in source data.
• Auto Documentation Reports—Offers a convenient way to create printed
documentation for the objects you create in Data Services by capturing
critical information so you can see an overview of the entire ETL process.
• Data Quality Reports—Allows you to view and export Crystal reports for
batch and real-time jobs that include statistics-generating transforms.
Report types include job summaries, transform-specific reports, and
transform group reports.
1
Data Services Management Console: Metadata Reports Guide 15
Page 16

Introduction
Introduction to Metadata Reports
1
16 Data Services Management Console: Metadata Reports Guide
Page 17

Getting Started
2
Page 18

Getting Started
2
Requirements
This section describes the overall requirements for enabling and viewing
metadata reports including software and configuration requirements,
configuring the Metadata Integrator, and logging in to the Management
Console.
Requirements
Use the Data Services Administrator to configure repositories for metadata
reporting applications to access.
To make metadata reports available for Data Services objects, the metadata
reporting applications require:
• The Web Server service (which uses the Tomcat servlet engine)
• JDBC drivers to connect to a repository
• Configured Data Services repositories
• Installation and configuration of Metadata Integrator for impact and lineage
analysis on BusinessObjects Enterprise objects such as Universes and
Crystal Reports
Related Topics
• Management Console—Administrator Guide: Administrator Management,
Connecting repositories to the Administrator
• Adding Metadata Integrator on page 18
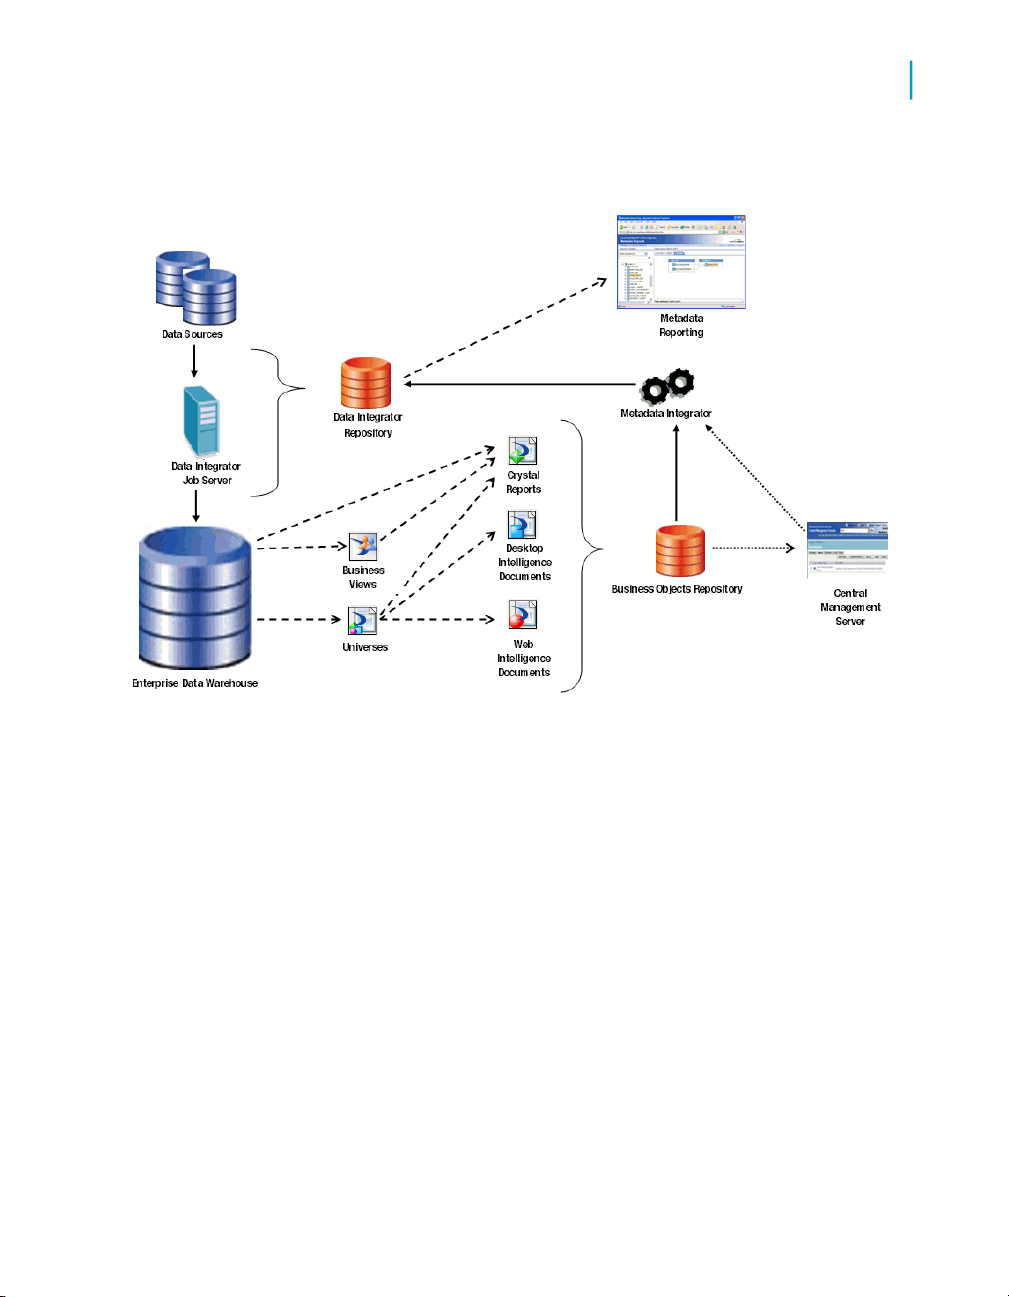
Adding Metadata Integrator
To view impact and lineage analysis and auto documentation reports for the
following objects, you must install, configure, and run the Metadata Integrator:
• Business Views
• Crystal Reports
• Universes
• Desktop Intelligence documents
• Web Intelligence documents
Metadata Integrator scans definitions on your Business Objects Central
Management Server (CMS) to find the tables and columns used by the
reports, views, and documents. Metadata Integrator stores the collected
18 Data Services Management Console: Metadata Reports Guide
Page 19
Getting Started
Repository reporting tables and views
metadata in your Data Services repository for use by the impact and lineage
analysis and auto documentation applications.
2
Related Topics
• Impact and Lineage Analysis Reports on page 25
Repository reporting tables and views
The Data Services repository is a database that stores your application
components and the built-in Data Services design components and their
properties. The open architecture of the repository allows for metadata sharing
with other enterprise tools.
Within your repository, Data Services populates a special set of reporting
tables with metadata describing the objects in your repository. When you
query these tables, you can perform analyses on your Data Services
applications.
Data Services metadata reporting tables and views are listed in the following
table:
Data Services Management Console: Metadata Reports Guide 19
Page 20

Getting Started
2
Repository reporting tables and views
ContainsName
Attribute information about native objectsAL_ATTR
Audit information about each data flow executionAL_AUDIT
Information about audit statisticsAL_AUDIT_INFO
Components of a Business ViewAL_CMS_BV
AL_CMS_BV_FIELDS
AL_CMS_REPORTS
AL_CMS_REPORT
SUSAGE
AL_CMS_FOLDER
AL_CMS_UNV_OBJ
Business Fields within Business Elements in a Business
View
Information that uniquely identifies Crystal Reports,
Desktop Intelligence document, or Web Intelligence
documents
Tables, columns, Business Views, or Universes that a
Crystal Report, Desktop Intelligence Document, or Web
Intelligence Document uses
Folder names in which a Crystal Report, Desktop Intelligence Document, or Web Intelligence Document resides
Information that uniquely identifies UniversesAL_CMS_UNV
Universe classes and the child objects, with the source
column and table
Execution statistics about jobs and data flowsAL_HISTORY
Index information about imported tablesAL_INDEX
Information about native (.atl) Data Services objectsAL_LANG
Information about objects represented in XML formatAL_LANGXMLTEXT
Column information about imported table partitionsAL_PCOLUMN
Primary key information about imported tablesAL_PKEY
Validation rule namesAL_QD_VRULE
20 Data Services Management Console: Metadata Reports Guide
Page 21

Getting Started
Repository reporting tables and views
ContainsName
2
AL_QD_VRULE_OFLOW
AL_QD_ROW_DATA
AL_USAGE
ALVW_COLUMNAT
TR
ALVW_COLUMNIN
FO
ALVW_FLOW_STAT
ALVW_FUNCINFO
Rule name if it cannot fit it into AL_QD_VRULE (if there
is an overflow)
Runtime validation rule statisticsAL_QD_STATS
Sample row data for which the validation rules have
failed
All the column information for the failed validation rulesAL_QD_COLINFO
All ancestor-descendant relationships between Data
Services objects
Attribute information about imported columns
Information about imported column
Primary-foreign key relationships among imported tablesALVW_FKREL
Execution statistics about individual transforms within
data flows
Information about both native functions and functions
imported from external systems
Mapping and lineage information for target tablesALVW_MAPPING
ALVW_PAR
ENT_CHILD
Note:
Direct parent-child relationships between Data Services
objects
Option settings for all objectsAL_SETOPTIONS
Attribute information about imported (external) tablesALVW_TABLEATTR
Information about imported tablesALVW_TABLEINFO
This is not the complete list because some repository tables and views are
for internal use.
Data Services Management Console: Metadata Reports Guide 21
Page 22

Getting Started
2
About the Management Console
Data Services automatically creates reporting tables for each new or
upgraded repository. Except for AL_USAGE, Data Services automatically
updates all reporting tables.
The Metadata Integrator collects metadata for Crystal Reports, Business
Views, Universes, Desktop Intelligence document, and Web Intelligence
documents from the Central Management Server (CMS) and stores the
metadata in the Data Services reporting tables that start with AL_CMS.
Related Topics
• Adding Metadata Integrator on page 18
About the Management Console
The Management Console is a collection of Web-based applications for
administering Data Services jobs and services, viewing object relationships,
evaluating job execution performance and data validity, and generating data
quality reports.
• Administrator—Use to manage your production environment including
batch job execution, real-time services, Web services, adapter instances,
server groups, central and profiler repositories, and more. This applicaiton
is documented in the Data Services Management Console—Administrator
Guide.
The remaining Management Console applications are documented in the
Data Services Management Console—Metadata Reports Guide.
• Impact and Lineage Analysis—Use to analyze the end-to-end impact
and lineage for Data Services tables and columns and BusinessObjects
Enterprise objects such as universes, business views, and reports.
• Operational Dashboards—Use to view dashboards of Data Services
job execution statistics to see at a glance the status and performance of
your job executions for one or more repositories over a given time period.
• Data Validation Dashboards—Use to evaluate the reliability of your
target data based on the validation rules you created in your Data Services
batch jobs to quickly review, assess, and identify potential inconsistencies
or errors in source data.
• Auto Documentation—Use to view, analyze, and print graphical
representations of all objects as depicted in Data Services Designer
including their relationships, properties, and more.
22 Data Services Management Console: Metadata Reports Guide
Page 23

• Data Quality Reports—Use to view and export reports for batch and
Logging in
To access the metadata reporting applications, first log in to the Data Services
Management Console. The first time you log in to the Management Console,
use the default user name and password (admin/admin). Business Objects
recommends that you change the defaults thereafter by updating user roles
in the Data Services Administrator.
1. The first step depends on your operating system.
Getting Started
About the Management Console
real-time jobs such as job summaries and data quality transform-specific
reports.
• On Windows, click the Start menu and select Programs >
BusinessObjects XI 3.1 > BusinessObjects Data Services > Data
Services Management Console.
If you encounter an error, check to see whether the Data Services
Web Server service is installed and running. If the Web Server service
is running but you cannot log in, see the Troubleshooting section of
the Data Services Administrator Guide.
2
• On UNIX or Windows, open a browser, enter the following
case-sensitive URL, then press Enter:
http://hostname:28080/DataServices/
2. Enter the default user name (admin) and password (admin) and click Log
in.
The Management Console home page opens.
3. To launch one of the metadata reporting applications, click its icon (or
name).
If you are logged in to the Designer, you can also access the Management
Console home page as follows:
• From the Start page, click Data Services Management Console.
• From the Tools menu, click Data Services Management Console.
• Click the Data Services Management Console tool bar icon.
Data Services Management Console: Metadata Reports Guide 23
Page 24

Getting Started
2
About the Management Console
Management Console navigation
After you log in to the Management Console and launch one of the
applications, the application name appears under the Management Console
banner.
The upper-right side of the main window includes the following links:
• Home—Click to return to the Management Console home page (for
example to select another application).
• Settings—Use the Settings control panel for changing a variety of options
depending on the application.
• Logout—Click to exit the application and the Management Console and
return to the login page.
•
Help icon—Click to open the Data Services Management Console:
Administrator Guide or the Data Services Management Console: Metadata
Reports Guide, depending on which application you have open.
As you navigate around the applications, notice the top of the right-hand
pane often displays a "bread crumb" path to indicate where you are in the
application. Depending on the page displayed, sometimes you can click on
the bread crumbs to navigate to a different part of the application.
The Administrator, Impact and Lineage Analysis, and Auto Documentation
applications also use a navigation tree in the left-hand pane.
Data Services Management Console sessions time out after 120 minutes (2
hours) of inactivity.
24 Data Services Management Console: Metadata Reports Guide
Page 25

Impact and Lineage Analysis Reports
3
Page 26

Impact and Lineage Analysis Reports
3
Navigation
The Impact and Lineage Analysis application provides a simple, graphical,
and intuitive way to view and navigate through various dependencies between
objects.
Impact and lineage analysis allows you to identify which objects will be
affected if you change or remove other connected objects.
For example for impact analysis, a typical question might be, “If I drop the
source column Region from this table, which targets will be affected?”
For lineage analysis, the question might be, “Where does the data come
from that populates the Customer_ID column in this target?”
In addition to the objects in your Data Services datastores, impact and lineage
analysis allows you to view the connections to other objects including
Universes, classes and objects, Business Views, Business Elements and
Fields, and reports (Crystal Reports, Desktop Intelligence documents, and
Web Intelligence documents).
Navigation
From the Management Console home page, view impact and lineage
information by clicking the Impact and Lineage Analysis link.
The Impact and Lineage Analysis page contains two primary panes:
• The left pane contains a hierarchy (tree) of objects. The top of the tree is
the default repository. This pane also includes a search tool.
• The right pane displays object content and context based on how you
navigate in both panes.
In general, expand the tree in the left pane by clicking plus signs (+) next to
object nodes. Select an object in the tree to learn more about it. Details
associated with an object appear in the right pane on one or more tabs. Tabs
vary depending on the object you select.
The top level of the navigation tree displays the current repository. (You can
change this repository in the Settings control panel; for details, see Impact
and Lineage Analysis Settings control panel on page 36.)
Objects in a repository include:
• Datastores—Contain Data Services tables and columns
26 Data Services Management Console: Metadata Reports Guide
Page 27

Impact and Lineage Analysis Reports
Navigation
•
CMS server(s)—After you configure the Metadata Integrator (see Adding
Metadata Integrator on page 18), this node contains folders as defined
in the Business Objects Central Management Console, Universes, and
Business Views.
The Universe node displays classes, and each class contains objects.
Business Views contain Business Elements, and each Business Element
has Business Fields. Any object can contain one or more reports.
To narrow the view of objects to display in the navigation tree or to quickly
find specific objects in the repository, use the Objects to analyze search
feature. You can do one or both of the following:
1. Select a category in the Select an object type drop-down list:
• Table and column
• Universe
• Class and object
• Business view
• Element and field
3
• Report
AND/OR
2. Search for a specific object by typing all or part of the object name in the
search field. The search field is not case sensitive, spaces are allowed,
and you can use the percent symbol (%) as a wildcard.
3. Click the search icon (binoculars).
Metadata Reports highlights with a red border each object that meets your
search criteria.
• To repopulate the CMS navigation tree with any objects that might have
been changed (added, deleted, renamed, and so on) in the CMS repository
after you display an impact and lineage report, log out and log back in to
the Management Console to display the changes.
• If you receive an error such as the following:
This image is scaled to 50% of the original image. You could
avoid scaling the image by allocating more memory to the
current java process.
Data Services Management Console: Metadata Reports Guide 27
Page 28

Impact and Lineage Analysis Reports
3
Navigation
it means the java process (JVM) does not have enough memory to process
the current task. Circumvent this error by allocating more heap memory
to the Java process associated with the Data Services Web server.
To increase the java heap memory in Windows
1. In the Windows Services control panel, stop the Data Services Web
Server.
2. In the Data Services installation directory, navigate to \ext\WebServer\conf.
3. Using a text editor, open the wrapper.properties file.
4. To allocate a minimum of 256 MB and a maximum of 512 MB to the java
process, add the following parameters to wrapper.cmd_ line:
-Xms256M -Xmx512M
The result will appear as follows:
wrapper.cmd_line=$(wrapper.javabin) -Xms256M -Xmx512M -Dja
va.endorsed.dirs==$(ACTAHOME)\ext\webserver\common\endorsed
...
5. Save and close the file.
To increase the java heap memory in UNIX
1. Stop the Data Services Web Server.
2. In the Data Services installation directory, navigate to /ext/WebServer/bin.
3. Using a text editor, open the setclasspath.sh file.
4. To allocate a minimum of 256 MB and a maximum of 512 MB to the java
process, add the following lines to the end of the setclasspath.sh file:
JAVA_OPTS="-Xms256M -Xmx512M"
export JAVA_OPTS
5. Save and close the file.
28 Data Services Management Console: Metadata Reports Guide
Page 29
Analysis options
The following table lists the types of objects that can appear in the navigation
tree and provides a summary of what information appears in the right pane
when you select that object type.
To view or hide a pane in the display such as an attributes pane, click the
up/down arrow in its header bar.
Moving the cursor over an object displays a pop-up window with more
information about that object; for example:
• Table—Data flow (if applicable), datastore, and owner
• Business Objects report—Depending on the report type, the pop-up
window displays the CMS server name, the Business View name, or the
Universe name, for example.
• Universe objects—CMS server, universe, and class
The following table lists the objects in the navigation tree, the corresponding
tabs, and the content of each.
Impact and Lineage Analysis Reports
Analysis options
3
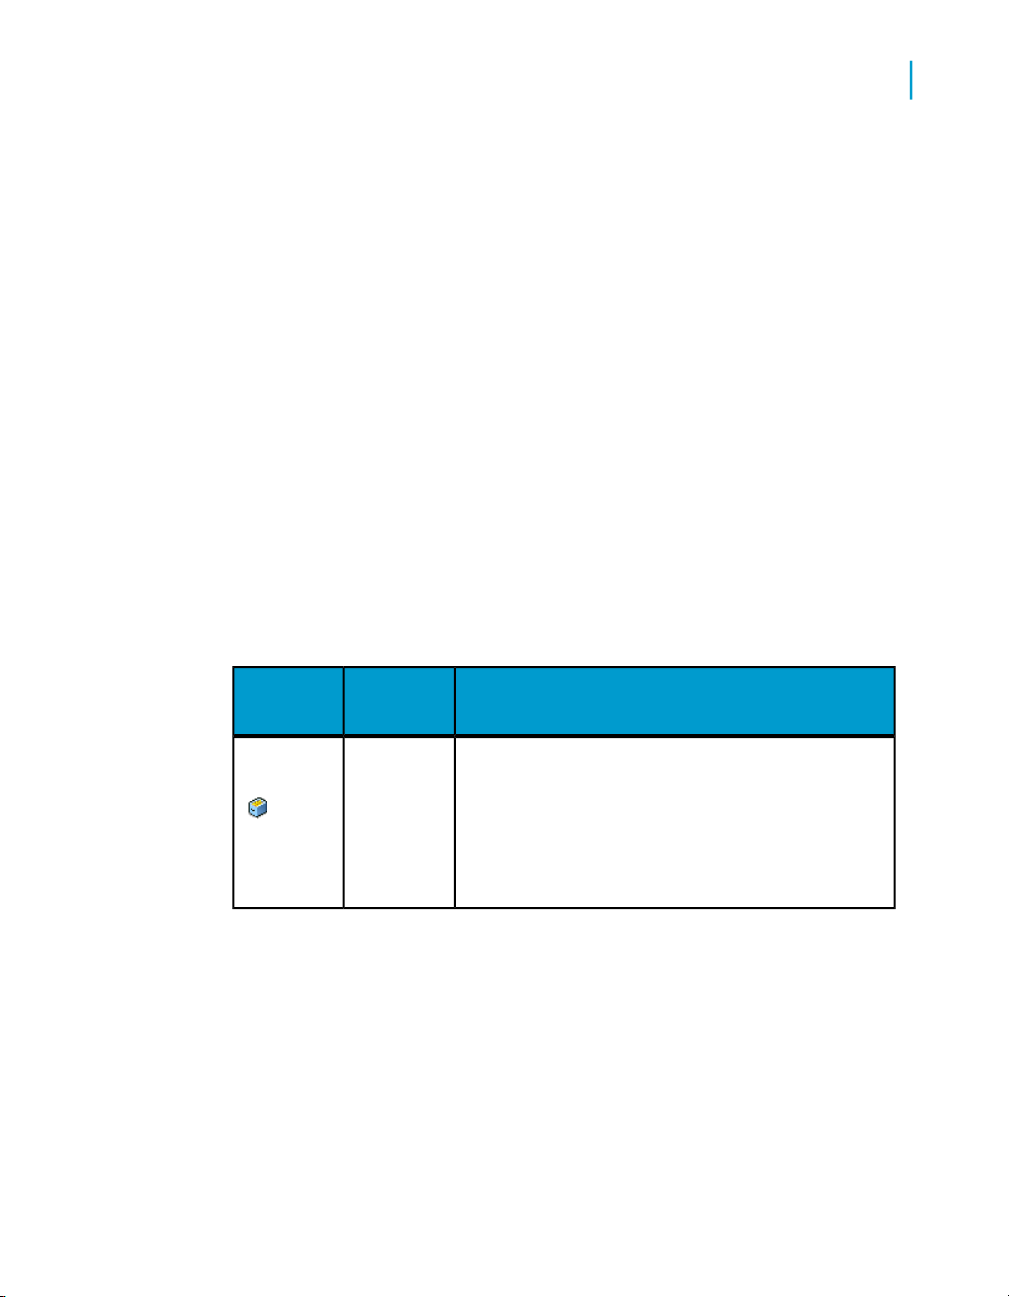
Associated contentTabObject
OverviewRepository
Data Services Management Console: Metadata Reports Guide 29
Repository name
Repository type—The database type
Repository version—The repository version
number
Page 30

Impact and Lineage Analysis Reports
3
Analysis options
Associated contentTabObject
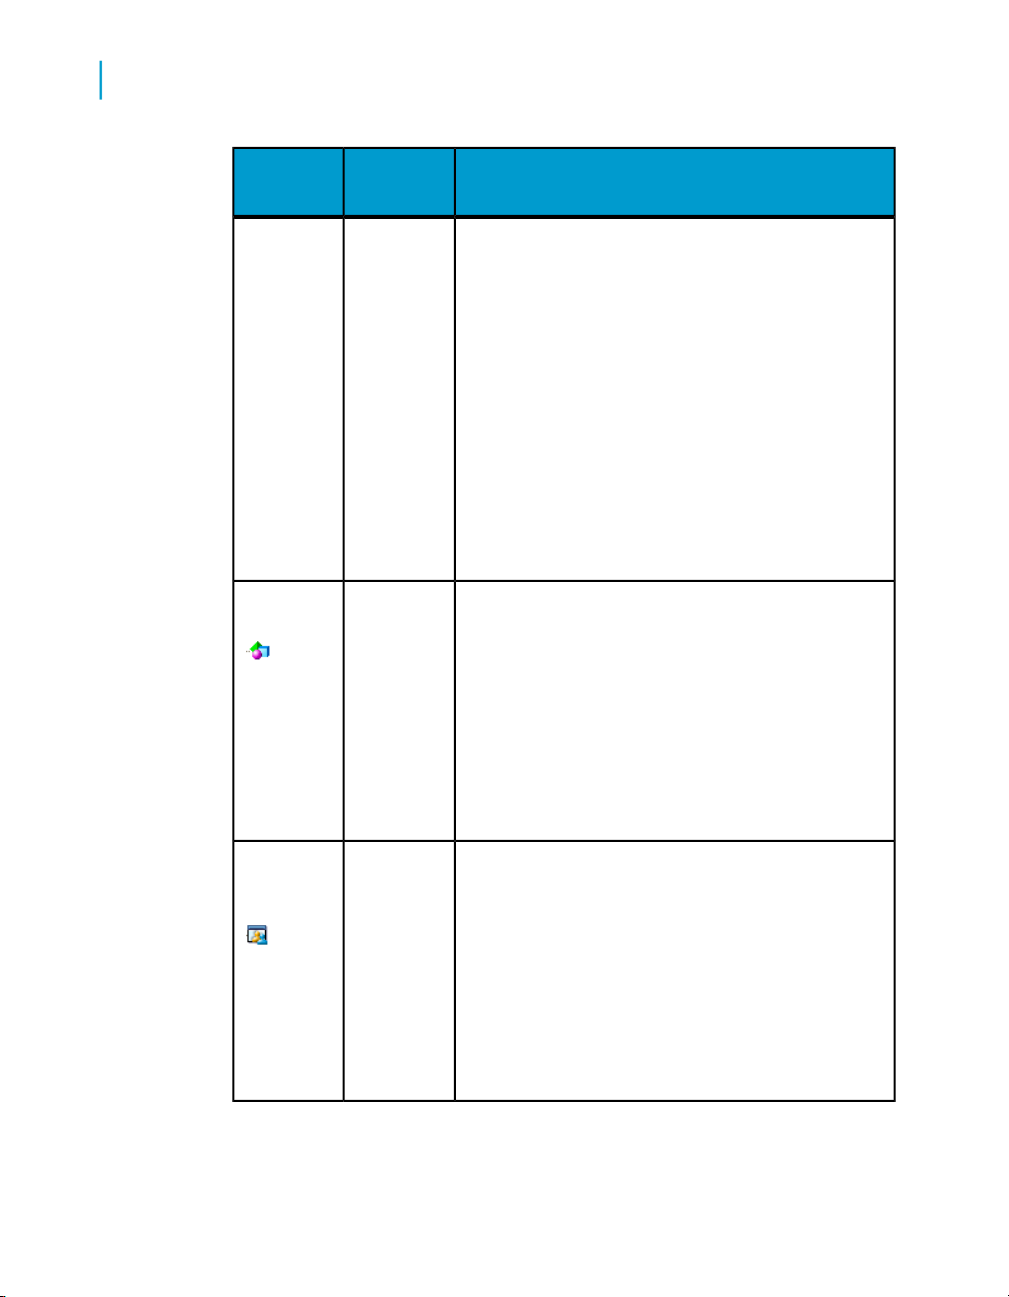
OverviewDatastore
OverviewTable
Overview information varies depending on the
datastore type. The following entries apply to a
datastore on Microsoft SQL Server.
Application type—Database
Database type—Microsoft_SQL_Server
User—Database user name
Case sensitive—Whether or not the database is
case sensitive
Configuration—The configuration select-
ed in the datastore editor
SQL_Server version—Microsoft SQL Server
2000
Database name—Database name
Server name—The host computer name
Table name—Table name
Datastore—Datastore to which this table belongs
Owner name—The table owner name in the
database.
Business name—Business-use name of the table
if defined
Table type—Table or template table
Last update date—When Data Services last up-
dated the table
30 Data Services Management Console: Metadata Reports Guide
Page 31

Impact and Lineage Analysis Reports
Analysis options
Associated contentTabObject
3
Impact
Lineage
Mapping
tree
OverviewColumn
Graphically shows the end-to-end impact of the
selected source table and the targets it affects.
Clicking a table in the Impact diagram displays
the object's attributes, which are the same as on
the Overview tab.
Contains the same information as on the Impact
tab except it describes the flow from target to
source.
Displays the overall mapping information for each
column in the table. Select between Group by
data flow or Group by column.
Column name—Column name
Table name—Parent table of the column
Data type—The data type for the column
Nullable—yes/no
Primary key—yes/no
Foreign key—yes/no
Impact
Data Services Management Console: Metadata Reports Guide 31
Graphically shows the end-to-end impact of the
selected source column and the targets it affects.
Clicking a column in the Impact diagram displays
the object's attributes, which are the same as on
the Overview tab.
Page 32
Impact and Lineage Analysis Reports
3
Analysis options
Associated contentTabObject
Lineage
OverviewUniverse
Contains the same information as on the Impact
tab except it describes the flow from target to
source.
It also displays any data flow objects associated
with the column. Move the cursor over a data flow
icon to display a pop-up window with the mapping
information.
Click on a data flow icon to open another pop-up
window that displays the Auto Documentation information including mapping. Notice that in the
auto documentation window, any objects that are
not part of the lineage for this column are dimmed.
Universe name
Folder—The folder name on the CMS server to
where the Universe has been exported
CMS server—The name of the CMS server for
this Universe
Description—The description created for the
Universe in BusinessObjects Designer
OverviewBusiness
View
32 Data Services Management Console: Metadata Reports Guide
Business View name
Folder—The folder name on the CMS server to
where the Business View has been exported
Last update date—When the Business View was
last updated in the Business View Manager
CMS server—The name of the CMS server for
this Business View
Page 33
Impact and Lineage Analysis Reports
Analysis options
Associated contentTabObject
3
OverviewClass
OverviewObject
Class name
Universe—Universe to which this class belongs
CMS server—The name of the CMS server for
this class
Object name
Class—The class to which this object belongs
Universe—Universe to which this object belongs
CMS Server—The name of the CMS server for
this object
Source column—The name of the source column
for this object followed by the owner.table
name
Shows all the reports that use the selected objectImpact
Shows column-level lineage for the selected objectLineage
Element
OverviewBusiness
Data Services Management Console: Metadata Reports Guide 33
Business element name
Business view—The Business View to which this
business element belongs
CMS server—The name of the CMS server for
this object
Page 34
Impact and Lineage Analysis Reports
3
Analysis options
Associated contentTabObject
Field
Crystal
and Web
Intelligence/
Desktop Intelligence
OverviewBusiness
Lineage
OverviewReports:
Business field name
Business element—The Business Element to
which this Business Field belongs
Business view—The Business View to which this
Business Field belongs
CMS server—The name of the CMS server for
this object
Shows all the reports that use the field.Impact
Shows column-level lineage for the selected
Business Field.
Report name
Folder—The folder on the CMS server where the
report is stored
CMS server—The name of the CMS server for
this report
Last update date——When the report was last
updated
Lineage
Related Topics
• Table-level and column-level analysis on page 35
• Auto Documentation Reports on page 69
34 Data Services Management Console: Metadata Reports Guide
Shows the lineage to the Universe objects or
Business View fields on which the report is based
(if any) and the column-level lineage in the Data
Services datastore.
Page 35
Impact and Lineage Analysis Reports
Table-level and column-level analysis
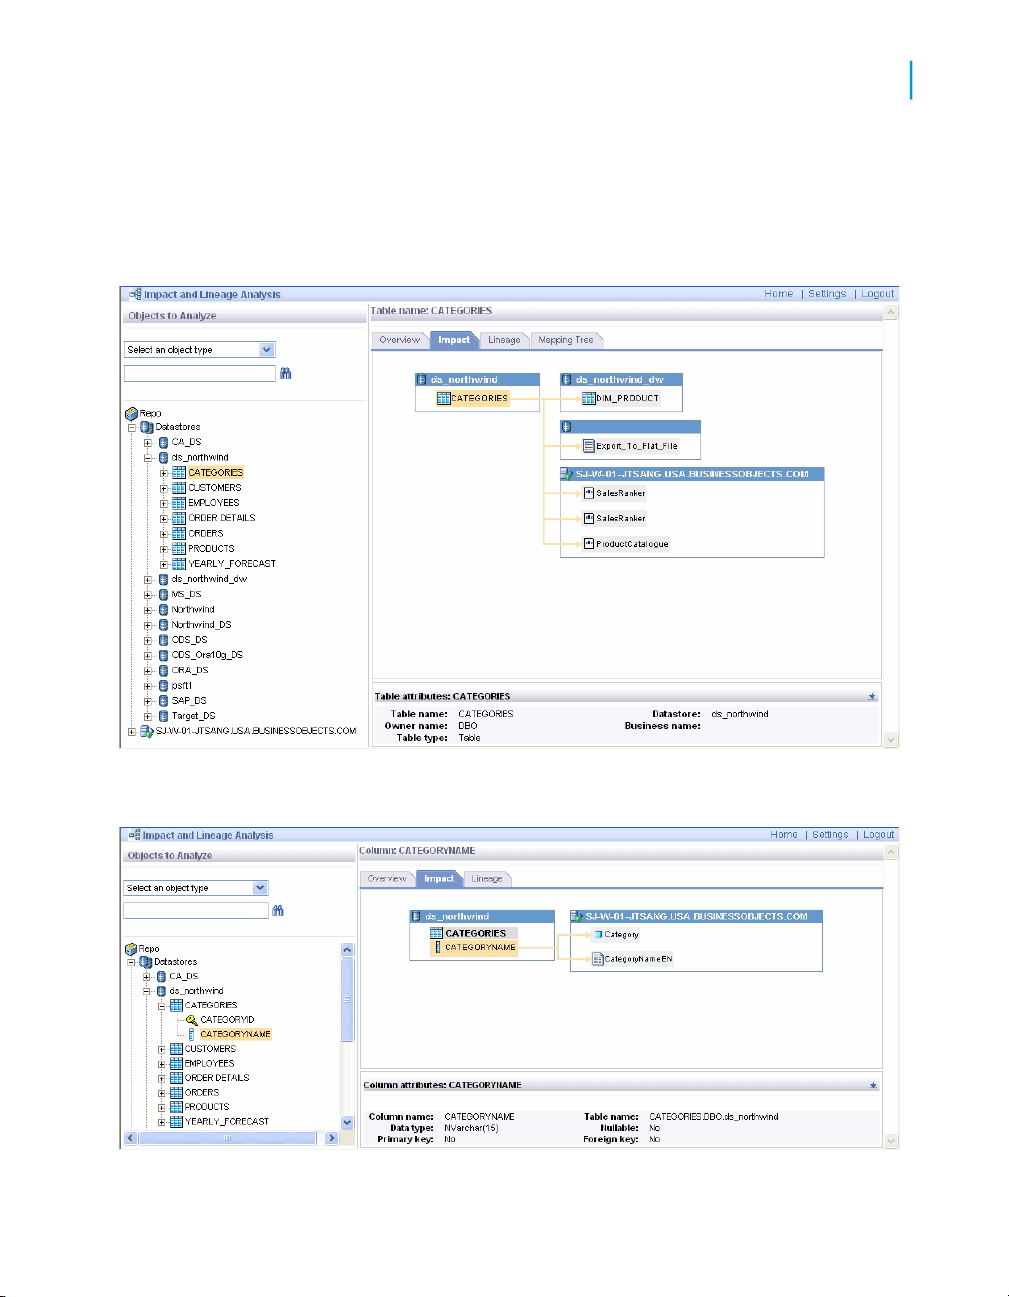
Table-level and column-level analysis
Impact and lineage analysis at the table level shows datastores, tables, and
reports/documents as shown in the following graphic.
3
Impact and lineage analysis at the column level shows datastores, objects,
fields, and reports/documents as shown in the following graphic.
Data Services Management Console: Metadata Reports Guide 35
Page 36

Impact and Lineage Analysis Reports
3
Impact and Lineage Analysis Settings control panel
Note:
If a report includes conditions predefined in a Universe, the columns used
by those conditions do not appear on the Impact and Lineage Analysis report
because the metadata collected for Universes is limited to the tables and
columns referenced directly by Universe objects.
Impact and Lineage Analysis Settings
control panel
The Impact and Lineage Analysis Settings control panel allows you to change
the options for your reports. To open it, click Settings in the upper-right
corner of the application window.
Settings tab
The Settings tab allows you to change repositories. Select a repository from
the drop-down list box and click Apply.
Refresh Usage Data tab
On the Refresh Usage Data tab, you can manually calculate column
mappings.
Calculating column mappings
Data Services can calculate information about target tables and columns
and the sources used to populate them, for example for impact and lineage
or auto documentation reports.
Calculating column mappings populates the internal ALVW_MAPPING view
and the AL_COLMAP_NAMES table. The ALVW_MAPPING view provides
current data to metadata reporting applications like Impact and Lineage
Analysis. If you need to generate a report about a data flow that processes
nested (NRDM) data, query the AL_COLMAP_NAMES table using a custom
report.
36 Data Services Management Console: Metadata Reports Guide
Page 37

Impact and Lineage Analysis Settings control panel
Whenever a column mapping calculation is in progress, the Designer displays
a status icon at the bottom right of the window. You can double-click this
icon to cancel the process.
To calculate column mappings, you can:
• Enable the option in the Designer to automatically calculate column
mappings.
• Execute the column mapping process manually from either the Designer
or the Impact and Lineage Analysis application in the Management
Console.
Related Topics
• Reference Guide: Metadata in Repository Tables and Views, Storing
nested column-mapping data
To automatically calculate column mappings
To set the option to automatically calculate column mapping information, in
the Designer select Tools > Options > Designer > General > Automatically
calculate column mappings. This option is selected by default.
Note that if the Designer option Automatically calculate column mappings
is cleared, any subsequent changes made to the data flow require that you
manually recalculate the column mappings to ensure the ALVW_MAPPING
view and the AL_COLMAP_NAMES table have the most current information.
Impact and Lineage Analysis Reports
3
To manually calculate column mappings
If the Designer option Automatically calculate column mappings is cleared
and you want to generate reports, you can manually calculate the mappings.
You can manually calculate column mappings at any time in either the
Designer or the Management Console.
In the Designer, right-click in the object library and select Repository >
Calculate column mappings.
In the Management Console:
1. Select Impact and Lineage Analysis.
2. Open the Settings control panel.
3. Click the Refresh Usage Data tab.
4. Select the Job Server that is associated with the repository you want to
use.
Data Services Management Console: Metadata Reports Guide 37
Page 38

Impact and Lineage Analysis Reports
3
Impact and Lineage Analysis Settings control panel
5. Click Calculate Column Mapping.
On the Impact and Lineage Analysis Overview tab, you can expand "Data
Flow Column Mapping Calculation" to view a list of data flows and the
calculation status of each. If the mapping calculation is complete, the "Status"
indicator is checked.
Business Objects Connections tab
Use the Business Objects Connections tab to create a connection to a
BusinessObjects Enterprise 6.5 repository.
To add a connection to a BusinessObjects Enterprise 6.5 repository
1. Click Add.
The Enter database connection information window appears.
2. Enter the following information for the repository.
DescriptionOption
Logical name for the repository.Repository name
Connection type
38 Data Services Management Console: Metadata Reports Guide
Select a Business Objects or Au-
ditor repository.
Page 39

Database type
Impact and Lineage Analysis Reports
Impact and Lineage Analysis Settings control panel
DescriptionOption
The type of database storing your
repository. Select one of the following database types:
•
DB2
•
Microsoft SQL Server
•
ODBC
•
Oracle
•
Sybase ASE
•
MySQL
3
Host name
Database port
Service Name/SID, Database
name, Server name, or Data source
User name
Password
3. (Optional) To test the database information you have specified for the
repository, click Test.
Host name where the repository
resides.
Port number of the repository or
data source.
This field requires additional information based on the Database
Type you select.
The user or owner name for the
repository or data source.
The user's account password for
the repository or data source.
Data Services Management Console: Metadata Reports Guide 39
Page 40

Impact and Lineage Analysis Reports
3
Impact and Lineage Analysis Settings control panel
If there are no Business Objects repository tables in the database, you
receive a notice that you can connect to the database but that there are
no repository tables.
4. Click Apply.
When you return to Metadata Reports, the navigation tree displays the
pertinent objects with respect to your selected repository.
To remove a connection, on the Business Objects Connections tab select
the check box for the connection and click Remove.
About tab
This tab provides Data Services version information.
40 Data Services Management Console: Metadata Reports Guide
Page 41

Operational Dashboard Reports
4
Page 42

Operational Dashboard Reports
4
Dashboards home page
Operational dashboard reports provide graphical depictions of Data Services
job execution statistics. This feedback allows you to view at a glance the
status and performance of your job executions for one or more repositories
over a given time period. You can then use this information to streamline
and monitor your job scheduling and management for maximizing overall
efficiency and performance.
For more information about how to use these reports to answer performance
questions, see the Data Services Performance Optimization Guide.
Dashboards home page
To view operational dashboards, on the Management Console home page,
click Operational Dashboards.
The upper-right corner identifies the repository for the reports you are viewing.
You can change the repository to view in the dashboards Settings control
panel.
You can drill into these dashboards for more details. The navigation path at
the top of the window indicates where you are in the operational dashboard
reports hierarchy. Click the hyperlinks to navigate to different levels. Click
the Operational tab to return to the dashboards home page.
There are two categories of dashboards: Job Execution Statistics and Job
Execution Duration. Each category contains a current (snapshot) report and
a historical (trend) report. Hence, the dashboards in the top row provide a
snapshot for the last 24 hours, and the dashboards on the bottom row display
trends over the last 7 days.
• Job execution statistics—Left side of dashboards home page. These
reports depict job execution statistics—in general, how many jobs
succeeded or had errors.
• Current (snapshot) pie chart
• Historical (trend) bar chart
• Job execution duration—Right side of page. These reports depict how
long it took the jobs to run and whether those run times were within
acceptable limits.
Each report type includes a current (snapshot) speedometer and a
historical (trend) line chart.
42 Data Services Management Console: Metadata Reports Guide
Page 43

The following sections describe the contents of these reports and their
subreports.
Job execution statistics
Job execution statistics display in two formats on the left side of the page:
• Current (snapshot) pie chart
• Historical (trend) bar chart
The color codes on these two charts apply to the status of the job's execution:
• Succeeded (green)
• One or more warnings (orange)
• One or more errors (red)
• Still running (blue)
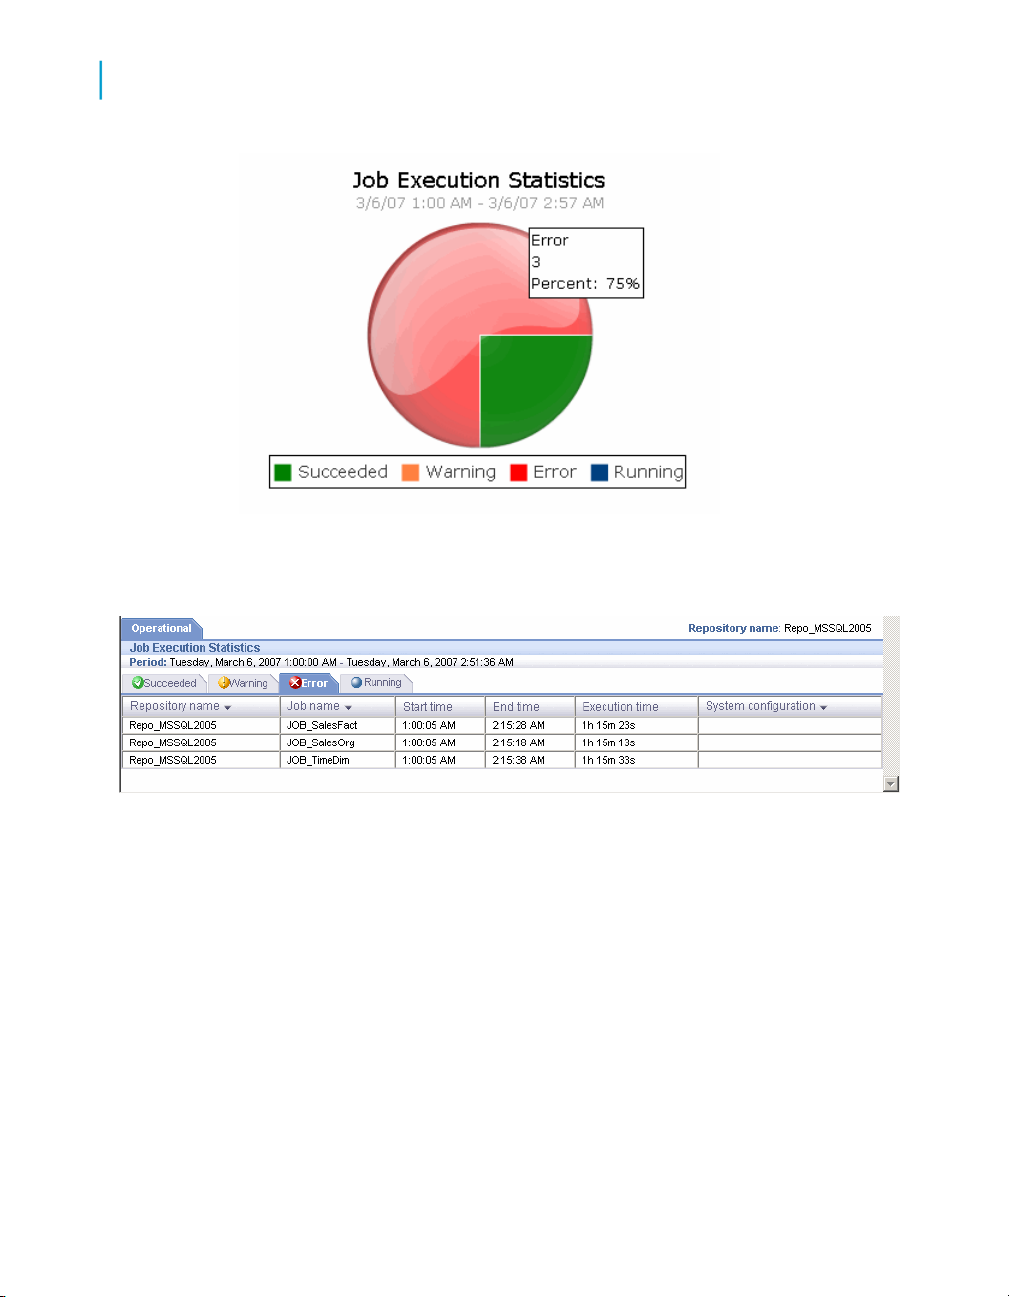
Current (snapshot) pie chart
The pie chart displays status information for jobs that ran in the time period
displayed. You can change the start time and execution time window in the
dashboard Settings control panel (see Configuring the Job Execution Duration
dashboard on page 46).
Operational Dashboard Reports
Job execution statistics
4
The chart identifies the number and ratio of jobs that succeeded, had one
or more warnings, had one or more errors, or are still currently running.
Data Services Management Console: Metadata Reports Guide 43
Page 44
Operational Dashboard Reports
4
Job execution statistics
Click on the pie "slices" to drill into the report, which displays a table that
shows the jobs in that status group. From there you can click on the status
tabs to view the list of jobs in each group.
Each Job Execution Statistics table includes:
• Repository name—The repository associated to this job
• Job name—The name of the job in the Designer
• Start time and End time—The start and end timestamps in the format
hh:mm:ss.
• Execution time—The elapsed time to execute the job
• System configuration—The name of the system configuration that applies
to that job.
44 Data Services Management Console: Metadata Reports Guide
Page 45
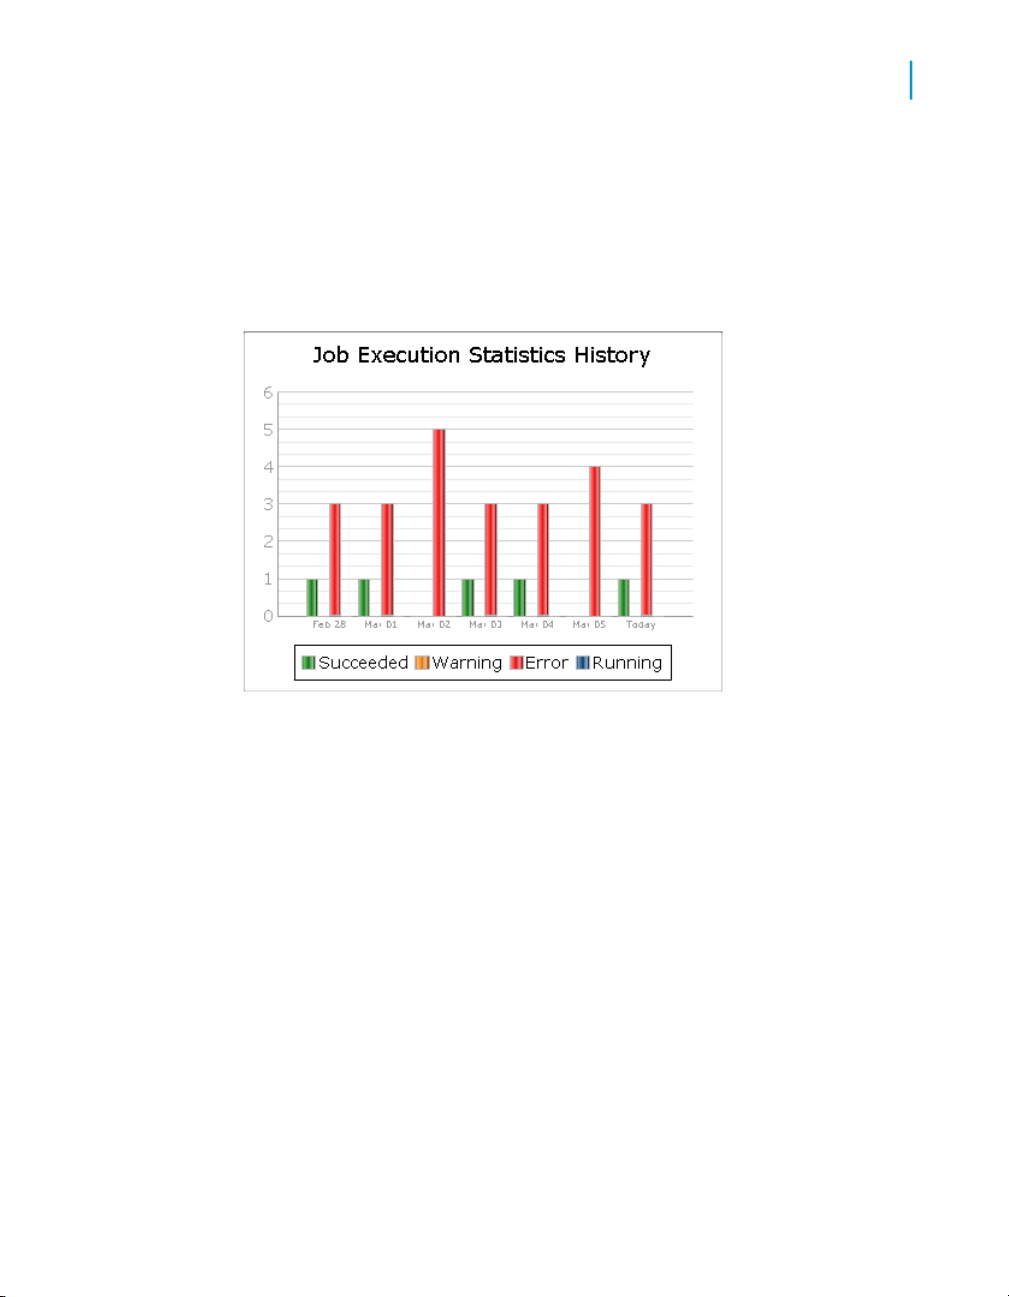
Historical (trend) bar chart
The Job Execution Statistics History bar chart depicts how many jobs
succeeded, had warnings, failed, or are still currently running on each of the
last 7 days.
Operational Dashboard Reports
Job Execution Duration
4
As with the Job Execution Statistics pie chart, you can click on the individual
bars to drill into the report to display the Job Execution Statistics status tables
(succeeded, warning, error, and so on) for a particular day. See Current
(snapshot) pie chart on page 43 for details on the Job Execution Statistics
tables.
Job Execution Duration
Job Execution Duration reports display in two dashboards on the right side
of the dashboards home page:
• Current (snapshot) pie chart
• Historical (trend) line chart
These two charts describe whether all jobs in the selected repositories
executed within the acceptable time frame that you established using the
dashboard Settings control panel. This window is the amount of time that
Data Services Management Console: Metadata Reports Guide 45
Page 46

Operational Dashboard Reports
4
Job Execution Duration
you allot to run your jobs so your target data warehouse is available to
applications and users during business hours, for example.
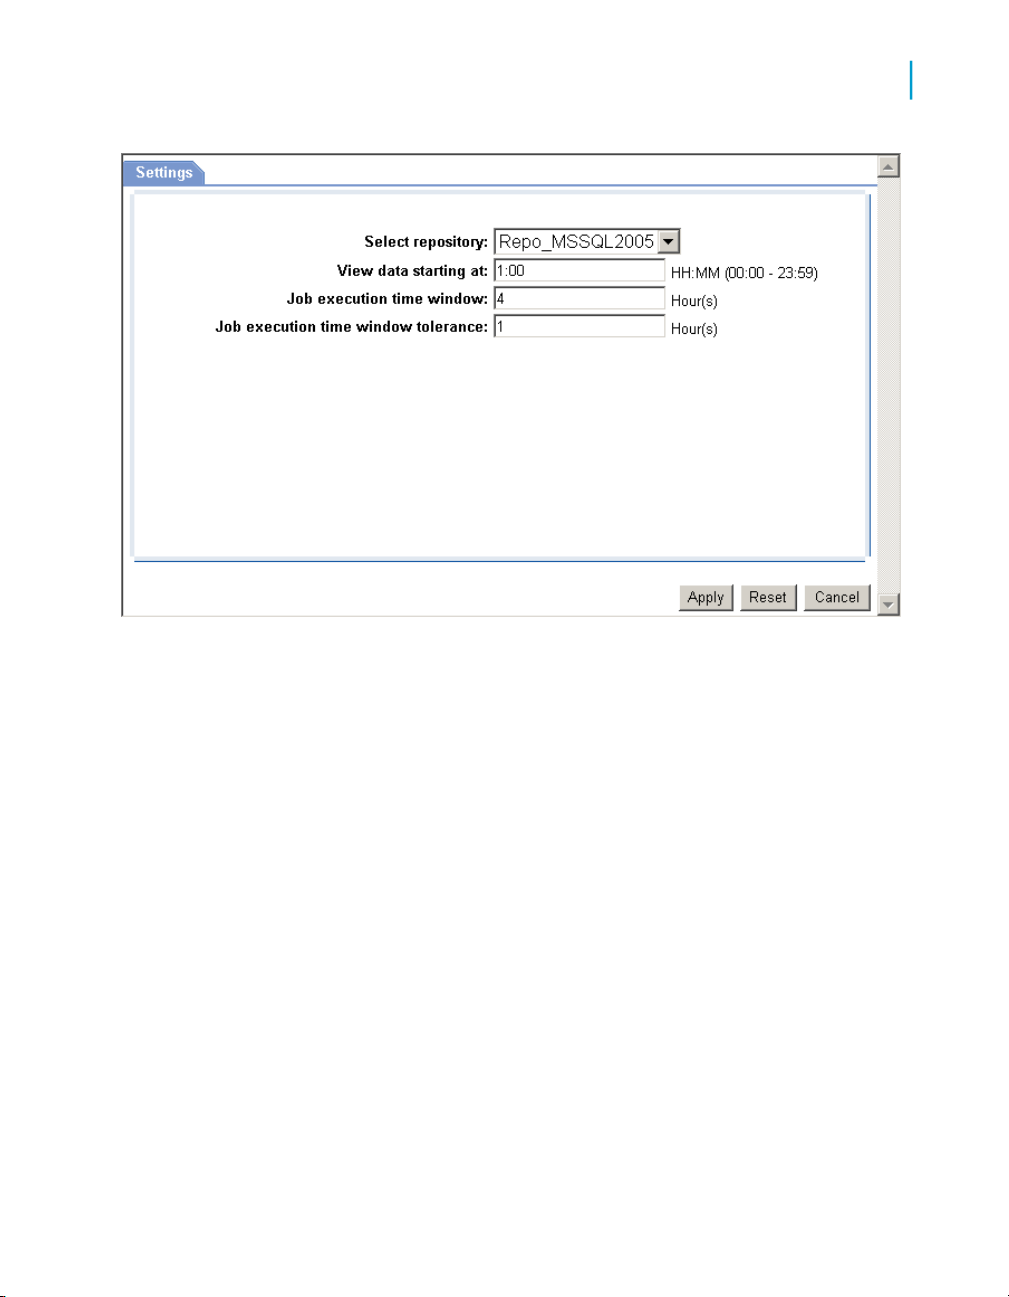
Configuring the Job Execution Duration dashboard
The recommended process for setting up the Job Execution Duration
dashboards is as follows.
1. In the Administrator, schedule your jobs for when you want them to run.
Example: Schedule all jobs to start executing at 1:00 AM.
2. In the Operational Dashboards application, click Settings to open the
control panel.
3. Select the repository to configure.
4. For the View data starting at value, enter the beginning of the time frame
in which you want to view job execution as a whole on the speedometer
dashboard (in the format HH:MM, from 00:00 to 23:59).
For example, if all of your jobs begin to execute at 1:00 AM, it would be
logical to set the View data starting at value to 1:00.
5. Enter a value for Job execution time window in number of hours (from
0 to 24) that you have available to run your ETL jobs.
For example, if you want all of your jobs to finish executing by 5 AM, enter
4 hours, which would be the time window between 1 AM and 5 AM.
6. Optionally, add a value for the Job execution time window tolerance
in increments of 1 hour.
Note:
The total of the Job execution time window value and the Job execution
time window tolerance value cannot exceed 24.
For example, suppose you determine that in some circumstances it is ok
if some jobs finish executing by 6 AM. In this case, set the Job execution
time window tolerance to 1 (extending the window from 5 AM to 6 AM).
46 Data Services Management Console: Metadata Reports Guide
Page 47
Operational Dashboard Reports
Job Execution Duration
4
Current (snapshot) speedometer
The speedometer graphic displays the current window of time allotted for
your jobs to complete their executions and whether or not the jobs as a whole
finished within the selected job execution time window.
Note:
This dashboard does not indicate whether a job succeeded or had errors; it
only displays execution duration. Drill into the speedometer dashboard to
see a Gantt chart that displays whether or not the job succeeded and if and
where it finished executing within the job execution time window.
Continuing with the example described in the preceding process, the following
morning, after running your jobs overnight, you want to verify they executed
within the time window of 1 AM to 5 AM. Open the Operational Dashboards
application and view the Job Execution Duration speedometer dashboard.
The speedometer needle points in the green zone, which represents the Job
execution time window setting in the Settings control panel. In the example,
that setting was 4 hours (from 1:00 AM to 5:00 AM). Therefore, all jobs in
the repository finished executing within the desired time frame.
Data Services Management Console: Metadata Reports Guide 47
Page 48

Operational Dashboard Reports
4
Job Execution Duration
The solid red bar indicates when the first job actually started, which in the
case of the example was 1:00 AM.
The time below the needle hub indicates when the last job finished executing
for the selected repository. If the start time of the first job execution and the
View data starting at value are the same, as in the example, that value
equates to the total execution time for all the jobs (1:15 in the example).
If, however, you entered a View data starting at value other than when the
first job actually started, to calculate the overall job execution duration period,
subtract the time the first job started (indicated by the red bar and noted
below the dashboard) from the time below the needle hub.
The time period displayed above the speedometer graphic indicates the
viewing period. For example,
3/6/07 1:00 AM - 3/6/07 2:57 PM
indicates that you are viewing a dashboard that reflects all jobs that ran
between 1:00 AM and 2:57 PM. The time 1:00 AM is the same as the View
data starting at value. The time 2:57 PM is when you opened the Operational
Dashboards control panel, which acts as a time stamp for the end period of
the data you are actually viewing.
Therefore, the color zones on both Job Execution Duration dashboards (the
speedometer and the history line chart) represent:
• Green (normal)—All jobs executed within the job execution time window.
Specify this window with the Job execution time window setting. The
green range of the speedometer represents this value.
• Yellow (warning)—At least one job finished executing during the tolerance
period. Tolerance is the amount of time that jobs can run beyond your
normal Job execution time window. Specify this tolerance limit with the
Job execution time window tolerance setting. This value is represented
in the yellow range of the speedometer and in line charts, and it defines
the red line limit on Gantt charts.
• Red (exceeded)—At least one job finished executing beyond the normal
or warning (tolerance) limits.
48 Data Services Management Console: Metadata Reports Guide
Page 49

Viewing job execution duration details
Click on the speedometer dashboard to drill into the report and display a
Gantt chart of the Job Execution Duration for all jobs.
In the Job Execution Duration Gantt chart, each job shows its start time, end
time, and status (succeeded, warning, and so on). The orange line denotes
the high end of the Job execution time window setting, and the red line
indicates the high end of the Job execution time window tolerance setting.
You can move the cursor over the Gantt bars to view a pop-up window with
the Job Execution Duration (total elapsed time).
Operational Dashboard Reports
Job Execution Duration
4
You can view Job Execution Duration (and Data Flow Execution Duration)
information in both graphical and tabular formats. Click the Graph or Table
tabs accordingly.
The Job Execution Duration table displays the repository name, the job name
(for successful jobs, you can click its name to drill in to the Data Flow
Execution Duration table), the start and end time of the job execution, the
execution time (elapsed), the status, and whether the job is associated with
a system configuration.
Viewing data flow execution duration details
From the Job Execution Duration details Graph window, you can drill into a
job for its data flow execution duration times and audit details if applicable.
Click on a job's Gantt bar to display the Data Flow Execution Duration Gantt
chart:
Data Services Management Console: Metadata Reports Guide 49
Page 50

Operational Dashboard Reports
4
Job Execution Duration
The Data Flow Execution Duration Gantt chart lists the data flows in the job
and the execution duration of each. It also shows the Job execution time
window (orange) and Job execution time window tolerance (red) limits.
You can move the pointer over the Gantt bars to view a pop-up window of
the execution duration (elapsed time), and if you enabled auditing for the
job, the audit status also displays:
• Not audited
• Success—All audit rules succeeded
• Collected—This status occurs when you define audit labels to collect
statistics but do not define audit rules
• Failed—Audit rule failed
You can view Data Flow Execution Duration (and Job Execution Duration)
information in both graphical and tabular formats. Click the Graph or Table
tabs accordingly.
The Data Flow Execution Duration table shows the repository name, the
data flow name, the job name, the start and end time of the data flow
execution, the execution time (elapsed), the number of rows extracted and
loaded, and the audit status. You can view the Audit Details page from the
Table tab by clicking on a value in the Audit status column.
Viewing audit details
If auditing has been enabled, on the Data Flow Execution Duration Gantt
chart (Graph), click on the Gantt bar for the data flow to display the Audit
Details page.
In addition to job name, data flow name, and job start time, the report includes:
50 Data Services Management Console: Metadata Reports Guide
Page 51

• Audit rule information if applicable
• Audit failed information if applicable
• A table with the audit labels and values
Historical (trend) line chart
The Job Execution Duration History line chart shows the trend of job execution
performance over the last 7 days. The vertical axis is in hours, the horizontal
axis shows the date, and the colored dots indicate the overall results of job
execution duration based on the settings defined in the Settings control panel.
Operational Dashboard Reports
Job Execution Duration
4
Each point denotes the Job Execution Duration (total elapsed time) of all the
jobs for that day.
Click on the points to drill in to display the Job Execution Duration Gantt
chart.
Also as with the speedometer dashboard, you can drill into the job for data
flow execution duration times and audit details by clicking on a Gantt bar to
display the Data Flow Execution Duration window. Additionally, if auditing
has been enabled, click on the Gantt bar to display the Audit Details page.
Click the View all history button to display two tables:
Data Services Management Console: Metadata Reports Guide 51
Page 52

Operational Dashboard Reports
4
Job Execution Duration
• Job Execution History—This table lets you view execution history for
• Data Flow Execution History—This table includes three options for
all jobs or individual jobs. You can also select over how many days you
want to view the history.
This table displays the same information as in the Job Execution Duration
table: repository name, job name, the start and end time of the job
execution, the execution time (elapsed), the status, and whether the job
is associated with a system configuration.
customizing the display:
• Data Flow—Enter a data flow name for which to search and click
Search.
• Job Name—Select all jobs or an individual job.
• View history for x days—Select over how many days you want to
view the history
This table displays almost the same information as in the Data Flow
Execution Duration table: repository name, data flow name, job name,
the start and end time of the data flow execution, the execution time
(elapsed), and the number of rows extracted and loaded.
Related Topics
• Configuring the Job Execution Duration dashboard on page 46
• Current (snapshot) speedometer on page 47
52 Data Services Management Console: Metadata Reports Guide
Page 53
Data Validation Dashboard Reports
5
Page 54

Data Validation Dashboard Reports
5
Configuring Data Validation dashboards
Data Validation dashboard reports provide graphical depictions that let you
evaluate the reliability of your target data based on the validation rules you
created in your Data Services batch jobs. This feedback allows business
users to quickly review, assess, and identify potential inconsistencies or
errors in source data.
Configuring Data Validation dashboards
To generate meaningful Data Validation dashboards, follow this process:
1. In your Data Services jobs in Designer, create data flows that contain
validation transforms with validation rules.
You use validation transforms to:
• Verify that your source data meets your business rules.
• Take the appropriate actions when the data does not meet your
business rules.
2. In the Data Validation application, create functional areas. A functional
area is a virtual group of jobs that relate to the same business function,
for example Human Resources or Customers. Functional areas can
contain multiple Data Services jobs and one or more data validation
business rules.
3. In the Data Validation application, create business rules. Business rules
are typical categories of data, for example Social Security Number or
Address.
These business rules contain validation rules that you created in your
validation transforms in your data flows.
Begin by opening the Management Console and clicking the Data Validation
name or icon link on the Home page.
Related Topics
• Creating functional areas on page 55
• Creating business rules on page 57
• Designer Guide: Data Assessment, Using the Validation transform
54 Data Services Management Console: Metadata Reports Guide
Page 55

Creating functional areas
After you create data flows with validation transforms and rules in Data
Services Designer, next create functional areas.
Note:
If you do not create any functional areas, the dashboard displays statistics
for all jobs for the selected repository.
To create functional areas
1. In the Data Validation module, click the Settings link.
The Repository tab displays.
2. Verify the desired repository displays.
To change the repository, select a different one from the drop-down list
and click Apply.
Data Validation Dashboard Reports
Configuring Data Validation dashboards
5
3. Click the Functional area tab.
The selected repository displays.
4. Type a name for the new functional area (such as Customer) and
optionally a description.
5. Click Save.
A list of batch jobs (and the associated system configuration for each, if
any) appears that lets you select the jobs you want to include in this
functional area.
You can change the sort order of the table by clicking the arrow in a
column heading.
6. From the list of Available batch jobs, select the check box for each job to
include in this functional area and click the arrow button to move it to the
Associated batch jobs window.
• Jobs are not reusable among functional areas.
Data Services Management Console: Metadata Reports Guide 55
Page 56

Data Validation Dashboard Reports
5
Configuring Data Validation dashboards
• In the Data Services Administrator, deleting job information on the
Batch Job Status page (Batch Jobs History) also clears data validation
statistics from Data Validation Metadata Reports.
7. Click Apply to save the changes and keep the Functional area window
open, for example to add more functional areas.
Clicking OK saves your changes and closes the Settings control panel.
Clicking Cancel closes the Settings control panel without saving changes.
To add another functional area, on the Functional area tab click Add and
follow steps 4 through 7 in the previous procedure.
To display a different functional area for editing, select it from the drop-down
list.
Delete a functional area by clicking Delete next to the functional area selected
in the drop-down list.
56 Data Services Management Console: Metadata Reports Guide
Page 57

Next, create business rules to associate the validation rules in your data
flows with your functional areas as described in the next section.
Related Topics
• Designer Guide: Datastores, Creating and managing multiple datastore
configurations
Creating business rules
After creating functional areas, associate business rules to each functional
area as follows.
Note:
If you do not create business rules, each validation rule in the jobs that you
have associated with a functional area becomes its own business rule.
To create business rules
Data Validation Dashboard Reports
Configuring Data Validation dashboards
5
1. In the Settings control panel, click the Business rule tab.
On the Business rule tab, the default repository displays. (To change the
repository, click the Repository tab, select a different repository, and click
Apply.)
2. From the drop-down list, select the functional area to which this business
rule will belong.
3. In the business rule definition area, type a name for the business rule
such as Phone number.
4. Select a priority for how significant this group will be to your business end
users: High, Medium, or Low.
5. Type an optional description for the business rule such as Phone and
FAX. In this example, the validation rule checks to see if telephone and
fax numbers in the USA conform to the seven-digit standard.
6. Click Save.
A list of validation rules appears. Select the validation rules you want to
include in this business rule. See the table below for a description of the
columns in the lists of validation rules (scroll horizontally to view the other
columns).
Data Services Management Console: Metadata Reports Guide 57
Page 58

Data Validation Dashboard Reports
5
Configuring Data Validation dashboards
7. From the list of Available validation rules, select the check box for all of
the rules to include in this business rule and click the arrow button to
move it to the Associated validation rules pane.
Note:
Validation rules are not reusable among business rules (you can use a
validation rule only once and only in one business rule).
8. Click Apply to save the changes and keep the Business rule window
open, for example to add more business rules.
Clicking OK saves your changes and closes the Settings control panel.
Clicking Cancel closes the Settings control panel without saving changes.
The columns in the validation rule lists are as follows. Scroll horizontally to
view the other columns. Note that you can change the sort order of the tables
by clicking the arrow in a column heading.
58 Data Services Management Console: Metadata Reports Guide
Page 59

Data Validation Dashboard Reports
Configuring Data Validation dashboards
DescriptionColumn
5
Validation rule name
Description
Full path
System configuration
To add another business rule, on the Business rule tab click Add and follow
steps 3 through 8 in the previous procedure.
To display a different functional area so you can edit its business rules, select
it from the Functional area drop-down list.
The validation rule name in Data Services. The default is the column name unless you create a new
name in the validation transform Properties dialog
box.
The description for the validation rule in Data Services.
Describes the hierarchy in Data Services from the
job level to the data flow level to indicate where this
validation rule has been defined.
The name of the system configuration selected for
this job.
To display a different business rule for editing, select it from the Business
rule drop-down list.
Delete a business rule by clicking Delete next to the business rule selected
in the drop-down list.
Related Topics
• Designer Guide: Data Assessment, Using the Validation transform
• Designer Guide: Datastores, Creating and managing multiple datastore
configurations
Data Services Management Console: Metadata Reports Guide 59
Page 60

Data Validation Dashboard Reports
5
Viewing Data Validation dashboards
Enabling data validation statistics collection
To enable data validation statistics collection for your reports, you must verify
two options—one at the validation transform level and one at the job execution
level.
Validation transform level
In Designer, navigate to the validation transforms from which you want to
collect data validation statistics for your reports. For the columns that have
been enabled for validation, in the transform editor click the Validation
transform options tab and select the check box Collect data validation
statistics.
Job execution level
When you execute a job, the Execution Properties window displays. On the
Parameters tab, clear the option Disable data validation statistics
collection (the default) before executing the job.
To execute a job without collecting statistics, select the Disable data
validation statistics collection option, which suppresses statistics collection
for all the validation rules in that job.
Viewing Data Validation dashboards
To view Data Validation dashboards, on the Management Console Home
page, click Data Validation. The functional area view displays.
The upper-right corner identifies the repository for the reports you are viewing.
You can change the repository to view in the Settings control panel.
Some dashboards let you to drill in to some of the components for more
details. The navigation path at the top of the window indicates where you
are in the Data Validation dashboard reports hierarchy. Click the hyperlinks
to navigate to different levels.
60 Data Services Management Console: Metadata Reports Guide
Page 61

Related Topics
• Functional area view on page 61
• Repository tab on page 68
Functional area view
The top-level Data Validation dashboard view is the functional area view.
This view includes two dashboards:
•
Functional area pie chart on page 61—A current (snapshot) report.
•
History line chart on page 63—A historical (trend) report that displays
trends over the last 7 days. To display this chart, click the link below the
pie chart.
To change the functional area dashboards to view, select a different functional
area from the drop-down list at the top of the window. Select All to view data
for all batch jobs in that repository.
If there are no functional areas defined, the chart displays statistics for all
jobs for the selected repository.
Data Validation Dashboard Reports
Functional area view
5
Functional area pie chart
The pie chart displays status information for jobs that ran in the time period
displayed. The data collection period begins at the time set on the Repository
tab in the Settings control panel (see Repository tab on page 68) and ends
with the time you open the report Web page.
Data Services Management Console: Metadata Reports Guide 61
Page 62

Data Validation Dashboard Reports
5
Functional area view
The color codes on this chart apply to the volume of validation rules that
passed or failed:
• Green—The percentage of rules that passed for the selected functional
area.
• Red—The percentage of rules that failed for the selected functional area
with a High priority label.
Note:
If you have All selected for Functional area, the failed portion appears
red and does not include priority information.
• Orange—The percentage of rules that failed for the selected functional
area with a Medium priority label.
• Blue—The percentage of rules that failed for the selected functional area
with a Low priority label.
See Creating business rules on page 57 for how to set the priority labels.
Click on the failed pie "slices" to drill into the report:
• If there is at least one functional area and business rule defined, the
Business rule view displays. See Business rule view on page 63.
62 Data Services Management Console: Metadata Reports Guide
Page 63

• If no functional areas or business rules are defined, the Validation rule
view displays. See Validation rule view on page 65.
History line chart
The History line chart displays the percentage of all validation rule failures
that occurred on each of the last 7 days. Data Services collects the number
of failures for the last run of all of the batch jobs that are associated with this
functional area on each day.
To display the History line chart, click the link below the pie chart.
Business rule view
The Business rule dashboard is a bar chart that shows the percentage of
validation failures for each defined business rule. You access this chart by
clicking on one of the failed “slices” of the functional area pie chart.
Data Validation Dashboard Reports
Business rule view
5
Note:
If no functional areas or business rules have been defined, drilling down on
the functional area pie chart displays the Validation rule view. Therefore, the
“business rules” are the same as the validation rules.
The data collection period begins at the time set on the Repository tab in the
Settings control panel (see Repository tab on page 68) and ends with the
time you open the report Web page.
Data Services Management Console: Metadata Reports Guide 63
Page 64

Data Validation Dashboard Reports
5
Business rule view
You can filter the view by selecting an option from the Priority drop-down
list:
• All
• High priority
• Medium priority
• Low priority
The chart displays 10 bars per page; click the Next or Previous links to view
more.
To view the business rules associated with another functional area, select
it from the Functional area drop-down list.
To see the validation rules that apply to a particular business rule, click on
that bar in the chart. The Validation Rule View displays. See Validation rule
view on page 65.
64 Data Services Management Console: Metadata Reports Guide
Page 65

Validation rule view
When you view the Functional area pie chart (the Data Validation Home
page) and click on one of the failed pie “slices” to drill into the report, if no
functional areas or business rules have been defined, the Validation rule
view displays.
Note:
If no Functional areas or Business Rules have been defined, drilling down
on the functional area pie chart displays the Validation rule view. Therefore,
the “business rules” are the same as the validation rules.
The Validation Rule page includes two dashboards:
•
Validation rule bar chart on page 65—A current (snapshot) report.
•
History line chart on page 66—A historical (trend) report that displays
trends over the last 7 days. To display this chart, click the link below the
Validation rules bar chart.
The chart displays 10 bars per page; click the Next or Previous links to view
more.
Data Validation Dashboard Reports
Validation rule view
5
To view the validation rules for a different business rule, select it from the
Business rule drop-down list.
Validation rule bar chart
The Validation rule bar chart displays the percentage of rows that failed for
each validation rule.
The Data collection period begins at the time set on the Repository tab in
the Settings control panel (see Repository tab on page 68) and ends with
the time you open the report Web page.
Data Services Management Console: Metadata Reports Guide 65
Page 66

Data Validation Dashboard Reports
5
Sample data view
You can click on a bar to display the Sample data view. (See Sample data
view on page 66.)
History line chart
The History line chart displays the percentage of all validation rule failures
that occurred on each of the last 7 days. Data Services collects the number
of failures for the last run of all of the batch jobs that are associated with this
functional area.
To display this chart, click the link below the Validation rules bar chart.
Sample data view
If you have enabled the option to collect sample data in a validation transform,
the Sample data page includes two images:
•
Sample data table on page 67
•
History line chart on page 67
66 Data Services Management Console: Metadata Reports Guide
Page 67

If you have not configured the validation transform to collect sample data,
only the History line chart displays.
To view sample data from another validation rule, select it from the drop-down
list.
Sample data table
If you have configured the validation transform to collect sample data , this
page displays up to 50 rows of sample data in tabular form.
The column that maps to the currently selected validation rule appears
highlighted.
History line chart
The History line chart displays the percentage of all validation rule failures
that occurred on each of the last 7 days. Data Services collects the number
of failures for the last run of all of the batch jobs that are associated with this
functional area.
Data Validation Dashboard Reports
Data Validation dashboards Settings control panel
5
To display this chart, click the link below the sample data table.
Data Validation dashboards Settings
control panel
The dashboard settings window allows you to change the options for your
reports.
In the upper-right corner of the window, click Settings.
The three settings tabs are:
•
Repository tab on page 68
•
Functional area tab on page 68
•
Business rule tab on page 68
For all of the Settings pages:
Data Services Management Console: Metadata Reports Guide 67
Page 68

Data Validation Dashboard Reports
5
Data Validation dashboards Settings control panel
• Click Apply to save the changes and keep the Business rules dialog box
open, for example to add more business rules.
• Clicking OK saves your changes and closes the Settings control panel.
• Clicking Cancel closes the Settings control panel without saving changes.
Repository tab
The settings on the Repository tab include:
• Repository—Select a repository to view from the drop-down list.
• View data starting at—Enter the time from when you want start viewing
data in the format HH:MM (from 00:00 to 23:59). On the Data Validation
dashboard charts, the end of the time window is the moment you open
one of the dashboard Web pages.
For example, entering 02:00 means your data validation reports will display
data from the repository starting at 2:00 a.m. through the time you open
the report page. Each dashboard page displays the time frame for which
the dashboard statistics apply.
Functional area tab
For details on how to use the Functional area tab settings, see Creating
functional areas on page 55.
Business rule tab
For details on how to use the business rule tab settings, see Creating
business rules on page 57.
68 Data Services Management Console: Metadata Reports Guide
Page 69

Auto Documentation Reports
6
Page 70

Auto Documentation Reports
6
Navigation
Auto Documentation reports provide a convenient and comprehensive way
to create printed documentation for all of the objects you create in Data
Services. Auto Documentation reports capture critical information for
understanding your Data Services jobs so you can see at a glance the entire
ETL process.
After creating a Data Services project, you can use Auto Documentation
reports to quickly create a PDF or Microsoft Word file that captures a selection
of job, work flow, and/or data flow information including graphical
representations and key mapping details.
The types of information provided by Auto Documentation reports include:
• Object properties—Apply to work flows, data flows, and R/3 data flows
• Variables and parameters—Apply to jobs, work flows, data flows, and
• Table usage—Shows all tables used in this object and its child objects.
• Thumbnails—An image that reflects the selected object with respect to
• Mapping tree—Applies to data flows
R/3 data flows
For example for a data flow, table usage information includes datastores
and the source and target tables for each
all other objects in the parent container. Applies to all objects except jobs.
The next section includes object descriptions that describe these components
in more detail as they apply to that object.
Navigation
Auto Documentation reports allow you to navigate to any project, job, work
flow, data flow, or R/3 data flow created in Designer and view information
about the object and its components.
To open Auto Documentation reports, from the Management Console Home
page, click Auto Documentation.
Auto Documentation navigation is similar to that of Impact and Lineage
reports. The Auto Documentation page has two primary panes:
• The left pane shows a hierarchy (tree) of objects.
• The right pane shows object content and context.
70 Data Services Management Console: Metadata Reports Guide
Page 71
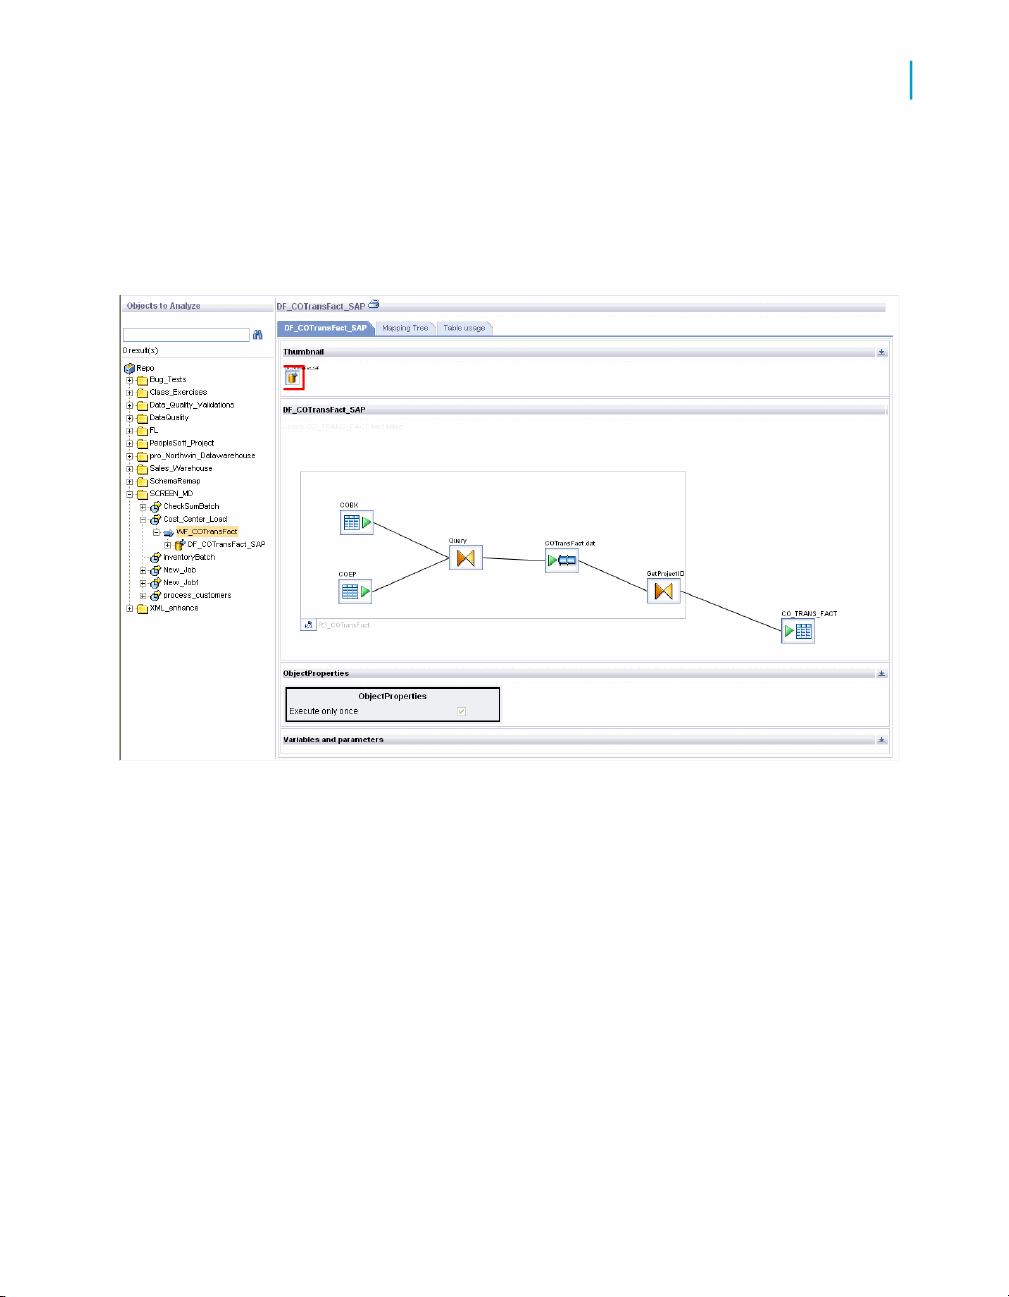
Auto Documentation Reports
Navigation
Expand the tree to select an object to analyze. Select an object to display
pertinent information in the right pane. In the right pane, select tabs to display
desired information. Tabs vary depending on the object you are exploring.
Note that if the subcategory within a tab has a window icon on the far right
side of its header bar, you can collapse or expand that part of the display.
6
Related Topics
• Impact and Lineage Analysis Reports on page 25
To search for a specific object
1. Type the object name in the Objects to analyze search field. The search
field is not case sensitive, you may use the percent symbol (%) as a
wildcard, and spaces are allowed.
2. Click the search icon (binoculars) or press Enter.
The top level of the navigation tree displays the current repository. You can
change this repository in the Settings control panel.
When you first open Auto Documentation, in the right pane the Project tab
displays with hyperlinks to the projects in the repository. You can click on
Data Services Management Console: Metadata Reports Guide 71
Page 72

Auto Documentation Reports
6
Navigation
these links to drill into the project to display a list of jobs. You can also
continue to click the job name links to continue drilling into objects for more
information (thumbnails, object properties, and so on).
You can also navigate to this content by selecting objects in the navigation
tree. The hierarchy of the tree matches the hierarchy of objects created in
Designer.
Repository
Project
Job
Work flow
Data flow
Repository
Clicking a repository name in the navigation tree displays the Overview tab
in the right pane, which includes the following:
• Repository name—The name given to the repository in the Repository
Manager
• Repository type—The type of repository such as the database type
• Repository version—The Data Services repository version
Project
Clicking on a project name in the navigation tree displays the Project tab in
the right pane, which displays the list of jobs in the project. You can click on
these jobs to drill into the hierarchy.
Job
Clicking on a job name displays information on two tabs:
• Name of job—This tab includes:
72 Data Services Management Console: Metadata Reports Guide
Page 73

• Table usage—This tab lists the datastores and associated tables
Work flow
Clicking on a work flow name displays information on two tabs:
• Name of work flow—This tab includes:
Auto Documentation Reports
Navigation
• Description
• A graphical image of the next level of objects in the job (for example
one or more work flows or data flows)
• Variables and parameters used in the job
contained in the selected object if applicable.
• Thumbnail—This image reflects the selected object with respect to all
other objects in the parent container.
For example, if this work flow is the only one in the job, it appears
alone; but if there are two other work flows in the job, they will also
appear in the thumbnail image. You can click the other thumbnail
images to navigate to them, which replaces the content in the right
pane with that of the selected object.
6
Data flow
• A graphical image of the object's workspace window as it appears in
Designer.
You can click on objects to drill into them for more details. Objects
that have a workspace in Designer will display that workspace.
• Object properties—Displays properties such as Execute only once
or Recover as a unit if set.
• Variables and parameters used in the work flow
• Table usage—This tab lists the datastores and associated tables
contained in the selected object if applicable.
Clicking a data flow name displays information on three tabs:
Data Services Management Console: Metadata Reports Guide 73
Page 74

Auto Documentation Reports
6
Navigation
• Name of data flow—This tab includes:
• Thumbnail—This image reflects the selected object with respect to all
other objects in the parent container.
• A graphical image of the object's workspace window as it appears in
Designer.
You can click on an object in the data flow to drill into it for more
information:
A table displays the following information when selected:
• A thumbnail of the table with respect to the other objects in the
data flow
• Table properties including Optimizer hints (caching and join rank
settings) and Table basics (datastore and table name)
A transform displays the following information when selected:
• A thumbnail of the transform with respect to the other objects in
the data flow
• Mapping details including column names, mapping expressions,
descriptions, and data types.
To go to the top level of the data flow object, click the data flow name
in the navigation tree, or click the Back button on your browser.
• Object properties—Data flow properties such as Execute only once
and Degree of parallelism
• Variables and parameters used in the job
• Mapping tree—This tab displays a list of target tables. You can expand
or collapse each table display by clicking its header bar. Each target table
lists its target columns and the mapping expressions (sources) for each.
• Table usage—This tab lists the datastores and associated tables
contained in the selected object if applicable.
74 Data Services Management Console: Metadata Reports Guide
Page 75

Auto Documentation Reports
Generating documentation for an object
Generating documentation for an object
For most objects, you can quickly generate documentation in Adobe PDF or
Microsoft Word format by clicking the printer icon next to the object name in
the right pane.
6
To print Auto Documentation for an object
1. Select the highest-level object you want to document in the left pane.
2. In the right pane, click the printer icon next to the object name.
3. In the Print window, select the check boxes for the items to include in
your printed report.
4. Select PDF or Microsoft Word format.
5. Click Print.
The Windows File download dialog box displays. Click Open to generate
and open the file now, or click Save to save the file to any location.
6. After saving or printing your report, click Close to close the Print window.
Data Services Management Console: Metadata Reports Guide 75
Page 76

Auto Documentation Reports
6
Auto Documentation Settings control panel
Auto Documentation Settings control
panel
The Auto Documentation Settings control panel allows you to change the
options for your reports.
In the upper-right corner of the window, click Settings.
The Auto Documentation settings tabs are:
• Repository—Select a repository from the drop-down list box and click
Apply.
• About—Provides Data Services version information.
76 Data Services Management Console: Metadata Reports Guide
Page 77

Data Quality Reports
7
Page 78

Data Quality Reports
7
Lists of available reports
Many data quality transforms generate information about the data being
processed. Data quality reports provide access to that data processing
information. You can view and export these Crystal reports for batch and
real-time jobs. The statistics-generating transforms include Match, USA
Regulatory Address Cleanse, and Global Address Cleanse transforms. Report
types include job summaries, transform-specific reports, and transform group
reports.
To enable report generation, ensure the option Generate report data in the
transform editor is enabled, or use substitution parameters to set this and
other transform options at a repository level. For details on setting the options
for transforms, see the Data Services Reference Guide. For details on using
substitution parameters, see the Data Services Designer Guide.
To view data quality reports, on the Management Console Home page, click
Data Quality Reports. The Batch job reports tab displays.
The following table lists the available reports and their associated transforms.
Transform(s)Report
USA Regulatory Address CleanseUSA CASS report: USPS Form 3553
USA Regulatory Address CleanseNCOALink Processing Summary Report
Global Address CleanseCanadian SERP report: Statement of
Address Accuracy
Global Address CleanseAustralian AMAS report: Address
Matching Processing Summary
Address Information Codes Sample report
Address Information Code Summary
report
Address Validation Summary report
Address Type Summary report
Address Standardization Sample
78 Data Services Management Console: Metadata Reports Guide
Global Address Cleanse and USA
Regulatory Address Cleanse
Global Address Cleanse and USA
Regulatory Address Cleanse
Global Address Cleanse and USA
Regulatory Address Cleanse
Global Address Cleanse and USA
Regulatory Address Cleanse
Global Address Cleanse and USA
Regulatory Address Cleanse
Global Address CleanseAddress Quality Code Summary
Page 79

Data Quality Reports
Lists of available reports
Transform(s)Report
MatchBest Record Summary
MatchMatch Contribution Report
MatchMatch Criteria Summary report
MatchMatch Source Stats Summary report
MatchMatch Duplicate Sample report
USA Regulatory Address CleanseUS Addressing report
USA Regulatory Address CleanseUS Regulatory Locking report
Note:
Reports require the Arial Unicode MS font. This font is designed to support
a wide variety of code pages and is included with Microsoft Office 2002 (XP)
and later. To view Unicode data in PDF reports, this font must be installed
on the computer being used to view the reports. For more information about
the Arial Unicode MS font, including how to install from a Microsoft Office
CD, visit the Microsoft Web site.
7
Font issue on AIX
If you are running Data Services on AIX, you may notice that some of the
text for the Data Quality reports is not displayed properly within the form of
an exported report in PDF or RTF format. This is caused by the fonts shipped
with Data Services.
You can fix this issue in one of two ways:
• Purchase the Arial font and copy the files into the JRE (Java Runtime
Environment) path of the Data Services installation, located at <instal
lation_directory>/bobje/jdk/jre/lib/fonts. After you copy the
fonts, restart your application server.
• Remove the Thonburi and Courier fonts from the Data Services JRE path
(<installation_directory>/bobje/jdk/jre/lib/fonts). This forces
Data Services to use the Lucida family fonts, which display correctly. After
you remove the fonts, restart your application server.
Data Services Management Console: Metadata Reports Guide 79
Page 80

Data Quality Reports
7
Lists of available reports
Lists of available reports
After opening the Data Quality Reports module, the Batch job reports tab
displays a list of jobs and their associated available reports. Click the
Real-time job reports tab to display reports available for real-time jobs. The
Real-time job reports tab includes the same information that is on the Batch
job reports tab.
The upper-right corner of the page displays the repository for the reports you
are viewing. You can change the repository to view in the "Settings" control
panel. See Data Quality Reports Settings control panel on page 83.
You can filter the list of reports displayed by selecting a job name and/or
when the job(s) executed.
To filter by job, select the job name from the drop-down Job name list. Or
type the name, or type part of the name and a wildcard character (% or *),
into the wildcard search string box and click Search. The Search field is not
case sensitive and spaces are allowed.
To filter by when the job(s) executed, select one of the following options:
• Show last execution of a job
• Show status relative to today—Select the number of previous days over
which to view job executions
• Show status as a set period—Type the date range or select the dates by
clicking the calendar icons
Click Search to update the list.
The report list includes the following headings. You can sort or reverse sort
on any column by clicking the arrow next to the column name.
• Report—Click the icon in this column to go to a page that lists the reports
for the associated job
• Job name—The name of the job in the Designer
• Status—The execution status of the job: green (succeeded), yellow (had
one or more warnings), red (had one or more errors), or blue (still
executing)
• Start time and End time—The start and end dates (in the format
yyyy-mm-dd) and times (in the format hh:mm:ss)
• Execution time—The elapsed time to execute the job
80 Data Services Management Console: Metadata Reports Guide
Page 81

Data Quality Reports
List of reports by job
• Rows extracted and Rows loaded—The number of rows read by the job
and the number of rows loaded to the target
7
List of reports by job
On the list of available reports page (either the Batch job reports or
Real-time reports tabs), clicking an icon in the Report column displays a
page with the list of reports that are available for the associated job. The job
name displays at the top of the page.
Data Services Management Console: Metadata Reports Guide 81
Page 82
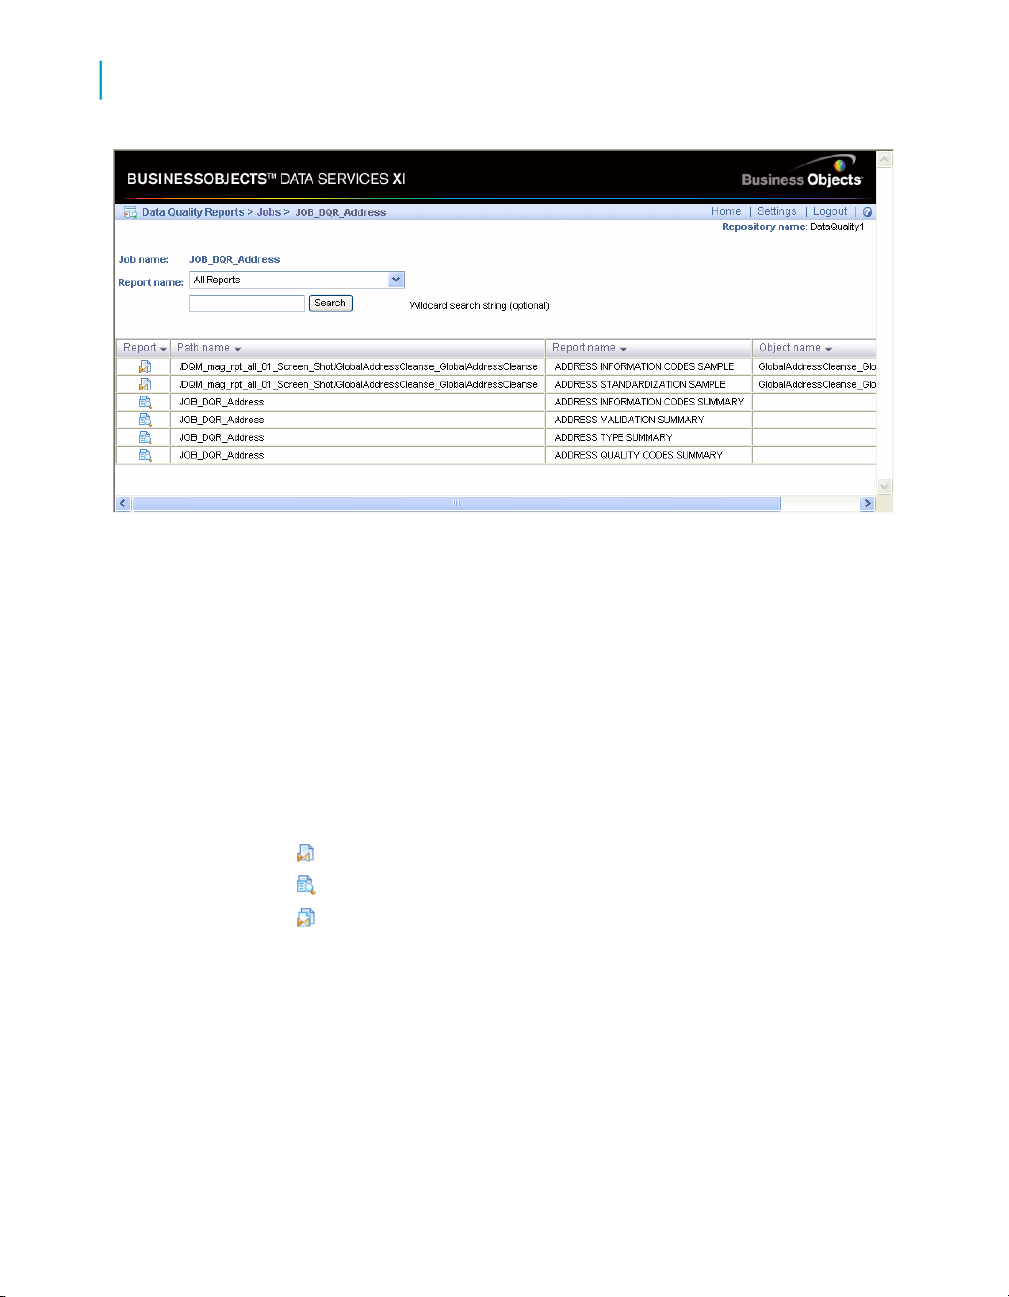
Data Quality Reports
7
List of reports by job
To filter this list, you can:
• Select a report name from the drop-down list. This action automatically
populates the Search box and submits the request.
• Type the name, or type part of the name and a wildcard character (% or
*), into the Search box and click Search. The Search field is not case
sensitive and spaces are allowed.
The list of reports includes the following headings. You can sort or reverse
sort on any column by clicking the arrow next to the column name.
• Report—Click the icon in this column to open the report, which displays
in a new browser window. The three icons types identify:
•
•
•
• Path name—If the report comes from a transform, match set, or associate
set, the transform location within the job displays in the form of data
flow name / transform name. If the report comes from a job
summary report, the job name displays.
• Report name—The type of report (for example Address Type Summary
report or Match Contribution report)
• Object name—Indicates the source object used for the report, typically
the transform name used in the data flow (blank for job summary reports).
82 Data Services Management Console: Metadata Reports Guide
Summary
Transform-specific report
Report for a group of transforms (match set or associate set)
Page 83
Data Quality Reports
Data Quality Reports Settings control panel
Data Quality Reports Settings control
panel
Use the Settings control panel to select a different repository for viewing
reports. In the upper-right corner of the window, click Settings. Select a
repository from the drop-down list box and click Apply.
Report options
After opening a report, you can do the following using the toolbars at the top
(and bottom) of the report window:
• Export to one of the following formats: Crystal Report (RPT), Adobe
Acrobat (PDF), Microsoft Word - Editable (RTF), or Rich Text Format
(RTF). The Export Report dialog box also lets you select a page range
to export.
• Print the full report or a range of pages
• Show the group tree, which displays a hierarchical navigation tree pane.
Select links in the tree to navigate to different sections of the report.
• Navigate through the report using the page links and fields at the top and
bottom of the report page
• Refresh the report
• Search for text
• Resize the view
7
In many of the reports, you can select the transform name, path, charts, or
other components to display a separate report that is specific to that
component. To identify which components are enabled for viewing as a
subreport, move the cursor over the report and look for objects that make it
change to a hand icon. The description (name) of the newly displayed report
then appears in the drop-down list at the top of the report. The drop-down
Data Services Management Console: Metadata Reports Guide 83
Page 84

Data Quality Reports
7
Descriptions of Reports
list displays all the subreports you have accessed. Select Main Report to
return to the original report.
Descriptions of Reports
USA CASS report: USPS Form 3553
Description
The Coding Accuracy Support System (CASS) report is a facsimile of United
States Postal Service (USPS) Form 3553. You need this form to qualify
mailings for postage discounts. For more information about CASS, call the
USPS National Customer Support Center (NCSC), CASS department, at
1-800-238-3150 or write to:
CASS/ZIP+4 Matching
National Customer Support Center
6060 Primacy Parkway, Suite 101
Memphis, Tennessee 38188-0001
You can also find information about CASS in section A950 of the USPS
Domestic Mail Manual (DMM).
To enable the report
To generate this report, use the USA Regulatory Address Cleanse transform.
Ensure the following options have been defined, or configure the appropriate
substitution parameters:
• Enable Report And Analysis > Generate Report Data.
• Disable Non Certified Options > Disable Certification.
• Set all applicable options in the CASS Report Options option group.
• Set Assignment Options > Enable DPV to Yes and specify a valid DPV
Path under Reference Files.
• Set Assignment Options > Enable LACSLink to Yes and specify a valid
LACSLink Path under Reference Files.
84 Data Services Management Console: Metadata Reports Guide
Page 85

Data Quality Reports
Descriptions of Reports
Example
The following is an abbreviated example of the CASS report.
7
Data Services Management Console: Metadata Reports Guide 85
Page 86

Data Quality Reports
7
Descriptions of Reports
NCOALink Processing Summary Report
Description
The NCOALink Processing Summary Report can provide a detailed
breakdown of the various codes returned by NCOALink and ANKLink
processing, information regarding how the NCOALink job was configured,
and summary information for some job processing statistics. The report
generates information and completes the applicable fields based on your
service provider level. The NCOALink Processing Summary Report can be
used for USPS certification and audit purposes.
To enable the report
To generate this report, use the USA Regulatory Address Cleanse transform.
On the Options tab, enable the following options or configure the appropriate
substitution parameters:
• Set Assignment Options > Enable NCOALink to Yes.
• Set Report And Analysis > Generate Report Data to Yes.
• Ensure that the other required NCOALink fields on the Options tab have
been correctly configured.
How to read this report
The first section of the report includes the report title, the date of the report,
and other general information about your job as follows:
• The job name
• The run ID, which specifies a unique identification of an instance of the
executed job
• The name of the repository where the job is located
• The official transform name
• The path to the transform in the form data flow name / transform
name
Depending on the transform option settings, the remainder of the report
includes the following sections:
• Move Update Summary: Contains information on the job configuration
and statistics for move-updated addresses as well as pre-move update
counts for Postcode2, DPV, LACSLink, and SuiteLink matches.
86 Data Services Management Console: Metadata Reports Guide
Page 87

Data Quality Reports
Descriptions of Reports
The "Data Returned" value shows the processing mode for the mailing
list. The possible values are "C" (change of address), "F" (return codes),
or "S" (statistics). For a detailed description of the values, see the Data
Services Reference Guide. To change the processing mode, modify the
NCOALink > Processing Options > List Processing Mode option in
the transform.
The "Match Logic" value is a single character code that denotes the
combination of move types processed. The setting for each move type
(business, individual, and family) displays in the area of the report
immediately below the list of all processes used. To change the match
logic, modify the NCOALink > Processing Options > Retrieve Move
Types option in the transform.
The "Mail Class" character code is derived from the settings for processing
standard mail, first class mail, package services, and periodicals. The
setting for each mail class is shown in the section immediately below the
list of all processes used. To change the settings, modify the previously
noted fields located in the NCOALink > Processing Options option
group in the transform.
• NCOALink Move Type Summary: Displays statistics for the types of moves
(Individual, Family, or Business) processed.
• NCOALink Return Code Summary: Displays a summary of the NCOALink
codes returned.
• ANKLink Return Code Summary: If ANKLink is enabled, displays a
summary of the ANKLink codes returned. The section won't display if
there aren't any ANKLInk return codes in the output.
• Return Code Descriptions: If enabled in the NCOALink > Report Options
> Generate Return Code Descriptions option, displays detailed return
code descriptions.
• Service Provider Summary: Contains information specific to processing
for limited or full service providers. This section does not display if
processing the job as an end user.
7
The following is an example of the first page of the NCOALink Processing
Summary report, which shows the Service Provider Summary and the Move
Update summary.
Data Services Management Console: Metadata Reports Guide 87
Page 88

Data Quality Reports
7
Descriptions of Reports
Related Topics
• Reference Guide: NCOALink options
88 Data Services Management Console: Metadata Reports Guide
Page 89

Data Quality Reports
Descriptions of Reports
Canadian SERP report: Statement of Address Accuracy
Description
The Canadian Software Evaluation and Recognition Program (SERP)
Statement of Address Accuracy report includes statistical information about
Canadian address cleanse processing such as the Address Accuracy Level.
To generate the report
To generate this report with the Global Address Cleanse transform, ensure
the following options are defined, or configure the appropriate substitution
parameters:
• In the Global Address Cleanse transform, enable Report And Analysis
> Generate Report Data.
• In the Canada group, complete all applicable options in the Report
Options subgroup.
• In the Engines section, set Canada to Yes.
7
Example
The following is an example of the Statement of Address Accuracy report.
Data Services Management Console: Metadata Reports Guide 89
Page 90

Data Quality Reports
7
Descriptions of Reports
90 Data Services Management Console: Metadata Reports Guide
Page 91

Descriptions of Reports
Australian AMAS report: Address Matching Processing Summary
Description
The Australian Address Matching Approval System (AMAS) Address Matching
Processing Summary report includes statistical information about Australian
address cleanse processing.
To generate the report
To generate this report with the Global Address Cleanse transform, ensure
the following options have been defined, or configure the appropriate
substitution parameters:
• In the Global Address Cleanse transform, enable Report And Analysis
> Generate Report Data.
• In the Australia group, complete all applicable options in the Report
Options subgroup.
• In the Engines section, set Australia to Yes.
Data Quality Reports
7
Example
The following is an example of the Address Matching Processing Summary
report.
Data Services Management Console: Metadata Reports Guide 91
Page 92
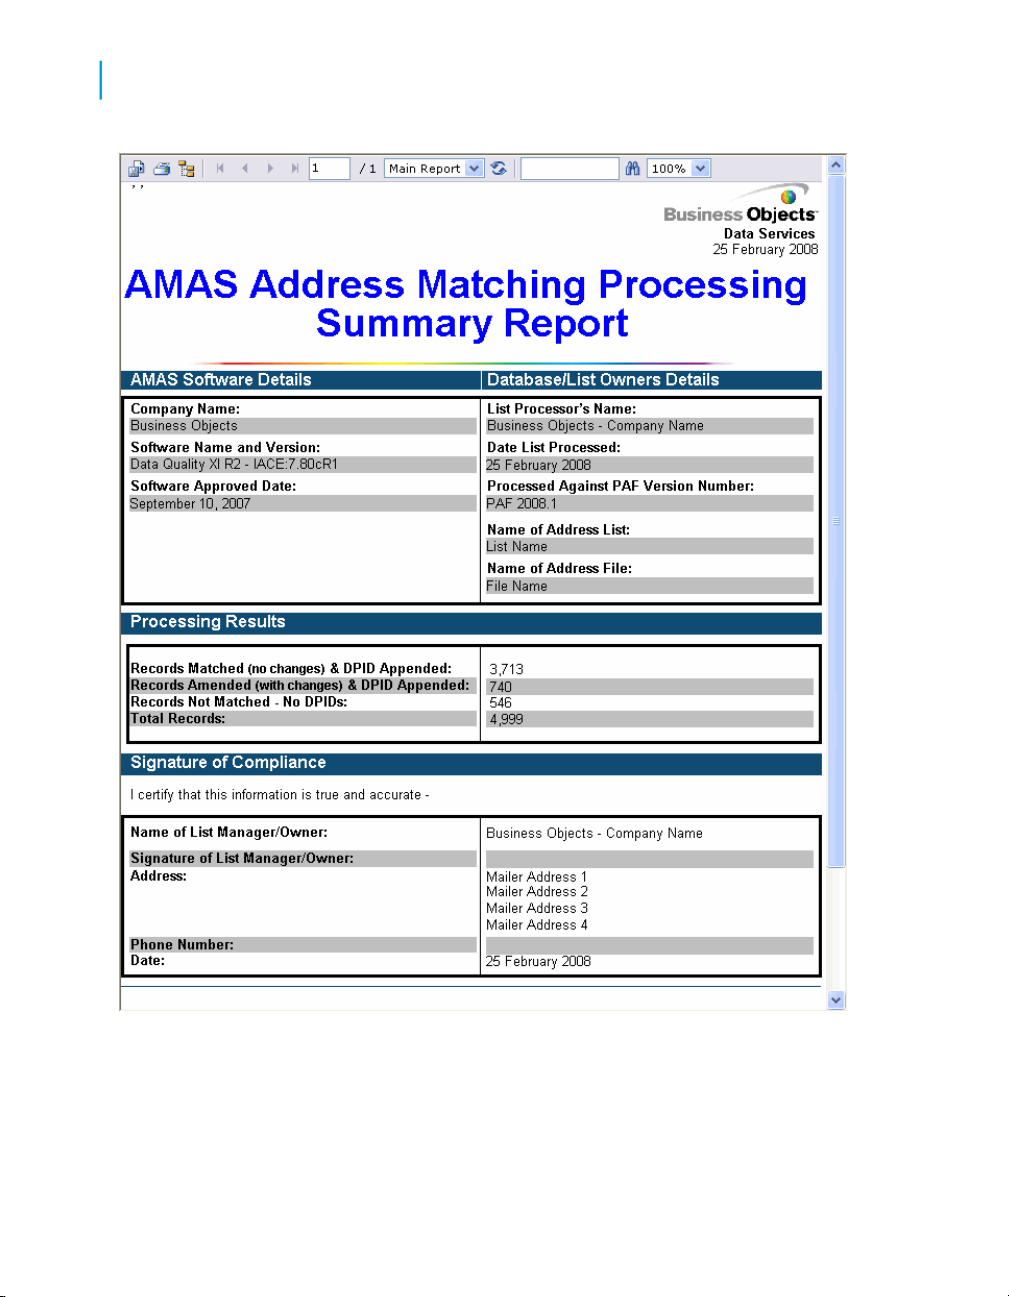
Data Quality Reports
7
Descriptions of Reports
92 Data Services Management Console: Metadata Reports Guide
Page 93

Data Quality Reports
Descriptions of Reports
New Zealand Statement of Accuracy (SOA) report
Description
The New Zealand Statement of Accuracy (SOA) report includes statistical
information about address cleansing for New Zealand.
To enable the report
• In the Global Address Cleanse transform, enable Report And Analysis
> Generate Report Data.
• In the Global Address transform, set Country Options > Disable
Certification to No.
• Complete all applicable options in the Global Address > Report Options
> New Zealand subgroup.
• In the Engines section, set Global Address to Yes.
Note:
Data Services does not produce the SOA Report when Global Address
certification is disabled or when there are no New Zealand addresses included
in the present job.
7
Example
The following is an example of the New Zealand Statement of Accuracy
report.
Data Services Management Console: Metadata Reports Guide 93
Page 94

Data Quality Reports
7
Descriptions of Reports
94 Data Services Management Console: Metadata Reports Guide
Page 95

Address Information Codes Sample report
Description
The Address Information Codes Sample report is a sampling of the records
that were assigned information codes (Global Address Cleanse) or fault
codes (USA Regulatory Address Cleanse) during processing. The transform
uses these codes to indicate why it was unable to standardize the address.
These codes can help you correct the data in specific records or find a pattern
of incorrect data entry.
Data Services initially outputs the first fault record encountered. After that,
it outputs every 100th fault record (for example 1, 101, 201, and so on).
There is a maximum of 500 fault records.
Note:
Depending on your configuration settings, you might see different
information/fault records each time the transform processes a particular set
of input records.
Data Quality Reports
Descriptions of Reports
7
How to read this report
The first section of the report includes the report title, the date of the report,
and other general information about your job as follows:
• The job name
• The run ID, which specifies a unique identification of an instance of the
executed job
• The name of the repository where the job is located
• The full transform name
• The path to the transform in the form data flow name / transform
name
• The engine name. For the Global Address Cleanse transform, it is the
name of the global engine that processed the data, and for the USA
Regulatory Address Cleanse transform, it is always USA.
The second section of the report includes a table that specifies the field
details for each record for which an information/fault code was found. The
table is subdivided by country.
Data Services Management Console: Metadata Reports Guide 95
Page 96

Data Quality Reports
7
Descriptions of Reports
The following example is the first page of the report for a Global Address
Cleanse transform.
The third section of the report lists a description of each information/fault
code. The following is an example of this section for the Global Address
Cleanse transform.
96 Data Services Management Console: Metadata Reports Guide
Page 97

Descriptions of Reports
Address Information Code Summary report
Description
The Address Information Code Summary report provides record counts of
each information or fault code of a specific project.
How to read this report
The first page of the report is a summary of all the information codes if:
Data Quality Reports
7
• The job contains more than one USA Regulatory Address Cleanse or
Global Address Cleanse transform.
• A single Global Address Cleanse transform processes records from more
than one engine.
In these cases, subsequent pages will include a report for each transform
or engine.
The following is an example of the summary page.
Data Services Management Console: Metadata Reports Guide 97
Page 98
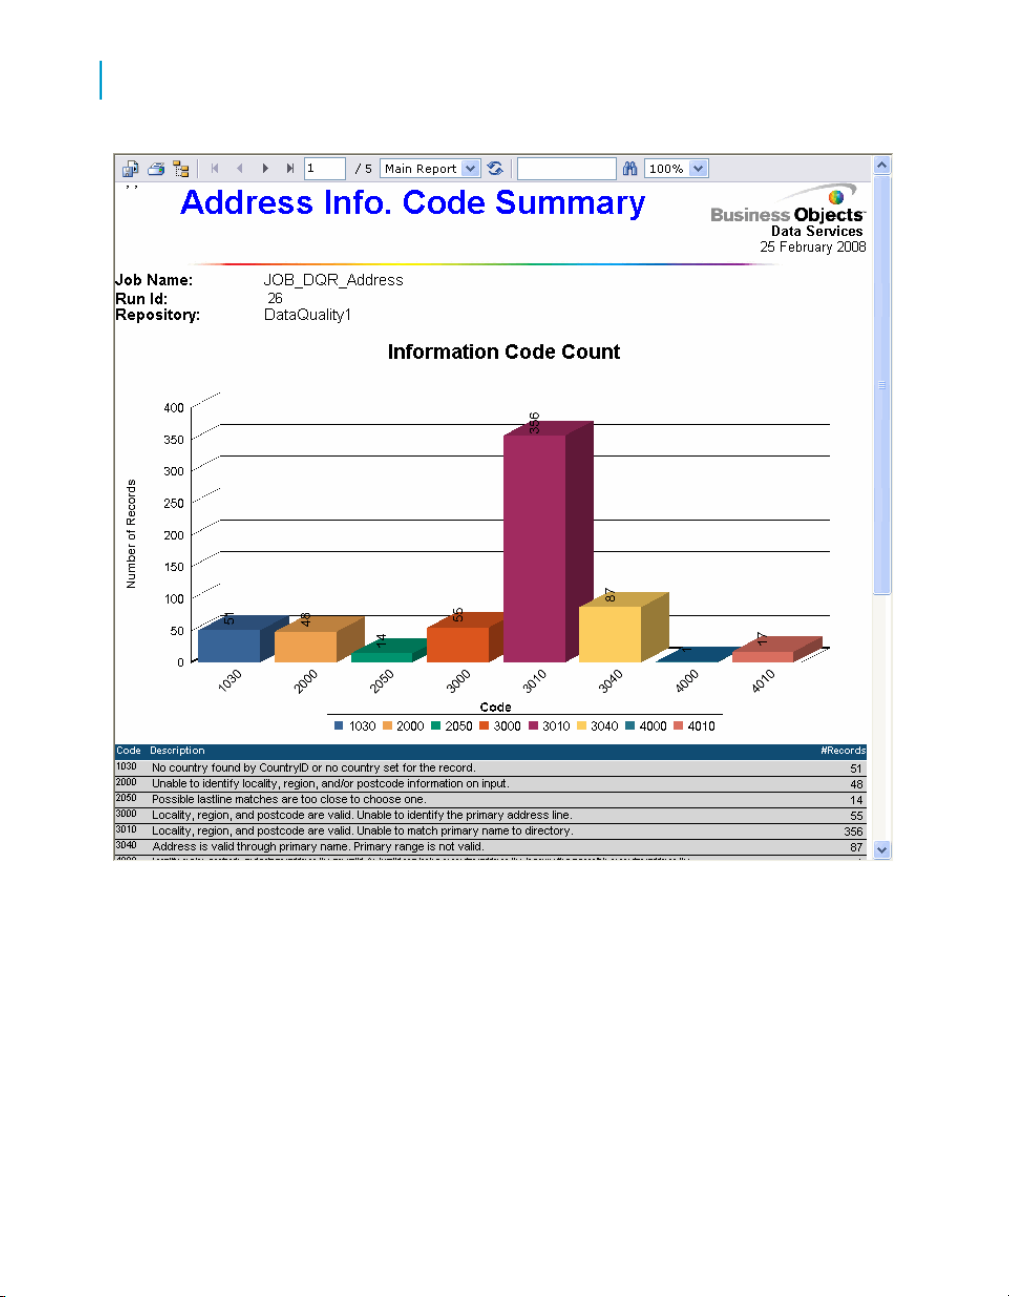
Data Quality Reports
7
Descriptions of Reports
The first section includes the report title, the date of the report, and other
general information about your job as follows:
• The job name
• The run ID, which specifies a unique identification of an instance of the
executed job
• The name of the repository where the job is located
• The official transform name
• The path to the transform in the form data flow name / transform
name
98 Data Services Management Console: Metadata Reports Guide
Page 99

Data Quality Reports
Descriptions of Reports
• Audit information, which specifies how many records were processed
during address cleansing, the start and end time, any idle time, and the
amount of active processing time
The second part of the report includes a bar graph that shows how many
different information/fault codes were assigned during processing. With this
graph, you should be able to see which information/fault code occurred the
most frequently, which could help you detect any consistent problems with
your data.
The section below the bar graph shows how many different information/fault
codes occurred along with a description of each code. For the Global Address
Cleanse transform, this section is organized by engine name. At the end of
the listing, the report shows the total number of information/fault codes
assigned.
The following is an abbreviated example of this section of the report for the
Global Address Cleanse transform.
7
Data Services Management Console: Metadata Reports Guide 99
Page 100

Data Quality Reports
7
Descriptions of Reports
100 Data Services Management Console: Metadata Reports Guide
 Loading...