

Page 1
Version 3
™
Positive Feedback
The Advantages of FBX Feedback Exterminators
INSIDE:
Story of Feedback 1
Equalization 2
The FBX Solution 3
Glossary of Tech Terms 5-8
®
®
Page 2
The Story of Feedback
By Doran Oster, President
Ever since Lee DeForest
invented the first vacuum tube,
engineers have walked the
tightrope between feedback
and system gain. The purpose of this guide is to give
you the tools to get all the
gain you need without the
agony of feedback. We’ll start
with a common-sense discussion of the techniques sound
engineers now use to control
feedback to get the most gain
and clarity out of their sound
systems.
Our imaginary
work bench
Imagine a mic and speakers set up in a tiny shower
room. Clap your hands. The
sound reverberates back and
forth between the tile walls
and floor. Just a touch of the
volume fader fills the room
with screeching feedback.
Now move our sound system out to an open
grassy field. Clap your
hands. There is no
echo. The speakers are
well away from the
microphone and there
are no reflections, so
now we can really crank
up the system without a
bit of feedback.
Most sound systems
have characteristics that
fall between these two
examples, but examining the extreme cases makes
it easier to understand the
more common in-between situations.
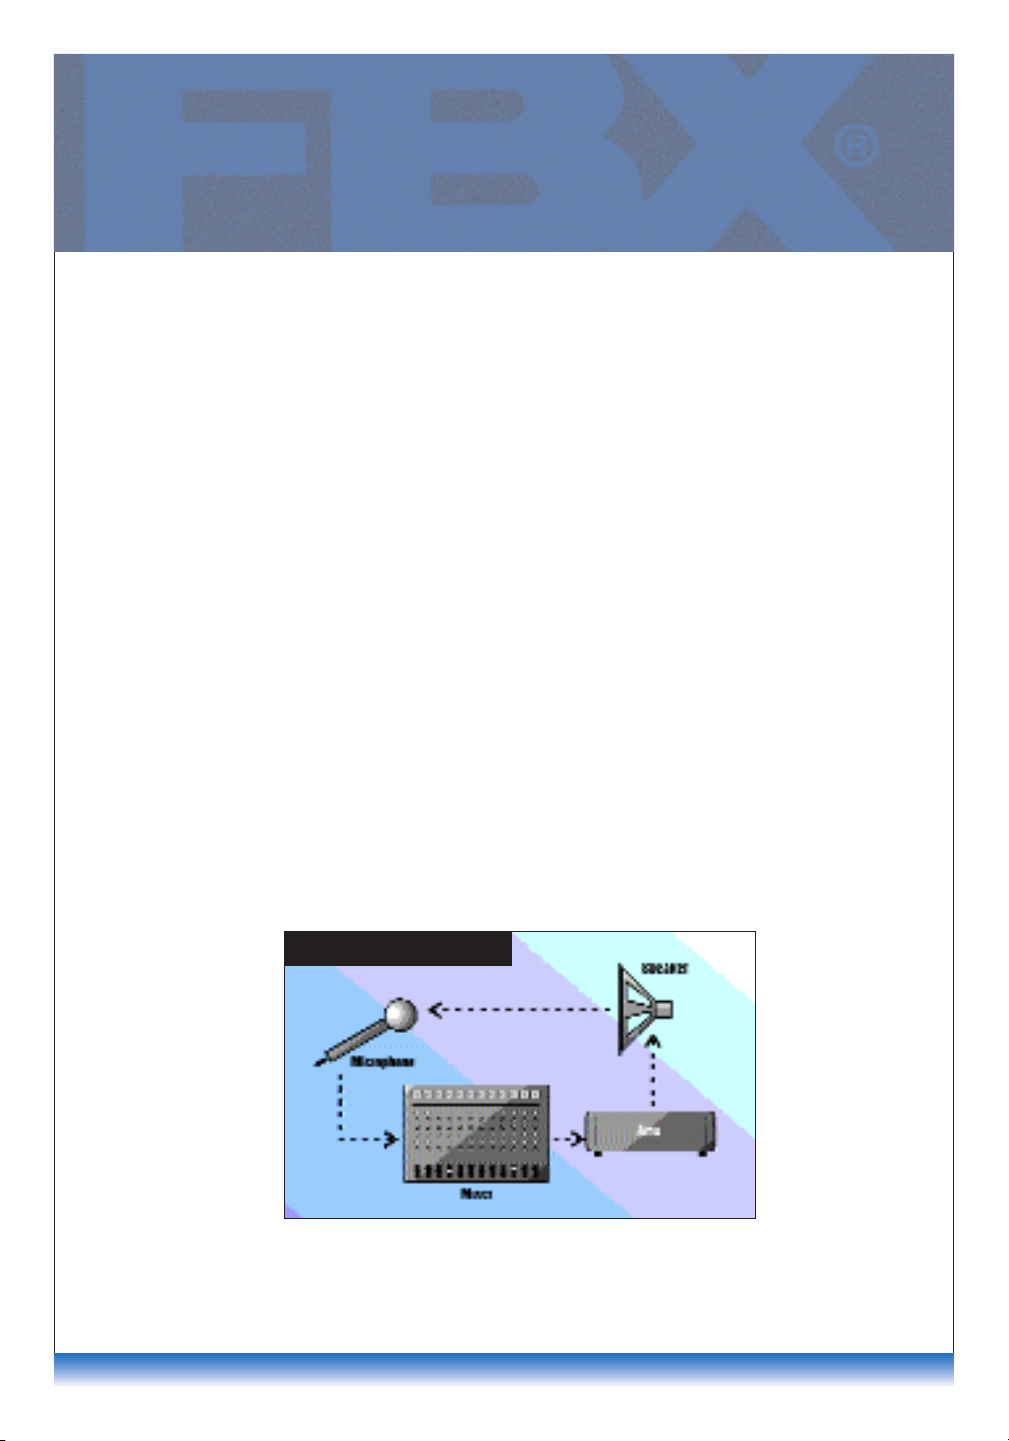
Fig. 1: Feedback Loop
What is acoustic
feedback?
Feedback is the loud ringing
sound that occurs when the
sound leaving a speaker is
picked up by a microphone and
reamplified again and again.
(See Fig. 1.) The cycle repeats
until the feedback reaches the
system’s maximum loudness or
until someone turns down the
volume. Virtually every sound
system that has a microphone
and a speaker in the same room
is susceptible to feedback.
Which frequencies feed
back? All acoustic systems
have distinct resonant frequencies. Regardless of where you
thump a guitar’s top, it always
responds with the same tone.
This is the natural resonant frequency of the guitar. It is the
frequency where all of the
instrument’s components vibrate
naturally as a unit. In sound
systems, these resonant points
are the frequencies where feedback occurs.
Each of the system’s components, including and especial-
ly the room itself, has its own
set of resonant frequencies.
Each component adds together to produce the total system’s resonant frequencies. It
is almost impossible to predict
which frequencies will feed
back without first “thumping”
the system, but you only have
to turn up the amp for them to
rudely reveal themselves.
The frequency that feeds
back first is the one that
requires the least amount of
energy to excite the resonance.
If you remove the first feedback
frequency, the next feedback
frequency will be the one that
requires the second least
amount of energy, and so on.
Controlling feedback
In order for feedback to
occur, the amplifier has to be
turned up enough so that
sound from the speaker reenters the microphone louder
than the original sound. In our
imaginary experiment, feed-
back easily
occurred in the
shower room
because the
sound leaving the
speakers did not
dissipate very
much before reentering the
microphone. But
when we move
the speakers
away in the open
field, the sound
energy dissipates as it radiates away from the speakers.
If there are no surfaces to
reflect the sound back to the
1
Page 3

EQUALIZATION
mic, the sound quickly loses
energy, dropping to one quarter the energy every time the
distance from the speakers is
doubled. By the time the
sound finally reaches the
microphone, the sound energy
is weaker than the original
sound, so there is no feedback. From this example we
deduce the Prime Directive of
Feedback Control:
Keep the sound emanat-
ing from the speakers away
from the microphones as
much as possible.
Here are the most common tricks of the trade for
controlling feedback:
• Stand close to the microphone. Speak loudly and
clearly so that you do not have
to amplify the sound too much.
• Each open microphone
has a chance to feed back.
Mute or turn down the gain of
any microphone that is not in
use. Noise gates can be helpful for this.
• Mount the microphones in
fixed positions. Moving the
microphone around on the
stage increases the chances
that the microphone and the
speaker will form new resonant
paths.
• Use cardioid or hyper-cardioid microphones, and point
the mics away from the
speakers. They pick up much
less sound from the back side
of the mic, which protects
against monitor feedback. Be
careful not to put your hand on
or too close to the microphone’s screen, since this can
cover the ports that enable the
heart-shaped (hence cardioid)
rejection pattern.
• Place the speakers in front
of the microphones so there
is not a direct path back to the
microphone.
• Aim the speakers so the
sound does not reflect
directly off a wall back into
the mic. You can estimate the
speaker’s dispersion pattern
(the area that is directly
“sprayed” with sound) for the
mids and high frequencies by
imagining rays of light radiating
out of the speaker’s horns. If
you can see the center part of
the horn, you are probably in
the dispersion pattern. Lower
frequency sounds tend to radiate out in all directions from all
sides of the speakers.
• Make the surfaces of the
room as sound absorbent as
possible to reduce sound
reflections. Use acoustical
absorbing tiles in the ceiling, put
down carpeting, and hang
curtains.
In the real world of most
performance spaces, you cannot always follow these antifeedback techniques. Lead
singers insist on pointing the
monitors directly at the mic.
Worship leaders insist on the
mobility of a wireless microphone, and night club owners
will not likely carpet the dance
floor and hang velvet curtains.
Even after you’ve tried all these
tricks, you may still not have
enough gain and clarity to satisfy the audience. Do the best
you can, and then go on to the
next level of feedback control:
equalization.
Equalization
Equalizers (EQs) are sets
of filters, or volume controls, for
different parts of the audio
spectrum.
Since the earliest days,
sound engineers have used
equalizers for two distinctly different purposes: 1) To improve
the tone quality and balance of
the sound, and 2) To control
feedback for extra gain and
microphone mobility. Some
types of EQs are best at shaping the tone and other types are
better at controlling feedback.
It may seem paradoxical to
add filters to a sound system in
order to increase the gain. But
if you can use extremely narrow
filters to turn down the frequencies that are feeding back, you
will be able to increase the gain
of all the other frequencies for a
total net gain. There are essentially three categories of equalizers: graphic, parametric and
adaptive parametric.
Graphic EQ
Graphic EQs are basically
a set of volume controls for
individual sections of the audio
spectrum. The earliest music
equalizers were the bass and
treble tone knobs. As technology advanced, these filters were
narrowed to give more precise
control. Today, the industry
standard is called a 1/3-octave
graphic equalizer, which has 31
individual volume controls
spaced 3 per octave.
There is a common misconception in the industry about
1/3-octave EQs that is important to this discussion. Many
industry veterans incorrectly
presume that 1/3-octave EQs
use 1/3-octave wide filters. If
this were the case, the EQ filters would not be wide enough
to create smooth curves.
Instead, they would produce a
notched frequency response
that would make the EQ useless for shaping the sound and
useless for controlling feedback
frequencies between the sliders. Actually, most manufacturers use 3/4 to 1-octave wide
overlapping filters placed on
1/3-octave center points. These
wider filters provide the necessary smooth frequency
response. (See Fig. 2.) It’s
important to understand that
the term “1/3-octave” refers
to the spacing of the sliders,
not the filter width.
Graphic EQs are excellent
for shaping the sound, and they
2
Page 4

THE FBX SOLUTION
are fairly simple to use.
However, using one-octave
wide EQ filters to control feedback invariably causes an
unnecessary decrease in the
gain and fidelity of the program.
It’s easy to see that if feedback
occurs somewhere between the
sliders, you will have to pull one
of those EQ sliders down pretty
far to eliminate feedback. That
pulls out plenty of your program,
too. On the other hand, you’ll
get considerably more net gain
and much better sound quality if
you use wide graphic EQ filters
for tone control and insist on
narrow filters for feedback control. (See Fig. 3.) That’s where
parametric EQs come in.
Parametric EQ
In the quest for perfect
sound, engineers developed
very narrow tuned filters for
controlling feedback points in
auditoriums. In the early days
of sound reinforcement, these
filters were custom made to a
specific frequency and width for
a specific application. Now
Fig. 2: Graphic EQ
Typical Graphic EQ:
-10 dB cut at 500, 630, 1K, 1.25K, 1.6K & 2K Hz
If the graphic EQ really had 1/3-octave
filter widths, the frequency response
curve would vary 6 dB between sliders.
This would ruin the sound.
there are a number of commercially available parametric
filter sets that allow engineers
to dial in the width, center frequency and depth of the filter.
The problem with parametrics is that they’re expensive, they require a good deal
of expertise and auxiliary
equipment to tune properly,
they require constant retuning
whenever the room acoustics
change, and they are far too
slow and cumbersome for
catching feedback that occurs
during the program.
Adaptive Parametric:
The FBX Solution
The Sabine FBX
Feedback Exterminator® is
the next step in the evolution
of feedback control. The FBX
is essentially a self-tuning
parametric EQ. It constantly
monitors the program, searching for tones that have the
overtone signature of feedback. Once feedback occurs,
the FBX automatically places
a very narrow, constant-width
filter directly on the feedback
frequency and lowers it just
deep enough to eliminate the
ringing sound.
The FBX out performs
other EQs five ways:
1. The FBX finds and eliminates feedback automatically
before and during the program.
2. The FBX’s narrow filters
eliminate feedback without losing the fidelity of the sound.
Graphic EQ’s usually use one
octave wide overlapping filters
that provide much smoother frequency response curves. Notice
that the overlapping filters add
together to cut -16 dB when the
sliders are only pulled -10 dB.
3. The FBX is fastest. It typically finds and eliminates feedback in less than one second.
4. The FBX gives the most
gain. Use wide-filter graphic
EQs for controlling the shape
of the sound and narrow FBX
filters for controlling feedback,
and you’ll typically achieve a 6
3
Page 5

THE FBX SOLUTION
to 9 dB increase in gain compared with using the EQ alone.
5. Increase wireless mic mobility.
What about that 6 to 9 dB
increase in gain? Gain
increase from equalization really depends on the characteristics of the sound system and
the room. Returning to our
imaginary system in the shower
room, the sound bounces off
the hard tile surfaces and
reflects back into the microphone with only a slight touch
of the volume slider. If you filter the first feedback point, you
can only increase the volume
fader a touch more before the
second feedback occurs at a
new frequency. Even if you filter six different resonance
points, you may only achieve 1
or 2 decibels of net gain
because there are so many
low-energy resonant paths.
When we set our system in
a large open field and the
speakers are far away from the
microphone, we really have to
crank it up before we hear the
first feedback. We would need
an enormous system to drive
six feedback points. In this
system, damping six feedback
points could easily deliver well
over 15 dB net gain!
How much gain do you
achieve with the six FBX filters? Six resonance points
worth - whatever that happens
to be in your unique system.
You can maximize your gain by
following our anti-feedback
directives and by learning more
about how the FBX filters work
best for your situation.
Microphone Mobility
Mobile karaoke and wireless microphones present a
special feedback challenge. It
does little good to set a number
of filters for a mounted microphone if you plan to carry the
mic around the stage to differ-
ent locations. Each position on
the stage has its own unique
set of resonant frequencies, so
the filters that control feedback
in one location will probably not
provide much help in other
locations.
You are faced with a balancing act. If you insert too
many filters in the system, you
ference comes after the filter is
placed. Fixed filters remain on
the initially detected feedback
tone - they do not move. These
filters provide the initial maximum gain before feedback and
are set automatically during
setup. Dynamic filters can
release and move to new feedback frequencies and are for
Fig. 3: FBX vs. 1/3-Octave Graphic EQ
will hear a degradation of the
sound quality. If you set too
few filters, you will not have
enough mobility or gain.
In this case, it is usually
best to walk around the stage
area until you find an area
where feedback is a particular
problem. Then place one or two
feedback control filters to take
care of that location and repeat
the process in the next few
areas. FBX filters add less gain
to mobile systems than to fixed
microphone systems, but they
add a significant increase in the
usable area while preserving the
natural clear sounds.
Feedback Control
During the Program
One of the most powerful
features of the FBX is that it
can eliminate feedback during
the program. FBX filters come
in two types: fixed and dynamic.
Both filters are placed the same
way: Feedback is detected, and
the filter is placed just deep
enough to eliminate it. The dif-
adaptive feedback control during
the performance. You can
change the number of fixed vs.
dynamic filters using front panel
controls.
Hearing is Believing
To hear the difference for
yourself, insert an FBX in your
sound system and bypass it.
Mount the mics on stands to fix
their positions. Remove as
much feedback as possible
using your normal method with
just the graphic EQ. Next, lower
the volume, bypass the graphic
EQ, and activate the FBX. Now
slowly raise the gain of the system until at least six FBX filters
have kicked in.
Next, turn down the mics
and play your favorite CD
through the system. Alternately
listen to the system with just the
FBX and then just the graphic
EQ. You will hear the FBX provides much clearer, brighter and
louder sound.
If you do not have immediate access to an FBX, run this
experiment with a graphic EQ
alone. You will be amazed to
A PA System was set
up using a microphone, mixer, FBX,
power amp and two
speakers. The system’s gain was raised
until the FBX
removed nine feedback points. Next the
FBX was replaced
with a graphic EQ.
The EQ was adjusted
while the system gain
was raised to the
same level achieved
with the FBX. The
frequency response
curves of each device
were then plotted.
4
Page 6

TECH TERMS
GLOSSARY:
Definitions of
“tech” terms
What is Gain?
Gain is a measure of the
change in power (or loudness)
in a sound system. For example, turning up the amp causes
an increase in gain, while moving away from the speakers
causes a decrease in gain. By
convention, gain is expressed
in decibels.
ClipGuardTM Adaptive
Clip Level Control
Sabine’s ClipGuardTM
makes FBX feedback control
faster and easier to use, and
it adds about 10 dB to the
effective dynamic range. Until
ClipGuard, engineers manually
set the input and output level
controls to a compromise setting that causes unnecessary
noise during quiet programs
and risks clipping overload
during high level programs.
Now ClipGuard constantly
readjusts the FBX’s electronics
to match the continually changing program levels.
Another feature of
ClipGuard is TURBO mode
that cuts the time of the preprogram setup to just a few
seconds. ClipGuard is currently
a standard feature in Sabine’s
FBX-1020P & 2020P Feedback
Exterminators, POWER-Q
ADF-4000, GRAPHI-Q,
DQX-206 parametric EQ/delay
and the REAL-Q2 Real-Time
Adaptive Equalizer.
so it is advantageous
to turn off microphones
that are not currently
being used. Noise
gates do this automatically by continuously
monitoring the program’s loudness. If the
loudness falls below a
threshold set by the
user, the noise gate
automatically turns off
the microphone. Once
the loudness exceeds
the threshold, the
microphone channel
automatically turns back on.
Noise gates are useful for
a number of important sound
applications besides feedback
control. For example, if a person or instrument is picked up
by two microphones placed in
different locations, the combined mic signals will interfere
with each other, causing a type
of distortion called comb filters.
Comb filters add gain at certain
frequencies and thus increase
the chance of feedback. At the
same time, they cut the gain
at other frequencies, causing
the program to sound thin and
over-equalized. Gating the
Fig. 4: Loudness in Decibels
unused microphones eliminates
this source of comb filtering.
Noise gates are often
employed in CD players to
eliminate noise between songs.
They are similarly used in
sound systems to mute the hiss
of noisy electronic components
during quiet periods.
Most Sabine FBX
Feedback Exterminators
feature user-progammable
noise gates.
What are Decibels?
We have the ability to hear
an amazing range of loudness.
People placed in an absolutely
quiet anechoic chamber eventu-
Fig. 5: Typical Frequency Response
1K EQ slider pulled down 12 dB
Noise Gate/
Comb Filters
As we mentioned earlier,
every microphone creates a
potential source of feedback,
5
Page 7

TECH TERMS
ally perceive the sound of air
molecules hitting their eardrums. On the other hand,
people working near jet
engines hear sounds a billion
times more powerful.
Engineers have developed a
convention that economizes
the calculations of such an
enormous range of values.
This convention describes
these changes in terms of
decibels (abbreviated dB)
named in honor of Alexander
Graham Bell.
Many non-technical people
find the different uses of the
term decibels confusing
because it seems to have so
many different meanings. For
example, decibels are commonly used to describe the
loudness of a sound, the
change in loudness (or gain)
from one time to another, for
changes in signal voltage, and
a number of other technical
measurements involving the
power ratio of large numbers.
While we gladly leave these
calculations to the engineers, it
is helpful to realize that a
change of 1 dB is equivalent to
a 27 percent change in power.
With this in mind, we realize
that turning up the system gain
by 3 dB increases the power
approximately 100% (27% x 3).
In other words, turning up the
amp from 400 Watts to 800
Watts adds about 3 dB to the
system gain.
Wow! Does doubling the
power from 400 Watts to 800
Watts make it sound twice as
loud? No! A three decibel
change sounds only slightly
louder. In general, you have to
increase the power about 10
times (or 10dB) to make the
sound seem twice as loud.
When engineers describe
the loudness of a sound in
terms of decibels, they are
comparing the sound pressure
level of a particular sound compared to an international standard. Fig. 4 gives several common reference points.
Frequency
Response Curves
A frequency response
curve is a graph that shows the
gain of a component or a group
of components at different frequencies. Fig. 5 shows the frequency response of a typical
Fig. 6: Typical Frequency Response
Two overlapping EQ sliders pulled down 12 dB
equalizer with the 1,000 Hz
slider pulled down 12 dB. The
frequency response curve
shows that the biggest cut in
power, called the center frequency is at 1,000 Hz, that the
filter removes half of the power
(-3dB) between 645 Hz and
1550 Hz, the Q of the filter is
1550-645 Hz/1000 Hz (.905),
and the maximum depth is -12
dB.
Fig. 6 shows the frequency
response of two adjacent sliders pulled down 12 dB. Notice
that the center frequency of the
two sliders is at 885 Hz. The
combined filter width is 1.49
octave and the two filters add
together to give a maximum
depth of -19.3 dB.
Constant-Q Filters
It is common to describe a
filter’s quality factor, or “Q,” as
the center frequency of the filter
divided by the filter width (in
Hertz) measured at the -3dB
point. Filters that have the
same Q, or width, at the -3dB
point regardless of the filter’s
cut or boost are called constant
Q filters. Filters that get wider
as the filter gets deeper are
called proportional Q filters.
There seems to be a new
development in the audio industry. The definition of constant Q
is blurring. Many equalizer
manufacturers claim their
equalizers have constant Q filters, when in fact they get substantially wider as they get
deeper. The only way to know
for sure if the filters are truly
constant Q is to inspect their
frequency response curves.
(See Figs. 7 & 8.)
Net Gain
Before Feedback
Many people measure their
increase in gain by the amount
they push up the mixer’s calibrated slider. But if adding gain
6
Page 8

TECH TERMS
Fig. 7: Typical Constant Q Filter
Fig. 8: Typical Proportional Q Filter
Fig. 9: Net Gain = Mixer minus EQ
causes feedback, you will have
to cut the gain of the feedback
frequency at the EQ in order to
add gain at the mixer. A more
accurate concept could be
called NET gain. It is the
amount of gain you achieve
pushing up the mixer slider,
minus the gain you lose lowering the EQ sliders. NET gain
is the gain you realize in front
of the speakers as measured
by a sound pressure level
meter. That is the gain that
matters. (See Fig. 9.)
The Frequency
Spectrum
People with excellent hearing can hear frequencies
between 20 and 20,000 vibrations per second or Hertz. Fig.
10 shows an imaginary 120
key keyboard that would be
big enough to play all the
notes that we can hear. The
lowest key would play a 20 Hz
“E” and the highest key would
play a 19,912 Hz “D#.” Notice
that doubling the frequency
raises the pitch one octave.
We hear the same one-octave
musical interval between 40
and 80 Hz as we do between
10,000 and 20,000 Hertz.
A graphic equalizer is
superimposed that shows
which sliders affect the notes
of several instruments. For
example, the chart shows that
the 250 Hz slider affects most
of the bottom 1/3 of a guitar’s
range.
The typical FBX filter
below the EQ shows the relatively smaller size and effect
on sound of FBX filters and
illustrates why they cause less
tonal change and gain loss.
The nine FBX filters are
not preset on any particular
frequencies like EQ filters.
They are placed precisely
where feedback occurs.
7
Page 9

TECH TERMS
©1997 Sabine, Inc.
Fig. 10: The Frequency Spectrum
Horizontal bars show
practical ranges of
musical instruments.
Light gray shaded area
shows tones affected
by one graphic EQ filter
(250 Hz). Note large
gaps in response of
many instruments when
just one EQ fader is
pulled! Compare this to
the much narrower area
affected by one FBX fil-
ter (dark gray bar).
8
 Loading...