


R&S® ZNC/ZND
Vector Network Analyzers
User Manual
(;×íÇ2)
1173955702
User Manual
Version 37

This manual describes the following vector network analyzer types:
●
R&S®ZNC3 (2 ports, 9 kHz to 3 GHz, N connectors), order no. 1311.6004K12
Hardware Options
–
R&S®ZNC-B10 "GPIB Interface", order no. 1316.1617.02
–
R&S®ZN-B14 "Handler I/O", order no. 1316.2459.05
–
R&S®ZNC-B19 "Additional Removable Hard Disk, 32 bit IPS1", order no. 1323.9503.02
–
R&S®ZNC-B19 "Additional Removable Hard Disk, 64 bit IPS2", order no. 1323.9503.08
–
R&S®ZNC3-B22 "Extended Power Range for R&S®ZNC3", order no. 1316.1752.02
Software Options
–
R&S®ZNC-K2 "Time Domain Analysis", order no. 1316.1630.02
–
R&S®ZNC-K19 "1 mHz Frequency Resolution", order no. 1317.8596.02
●
R&S®ZND (2 ports, 100 kHz to 4.5 GHz, unidirectional, N connectors), order no. 1328.5170.92
Hardware Options
–
R&S®ZND-B7 "High Output Power", order no. 1338.1578.02
–
R&S®ZND-B10 "GPIB Interface", order no. 1328.5358.02
–
R&S®ZN-B14 "Handler I/O", order no. 1316.2459.05
Software Options
–
R&S®ZND-K1 "Frequency range extension to 8.5 GHz for unidirectional instrument", order no.
1328.5306.02
(not compatible with R&S®ZND-K5 and R&S®ZND-K8)
–
R&S®ZND-K2 "Time Domain (TDR)", order no. 1328.5393.02
–
R&S®ZND-K5 "Bidirectional measurements 100 kHz to 4.5 GHz", order no. 1328.5312.02
(not compatible with R&S®ZND-K1 and R&S®ZND-K6)
–
R&S®ZND-K6 "Bidirectional measurements 100 kHz to 8.5 GHz", order no. 1328.5329.02
(requires R&S®ZND-K1; not compatible with R&S®ZND-K5 and R&S®ZND-K8)
–
R&S®ZND-K8 "Frequency range extension to 8.5 GHz for bidirectional instrument", order no.
1328.5412.02
(requires R&S®ZND-K5; not compatible with R&S®ZND-K1 and R&S®ZND-K6)
–
R&S®ZND-K7 "Extended Power Range", order no. 1328.5335.02
–
R&S®ZND-K19 "1 mHz Frequency Resolution", order no. 1326.8089.02
© 2019 Rohde & Schwarz GmbH & Co. KG
Mühldorfstr. 15, 81671 München, Germany
Phone: +49 89 41 29 - 0
Fax: +49 89 41 29 12 164
Email: info@rohde-schwarz.com
Internet: www.rohde-schwarz.com
Subject to change – Data without tolerance limits is not binding.
R&S® is a registered trademark of Rohde & Schwarz GmbH & Co. KG.
Trade names are trademarks of the owners.
1173.9557.02 | Version 37 | R&S® ZNC/ZND
Throughout this manual, R&S® is abbreviated as R&S.

R&S® ZNC/ZND
1 Preface.................................................................................................. 13
1.1 Documentation Overview........................................................................................... 13
1.1.1 Getting Started Manual................................................................................................. 13
1.1.2 User Manual and Help.................................................................................................. 13
1.1.3 Service Manual............................................................................................................. 13
1.1.4 Instrument Security Procedures....................................................................................14
1.1.5 Basic Safety Instructions...............................................................................................14
1.1.6 Data Sheets and Brochures.......................................................................................... 14
1.1.7 Release Notes and Open Source Acknowledgment (OSA).......................................... 14
1.1.8 Application Notes, Application Cards, White Papers, etc..............................................14
1.2 Conventions Used in the Documentation.................................................................15
Contents
Contents
1.2.1 Typographical Conventions...........................................................................................15
1.2.2 Conventions for Procedure Descriptions.......................................................................15
1.2.3 Notes on Screenshots...................................................................................................15
2 Safety Information................................................................................16
3 Release Notes for Firmware V2.94..................................................... 17
4 Getting Started..................................................................................... 18
4.1 Putting the Analyzer into Operation..........................................................................18
4.1.1 Unpacking and Checking the Instrument...................................................................... 18
4.1.2 Positioning the Instrument.............................................................................................19
4.1.3 Bench Top Operation.................................................................................................... 19
4.1.4 Operation in a 19" Rack................................................................................................ 20
4.1.5 EMI Suppression...........................................................................................................20
4.1.6 Connecting the Analyzer to the AC Supply................................................................... 21
4.1.7 Starting the Analyzer and Shutting Down..................................................................... 21
4.1.8 Standby and Ready State............................................................................................. 22
4.1.9 Connecting External Accessories................................................................................. 22
4.1.10 Minimizing the VNA Application.................................................................................... 25
4.2 Instrument Tour...........................................................................................................26
4.2.1 Front Panel....................................................................................................................26
3User Manual 1173.9557.02 ─ 37

R&S® ZNC/ZND
4.2.2 Rear Panel.................................................................................................................... 32
4.3 Operating the Instrument........................................................................................... 34
4.3.1 Manual Operation .........................................................................................................35
4.3.2 Control Elements of the Application Window................................................................ 39
4.3.3 Working with Dialogs.....................................................................................................45
4.3.4 Handling Diagrams, Traces, and Markers.....................................................................46
4.3.5 Entering Data................................................................................................................ 50
4.3.6 Scaling Diagrams.......................................................................................................... 53
4.4 Performing Measurements.........................................................................................58
4.4.1 Transmission S-Parameter Measurement.....................................................................59
4.4.2 Reflection S-Parameter Measurement..........................................................................66
5 Concepts and Features....................................................................... 68
Contents
5.1 Basic Concepts........................................................................................................... 68
5.1.1 Global (Persistent) Settings.......................................................................................... 68
5.1.2 Recall Sets.................................................................................................................... 69
5.1.3 Traces, Channels and Diagrams...................................................................................69
5.1.4 Sweep Control...............................................................................................................71
5.1.5 Data Flow...................................................................................................................... 75
5.2 Screen Elements......................................................................................................... 77
5.2.1 Display Elements of a Diagram.....................................................................................77
5.2.2 Dialogs.......................................................................................................................... 88
5.2.3 Trace Formats...............................................................................................................91
5.3 Measurement Results................................................................................................. 99
5.3.1 S-Parameters................................................................................................................ 99
5.3.2 Impedance Parameters...............................................................................................101
5.3.3 Admittance Parameters...............................................................................................103
5.3.4 Wave Quantities and Ratios........................................................................................105
5.3.5 Unbalance-Balance Conversion..................................................................................109
5.3.6 Reference Impedances................................................................................................111
5.3.7 Stability Factors...........................................................................................................113
5.3.8 Delay, Aperture, Electrical Length............................................................................... 114
5.4 Operations on Traces................................................................................................115
5.4.1 Limit Check..................................................................................................................115
4User Manual 1173.9557.02 ─ 37

R&S® ZNC/ZND
5.4.2 Trace Files...................................................................................................................120
5.5 Calibration................................................................................................................. 125
5.5.1 Calibration Types........................................................................................................ 126
5.5.2 Calibration Standards and Calibration Kits................................................................. 137
5.5.3 Calibration Pool...........................................................................................................143
5.5.4 Calibration Labels....................................................................................................... 143
5.5.5 Automatic Calibration.................................................................................................. 143
5.5.6 Scalar Power Calibration.............................................................................................149
5.5.7 Parallel Calibration of Multiple Channels.................................................................... 154
5.6 Offset Parameters and Embedding......................................................................... 155
5.6.1 Offset Parameters....................................................................................................... 155
5.6.2 Embedding and Deembedding....................................................................................161
5.7 Optional Extensions and Accessories....................................................................173
Contents
5.7.1 Frequency Range Extension to 8.5 GHz for unidirectional R&S ZND........................ 173
5.7.2 Bidirectional Measurements 100 kHz to 4.5 GHz for R&S ZND................................. 174
5.7.3 Bidirectional Measurements 100 kHz to 8.5 GHz for R&S ZND................................. 174
5.7.4 Frequency Range Extension to 8.5 GHz for bidirectional R&S ZND.......................... 174
5.7.5 Time Domain Analysis.................................................................................................174
5.7.6 Frequency Resolution 1 mHz......................................................................................182
5.7.7 High Output Power for R&S ZND................................................................................182
5.7.8 GPIB Interface.............................................................................................................182
5.7.9 Handler I/O (Universal Interface)................................................................................ 182
5.7.10 Additional Removable System Drive...........................................................................183
5.7.11 Extended Power Range.............................................................................................. 183
5.7.12 External Power Meters................................................................................................183
6 GUI Reference.................................................................................... 186
6.1 Function Keys and Softtools................................................................................... 186
6.2 Meas Softtool.............................................................................................................188
6.2.1 S-Params Tab............................................................................................................. 188
6.2.2 Ratios Tab................................................................................................................... 197
6.2.3 Wave Tab.................................................................................................................... 200
6.2.4 Z←Sij Tab....................................................................................................................203
6.2.5 Y←Sij Tab................................................................................................................... 205
5User Manual 1173.9557.02 ─ 37

R&S® ZNC/ZND
6.2.6 Y-Z-Params Tab.......................................................................................................... 206
6.2.7 Stability Tab................................................................................................................. 208
6.2.8 Power Sensor Tab....................................................................................................... 210
6.3 Format Softtool..........................................................................................................211
6.4 Scale Softtool............................................................................................................ 217
6.4.1 Scale Values Tab.........................................................................................................218
6.4.2 Scale Coupling Tab..................................................................................................... 220
6.4.3 Zoom Tab.................................................................................................................... 221
6.5 Trace Config Softtool................................................................................................223
6.5.1 Traces Tab...................................................................................................................223
6.5.2 Mem Math Tab............................................................................................................ 228
6.5.3 All Mem All Data Tab................................................................................................... 235
6.5.4 Time Domain Tab........................................................................................................ 237
Contents
6.5.5 Time Gate Tab.............................................................................................................241
6.5.6 Trace Statistics Tab..................................................................................................... 243
6.5.7 Smooth Shift Hold Tab................................................................................................ 248
6.5.8 Trace Data Tab............................................................................................................251
6.6 Lines Softtool............................................................................................................ 258
6.6.1 Limit Test Tab.............................................................................................................. 258
6.6.2 Ripple Test Tab............................................................................................................266
6.6.3 Circle Test Tab.............................................................................................................270
6.6.4 Display Circle Tab....................................................................................................... 273
6.6.5 Horiz. Line Tab............................................................................................................ 275
6.7 Marker Softtool..........................................................................................................276
6.7.1 Markers Tab................................................................................................................ 276
6.7.2 Marker Props Tab........................................................................................................ 278
6.7.3 Marker Search Tab...................................................................................................... 281
6.7.4 Multiple Peak Tab........................................................................................................ 285
6.7.5 Target Search Tab....................................................................................................... 286
6.7.6 Bandfilter Tab.............................................................................................................. 288
6.7.7 Set by Marker Tab....................................................................................................... 293
6.7.8 Info Field Tab...............................................................................................................294
6.8 Stimulus Softtool...................................................................................................... 295
6User Manual 1173.9557.02 ─ 37

R&S® ZNC/ZND
6.8.1 Stimulus Tab................................................................................................................295
6.8.2 Power Tab................................................................................................................... 297
6.8.3 Time Domain X-Axis Tab.............................................................................................298
6.9 Power Bw Avg Softtool.............................................................................................300
6.9.1 Power Tab................................................................................................................... 300
6.9.2 Bandwidth Tab.............................................................................................................300
6.9.3 Average Tab................................................................................................................ 301
6.10 Sweep Softtool.......................................................................................................... 303
6.10.1 Sweep Params Tab..................................................................................................... 303
6.10.2 Sweep Type Tab..........................................................................................................306
6.10.3 Sweep Control Tab...................................................................................................... 316
6.11 Cal Softtool................................................................................................................320
6.11.1 Start Cal Tab............................................................................................................... 320
Contents
6.11.2 Cal Devices Tab.......................................................................................................... 341
6.11.3 Pwr Cal Settings Tab................................................................................................... 354
6.11.4 Use Cal Tab.................................................................................................................360
6.12 Channel Config Softtool........................................................................................... 365
6.12.1 Channels Tab.............................................................................................................. 365
6.12.2 Mode Tab.................................................................................................................... 369
6.12.3 Pwr Cal Settings Tab................................................................................................... 374
6.13 Trigger Softtool......................................................................................................... 374
6.13.1 Trigger Tab.................................................................................................................. 374
6.13.2 Sweep Control Tab...................................................................................................... 379
6.14 Offset Embed Softtool.............................................................................................. 379
6.14.1 Offset Embed Dock Widget.........................................................................................379
6.14.2 Offset Tab.................................................................................................................... 387
6.14.3 One Way Loss Tab...................................................................................................... 393
6.14.4 Single Ended Tab........................................................................................................ 395
6.14.5 Fixture Modeling Dialog.............................................................................................. 398
6.14.6 Port Sets Tab...............................................................................................................407
6.14.7 Balanced Tab.............................................................................................................. 410
6.14.8 Ground Loop Tab........................................................................................................ 412
6.14.9 Differential Match Tab..................................................................................................414
7User Manual 1173.9557.02 ─ 37

R&S® ZNC/ZND
6.14.10 Config Tab................................................................................................................... 416
6.15 File Softtool............................................................................................................... 417
6.15.1 Recall Sets Tab........................................................................................................... 418
6.15.2 Favorites Tab...............................................................................................................420
6.15.3 Print Tab...................................................................................................................... 421
6.15.4 Trace Data Tab............................................................................................................421
6.15.5 More Tab..................................................................................................................... 421
6.16 Print Softtool............................................................................................................. 422
6.16.1 Print Tab...................................................................................................................... 422
6.16.2 Printer Setup Dialog.................................................................................................... 423
6.17 Applic Softtool...........................................................................................................424
6.17.1 External Tools Application........................................................................................... 424
6.18 Display Softtool.........................................................................................................426
Contents
6.18.1 Diagram Tab................................................................................................................ 426
6.18.2 Split Tab...................................................................................................................... 430
6.18.3 Config Tab................................................................................................................... 432
6.18.4 View Bar Tab............................................................................................................... 437
6.18.5 Touchscreen Tab.........................................................................................................438
6.19 Setup Softtool............................................................................................................439
6.19.1 Setup Tab.................................................................................................................... 439
6.19.2 Freq. Ref. Tab............................................................................................................. 453
6.19.3 Remote Settings Tab................................................................................................... 454
6.19.4 External Devices Tab.................................................................................................. 457
6.20 Help Softtool..............................................................................................................462
6.21 Additional Function Keys.........................................................................................463
7 Remote Control.................................................................................. 465
7.1 Introduction to Remote Control...............................................................................465
7.1.1 Starting a Remote Control Session.............................................................................466
7.1.2 GPIB Explorer............................................................................................................. 466
7.1.3 Switchover to Remote Control.................................................................................... 468
7.1.4 Combining Manual and Remote Control..................................................................... 471
7.2 Messages................................................................................................................... 472
7.2.1 Device Messages (Commands and Device Responses)............................................ 472
8User Manual 1173.9557.02 ─ 37

R&S® ZNC/ZND
7.2.2 SCPI Command Structure and Syntax........................................................................472
7.2.3 SCPI Parameters........................................................................................................ 476
7.3 Basic Remote Control Concepts............................................................................. 478
7.3.1 Traces, Channels, and Diagram Areas....................................................................... 478
7.3.2 Active Traces in Remote Control.................................................................................479
7.3.3 Initiating Measurements, Speed Considerations.........................................................480
7.3.4 Addressing Traces and Channels............................................................................... 481
7.4 Command Processing.............................................................................................. 482
7.4.1 Input Unit.....................................................................................................................482
7.4.2 Command Recognition................................................................................................483
7.4.3 Data Base and Instrument Hardware..........................................................................483
7.4.4 Status Reporting System............................................................................................ 484
7.4.5 Output Unit.................................................................................................................. 484
Contents
7.4.6 Command Sequence and Command Synchronization............................................... 484
7.5 Status Reporting System......................................................................................... 486
7.5.1 Overview of Status Registers......................................................................................487
7.5.2 Structure of an SCPI Status Register..........................................................................487
7.5.3 Contents of the Status Registers................................................................................ 489
7.5.4 Application of the Status Reporting System................................................................496
7.5.5 Reset Values of the Status Reporting System............................................................ 499
8 Command Reference......................................................................... 500
8.1 Special Terms and Notation..................................................................................... 500
8.1.1 Upper/Lower Case...................................................................................................... 501
8.1.2 Special Characters......................................................................................................501
8.1.3 Parameters..................................................................................................................501
8.1.4 Numeric Suffixes......................................................................................................... 501
8.2 Common Commands................................................................................................ 502
8.3 SCPI Command Reference.......................................................................................503
8.3.1 CALCulate Commands............................................................................................... 504
8.3.2 CONFigure Commands...............................................................................................652
8.3.3 CONTrol Commands...................................................................................................659
8.3.4 DIAGnostic Commands...............................................................................................668
8.3.5 DISPlay Commands....................................................................................................670
9User Manual 1173.9557.02 ─ 37

R&S® ZNC/ZND
8.3.6 FORMat Commands................................................................................................... 694
8.3.7 HCOPy Commands.....................................................................................................696
8.3.8 INITiate Commands.................................................................................................... 700
8.3.9 INSTrument Commands..............................................................................................703
8.3.10 MEMory.......................................................................................................................704
8.3.11 MMEMory Commands................................................................................................ 706
8.3.12 OUTPut Commands....................................................................................................743
8.3.13 PROGram Commands................................................................................................ 748
8.3.14 [SENSe:] Commands.................................................................................................. 751
8.3.15 SOURce Commands...................................................................................................849
8.3.16 STATus Commands.....................................................................................................872
8.3.17 SYSTem Commands................................................................................................... 875
8.3.18 TRACe Commands..................................................................................................... 901
Contents
8.3.19 TRIGger Commands................................................................................................... 904
8.4 R&S ZVR/ZVABT Compatible Commands...............................................................911
9 Programming Examples....................................................................935
9.1 Basic Tasks................................................................................................................935
9.1.1 Typical Stages of a Remote Control Program.............................................................935
9.1.2 Channel, Trace and Diagram Handling.......................................................................938
9.2 Condensed Programming Examples...................................................................... 944
9.2.1 Path Independent RC Programs................................................................................. 944
9.2.2 Trace and Diagram Handling...................................................................................... 945
9.2.3 Using Markers............................................................................................................. 954
9.2.4 Data Handling............................................................................................................. 956
9.2.5 Calibration................................................................................................................... 960
9.2.6 Fixture Modeling..........................................................................................................965
10 Error Messages and Troubleshooting..............................................967
10.1 Errors during Firmware Operation.......................................................................... 967
10.1.1 Asynchronous Errors...................................................................................................968
10.1.2 Errors during Measurement........................................................................................ 968
10.2 Errors during Firmware Installation/Update........................................................... 969
10.3 Obtaining Technical Support................................................................................... 970
10User Manual 1173.9557.02 ─ 37

R&S® ZNC/ZND
11 Annexes..............................................................................................971
11.1 Administrative Tasks................................................................................................ 971
11.1.1 Windows Operating System........................................................................................971
11.1.2 Firmware Update.........................................................................................................972
11.1.3 Remote Operation in a LAN........................................................................................ 972
11.2 System Recovery...................................................................................................... 976
11.3 Interfaces and Connectors.......................................................................................977
11.3.1 Rear Panel Connectors...............................................................................................977
11.3.2 LAN Interface.............................................................................................................. 979
11.3.3 GPIB Interface.............................................................................................................979
11.3.4 Handler I/O (Universal Interface)................................................................................ 983
11.4 Maintenance.............................................................................................................. 991
11.4.1 Cleaning...................................................................................................................... 991
Contents
11.4.2 Storing and Packing the Instrument............................................................................ 992
11.4.3 Replacing Fuses......................................................................................................... 992
11.5 Showroom Mode....................................................................................................... 992
11.6 ENA Emulation Commands......................................................................................993
Glossary: Frequently Used Terms.................................................. 1001
List of Commands............................................................................1007
Index..................................................................................................1024
11User Manual 1173.9557.02 ─ 37

R&S® ZNC/ZND
Contents
12User Manual 1173.9557.02 ─ 37

R&S® ZNC/ZND
1 Preface
1.1 Documentation Overview
1.1.1 Getting Started Manual
Preface
Documentation Overview
This chapter provides safety-related information, an overview of the user documentation and the conventions used in the documentation.
This section provides an overview of the R&S ZNC/ZND user documentation. Unless
specified otherwise, you find the documents on the R&S ZNC/ZND product page at:
●
https://www.rohde-schwarz.com/manual/ZNC
●
https://www.rohde-schwarz.com/manual/ZND
Introduces the R&S ZNC/ZND and describes how to set up and start working with the
product. Includes basic operations, typical measurement examples, and general information, e.g. safety instructions, etc.
A printed version is delivered with the instrument. A PDF version is available for download on the Internet.
1.1.2 User Manual and Help
The user manual contains the description of all instrument modes and functions. It also
provides an introduction to remote control, a complete description of the remote control
commands with programming examples, and information on maintenance, instrument
interfaces and error messages. Includes the contents of the getting started manual.
The contents of the user manual is available as help in the R&S ZNC/ZND. The help
offers quick, context-sensitive access to the complete information for the instrument
and its firmware.
The user manual is also available for download or for immediate display on the Internet.
1.1.3 Service Manual
Describes the performance test for checking the rated specifications, module replacement and repair, firmware update, troubleshooting and fault elimination, and contains
mechanical drawings and spare part lists.
The service manual is available for registered users on the global Rohde & Schwarz
information system (GLORIS):
●
R&S ZNC Service Manual
13User Manual 1173.9557.02 ─ 37

R&S® ZNC/ZND
1.1.4 Instrument Security Procedures
1.1.5 Basic Safety Instructions
1.1.6 Data Sheets and Brochures
Preface
Documentation Overview
●
R&S ZND Service Manual
Deals with security issues when working with the R&S ZNC/ZND in secure areas. It is
available for download on the Internet.
Contains safety instructions, operating conditions and further important information.
The printed document is delivered with the instrument.
The data sheet contains the technical specifications of the R&S ZNC/ZND. It also lists
the firmware applications and their order numbers, and optional accessories.
The brochure provides an overview of the instrument and deals with the specific characteristics.
See
●
https://www.rohde-schwarz.com/brochure-datasheet/ZNC
●
https://www.rohde-schwarz.com/brochure-datasheet/ZND
1.1.7 Release Notes and Open Source Acknowledgment (OSA)
The release notes list new features, improvements and known issues of the current
firmware version, and describe the firmware installation.
The open source acknowledgment document provides verbatim license texts of the
used open source software.
See
●
https://www.rohde-schwarz.com/firmware/ZNC
●
https://www.rohde-schwarz.com/firmware/ZND
1.1.8 Application Notes, Application Cards, White Papers, etc.
These documents deal with special applications or background information on particular topics.
See
●
https://www.rohde-schwarz.com/application/ZNC
●
https://www.rohde-schwarz.com/application/ZND
14User Manual 1173.9557.02 ─ 37

R&S® ZNC/ZND
1.2 Conventions Used in the Documentation
1.2.1 Typographical Conventions
Preface
Conventions Used in the Documentation
The following text markers are used throughout this documentation:
Convention Description
[Keys] Key and knob names are enclosed by square brackets.
"Graphical user interface elements"
File names, commands,
program code
Input Input to be entered by the user is displayed in italics.
Links Links that you can click are displayed in blue font.
"References" References to other parts of the documentation are enclosed by quota-
All names of graphical user interface elements on the screen, such as
dialog boxes, menus, options, buttons, and softkeys are enclosed by
quotation marks.
File names, commands, coding samples and screen output are distinguished by their font.
tion marks.
1.2.2 Conventions for Procedure Descriptions
When operating the instrument, several alternative methods may be available to perform the same task. In this case, the procedure using the touchscreen is described.
Any elements that can be activated by touching can also be clicked using an additionally connected mouse. The alternative procedure using the keys on the instrument or
the on-screen keyboard is only described if it deviates from the standard operating procedures.
The term "select" may refer to any of the described methods, i.e. using a finger on the
touchscreen, a mouse pointer in the display, or a key on the instrument or on a keyboard.
1.2.3 Notes on Screenshots
When describing the functions of the product, we use sample screenshots. These
screenshots are meant to illustrate as many as possible of the provided functions and
possible interdependencies between parameters. The shown values may not represent
realistic usage scenarios.
The screenshots usually show a fully equipped product, that is: with all options installed. Thus, some functions shown in the screenshots may not be available in your particular product configuration.
15User Manual 1173.9557.02 ─ 37

R&S® ZNC/ZND
2 Safety Information
Safety Information
The product documentation helps you use the R&S ZNC/ZND safely and efficiently.
Follow the instructions provided here and in the printed "Basic Safety Instructions".
Keep the product documentation nearby and offer it to other users.
Intended use
The R&S ZNC/ZND is intended for the development, production and verification of
electronic components and devices in industrial, administrative, and laboratory environments. Use the R&S ZNC/ZND only for its designated purpose. Observe the operating
conditions and performance limits stated in the data sheet.
Where do I find safety information?
Safety information is part of the product documentation. It warns you about the potential dangers and gives instructions how to prevent personal injuries or damage caused
by dangerous situations. Safety information is provided as follows:
●
The printed "Basic Safety Instructions" provide safety information in many languages and are delivered with the R&S ZNC/ZND.
●
Throughout the documentation, safety instructions are provided when you need to
take care during setup or operation.
16User Manual 1173.9557.02 ─ 37

R&S® ZNC/ZND
3 Release Notes for Firmware V2.94
Release Notes for Firmware V2.94
Version 2.94 of the R&S ZNC/ZND firmware provides the following changes:
New Functionality
●
Windows 10 support
– New R&S ZND ship with Windows 10 (64bit)
– Analyzer firmware V2.94 or higher supports Windows 10 and Windows 7
– Windows edition, version and build are now part of the analyzer's hardware info
For the R&S ZND, upgrade kits Windows 7 → Windows 10 and additional removable system drives with Windows 10 are also available
Improvements
●
Up to 100 trace colors in user-defined color schemes
See "Number of Trace Colors" on page 445
●
Ports sets for offset de-/embedding: the "port set number" is now indicated in the
"Port Set" selection combo boxes
●
Fixture Compensation calculation now uses the configured Freq for Loss instead of
a fixed reference frequency of 1 GHz
●
Marker tracking now also works for coupled markers
●
Touchstone file export dialog (free configuration): selected ports and port order can
be preserved per recall set
See "Save Settings in Recall Set" on page 258
●
Optimized calculation of time domain traces if balanced ports are configured and
distance is used as the x-axis
Solved Issues
●
For a unidirectional R&S ZND, the "S-Parameter Wizard" could not be finished
without calibration
●
"Low Pass Step" time domain representation (R&S ZNC/ZND-K2): DC extrapolation did only work for S-parameter traces
●
Fixture measurement data were not always stored with s1p file name extension
●
In presence of single-ended and balanced ports, sometimes the impedance
renormalization was not applied
Downgrade to a firmware version < 2.40
In order to downgrade the firmware from a version ≥ 2.40 to a version < 2.40, it is
required to uninstall the "R&S ZNBC Compass Webserver" using the Windows "Programs and Features" control panel before proceeding with the installation.
Firmware version
► To check your R&S ZNC/ZND firmware version, select "Help" > "About..." from the
main menu.
17User Manual 1173.9557.02 ─ 37

R&S® ZNC/ZND
4 Getting Started
4.1 Putting the Analyzer into Operation
Getting Started
Putting the Analyzer into Operation
This section describes the basic steps to be taken when setting up the analyzer for the
first time.
Simple measurement examples are provided in Chapter 4.4, "Performing Measure-
ments", on page 58; for a description of the operating concept refer to Chapter 4.3,
"Operating the Instrument", on page 34. For all background and reference informa-
tion concerning manual and remote control of the instrument, refer to your analyzer's
help system or user manual. A more detailed description of the hardware connectors
and interfaces is also part of the help system or user manual.
Risk of injury due to disregarding safety information
Observe the information on appropriate operating conditions provided in the data sheet
to prevent personal injury or damage to the instrument. Read and observe the basic
safety instructions provided with the instrument, in addition to the safety instructions in
the following sections. In particular:
●
Do not open the instrument casing.
Risk of instrument damage due to inappropriate operating conditions
An unsuitable operating site or test setup can damage the instrument and connected
devices. Before switching on the instrument, observe the information on appropriate
operating conditions provided in the data sheet. In particular, ensure the following:
●
All fan openings are unobstructed and the airflow perforations are unimpeded. A
minimum distance of 10 cm to other objects is recommended.
●
The instrument is dry and shows no sign of condensation.
●
The instrument is positioned as described in the following sections.
●
The ambient temperature does not exceed the range specified in the data sheet.
●
Signal levels at the input connectors are all within the specified ranges.
●
Signal outputs are connected correctly and are not overloaded.
4.1.1 Unpacking and Checking the Instrument
Check the equipment for completeness using the delivery note and the accessory lists
for the various items. If you notice any damage, immediately contact the carrier who
delivered the instrument.
18User Manual 1173.9557.02 ─ 37

R&S® ZNC/ZND
4.1.2 Positioning the Instrument
Getting Started
Putting the Analyzer into Operation
Packing material
Retain the original packing material. If the instrument needs to be transported or shipped later, you can use the material to protect the control elements and connectors.
Risk of injury during transportation
The carrying handles at the front and side of the casing are designed to lift or carry the
instrument. Do not apply excessive force to the handles. If a handle is ripped off, the
falling instrument can cause injury.
The network analyzer is designed for use under laboratory conditions, either on a
bench top or in a rack. Notice the general ambient conditions at the operating site
described under "Risk of instrument damage due to inappropriate operating conditions"
on page 18.
Instrument damage caused by electrostatic discharge
Electrostatic discharge (ESD) can damage the electronic components of the instrument
and the device under test (DUT). Electrostatic discharge is most likely to occur when
you connect or disconnect a DUT or test fixture to the instrument's test ports. To prevent electrostatic discharge, use a wrist strap and cord and connect yourself to the
ground, or use a conductive floor mat and heel strap combination.
4.1.3 Bench Top Operation
If the analyzer is operated on a bench top, the surface must be flat. The instrument can
be used in horizontal or vertical position, standing on its feet, or with the support feet
on the bottom expanded.
19User Manual 1173.9557.02 ─ 37

R&S® ZNC/ZND
Getting Started
Putting the Analyzer into Operation
Risk of injury if feet are folded out
The feet can fold in if they are not folded out completely or if the instrument is shifted.
Collapsing feet can cause injury or damage the instrument.
●
Fold the feet completely in or out to ensure stability of the instrument. Never shift
the instrument when the feet are folded out.
●
When the feet are folded out, do not work under the instrument or place anything
underneath.
●
The feet can break if they are overloaded. The overall load on the folded-out feet
must not exceed 500 N.
4.1.4 Operation in a 19" Rack
The R&S ZNC/ZND can be mounted in 19" racks using the adapter R&S ZZA-KN5
(order number 1175.3040.00). Proceed according to the mounting instructions supplied
with the rack adapter.
Risk of instrument damage due to insufficient airflow in a rack
If you mount several instruments in a rack, you need an efficient ventilation concept to
ensure that the instruments do not overheat. Insufficient airflow for a longer period can
disturb the operation and even cause damage.
4.1.5 EMI Suppression
Electromagnetic Interference (EMI) can affect the measurement results.
To suppress generated Electromagnetic Interference:
●
Use suitable shielded cables of high quality (see table below)
●
Always terminate open cable ends
●
Note the EMC classification in the data sheet
Regarding cable length and quality, the following requirements have to be met:
Table 4-1: Cable Requirements
Cable Type (Connector) Requirement
RF cables (PORT 1, ..., PORT N) Double shielded
BNC cables (various) Double shielded
20User Manual 1173.9557.02 ─ 37

R&S® ZNC/ZND
4.1.6 Connecting the Analyzer to the AC Supply
Getting Started
Putting the Analyzer into Operation
Cable Type (Connector) Requirement
DB-25 (USER PORT) Double shielded
GPIB Standard cable
Handler I/O Standard cable
DVI-D (Monitor) 2 ferrite cores
LAN At least CAT6, S/FTP
USB Standard cables, length ≤ 3m
The network analyzer is automatically adapted to the AC supply voltage, which must
be in the range of 100 V to 240 V at 50 Hz to 60 Hz. The mains connector is located in
the upper part of the rear panel (see Chapter 4.2.2, "Rear Panel", on page 32).
► Connect the network analyzer to the AC power source using the AC power cable
delivered with the instrument.
The maximum power consumption and the typical power consumption of the individual
analyzer models are listed in the data sheet.
The R&S ZNC is protected by two fuses located in the fuse drawer below the AC
power switch; see Chapter 11.4.3, "Replacing Fuses", on page 992. There are no such
fuses on the R&S ZND.
4.1.7 Starting the Analyzer and Shutting Down
The AC power switch is located in the upper part of the rear panel, together with the
mains connector and the fuse drawer (R&S ZNC only); see Chapter 4.2.2, "Rear
Panel", on page 32.
To start the analyzer, proceed as follows:
1. Switch the AC power switch to position I (On).
After power-on, the analyzer automatically goes to standby or ready state, depending on the state of the standby toggle key at the front panel when the instrument
was switched off last time.
2. If necessary, press the standby toggle key on the front panel to switch the instrument to ready state (the green LED goes on).
The instrument automatically performs a system check, boots the Windows® operating system and then starts the vector network analyzer (VNA) application. If it
was terminated regularly, the VNA application restores all recall sets and instrument settings of the previous analyzer session.
21User Manual 1173.9557.02 ─ 37

R&S® ZNC/ZND
Getting Started
Putting the Analyzer into Operation
To shut down the analyzer, proceed as follows:
1. Press the standby key.
Pressing the standby key causes the instrument to save all loaded recall sets, to
close the VNA application, to shut down Windows®, and to go to standby state. Of
course, you can also perform these steps manually, like in any Windows session.
2. If desired, set the AC power switch to position O (Off).
Risk of data loss
It is recommended to switch the analyzer to standby state before disconnecting it from
the AC supply. If you set the power switch to 0 while the VNA application is still running, you lose the current settings. Moreover, loss of program data cannot be excluded
if the application is terminated improperly.
The AC power switch can be permanently on. It is recommendable, however, to switch
it off if the instrument is not used for some time. When you switch the instrument back
on, be sure to comply with the extended warm-up phase specified in the data sheet.
To guarantee the specified functionality, after turning off the R&S ZNC/ZND, you have
to wait for at least 10 seconds before turning it on again. This rule applies to both the
AC power off and the standby state.
4.1.8 Standby and Ready State
The standby toggle key is located in the bottom left corner of the front panel.
In standby state, the right, amber LED is on. The standby power only supplies the
power switch circuits. In this state, it is safe to switch the AC power off and disconnect
the instrument from the power supply.
In ready state, the left, green LED is on and all modules are power-supplied. When
switched to ready state, the analyzer initiates its startup procedure.
Observe the instructions for startup and shutdown in Chapter 4.1.7, "Starting the Ana-
lyzer and Shutting Down", on page 21.
4.1.9 Connecting External Accessories
The analyzer's standard PC interfaces (Monitor, USB, LAN) can be used to connect
various accessories:
●
An external monitor expands/displays the Windows® desktop, which is, by default,
covered by the Vector Network Analyzer (VNA) application window in full-screen
mode.
22User Manual 1173.9557.02 ─ 37

R&S® ZNC/ZND
4.1.9.1 Connecting a Monitor
Getting Started
Putting the Analyzer into Operation
●
External keyboard and mouse simplify local control, in particular manual (GUI)
operation of the VNA application.
●
A printer can be used to create hard copies of the measurement diagrams and
traces from within the VNA application.
●
A LAN connection can be established to access the analyzer's mass storage or
control the analyzer from an external PC.
External monitor, keyboard and mouse are not required for local operation. A
R&S ZNC/ZND can be fully controlled by tapping the touchscreen and front panel keys.
A standard monitor can be connected to the DVI-D connector on the rear panel of the
R&S ZNC/ZND (labeled "MONITOR (DVI-D)" on the R&S ZNC and "DVI" on the
R&S ZND). No extra configuration is required.
Safety aspects
The monitor must be connected while the instrument is switched off (or in standby
mode). Otherwise correct operation cannot be guaranteed.
Select SYSTEM > [DISPLAY] > "View Bar" > "Hard Key Panel On" from the menu bar
of the VNA application window to add the (virtual) "Hard Key Panel" to the application
window.
4.1.9.2 Connecting a Keyboard
A keyboard can be connected to any of the USB connectors. After being auto-detected
by the operating system, it can safely be disconnected and reconnected even during
measurements.
Keyboard configuration
The default input language is English – US. Select "Settings" > "Time & language" >
"Region & language" from the Windows® Start menu to manage languages and keyboards.
Windows 7: select "Control Panel" > "Clock, Language, and Region" > "Region and
Language" > "Keyboards and Languages" from the Windows® Start menu to configure
the keyboard properties.
To access Windows®, press the Windows key on the front panel or on the external keyboard.
23User Manual 1173.9557.02 ─ 37

R&S® ZNC/ZND
4.1.9.3 Connecting a Mouse
4.1.9.4 Connecting a Printer
Getting Started
Putting the Analyzer into Operation
A USB mouse can be connected to any of the USB connectors. After being auto-detected by the operating system, it can safely be disconnected and reconnected even during measurements.
Mouse configuration
Select "Settings" > "Devices" > "Mouse & touchpad" from the Windows® "Start" menu
to configure the mouse properties.
Windows 7: select "Control Panel" > "Hardware and Sound" > "Devices and Printers" >
"Mouse" from the Windows® "Start" menu to configure the mouse properties.
To access Windows®, press the Windows key on the front panel or on the external keyboard.
A printer can be connected to any of the USB connectors. After successful installation,
it can safely be disconnected and reconnected even during measurements.
Before printing (SYSTEM – [PRINT]), the analyzer checks whether a printer is connected and turned on and whether the appropriate printer driver is installed.
Printer driver installation
If necessary, the printer driver installation is initiated using the operating system's "Add
Printer Wizard". The wizard is self-explanatory. A printer driver must be installed only
once.
A great variety of printer drivers is available on the analyzer. To obtain the complete
list, select "Settings" > "Devices" > "Printers & scanners" from the Windows® "Start"
menu.
Windows 7: select "Control Panel" > "Hardware and Sound" > "Devices and Printers"
from the Windows® "Start" menu.
To access Windows®, press the Windows key on the front panel or on the external keyboard.
You can load updated and improved driver versions or new drivers from an installation
disk, USB memory stick or another external storage medium. Alternatively, if the analyzer is integrated in a network, you can install driver data stored in a network directory.
In either case, use the "Add Printer" wizard to complete the installation.
24User Manual 1173.9557.02 ─ 37

R&S® ZNC/ZND
4.1.9.5 Connecting a LAN Cable
Getting Started
Putting the Analyzer into Operation
Printer configuration
Use the "Printer Setup" dialog of the firmware (SYSTEM – [PRINT] > "Print...") or the
Windows® printer management to configure the printer properties and printing preferences.
A LAN cable can be connected to the LAN connector on the rear panel of the analyzer.
To establish a LAN connection, proceed as follows:
1. Refer to Chapter 11.1.3.1, "Assigning an IP Address", on page 973.
2. Connect a CAT6 or CAT7 LAN cable to the LAN port.
The LAN port of the analyzer is an auto-crossover Ethernet port. You can connect it to
a network, but you can also set up a direct connection to a computer or another instrument. For both connection types, you can use either crossover or straight through
(patch) cables.
The IP address information is displayed in the SYSTEM – [SETUP] > "Remote Settings" softtool tab.
4.1.10 Minimizing the VNA Application
With a minimized VNA application, you can access your analyzer's Windows® desktop
or run other applications.
To exit the default full-screen mode of the VNA application, deselect SYSTEM – [DISPLAY] > "View Bar" > "Title Bar Task Bar". Then use the standard Windows® titlebar
functions to minimize/maximize/close the application window.
To start the VNA application with a minimized window
1. Right-click the Vector Network Analyzer shortcut icon on the desktop and open the
"Properties" dialog.
2. In the "Shortcut" tab, select "Run: Minimized".
25User Manual 1173.9557.02 ─ 37

R&S® ZNC/ZND
Getting Started
Instrument Tour
A software update restores the original shortcut properties.
4.2 Instrument Tour
This chapter gives an overview of the control elements and connectors of the
R&S ZNC/ZND and gives all information that is necessary to put the instrument into
operation and connect external devices.
4.2.1 Front Panel
The front panel of the network analyzer consists of the touchscreen with the diagrams
and softtool panels (left side), the hardkey area (right side) and the test port area
below. Brief explanations on the controls and connectors, the hardkey area and the
rear panel can be found on the next pages.
26User Manual 1173.9557.02 ─ 37

R&S® ZNC/ZND
Getting Started
Instrument Tour
Figure 4-1: Front View of R&S ZNC3
Figure 4-2: Front View of R&S ZND
27User Manual 1173.9557.02 ─ 37

R&S® ZNC/ZND
4.2.1.1 Touchscreen
Getting Started
Instrument Tour
Instrument damage caused by cleaning agents
Cleaning agents contain substances such as solvents (thinners, acetone, etc.), acids,
bases, or other substances. Solvents can damage the front panel labeling, plastic
parts, or screens, for example.
Never use cleaning agents to clean the outside of the instrument. Use a soft, dry, lintfree dust cloth instead.
The analyzer is equipped with a 12.1'' XGA color touchscreen. The touchscreen presents all measurement results, mostly in the form of diagrams. Besides, all instrument
functions can be accessed and operated by tapping the control elements on the touchscreen. For an introduction to touchscreen operation, refer to Chapter 4.3.1, "Manual
Operation ", on page 35.
The following sections contain further useful information about manual control of the
instrument.
●
Refer to the other sections in chapter Chapter 4.3, "Operating the Instrument",
on page 34 to learn how to handle traces and diagrams, and how to use menus,
keys and softtools.
●
Refer to Chapter 5.2.1, "Display Elements of a Diagram", on page 77 to obtain
information about the results in the diagram.
●
Refer to section Chapter 6.18, "Display Softtool", on page 426 to learn how to customize the screen.
●
Refer to the data sheet for the technical specifications of the display.
Screen saver
The screen saver function of the operating system can be used to switch off the display
if the analyzer receives no command for a selectable period of time. The display is
switched on again if any front panel key is pressed.
To enable the screen saver, access the Windows® operating system (e.g. by pressing
the Windows key in the SYSTEM keypad) and tap "Control Panel > Power Options >
Change Plan Settings > Turn off the display".
(Windows 7: "Control Panel > Hardware and Sound > Power Options > Edit Plan Settings > Turn off the display").
4.2.1.2 Function Keys
Most of the keys in the TRACE, CHANNEL, STIMULUS, and SYSTEM keypads call up
a related softtool of the analyzer GUI. Every softtool provides access to a group of related measurement settings.
28User Manual 1173.9557.02 ─ 37

R&S® ZNC/ZND
Getting Started
Instrument Tour
The TRACE keys give access to all trace settings, to the limit check settings, and to
the marker functions including marker search.
●
The [MEAS] settings select the measured and displayed quantity.
●
The [FORMAT] settings define how measured data (traces) are presented.
●
The [SCALE] settings define how traces are scaled.
●
The [TRACE CONFIG] settings store traces to the memory and perform mathematical operations on traces.
●
The [LINES] settings define limits for the measurement results, visualize them in
the diagrams and activate/deactivate the limit check.
●
The [MARKER] settings position markers on a trace, configure their properties and
select the format of the numerical readout. Markers can also be used to locate specific points on the trace, define the sweep range, and scale the diagram.
The CHANNEL keys give access to the hardware-related (channel) settings.
●
The [POWER BW AVG] settings define the power of the internal signal source, the
IF bandwidth, and the sweep average.
●
The [SWEEP] settings define the scope of measurement, including the sweep type
and the number of measured sweeps.
●
[CAL] provides all functions that are necessary to perform a system error correction
(calibration).
●
[CHANNEL CONFIG] provides functions for channel management.
●
The [TRIGGER] settings control the start of the measurement sequence.
●
[OFFSET EMBED] provides a selection of length offset parameters to shift the
measurement plane.
The STIMULUS keys ([START], [STOP], [CENTER], [SPAN]) define the sweep range,
depending on the sweep type.
The SYSTEM keys provide general system settings.
●
[FILE] provides standard Windows® functions used to create, save, recall or print
recall sets, to copy the active screen and to shut down the application.
●
The [PRINT] settings control an external printer that is used to print a hardcopy of
the current recall set.
●
[APPLIC] gives access to external software tools and optional extensions of the
analyzer firmware.
●
[DISPLAY] gives access to all display settings and to the functions which activate,
modify and arrange different diagrams.
●
[SETUP] provides general system settings which are not restricted to a particular
recall set.
●
The Windows® key opens the startup menu of the Windows® operating system
from where you can perform system configurations and call up additional software
utilities.
●
[HELP] opens the context-sensitive help system of the analyzer.
●
[PRESET] performs a preset of the instrument settings.
29User Manual 1173.9557.02 ─ 37

R&S® ZNC/ZND
4.2.1.3 Data Entry Keys
Getting Started
Instrument Tour
The keys in the DATA ENTRY keypad are used to enter numbers, units, and characters. The data entry keys are only enabled while the cursor is placed on a data input
field in a dialog or in the Help navigation pane.
●
The keys 0 to 9 enter the corresponding numbers.
●
The function of the "." and "–" keys depends on the data type of the active input
field:
– In numeric input fields, the keys enter the decimal point and a negative sign for
the entered numeric value. Multiple entries have not effect.
– In character input fields, the keys enter a dot and a hyphen, respectively. Both
entries can be repeated as often as desired.
●
The function of the four unit keys depends on the data type of the active input field;
see Chapter 4.3.5, "Entering Data", on page 50.
– In numeric input fields, the G/n, M/μ, k/m or x1 keys multiply the entered value
(-)9
(-)6
with factors of 10
, 10
(-)3
, 10
or 1 and add the appropriate physical unit. x1
is equivalent to ENTER and confirms the previous entry.
– In character input fields, the G/n, M/μ, k/m keys enter the letters G, M, K,
respectively. x1 is equivalent to ENTER and confirms the previous entry.
●
ESC is used to:
– Cancel entries / close dialogs without activating the entries made (equivalent to
the "Close" button).
– Close the Help system.
●
ENTER is used to:
– Activate the selected active control element, e.g. a button in a dialog or a link in
the "Contents" page of the Help system.
– Confirm selections and entries made and close dialogs (equivalent to the "OK"
button).
– Compress or expand menus or the Help table of contents
●
BACKSPACE deletes the last character before the cursor position or the selected
character sequence or numeric value.
4.2.1.4 Rotary Knob
The rotary knob increases and decreases numerical values, scrolls within lists, activates controls and confirms entries. Turning or pressing the rotary knob is equivalent to
the action of the "Cursor Up" and "Cursor Down" navigation keys or of the ENTER key
in the DATA ENTRY keypad, respectively.
STEP SIZE opens an input box to select the steps (in units of the current physical
parameter) between two consecutive numerical values. The step size is also valid for
value changes using the "Cursor Up" and "Cursor Down" keys. See also Chap-
ter 4.3.5.2, "Using the Numeric Editor", on page 51.
4.2.1.5 Navigation Keys
30User Manual 1173.9557.02 ─ 37

R&S® ZNC/ZND
Getting Started
Instrument Tour
The keys in the NAVIGATION keypad are used to navigate within the touchscreen and
the help system, to access and control active elements.
The "Cursor Up" and "Cursor Down" keys are used to:
●
Scroll up and down in lists, e.g. among menu items, in a list of keywords, in the
Help table of contents, or in the Help index
●
Navigate between table rows in diagrams. Press "OK" to toggle between navigation
mode and data entries.
●
Increase and decrease numerical input values
"Cursor Up" (Down) become inactive as soon as the beginning of the list is reached.
"Cursor Up" (Down) is equivalent to a rotation of the rotary knob to the right (left).
The "Cursor Left" and "Cursor Right" keys are used to:
●
Move the cursor to the left or right within input fields
●
Navigate between table columns in diagrams. Press "OK" to toggle between navigation mode and data entries.
●
Compress or expand menus or the Help table of contents
●
Move the highlighted item in the menu bar of the active application
ENT OK is equivalent to the action of the ENTER key in the DATA ENTRY keypad.
UNDO reverses the last action, if possible. REDO reverses the action of the UNDO
button.
4.2.1.6 Standby Key
The standby toggle switch is located in the bottom left corner of the front panel.
The key serves two main purposes:
●
Toggle between standby and ready state; see Chapter 4.1.8, "Standby and Ready
State", on page 22.
●
Shut down the instrument; see Chapter 4.1.7, "Starting the Analyzer and Shutting
Down", on page 21.
4.2.1.7 Front Panel Connectors
The test ports and four USB connectors are located on the front panel of the analyzer.
Test Ports
Numbered type N female connectors.
The test ports serve as outputs for the RF stimulus signal and as inputs for the measured RF signals from the DUT (response signals).
●
With a single test port, it is possible to generate a stimulus signal and measure the
response signal in reflection. For a measurement example, refer to Chapter 4.4.2,
"Reflection S-Parameter Measurement", on page 66.
●
With 2 test ports, full two-port measurements are possible; see Chapter 5.3.1, "S-
Parameters", on page 99.
31User Manual 1173.9557.02 ─ 37

R&S® ZNC/ZND
Getting Started
Instrument Tour
However, to use port 2 of a R&S ZND as driving port, you need one of the "bidirectional measurements" options:
– R&S ZND-K5, for a R&S ZND without "extended frequency range" option
R&S ZND-K1
– R&S ZND-K6, for a R&S ZND with "extended frequency range" option
R&S ZND-K1
Maximum input levels
The maximum input levels at all test ports according to the front panel labeling or the
data sheet must not be exceeded.
In addition, the maximum input voltages of the other input connectors at the rear panel
must not be exceeded.
Use a torque wrench when screwing RF cables on the test port connectors.
USB Connectors
Four USB 2.0 connectors of type A (master USB).
The USB ports can be used to connect:
●
External PC accessories such as mouse or other pointing devices, a keyboard,
printer or external storage device (USB stick, CD-ROM drive etc.).
●
External measurement equipment such as a calibration unit or power meter.
4.2.2 Rear Panel
This section gives an overview of the rear panel controls and connectors of the network analyzer.
32User Manual 1173.9557.02 ─ 37

R&S® ZNC/ZND
Getting Started
Instrument Tour
Figure 4-3: Rear Panel R&S ZNC
Figure 4-4: Rear Panel R&S ZND
The following connectors are available on all instruments:
●
LAN is an RJ-45 connector. Use this connector to integrate the instrument to a
Local Area Network, primarily for remote control purposes; see Chapter 11.1.3.1,
"Assigning an IP Address", on page 973.
See also Chapter 11.3.2, "LAN Interface", on page 979.
33User Manual 1173.9557.02 ─ 37

R&S® ZNC/ZND
Getting Started
Operating the Instrument
●
Connectors MONITOR (DVI-D) on the R&S ZNC and DVI on the R&S ZND can be
used to connect an external monitor; see Chapter 4.1.9.1, "Connecting a Monitor",
on page 23.
●
USER PORT is a 25-pin D-Sub connector used as an input and output for low-voltage (3.3 V) TTL control signals.
See Chapter 11.3.1.1, "USER PORT", on page 977.
●
EXT TRIG IN and EXT TRIG OUT are two BNC connectors for 5 V TTL external
trigger signals.
See Chapter 6.13.1, "Trigger Tab", on page 374.
●
REF OUT is a BNC output for the internal reference frequency of the R&S ZNC/
ZND. Use this connector to synchronize other instruments to the analyzer.
●
REF IN is a BNC input for an external reference frequency. Use this connector to
synchronize the R&S ZNC/ZND to another device.
●
SYSTEM DRIVE contains the removable system drive of the R&S ZNC/ZND, containing all software (including the operating system and the VNA application) and
data. Do not remove the system drive during operation.
Option R&S ZNC-B19 provides an additional removable system drive (including
operating system and firmware). See Chapter 5.7.10, "Additional Removable Sys-
tem Drive", on page 183.
●
The ground connector in the lower left corner of the rear panel provides the ground
of the analyzer's supply voltage. Use this connector for ESD protection; see "Instru-
ment damage caused by electrostatic discharge" on page 19.
The following optional connectors can be installed in addition:
●
Option R&S ZNC/ZND-B10 provides a GPIB bus connector according to standard
IEEE 488 / IEC 625.
See Chapter 11.3.3, "GPIB Interface", on page 979.
●
Option R&S ZN-B14, Handler I/O (Universal Interface), provides a Centronics 36
input/output connector.
See Chapter 11.3.4, "Handler I/O (Universal Interface)", on page 983.
Input levels, EMC
The maximum input levels and voltages of the input connectors at the front and rear
panel must not be exceeded. Match signals with 50 Ω to comply with EMC directives.
See also Chapter 4.1.5, "EMI Suppression", on page 20.
4.3 Operating the Instrument
The following sections describe the basics of manual operation, i.e. how to access
instrument functions and settings via the analyzer GUI. Manual operation is particularly
useful for getting to know the instrument and for trouble shooting.
34User Manual 1173.9557.02 ─ 37
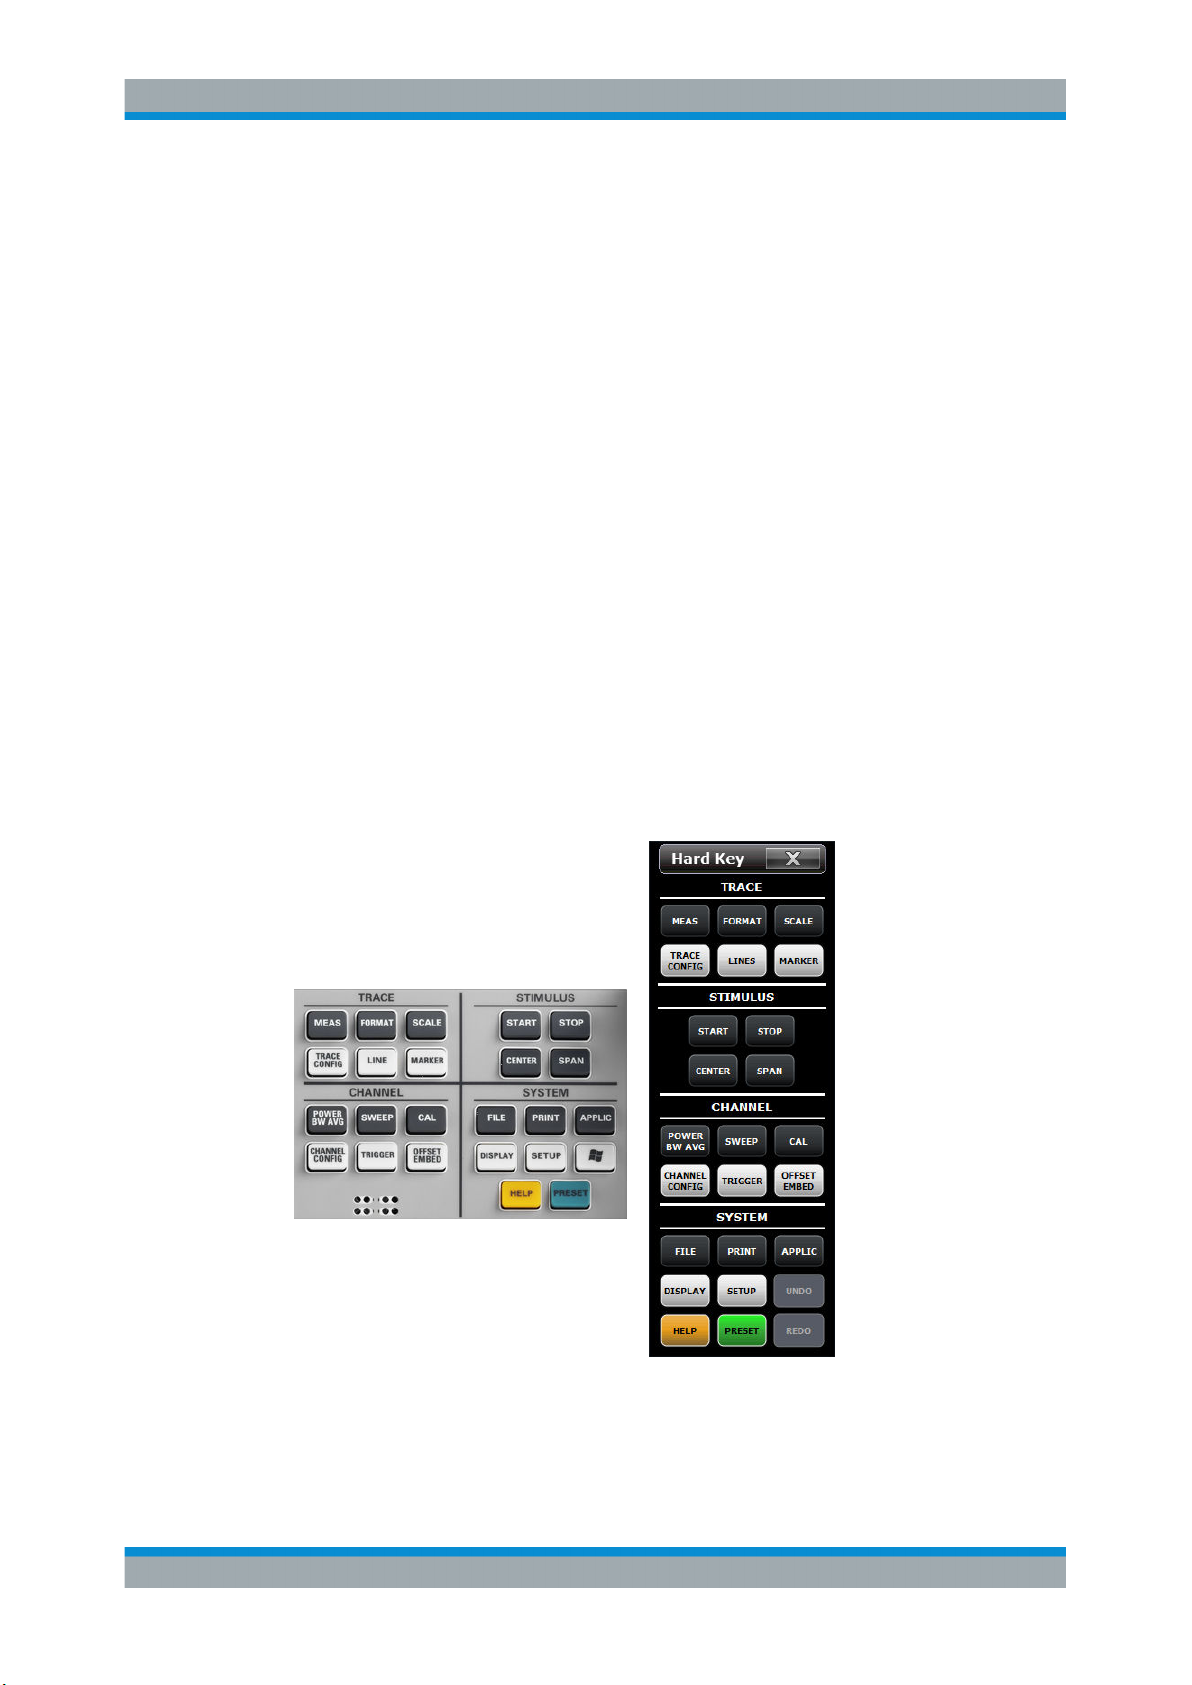
R&S® ZNC/ZND
4.3.1 Manual Operation
Getting Started
Operating the Instrument
Manual and remote control of the instrument
Manual control of the R&S ZNC/ZND is possible either via its touchscreen and frontpanel keys, via locally connected keyboard and mouse (see Chapter 4.1.9, "Connecting
External Accessories", on page 22), or via Remote Desktop (see also Chapter 11.1.3,
"Remote Operation in a LAN", on page 972). Alternatively it can be remote-controlled
via the GPIB interface or a LAN connection.
Manual operation and remote control are described to their full extent in the GUI Refer-
ence and Command Reference chapters, respectively. GUI functions and their related
remote commands are linked bidirectionally. Background information is provided in the
Concepts and Features chapter.
The analyzer functions are accessible via several tabbed softtools, each presenting
related functions and settings. The keys on the front panel or the on-screen "Hard Key
Panel" open the most frequently used softtools.
Manual operation via function keys and softtools provides touch-friendly access to the
instrument functions and settings, avoiding complicated menu structures and long
operating sequences. In general, this approach is recommended. However, sometimes
the toolbar or an object's context menu can offer a shortcut. As a full-fledged alternative for manual operation via mouse and keyboard, also the menu bar provides access
to all instrument functions and settings.
Figure 4-5: Function Keys
35User Manual 1173.9557.02 ─ 37
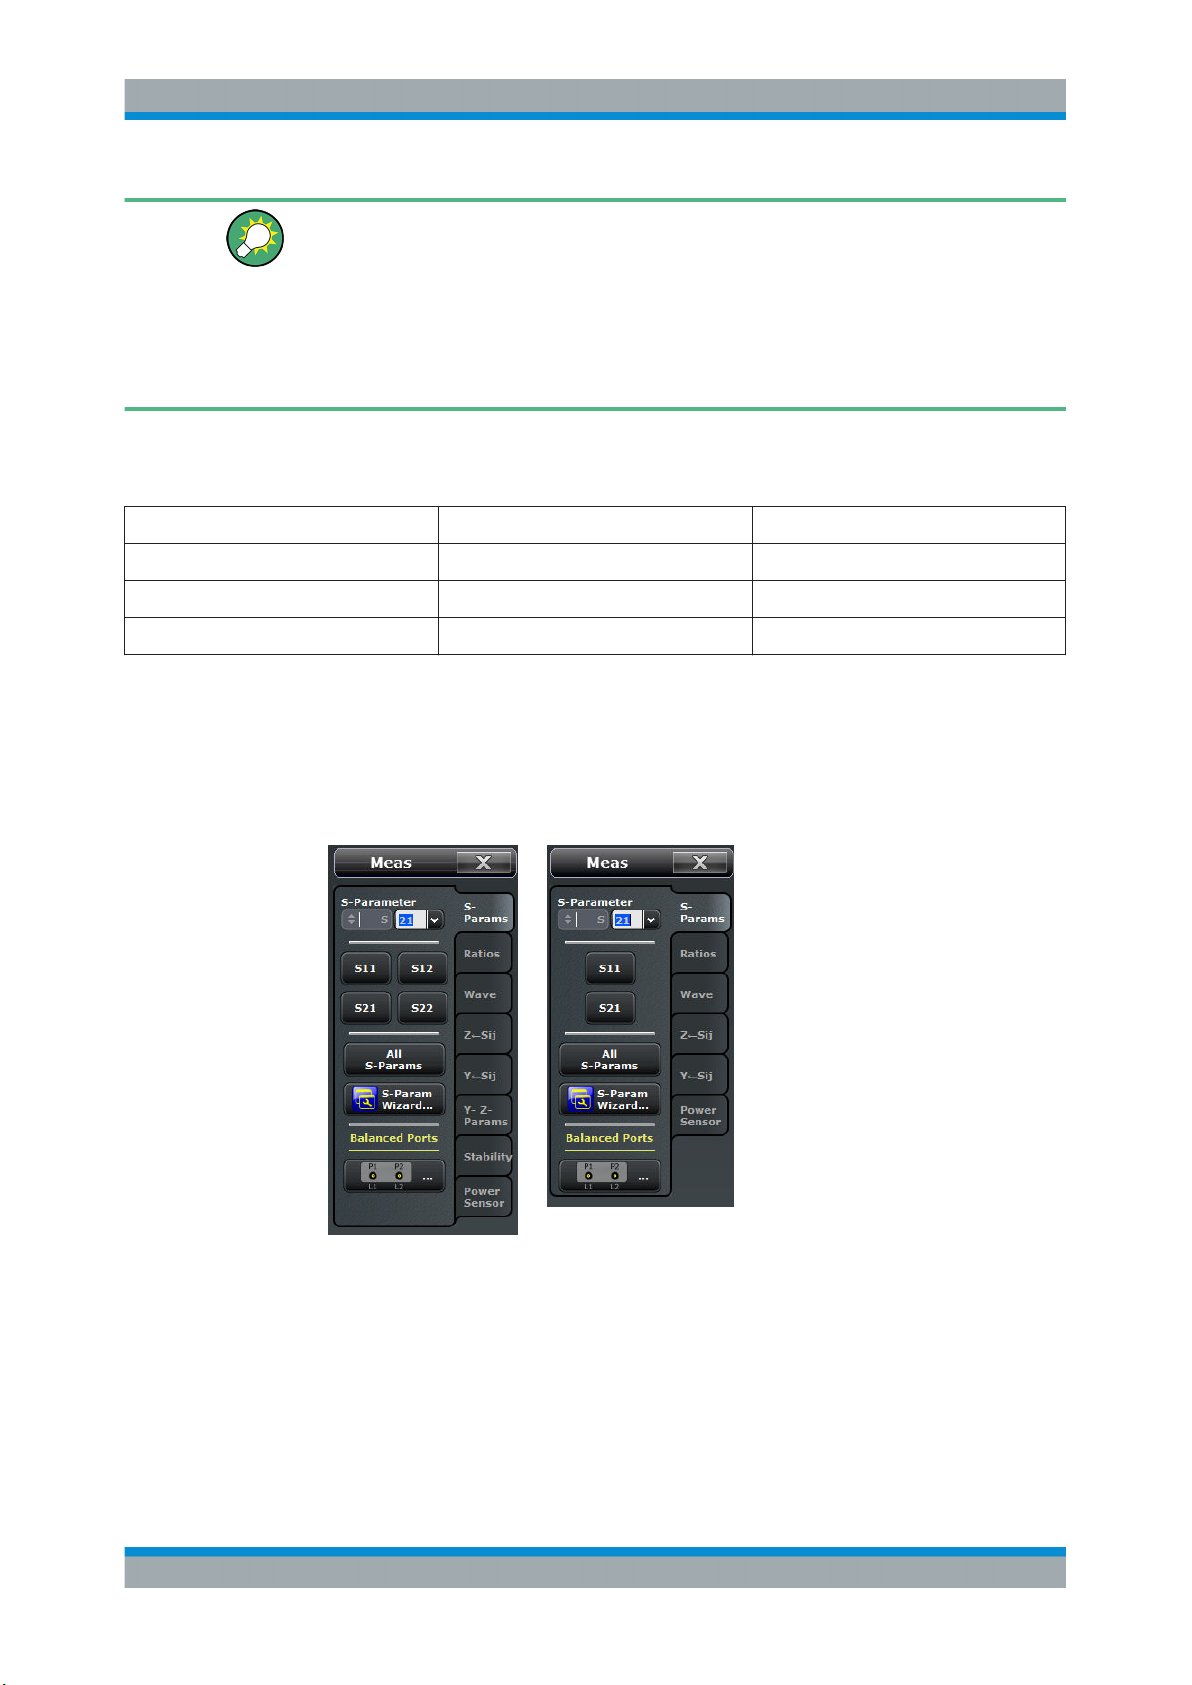
R&S® ZNC/ZND
Getting Started
Operating the Instrument
Customizing the screen
The contents of the screen and the size and position of many display and control elements are not fixed. You can display or hide most elements. You can also drag and
drop traces, info fields, and even the softtool panel to your preferred position; see
Chapter 4.3.4.4, "Using Drag and Drop", on page 49.
For example, you can show/hide the on-screen hardkey panel by selecting/deselecting
"Display" > "View Bar" > "Hard Key Panel On" from the main menu.
The following table shows possible touchscreen operations with the corresponding
mouse operations.
Touchscreen Mouse Typical task
Tap control element for a short time Click control element (left mouse button) Select button or tab
Tap for an extended time (tap and hold) Click (right button) Open context menu
Tap twice (double-tap) Double-click (left button) Open on-screen keyboard
Using the Front Panel
To access an instrument function:
1. Press a (virtual) key, e.g. the [MEAS] key in the TRACE section.
The corresponding softtool expands at the current docking position.
= R&S ZNC or bidirectional R&S ZND
left
right = unidirectional R&S ZND
2. Activate the desired softtool tab, e.g. "Z←Sij".
36User Manual 1173.9557.02 ─ 37

R&S® ZNC/ZND
Getting Started
Operating the Instrument
left = R&S ZNC or bidirectional R&S ZND
right = unidirectional R&S ZND
3. Select a control element, e.g. "Z←S11".
The diagram immediately reflects your selection. The active trace shows the measurement results for the selected measured quantity.
A control element with three dots (e.g. SYSTEM – [SETUP] > "Setup" > "System Config...") opens a dialog, containing a group of related settings, a wizard or additional
information.
Using the menu bar
The menu bar at the bottom of the application screen provides alternative access to all
instrument functions. To repeat the measured quantity selection described above,
► Select TRACE – [MEAS] > "Z←Sij" > "Z←S11".
The diagram immediately reflects your selection. The active trace shows the measurement results for the selected measured quantity. At the same time, the related
softtool tab is opened.
37User Manual 1173.9557.02 ─ 37

R&S® ZNC/ZND
Getting Started
Operating the Instrument
Using context menus
Context menus are another alternative for quick access to instrument settings.
1. Touch and hold (right-click) the measured quantity section in the trace info for a
couple of seconds until the context menu appears.
left = R&S ZNC or bidirectional R&S ZND
right = unidirectional R&S ZND
2. Select "S-Parameter" to open the "Meas" > "S-Params" softtool tab.
= R&S ZNC or bidirectional R&S ZND
left
right = unidirectional R&S ZND
38User Manual 1173.9557.02 ─ 37

R&S® ZNC/ZND
4.3.2 Control Elements of the Application Window
Getting Started
Operating the Instrument
3. Select "Z←Sij" > "Z←S11".
left = R&S ZNC or bidirectional R&S ZND
right = unidirectional R&S ZND
The application window of the analyzer provides all control elements for the measurements and contains the diagrams for the results. There are several alternative ways for
accessing an instrument function:
●
Using a function key on the (virtual) hardkey panel to open the related softtool (recommended, provides all settings)
●
Using the menus and submenus of the menu bar (alternative to the previous
method)
●
Using the context menus of certain display objects (for important actions in the
context of this object)
●
Using the icons in the toolbar above the diagram area (for frequent global actions)
39User Manual 1173.9557.02 ─ 37

R&S® ZNC/ZND
Getting Started
Operating the Instrument
These methods are described in more detail in the following sections.
For further reference:
●
Refer to Chapter 5.2.1, "Display Elements of a Diagram", on page 77 to obtain
information about the results in the diagram.
●
Refer to Chapter 6.18, "Display Softtool", on page 426 and learn how to customize
the screen.
4.3.2.1 Title Bar
By default, the analyzer GUI is shown in full screen mode, covering the whole screen
and hiding the Windows taskbar. However, you can toggle the full screen mode using
SYSTEM – [DISPLAY] > "View Bar" > "Title and Task Bar On".
If full screen mode is switched off, the main application window of the vector network
analyzer application provides a standard Windows® title bar.
40User Manual 1173.9557.02 ─ 37

R&S® ZNC/ZND
4.3.2.2 Toolbar
Getting Started
Operating the Instrument
The toolbar above the diagram area contains the most frequently used control elements of the user interface. All controls are also accessible via Softtools.
The toolbar is divided into five icon groups, separated by vertical lines.
●
The leftmost group comprises recall set actions (SYSTEM – [PWR BW AVG] >
"Recall Sets"): add a new recall set ("New..."), open a recall set file ("Open
Recall..."), save the active recall set to a file ("Save...").
●
The second group comprises the undo and redo actions that are also accessible
via the SYSTEM – [UNDO] and SYSTEM – [REDO] front panel keys.
●
The icons in the middle group control the graphical zoom function (TRACE –
[SCALE] > "Zoom"): "Zoom Reset", "Zoom Select", and "Overview Select".
●
The icons in the fourth group provide the following actions, from left to right:
– Add a new trace and (possibly) a new diagram (TRACE – [TRACE CONFIG] >
"Trace").
– Add a marker (TRACE – [MARKER] > "Markers")
– Delete a marker, trace, or diagram
●
The icon in the rightmost group allows you to restart the sweep in all channels
(CHANNEL – [SWEEP] > "Sweep Control" > "Restart Sweep").
You can hide the toolbar using SYSTEM – [DISPLAY] > "View Bar".
4.3.2.3 Softtools
Softtools display groups of related settings as a tabbed panel. They can be opened via
function keys on the front panel or the on-screen "Hard Key" panel, or via menu bar
and context menu items.
41User Manual 1173.9557.02 ─ 37

R&S® ZNC/ZND
Getting Started
Operating the Instrument
Figure 4-6: Scale softtool
A softtool consists of a title area with a close/re-open icon and a tabbed panel below it.
The title area remains displayed when the softtool is closed, which allows you to
reopen a closed softtool at any time.
Some controls on the softtool tabs allow you to read and modify settings (e.g. "Ref
Value" in the screenshot above), some perform actions (e.g. "Auto Scale Trace"), while
others open additional dialogs (button label ends with "...").
4.3.2.4 Menu Bar
All analyzer functions are arranged in drop-down menus. The menu bar is located
across the bottom of the diagram:
As in any Windows® application, menus can be controlled with the touchscreen or a
mouse. A short tap (left mouse click) expands a menu or submenu. If a menu command has no submenu assigned, a short tap (left mouse click) opens a dialog or
directly activates the menu command. When a (sub)menu is selected, the
R&S ZNC/ZND displays the corresponding softtool.
Overview of menu functions
●
The "File" menu provides standard Windows® functions that can be used to create,
save, recall or print recall sets, to copy the current screen or to shut down the
application.
●
The "Trace" menu provides all trace settings, the limit check settings, and the
marker functions including marker search.
●
The "Channel" menu provides all channel settings and activates, modifies or stores
different channels.
42User Manual 1173.9557.02 ─ 37
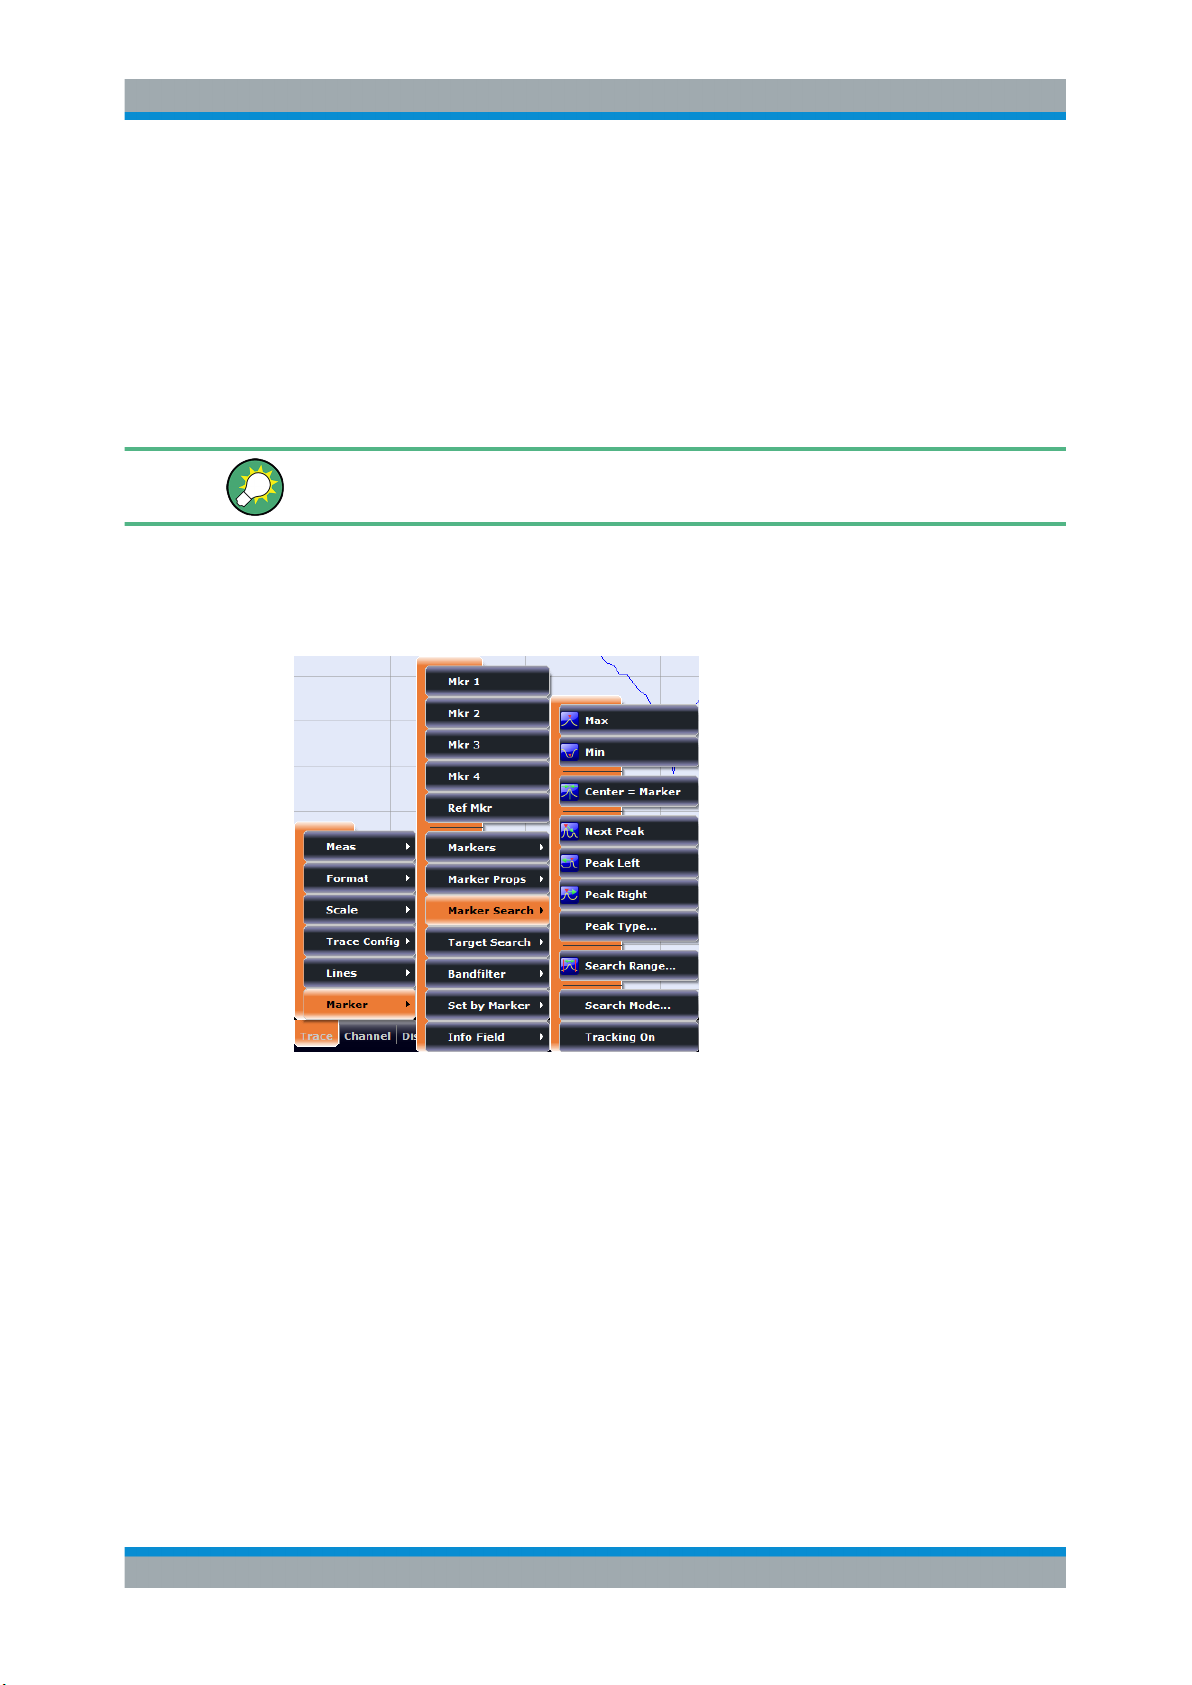
R&S® ZNC/ZND
4.3.2.5 Menu Structure
Getting Started
Operating the Instrument
●
The "Display" menu provides all display settings and the functions for activating,
modifying and arranging different diagrams.
●
The "Applications" menu gives access to applications and tools that extend the
functionality of the analyzer firmware.
●
The "System" menu provides functions that can be used to return to a defined
instrument state, reverse operations, access service functions and define various
system-related settings.
●
The "Help" menu provides assistance with the network analyzer and its operation.
You can toggle the visibility of the menu bar using SYSTEM – [DISPLAY] > "View Bar"
> "Menu Bar".
All menus show an analogous structure.
●
A menu command with a right arrow expands a submenu with further related settings.
Example: "Marker" expands a submenu with marker-related properties.
●
A menu command with three dots appended calls up a dialog providing several
related settings.
Example: "Search Range" opens a dialog to define the search range for the
marker search.
●
A menu command with no arrow or dots initiates an immediate action.
Example: "Max" sets the active marker to the maximum of the active trace.
4.3.2.6 Hardkey Panel
The (virtual) "Hard Key" panel provides on-screen access to the function keys (plus the
[UNDO] and [REDO] key) of the R&S ZNC/ZND. Most of the function keys open a rela-
43User Manual 1173.9557.02 ─ 37

R&S® ZNC/ZND
Getting Started
Operating the Instrument
ted softtool. For a short description, refer to section Chapter 4.2.1.2, "Function Keys",
on page 28.
The "Hard Key" panel is particularly useful if the analyzer is controlled from an external
monitor or Remote Desktop.
For the R&S ZNC/ZND, it is hidden by default.
You can display the "Hard Key" panel using one of the following methods:
●
Select SYSTEM – [DISPLAY] > "View Bar" > "Hard Key Panel".
●
Select "Display"> "View Bar" > "Hard Key Panel On" from the menu bar.
●
Select "Hard Key" from the context menu of the softtool panel.
4.3.2.7 Status Bar
The status bar shows
●
the current channel's sweep averaging counter (e.g. "Ch<i>: Avg 9/10"), or "Ch<i>:
Avg None" if averaging is disabled
●
the active channel and drive port (P1, P2 ...)
●
the progress of the sweep
The progress bar also shows when the R&S ZNC/ZND prepares a sweep with new
channel settings
(See Chapter 5.1.4, "Sweep Control", on page 71)
●
the External Reference symbol, if an external reference clock is used for synchronization
(see "Ext Frequency" on page 454)
44User Manual 1173.9557.02 ─ 37

R&S® ZNC/ZND
4.3.3 Working with Dialogs
Getting Started
Operating the Instrument
●
A green LXI status symbol indicates that a LAN connection has been established;
a red symbol indicates that no LAN cable is connected.
●
the current date and time
The progress bar shows a moving color gradient if the current sweep is too fast to be
monitored, e.g. because the number of sweep points is low. You can hide/show the status bar using SYSTEM – [DISPLAY] > "View Bar" > "Status Bar".
Dialogs provide groups of related settings and allow to make selections and enter data
in an organized way. The settings are visualized, if possible. An example is shown
below.
45User Manual 1173.9557.02 ─ 37

R&S® ZNC/ZND
Getting Started
Operating the Instrument
For a unidirectional R&S ZND, the bidirectional calibrations are not available.
All dialogs are operated in a similar way.
●
To open a dialog, select a softtool button with three dots appearing in its label (e.g.
"Start... (Manual)").
●
The title bar of each dialog contains some convenience functions:
– Use the "Dialog Transparency" slider to make the display elements behind the
dialog visible.
●
Drag and drop the lower right corner of the dialog to modify its size.
●
Some dialogs are subdivided into tabs, containing groups of related settings. Activate a tab to access those settings.
See also Chapter 5.2.2.1, "Immediate vs. Confirmed Settings", on page 88.
The Help system provides useful information about each dialog's specific settings.
Select "Help" to open the Help.
4.3.4 Handling Diagrams, Traces, and Markers
The analyzer displays measurement results as traces in rectangular diagrams. Markers
are used to read specific numerical values and to search for points or regions on a
trace. The following section presents some of the graphical tools the R&S ZNC/ZND
provides for trace and marker handling.
For further reference
Refer to Chapter 5, "Concepts and Features", on page 68 to learn more about traces,
channels, and screen elements.
4.3.4.1 Adding New Traces and Diagrams
A new trace is required if you want to measure and display an additional quantity.
Typical scenario: The transmission coefficient S21 is measured as described in Chap-
ter 4.4.1, "Transmission S-Parameter Measurement", on page 59. A trace is added to
display the reflection coefficient S11 for comparison.
To create a trace:
1. Drag the "New Trace" icon from the toolbar into a diagram.
The diagram changes its color scheme and contents as shown below. A rectangle
with diagonal lines divides the diagram into different sectors.
46User Manual 1173.9557.02 ─ 37

R&S® ZNC/ZND
Getting Started
Operating the Instrument
2. Select the sector, depending on whether you want to display the new trace in the
existing diagram, or whether you want to add a new diagram.
3. In the dialog box that is opened when you release the "New Trace" icon, select the
S-parameter to be measured.
= R&S ZNC or bidirectional R&S ZND
left
right = unidirectional R&S ZND
The R&S ZNC/ZND generates a new trace for the selected S-parameter.
47User Manual 1173.9557.02 ─ 37

R&S® ZNC/ZND
4.3.4.2 Adding New Markers
Getting Started
Operating the Instrument
Alternative control elements
To measure a different quantity, select TRACE – [MEAS]. Drag and drop a softkey representing a measured quantity to create a trace. Or simply select another softkey to
change the measured quantity of the active trace.
Select TRACE – [TRACE CONFIG] to access more trace handling functions. Select
SYSTEM – [DISPLAY] to access more diagram handling functions.
A marker is needed, for instance, to read a particular numerical trace value.
To add a new marker:
●
Drag and drop the "New Marker" icon from the toolbar to the desired position in the
target diagram.
The marker appears on the target diagram's active trace. The marker info field displays the stimulus value (x-axis value) and response value (y-axis value) at the
marker position. The response value varies as the analyzer continues performing
sweeps.
Active trace, alternative control elements
The trace line of the active trace in the upper part of the diagram is highlighted. If the
diagram contains several traces, first activate the target trace, then add the marker.
The TRACE – [MARKER] softtool provides more functions for marker handling. In particular, any marker offered in the "Markers" tab can be positioned on the active trace
using drag & drop.
4.3.4.3 Deleting Display Elements
Markers, traces, diagrams, and other display elements are most conveniently deleted
using the "Delete" icon in the toolbar above the diagram area.
●
To delete a single marker, drag it into vertical direction to release it from the trace
and drop it onto the "Delete" icon.
48User Manual 1173.9557.02 ─ 37
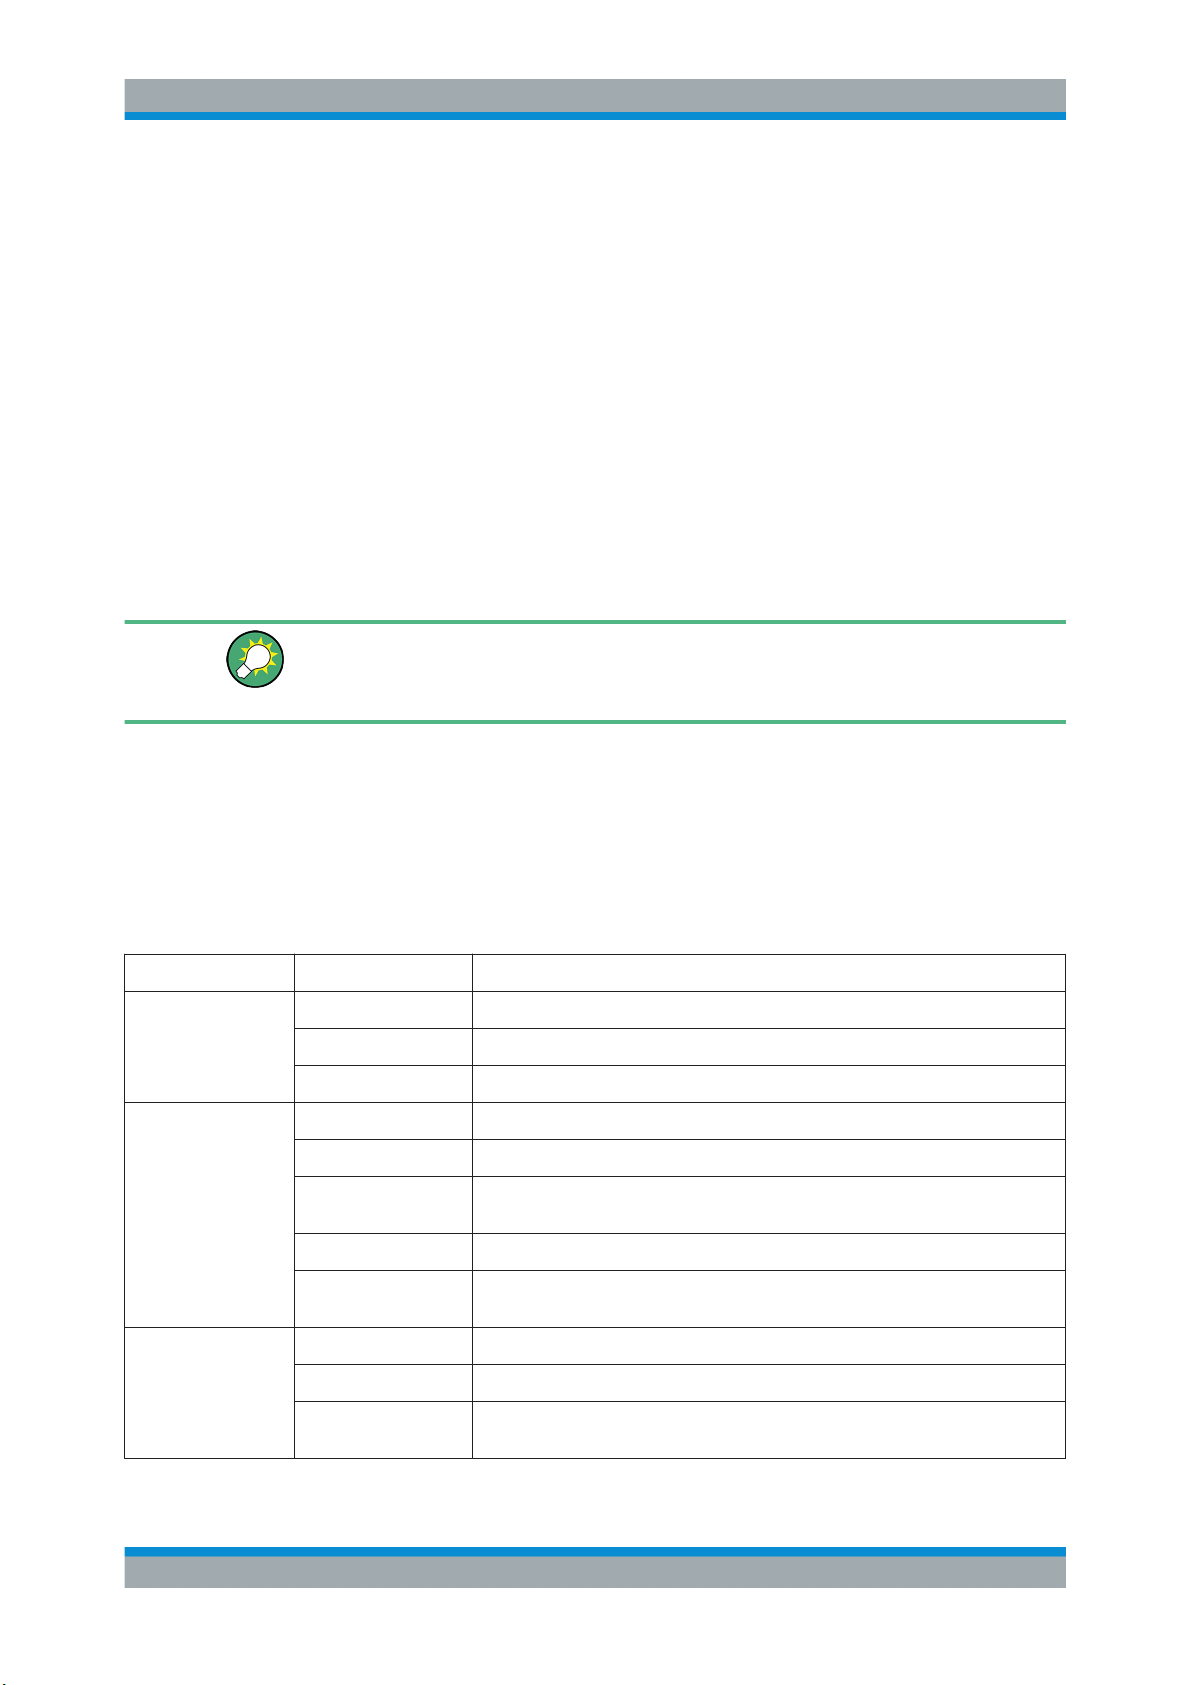
R&S® ZNC/ZND
Getting Started
Operating the Instrument
To delete a set of markers, drag and drop their marker info field onto the "Delete"
icon.
Deleting a marker and its info field also disables the associated marker function.
●
To delete a trace, drag and drop its trace line onto the "Delete" icon.
Note however, that the last remaining trace cannot be deleted.
●
To delete a diagram, drag and drop its diagram number label onto the "Delete"
icon.
Note however, that the last remaining diagram cannot be deleted.
●
To delete a channel, drag and drop all associated traces onto the "Delete" icon.
Note however, that the last remaining channel cannot be deleted.
●
To hide the limit lines and disable the limit check, drag and drop the PASS / FAIL
message onto the "Delete" icon. The limit line itself is not deleted; you can re-use it
any time.
The context menu of some display elements also provides the "Delete" function.
Undo function
If you happen to delete a display element unintentionally, you can restore it using the
"Undo" toolbar icon.
4.3.4.4 Using Drag and Drop
You can drag and drop many of the R&S ZNC/ZND's control and display elements to
change their size and position. The drag and drop functionality is often more convenient to use than the equivalent buttons of the softtool panels. The following table gives
an overview.
Table 4-2: Drag and drop functionality for various screen elements
Screen element Action Drag and drop...
Diagram Create See Chapter 4.3.4.1, "Adding New Traces and Diagrams", on page 46
Resize Separator between adjacent diagrams
Delete See Chapter 4.3.4.3, "Deleting Display Elements", on page 48
Trace Create See Chapter 4.3.4.1, "Adding New Traces and Diagrams", on page 46
Move vertically Reference line marker (right diagram edge)
Move into other or new
diagram
Delete See Chapter 4.3.4.3, "Deleting Display Elements", on page 48
Reset / suspend
graphic zoom
Marker Create See Chapter 4.3.4.2, "Adding New Markers", on page 48
Trace line
"Zoom" element in additional trace line --> "Delete" icon; see Chapter 4.3.6.1,
"Using the Graphical Zoom", on page 53
Move horizontally Marker symbol
Delete Marker or marker info field --> "Delete" icon; see Chapter 4.3.4.3, "Deleting Dis-
play Elements", on page 48
49User Manual 1173.9557.02 ─ 37

R&S® ZNC/ZND
Operating the Instrument
Screen element Action Drag and drop...
Marker info field Add See Chapter 4.3.4.2, "Adding New Markers", on page 48
Move within diagram Marker info field (move to one of several pre-defined positions)
Delete See Chapter 4.3.4.3, "Deleting Display Elements", on page 48
Softtool panel Move Softtool panel (move to the right or left edge of the screen)
4.3.5 Entering Data
The analyzer provides dialogs with various types of input fields where you can enter
numeric values and character data. Data entry with a mouse and an external keyboard
is a standard procedure known from other Windows® applications. However, there are
various other ways to enter data.
4.3.5.1 Using Front Panel Keys
Getting Started
You can use the keys in the DATA ENTRY keypad to enter numbers, units, and characters.
To enter a numeric value:
1. Select a numeric data input field to activate it.
2. Press the data entry keys.
● Use [0] to [9] to enter the corresponding numbers.
● Use [.] to enter a decimal point.
● Use [-] to change the sign of the value.
●
Use [G/n], [M/μ], [k/m], or [x1] to multiply the entered value with factors of 10
(-)6
10
(-)3
, 10
or 1 and to add the appropriate physical unit.
50User Manual 1173.9557.02 ─ 37
(-)9
,

R&S® ZNC/ZND
Getting Started
Operating the Instrument
To enter a character string:
1. Tap a character data input field to activate it.
2. Press the DATA ENTRY keys as if you were writing a short message on your
mobile phone.
● Use [0] to [9] to enter the corresponding numbers.
● Use [.] and [-] to enter a dot or hyphen.
● Use Use [G/n], [M/μ], or [k/m] to enter the letters G, M or K (case-insensitive).
● Use the [←] key to correct wrong entries, deleting the character to the left of
the current cursor position.
● Press [ENTER] to complete an entry.
● Press [ESC] to discard the entries made.
3. To enter letters other than G, M or K, you can also use one of the methods described in the following sections:
● Chapter 4.3.5.3, "Using the Analyzer's On-Screen Keyboard", on page 52
●
Chapter 4.3.5.4, "Using the Windows® On-Screen Keyboard", on page 52
4.3.5.2 Using the Numeric Editor
The "Numeric Editor" is a tool for convenient entry and modification of numeric values.
It is available for all numeric input fields in the analyzer GUI.
Operation with touchscreen or mouse:
1. Double-tap (double-click) a numeric input field in a dialog or on a softtool to open
the numeric editor.
2. Use the buttons in the numeric keypad to compose the numeric input value.
3. If desired, select a "Step Size" and use the cursor up/down buttons to increment/
decrement the current value. If a marker is active, you can also set the numeric
value to the current marker value ("Set to Marker").
51User Manual 1173.9557.02 ─ 37

R&S® ZNC/ZND
4.3.5.3 Using the Analyzer's On-Screen Keyboard
Getting Started
Operating the Instrument
4. After completing the input string, select "ENTER" to apply your selection and close
the numeric editor.
[STEP SIZE] key
If a numeric input field is active, the [STEP SIZE] front panel key opens a dialog box
containing the "Step Size" panel of the numeric editor. Use this box for efficient operation of the rotary knob (and mouse wheel).
The on-screen "Keyboard" allows you to enter characters, in particular letters, without
an external keyboard. It is available for all text input fields in the analyzer GUI.
4.3.5.4
1. Activate a character data input field in a softtool or a dialog.
2. Double-tap/click the input field to open the on-screen keyboard.
3. Select character buttons to compose the input string.
4. Select "Enter" to apply your selection and close the keyboard.
Using the Windows
®
On-Screen Keyboard
The Windows® on-screen keyboard allows you to enter characters, in particular letters,
even if an input field cannot call up the analyzer's own on-screen keyboard. Examples
are input fields in standard Windows ® dialogs.
52User Manual 1173.9557.02 ─ 37

R&S® ZNC/ZND
Getting Started
Operating the Instrument
Figure 4-7: Windows 10 on-screen keyboard
To call up the on-screen keyboard:
1. Open the SYSTEM – [APPLIC] softtool.
2. In the "External Tools" tab, select "Screen Keyboard".
4.3.6 Scaling Diagrams
The analyzer provides various tools for customizing the diagrams and for setting the
sweep range. Choose the method that is most convenient for you.
4.3.6.1 Using the Graphical Zoom
The graphical zoom function magnifies a rectangular portion of the diagram (zoom window) to fill the entire diagram area. The sweep points are not affected.
The graphical zoom function is only supported for cartesian trace formats. For (inverted) Smith and polar diagrams, it is not available.
To activate the graphical zoom:
●
Select the "Zoom Select" toggle button in the toolbar above the diagram area.
The icon changes its background color from black to blue.
●
In the active diagram area, select an appropriate rectangular area.
53User Manual 1173.9557.02 ─ 37

R&S® ZNC/ZND
Getting Started
Operating the Instrument
The zoomed view shows the selected rectangle, scaled in both horizontal and vertical direction. In general, the zoom window covers only a part of the sweep range;
the horizontal distance between the sweep points increases. The reduced display
range is indicated in an additional zoom line in the channel info area.
If the active diagram is graphically zoomed, the "Overview Select" button in the toolbar
toggles an overview. The upper part of the diagram then shows a small version of the
unzoomed diagram. You can move the zoomed part of the trace by moving the
selected rectangular area in the overview.
Use the "Zoom Reset" icon to restore the original diagram. Alternatively, you can drag
and drop the "Zoom" label from the additional channel info line onto the "Delete" toolbar button.
54User Manual 1173.9557.02 ─ 37

R&S® ZNC/ZND
4.3.6.2 Setting the Sweep Range
Getting Started
Operating the Instrument
Alternative settings
●
The TRACE – [SCALE] > "Zoom" softtool tab allows you to define the displayed
zoom range numerically.
●
To zoom the stimulus range (keeping the number of sweep points constant), use
the "Zoom Stimulus" function in the "Stimulus" tab of the "Stimulus" softtool. The
latter can be opened using the keys in the STIMULUS section.
Refer to the R&S ZNC/ZND Help or User Manual for details.
The sweep range for all related channels is displayed in the channel info area at the
bottom of each diagram:
To change the sweep range of the active channel, use one of the following methods:
●
Use the [START], [STOP], [CENTER], and [SPAN] function keys from the STIMULUS section.
●
Double-tap (with a mouse: double-click) the "Start" or "Stop" label in the channel
list.
●
Tap and hold (with a mouse: right-click) the "Start" or "Stop" label in the channel list
and select "Start Frequency", "Stop Frequency", "Center Frequency", or "Frequency Span" from the context menu.
●
Select "Start Frequency", "Stop Frequency", "Center Frequency", "Span Frequency" from the "Channel" > "Stimulus" menu.
●
Use the "Set by Marker" functions (TRACE – [MARKER] > "Set by Marker"; see
Chapter 4.3.6.6, "Set by Marker", on page 56).
4.3.6.3 Reference Value and Position
The analyzer provides three parameters for changing the scale of the vertical
(response) axis:
●
Changing the "Ref Value" or "Ref Pos" shifts the trace in vertical direction and
adjusts the labels of the vertical axis. "Ref Value" also works for radial diagrams.
●
Changing the "Scale/Div" modifies the value of the vertical or radial diagram divisions and thus the entire range of response values displayed.
The "Scale/Div" and the "Ref Value" are indicated in the scale section of the trace info.
In the example below, a "Scale/Div" of 10 dB and a "Ref Value" of 0 dB is used.
55User Manual 1173.9557.02 ─ 37

R&S® ZNC/ZND
4.3.6.4 Auto Scale
Getting Started
Operating the Instrument
To change such a scale parameter, use one of the following methods:
●
Open the TRACE – [SCALE] > "Scale Values" softtool tab and proceed from there.
●
Tap and hold (with a mouse: right-click) the scale section in the trace info and
select a setting from the context menu.
●
Select a setting from the "Trace" > "Scale" menu.
●
Use "Set by Marker" functions (TRACE – [MARKER] > "Set by Marker"; see Chap-
ter 4.3.6.6, "Set by Marker", on page 56).
The "Auto Scale" function adjusts the scale divisions and the reference value so that
the entire trace fits into the diagram. To access "Auto Scale", use one of the following
methods:
●
Open the TRACE – [SCALE] > "Scale Values" softtool tab and select "Auto Scale
Trace" or "Auto Scale Diagram".
●
Tap and hold (with a mouse: right-click) the scale section in the trace info and
select "Auto Scale Trace" from the context menu.
●
Select "Auto Scale Trace" or "Auto Scale Diagram" from the "Trace" > "Scale"
menu.
4.3.6.5 Circular Diagrams
The radial scale of a circular diagram ("Polar", "Smith" or "Inverted Smith") can be
changed with a single linear parameter, the "Ref Value". The reference value defines
the radius of the outer circumference.
●
Increasing the "Ref Value" scales down the polar diagram.
●
Decreasing the "Ref Value" magnifies the polar diagram.
The "Ref Value" is indicated in the scale section of the trace info.
To change the "Ref Value" setting, use one of the following methods:
●
Locate it on the TRACE – [SCALE] > "Scale Values" softtool tab.
●
Tap and hold (with a mouse: right-click) the scale section in the trace info and
select the parameter from the context menu.
●
Select the parameter from the "Trace" > "Scale" menu.
●
Use the "Set by Marker" functions; see Chapter 4.3.6.6, "Set by Marker",
on page 56.
4.3.6.6 Set by Marker
The "Set by Marker" functions are a convenient tool for scaling (in particular: magnifying) diagrams without entering explicit numeric values. You simply place a marker to a
trace point and use the marker values to change the sweep range or move the trace
56User Manual 1173.9557.02 ─ 37

R&S® ZNC/ZND
Getting Started
Operating the Instrument
relative to the vertical axis. The touchscreen or a mouse makes it easier to activate
(touch/click) or move (drag and drop) markers.
To set the sweep range using markers, use one of the following methods.
Set "Start" and "Stop" values in the diagram:
1. Create two normal markers, e.g. the markers "Mkr 1" (default label "M1") and "Mkr
2" (default label "M2").
See Chapter 4.3.4.2, "Adding New Markers", on page 48.
2. Place "M1" to the start value of the desired sweep range and tap TRACE –
[MARKER] > "Set by Marker" > "Start = Marker".
3. Place "M2" to the stop value of the desired sweep range and tap TRACE –
[MARKER] > "Set by Marker" > "Stop = Marker".
Use a definite "Span:"
1. Create a marker.
2. Enable "Delta Mode" for this marker.
The analyzer automatically creates an additional reference marker.
3. Place the reference marker to the start value of the desired sweep range.
4. Set the value of the delta marker to the desired sweep range and tap TRACE –
[MARKER] > "Set by Marker" > "Span = Marker".
To move the trace in vertical direction, proceed as follows:
1. Create a normal marker, e.g. the marker "Mkr 1" (default label "M1").
2. Place "M1" to a particular trace point, e.g. use the "Marker Search" functions to
locate a maximum or minimum on the trace.
3. Select TRACE – [MARKER] > "Set by Marker" > "Max = Marker" to move the trace
towards the upper diagram edge, leaving the values of the vertical divisions
57User Manual 1173.9557.02 ─ 37

R&S® ZNC/ZND
4.3.6.7 Enlarging a Diagram
Getting Started
Performing Measurements
("Scale/Div") and the overall vertical scale unchanged. Analogously, select "Min =
Marker" to move the trace towards the lower diagram edge, or select "Ref Val =
Marker" to move the trace towards the "Ref Value".
You can also use marker values in the "Numeric Editor"; see Chapter 4.3.5.2, "Using
the Numeric Editor", on page 51.
The analyzer provides different tools for customizing the contents and size of the diagrams:
●
Double-tap/click a diagram to maximize it. Or equivalently, select SYSTEM – [DISPLAY] > "Diagram" > "Maximize".
If enabled the active diagram is always maximized.
●
The "Menu Bar", the "Status Bar", the "Hard Key Panel", and the "Title Bar" can be
hidden to gain space for the diagrams (SYSTEM – [DISPLAY] > "View Bar").
●
The SYSTEM – [DISPLAY] > "Config" softtool tab defines optional display elements
for the interior of the diagrams.
Use the context menu of the diagram, the SYSTEM – [DISPLAY] key or the "Display"
menu to access the display settings.
4.4 Performing Measurements
This chapter takes you through a sample session with a R&S ZNC/ZND network analyzer and describes basic operation tasks.
Safety considerations
Before starting any measurement on your network analyzer, please note the instructions given in Chapter 4.1, "Putting the Analyzer into Operation", on page 18.
Use the "S-Parameter Wizard" accessible via TRACE – [MEAS] > "S-Params" > "SParam Wizard..." to measure S-parameters in a straightforward way. The wizard provides a series of dialogs where you can select the test setup, screen configuration and
measurement parameters, configure the essential channel settings and perform a guided calibration.
Measurement stages in the wizard
The individual dialogs of the "S-Parameter Wizard" correspond to the typical stages of
any measurement:
1. Select the test setup.
58User Manual 1173.9557.02 ─ 37

R&S® ZNC/ZND
4.4.1 Transmission S-Parameter Measurement
Getting Started
Performing Measurements
2. Define port impedances.
3. Select the measurement parameters and the diagrams.
4. Define the sweep range.
5. Adjust the receiver and source settings (measurement bandwidth, source power).
6. Perform a calibration.
In a transmission measurement, the analyzer transmits a stimulus signal to the input
port of the device under test (DUT) and measures the transmitted wave at the DUT's
output port. The trace settings allow you to select the measured quantities and display
formats, depending on what you want to learn from the data. A minimum of two analyzer test ports are required for transmission measurements.
In the following example, the analyzer is set up for a two-port transmission measurement. A frequency sweep range is selected, the instrument is calibrated and the measurement result is analyzed using various display formats.
4.4.1.1 Connecting the Instrument for Transmission Measurements
To prepare a transmission measurement, you have to connect your DUT (which for
simplicity we assume to have appropriate connectors) in-between a pair of analyzer
test ports. It is recommended that you preset the R&S ZNC/ZND to start from a welldefined instrument state.
1. Connect the DUT between test ports 1 and 2 of the network analyzer as shown
above.
59User Manual 1173.9557.02 ─ 37

R&S® ZNC/ZND
Getting Started
Performing Measurements
2. Switch on the instrument and start the VNA application.
Proceed as described in Chapter 4.1.7, "Starting the Analyzer and Shutting Down",
on page 21.
3. Use the [PRESET] key to restore a well-defined instrument state.
The analyzer is now set to its default state. The default measured quantity is the
transmission S-parameter S21.
Select TRACE – [TRACE CONFIG] and use the control elements in the "Traces" softtool tab if you wish to create additional traces and diagrams.
4.4.1.2 Selecting the Sweep Range and Other Parameters
After a system preset the display shows a diagram with a dB magnitude scale, and the
S-parameter S21 is selected as a measured quantity. This S-parameter is the forward
transmission coefficient of the DUT. It is defined as the ratio of the transmitted wave at
the DUT's output port (port no. 2) to the incident wave at the DUT's input port (port no.
1).
The R&S ZNC/ZND automatically adjusts its internal source and receiver to the
selected measured quantities: For an S21 measurement, a stimulus signal (termed a1)
is transmitted at the analyzer port no. 1; the transmitted wave (termed b2) is measured
at port 2. The stimulus signal from the analyzer port no. 2 is not needed except for
some calibration types.
By default the sweep range is set to the frequency range of the analyzer, which can be
unsuitable for your DUT. The following procedure shows you how to configure a
smaller sweep range.
1. Select STIMULUS – [START] and set the "Start Frequency" to the lowest frequency you want to measure (e.g. 1.77 GHz). For convenient numeric entry, open
the "Numeric Editor" (see Chapter 4.3.5.2, "Using the Numeric Editor",
on page 51).
Tip: If you use the DATA ENTRY keys at the front panel for data entry, type [1][.][7]
[7] and terminate the entry with the [G/n] key.
Refer to Chapter 4.3.5, "Entering Data", on page 50 to learn more about entering
numeric values and characters.
2. In the "Stop Frequency" input field, enter the highest frequency you want to measure (e.g. 2.5 GHz).
60User Manual 1173.9557.02 ─ 37

R&S® ZNC/ZND
4.4.1.3 Calibrating the Instrument
Getting Started
Performing Measurements
3. Select TRACE – [SCALE] > "Scale Values" and activate the "Auto Scale Trace"
function. The analyzer adjusts the scale of the diagram to fit in the entire S21 trace,
leaving an appropriate display margin.
Tip: Refer to Chapter 4.3.6, "Scaling Diagrams", on page 53 to learn more about
the different methods and tools for diagram scaling.
Calibration (system error correction) is the process of eliminating systematic, reproducible errors from the measurement results. E.g., in the current test setup, the connecting cables between the analyzer ports and the DUT introduce an attenuation and a
phase shift of the waves. Both effects impair the accuracy of the S-parameter measurement.
The analyzer provides a wide range of sophisticated calibration methods for all types of
measurements. The calibration method to select depends on the expected system
errors, the accuracy requirements of the measurement, on the test setup and on the
types of calibration standards available.
The following example requires a calibration kit with a male Through standard with
known transmission characteristics for the related test port connector type and gender.
With a single Through, it is possible to perform a transmission normalization, compensating for a frequency-dependent attenuation and phase shift in the signal paths.
Due to the R&S ZNC/ZND's calibration wizard, calibration is a straightforward, guided
process.
1. Replace the DUT by the Through standard of your calibration kit.
2. Select CHANNEL – [CAL] > "Start... (Manual)" to open the "Calibration Setting"
wizard.
3. Select the port combination Port 1 (P1) and Port 2 (P2) and the calibration type
"Trans Norm". Make sure to define port 1 as the source port.
61User Manual 1173.9557.02 ─ 37

R&S® ZNC/ZND
Getting Started
Performing Measurements
Tip: For a unidirectional R&S ZND, only port 1 can be the source port. Hence cali-
brations that require both ports as driving port are not available.
4. Select "Next" to proceed to the next page of the "Calibration Setting" wizard.
5. Select the test port connector type and gender (here: N 50 Ω, female, corresponding to a male Through standard) and the calibration kit (here: R&S ZV-Z121), then
click "Start".
62User Manual 1173.9557.02 ─ 37
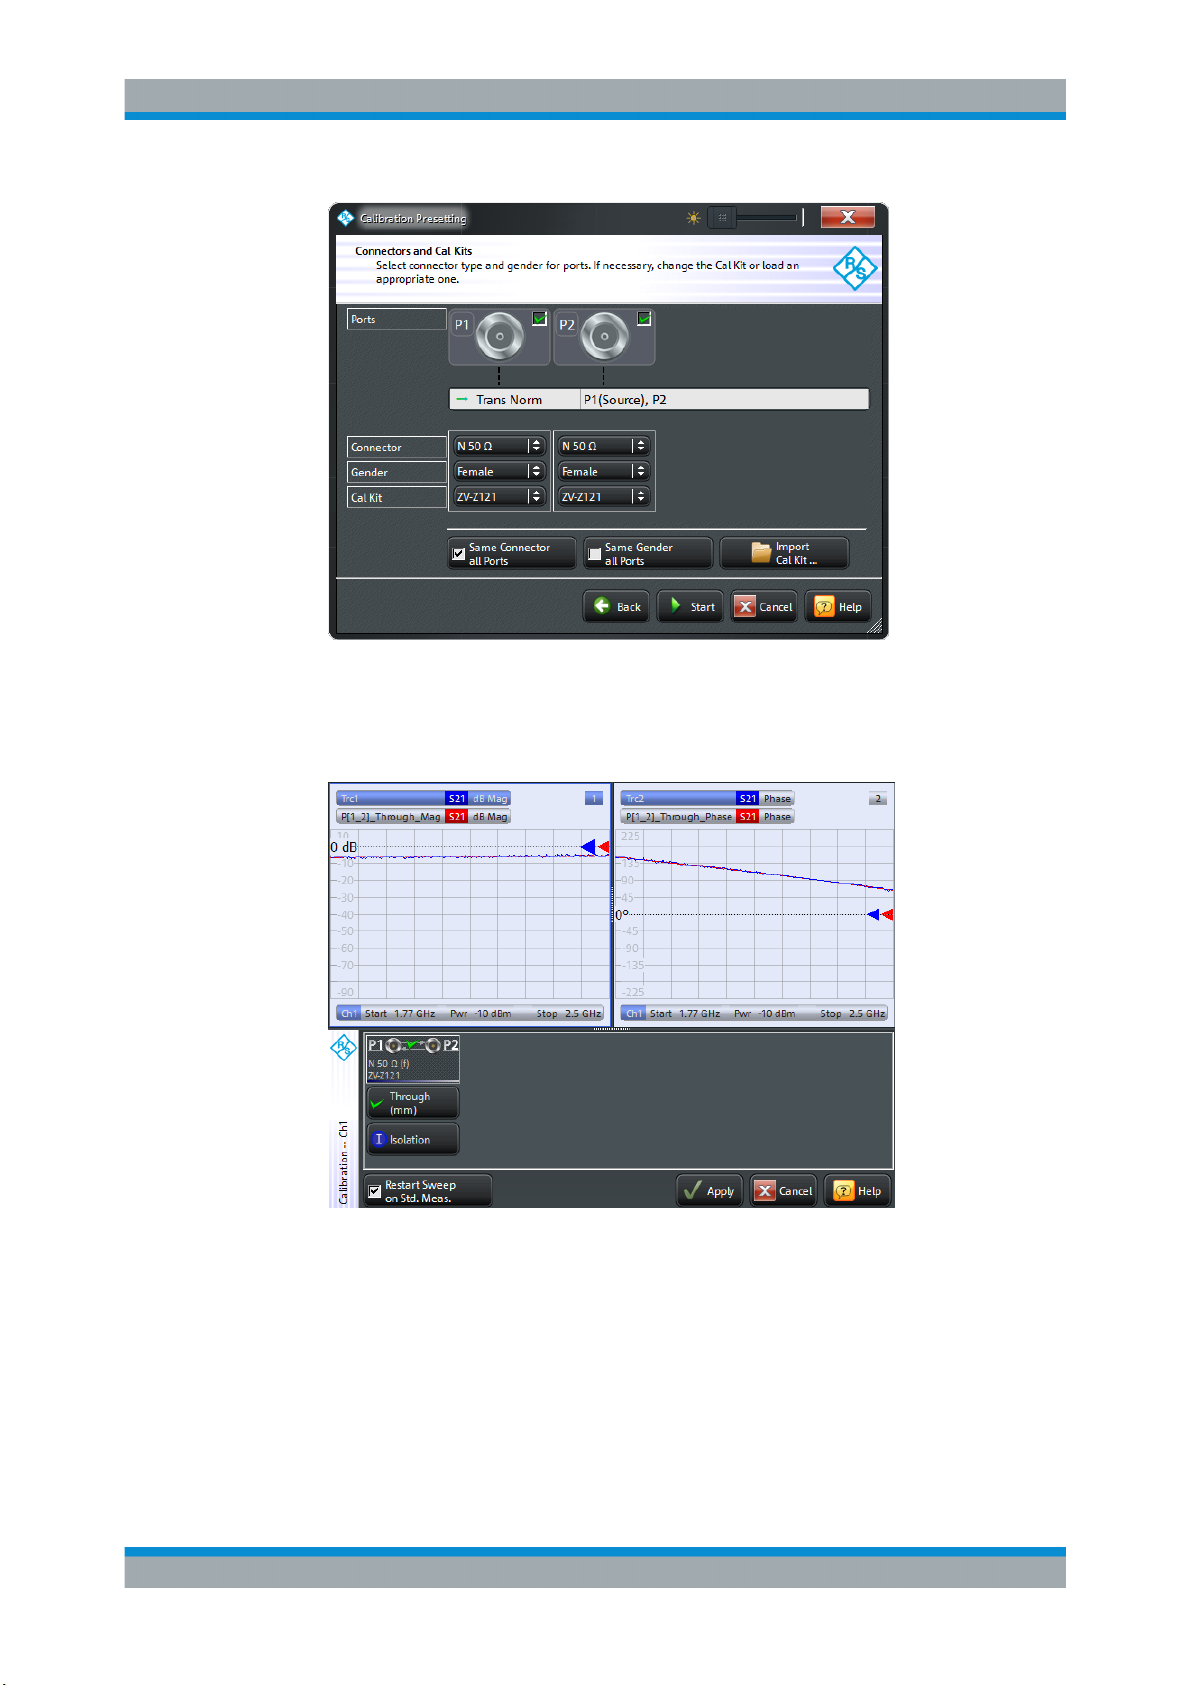
R&S® ZNC/ZND
Getting Started
Performing Measurements
6. The "Calibration" dock widget indicates the standard measurements that make up
a "Trans Norm" calibration.
Select "Through (mm)" to initiate the measurement of the connected Through standard. Measuring the isolation between ports 1 and 2 is optional. Skip it for now.
The analyzer performs a calibration sweep for the measured quantity S21. The
magnitude and phase of the result is displayed in two diagrams, together with the
expected typical result for a Through standard. The similarity of real and expected
traces indicates that the Through standard has been properly connected. After the
R&S ZNC/ZND has completed the calibration sweep and calculated the correction
data, the "Apply" button is enabled.
63User Manual 1173.9557.02 ─ 37

R&S® ZNC/ZND
4.4.1.4 Evaluating Data
Getting Started
Performing Measurements
7. Select "Apply" to close the wizard and apply the system error correction to the current channel.
A "Cal" label appears in the trace list.
To proceed with the measurement, remove the Through standard and connect the DUT
again.
The analyzer provides various tools to optimize the display and analyze the measurement data. For instance, you can use markers to determine maxima and minima on the
trace, and change the display format to obtain information about the group delay of the
transmitted wave.
1. Select TRACE – [MARKER] > "Markers" > "Mkr 1".
This places marker "M1" to its default position (center of the sweep range). A
marker symbol (triangle) appears on the trace, a marker info field in the upper right
corner of the diagram. The marker info field displays the stimulus value (frequency)
and response value (magnitude of the transmission coefficient converted to a dB
value) at the marker position.
2. Select TRACE – [MARKER], activate the "Marker Search" softtool tab and activate
"Min" search.
The marker jumps to the absolute minimum of the curve in the entire sweep range.
The marker info field shows the coordinates of the new marker position.
3. Select TRACE – [FORMAT] and choose the "Delay" of the transmission coefficient
as displayed quantity.
The group delay represents the propagation time of the wave through the DUT; it is
displayed in a Cartesian diagram. The marker info field shows the frequency and
group delay at the marker position.
64User Manual 1173.9557.02 ─ 37

R&S® ZNC/ZND
4.4.1.5 Saving and Printing Data
Getting Started
Performing Measurements
Refer to Chapter 5.2.3, "Trace Formats", on page 91 to learn more about the diagram
properties.
The analyzer provides standard functions for saving measurement settings and for
saving or printing the results. You can use these functions as if you were working on a
standard PC. Moreover you can export your trace data to an ASCII file and reuse it in a
later session or in an external application.
Data transfer is made easier if external accessories are connected to the analyzer or if
the instrument is integrated into a LAN. Refer to Chapter 4.1.9, "Connecting External
Accessories", on page 22, and Chapter 11.1.3, "Remote Operation in a LAN",
on page 972 to obtain information about the necessary steps.
1. Activate the SYSTEM – [FILE] > "Trace Data" softtool tab.
2. In the "Trace Data" softtool tab, select "Export" – "ASCII..." to open the "Export
Data - ASCII Files" dialog.
3. In the "Export Data - ASCII Files" dialog:
a) Select a file location ("Look in:").
b) Enter a file name ("File name:").
c) Select "Save".
The analyzer writes the data of the active trace to an ASCII file and closes the dialog.
4. Activate the "Print" softtool tab (SYSTEM – [FILE] > "Print") .
5. In the "Print" softtool tab, select "Print" to print the diagram area or "To Clipboard"
to copy it to the Windows clipboard.
6. Select SYSTEM – [FILE] > "Recall Sets" > "Save..." to open the "Save" dialog for
recall sets.
7. In the "Save" dialog:
a) Select a file location ("Look in:").
65User Manual 1173.9557.02 ─ 37

R&S® ZNC/ZND
4.4.2 Reflection S-Parameter Measurement
Getting Started
Performing Measurements
b) Enter a name for the recall set file ("File name:").
c) Select "Save".
The analyzer saves the active recall set, containing channel, stimulus and trace
settings, to a *.znx file. This recall set can be restored in a later session.
In a reflection measurement, the analyzer transmits a stimulus signal to the input port
of the device under test (DUT) and measures the reflected wave. Different trace formats allow you to express and display the results, depending on what you want to
learn from the data. Only one analyzer test port is required for reflection measurements.
In principle, a reflection measurement involves the same steps as a transmission measurement. Note the following differences:
●
The basic test setup for reflection measurements involves a single DUT and analyzer port. For instance, you can connect the input of your DUT to port 1 of the analyzer as shown below.
You can also use the basic transmission test setup, e.g. if you want to measure
reflection and transmission parameters in parallel.
●
The analyzer provides special calibration types for reflection measurements. Use
the calibration wizard and select an appropriate type.
A full 2-port calibration (TOSM, UOSM, TNA ...) corrects the system errors for all
transmission and reflection S-parameters.
●
Some of the trace formats are particularly suited for reflection measurements. For
instance, you can display the measured reflection coefficient S11 in a Smith chart to
obtain the complex input impedance at port 1.
66User Manual 1173.9557.02 ─ 37

R&S® ZNC/ZND
Getting Started
Performing Measurements
Proceed as described in Chapter 4.1.7, "Starting the Analyzer and Shutting Down",
on page 21 to shut down your analyzer.
67User Manual 1173.9557.02 ─ 37

R&S® ZNC/ZND
5 Concepts and Features
5.1 Basic Concepts
Concepts and Features
Basic Concepts
The following chapter provides an overview of the analyzer's capabilities and their use.
It contains a description of the basic concepts that the analyzer uses to organize, process and display measurement data. Also included are descriptions of the screen contents, possible measured quantities, calibration methods and typical test setups.
For a systematic explanation of all softtools, functions and parameters refer to Chap-
ter 6, "GUI Reference", on page 186.
The analyzer provides various functions to perform a particular measurement and to
customize and optimize the evaluation of results. To ensure that the instrument resources are easily accessible and that user-defined configurations can be conveniently
implemented, stored and reused, the instrument uses a hierarchy of structures:
●
Global resources can be used for all measurements, irrespective of the current
measurement session.
●
A recall set comprises a set of diagrams together with the underlying system, channel, trace and display settings. It can be saved to a recall set file and later recalled.
●
The diagrams show traces which are assigned to channels. See Chapter 5.1.3,
"Traces, Channels and Diagrams", on page 69.
5.1.1 Global (Persistent) Settings
The analyzer manages global settings that apply to all measurements, irrespective of
the current measurement setup. The following list contains examples of global settings:
●
Calibration kits
●
Connector types
68User Manual 1173.9557.02 ─ 37

R&S® ZNC/ZND
5.1.2 Recall Sets
Concepts and Features
Basic Concepts
●
Cal pool data including system error correction and power correction data
●
Directories for trace data, limit lines, calibration data etc.
●
Color schemes and printer settings
●
System configurations, to be accessed via SYSTEM – [SETUP].
●
External power meter configurations
Global settings are not part of a recall set nor are they affected by a [PRESET] of the
analyzer. Many of them can be "Reset" in the "System Config" dialog.
Some settings are session-specific, i.e. they are initialized to default when a new measurement session is started (session settings).
A recall set comprises a set of diagrams together with the underlying system, channel,
trace and display settings. The R&S ZNC/ZND can handle multiple recall sets in parallel, each of them displayed in a separate tab.
A recall set can be saved to a recall set file (*.znx) and reopened at a later point in
time or at another instrument. Use the "Recall Sets" tab of the SYSTEM – [FILE] softtool to organize recall sets.
A recall set only contains setup instructions, i.e. information on how to measure, how to
process the measurement results, and how to display the processed results. It does
not contain any trace or result data.
5.1.3 Traces, Channels and Diagrams
The analyzer arranges, displays or stores the measured data in traces which are
assigned to channels and displayed in diagrams. To understand the functions of the
instrument and quickly find the appropriate settings, it is important to understand the
exact meaning of the three terms.
●
A trace is a set of data points that can be displayed together in a diagram. The
trace settings specify the mathematical operations used to obtain traces from the
measured or stored data and to display them.
●
A channel contains hardware-related settings which specify how the network analyzer collects data.
●
A diagram is a rectangular portion of the screen which is used to display traces.
Diagrams belonging to the same recall set are arranged in a common tab. The settings for diagrams are described in Chapter 5.2.1, "Display Elements of a Dia-
gram", on page 77.
A diagram can contain a practically unlimited number of traces, assigned to different
channels. Diagrams and channels are independent from each other.
69User Manual 1173.9557.02 ─ 37

R&S® ZNC/ZND
Concepts and Features
Basic Concepts
5.1.3.1 Trace Settings
The trace settings specify the mathematical operations used to obtain traces from the
measured or stored data. They can be divided into several main groups:
●
Selection of the measured quantity (S-parameters, wave quantities, ratios, impedances,...)
●
Conversion into the appropriate display format and selection of the diagram type
●
Scaling of the diagram and selection of the traces associated to the same channel
●
Readout and search of particular values on the trace by means of markers
●
Limit check
The trace settings can be accessed via the keys in the TRACE section of the (virtual)
hardkey panel. They complement the Channel Settings accessible via the STIMULUS
and CHANNEL sections.
Each trace is assigned to a channel. The channel settings apply to all traces of the
channel.
5.1.3.2 Channel Settings
A channel contains hardware-related settings which specify how the network analyzer
collects data. The channel settings can be divided into three main groups:
●
Description of the test setup (power of the internal source, IF filter bandwidth, port
configuration, ...)
●
Control of the measurement process (sweep, trigger, averaging, ...)
●
Correction data (calibration, offset, ...)
The channel settings can be accessed via the STIMULUS and CHANNEL sections of
the (virtual) hardkey panel.
70User Manual 1173.9557.02 ─ 37

R&S® ZNC/ZND
5.1.3.3 Active and Inactive Traces and Channels
Concepts and Features
Basic Concepts
A window can display several diagrams simultaneously, each with a variable number of
traces. One of these traces is active at each time. The active trace is highlighted in the
trace list on top of the active diagram (Trc4 in the figure below):
When a trace is selected in the diagram area, it becomes the active trace. If a previously inactive area is selected as the active area, the trace that was active last time
when the area was active again becomes the active trace.
The active channel is the channel which belongs to the active trace. The channels of
all traces in a diagram are listed at the bottom of the diagram, together with the "Stimulus" values and the display colors of all traces. The active channel is highlighted.
Channels with no traces are not indicated in the diagrams but can be accessed via the
"Channel Manager" dialog.
In manual control, there is always exactly one active trace, irrespective of the number
of channels and traces defined. In remote control, each channel contains an active
trace.
See also Chapter 7.3, "Basic Remote Control Concepts", on page 478.
5.1.4 Sweep Control
A sweep is a series of consecutive measurements taken over a specified sequence of
stimulus values. It represents the basic measurement cycle of the analyzer.
The analyzer can perform sweeps at constant power but variable frequency (frequency
sweeps), sweeps at constant frequency but variable power (power sweeps), and
sweeps at constant power and frequency that are repeated in time (Time/CW Mode
sweeps). The sweeps are further specified by the number of measurement points and
the total measurement time.
By default sweeps are repeated continuously. Alternatively, a measurement can also
consist of a single sweep or of a specified number of sweeps.
71User Manual 1173.9557.02 ─ 37

R&S® ZNC/ZND
5.1.4.1 Partial Measurements and Driving Mode
Concepts and Features
Basic Concepts
After changing the channel settings or selecting another measured quantity, the analyzer needs some time to initialize the new sweep. This preparation period increases
with the number of points and the number of partial measurements involved. It indicated in the status bar:
All analyzer settings can still be changed during sweep initialization. If necessary, the
analyzer terminates the current initialization and starts a new preparation period.
During the first sweep after a change of the channel settings, the asterisk symbol in the
status bar remains yellow.
The asterisk turns grey after the first sweep has been completed.
Depending on the measurement task and the measured quantities, the measurement
at each sweep point can consist of one or several "partial measurements" with definite
hardware settings.
●
If a single S-parameter is measured (e.g. the reflection coefficient S11), the analyzer can operate at fixed hardware settings. In particular, a fixed source port and
receive port is used. Each sweep point requires a single partial measurement.
See also Chapter 5.3.1, "S-Parameters", on page 99.
●
For a complete two-port S-parameter measurement (e.g. S11, S21, S12, S22) the
analyzer needs to interchange the roles of the source and receive ports. Each
sweep point requires two partial measurements.
To improve the accuracy, it is possible to insert a delay time before each partial measurement.
To use port 2 of a R&S ZND as driving port, you need one of the "bidirectional measurements" options R&S ZND-K5 (for a R&S ZND without the "extended frequency
range" option R&S ZND-K1) or R&S ZND-K6 (for a R&S ZND with R&S ZND-K1).
In the default configuration, the R&S ZNC/ZND performs a partial measurement at all
sweep points (partial sweep) before the hardware settings are changed. The next partial measurement is carried out in an additional sweep ("Alternated" driving mode).
However, it is possible to reverse the order of partial measurements and sweeps
("Chopped" driving mode).
See CHANNEL – [CHANNEL CONFIG] > "Mode" > "Driving Mode".
Advantages of alternated and chopped driving mode
If the settling time between adjacent frequency points is smaller than the settling time
between the partial measurements (which is generally true), then the "Alternated" measurement is faster than a normal sweep so that smaller sweep times can be set. In
72User Manual 1173.9557.02 ─ 37

R&S® ZNC/ZND
Concepts and Features
Basic Concepts
contrast, an "Alternated" measurement provides a result only during the last partial
sweep.
Use the "Alternated" mode to increase the accuracy of measurements on DUTs with
long level settling times (e.g. quartzes, SAW filters). To measure DUTs with short settling times and obtain a trace from the beginning of the sweep, use "Chopped" mode.
In "Auto" mode, the analyzer optimizes the display update: Fast sweeps are performed
in "Alternated" mode, slower sweeps in "Chopped" mode.
As an alternative to activating the "Alternated" mode, it is possible to insert a measurement delay before each partial measurement and thus improve the accuracy.
See CHANNEL – [SWEEP] > "Sweep Params" > "Meas Delay".
However, the delay slows down the measurement.
Relation to trigger settings
In triggered measurements, "Alternated" has no effect if the triggered measurement
sequence is identical to a single sweep point. The following table shows how the analyzer performs a sweep comprising m sweep points, assuming that each of them
requires n partial measurements.
Triggered Meas.
Sequence
Sweep Trigger event starts n partial sweeps over
Sweep Segment Trigger event starts n partial sweeps over
Point All partial measurements of each sweep
Partial Measurement Each partial measurement is carried out
Alternate On Alternate Off
all sweep points.
the next segment.
point are carried out one after another.
for all sweep points.
5.1.4.2 R&S ZND: Unidirectional vs. Bidirectional Operation
To use port 2 of a R&S ZND as driving port, you need one of the "bidirectional measurements" options R&S ZND-K5 (for a R&S ZND without the "extended frequency
range" option R&S ZND-K1) or R&S ZND-K6 (for a R&S ZND with R&S ZND-K1).
Trigger event starts m complete
measurements at consecutive sweep
points.
Trigger event starts complete measurements at all consecutive sweep
points in the segment.
All partial measurements of each
sweep point are carried out one after
another.
All partial measurements of each
sweep point are carried out one after
another
73User Manual 1173.9557.02 ─ 37

R&S® ZNC/ZND
R&S ZND-K5
R&S ZND-K6
max frequency 4.5 GHz
unidirectional P1→P2
max frequency 4.5 GHz
bidirectional P1↔P2
max frequency 8.5 GHz
bidirectional P1↔P2
max frequency 8.5 GHz
unidirectional P1→P2
R&S
ZND-K1
R&S
ZND-K8
Concepts and Features
Basic Concepts
With unidirectional operation, the following restrictions apply:
●
S12, S22 and wave quantities of the reverse direction (port 2 as source) are not
available
●
Other (derived) results that require driving both ports, such as Y- and Z-parameters
or stability parameters, are not available
●
Balanced mode is not available
●
Calibrations that require driving both ports are not available (see Chapter 5.5.1,
"Calibration Types", on page 126)
●
Cal kit characterizations cannot be performed
●
Only automatic spur avoidance is possible (see "Image Suppr." on page 370)
5.1.4.3 Stimulus and Sweep Types
The function of the STIMULUS hardkeys [START], [STOP], [CENTER] and [SPAN]
depends on the sweep type.
Table 5-1: Function of STIMULUS keys
Sweep type [START](unit) [STOP] (unit) [CENTER] (unit) [SPAN] (unit)
"Lin Freq" "Start Frequency" (Hz) "Stop Frequency" (Hz) "Center Frequency"
(Hz)
"Log Freq" "Start Frequency" (Hz) "Stop Frequency" (Hz) – –
"Segmented" – – – –
"Power" "Start Power" (dBm) "Stop Power" (dBm) "CW Frequency" (Hz) "CW Frequency" (Hz)
"CW Mode" "CW Frequency" (Hz) "Number of Points" (-) "CW Frequency" (Hz) "CW Frequency" (Hz)
"Time" "CW Frequency" (Hz) "Stop Time" (s) "CW Frequency" (Hz) "CW Frequency" (Hz)
"Span Frequency" (Hz)
The ranges of numerical values must be compatible with the instrument model. The
conditions for the stimulus range depend on the sweep type:
●
"Lin Freq" / "Log Freq" / "Segmented"
The supported frequency range is listed in Table 8-13.
If the number of sweep points is greater than 1, the stop frequency must be greater
than the start frequency and the span must be ≥ 1 Hz. If a stop frequency smaller
than the current start frequency is set, then the start frequency is adjusted and vice
versa.
●
"Power"
74User Manual 1173.9557.02 ─ 37

R&S® ZNC/ZND
Concepts and Features
Basic Concepts
Start and stop power are both entered in absolute units (dBm). Start and stop
power must be different; the stop power must be larger than the start power. If a
stop power smaller than the start power is set, then the start power is adjusted
automatically and vice versa.
The power corresponds to the actual source power at the test ports (channel base
power Pb). After a port power calibration, this source power is available at the cali-
brated reference plane.
●
"CW Mode"
The stimulus hardkeys define the fixed stimulus frequency ("CW Frequency") and
the "Number of Points" of the measurement. The other sweep parameters (e.g. the
"Sweep Time") are set via CHANNEL – [SWEEP] > "Sweep Params".
●
"Time"
The stimulus hardkeys define the fixed stimulus frequency ("CW Frequency") and
the total sweep time ("Stop Time") of the measurement. The other sweep parameters (e.g. the "Number of Points") are set via CHANNEL – [SWEEP] > "Sweep Params".
The sweep time is entered in seconds and must be positive.
The selected sweep range applies to all source and receive ports of the analyzer.
5.1.5 Data Flow
The analyzer processes the raw measurement data in a sequence of stages to obtain
the displayed trace. The following diagram gives an overview.
The diagram consists of an upper and a lower part, corresponding to the data processing stages for the entire channel and for the individual traces. All stages in the diagram
are configurable. Note that the channel data flow for S-parameters (and quantities
derived from S-parameters such as impedances, admittances, stability factors) differs
from the channel data flow for wave quantities (and derived quantities such as ratios).
75User Manual 1173.9557.02 ─ 37
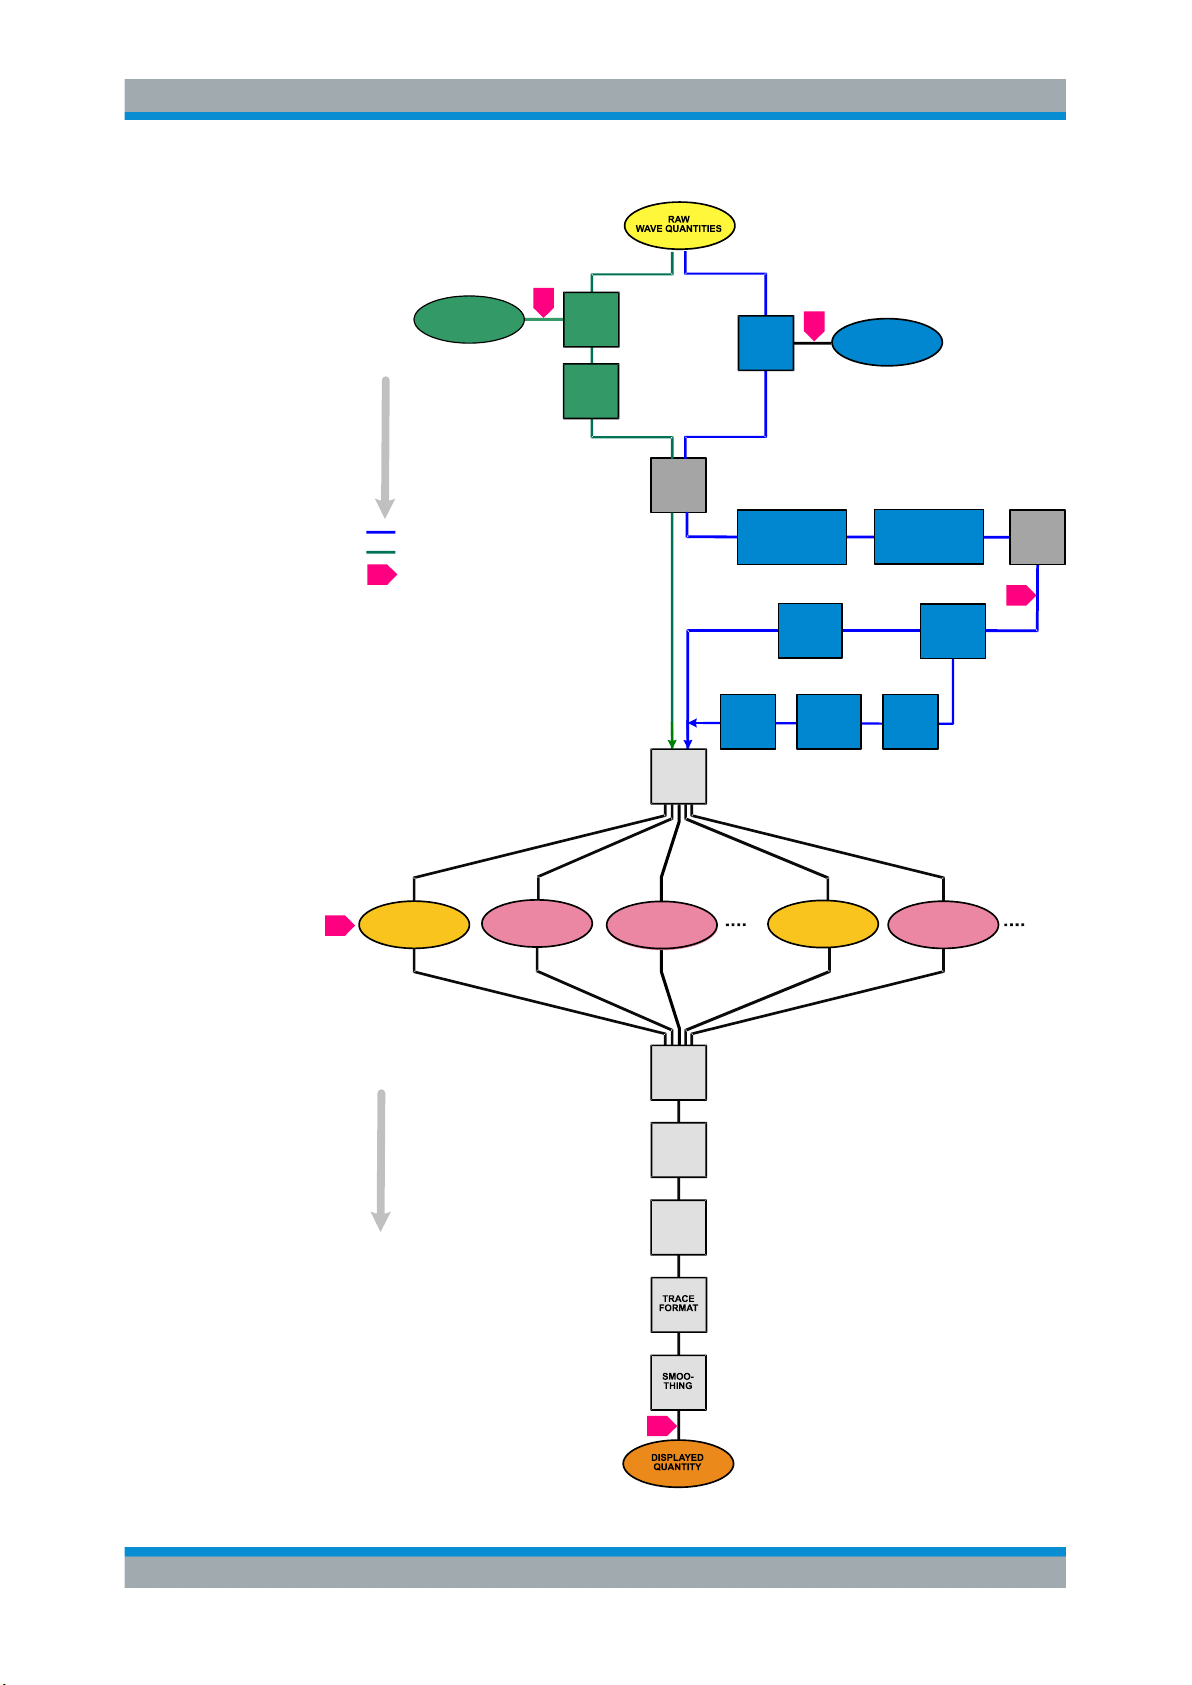
R&S® ZNC/ZND
POWER
POWER
CORRECTION DATA
CORR. DATA
Channel data flow
(for all traces of the channel)
5
POWER
CORR.
RATIOS
OFFSET
(ALT. 1)
SYSTEM
ERROR
CORR.
Concepts and Features
Basic Concepts
4
SYSTEM
ERROR CORR. DATA
S - parameters
Wave quantities, ratios
Data access points:
1 Export S-Matrix
2 Export/import complex data
3 Export formatted data
4, 5 apply cal pool data /
copy to cal pool
– S parameters (no conversion)
‡
– Z and S parameters
(n.a. for unidirectional R&S ZND)
– Converted impedances and admittances
– Stability factors
Before entering this block, converted
#
impedances and converted admittances
are re-converted to S-parameters and
converted back after the block
TRACE 1 TRACE 2
2
MEM
(TRACE 1)
AVERAGE
MEM 2
(TRACE 1)
MATH
DEEMBEDDING
Single Ended > Port Set >
Balanced > Ground Loop
IMBALANCE
‡
COMPLEX
CONV.
EMBEDDING
Differential
Match
EMBEDDING
Ground Loop > Balanced >
Port Set > Single Ended
IMPEDANCE
RENORMA-
LIZATION
MIXED
MODE
S-PARAM.
MEM
(TRACE 2)
OFFSET
(ALT. 2)
1
Trace data flow
(for individual traces)
Figure 5-1: Data Flow
SHIFT
RESPONSE
TIME
DOMAIN
GATE
3
#
76User Manual 1173.9557.02 ─ 37

R&S® ZNC/ZND
5.2 Screen Elements
5.2.1 Display Elements of a Diagram
Concepts and Features
Screen Elements
This section describes manual operation of the analyzer, including trace settings, markers and diagrams. For a description of the different quantities measured by the instrument, refer to Chapter 5.3, "Measurement Results", on page 99.
The central part of the screen is occupied by one or more diagrams.
A diagram is simply a rectangular portion of the screen used to display traces. Diagrams are independent of trace and channel settings. A diagram can contain a practically unlimited number of traces which can be assigned to different channels.
Most diagram settings are arranged in the "Display" softtool (hardkey SYSTEM – [DISPLAY]). To assign traces and channels to diagrams, use the control elements on the
"Trace Config" > "Traces" and "Channel Config" > "Channels" softtool tabs (hardkeys
TRACE – [TRACE CONFIG] and CHANNEL – [CHANNEL CONFIG]).
Diagrams can contain:
●
A title (optional)
●
The diagram number (or label)
●
Measurement results, in particular traces and marker values (optional)
●
An indication of the basic channel and trace settings
●
Context menus providing settings which are related to a particular display element
●
Error messages
The examples in this section have been taken from Cartesian diagrams. All other diagram types provide the same display elements.
77User Manual 1173.9557.02 ─ 37

R&S® ZNC/ZND
Concepts and Features
Screen Elements
5.2.1.1 Title
An optional title across the top of the diagram can be used for a brief description of the
diagram contents.
Select SYSTEM – [DISPLAY] > "Diagram" > "Title" to enter the diagram title and "Show
Title" to display or hide it.
5.2.1.2 Traces
A trace is a set of data points displayed together in the diagram. The individual data
points are connected so that each trace forms a continuous line.
The trace can be complemented by the following display elements, plotted with the
same color:
●
Reference value (for all traces): The reference value is indicated with a triangle at
the right edge of the diagram and a dashed, horizontal line. The value and position
78User Manual 1173.9557.02 ─ 37

R&S® ZNC/ZND
Concepts and Features
Screen Elements
of the triangle can be changed to modify the diagram scale and shift the trace vertically.
●
Measured quantity (for the active trace): The measured quantity is indicated in the
trace list; see "Trace List and Trace Settings" on page 79.
A trace can be either a data trace, a memory trace, or a mathematical trace; see
"Trace Types" on page 79.
Trace Types
The analyzer uses traces to display the current measurement result in a diagram. It is
also capable of storing traces to the memory, recalling stored traces, and defining
mathematical relations between different traces. There are three basic trace types:
●
Data traces show the current measurement data and are continuously updated as
the measurement goes on. Data traces are dynamic traces.
●
Memory traces are generated by storing the data trace to the memory. They represent the state of the data trace at the moment when it was stored. Memory traces
are static traces which can be stored to a file and recalled.
●
Mathematical traces are calculated according to a mathematical relation between
constants and the data or memory traces of the active recall set. A mathematical
trace that is based on the active data trace is dynamic.
It is possible to generate an unlimited number of memory traces from a data trace and
display them together. Markers and marker functions are available for all trace types.
The type of each trace in a diagram is indicated in the trace list: "MEM<no>" at the
beginning of the trace name indicates a memory trace (with default naming), "Math" at
the end of the trace label indicates a mathematical trace. You can also hide a trace
("Invisible") without deleting it.
Trace List and Trace Settings
The main properties of all traces assigned to the diagram are displayed in the trace list
in the upper part of the diagram.
Each line in the trace list describes a single trace. The active trace is highlighted
("Trc5" in the example above). The lines are divided into several sections with the following contents (from left to right):
●
The trace name appears in the first section. The default names for new traces are
Trc<n> with n automatically selected. A "Mem..." at the beginning of the trace
name indicates a memory trace (default naming). To change the trace names,
open the "Trace Manager" from any trace name segment's context menu.
79User Manual 1173.9557.02 ─ 37

R&S® ZNC/ZND
Concepts and Features
Screen Elements
●
The measured quantity (e.g. an S-parameter or a ratio) appears on a colored
background. The source port for wave quantities and ratios is indicated in brackets.
●
The format section shows how the measured data is presented in the graphical
display. Use the context menu of the format section to change the format of the
related trace.
●
The next sections show the value of the vertical or radial diagram divisions ("Scale
Div.") and the reference value ("Ref").
●
The channel section shows the channel that each trace is assigned to. It is omitted
if the all traces in the diagram are assigned to the same channel.
●
The type section indicates "Invisible" if a trace is hidden and "Math" if the trace is a
mathematical trace. "Gat" indicates that a time gate is active for the trace. Use the
"Mem Math" and "Traces" tabs of the "Trace Config" softtool to display and hide
data and memory traces, and to define mathematical traces.
●
The respective section's context menu (except for the type section) provides
access to the most common related tasks.
●
If the size of the diagram is too small, some of the sections are hidden. Enlarge or
maximize the diagram to display all sections.
Example:
The following context menu is assigned to the measured quantity section in the trace
list:
A label "Cal Off" appears at the end of the trace line if the system error correction no
longer applies to the trace.
80User Manual 1173.9557.02 ─ 37

R&S® ZNC/ZND
5.2.1.3 Markers
Concepts and Features
Screen Elements
Markers are tools for numerical readout of measured data and for selecting points on
the trace, or, in general, in the diagram area. A marker is displayed with a symbol (e.g.
a triangle, a crossbar or a line) on the trace, which can be a data trace or a memory
trace. At the same time, the coordinates are displayed in a marker info field or in a
table. Each marker can be defined as a normal marker (M), reference marker (R), or
delta marker (ΔM).
●
A normal marker ("M1, M2...") determines the coordinates of a measurement point
on the trace.
Up to 10 different normal markers can be assigned to a trace.
●
The reference marker ("R") defines the reference value for all delta markers.
●
A delta marker ("DeltaM1, DeltaM2...") indicates the coordinates relative to the reference marker.
A special set of markers M1 to M4 is provided for bandfilter search mode.
The most common tasks to be performed with markers can be achieved using the
"Marker" menu functions:
●
Determine the coordinates of a measurement point on the trace. In polar diagrams
where no x-axis is displayed, markers can be used to retrieve the stimulus value of
specific points.
●
Determine the difference between two trace points or the relative measurement
result ("Delta Mode").
●
Convert a complex measurement result into other formats.
Markers also play an important role in performing the following advanced tasks:
●
Change the sweep range and the diagram scale ("Marker Function").
●
Search for specific points on the trace ("Marker Search", "Target Search", "Bandfilter").
Activating and Moving Markers
To activate a marker, either select the marker symbol itself or the corresponding line in
the marker info field.
To move the active marker on the trace, use one of the following methods:
●
Drag the marker symbol to the desired position (Cartesian diagrams only).
●
Activate the "Markers" tab of the "Marker" softtool (TRACE – [MARKER]) and enter
the related stimulus value numerically.
●
Use the functions on the "Marker Search" softtool tab to move the marker to a specific position.
81User Manual 1173.9557.02 ─ 37

R&S® ZNC/ZND
Concepts and Features
Screen Elements
If the marker position is adjusted using the roll key, the mouse or the cursor keys, it
always remains within the sweep range. If set explicitly by entering a numeric value,
the marker position can be outside the sweep range. In this case, the marker symbol is
automatically positioned to the start or stop value of the sweep range, whichever is
closer.
Marker Info Field
The coordinates of all markers defined in a diagram can be displayed in the info field,
which by default is located in the upper right corner.
The info field contains the following information:
●
"M1, M2..." denote the marker numbers. Markers are displayed with the same color
as the associated trace.
●
The marker coordinates are expressed in one of the marker formats selected via
TRACE – [MARKER] > "Marker Props" > "Marker Format". The formats of the
markers assigned to a trace are independent of each other and of the trace format
settings.
●
The active marker has a dot placed in front of the marker line.
●
"R" denotes the reference marker. A "Δ" sign placed in front of the marker line indicates that the marker is in delta mode.
Open the context menu of the marker info field to access frequently used marker settings.
Customizing the marker info field
To change the position, appearance or contents of the marker info field, use one of the
following methods:
●
The info field can be moved to several positions in the upper and lower part of the
active diagram. Drag & drop it to the desired position.
●
To change the format of the active marker, select [TRACE] > "Marker" > "Marker
Properties" > "Marker Format".
82User Manual 1173.9557.02 ─ 37

R&S® ZNC/ZND
Concepts and Features
Screen Elements
●
To express the coordinates of the active marker relative to the reference marker,
activate the delta mode [TRACE] > "Marker" > "Marker Properties" > "Delta Mode".
Info Table
If you wish to reserve the full diagram space for traces, you can drag & drop the
marker info field to the info table.
The info table is hidden by default. To display it, open the "Display" softtool (SYSTEM –
[DISPLAY]), activate its "Config" tab and select "Info Table" – "Show".
Marker Format
Marker values can be formatted according to the current trace format, according to the
default marker format of the related trace (TRACE > [FORMAT] > "Format" > "Default
Marker Frmt" ), or formatted individually (TRACE > [MARKER] > "Marker Props" >
"Marker Format").
The available marker formats are defined for all measured quantities and trace formats
(see Chapter 5.2.3.3, "Measured Quantities and Trace Formats", on page 98).
Essentially, a marker format is simply a conversion between points on a complex-valued trace (the raw measurement data) and the respective target format. This must be
kept in mind when interpreting the results and physical units displayed.
The following table describes how a complex marker value z = x + jy is converted. It
makes use of the polar representation z = x + jy = |z| e
|z| = ( x2 + y2 )
Table 5-2: Marker formats
Marker Format Description Formula
Default
Lin Mag Magnitude of z, unconverted
dB Mag Magnitude of z in dB
Phase Phase of z φ (z) = arctan (y/x)
1/2
and φ(z) = arctan( y / x )
●
For an individual marker, this means that
the marker is formatted according to the
default marker format of the related trace.
●
For a trace's default marker format, this
means that the default format is (dynamically)
adjusted according to the selected trace format.
jφ(z)
, where
–
|z| = sqrt ( x2 + y2)
|z| = sqrt ( x2 + y2 ) dB Mag(z) =
20 * log|z| dB
Delay Group delay, neg. derivative of the phase
response
Real Real part of z Re(z) = x
Imag Imaginary part of z Im(z) = y
*)
– dφ(z) / dω, where ω denotes
the stimulus frequency
83User Manual 1173.9557.02 ─ 37

R&S® ZNC/ZND
Concepts and Features
Screen Elements
Marker Format Description Formula
SWR (Voltage) Standing Wave Ratio SWR = (1 + |z|) / (1 – |z|)
dB Mag Phase Magnitude of z in dB and phase in two lines 20 * log|z| dB arctan ( Im(z) /
Re(z) )
Lin Mag Phase Magnitude of z (unconverted) and phase in two
lines
Real Imag Real and imaginary part of z in two lines x y
R + j X Unnormalized resistance, reactance, and L or C in
three lines (Smith diagram)
G + j B Unnormalized conductance, susceptance, and L
or C in three lines (Inverted Smith diagram)
IMP Mag Impedance Magnitude (combined complex impe-
Index Index of the current sweep point –
*)
The delay aperture is defined in the TRACE > FORMAT softtool.
**)
An impedance Z is represented as Z = R + jX, the corresponding admittance as Y =
dance)
**)
|z| arctan ( Im(z) / Re(z) )
R
X
**)
L or C
G
B
**)
L or C
|Z| = (R2 + X2)
1/2
1/Z = G + jB. For X ≥ 0, we have an inductance L = X/ω, for X < 0 we have a capacitance C = 1/(ωX), where ω denotes the stimulus frequency.
Marker Coupling
It connects the markers of a set of traces.
Marker coupling allows you to compare different measurement results (assigned to different traces) at the same stimulus value. It connects the markers of all traces in the
active recall set that have the same stimulus variable as the active trace.
When marker coupling is enabled, the same markers are activated for all related
traces: if a marker was active for some related trace, then it is activated for all related
traces.
While marker coupling is active, the marker sets of the related traces are always kept
in sync, i.e.:
●
If a marker is added to (removed from) one of the related traces, it is also added to
(removed from) the other related traces.
●
If a marker is moved to a particular stimulus value for one of the related traces,
then it is moved to this stimulus value for all related traces.
If the new stimulus value is outside a trace's sweep range, the marker value is
invalid for this trace. The corresponding info field only displays the stimulus value.
84User Manual 1173.9557.02 ─ 37

R&S® ZNC/ZND
Concepts and Features
Screen Elements
Basic Marker Search Functions
The search functions are tools for searching measurement data according to specific
criteria. A search consists of analyzing the measurement points of the current trace (or
of a user-defined subrange termed the "Search Range") to find one of the following:
●
Absolute or relative (local) maxima and minima (peak search).
●
Trace points with a specific response value (target search).
●
Trace segments with a shape that is characteristic for bandpass or bandstop filters
(bandfilter search); see "Bandfilter Search" on page 85.
When the search is activated, the active marker is moved to the (next) point that meets
the search criteria. If the trace contains no markers, a marker M1 is created and used
for the search. The search result is displayed in the marker info field. If no search result
can be found, the marker remains at its original position.
Some search functions can be activated repeatedly to find all possible search results.
Moreover the analyzer provides a "Tracking" mode where the search is repeated after
each sweep.
Multiple Peak Search
Multiple peak search allows you to find multiple local minima/maxima at once. Markers
1 to 10 are assigned to the peaks detected from the start frequency towards the stop
frequency. Multiple peak search uses its own search and tracking settings; search and
tracking settings for standard marker search are ignored.
Bandfilter Search
In a bandfilter search, the R&S ZNC/ZND locates trace segments with a bandpass or
bandstop shape and determines characteristic filter parameters.
Bandpass and bandstop regions can be described with the same parameter set:
●
A bandpass region contains a local maximum around which the magnitude of the
trace falls off by more than a specified value.
●
A bandstop region contains a local minimum around which the magnitude of the
trace increases by more than a specified value.
The analyzer locates bandpass and bandstop regions and determines their position
("Center" frequency) and shape ("Bandwidth", "Lower Edge" and "Upper Edge", quality
factor. For a meaningful definition of the bandwidth factor, the trace format must be "dB
Mag" .
The info field contains the following search results:
●
"Bandwidth" is the n-dB bandwidth of the bandpass/bandstop region, where n is a
selectable bandwidth factor. The bandwidth is equal to the difference between the
lower and the upper band edge frequency.
85User Manual 1173.9557.02 ─ 37
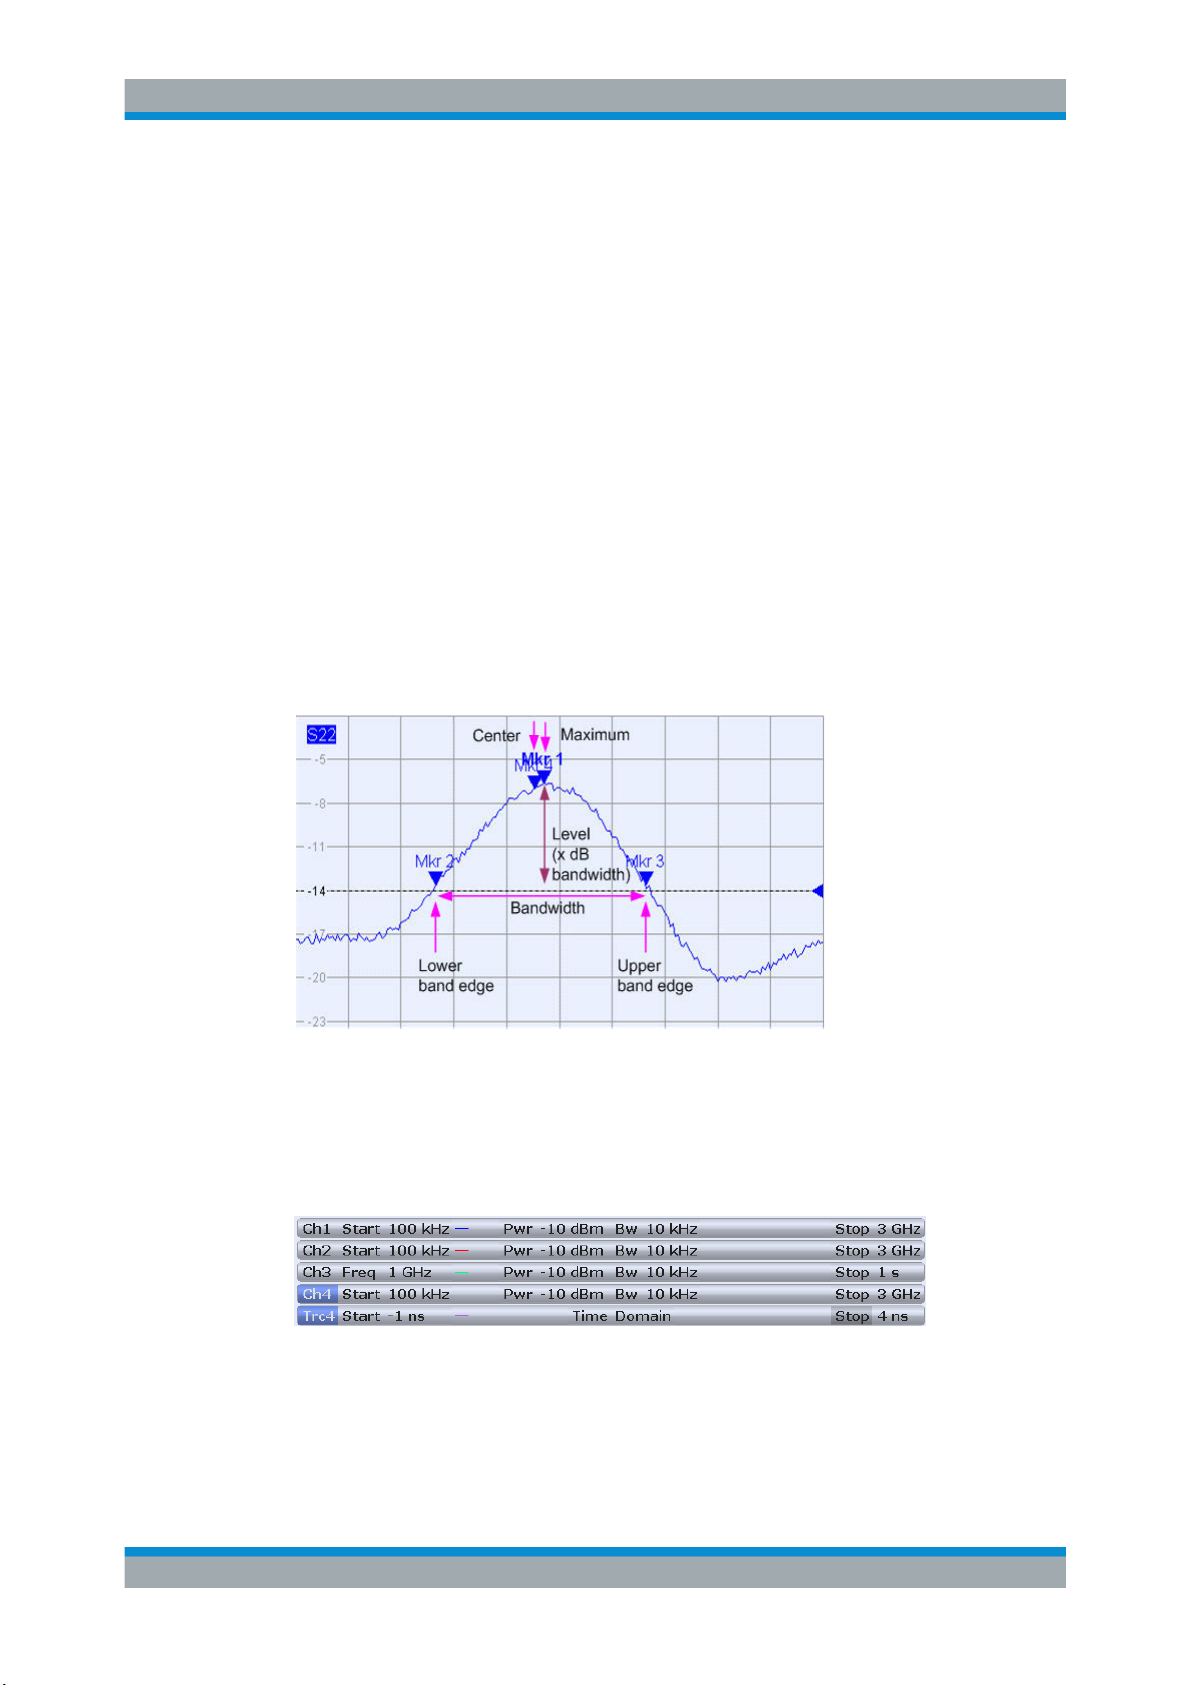
R&S® ZNC/ZND
Concepts and Features
Screen Elements
●
"Center" is calculated as the geometric or arithmetic mean of the lower band edge
frequency f
f
= sqrt (f
Center
f
= 1/2 (f
Center
and the upper band edge frequency f
LBE
* f
LBE
LBE
) (geometric mean) or
UBE
+ f
) (arithmetic mean)
UBE
UBE
:
The arithmetic mean is always higher than the geometric mean. The values are
close if the bandwidth is small compared to the geometric mean of the band edges.
●
"Lower Edge" is the closest frequency below the maximum (or minimum), where
the trace value is equal to the maximum (minimum) value minus (plus) n dB.
●
"Upper Edge" is the closest frequency above the maximum (or minimum), where
the trace value is equal to the maximum (minimum) value minus (plus) n dB.
●
The "Quality Factor (3 dB)" is the ratio between the "Center" frequency and the 3dB "Bandwidth"; it does not depend on the selected bandwidth factor.
●
The "Quality Factor (BW)" is the ratio between the "Center" frequency and the
"Bandwidth" displayed above. This result is available only if the selected bandwidth
factor is different from 3 dB.
●
"Loss" is the loss of the filter at its center frequency and is equal to the response
value of marker no. 4. For an ideal bandpass filter, the loss is zero (0 dB), for an
ideal bandstop filter it is –∞ dB.
5.2.1.4 Channel List and Channel Settings
The main properties of all channels assigned to the traces in the diagram are displayed
in the channel list below the diagram.
Each line in the channel list describes a single channel. The channel of the active trace
is highlighted. The lines are divided into several sections with the following contents
(from left to right):
●
The "Channel Name" appears in the first section. The default names for new channels are Ch<n> with an automatically assigned number <n>. If a time domain
86User Manual 1173.9557.02 ─ 37

R&S® ZNC/ZND
Concepts and Features
Screen Elements
transform is active, the R&S ZNC/ZND displays an additional line to indicate the
stimulus range of the displayed time-domain trace.
Open the "Channel Manager" from the name segment's context menu to change
the channel name.
●
Start indicates the lowest value of the sweep variable (e.g. the lowest frequency
measured), corresponding to the left edge of a Cartesian diagram.
●
The color legend shows the display color of all traces assigned to the channel.
The colors are different, so the number of colors is equal to the numbers of traces
assigned to the channel.
●
The values behind the color legend show the constant stimulus value, which is
either the power of the internal signal source (for frequency sweeps and time
sweeps) or the CW frequency (for power sweeps), and the measurement bandwidth ("BW").
●
Stop indicates the highest value of the sweep variable (e.g. the highest frequency
measured), corresponding to the right edge of a Cartesian diagram.
Open a segment's context menu to access common related tasks.
Example:
The following context menu is assigned to the channel name section:
The settings in the context menus correspond to the most common functions in the
CHANNEL – [CHANNEL CONFIG] > "Channels" softtool tab, the "Stimulus" softtool
(opened via STIMULUS hardkeys), the CHANNEL – [SWEEP] > "Sweep Params" softtool tab, and the CHANNEL – [PWR BW AVG] softtool.
5.2.1.5 Context Menus
To provide access to the most common tasks and speed up the operation, the analyzer
offers context menus (right-click menus) for the following display elements:
●
Diagram
●
Marker info field
●
Trace list (separate context menus for trace name section, measured quantity section, format section, scale section, and channel section)
●
Channel list (separate context menus for channel name section, sweep range section, additional parameter section)
To open a context menu associated with a display element, tap and hold the element
for some seconds. Right-click the display element if you are using a mouse.
87User Manual 1173.9557.02 ─ 37

R&S® ZNC/ZND
5.2.2 Dialogs
Concepts and Features
Screen Elements
Example:
The following context menu is assigned to the channel name section in the channel list:
The functions of the context menu can also be called using the menu bar or the related
softtool panels. Use whatever method is most convenient.
Dialogs provide groups of related settings and allow to make selections and enter data
in an organized way. All softkeys with three dots behind their labeling (as in "Balanced
Ports...") call up a dialog. The dialogs of the analyzer have an analogous structure and
several common control elements.
Dialogs are controlled in the usual way. For an introduction, refer to Chapter 4.3.3,
"Working with Dialogs", on page 45.
5.2.2.1 Immediate vs. Confirmed Settings
In some dialogs settings take effect immediately, so that the effect on the measurement
is observable while the dialog is still open. This behavior is particularly useful when a
numeric value is incremented or decremented, or when display elements are added or
removed.
88User Manual 1173.9557.02 ─ 37

R&S® ZNC/ZND
Concepts and Features
Screen Elements
In most dialogs, however, it is possible to cancel an erroneous input before it takes
effect. The settings in such dialogs must be confirmed explicitly.
The two types of dialogs are easy to distinguish:
●
Dialogs with immediate settings provide a "Close" button but no "OK" button.
Example: "Trace Manager" dialog
●
Dialogs with confirmed settings provide both an "OK" button and a "Cancel" button.
Example: "Balanced Ports" dialog
Immediate settings can be undone using [UNDO].
5.2.2.2 Common Dialogs
Open Dialog
The "Open File" dialog is used to open various file types (cal kit data, limit lines, sweep
segment lists, ...).
Depending on the context, the dialog is displayed with different caption, default directory ("Traces" in the above screenshot), and file type filters. Context-specific options
("Import Data to New Mem" in the above screenshot) are accessible via controls in the
section below the "Windows Explorer" button.
●
"Look in:" specifies the directory to be listed. The icons to the right of the pull-down
list are provided for easy navigation in the file system (place the cursor on the
icons to obtain "Whats this" help).
89User Manual 1173.9557.02 ─ 37

R&S® ZNC/ZND
Concepts and Features
Screen Elements
●
"Windows Explorer" opens the selected directory in the Windows Explorer.
●
"File name" specifies a filename to save the current data. The analyzer adds the
extension in the "Files of type" field.
●
"Files of type" filters the displayed files by type.
●
"Open" opens selected file and closes the dialog.
●
"Cancel" closes the dialog without opening a file.
Tip: Dialog properties (e.g. the current directory) are remembered when the dialog is
closed. To restore default directories, select "Use Default Directories" in the Presets
Tab of the "System Config" dialog.
Save Dialog
The "Save" dialog is used to store various data types (e.g. cal kit data, limit lines,
sweep segment lists, ...).
Depending on the context, the dialog is displayed with different caption, default directory ("RecallSets" in the above screenshot), and file types. Context-specific options (if
any) are accessible via controls in the section below the "Ask Before Overwriting" toggle button.
●
"Look in" specifies the drive and directory in which the data is stored. The icons to
the right of the pull-down list are provided for easy navigation in the file system
(place the cursor on the icons to obtain "Whats this" help).
●
"File name" specifies a filename to save the current data. The analyzer adds the
extension in the "Files of type" field.
●
"Files of type" selects a particular file type for the created file.
●
"Save" saves the data in the selected file and directory and closes the dialog.
●
"Cancel" closes the dialog without saving the data.
●
"Windows Explorer" opens the selected directory in Windows Explorer.
●
If "Ask Before Overwriting" is enabled, overwriting an existing file has to be confirmed.
Tip: Dialog properties (e.g. the current directory) are remembered when the dialog is
closed. To restore default directories, select "Use Default Directories" in the Presets
Tab of the "System Config" dialog.
90User Manual 1173.9557.02 ─ 37

R&S® ZNC/ZND
5.2.3 Trace Formats
5.2.3.1 Cartesian Trace Formats
Concepts and Features
Screen Elements
A trace format defines how a trace is represented in a diagram.
The R&S ZNC/ZND supports the following trace formats:
●
Cartesian Trace Formats "dB Mag" , "Phase" , "SWR" , "Unwr Phase" , "Lin Mag" ,
"Log Mag" , "Real" , "Imag" and "Delay" .
●
Complex trace formats "Polar" , "Smith" and "Inv Smith"
The VNA firmware allows arbitrary combinations of trace formats and measured quantities. However, to extract useful information from the measured data, it is important to
select a trace format which is appropriate for the analysis of a particular measured
quantity; see Chapter 5.2.3.3, "Measured Quantities and Trace Formats",
on page 98.
Cartesian trace formats assign a scalar response to the stimulus value (frequency,
power, or time). The response can be calculated from the measured quantity at the
related stimulus value, but it can also be the result of some mathematical transformation of the original (unformatted) trace.
Diagram Representation
When a Cartesian trace is assigned to a diagram, the stimulus variable appears on the
horizontal axis (x-axis), the response values appear on the vertical axis (y-axis).
Graph Scaling
●
The y-axis scale is always linear (although the y-axis values can be obtained from
the measured data by non-linear conversions).
●
The x-axis scaling depends on the sweep type of the channel to which the trace is
assigned:
– For sweep types "Lin Freq", "Power", "CW Mode" and "Time" it is scaled line-
arly.
– For sweep type "Log Freq", it is scaled logarithmically.
The resulting linear or lin-log grid is plotted with the formatted trace.
The following examples show "dB Mag" Cartesian traces for the same measured quantity and sweep range, but with "Lin Freq" and "Log Freq" sweep types.
91User Manual 1173.9557.02 ─ 37
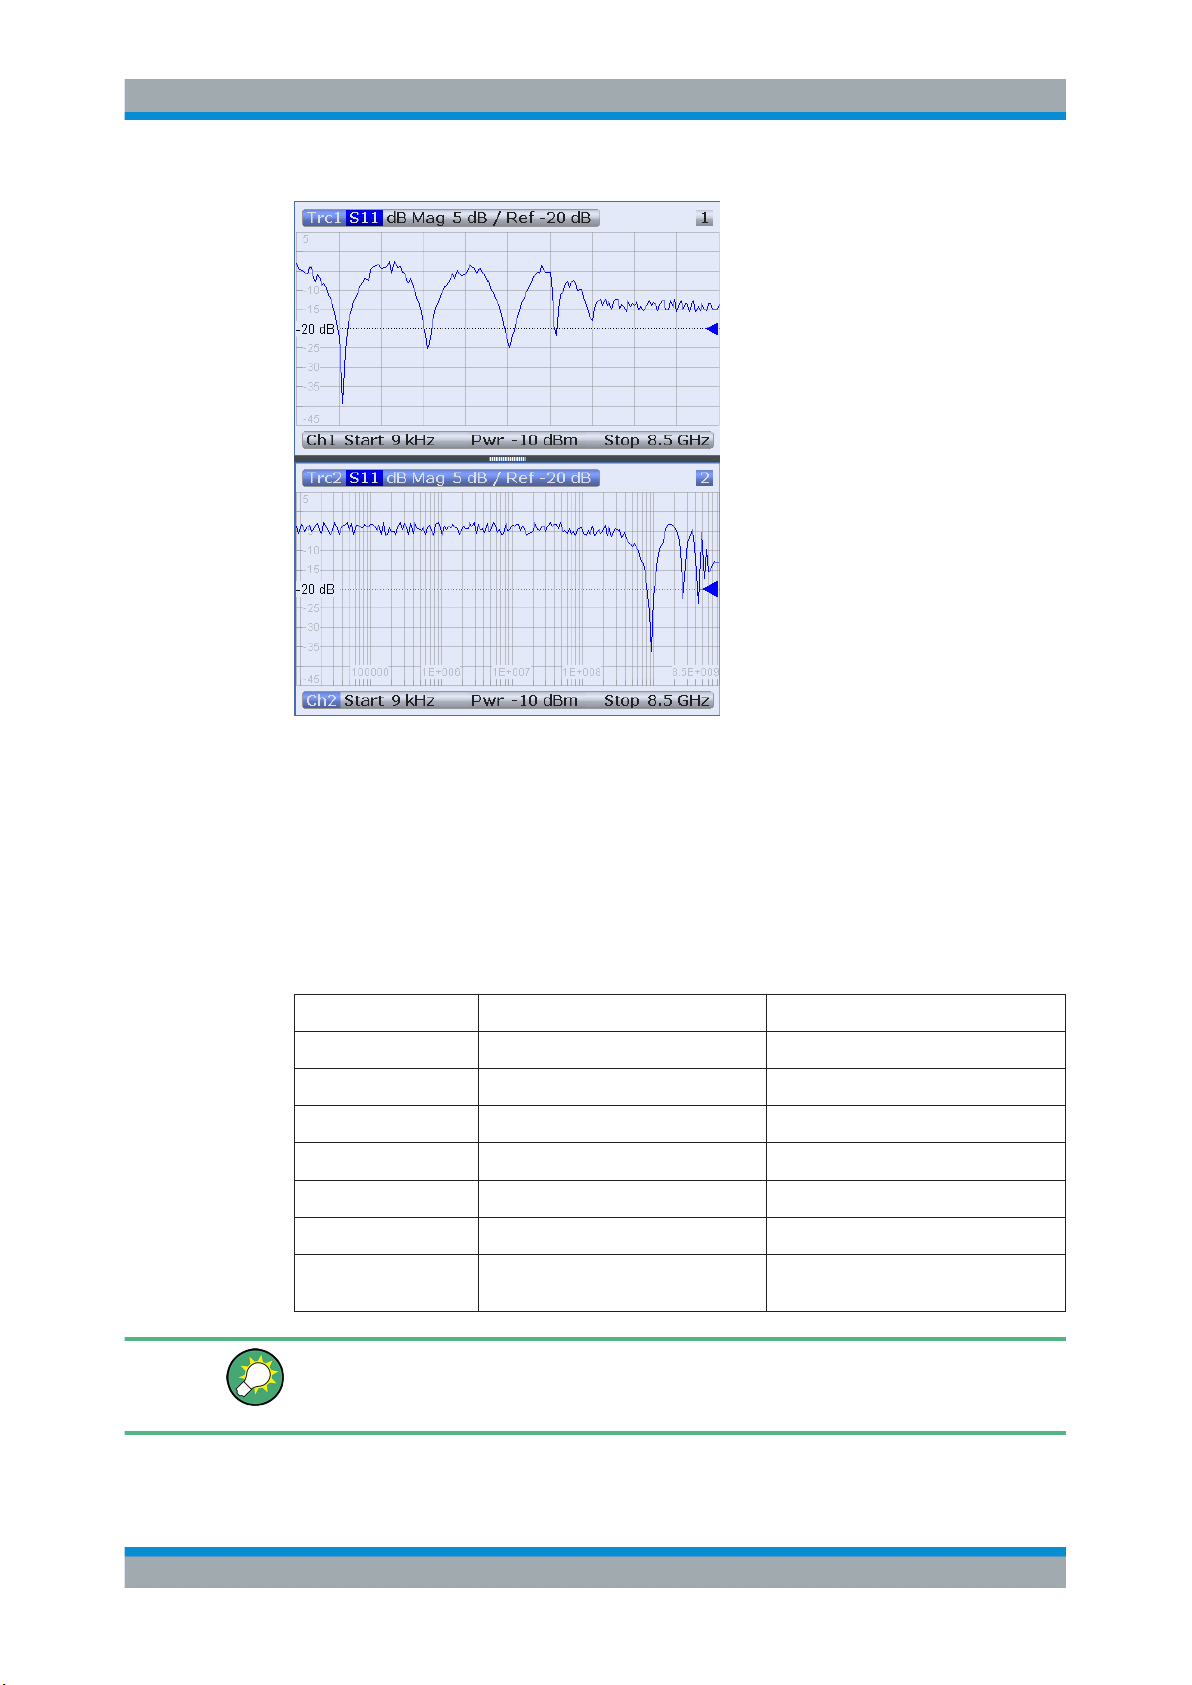
R&S® ZNC/ZND
Concepts and Features
Screen Elements
Figure 5-2: S11 trace in dB Mag format: sweep type Lin Freq (top) and Log Freq (bottom)
Conversion of Complex to Real Quantities
Among the measured quantities the R&S ZNC/ZND supports, only "Stability" factors
and "Power Sensor" results are real. All other measured quantities are complex.
The following table shows how "real" response values are calculated from complex
measurement values z = x + j y (where x, y, z are functions of the sweep variable). The
formulas also hold for real measurement values (y = 0).
Trace Format Description Formula
"dB Mag" Magnitude of z in dB dB Mag(z) = 20 * log|z| dB
"Phase" Phase of z φ (z) = arctan (y/x)
"SWR" (Voltage) Standing Wave Ratio SWR = (1 + |z|) / (1 – |z|)
"Lin Mag" Magnitude of z, unconverted
"Real" Real part of z Re(z) = x
"Imag" Imaginary part of z Im(z) = y
"Delay" Group delay, neg. derivative of the
phase response
|z| = sqrt ( x2 + y2 )
– d φ (z) / dΩ (Ω = 2π * f)
An extended range of formats and conversion formulas is available for markers. To
convert any point on a trace, create a marker and select the appropriate marker format.
Marker and trace formats can be selected independently.
92User Manual 1173.9557.02 ─ 37

R&S® ZNC/ZND
5.2.3.2 Complex Trace Formats
Concepts and Features
Screen Elements
Complex trace formats assign a complex response to the stimulus value (frequency,
power, or time).
In diagrams, the response values are always represented as points in the two-dimensional complex plane:
●
The complex 0 is located at the center of the diagram.
●
The real part is drawn in horizontal direction, the imaginary part in vertical direction.
Result values for consecutive stimulus values are interconnected by straight lines, so
the trace is represented as a polygonal chain in the complex plane.
The stimulus axis is not visible. However, the stimulus value for a given trace point can
be displayed using a marker.
The difference between the different complex trace formats (Polar ,Smith and Inv
Smith ) is the coordinate system that is used for the representation of the response val-
ues and that is graphically overlaid to the formatted trace.
Polar
For "Polar" traces the complex response values are represented in polar coordinates:
magnitude and phase.
In a diagram the grid lines overlaid to the trace correspond to points of equal magnitude and phase:
●
Points with equal magnitude are located on circles around the complex 0 that is
located at the center of the diagram.
●
Points with the equal phase are located on straight lines originating at the center.
The following example shows a polar diagram with a marker used to display a pair of
stimulus and response values.
Example: Reflection coefficients in polar diagrams
If the measured quantity is a complex reflection coefficient (S11, S22 etc.), then the center of the polar diagram corresponds to a perfect load Z0 at the input test port of the
DUT (no reflection, matched input). The outer circumference (|Sii| = 1) represents a
totally reflected signal.
93User Manual 1173.9557.02 ─ 37

R&S® ZNC/ZND
Concepts and Features
Screen Elements
Examples for definite magnitudes and phase angles:
●
The magnitude of the reflection coefficient of an open circuit (Z = infinity, I = 0) is
one, its phase is zero.
●
The magnitude of the reflection coefficient of a short circuit (Z = 0, U = 0) is one, its
phase is –180 deg.
Smith
For "Smith" traces the response values are interpreted as reflection coefficients Sii and
represented in terms of their corresponding complex impedance Z(Sii) = R(Sii) + j X(Sii).
In a diagram, the grid lines overlaid to a "Smith" trace correspond to points of equal
resistance R and reactance X:
●
Points with the same resistance are located on circles.
●
Points with the same reactance produce arcs.
The following example shows a Smith chart with a marker used to display the stimulus
value, the complex impedance Z = R + j X and the equivalent inductance L.
Smith chart construction
In a Smith chart, the impedance plane is reshaped so that the area with positive resistance is mapped into a unit circle.
94User Manual 1173.9557.02 ─ 37

R&S® ZNC/ZND
,
)Im()Re(1
)Im()Re(1
)/Re(
2
2
22
0
ZZR
2
2
0
)Im()Re(1
)Im(2
)/Im(
ZZX
Concepts and Features
Screen Elements
The basic properties of the Smith chart follow from this construction:
●
The central horizontal axis corresponds to zero reactance (real impedance). The
center of the diagram represents Z/Z0 = 1 which is the reference impedance of the
system (zero reflection). At the left and right intersection points between the horizontal axis and the outer circle, the impedance is zero (short) and infinity (open).
●
The outer circle corresponds to zero resistance (purely imaginary impedance).
Points outside the outer circle indicate an active component.
●
The upper and lower half of the diagram correspond to positive (inductive) and
negative (capacitive) reactive components of the impedance, respectively.
Example: Reflection coefficients in the Smith chart
If the measured quantity is a complex reflection coefficient Γ (e.g. S11, S22), then the
unit Smith chart can be used to read the normalized impedance of the DUT. The coor-
dinates in the normalized impedance plane and in the reflection coefficient plane are
related as follows (see also: definition of matched-circuit (converted) impedances):
Z / Z0 = (1 + Γ) / (1 – Γ)
From this equation, it is easy to relate the real and imaginary components of the complex resistance to the real and imaginary parts of Γ:
According to the two equations above, the graphical representation in a Smith chart
has the following properties:
●
Real reflection coefficients are mapped to real impedances (resistances).
95User Manual 1173.9557.02 ─ 37

R&S® ZNC/ZND
Concepts and Features
Screen Elements
●
The center of the Γ plane (Γ = 0) is mapped to the reference impedance Z0,
whereas the circle with |Γ| = 1 is mapped to the imaginary axis of the Z plane.
●
The circles for the points of equal resistance are centered on the real axis and
intersect at Z = infinity. The arcs for the points of equal reactance also belong to
circles intersecting at Z = infinity (open circuit point (1, 0)), centered on a straight
vertical line.
Examples for special points in the Smith chart:
●
The magnitude of the reflection coefficient of an open circuit (Z = infinity, I = 0) is
one, its phase is zero.
●
The magnitude of the reflection coefficient of a short circuit (Z = 0, U = 0) is one, its
phase is –180 deg.
Inv Smith
For "Inv Smith" formatted traces, the response values are interpreted as complex
reflection coefficients Sii and represented in terms of their corresponding complex
admittance Y(Sii) = G(Sii) + j B(Sii).
In a diagram, the grid lines overlaid to a "Smith" trace correspond to points of equal
conductance G and susceptance B:
●
Points with the same conductance are located on circles.
●
Points with the same susceptance produce arcs.
The following example shows an inverted Smith chart with a marker used to display the
stimulus value, the complex admittance Y = G + j B and the equivalent inductance L.
96User Manual 1173.9557.02 ─ 37

R&S® ZNC/ZND
2
2
22
0
)Im()Re(1
)Im()Re(1
)/Re(
YYG
,
)Im()Re(1
)Im(2
)/Im(
2
2
0
YYB
Concepts and Features
Screen Elements
Inverted Smith chart construction
The inverted Smith chart is point-symmetric to the Smith chart:
The basic properties of the inverted Smith chart follow from this construction:
●
The central horizontal axis corresponds to zero susceptance (real admittance). The
center of the diagram represents Y/Y0 = 1, where Y0 is the reference admittance of
the system (zero reflection). At the left and right intersection points between the
horizontal axis and the outer circle, the admittance is infinity (short) and zero
(open).
●
The outer circle corresponds to zero conductance (purely imaginary admittance).
Points outside the outer circle indicate an active component.
●
The upper and lower half of the diagram correspond to negative (inductive) and
positive (capacitive) susceptive components of the admittance, respectively.
Example: Reflection coefficients in the inverted Smith chart
If the measured quantity is a complex reflection coefficient G (e.g. S11, S22), then the
unit inverted Smith chart can be used to read the normalized admittance of the DUT.
The coordinates in the normalized admittance plane and in the reflection coefficient
plane are related as follows (see also: definition of matched-circuit (converted) admittances):
Y / Y0 = (1 - Γ) / (1 + Γ)
From this equation, it is easy to relate the real and imaginary components of the complex admittance to the real and imaginary parts of Γ:
According to the two equations above, the graphical representation in an inverted
Smith chart has the following properties:
●
Real reflection coefficients are mapped to real admittances (conductances).
97User Manual 1173.9557.02 ─ 37

R&S® ZNC/ZND
Concepts and Features
Screen Elements
●
The center of the Γ plane (Γ = 0) is mapped to the reference admittance Y0,
whereas the circle with |Γ| = 1 is mapped to the imaginary axis of the Y plane.
●
The circles for the points of equal conductance are centered on the real axis and
intersect at Y = infinity. The arcs for the points of equal susceptance also belong to
circles intersecting at Y = infinity (short circuit point (–1, 0)), centered on a straight
vertical line.
Examples for special points in the inverted Smith chart:
●
The magnitude of the reflection coefficient of a short circuit (Y = infinity, U = 0) is
one, its phase is –180 deg.
●
The magnitude of the reflection coefficient of an open circuit (Y = 0, I = 0) is one, its
phase is zero.
5.2.3.3 Measured Quantities and Trace Formats
The analyzer allows any combination of a display format and a measured quantity. The
following rules can help to avoid inappropriate formats and find the format that is ideally suited to the measurement task.
●
All formats are suitable for the analysis of reflection coefficients Sii. The formats
"SWR" , "Smith" and "Inv Smith" lose their original meaning (standing wave ratio,
normalized impedance or admittance) if they are used for transmission S-parameters, ratios and other quantities.
●
For complex "Impedances", "Admittances", "Z-parameters", and "Y-parameters"
generally a Cartesian format or the polar format is suitable.
●
For the real valued Stability Factors, one of the Cartesian formats "Lin Mag" or
"Real" should be used. In complex formats, real numbers represent complex numbers with zero imaginary part.
The following table gives an overview of recommended display formats.
Lin Mag ON ON (default for Z-parameters, Y-param-
Complex dimensionless quantities:
S-parameters and ratios
Complex quantities with dimensions:
Wave quantities, Z-parameters, Yparameters, impedances, admittances
eters, impedances, admittances)
Real quantities:
Stability Factors
ON (default)
dB Mag ON (default) ON (default for wave quantities) –
98User Manual 1173.9557.02 ─ 37

R&S® ZNC/ZND
Concepts and Features
Measurement Results
Phase ON ON –
Real ON ON ON
Imag ON ON –
Unwrapped Phase ON ON –
Smith ON (reflection coefficients Sii) – –
Polar ON – –
Inverted Smith ON (reflection coefficients Sii) – –
SWR ON (reflection coefficients Sii) – –
Delay ON (transmission coefficients Sij) – –
Complex dimensionless quantities:
S-parameters and ratios
Complex quantities with dimensions:
Wave quantities, Z-parameters, Yparameters, impedances, admittances
Real quantities:
Stability Factors
The default formats are activated automatically when the measured quantity is
changed.
5.3 Measurement Results
This section gives an overview of the measurement results of the network analyzer and
the meaning of the different measured quantities. All quantities can be selected in the
"Meas" softtool (function key TRACE – [MEAS]).
5.3.1 S-Parameters
S-parameters are the basic measured quantities of a network analyzer. They describe
how the DUT modifies a signal that is transmitted or reflected in forward or reverse
direction. For a 2-port measurement, the signal flow is as follows.
The figure above is sufficient for the definition of S-parameters but does not necessarily show the complete signal flow. In fact, if the source and load ports are not ideally
matched, part of the transmitted waves are reflected off the receiver ports. An additional a2 contribution occurs in forward measurements, and an a1 contribution occurs in
99User Manual 1173.9557.02 ─ 37

R&S® ZNC/ZND
2
1
2221
1211
2
1
a
a
SS
SS
b
b
Concepts and Features
Measurement Results
reverse measurements. The 7-term calibration types Txx take these additional contributions into account.
The scattering matrix links the incident waves a1, a2 to the outgoing waves b1, b
according to the following linear equation:
Meaning of 2-port S-parameters
The four 2-port S-parameters can be interpreted as follows:
●
S11 is the reflection coefficient of DUT port 1, i.e. the ratio between outgoing wave
b1 and incident wave a1 in a forward measurement with matched DUT port 2:
S11 = b1 / a1 , if |a1| > 0 and a2 = 0
●
S21 is the forward transmission coefficient, defined as the ratio between outgoing
wave b2and incident wave a1 in a forward measurement with matched DUT port 2:
S21 = b2 / a1 , if |a1| > 0 and a2 = 0
●
S12 is the reverse transmission coefficient, defined as the ratio between outgoing
wave b1and incident wave a2 in a forward measurement with matched DUT port 1:
S12 = b1 / a2 , if |a2| > 0 and a1 = 0
●
S22 is the reflection coefficient of port 2, i.e. the ratio between outgoing wave b2 and
incident wave a2 in a forward measurement with matched DUT port 1:
S22 = b2 / a2 , if |a2| > 0 and a1 = 0
2
With a unidirectional R&S ZND (see Chapter 5.1.4.2, "R&S ZND: Unidirectional vs.
Bidirectional Operation", on page 73) "reverse direction" S-parameters Si2 (i=1,2) can-
not be measured.
Meaning of squared amplitudes
The squared amplitudes of the incident and outgoing waves and of the matrix elements
have a simple meaning:
Table 5-3: Squared S-parameters
2
|ai|
2
|bi|
10 log|Sii|2 = 20 log|Sii|
10 log|S21|2 = 20 log|S21|
10 log|S12|2 = 20 log|S12|
Available incident power (= the power provided by a generator with
a source impedance equal to the reference impedance Z0) at DUT
port i=1,2
Reflected power at DUT port i=1,2
Reflection loss at DUT port i=1,2
Insertion loss of forward transmission
Insertion loss of reverse transmission
100User Manual 1173.9557.02 ─ 37
 Loading...