

Page 1
R&S®VSE-K144
3GPP 5G NR Measurement
Application (Uplink)
User Manual
(;Üé32)
1178910302
Version 04
Page 2

This manual applies to the following software, version 1.90 and later:
●
R&S®VSE Enterprise Edition base software (1345.1105.06)
●
R&S®VSE Basic Edition base software (1345.1011.06)
The following firmware options are described:
●
R&S®VSE-K144 (5G NR) (1309.9574.02)
© 2020 Rohde & Schwarz GmbH & Co. KG
Mühldorfstr. 15, 81671 München, Germany
Phone: +49 89 41 29 - 0
Email: info@rohde-schwarz.com
Internet: www.rohde-schwarz.com
Subject to change – data without tolerance limits is not binding.
R&S® is a registered trademark of Rohde & Schwarz GmbH & Co. KG.
Trade names are trademarks of the owners.
1178.9103.02 | Version 04 | R&S®VSE-K144
Throughout this manual, products from Rohde & Schwarz are indicated without the ® symbol , e.g. R&S®VSE is indicated as
R&S VSE.
Page 3

R&S®VSE-K144
1 Preface.................................................................................................... 7
1.1 About this Manual......................................................................................................... 7
1.2 Documentation Overview............................................................................................. 7
1.3 Typographical Conventions......................................................................................... 8
2 Welcome to the 5G NR Measurement Application............................10
2.1 5G NR Measurement Application Selection............................................................. 10
2.2 Display Information.....................................................................................................11
3 Measurements and Result Displays...................................................13
3.1 Selecting Measurements............................................................................................ 13
3.2 Selecting Result Displays.......................................................................................... 14
Contents
Contents
3.3 Performing Measurements.........................................................................................15
3.4 Result Summary..........................................................................................................15
3.5 I/Q Measurements....................................................................................................... 22
3.6 PRACH Analysis..........................................................................................................34
3.7 Frequency Sweep Measurements............................................................................. 35
3.8 Reference: Custom Limits..........................................................................................38
4 Configuration........................................................................................40
4.1 I/Q Measurement......................................................................................................... 40
4.1.1 Configuration Overview.................................................................................................41
4.1.2 Automatic Measurement Configuration.........................................................................42
4.1.3 Physical Signal Description...........................................................................................44
4.1.4 Component Carrier Configuration................................................................................. 47
4.1.5 Radio Frame Configuration........................................................................................... 50
4.1.6 Bandwidth Part Configuration....................................................................................... 54
4.1.7 Slot Configuration..........................................................................................................58
4.1.8 PUSCH and PUCCH Configuration.............................................................................. 66
4.1.9 Antenna Port Configuration...........................................................................................81
4.1.10 Advanced Settings........................................................................................................ 83
4.1.11 Selecting the Input and Output Source......................................................................... 87
4.1.12 Frequency Configuration...............................................................................................91
3User Manual 1178.9103.02 ─ 04
Page 4

R&S®VSE-K144
4.1.13 Amplitude Configuration................................................................................................92
4.1.14 Trigger Configuration.....................................................................................................95
4.1.15 Data Capture.................................................................................................................97
4.1.16 Tracking.......................................................................................................................100
4.1.17 Demodulation.............................................................................................................. 102
4.2 Frequency Sweep Measurement Configuration.....................................................104
4.3 Microservice Export..................................................................................................105
4.4 Time Trigger Measurement Guide........................................................................... 106
4.5 Reference: Structure of .allocation Files................................................................ 107
5 Analysis...............................................................................................114
5.1 General Analysis Tools.............................................................................................114
5.1.1 Data Export..................................................................................................................114
Contents
5.1.2 Diagram Scale.............................................................................................................115
5.1.3 Zoom........................................................................................................................... 116
5.1.4 Markers........................................................................................................................116
5.2 Analysis Tools for I/Q Measurements......................................................................117
5.2.1 Layout of Numerical Results........................................................................................117
5.2.2 Result Settings............................................................................................................ 117
5.2.3 Table Configuration..................................................................................................... 120
5.2.4 Result Views................................................................................................................120
5.2.5 Evaluation Range........................................................................................................122
5.3 Analysis Tools for Frequency Sweep Measurements............................................125
6 Remote Control.................................................................................. 126
6.1 Common Suffixes......................................................................................................126
6.2 Introduction............................................................................................................... 127
6.2.1 Conventions used in Descriptions...............................................................................127
6.2.2 Long and Short Form.................................................................................................. 128
6.2.3 Numeric Suffixes......................................................................................................... 128
6.2.4 Optional Keywords...................................................................................................... 129
6.2.5 Alternative Keywords.................................................................................................. 129
6.2.6 SCPI Parameters........................................................................................................ 129
6.3 5G NR Application Selection....................................................................................132
6.4 Screen Layout........................................................................................................... 132
4User Manual 1178.9103.02 ─ 04
Page 5

R&S®VSE-K144
6.4.1 General Layout............................................................................................................132
6.4.2 Layout over all Channels.............................................................................................133
6.4.3 Layout of a Single Channel......................................................................................... 136
6.5 Measurement Control............................................................................................... 142
6.6 Remote Commands to Retrieve Numeric Results................................................. 144
6.6.1 Result Summary..........................................................................................................144
6.6.2 Marker Table............................................................................................................... 157
6.6.3 CCDF Table.................................................................................................................160
6.7 Limit Check Results..................................................................................................162
6.7.1 EVM Limits.................................................................................................................. 162
6.7.2 Frequency Sweep Limits.............................................................................................170
6.8 Retrieve Trace Data...................................................................................................172
6.8.1 Using the TRACe[:DATA] Command...........................................................................172
Contents
6.8.2 Read Measurement Results........................................................................................182
6.9 Configuration.............................................................................................................185
6.9.1 General Configuration................................................................................................. 186
6.9.2 Automatic Configuration..............................................................................................188
6.9.3 Physical Settings.........................................................................................................190
6.9.4 Component Carrier Configuration............................................................................... 194
6.9.5 General Radio Frame Configuration........................................................................... 196
6.9.6 Bandwidth Part Configuration..................................................................................... 197
6.9.7 Slot Configuration........................................................................................................200
6.9.8 SRS Configuration...................................................................................................... 207
6.9.9 PUCCH Allocation Configuration................................................................................ 216
6.9.10 PUSCH Allocation Configuration.................................................................................223
6.9.11 Enhanced PUCCH Allocation Configuration............................................................... 230
6.9.12 Enhanced PUSCH Settings: DMRS............................................................................236
6.9.13 Enhanced PUSCH Settings: PTRS.............................................................................245
6.9.14 Enhanced PUSCH Settings: Scrambling / Coding...................................................... 250
6.9.15 Antenna Port Configuration.........................................................................................253
6.9.16 Advanced Settings: Global..........................................................................................254
6.9.17 Advanced Settings: Reference Point A....................................................................... 258
6.9.18 Inputs Configuration.................................................................................................... 260
5User Manual 1178.9103.02 ─ 04
Page 6

R&S®VSE-K144
6.9.19 Frequency Configuration.............................................................................................265
6.9.20 Amplitude Configuration..............................................................................................267
6.9.21 Data Capture...............................................................................................................271
6.9.22 Trigger.........................................................................................................................274
6.9.23 Tracking.......................................................................................................................280
6.9.24 Demodulation.............................................................................................................. 282
6.9.25 PRACH Analysis......................................................................................................... 283
6.9.26 Frequency Sweep Measurements.............................................................................. 286
6.10 Analysis..................................................................................................................... 287
6.10.1 General Analysis Tools................................................................................................287
6.10.2 Analysis Tools for I/Q Measurements..........................................................................299
Contents
Annex.................................................................................................. 309
A Annex: Reference...............................................................................309
A.1 Menu Reference........................................................................................................ 309
A.1.1 Common R&S VSE Menus......................................................................................... 309
A.1.2 LTE Measurement Menus........................................................................................... 311
A.2 Reference of Toolbar Functions.............................................................................. 313
List of Commands (5G NR Uplink)................................................... 317
Index....................................................................................................326
6User Manual 1178.9103.02 ─ 04
Page 7

R&S®VSE-K144
1 Preface
1.1 About this Manual
Preface
Documentation Overview
This User Manual describes information specific to measurements in the LTE mea-
surement application. All other applications are described in the corresponding application manuals.
The main focus in this manual is on the measurement results and the tasks required to
obtain them. The following topics are included:
●
Welcome to the R&S VSE
Introduction to and getting familiar with the software
●
Measurements and Results
Descriptions of the measurement types available in the R&S VSE software
●
Controlling Instruments and Capturing I/Q Data
Methods of data acquisition and description of basic instrument control functions
●
LTE Measurements
Description of the settings and functions provided to analyze results with the software and the corresponding remote control commands
●
Remote Commands for LTE Measurements
Remote commands required to configure and perform measurements in a remote
environment, sorted by tasks
Remote commands required to set up the environment and to perform common
tasks in the software, sorted by tasks
Programming examples demonstrate the use of many commands and can usually
be executed directly for test purposes
●
List of Commands
Alphabetical list of all remote commands described in the manual
●
Index
1.2 Documentation Overview
The user documentation for the R&S VSE consists of the following parts:
●
"Getting Started" printed manual
●
Online Help system in the software
●
CD-ROM including the following documentation:
– Getting Started
– User Manuals for base software and options
– Service Manual
– Release Notes
– Data sheet and product brochures
7User Manual 1178.9103.02 ─ 04
Page 8

R&S®VSE-K144
Preface
Typographical Conventions
Online Help
The Online Help is embedded in the software. It offers quick, context-sensitive access
to the complete information needed for operation and programming. Online help is
available using the icon on the toolbar of the R&S VSE.
Getting Started
This manual is delivered with the software in printed form and in PDF format on the
CD. It provides the information needed to set up and start working with the software.
Basic operations and handling are described. Safety information is also included.
User Manuals
User manuals are provided for the base software and each additional (software)
option.
The user manuals are available in PDF format - in printable form - on the CD-ROM
delivered with the software. In the user manuals, all software functions are described in
detail. Furthermore, they provide a complete description of the remote control commands with programming examples.
The user manual for the base software provides basic information on operating the
R&S VSE in general, and the I/Q Analyzer application in particular. Furthermore, the
software functions that enhance the basic functionality for various applications are
described here. An introduction to remote control is provided, as well as information on
troubleshooting.
In the individual application manuals, the specific software functions of the application
are described in detail. For additional information on default settings and parameters,
refer to the data sheets. Basic information on operating the R&S VSE is not included in
the application manuals.
Release Notes
The release notes describe the installation of the software, new and modified functions,
eliminated problems, and last minute changes to the documentation. The corresponding software version is indicated on the title page of the release notes.
Application Notes
Application notes, application cards, white papers and educational notes are further
publications that provide more comprehensive descriptions and background information. The latest versions are available for download from the Rohde & Schwarz website, at www.rohde-schwarz.com/appnote/.
1.3 Typographical Conventions
The following text markers are used throughout this documentation:
8User Manual 1178.9103.02 ─ 04
Page 9

R&S®VSE-K144
Preface
Typographical Conventions
Convention Description
"Graphical user interface elements"
[Keys] Key and knob names are enclosed by square brackets.
Filenames, commands,
program code
Input Input to be entered by the user is displayed in italics.
Links Links that you can click are displayed in blue font.
"References" References to other parts of the documentation are enclosed by quota-
All names of graphical user interface elements on the screen, such as
dialog boxes, menus, options, buttons, and softkeys are enclosed by
quotation marks.
Filenames, commands, coding samples and screen output are distinguished by their font.
tion marks.
9User Manual 1178.9103.02 ─ 04
Page 10

R&S®VSE-K144
2 Welcome to the 5G NR Measurement Appli-
Welcome to the 5G NR Measurement Application
5G NR Measurement Application Selection
cation
The R&S VSE-K144 is a firmware application that adds functionality to measure signals according to the 3GPP 5G NR (new radio) standard on the downlink to the
R&S VSE.
Bandwidth of 5G NR signals
5G NR signals have a bandwidth between 5 MHz and 400 MHz.
If you measure signals with an instrument, measuring signals greater than 10 MHz
requires an instrument with one of the optional bandwidth extensions (28 MHz or
more).
This user manual contains a description of the functionality that the application provides, including remote control operation. Functions that are not discussed in this manual are the same as in the spectrum application and are described in the R&S VSE
user manual. The latest versions of the manuals are available for download at the
product homepage.
https://www.rohde-schwarz.com/manual/vse.
● 5G NR Measurement Application Selection............................................................10
● Display Information..................................................................................................11
2.1 5G NR Measurement Application Selection
The 5G NR measurement application adds a new application to the R&S VSE.
Starting the application
1.
Select the "Add Channel" function in the Sequence tool window.
A dialog box opens that contains all operating modes and applications currently
available in your R&S VSE.
2. Select the "5G NR" item.
The R&S VSE opens a new measurement channel for the 5G NR application.
The application starts with the default settings. You can configure measurements with
the items in the "Meas Setup" menu.
10User Manual 1178.9103.02 ─ 04
Page 11
R&S®VSE-K144
2.2 Display Information
Welcome to the 5G NR Measurement Application
Display Information
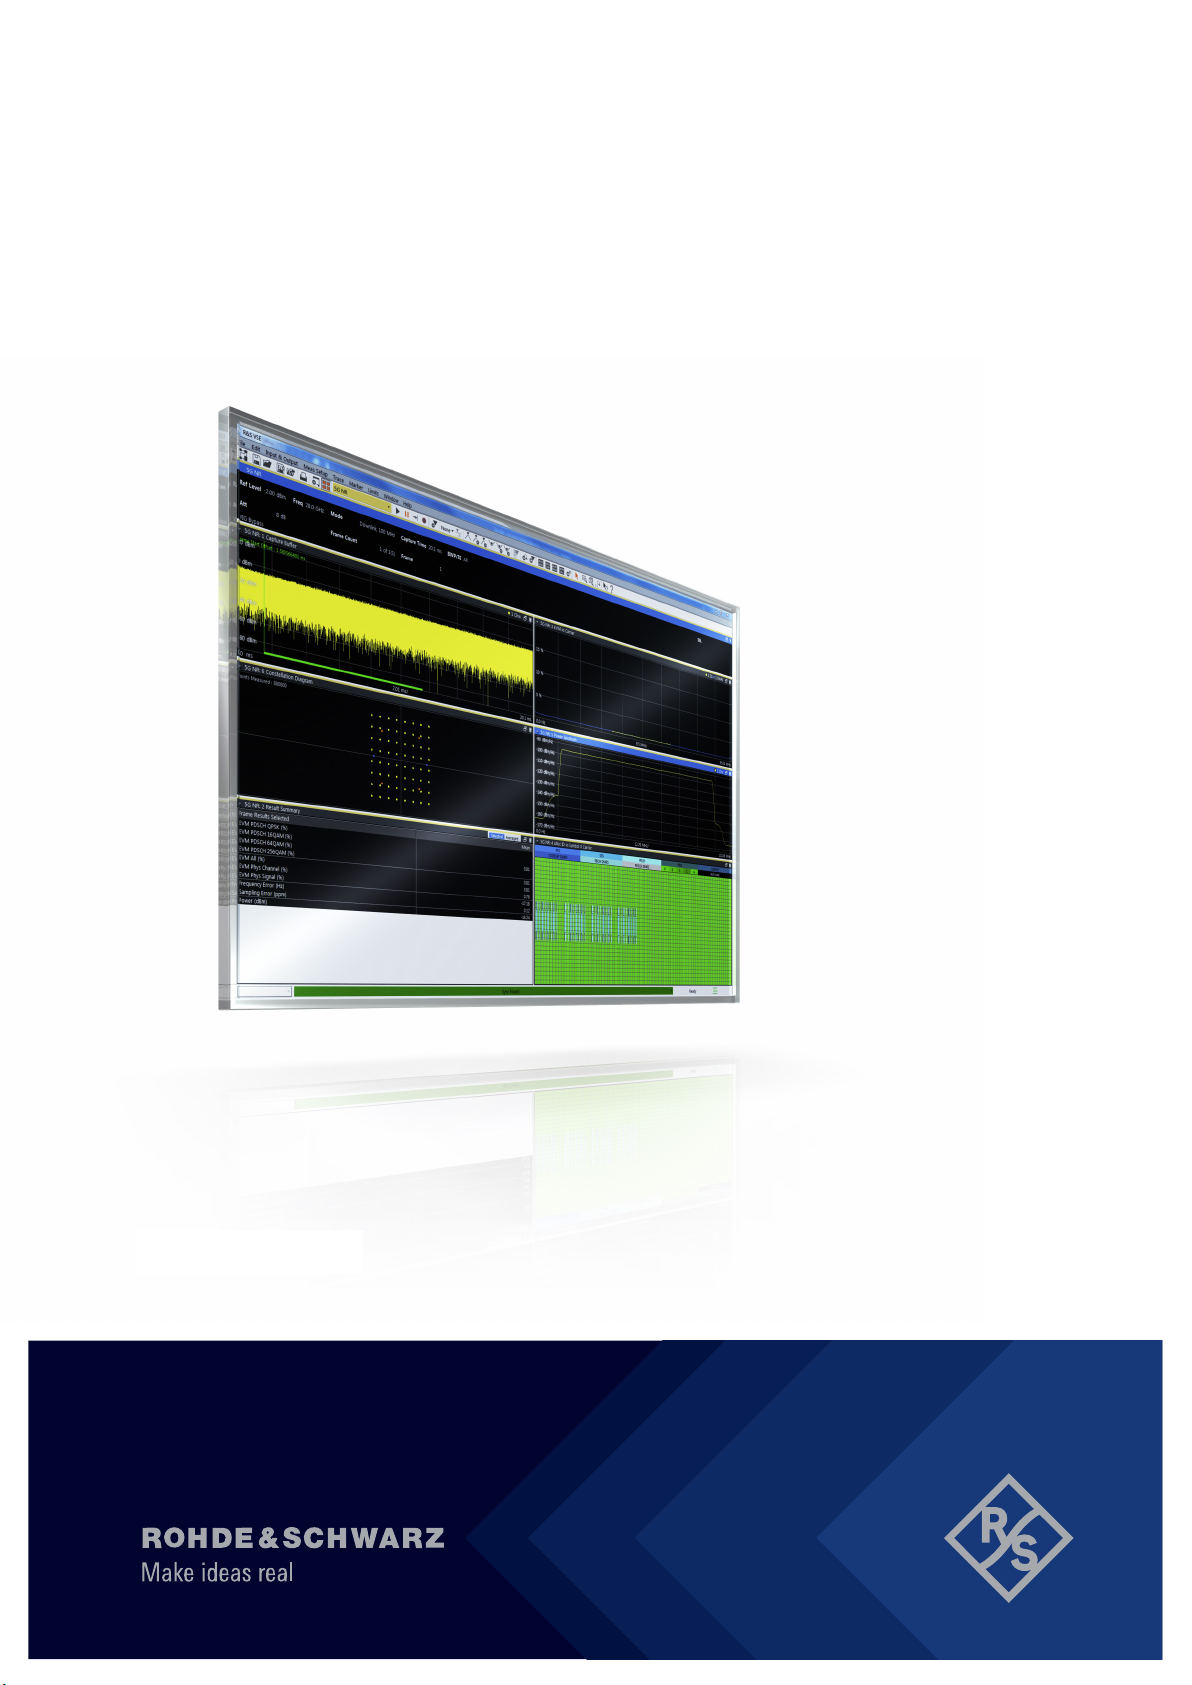
The following figure shows a typical display of the 5G NR application. All different information areas are labeled. They are explained in more detail in the following sections.
1 2 3 7 84 5 6
1 = Menu bar
2 = Toolbar
3 = Channel bar header, incl. color code for windows of the same channel (here: yellow)
4 = Channel bar
5 = Diagram header, incl. color code for windows of the same channel (here: yellow)
6 = Diagram area
7 = Diagram footer
8 = Status bar
Channel bar information
In the 5G NR measurement application, the R&S VSE shows the following settings:
Table 2-1: Information displayed in the channel bar in the 5G NR measurement application
Ref Level Reference level
Att Mechanical and electronic RF attenuation
Freq Frequency
Mode* 5G NR mode (link direction and channel bandwidth)
Frame Count* The first number represents the number of frames that have already been
captured.
The second number represents the total number of frames that will be
captured.
The third number in brackets represents the number of frames currently in
the capture buffer.
11User Manual 1178.9103.02 ─ 04
Page 12

R&S®VSE-K144
Welcome to the 5G NR Measurement Application
Display Information
Capture Time Signal length that has been captured
Frame Frame that is currently analyzed
BWP/SS Shows the signal part for which results are displayed (evaluation range).
SS = synchronization signal
BWP = bandwidth part
View<x> Information about the contents of View 1 and View 2.
Select the button for access to the dialog box for view configuration..
The channel bar also displays information on instrument settings that affect the measurement results even though this is not immediately apparent from the display of the
measured values (for example transducer or trigger settings). This information is displayed only when applicable for the current measurement. For a comprhensive
description, refer to the user manual of the R&S VSE.
Diagram header
The information in the diagram header depends on the result display.
●
All diagrams show the window number and type of result display.
●
Most diagrams contain trace information.
●
Some diagrams contain controls to customize the diagram contents. The diagram
header of the "Allocation Summary", for example, contains a control to select which
columns are displayed.
Status bar information
Global instrument settings, the instrument status and any irregularities are indicated in
the status bar beneath the diagram. Furthermore, the progress of the current operation
is displayed in the status bar.
Regarding the synchronization state, the application shows the following labels.
●
"Sync OK"
The synchronization was successful. The status bar is green.
●
"Sync Failed"
The synchronization was not successful. The status bar is red.
12User Manual 1178.9103.02 ─ 04
Page 13

R&S®VSE-K144
3 Measurements and Result Displays
Measurements and Result Displays
Selecting Measurements
The 5G NR measurement application measures and analyzes various aspects of a 5G
NR signal.
The application provides several measurements and result displays.
●
Measurements capture and analyze the signal in a different way.
●
Result displays are different representations of the measurement results. They are
either diagrams that show the results as a graph or tables that show the results as
numbers.
Remote command:
Measurement selection: CONFigure[:NR5G]:MEASurement on page 186
Result display selection: LAYout:ADD[:WINDow]? on page 136
● Selecting Measurements.........................................................................................13
● Selecting Result Displays........................................................................................14
● Performing Measurements......................................................................................15
● Result Summary......................................................................................................15
● I/Q Measurements...................................................................................................22
● PRACH Analysis..................................................................................................... 34
● Frequency Sweep Measurements.......................................................................... 35
● Reference: Custom Limits.......................................................................................38
3.1 Selecting Measurements
Access: "Overview" > "Select Measurement"
The "Select Measurement" dialog box contains several buttons. Each button represents a measurement. A measurement in turn is a set of result displays that thematically belong together and that have a particular display configuration. If these predefined display configurations do not suit your requirements, you can add or remove
result displays as you like. For more information about selecting result displays, see
Chapter 3.2, "Selecting Result Displays", on page 14.
Depending on the measurement, the R&S VSE changes the way it captures and processes the raw signal data.
EVM
EVM measurements record, process and demodulate the signal's I/Q data. The result
displays available for EVM measurements show various aspects of the 5G NR signal
quality.
For EVM measurements, you can combine the result displays in any way.
For more information on the result displays, see Chapter 3.5, "I/Q Measurements",
on page 22.
Remote command:
CONFigure[:NR5G]:MEASurement on page 186
13User Manual 1178.9103.02 ─ 04
Page 14

R&S®VSE-K144
Measurements and Result Displays
Selecting Result Displays
PRACH Analysis
EVM measurements record, process and demodulate the PRACH. The result displays
available for PRACH measurements show various aspects of the PRACH signal quality.
For PRACH measurements, you can combine the result displays in any way.
Remote command:
CONFigure[:NR5G]:MEASurement on page 186
Channel Power ACLR
ACLR measurements process captured the I/Q data.
The ACLR measurements evaluates the leakage ratio of neighboring channels and
evaluates if the signal is within the defined limits. The measurement provides several
result displays. You can combine the result displays in any way.
For more information on the result displays, see Chapter 3.7, "Frequency Sweep Mea-
surements", on page 35.
Remote command:
CONFigure[:NR5G]:MEASurement on page 186
SEM
SEM measurements process captured the I/Q data.
The SEM measurements tests the signal against a spectrum emission mask and eval-
uates if the signal is within the defined limits. The measurement provides several result
displays. You can combine the result displays in any way.
For more information on the result displays, see Chapter 3.7, "Frequency Sweep Mea-
surements", on page 35.
Remote command:
CONFigure[:NR5G]:MEASurement on page 186
3.2 Selecting Result Displays
Access: or "Window" > "New Window"
The R&S VSE opens a menu to select result displays. Depending on the number of
LTE channels you are currently using, there is a submenu that contains all available
result displays for each LTE channel.
In the default state of the application, it shows several conventional result displays.
●
Capture Buffer
●
EVM vs Carrier
●
Power Spectrum
●
Result Summary
●
Alloc ID vs Symbol x Carrier
●
Constellation Diagram
14User Manual 1178.9103.02 ─ 04
Page 15

R&S®VSE-K144
3.3 Performing Measurements
Measurements and Result Displays
Result Summary
From that predefined state, add and remove result displays to the channels as you like
from the "Window" menu.
Remote command: LAYout:ADD[:WINDow]? on page 136
By default, the application measures the signal continuously. In "Continuous Sweep"
mode, the R&S VSE captures and analyzes the data again and again.
●
For I/Q measurements, the amount of captured data depends on the capture time.
●
For frequency sweep measurement, the amount of captured data depends on the
sweep time.
In "Single Sweep" mode, the R&S VSE stops measuring after it has captured the data
once. The amount of data again depends on the capture time.
Refreshing captured data
You can also repeat a measurement based on the data that has already been captured
with the "Refresh" function. Repeating a measurement with the same data can be useful, for example, if you want to apply different modulation settings to the same I/Q data.
For more information, see the documentation of the R&S VSE.
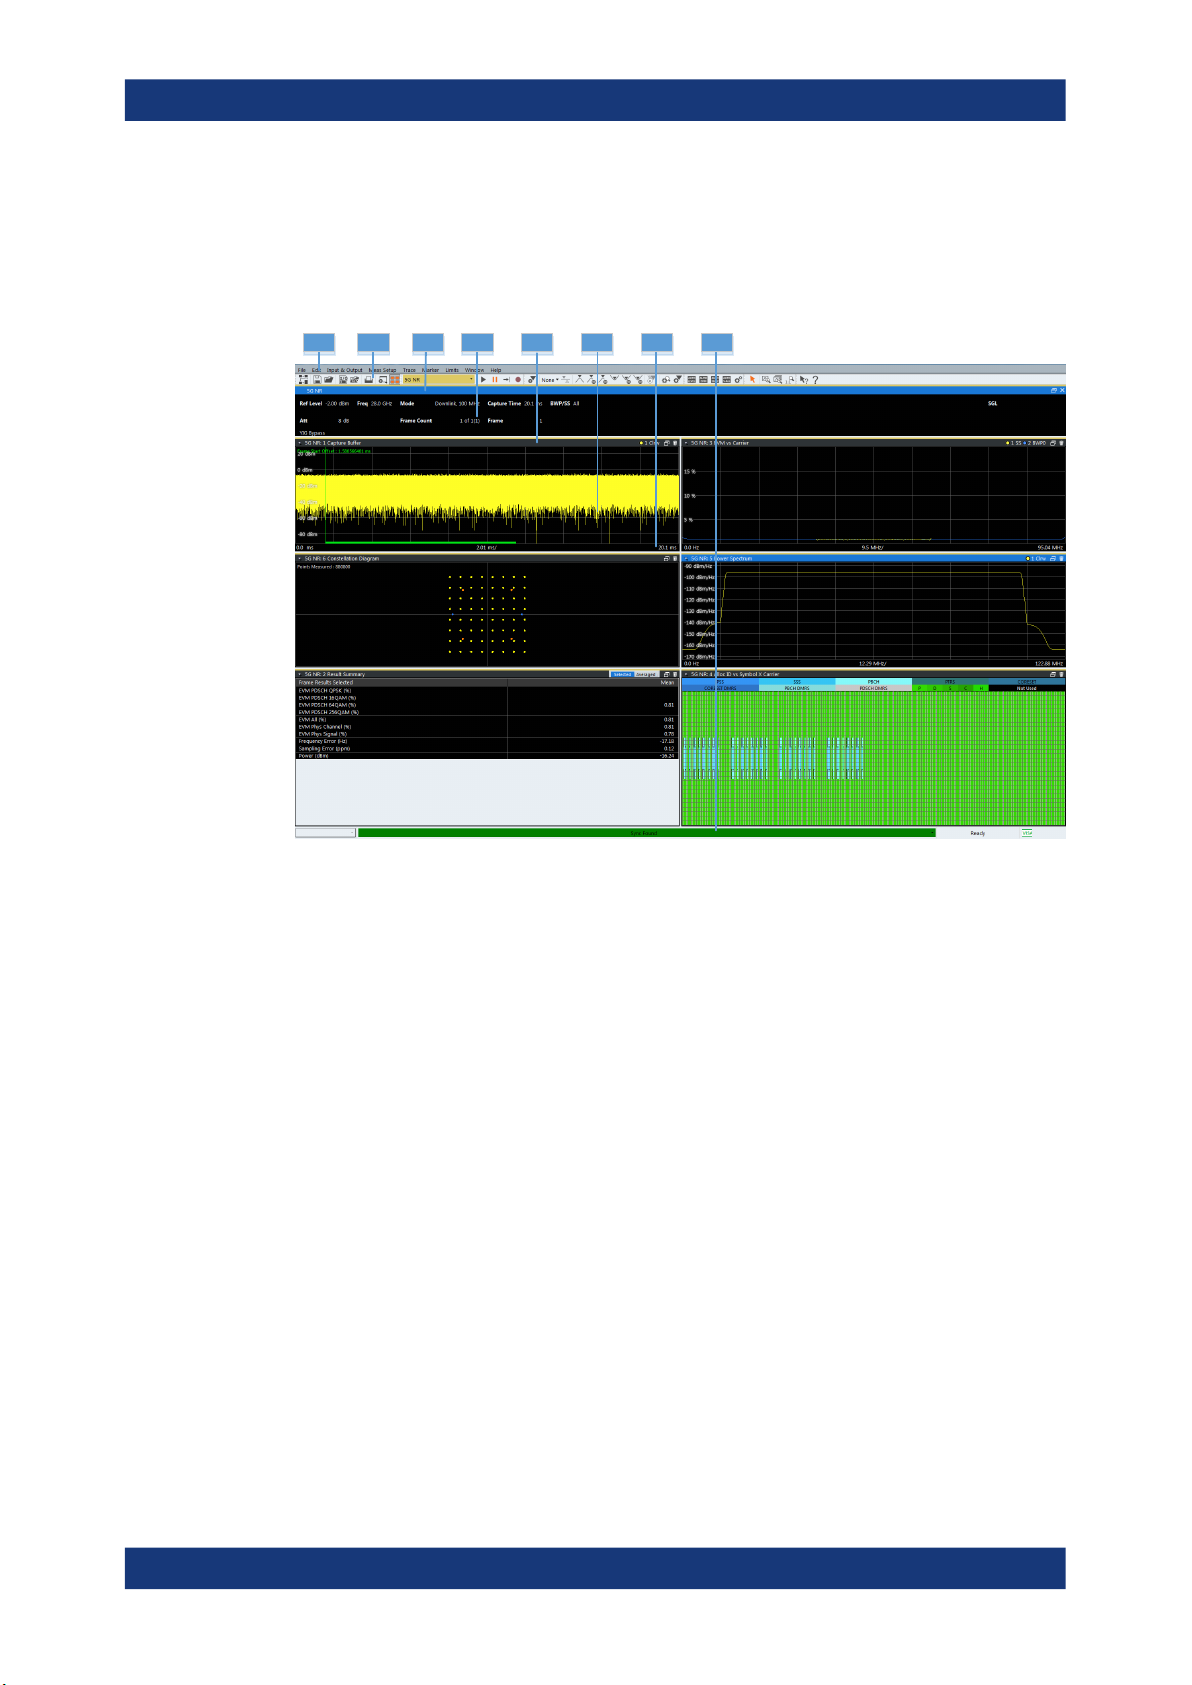
3.4 Result Summary
In addition to various graphical results, the R&S VSE provides a numerical result summary for I/Q measurements. The result summary shows a multitude of results that indicate the signal quality, combined in one table.
The result summary is split into several parts.
●
Frame statistics, which evaluate the metrics of the resource elements in a complete
frame.
Results are averaged over frames.
●
Slot and subframe statistics, which evaluate metrics of the resource elements in a
single slot or subframe.
Results are averaged over slots / subframes.
Each row in the table corresponds to a certain metric or result parameter. You can add
or remove results you want to display as necessary.
By default, the R&S VSE evaluates the results over all captured frames, bandwidth
parts, subframes and slots. For most results, the result summary therefore contains a
mean (average), maximum and minimum value.
15User Manual 1178.9103.02 ─ 04
Page 16
R&S®VSE-K144
Measurements and Result Displays
Result Summary
Limit check
The R&S VSE also tests several results against limits, if 3GPP has defined limits for a
result. Limits are only evaluated if the signal complies to the 3GPP specification
regarding the number of analyzed frames and the results are averaged over all frames.
Depending on the limit test, the results are highlighted.
●
If one of the results passes the limit, the value is highlighted green.
●
If one of the results violates the limit, the value is highlighted red.
●
Results that are not evaluated are not highlighted in a color.
For some results you can define custom limits. For more information, see Chapter 3.8,
"Reference: Custom Limits", on page 38.
You can check if a result supports limit evaluation in the result descriptions below. The
result descriptions also indicate special behavior of the limit check.
Evaluation range and multiple frame analysis
Unavailable for PRACH analysis.
The evaluation range selects the way the results are evaluated and which values are
displayed.
For the frame statistics, the evaluation range is irrelevant. However, you can select a
specific frame that you want to analyze.
●
Select "Frame Averaged" in the result summary header to display the average
result over all analyzed frames. The average results relate to all frames, not just
those in the capture buffer.
The table also shows the minimum and maximum values over the analyzed
frames.
●
Select "Selected Frame" in the result summary header to display the results for a
single frame.
16User Manual 1178.9103.02 ─ 04
Page 17

R&S®VSE-K144
Measurements and Result Displays
Result Summary
If you analyze a single frame, the mean, minimum and maximum values are the
same.
For the slot statistics and subframe statistics, the effects of the evaluation range are
as follows.
●
Select "Frame Averaged" in the result summary header to display the average
results over all analyzed slots in all analyzed frames. The average results relate to
all frames, not just those in the capture buffer. The table also shows the minimum
and maximum values found in the analyzed frames.
When you select a specific BWP, subframe or slot while in "Frame Averaged"
mode, the R&S VSE automatically selects "Selected Frame" mode.
●
Select "Selected Frame" in the result summary header to display the results over
all analyzed slots in a single frame. The analyzed frame depends on the frame you
have selected. In this case, you can filter the evaluation range as you like.
Examples:
– If you select a specific BWP: the R&S VSE takes the average over all slots in
the selected BWP.
– If you select a specific subframe: the R&S VSE takes the average over all slots
in the selected subframe.
– If you select a specific slot: the R&S VSE shows the result for that slot.
Note that selecting a specific slot for the subframe results (frequency and sampling error) will not make a difference, because those results are always calculated over a complete subframe.
The current evaluation range is indicated in the header row of the slot statistics.
Multiple carrier analysis
Unavailable for PRACH analysis.
For measurements on multiple carriers, the contents of the result summary depend on
your configuration, especially the CC result setting.
●
Select "CC Result" = "All" to display information about all component carriers,
regardless of the number of component carriers.
– The "All" tab shows the average results for all component carriers. Each col-
umn in the table corresponds to one component carrier.
– The "View <x>" tabs show the detailed results for the component carriers
assigned to the two views.
●
Select "CC Result" = "Viewed" to display information about the component carriers
assigned to the two views.
– The "All" tab shows the average results for the two selected component carri-
ers. Depending on your selection in the result summary header, the results are
either averaged over all frames, or relate to a single frame.
– The "View <x>" tabs show the detailed results for the component carriers
assigned to the two views. Depending on your selection in the result summary
header, the results are either averaged over all frames, or relate to a single,
selected frame.
17User Manual 1178.9103.02 ─ 04
Page 18

R&S®VSE-K144
Measurements and Result Displays
Result Summary
If you analyze only one frame, the results are the same in both cases.
Note that analyzing all component carriers is slower compared analyzing the viewed
component carriers, because of the post-processing that occurs during the analysis.
Thus, if time is an issue, you can select two component carriers to analyze, and, if you
are later interested in the characteristics of another component carrier, analyze that
component carrier later (the data of the other carriers is available, just not analyzed).
Units
Most of the units of the results are fixed.
The unit of the EVM results depends on the selected EVM unit.
EVM PUSCH.................................................................................................................18
EVM DMRS PUSCH..................................................................................................... 19
EVM PUCCH.................................................................................................................19
EVM DMRS PUCCH.....................................................................................................20
EVM PRACH.................................................................................................................20
Frame Start Offset.........................................................................................................20
EVM All......................................................................................................................... 20
EVM Peak..................................................................................................................... 20
EVM Phys Channel.......................................................................................................21
EVM Phys Signal.......................................................................................................... 21
Frequency Error............................................................................................................ 21
Sampling Error.............................................................................................................. 21
Power............................................................................................................................21
I/Q Offset.......................................................................................................................22
I/Q Gain Imbalance....................................................................................................... 22
I/Q Quadrature Error..................................................................................................... 22
Crest Factor.................................................................................................................. 22
EVM PUSCH
Shows the EVM for all PUSCH resource elements with a certain modulation in the analyzed frame (PI/2 BPSK, QPSK, 16QAM, 64QAM, 256QAM).
The values for resource elements with a PI/2 BPSK modulation is only calculated if you
turn on transform precoding.
When you turn on transform precoding, the allocations actually contain a PTRS. In that
case, the result summary also shows the combined EVM for PUSCH and PTRS.
Limit evaluation supported.
Unavailable for PRACH analysis.
Remote command:
PI/2 BPSK: FETCh[:CC<cc>][:ISRC<ant>][:FRAMe<fr>]:SUMMary:EVM:
USPB[:AVERage]? on page 152
QPSK: FETCh[:CC<cc>][:ISRC<ant>][:FRAMe<fr>]:SUMMary:EVM:USQP[:
AVERage]? on page 152
16QAM: FETCh[:CC<cc>][:ISRC<ant>][:FRAMe<fr>]:SUMMary:EVM:USST[:
AVERage]? on page 153
64QAM: FETCh[:CC<cc>][:ISRC<ant>][:FRAMe<fr>]:SUMMary:EVM:USSF[:
AVERage]? on page 153
18User Manual 1178.9103.02 ─ 04
Page 19

R&S®VSE-K144
Measurements and Result Displays
Result Summary
256QAM: FETCh[:CC<cc>][:ISRC<ant>][:FRAMe<fr>]:SUMMary:EVM:
USTS[:AVERage]? on page 154
Limit check PI/2 BPSK: CALCulate<n>:LIMit<li>[:CC<cc>][:ISRC<ant>][:
FRAMe<fr>]:SUMMary:EVM:USPB:MAXimum:RESult? on page 167
Limit check QPSK: CALCulate<n>:LIMit<li>[:CC<cc>][:ISRC<ant>][:
FRAMe<fr>]:SUMMary:EVM:USQP:MAXimum:RESult? on page 168
Limit check 16QAM: CALCulate<n>:LIMit<li>[:CC<cc>][:ISRC<ant>][:
FRAMe<fr>]:SUMMary:EVM:USST:MAXimum:RESult? on page 169
Limit check 64QAM: CALCulate<n>:LIMit<li>[:CC<cc>][:ISRC<ant>][:
FRAMe<fr>]:SUMMary:EVM:USSF:MAXimum:RESult? on page 168
Limit check 256QAM: CALCulate<n>:LIMit<li>[:CC<cc>][:ISRC<ant>][:
FRAMe<fr>]:SUMMary:EVM:USTS:MAXimum:RESult? on page 169
EVM DMRS PUSCH
Shows the EVM for all PUSCH DMRS resource elements with a certain modulation in
the analyzed frame (PI/2 BPSK, QPSK, 16QAM, 64QAM, 256QAM).
The values for resource elements with a PI/2 BPSK modulation is only calculated if you
turn on transform precoding.
Limit evaluation supported.
Unavailable for PRACH analysis.
Remote command:
PI/2 BPSK: FETCh[:CC<cc>][:ISRC<ant>][:FRAMe<fr>]:SUMMary:EVM:
SDPB[:AVERage]? on page 148
QPSK: FETCh[:CC<cc>][:ISRC<ant>][:FRAMe<fr>]:SUMMary:EVM:SDQP[:
AVERage]? on page 149
16QAM: FETCh[:CC<cc>][:ISRC<ant>][:FRAMe<fr>]:SUMMary:EVM:SDST[:
AVERage]? on page 150
64QAM: FETCh[:CC<cc>][:ISRC<ant>][:FRAMe<fr>]:SUMMary:EVM:SDSF[:
AVERage]? on page 149
256QAM: FETCh[:CC<cc>][:ISRC<ant>][:FRAMe<fr>]:SUMMary:EVM:
SDTS[:AVERage]? on page 150
Limit check PI/2 BPSK: CALCulate<n>:LIMit<li>[:CC<cc>][:ISRC<ant>][:
FRAMe<fr>]:SUMMary:EVM:SDPB:MAXimum:RESult? on page 163
Limit check QPSK: CALCulate<n>:LIMit<li>[:CC<cc>][:ISRC<ant>][:
FRAMe<fr>]:SUMMary:EVM:SDQP:MAXimum:RESult? on page 164
Limit check 16QAM: CALCulate<n>:LIMit<li>[:CC<cc>][:ISRC<ant>][:
FRAMe<fr>]:SUMMary:EVM:SDST:MAXimum:RESult? on page 165
Limit check 64QAM: CALCulate<n>:LIMit<li>[:CC<cc>][:ISRC<ant>][:
FRAMe<fr>]:SUMMary:EVM:SDSF:MAXimum:RESult? on page 164
Limit check 256QAM: CALCulate<n>:LIMit<li>[:CC<cc>][:ISRC<ant>][:
FRAMe<fr>]:SUMMary:EVM:SDTS:MAXimum:RESult? on page 165
EVM PUCCH
Shows the EVM for all PUCCH resource elements in the analyzed frame.
Limit evaluation supported.
Unavailable for PRACH analysis.
19User Manual 1178.9103.02 ─ 04
Page 20

R&S®VSE-K144
Measurements and Result Displays
Result Summary
Remote command:
Result: FETCh[:CC<cc>][:ISRC<ant>][:FRAMe<fr>]:SUMMary:EVM:UCCH[:
AVERage]? on page 151
Limit check: CALCulate<n>:LIMit<li>[:CC<cc>][:ISRC<ant>][:
FRAMe<fr>]:SUMMary:EVM:UCCH:MAXimum:RESult? on page 166
EVM DMRS PUCCH
Shows the EVM for all PUSCH DMRS resource elements in the analyzed frame.
Unavailable for PRACH analysis.
Remote command:
Result: FETCh[:CC<cc>][:ISRC<ant>][:FRAMe<fr>]:SUMMary:EVM:UCCD[:
AVERage]? on page 151
Limit check: CALCulate<n>:LIMit<li>[:CC<cc>][:ISRC<ant>][:
FRAMe<fr>]:SUMMary:EVM:UCCD:MAXimum:RESult? on page 166
EVM PRACH
Shows the EVM for all PRACH resource elements in the captured signal.
Available for PRACH analysis.
Remote command:
FETCh[:CC<cc>][:ISRC<ant>][:FRAMe<fr>]:SUMMary:EVM:PRACh[:
AVERage]? on page 147
Frame Start Offset
Shows the start of the frame relative to the start of the capture buffer.
Unavailable for "Frame Averaged" results, otherwise refers to the selected frame.
For PRACH analysis, it shows the start of the preamble relative to the start of the cap-
ture buffer.
Remote command:
FETCh[:CC<cc>][:ISRC<ant>]:SUMMary:TFRame? on page 157
EVM All
Shows the EVM for all resource elements in the selected evaluation range.
Remote command:
FETCh[:CC<cc>][:ISRC<ant>][:FRAMe<fr>]:SUMMary:EVM[:ALL][:
AVERage]? on page 146
EVM Peak
Shows the EVM of the resource element with the highest EVM value in the selected
evaluation range.
Unavailable for PRACH analysis.
Remote command:
FETCh[:CC<cc>][:ISRC<ant>][:FRAMe<fr>]:SUMMary:EVM:PEAK[:
AVERage]? on page 147
20User Manual 1178.9103.02 ─ 04
Page 21

R&S®VSE-K144
Measurements and Result Displays
Result Summary
EVM Phys Channel
Shows the EVM for all physical channel resource elements in the selected evaluation
range.
A physical channel corresponds to a set of resource elements carrying information
from higher layers. PDSCH, PUSCH, PBCH or PDCCH, for example, are physical
channels.
Unavailable for PRACH analysis.
Remote command:
FETCh[:CC<cc>][:ISRC<ant>][:FRAMe<fr>]:SUMMary:EVM:PCHannel[:
AVERage]? on page 146
EVM Phys Signal
Shows the EVM for all physical signal resource elements in the selected evaluation
range.
The reference signal is a physical signal, for example.
Unavailable for PRACH analysis.
Frequency Error
Shows the difference in the measured center frequency and the reference center frequency.
The frequency error is calculated over a subframe.
Limit evaluation supported.
The limit check passes if both the minimum and maximum value pass. Only the mean
value is highlighted green (pass) or red (fail) respectively.
Remote command:
Result: FETCh[:CC<cc>][:ISRC<ant>][:FRAMe<fr>]:SUMMary:FERRor[:
AVERage]? on page 154
Limit check: CALCulate<n>:LIMit<li>[:CC<cc>][:ISRC<ant>][:
FRAMe<fr>]:SUMMary:EVM:FERRor[:AVERage]:RESult? on page 162
Sampling Error
Shows the difference in measured symbol clock and reference symbol clock relative to
the system sampling rate.
The sampling error is calculated over a subframe.
Remote command:
FETCh[:CC<cc>][:ISRC<ant>][:FRAMe<fr>]:SUMMary:SERRor[:AVERage]?
on page 156
Power
Shows the average time domain power for all resource elements in the selected evaluation range.
Remote command:
FETCh[:CC<cc>][:ISRC<ant>][:FRAMe<fr>]:SUMMary:POWer[:AVERage]?
on page 156
21User Manual 1178.9103.02 ─ 04
Page 22

R&S®VSE-K144
Measurements and Result Displays
I/Q Measurements
I/Q Offset
Shows the power at spectral line 0 normalized to the total transmitted power.
Not available for multiple BWPs.
Remote command:
FETCh[:CC<cc>][:ISRC<ant>][:FRAMe<fr>]:SUMMary:IQOFfset[:
AVERage]? on page 155
I/Q Gain Imbalance
Shows the logarithm of the gain ratio between the Q-channel and the I-channel.
Not available for multiple BWPs and only calculated if you turn on the calculation.
Remote command:
FETCh[:CC<cc>][:ISRC<ant>][:FRAMe<fr>]:SUMMary:GIMBalance[:
AVERage]? on page 154
I/Q Quadrature Error
Shows the measure of the phase angle between Q-channel and I-channel deviating
from the ideal 90 degrees.
Not available for multiple BWPs and only calculated if you turn on the calculation.
Crest Factor
Shows the peak-to-average power ratio of the captured signal.
Unavailable for PRACH analysis.
Remote command:
FETCh[:CC<cc>][:ISRC<ant>]:SUMMary:CRESt[:AVERage]? on page 146
3.5 I/Q Measurements
Access: [MEAS] > "EVM/Frequency Err/Power"
You can select the result displays from the evaluation bar and arrange them as you like
with the SmartGrid functionality.
Remote command:
Measurement selection: CONFigure[:NR5G]:MEASurement on page 186
Result display selection: LAYout:ADD[:WINDow]? on page 136
Capture Buffer...............................................................................................................23
EVM vs Carrier..............................................................................................................23
EVM vs Symbol.............................................................................................................24
EVM vs RB....................................................................................................................25
Frequency Error vs Symbol...........................................................................................26
Power Spectrum............................................................................................................26
Inband Emission............................................................................................................27
Flatness.........................................................................................................................28
CCDF............................................................................................................................ 29
Constellation Diagram...................................................................................................29
22User Manual 1178.9103.02 ─ 04
Page 23
R&S®VSE-K144
Measurements and Result Displays
I/Q Measurements
Allocation Summary...................................................................................................... 30
Bitstream.......................................................................................................................31
EVM vs Symbol x Carrier..............................................................................................32
Power vs Symbol x Carrier............................................................................................32
Allocation ID vs Symbol x Carrier..................................................................................32
Marker Table ................................................................................................................ 33
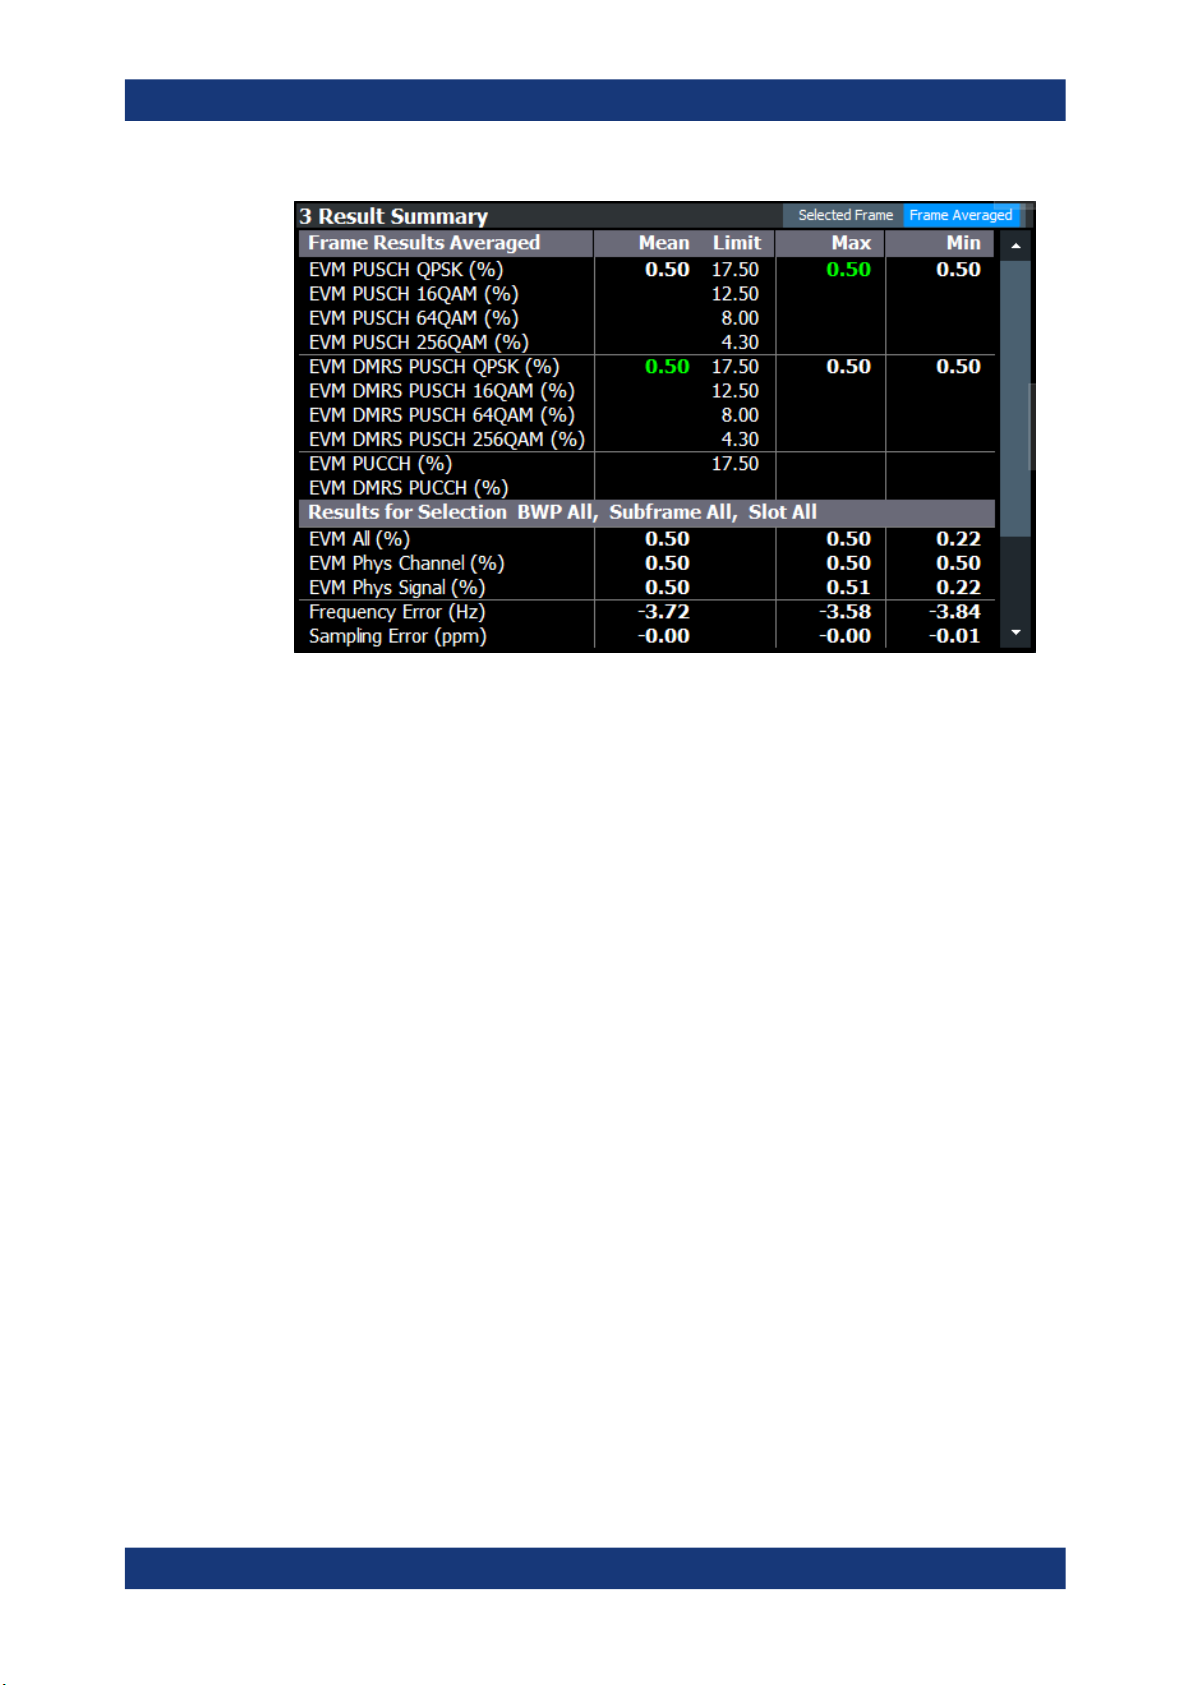
Capture Buffer
The "Capture Buffer" shows the complete range of captured data for the last data capture.
The x-axis represents time. The maximum value of the x-axis is equal to the Capture
Time.
The y-axis represents the amplitude of the captured I/Q data in dBm (for RF input).
Figure 3-1: Capture buffer without zoom
A green vertical line at the beginning of the green bar in the capture buffer represents
the frame start. The diagram also contains the "Start Offset" value. This value is the
time difference between the frame start and capture buffer start.
For PRACH analysis, the green line indicates the location of the preamble relative to
the start of the capture buffer ("Preamble Start Offset").
The header of the "Capture Buffer" result display contains an "I/Q Export" button that
allows you to export I/Q data easily.
Remote command:
Selection: LAY:ADD ? '1',LEFT,CBUF
Query (y-axis): TRACe:DATA?
Query (x-axis): TRACe<n>[:DATA]:X? on page 185
Frame start offset: FETCh[:CC<cc>][:ISRC<ant>]:SUMMary:TFRame?
on page 157
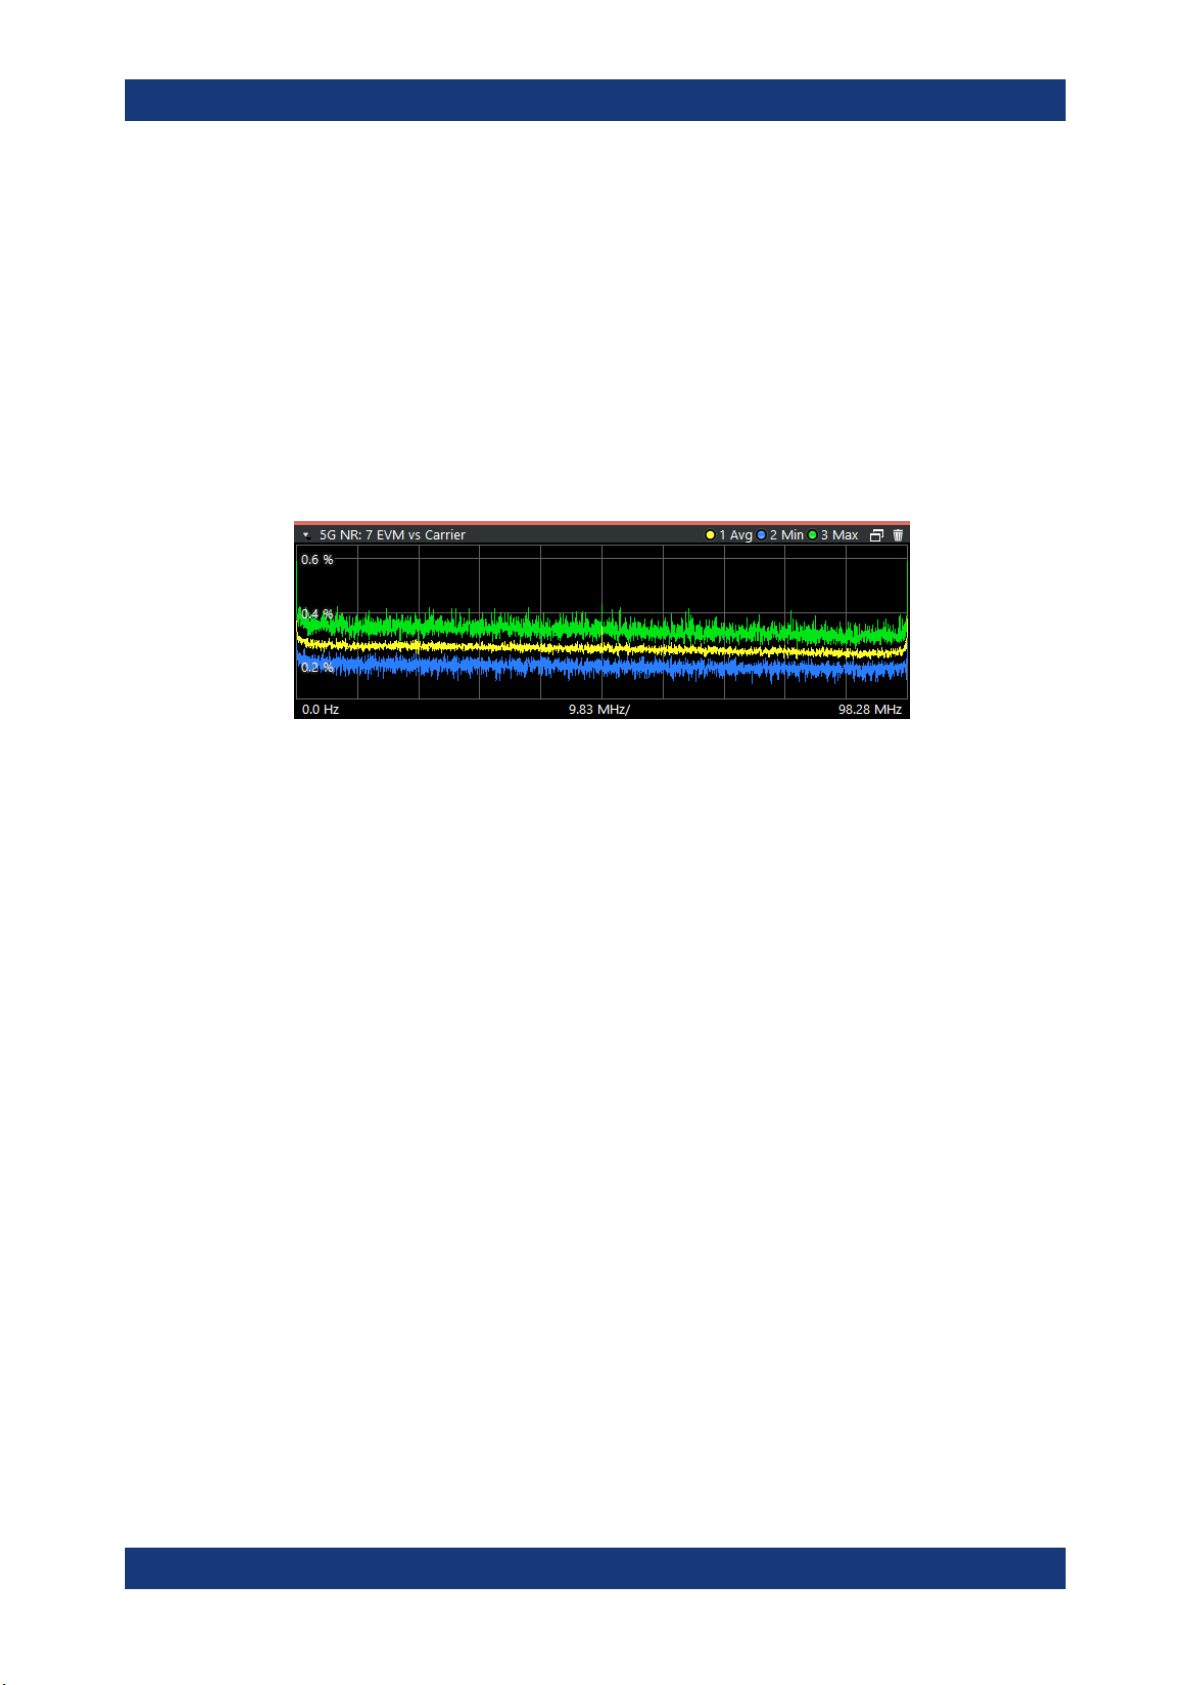
EVM vs Carrier
The "EVM vs Carrier" result display shows the error vector magnitude (EVM) of the
subcarriers. With the help of a marker, you can use it as a debugging technique to
identify any subcarriers whose EVM is too high.
The results are based on an average EVM that is calculated over the resource elements for each subcarrier. This average subcarrier EVM is determined for each analyzed slot in the capture buffer.
The contents of the result display depend on the evaluation range.
●
If you analyze all bandwidth parts (BWP), the result display contains a variable
number of traces that represent the bandwidth parts. The traces show the average
23User Manual 1178.9103.02 ─ 04
Page 24
R&S®VSE-K144
Measurements and Result Displays
I/Q Measurements
EVM of the corresponding signal part. The diagram header contains a legend that
shows the information that each trace carries.
●
If you analyze only one specific bandwidth part, or a single subframe, the diagram
contains three traces. The traces show the following information.
– The average subcarrier EVM over all slots in the selected signal part.
– The lowest subcarrier EVM over all slots in the selected signal part.
– The highest subcarrier EVM over all slots in the selected signal part.
●
If you analyze only a single slot, the diagram contains one trace. That trace shows
the subcarrier EVM for that slot only. Average, minimum and maximum values in
that case are the same.
The x-axis represents the center frequencies of the subcarriers. The y-axis shows the
EVM in % or in dB, depending on the EVM Unit.
Remote command:
Selection LAY:ADD ? '1',LEFT,EVCA
Query (y-axis): TRACe:DATA?
Query (x-axis): TRACe<n>[:DATA]:X? on page 185
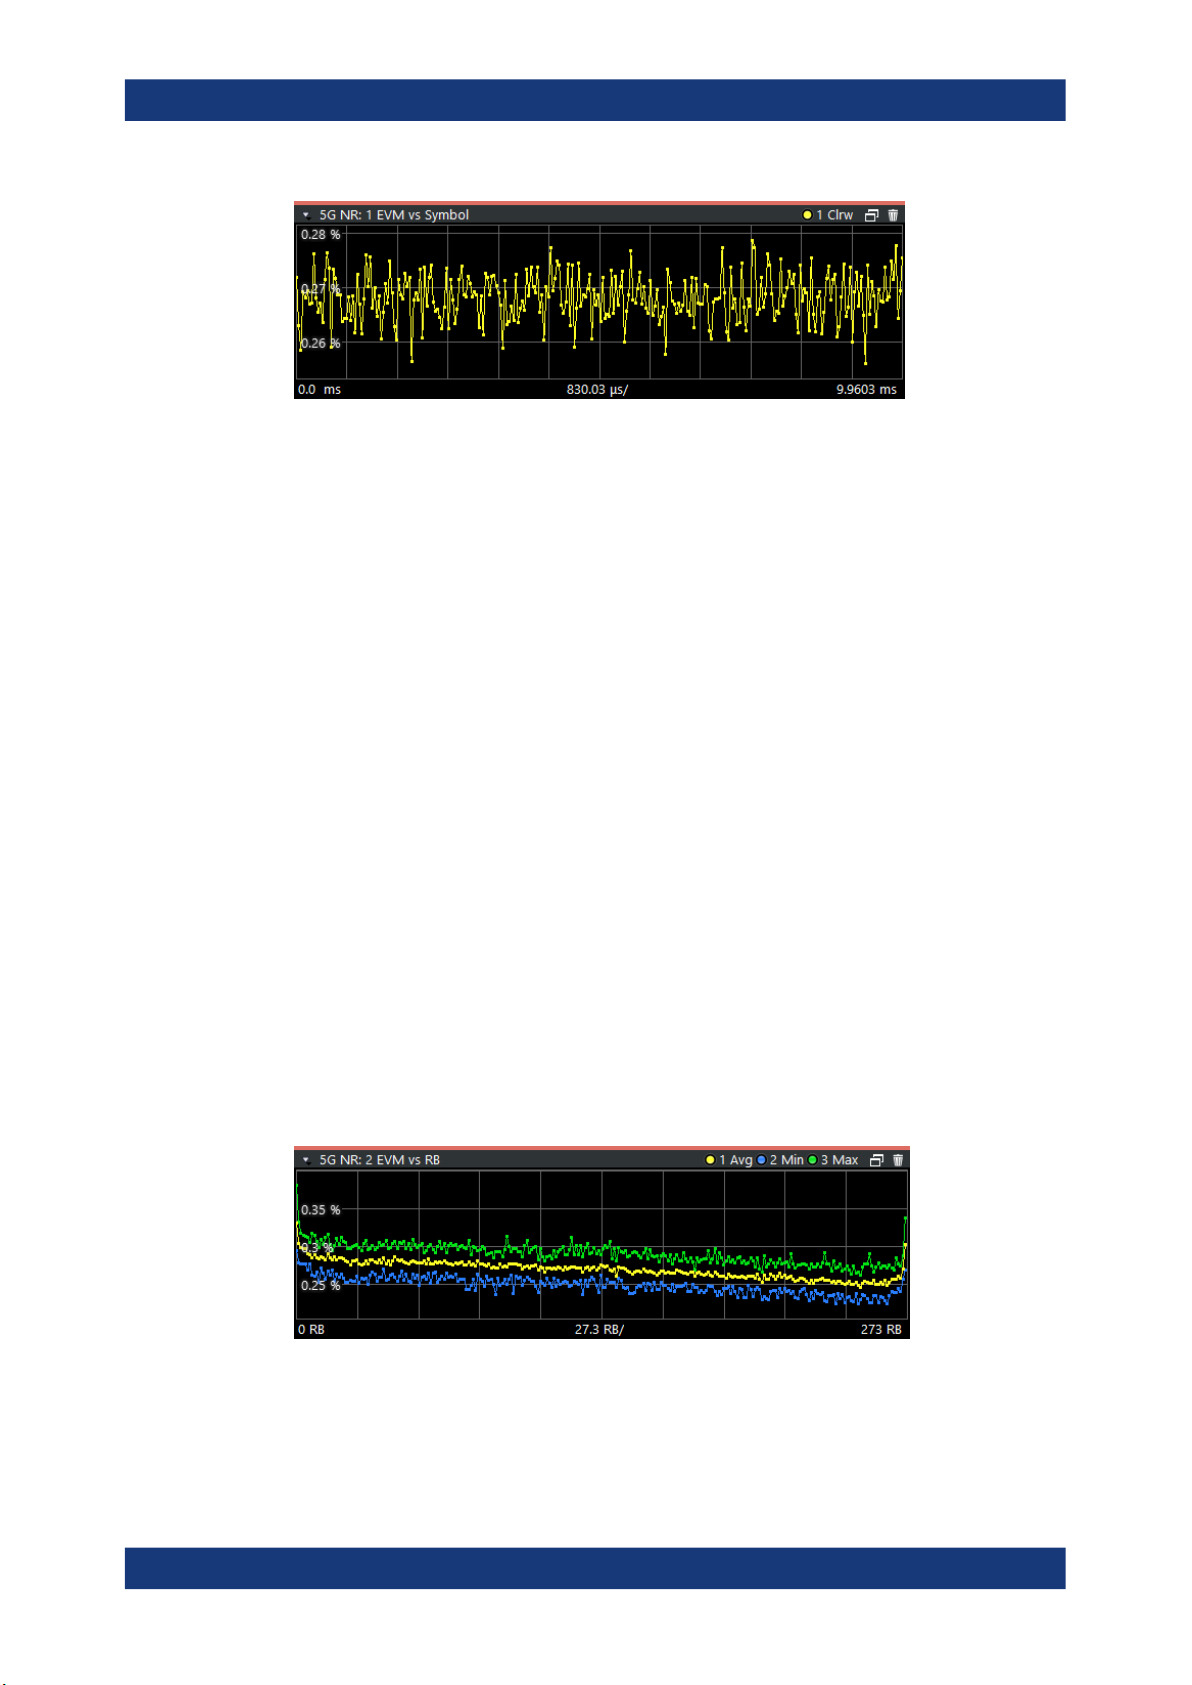
EVM vs Symbol
The "EVM vs Symbol" result display shows the error vector magnitude (EVM) of the
OFDM symbols. You can use it as a debugging technique to identify any symbols
whose EVM is too high.
The results are based on an average EVM that is calculated over the resource elements for each subcarrier. This average subcarrier EVM is determined for each analyzed slot in the capture buffer.
The contents of the result display depend on the evaluation range.
●
If you analyze all bandwidth parts (BWP), the result display contains a variable
number of traces that represent the bandwidth parts. The diagram header contains
a legend that shows the information that each trace carries.
●
If you analyze only one specific bandwidth part, a single subframe or a single slot,
the diagram contains one trace. That trace shows the average EVM of the symbols
in the selected signal part.
The x-axis represents the OFDM symbols, with each symbol represented by a dot on
the line. Any missing connections from one dot to another mean that the R&S VSE
could not determine the EVM for that symbol.
On the y-axis, the EVM is plotted either in % or in dB, depending on the EVM Unit.
24User Manual 1178.9103.02 ─ 04
Page 25
R&S®VSE-K144
Measurements and Result Displays
I/Q Measurements
Remote command:
Selection: LAY:ADD ? '1',LEFT,EVSY
Query (y-axis): TRACe:DATA?
Query (x-axis): TRACe<n>[:DATA]:X? on page 185
EVM vs RB
The "EVM vs RB" result display shows the Error Vector Magnitude (EVM) for all
resource blocks that can be occupied by the PDSCH.
The contents of the result display depend on the evaluation range.
●
If you analyze all bandwidth parts (BWP), the result display contains a variable
number of traces that represent the bandwidth parts. The traces show the average
EVM of the corresponding signal part. The diagram header contains a legend that
shows the information that each trace carries.
●
If you analyze only one specific bandwidth part, or a single subframe, the diagram
contains three traces. The traces show the following information.
– The average subcarrier EVM over all slots in the selected signal part.
– The lowest subcarrier EVM over all slots in the selected signal part.
– The highest subcarrier EVM over all slots in the selected signal part.
●
If you analyze only a single slot, the diagram contains one trace. That trace shows
the subcarrier EVM for that slot only. Average, minimum and maximum values in
that case are the same.
If you select and analyze one subframe only, the result display contains one trace that
shows the resource block EVM for that subframe only. Average, minimum and maximum values in that case are the same. For more information, see "Subframe Selec-
tion" on page 123.
The x-axis represents the PDSCH resource blocks. On the y-axis, the EVM is plotted
either in % or in dB, depending on the EVM Unit.
Remote command:
Selection: LAY:ADD ? '1',LEFT,EVRP
Query (y-axis): TRACe:DATA?
Query (x-axis): TRACe<n>[:DATA]:X? on page 185
25User Manual 1178.9103.02 ─ 04
Page 26
R&S®VSE-K144
Measurements and Result Displays
I/Q Measurements
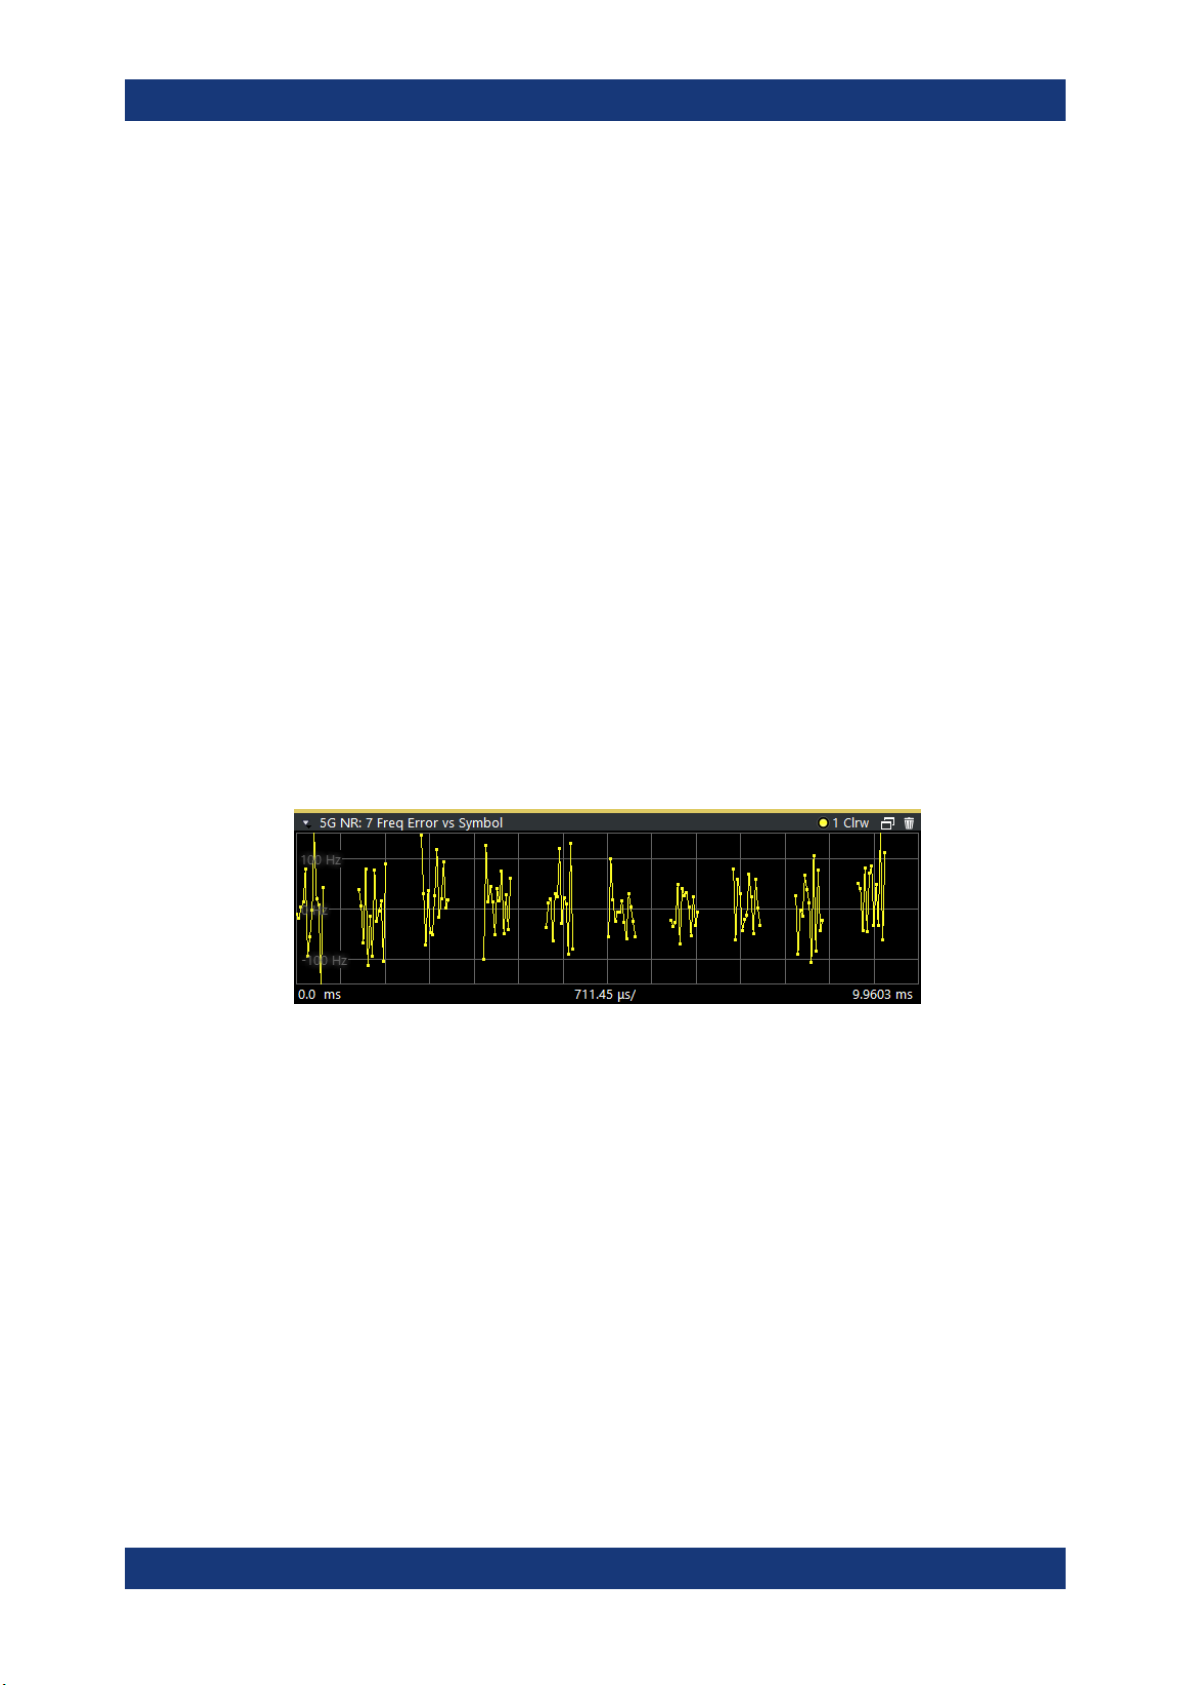
Frequency Error vs Symbol
Th e "Frequency Error vs Symbol" result display shows the frequency error of each
symbol. You can use it as a debugging technique to identify any frequency errors within
symbols.
The result is an average over all subcarriers in the symbol.
The contents of the result display depend on the evaluation range.
●
If you analyze all bandwidth parts (BWP), the result display contains a variable
number of traces that represent the bandwidth parts. The diagram header contains
a legend that shows the information that each trace carries.
●
If you analyze only one specific bandwidth part, a single subframe or a single slot,
the diagram contains one trace. That trace shows the average frequency error of
the symbols in the selected signal part.
The x-axis represents the OFDM symbols, with each symbol represented by a dot on
the line. The number of displayed symbols depends on the subframe selection. Any
missing connections from one dot to another mean that the R&S VSE could not determine the frequency error for that symbol.
On the y-axis, the frequency error is plotted in Hz.
Note that the variance of the measurement results in this result display can be much
higher compared to the frequency error display in the numerical result summary,
depending on the PDSCH and control channel configuration. The potential difference is
caused by the number of available resource elements for the measurement on symbol
level.
Remote command:
Selection: LAY:ADD ? '1',LEFT,FEVS
Query (y-axis): TRACe:DATA?
Query (x-axis): TRACe<n>[:DATA]:X? on page 185
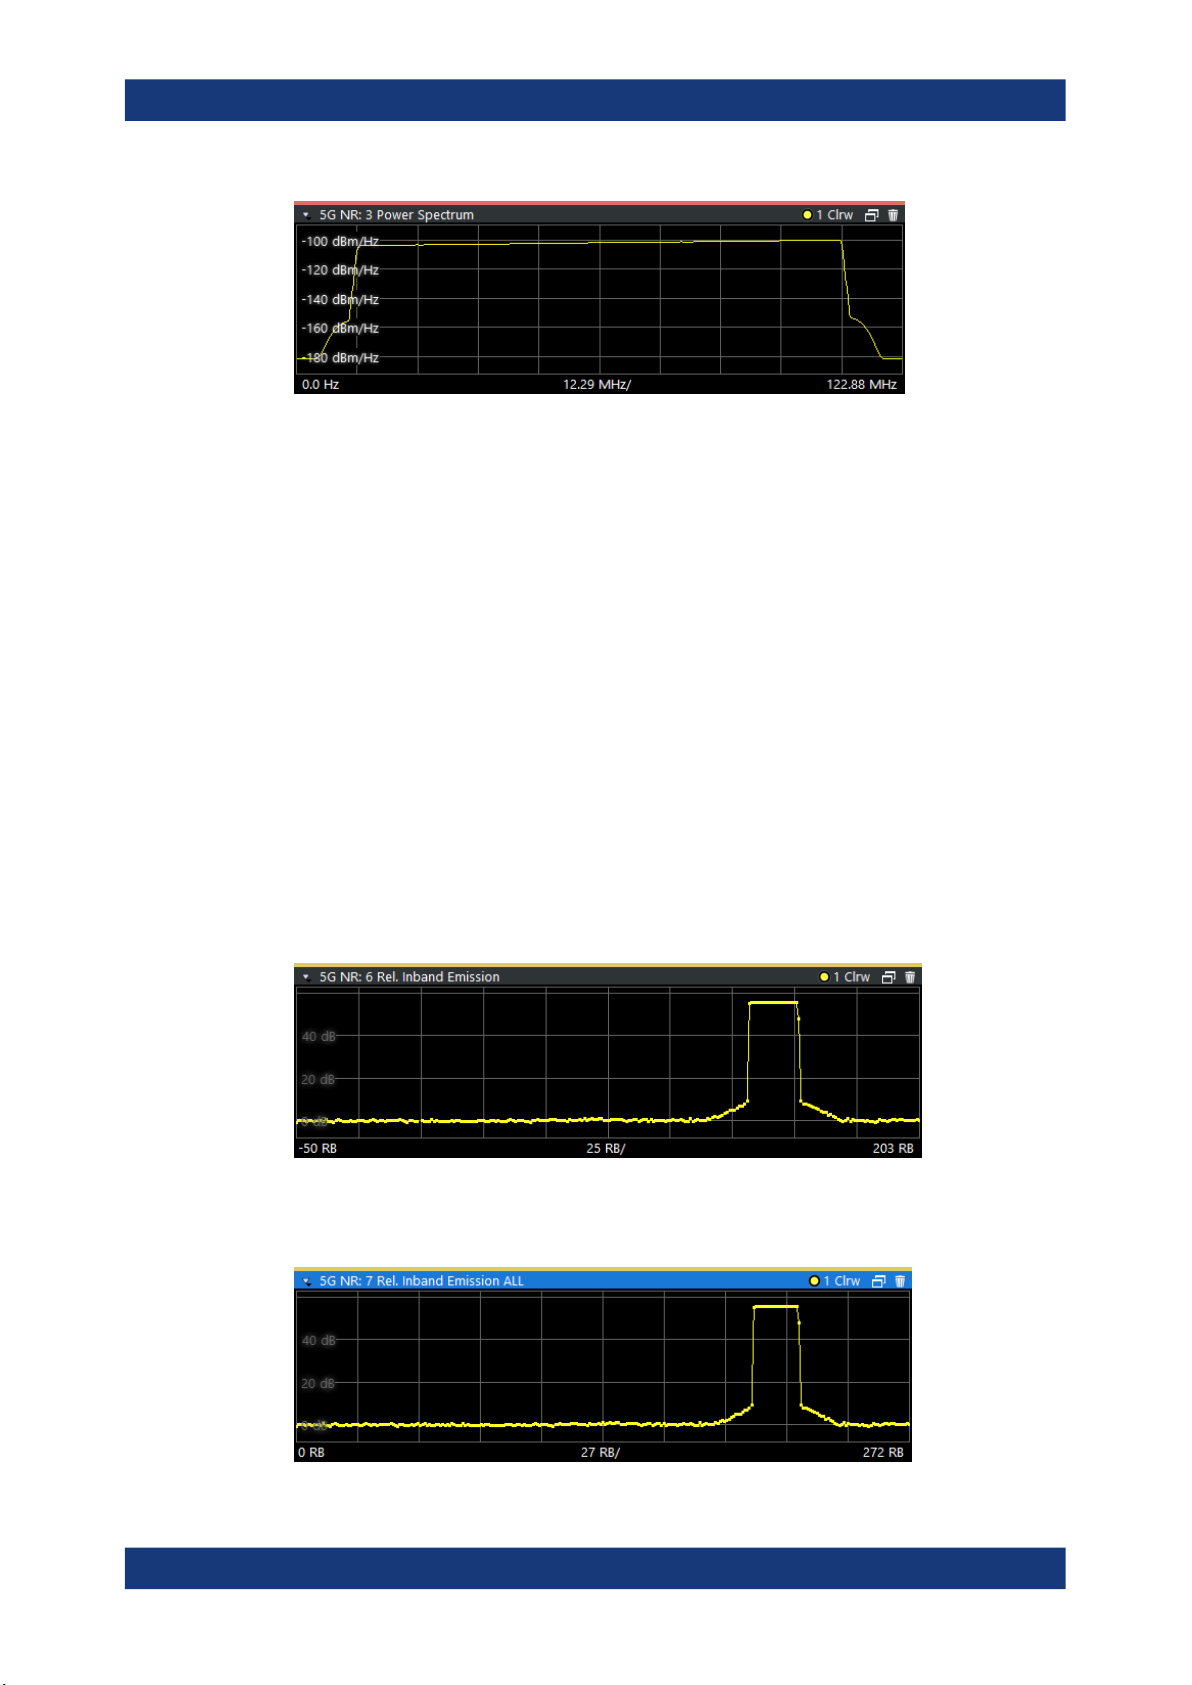
Power Spectrum
The "Power Spectrum" shows the power density of the complete capture buffer in
dBm/Hz.
The displayed bandwidth depends on the channel bandwidth.
The x-axis represents the frequency. On the y-axis, the power level is plotted.
26User Manual 1178.9103.02 ─ 04
Page 27
R&S®VSE-K144
Measurements and Result Displays
I/Q Measurements
Remote command:
Selection: LAY:ADD ? '1',LEFT,PSPE
Query (y-axis): TRACe:DATA?
Query (x-axis): TRACe<n>[:DATA]:X? on page 185
Inband Emission
The "Inband Emission" result display shows the power of the unused resource blocks
relative to the allocated resource blocks (yellow trace). The diagram also shows the
inband emission limit lines (red trace). The allocated resource blocks are not evaluated.
The evaluation method depends on the evaluation range:
●
To check against limits, you have evaluate all bandwidth parts, subframes and
slots. In that case, the measurement is evaluated over 10 subframes as defined by
3GPP. In addition, analyze a number of frames according to the standard and all
slots in the frame.
●
If you select a specific slot, the inband emissions are evaluated over a single slot.
In that case, however, the measurement does not check against limits.
You can only use a single PUSCH or PUCCH allocation to get results for the inband
emission.
Limits for the inband emission are specified in 3GPP 38.521-1/2.
You can also display the inband emissions for the allocated resource block in addition
to the unused resource blocks when you select the "Inband Emissions All" result display.
27User Manual 1178.9103.02 ─ 04
Page 28
R&S®VSE-K144
Measurements and Result Displays
I/Q Measurements
Remote command:
Selection: LAY:ADD ? '1',LEFT,IE
Selection: LAY:ADD ? '1',LEFT,IEA
Query (y-axis): TRACe:DATA?
Query (x-axis): TRACe<n>[:DATA]:X? on page 185
Limit check: CALCulate<n>:LIMit<li>:FAIL? on page 171
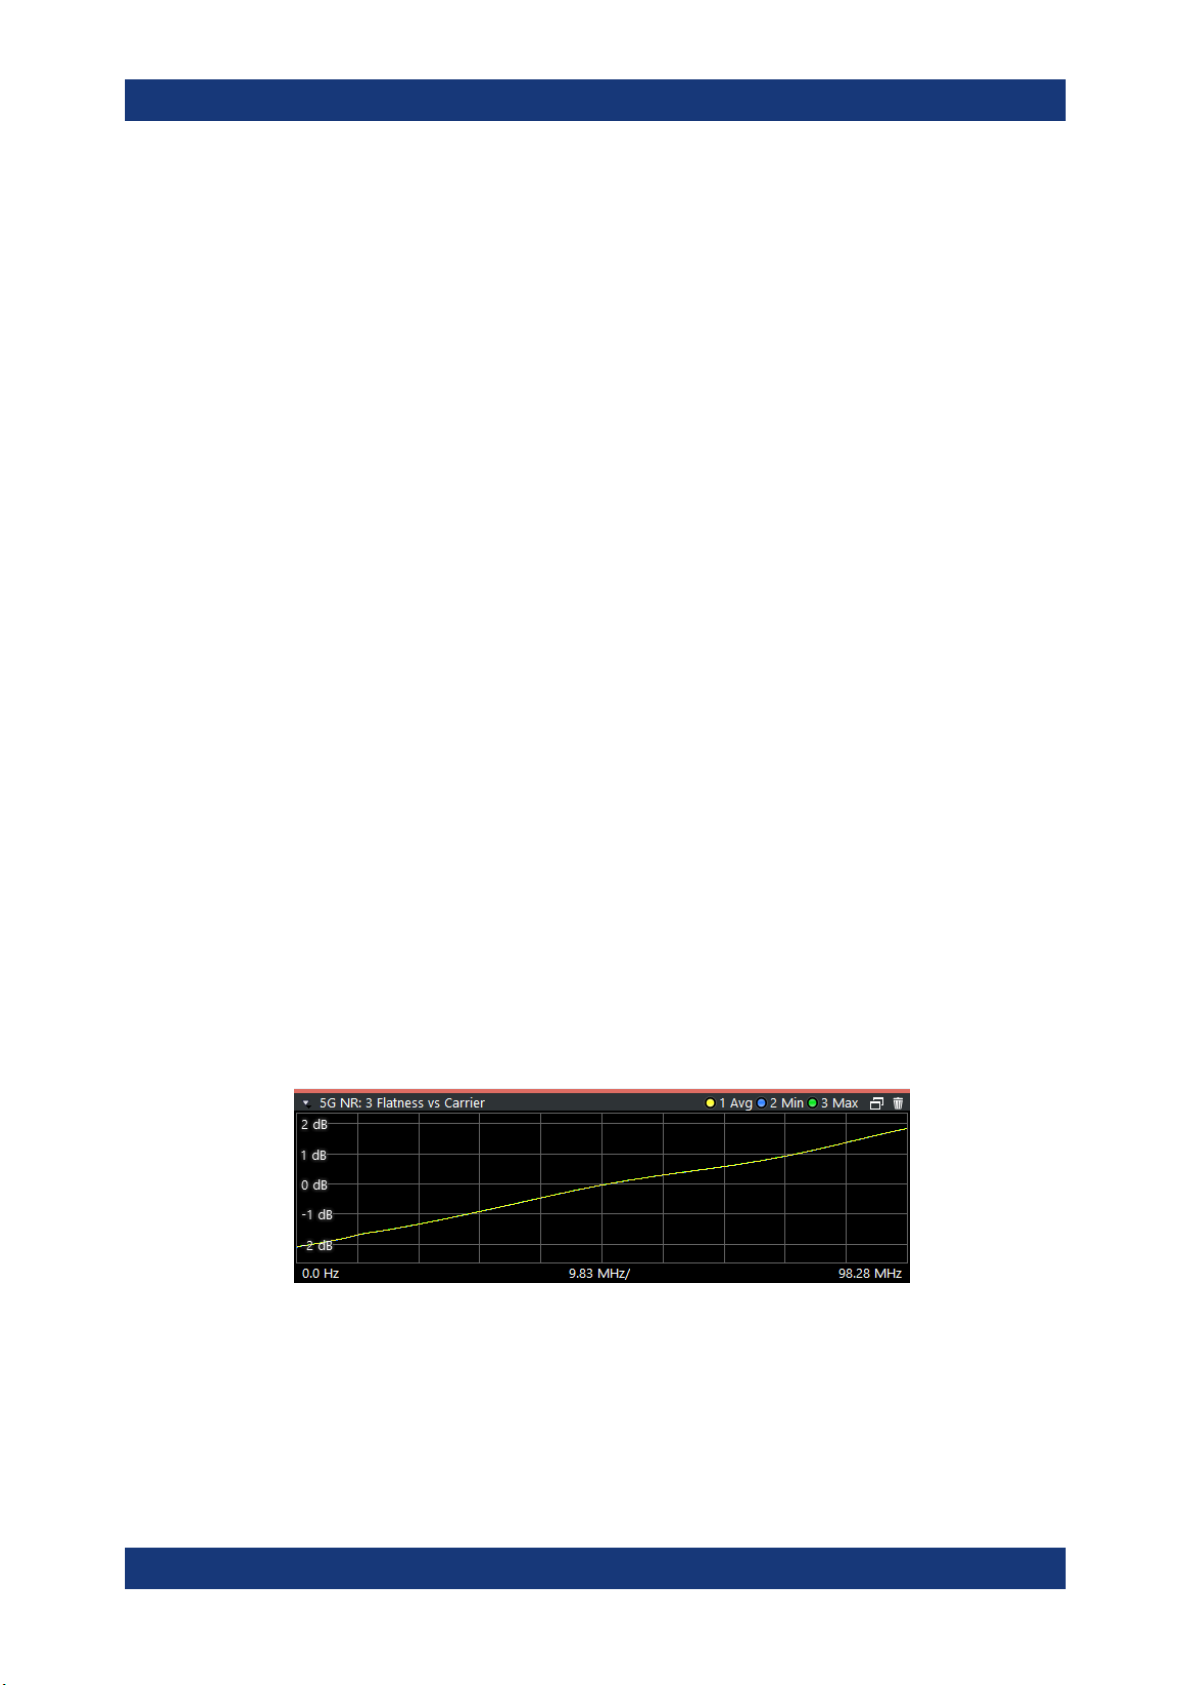
Flatness
The "Spectrum Flatness" result shows the relative power offset caused by the transmit
channel for each subcarrier.
The contents of the result display depend on the evaluation range.
●
If you analyze all bandwidth parts (BWP), the result display contains a variable
number of traces that represent the bandwidth parts. The traces show the average
flatness of the corresponding signal part. The diagram header contains a legend
that shows the information that each trace carries.
●
If you analyze only one specific bandwidth part, a specific frame or a single subframe, the diagram contains three traces. The traces show the following information.
– The average subcarrier flatness over all slots in the selected signal part.
– The lowest subcarrier flatness over all slots in the selected signal part.
– The highest subcarrier flatness over all slots in the selected signal part.
●
If you analyze only a single slot, the diagram contains one trace. That trace shows
the subcarrier flatness for that slot only. Average, minimum and maximum values in
that case are the same.
The x-axis represents the frequency. On the y-axis, the channel flatness is plotted in
dB.
The spectrum flatness is also tested against the limits defined by 3GPP. Limit evaluation is slot based, so the limit lines (red color) are only displayed in the diagram, if you
select a certain slot.
Limits are defined for each operating band. For single carrier scenarios, the R&S VSE
automatically determines the operating band based on the center frequency. For multi
carrier scenarios, make sure to select the correct operating band. The shape of the
limit line also depends on the operating conditions.
Remote command:
Selecting the result display: LAY:ADD ? '1',LEFT,SFL
Querying results:
TRACe:DATA?
TRACe<n>[:DATA]:X? on page 185
Limit check: CALCulate<n>:LIMit<li>:FAIL? on page 171
28User Manual 1178.9103.02 ─ 04
Page 29
R&S®VSE-K144
Measurements and Result Displays
I/Q Measurements
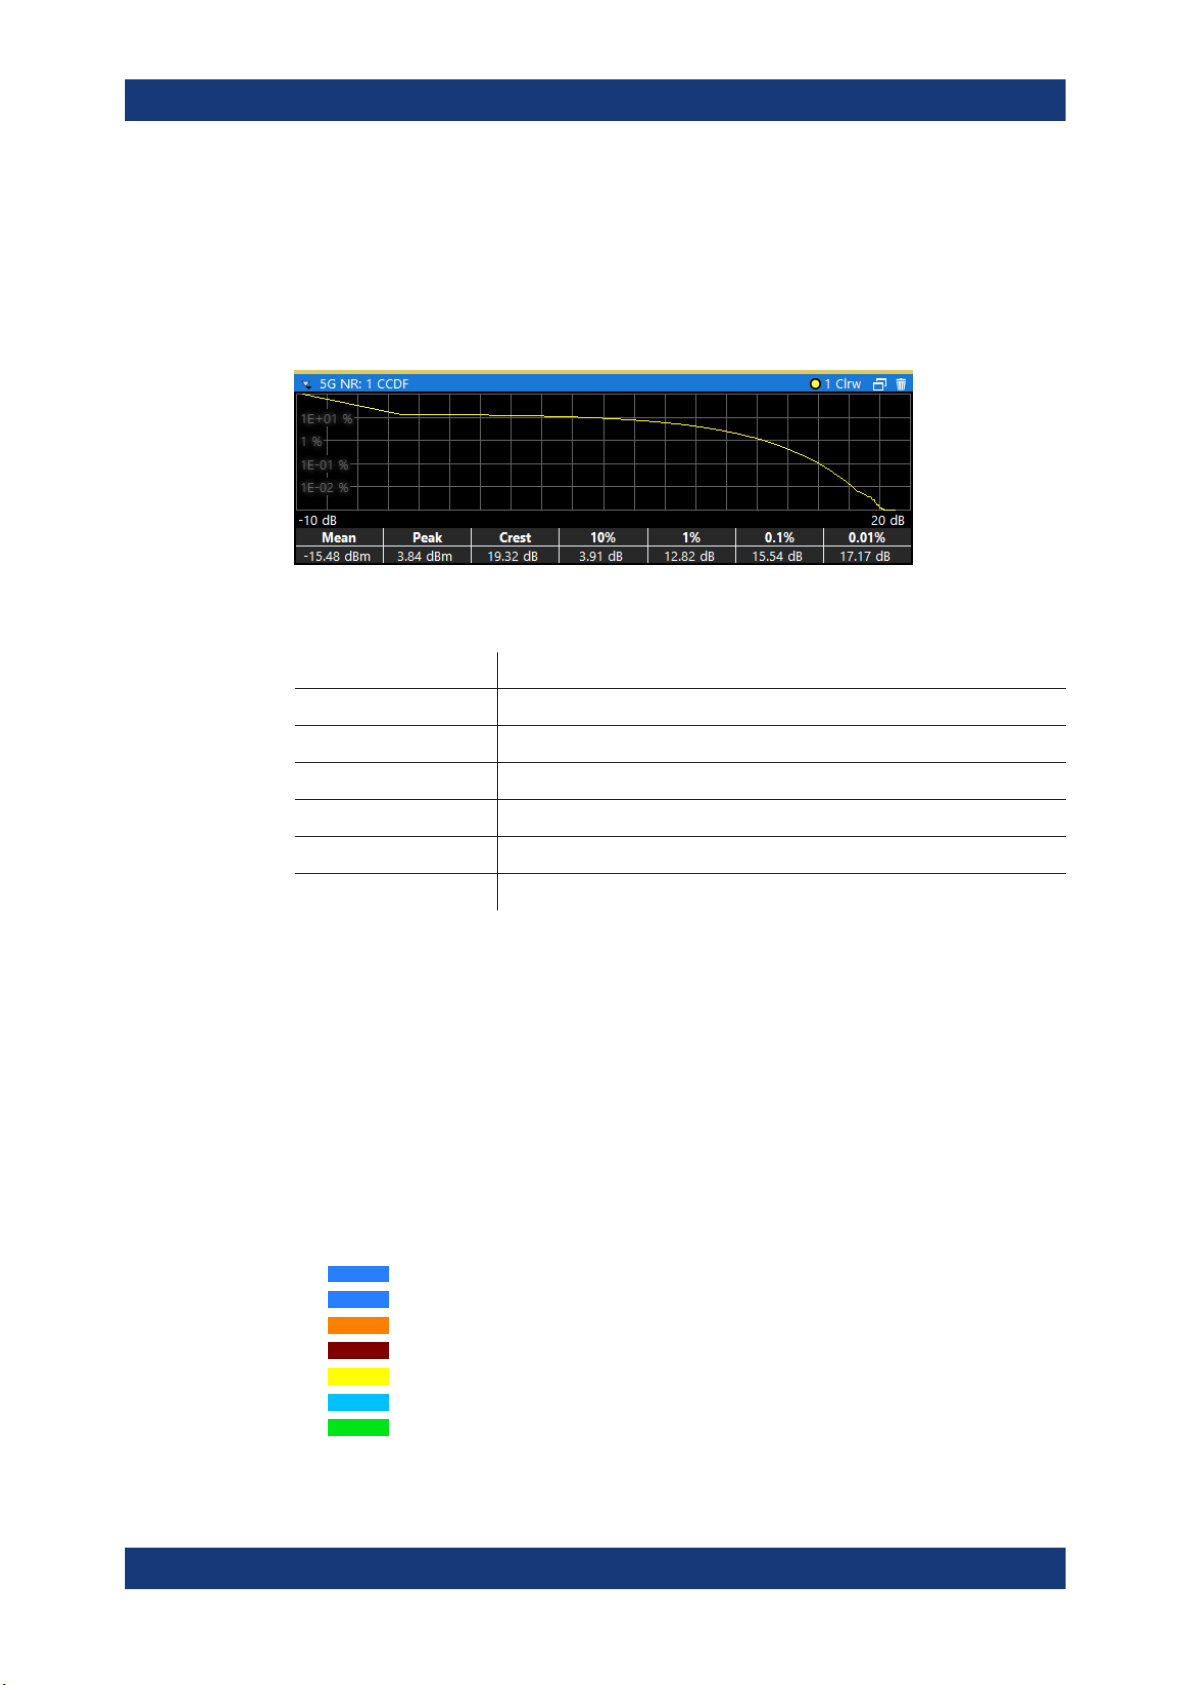
CCDF
The "Complementary Cumulative Distribution Function (CCDF)" shows the probability
of an amplitude exceeding the mean power. For the measurement, the complete capture buffer is used.
The x-axis represents the power relative to the measured mean power. On the y-axis,
the probability is plotted in %.
In addition to the diagram, the results for the CCDF measurement are summarized in
the CCDF table.
Mean Mean power
Peak Peak power
Crest Crest factor (peak power – mean power)
10 % 10 % probability that the level exceeds mean power + [x] dB
1 % 1 % probability that the level exceeds mean power + [x] dB
0.1 % 0.1 % probability that the level exceeds mean power + [x] dB
0.01 % 0.01 % probability that the level exceeds mean power + [x] dB
Remote command:
Selection: LAY:ADD ? '1',LEFT,CCDF
Query (y-axis): TRACe:DATA?
Numerical results: CALCulate<n>:STATistics:CCDF:X<t>? on page 161
Numerical results: CALCulate<n>:STATistics:RESult<res>? on page 161
Constellation Diagram
The "Constellation Diagram" shows the in-phase and quadrature phase results and is
an indicator of the quality of the modulation of the signal.
In the default state, the result display evaluates the full range of the measured input
data.
Each color represents a modulation type.
●
●
●
●
●
●
●
: RBPSK
: pi/2-BPSK
: QPSK
: 16QAM
: 64QAM
: 256QAM
: PSK (CAZAC)
You can filter the results by changing the evaluation range.
29User Manual 1178.9103.02 ─ 04
Page 30
R&S®VSE-K144
Measurements and Result Displays
I/Q Measurements
The constellation diagram shows the number of points that are displayed in the diagram.
Remote command:
Selection: LAY:ADD ? '1',LEFT,CONS
Query: TRACe:DATA?
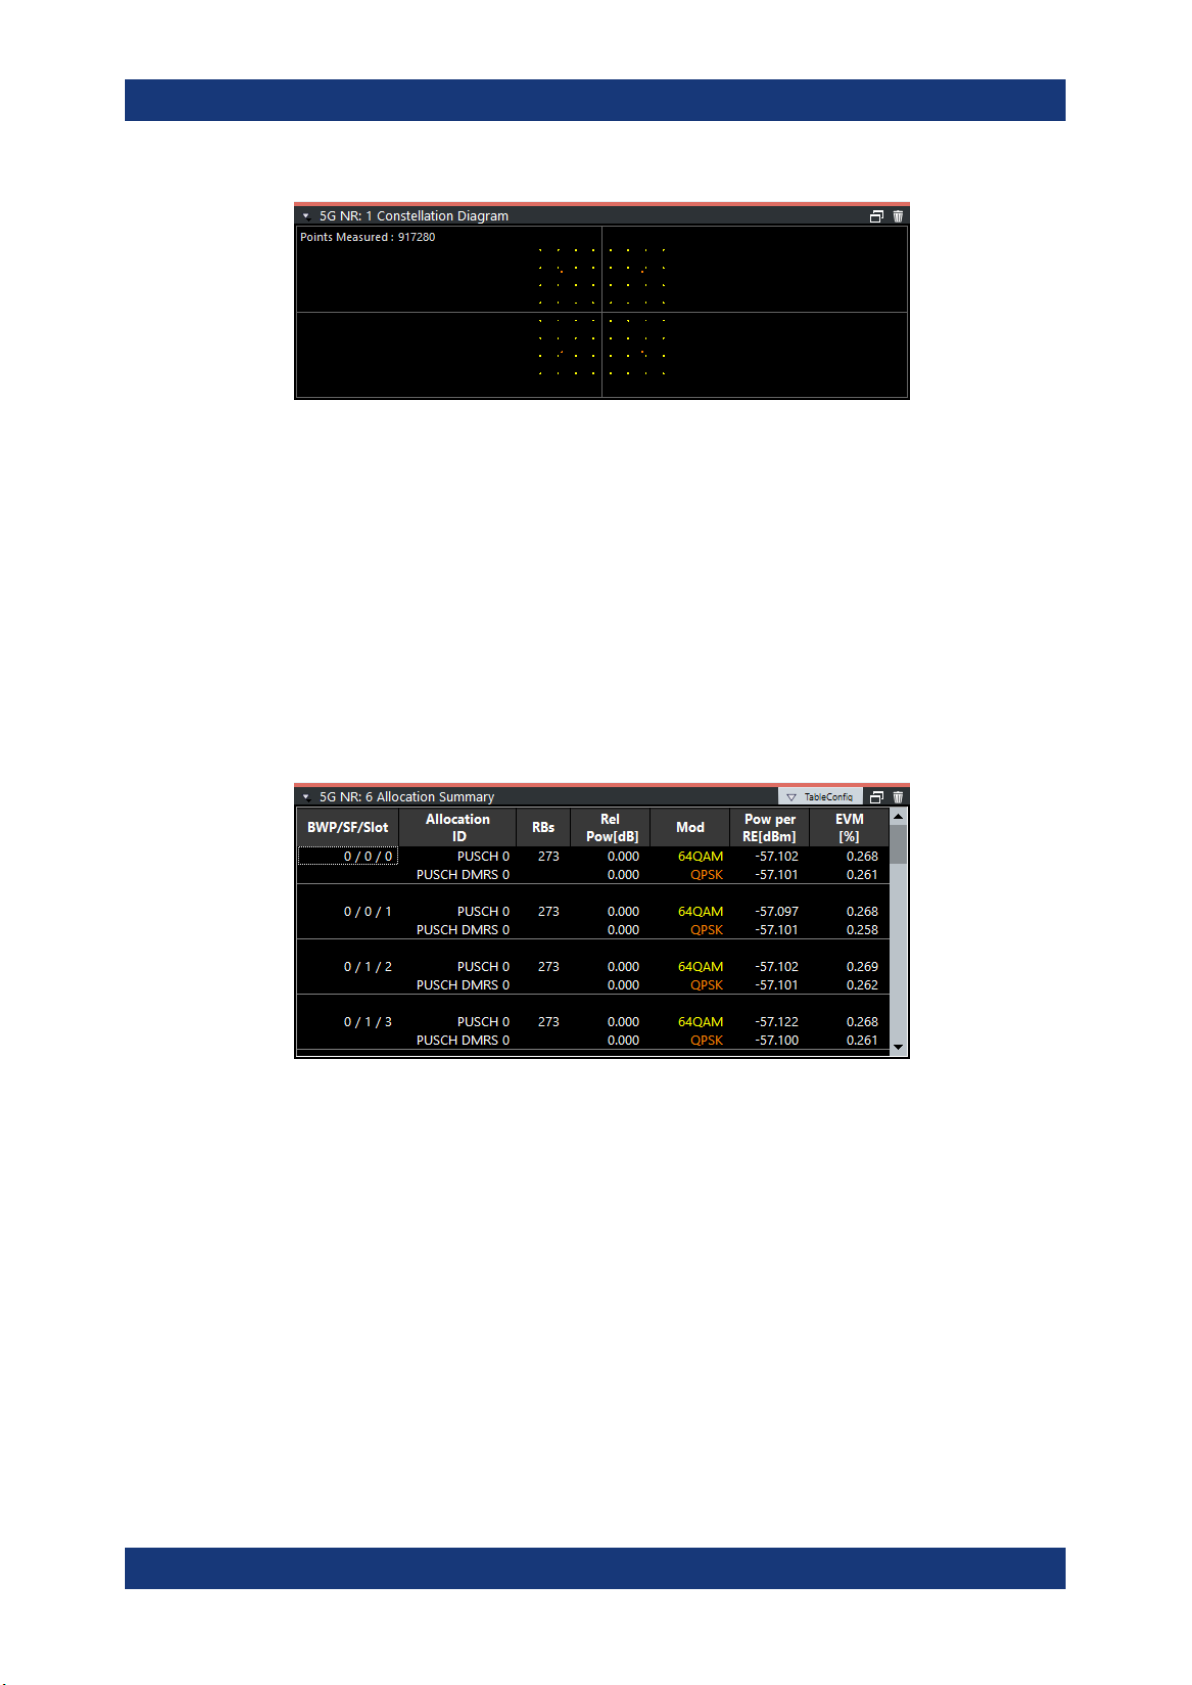
Allocation Summary
The "Allocation Summary" shows various parameters of the measured allocations in a
table.
Each row in the allocation table corresponds to an allocation. A set of several allocations make up a slot. A horizontal line indicates the beginning of a new slot. Special
allocations summarize the characteristics of all allocations in a bandwidth part ("BWP
ALL") and the radio frame ("TOTAL ALL").
The columns of the table show the following properties for each allocation.
●
The location of the allocation (slot, subframe, bandwidth part number).
●
The ID of the allocation (channel type).
●
Number of resource blocks used by the allocation.
●
The relative power of the allocation in dB.
●
The modulation of the allocation.
●
The power of each resource element in the allocation in dBm.
●
The EVM of the allocation.
The unit depends on the EVM unit
Select "TableConfig" to open a dialog box that allows you to add and remove columns.
Remote command:
Selection: LAY:ADD ? '1',LEFT,ASUM
Query: TRACe:DATA?
30User Manual 1178.9103.02 ─ 04
Page 31

R&S®VSE-K144
Measurements and Result Displays
I/Q Measurements
Bitstream
The "Bitstream" shows the demodulated data stream for the data allocations.
Depending on the demodulated data property, the numbers represent either bits (after
decoding) or symbols (before decoding).
For the bit format, each number represents one raw bit. For the symbol format, the bits
that belong to one symbol are shown as hexadecimal numbers with two digits.
Resource elements that do not contain data or are not part of the transmission are rep-
resented by a "-".
The table contains the following information:
●
BWP / Sf / Slot
Number of the bandwidth part, subframe and slot the bits belong to.
●
Allocation ID
Channel the bits belong to.
This is the PUSCH allocation.
●
Codeword
Code word of the allocation.
●
Modulation
Modulation type of the channels.
●
# Symbols / # Bits
Number of symbols in the allocation.
●
Bit Stream
The actual bit stream.
The table only shows the first few bits for each slot. If you want to see the complete
bitstream, you have to select a certain bandwidth part, subframe and slot from the
evaluation range. When you have done that, you can select "Extended" bitstream
from the header row.
Figure 3-2: Compact vs extended bitstream (symbol format for coded data)
In the extended display, the "# Symbols" / "# Bits" column turns into the "Bit Index"
or "Symbol Index" column, which indicates the position of the table row's first bit or
symbol within the complete stream.
If you decode the payload data, the R&S VSE shows the number of coded bits (#
symbols * Number of bits per symbol) and the number of bit errors at the end of the
31User Manual 1178.9103.02 ─ 04
Page 32

R&S®VSE-K144
Measurements and Result Displays
I/Q Measurements
bitstream. The number of info bits transmitted by the PDCCH is displayed in a dedi-
cated column ("# Bits").
Remote command:
Selection: LAY:ADD ? '1',LEFT,BSTR
Query: TRACe:DATA?
EVM vs Symbol x Carrier
The "EVM vs Symbol x Carrier" result display shows the EVM for each carrier in each
symbol.
The x-axis represents the symbols. The y-axis represents the subcarriers. Different colors in the diagram area represent the EVM. A color map in the diagram header indicates the corresponding power levels.
Remote command:
Selection: LAY:ADD ? '1',LEFT,EVSC
Query: TRACe:DATA?
Power vs Symbol x Carrier
The "Power vs Symbol x Carrier" result display shows the power for each carrier in
each symbol.
The x-axis represents the symbols. The y-axis represents the subcarriers. Different colors in the diagram area represent the power. A color map in the diagram header indicates the corresponding power levels.
Remote command:
Selection: LAY:ADD ? '1',LEFT,PVSC
Query: TRACe:DATA?
Allocation ID vs Symbol x Carrier
The "Allocation ID vs Symbol x Carrier" result display is a graphical representation of
the structure of the analyzed frame. It shows the allocation type of each subcarrier in
each symbol of the received signal.
The x-axis represents the OFDM symbols. The y-axis represents the subcarriers.
32User Manual 1178.9103.02 ─ 04
Page 33

R&S®VSE-K144
Measurements and Result Displays
I/Q Measurements
Each type of allocation is represented by a different color. The legend above the diagram indicates the colors used for each allocation. You can also use a marker to get
more information about the type of allocation.
Remote command:
Selection: LAY:ADD ? '1',LEFT,AISC
Query: TRACe:DATA?
Marker Table
Displays a table with the current marker values for the active markers.
This table is displayed automatically if configured accordingly.
Wnd Shows the window the marker is in.
Type Shows the marker type and number ("M" for a nor-
mal marker, "D" for a delta marker).
Trc Shows the trace that the marker is positioned on.
Ref Shows the reference marker that a delta marker
refers to.
X- / Y-Value Shows the marker coordinates (usually frequency
and level).
Z-EVM
Z-Power
Z-Alloc ID
Shows the EVM, power and allocation type at the
marker position.
Only in 3D result displays (for example "EVM vs
Symbol x Carrier").
Remote command:
LAY:ADD? '1',RIGH, MTAB, see LAYout:ADD[:WINDow]? on page 136
Results:
CALCulate<n>:MARKer<m>:X on page 158
CALCulate<n>:MARKer<m>:Y on page 159
CALCulate<n>:MARKer<m>:Z? on page 159
CALCulate<n>:MARKer<m>:Z:ALL? on page 160
33User Manual 1178.9103.02 ─ 04
Page 34

R&S®VSE-K144
3.6 PRACH Analysis
Measurements and Result Displays
PRACH Analysis
Access: [MEAS] > "PRACH Analysis"
You can select the result displays from the evaluation bar and arrange them as you like
with the SmartGrid functionality.
Remote command:
Measurement selection: CONFigure[:NR5G]:MEASurement on page 186
Result display selection: LAYout:ADD[:WINDow]? on page 136
The following result displays carry the same information as those available for I/Q measurements, but for the preambles:
●
Capture buffer
●
Power spectrum
●
Constellation diagram
●
Marker table
The contents of the numerical result summary are similar (fewer result are available for
PRACH analysis). For a comprehensive description, see .
Spectrum Flatness
The "Spectrum Flatness" result shows the relative power offset caused by the transmit
channel for each subcarrier.
The contents of the result display depend on the evaluation range.
●
If you analyze all preambles, the diagram contains three traces. The traces show
the following information.
– The average subcarrier flatness over all preambles in the selected signal part.
– The lowest subcarrier flatness over all preambles in the selected signal part.
– The highest subcarrier flatness over all preambles in the selected signal part.
●
If you analyze only a single preamble, the diagram contains one trace. That trace
shows the subcarrier flatness for that preamble only. Average, minimum and maxi-
mum values in that case are the same.
The x-axis represents the frequency. On the y-axis, the channel flatness is plotted in
dB.
Remote command:
Selecting the result display: LAY:ADD ? '1',LEFT,FVCA
Querying results:
TRACe:DATA?
TRACe<n>[:DATA]:X? on page 185
PRACH Allocation Summary
The "Allocation Summary" shows various parameters of the measured allocations in a
table.
Each row in the allocation table corresponds to a preamble. A set of several preambles
make up the PRACH. The last row summarizes the characteristics of all preambles in
the PRACH ("TOTAL ALL").
34User Manual 1178.9103.02 ─ 04
Page 35

R&S®VSE-K144
3.7 Frequency Sweep Measurements
Measurements and Result Displays
Frequency Sweep Measurements
The columns of the table show the following properties for each allocation.
●
An index number of the preamble.
●
The allocation ID (always "PRACH").
●
Number of resource blocks used by the preamble, expressed as number of
resource blocks for PUSCH.
●
The relative power of the preamble in dB.
●
The modulation of the preamble (always "CAZAC").
●
The power of the preamble in dBm.
●
The EVM of the preamble.
The unit depends on the EVM unit
Select "TableConfig" to open a dialog box that allows you to add and remove columns.
Remote command:
Selection: LAY:ADD ? '1',LEFT,ASUM
Query: TRACe:DATA?
Access (ACLR): [MEAS] > "Channel Power ACLR"
Access (SEM): [MEAS] > "Spectrum Emission Mask"
The 5G NR aplication supports the following frequency sweep measurements.
●
Adjacent channel leakage ratio (ACLR)
●
Spectrum emission mask (SEM)
Frequency sweep measurements also capture and process I/Q data to analyze a signal.
Make sure to have sufficient bandwidth to be able to capture the whole signal, including neighboring channels.
Features of the frequency sweep measurements:
●
SEM measurements use the FFT sweep type by default. For more information, see
the R&S VSE user manual.
●
Gated trigger is possible by using I/Q files for the ACLR and SEM.
In addition to the specific diagrams and table (see description below), frequency sweep
measurements support the following result displays.
●
" Marker Table " on page 33
●
Marker peak list
Both result displays have the same contents as the spectrum application.
Remote command:
Measurement selection: CONFigure[:NR5G]:MEASurement on page 186
Result display selection: LAYout:ADD[:WINDow]? on page 136
Adjacent Channel Leakage Ratio (ACLR).....................................................................36
└ Result diagram................................................................................................36
└ Result summary..............................................................................................36
35User Manual 1178.9103.02 ─ 04
Page 36

R&S®VSE-K144
Measurements and Result Displays
Frequency Sweep Measurements
Spectrum Emission Mask (SEM).................................................................................. 37
└ Result diagram................................................................................................37
└ Result summary..............................................................................................37
Marker Peak List .......................................................................................................... 38
Adjacent Channel Leakage Ratio (ACLR)
The adjacent channel leakage ratio (ACLR) measurement is designed to analyze signals that contain multiple signals for different radio standards. Using the ACLR measurement, you can determine the power of the transmit (Tx) channel and the power of
the neighboring (adjacent) channels to the left and right of the Tx channel. Thus, the
ACLR measurement provides information about the power in the adjacent channels as
well as the leakage into these adjacent channels.
When you measure the ACLR in the 5G NR application, the R&S VSE automatically
selects appropriate ACLR settings based on the selected channel bandwidth.
For a comprehensive description of the ACLR measurement, refer to the user manual
of the R&S VSE.
Remote command:
Selection: CONFigure[:NR5G]:MEASurement on page 186
Result diagram ← Adjacent Channel Leakage Ratio (ACLR)
The result diagram is a graphic representation of the signals with a trace that shows
the measured signal. Individual channels (Tx and adjacent channels) are indicated by
vertical lines and corresponding labels.
In addition, the R&S VSE highlights the channels (blue: Tx channel, green: adjacent
channels).
The x-axis represents the frequency with a frequency span that relates to the specified
5G NR channel and adjacent channel bandwidths. On the y-axis, the power is plotted
in dBm.
The power for the Tx channel is an absolute value in dBm. The power of the adjacent
channels is relative to the power of the Tx channel.
In addition, the R&S VSE tests the ACLR measurement results against the limits
defined by 3GPP.
Remote command:
Result query: TRACe:DATA?
Result summary ← Adjacent Channel Leakage Ratio (ACLR)
The result summary shows the signal characteristics in numerical form. Each row in
the table corresponds to a certain channel type (Tx, adjacent channel). The columns
contain the channel characteristics.
●
Channel
Shows the channel type (Tx, adjacent or alternate channel).
●
Bandwidth
Shows the channel bandwidth.
●
Offset
Shows the channel spacing.
●
Power
Shows the power of the Tx channel.
36User Manual 1178.9103.02 ─ 04
Page 37

R&S®VSE-K144
Measurements and Result Displays
Frequency Sweep Measurements
●
Lower / Upper
Shows the relative power of the lower and upper adjacent and alternate channels.
The values turn red if the power violates the limits.
Remote command:
Result query: CALCulate<n>:MARKer<m>:FUNCtion:POWer<sb>:RESult[:
CURRent]?
Limit check: CALCulate<n>:LIMit<li>:FAIL? on page 171
Spectrum Emission Mask (SEM)
The "Spectrum Emission Mask" (SEM) measurement shows the quality of the measured signal by comparing the power values in the frequency range near the carrier
against a spectral mask that is defined by the 3GPP specifications. In this way, you can
test the performance of the DUT and identify the emissions and their distance to the
limit.
For a comprehensive description of the SEM measurement, refer to the user manual of
the R&S VSE.
Remote command:
Selection: CONFigure[:NR5G]:MEASurement on page 186
Result diagram ← Spectrum Emission Mask (SEM)
The result diagram is a graphic representation of the signal with a trace that shows the
measured signal. The SEM is represented by a red line.
If any measured power levels are above that limit line, the test fails. If all power levels
are inside the specified limits, the test passes. The application labels the limit line to
indicate whether the limit check has passed or failed.
The x-axis represents the frequency with a frequency span that relates to the specified
5G NR channel bandwidths. The y-axis shows the signal power in dBm.
Remote command:
Result query: TRACe:DATA?
Result summary ← Spectrum Emission Mask (SEM)
The result summary shows the signal characteristics in numerical form. Each row in
the table corresponds to a certain SEM range. The columns contain the range characteristics. If a limit fails, the range characteristics turn red.
●
Start / Stop Freq Rel
Shows the start and stop frequency of each section of the spectrum emission mask
relative to the center frequency.
●
RBW
Shows the resolution bandwidth of each section of the spectrum emission mask.
●
Freq at Δ to Limit
Shows the absolute frequency whose power measurement being closest to the
limit line for the corresponding frequency segment.
●
Power Abs
Shows the absolute measured power of the frequency whose power is closest to
the limit. The application evaluates this value for each frequency segment.
●
Power Rel
37User Manual 1178.9103.02 ─ 04
Page 38

R&S®VSE-K144
Measurements and Result Displays
Reference: Custom Limits
Shows the distance from the measured power to the limit line at the frequency
whose power is closest to the limit. The application evaluates this value for each
frequency segment.
●
Δ to Limit
Shows the minimal distance of the tolerance limit to the SEM trace for the corre-
sponding frequency segment. Negative distances indicate that the trace is below
the tolerance limit, positive distances indicate that the trace is above the tolerance
limit.
Marker Peak List
The marker peak list determines the frequencies and levels of peaks in the spectrum or
time domain. How many peaks are displayed can be defined, as well as the sort order.
In addition, the detected peaks can be indicated in the diagram. The peak list can also
be exported to a file for analysis in an external application.
Remote command:
LAY:ADD? '1',RIGH, PEAK, see LAYout:ADD[:WINDow]? on page 136
Results:
CALCulate<n>:MARKer<m>:X on page 158
CALCulate<n>:MARKer<m>:Y on page 159
3.8 Reference: Custom Limits
The R&S VSE checks various results against the limits defined by 3GPP. For some of
those limits, you can define custom limits.
I/Q measurement result summary
●
EVM PDSCH QPSK / 16QAM / 64QAM / 256QAM
●
EVM PUSCH PI/2 BPSK / QPSK / 16QAM / 64QAM
●
EVM PUSCH DMRS PI/2 BPSK / QPSK / 16QAM / 64QAM
●
EVM PUCCH
Limit values are stored in an xml file that combines the limits for downlink and uplink.
The file name must be Default.nr5G_limits and is located in the following directory:
38User Manual 1178.9103.02 ─ 04
Page 39

R&S®VSE-K144
Measurements and Result Displays
Reference: Custom Limits
C:\R_S\instr\user\NR5G\
The R&S VSE automatically applies the custom limits after you have copied the file
and restarted the R&S VSE
The structure of the file is as follows. You can omit any xml elements you do not want
to define, either by making no entry or by deleting the corresponding element.
<Limits>
<DL>
<EVM>
<PDSCHQPSK Mean="0.185"></PDSCHQPSK>
<!--Unit: linear (1 = 0 dB, 0.1 = -20 dB)-->
<PDSCH16QAM Mean="0.135"></PDSCH16QAM>
<!--Unit: linear (1 = 0 dB, 0.1 = -20 dB)-->
<PDSCH64QAM Mean="0.09"></PDSCH64QAM>
<!--Unit: linear (1 = 0 dB, 0.1 = -20 dB)-->
<PDSCH256QAM Mean="0.045"></PDSCH256QAM>
<!--Unit: linear (1 = 0 dB, 0.1 = -20 dB)-->
</EVM>
<TimeAlignmentError Limit="90"></TimeAlignmentError>
<!--Unit [ns]-->
<OffPowSpectralDensity Limit="-82.5"></OffPowSpectralDensity>
<!--Unit: [dBm/MHz]-->
</DL>
<UL>
<EVM>
<PUSCHPI_2BPSK Max="0.3"></PUSCHPI_2BPSK>
<!--Unit: linear (1 = 0 dB, 0.1 = -20 dB)-->
<PUSCHQPSK Max="0.175"></PUSCHQPSK>
<!--Unit: linear (1 = 0 dB, 0.1 = -20 dB)-->
<PUSCH16QAM Max="0.125"></PUSCH16QAM>
<!--Unit: linear (1 = 0 dB, 0.1 = -20 dB)-->
<PUSCH64QAM Max="0.08"></PUSCH64QAM>
<!--Unit: linear (1 = 0 dB, 0.1 = -20 dB)-->
<DMRSPUSCHPI_2BPSK Mean="0.3"></DMRSPUSCHPI_2BPSK>
<!--Unit: linear (1 = 0 dB, 0.1 = -20 dB)-->
<DMRSPUSCHQPSK Mean="0.175"></DMRSPUSCHQPSK>
<!--Unit: linear (1 = 0 dB, 0.1 = -20 dB)-->
<DMRSPUSCH16QAM Mean="0.125"></DMRSPUSCH16QAM>
<!--Unit: linear (1 = 0 dB, 0.1 = -20 dB)-->
<DMRSPUSCH64QAM Mean="0.08"></DMRSPUSCH64QAM>
<!--Unit: linear (1 = 0 dB, 0.1 = -20 dB)-->
<PUCCH Max="0.175"></PUCCH>
<!--Unit: linear (1 = 0 dB, 0.1 = -20 dB)-->
</EVM>
</UL>
</Limits>
39User Manual 1178.9103.02 ─ 04
Page 40

R&S®VSE-K144
4 Configuration
Configuration
I/Q Measurement
3GPP 5G NR measurements require a special application on the R&S VSE, which you
activate using the [MODE] key on the front panel.
When you start the 5G NR application, the R&S VSE starts to measure the input signal
with the default configuration or the configuration of the last measurement (when you
have not performed a preset since then). After you have started an instance of the 5G
NR application, the application displays the "Meas Config" menu which contains functions to define the characteristics of the signal you are measuring.
Unavailable hardkeys
Note that the [SPAN], [BW], [TRACE], [LINES] and [MKR FUNC] keys have no contents and no function in the 5G NR application.
● I/Q Measurement.................................................................................................... 40
● Frequency Sweep Measurement Configuration....................................................104
● Microservice Export...............................................................................................105
● Time Trigger Measurement Guide........................................................................ 106
● Reference: Structure of .allocation Files............................................................... 107
4.1 I/Q Measurement
● Configuration Overview...........................................................................................41
● Automatic Measurement Configuration...................................................................42
● Physical Signal Description.....................................................................................44
● Component Carrier Configuration........................................................................... 47
● Radio Frame Configuration.....................................................................................50
● Bandwidth Part Configuration................................................................................. 54
● Slot Configuration....................................................................................................58
● PUSCH and PUCCH Configuration........................................................................ 66
● Antenna Port Configuration.....................................................................................81
● Advanced Settings.................................................................................................. 83
● Selecting the Input and Output Source................................................................... 87
● Frequency Configuration.........................................................................................91
● Amplitude Configuration..........................................................................................92
● Trigger Configuration.............................................................................................. 95
● Data Capture...........................................................................................................97
● Tracking................................................................................................................ 100
● Demodulation........................................................................................................102
40User Manual 1178.9103.02 ─ 04
Page 41

R&S®VSE-K144
4.1.1 Configuration Overview
Configuration
I/Q Measurement
Throughout the measurement channel configuration, an overview of the most important
currently defined settings is provided in the "Overview". The "Overview" is displayed
when you select the "Overview" menu item from the "Meas Setup" menu.
In addition to the main measurement settings, the "Overview" provides quick access to
the main settings dialog boxes. The individual configuration steps are displayed in the
order of the data flow. Thus, you can easily configure an entire measurement channel
from input over processing to output and analysis by stepping through the dialog boxes
as indicated in the "Overview".
In particular, the "Overview" provides quick access to the following configuration dialog
boxes (listed in the recommended order of processing):
1. Signal Description
See Chapter 4.1.3, "Physical Signal Description", on page 44.
2. Input / Frontend
Chapter 4.1.11, "Selecting the Input and Output Source", on page 87
3. Trigger / Signal Capture
See Chapter 4.1.14, "Trigger Configuration", on page 95.
See Chapter 4.1.15, "Data Capture", on page 97.
4. Tracking
See Chapter 4.1.16, "Tracking", on page 100.
5. Demodulation
See Chapter 4.1.17, "Demodulation", on page 102.
6. Analysis
See Chapter 5, "Analysis", on page 114.
7. Display Configuration
See Chapter 3, "Measurements and Result Displays", on page 13
41User Manual 1178.9103.02 ─ 04
Page 42

R&S®VSE-K144
Configuration
I/Q Measurement
In addition, the dialog box provides the "Select Measurement" button that serves as a
shortcut to select the measurement type.
Configuring the measurement
► Select any button in the "Overview" to open the corresponding dialog box.
Select a setting in the channel bar (at the top of the measurement channel tab) to
change a specific setting.
Preset Channel............................................................................................................. 42
Select Measurement..................................................................................................... 42
Specific Settings for ..................................................................................................... 42
Preset Channel
Select the "Preset Channel" button in the lower left-hand corner of the "Overview" to
restore all measurement settings in the current channel to their default values.
Remote command:
SYSTem:PRESet:CHANnel[:EXEC] on page 187
Select Measurement
Opens a dialog box to select the type of measurement.
Remote command:
n/a
Specific Settings for
The channel may contain several windows for different results. Thus, the settings indicated in the "Overview" and configured in the dialog boxes vary depending on the
selected window.
Select an active window from the "Specific Settings for" selection list that is displayed
in the "Overview" and in all window-specific configuration dialog boxes.
The "Overview" and dialog boxes are updated to indicate the settings for the selected
window.
4.1.2 Automatic Measurement Configuration
The R&S VSE provides various functions to automatically configure measurements
based on the signal you are measuring and thus makes these measurements as easy
as possible.
Automatic configuration functions are available in different dialog boxes and softkey
menus.
Access: [AUTO SET]
Access (auto demodulation): "Overview" > "Signal Description" > "Signal Description"
Automatic measurement configuration
The automatic measurement configuration functions adjust various general measurement settings to achieve the optimal display of the measurement results.
42User Manual 1178.9103.02 ─ 04
Page 43

R&S®VSE-K144
Configuration
I/Q Measurement
Automatic signal demodulation
The automatic signal demodulation functions determine the characteristics of the signal
you are measuring. Based on the signal characteristics, the R&S VSE is then able to
demodulate and analyze the signal.
Signal demodulation is available on several levels.
●
Detection of all signal characteristics.
●
Detection of the bandwidth part configuration, incl. antenna port configuration.
For an automatic signal demodulation, all frames must have the same configuration.
Auto Level..................................................................................................................... 43
Auto EVM......................................................................................................................43
Auto Scale.....................................................................................................................43
Automatic Signal Detection...........................................................................................44
Auto Level
You can use the auto leveling routine for a quick determination of preliminary amplitude
settings for the current 5G NR input signal.
For additional information, see "Auto Level" on page 93.
Remote command:
[SENSe:]ADJust:LEVel on page 189
Auto EVM
Adjusts the amplitude settings to achieve the optimal EVM using the maximum
dynamic range.
This routine measures the signal several times at various levels to achieve the best
results.
If you measure several component carriers, this routine can take several minutes to finish (depending on the number of component carriers).
You can speed up the auto EVM routine by performing it across a certain number of
slots only ("Auto EVM # Of Slots To Analyze").
Select "Auto Set" > "Auto Level Config" > "Meas Time Mode" = "Manual" to access this
method.
If you are using this method, make sure to:
●
Define an appropriate measurement time that corresponds to the number of
selected slots. The minimum measurement time is 1 ms.
●
Perform a triggered measurement to reliably capture at least one complete slot.
Remote command:
Run measurement: [SENSe:]ADJust:EVM on page 189
Slots used: [SENSe:]ADJust:EVM:SLOTs on page 189
Auto Scale
Scales the y-axis for best viewing results based on the results.
For more information about y-axis scaling, see "Automatic scaling of the y-axis"
on page 115.
43User Manual 1178.9103.02 ─ 04
Page 44

R&S®VSE-K144
Configuration
I/Q Measurement
Remote command:
DISPlay[:WINDow<n>][:SUBWindow<w>]:TRACe<t>:Y[:SCALe]:AUTO
on page 289
Automatic Signal Detection
Automatic signal demodulation determines the complete signal configuration.
Complete signal demodulation includes:
●
Detection of the cell ID.
This is only possible when you turn on transform precoding.
●
Detection of the bandwidth part configuration.
●
Detection of the slot configuration.
●
Detection of the PDSCH and CORESET configuration, including the enhanced set-
tings.
●
Detection of the antenna port configuration.
●
Detection of transform precoding.
When you turn on automatic signal detection, you only have to define the basic signal
characteristics like the deployment frequency range, the channel bandwidth or the
number of component carriers.
It is not possible to edit any properties that are automatically detected.
Remote command:
CONFigure[:NR5G]:UL[:CC<cc>]:FRAMe<fr>:BWPart<bwp>:DETection
on page 190
4.1.3 Physical Signal Description
Access: "Overview" > "Signal Description" > "Signal Description"
The "Signal Description" dialog box contains general signal characteristics.
44User Manual 1178.9103.02 ─ 04
Page 45

R&S®VSE-K144
Configuration
I/Q Measurement
Configuring component carriers
When you are doing measurements on aggregated carriers, you can configure each
carrier separately.
When available, each carrier in the dialog boxes is represented by an additional tab
labeled "CC<x>", with <x> indicating the number of the component carrier.
Note that the additional tabs are only added to the user interface after you have
selected more than "1" component carrier.
The remote commands required to configure the physical signal characteristics are
described in Chapter 6.9.3, "Physical Settings", on page 190.
The remote commands required to query measurement results are decribed in:
●
Chapter 6.8, "Retrieve Trace Data", on page 172
●
Chapter 6.6, "Remote Commands to Retrieve Numeric Results", on page 144
Selecting the 5G NR mode........................................................................................... 45
Test Scenarios...............................................................................................................45
└ User defined test scenarios............................................................................ 45
└ Test scenarios for carrier aggregation.............................................................46
Deployment Frequency Range..................................................................................... 46
Operating Band.............................................................................................................46
Physical settings of the signal.......................................................................................46
Selecting the 5G NR mode
The "Mode" selects the 5G NR link direction you are testing.
The choices you have depend on the set of options you have installed.
●
Option R&S VSE-K144 enables testing of 3GPP 5G NR signals on both the downlink and the uplink.
Downlink (DL) and Uplink (UL) describe the transmission path.
●
Downlink is the transmission path from the base station to the user equipment.
●
Uplink is the transmission path from the user equipment to the base station.
Remote command:
Link direction: CONFigure[:NR5G]:LDIRection on page 190
Test Scenarios
Test scenarios are descriptions of specific 5G NR signals.
Test scenarios are stored in .allocation files. You can select, manage and create
test scenarios in the "Test Models" dialog box.
User defined test scenarios ← Test Scenarios
Access: "Overview" > "Signal Desription" > "Test Models / User Defined Sets" > "User
Defined"
User defined test scenarios are custom signal descriptions that you can save and
restore as you like.
To create a custom test scenario, describe a signal as required and then save it with
the corresponding button. The R&S VSE stores custom scenarios in .allocation
files.
45User Manual 1178.9103.02 ─ 04
Page 46

R&S®VSE-K144
Configuration
I/Q Measurement
If you do not need test scenarios any longer, you can also delete them.
For a description of the .allocation files, see Chapter 4.5, "Reference: Structure
of .allocation Files", on page 107.
Remote command:
Save: MMEMory:STORe<n>:DEModsetting[:CC<cc>] on page 194
Restore: MMEMory:LOAD:DEModsetting[:CC<cc>] on page 193
Test scenarios for carrier aggregation ← Test Scenarios
When you measure component carriers, you can describe each component carrier
separately and save or restore the scenario for each carrier in the corresponding tab
("CC<x>"). Single carrier scenarios are stored in .allocation files.
For easier handling of multiple carriers, however, you can also store the descriptions of
all carriers in a single file. To do so, configure all component carriers as required and
save the test scenario in "All CCs" tab. Multiple carrier test scenarios are stored
in .ccallocation files. The advantage of this method is, that you do not have to
restore a scenario for each component carrier, but can do so in a single step.
The .ccallocation files contain the frequency information of the signal.
Remote command:
Save: MMEMory:STORe<n>:DEModsetting:ALL on page 194
Restore: MMEMory:LOAD:DEModsetting:ALL on page 193
Deployment Frequency Range
A 5G NR signal can be transmitted in several different frequency ranges ("FR").
●
"FR1 <= 3 GHz": Deployment in frequency range 1 ≤ 3 GHz.
●
"FR1 > 3 GHz": Deployment in frequency range 1 above 3 GHz.
●
"FR2": Deployment in frequency range 2.
The frequencies that FR1 and FR2 cover are defined by 3GPP.
The selected frequency range has an effect on the following settings.
●
Different channel bandwidths are available in each frequency range.
●
Different subcarrier spacings are available in each frequency range.
Remote command:
CONFigure[:NR5G]:UL[:CC<cc>]:DFRange on page 191
Operating Band
Selects the operating band that the carriers are in. The operating bands are defined in
3GPP 38.104: 5.2 "Operating Bands".
Depending on the operating band you select for the transmission, the R&S VSE automatically adjusts the minimum requirements for channel spacing between component
carriers, especially the frequency offset to CC1.
If the center frequency of the carriers is not within the selected operating band, the
R&S VSE shows a corresponding message in the carrier configuration dialog box.
Remote command:
CONFigure[:NR5G]:OBANd on page 191
Physical settings of the signal
Physical settings describe the basic structure of the signal you are measuring.
46User Manual 1178.9103.02 ─ 04
Page 47

R&S®VSE-K144
Configuration
I/Q Measurement
The "Channel Bandwidth" is variable with fixed values in the range from 5 MHz to
400 MHz. The numbers next to the dropdown box show the sample rate of the signal.
The sample rate depends on the selected channel bandwidth.
The available channel bandwidths depend on the frequency range you have selected.
Selecting one of the "Configure" buttons opens the radio frame configuration tab where
you can customize the radio frame structure according to your needs.
●
"Bandwidth Parts": Configuration of bandwidth parts (BWP).
The numbers next to the button indicate the number of configured BWPs and their
subcarrier spacings.
●
"Slot Config": Configuration of individual slots.
The numbers next to the button indicate the slot format used in the BWPs and if a
CSI reference signal is present or not.
The slot format determines the usage of the OFDM symbols (UL, DL or flexible).
The slot formats are defined in 3GPP 38.211, table 4.3.2-3.
●
"PUSCH / PUCCH Config": Configuration of the data channel (PUSCH) and the
control channel (PUCCH)
The numbers next to the button indicate the modulation types used for the alloca-
tions in all slots and if a SMUX or phase-tracking reference signal (PT-RS) is pres-
ent or not.
The physical layer cell ID is responsible for synchronization between network and user
equipment. It identifies a specific radio cell in the 5G NR network. The cell ID is a value
between 0 and 503.
For automatic detection of the cell ID, turn on the "Auto" function. However, auto detection only works if you turn on transform precoding.
For FR2 deployments, you can also select the power class. The power class (1 to 4)
defines the limits for inband emission tests. The power class you should select
depends on the user equipment.
Remote command:
Channel bandwidth: CONFigure[:NR5G]:UL[:CC<cc>]:BW on page 191
Cell ID: CONFigure[:NR5G]:UL[:CC<cc>]:PLC:CID on page 192
Power class: CONFigure[:NR5G]:UL[:CC<cc>]:PLC:PCLass on page 192
4.1.4 Component Carrier Configuration
Access: "Overview" > "Signal Description"
Carrier aggregation has been introduced in the 5G NR standard to increase the bandwidth. In those systems, you can use several carriers to transmit a signal.
The 5G NR measurement application supports up to 16 component carriers for measurements on contiguous and non-contiguous intra-band carrier aggregation (the carriers are in the same frequency band).
Each carrier has one of the channel bandwidths defined by 3GPP. You can deploy the
component carriers in different frequency ranges.
The radio frame can be different for each component carrier. For more information
about configuring 5G NR radio frames, see Chapter 4.1.5, "Radio Frame Configura-
tion", on page 50.
47User Manual 1178.9103.02 ─ 04
Page 48

R&S®VSE-K144
Configuration
I/Q Measurement
Several measurements support contiguous and non-contiguous intra-band carrier
aggregation (the carriers are in the same frequency band).
●
I/Q Based Measurements (EVM, Frequency Error, etc.)
The remote commands required to configure component carriers are described in
Chapter 6.9.4, "Component Carrier Configuration", on page 194.
Number of component carriers......................................................................................48
Component carrier data capture................................................................................... 48
Views.............................................................................................................................49
Basic component carrier configuration..........................................................................49
└ Frequency configuration................................................................................. 49
└ Bandwidth configuration..................................................................................50
Number of component carriers
The supported "Number Of Component Carriers" you can measure is in the range from
1 to 16. When you select more than one component carrier, the R&S VSE expands the
"Signal Description" dialog box by several tabs.
One tab for each component carrier you can configure and one tab to define general
properties of the component carrier configuration.
Remote command:
CONFigure[:NR5G]:NOCC on page 195
Component carrier data capture
Capturing signals with several component carriers can generate big amounts of data.
The 5G NR application thus provides different "CC Signal Capture" modes that allow
you to capture even several component carriers with a large bandwidth.
●
"Single": Each configured component carrier is captured consecutively by an indi-
vidual data capture buffer.
●
"Auto": The R&S VSE determines how many component carriers it can capture in a
single measurement.
48User Manual 1178.9103.02 ─ 04
Page 49

R&S®VSE-K144
Configuration
I/Q Measurement
If you select "Auto" mode, the R&S VSE captures as many component carriers as it
can in a single measurement and captures the rest in subsequent measurements. The
maximum number of component carriers the R&S VSE can analyze in a single capture
depends on the available bandwidth. With the optional 500 MHz bandwidth, for example, it can analyze up to 5 100 MHz carriers in a single capture.
When all required measurements are done, the R&S VSE shows the results for all
component carriers.
Remote command:
CONFigure[:NR5G]:CSCapture on page 195
Views
Results of component carrier measurements are shown for each component carrier
separately. When you measure more than one carrier, each result display shows the
information of up to two component carriers. For more than two component carriers,
you can select which component carriers are displayed in the two views.
Remote command:
DISPlay[:WINDow<n>][:SUBWindow<w>]:CCNumber on page 300
Basic component carrier configuration
The number of component carriers (CCs) you can select depends on the measurement.
●
I/Q based measurements (EVM etc.): up to 16 CCs
You can define the characteristics of the CCs in the table in the "Carrier Configuration"
panel (in the "Signal Characteristics" dialog box). Depending on the "Number of Component Carriers", the application adjusts the size of the table. Each line corresponds to
a component carrier.
The R&S VSE shows a preview of the current carrier configuration in a diagram at the
bottom of the dialog.
Frequency configuration ← Basic component carrier configuration
The location of each component carrier in the spectrum is defined by a center frequency. The frequencies of the carriers must be in an ascending order.
The R&S VSE indicates if the location of the carriers is compatible to the selected
operating band.
●
"Carrier within selected NR band"
●
"Carrier outside of selected NR band"
Note that the actual measurement frequency differs from the carrier frequencies: the
application calculates that frequency based on the carrier frequencies. It is somewhere
in between the carrier frequencies.
Note that the measurement frequency can change during a capture. If the signal bandwidth is larger than the available analysis bandwidth, the captured data consists of several captures with a smaller bandwidth, each with a different measurement frequency.
49User Manual 1178.9103.02 ─ 04
Page 50

R&S®VSE-K144
Configuration
I/Q Measurement
The R&S VSE indicates the actual measurement frequency in the channel bar.
In addition to the carrier's center frequency, you have to define a frequency offset to
CC1. The frequency offset is the offset relative to the center frequency of the first component carrier.
●
When you change the offset of a carrier, the R&S VSE adjusts its center frequency.
●
When you change the frequency of one of the carriers, the R&S VSE adjusts the
offset.
You can change this logic by turning on a fixed CC offset. When you do, the offset
becomes a fixed value. Changing the frequency of one carrier adjusts the frequencies
of the other carriers. The offset remains the same.
Remote command:
Frequency: [SENSe:]FREQuency:CENTer[:CC<cc>] on page 265
Offset: [SENSe:]FREQuency:CENTer[:CC<cc>]:OFFSet on page 266
Fixed offset: CONFigure[:NR5G]:FCOFfset on page 195
Bandwidth configuration ← Basic component carrier configuration
For each carrier, select the "Bandwidth" from the corresponding dropdown menu.
The combination of bandwidths is arbitrary. If the total bandwidth of all component car-
riers is too large, the R&S VSE displays a corresponding message.
The R&S VSE also shows the "Occupied Bandwidth" of the aggregated carriers and
the "Sample Rate" in a read-only field next to the carrier configuration.
Remote command:
CONFigure[:NR5G]:UL[:CC<cc>]:BW on page 191
4.1.5 Radio Frame Configuration
Access: "Overview" > "Signal Description" > "Radio Frame Config"
Basic frame structure
A radio frame in the 5G NR standard has a length of 10 ms (same as in LTE). It consists of 10 subframes, each with a length of 1 ms.
A subframe contains a variable number of slots, depending on the subcarrier spacing.
A subframe can have different subcarrier spacings in different bandwidth parts.
50User Manual 1178.9103.02 ─ 04
Page 51

R&S®VSE-K144
Configuration
I/Q Measurement
Subframe
= 1 ms
Bandwidth part 2 (= x MHz)
Bandwidth part 2 (= x MHz)
Bandwidth part 1 (= x MHz)
Bandwidth part 1 (= x MHz)
Bandwidth part 0 (= x MHz)
Channel bandwidth (x subcarrier)
x slots
Figure 4-1: Basic frame structure of a 5G NR frame
Slot structure
A slot contains 14 OFDM symbols and has a bandwidth the size of the bandwidth part
it is in. A slot can have one of many slot formats, with each slot format representing a
different symbol usage. Most of the symbols are usually used by the PUSCH for transmission of user data (payload).
Resource blocks
Bandwidth part 0 (= x MHz)
Frame
= 10 ms
One symbol with a bandwidth of 12 subcarriers makes up a resource block (the size of
the subcarrier is variable). One symbol over one subcarrier makes up a resource element, which is the basic quantity in a 5G NR radio frame.
The 5G NR standard differentiates between virtual resource blocks (VRB) and physical
resource blocks (PRB). VRBs are all resource blocks that are allocated to the resource
grid. PRBs have the same size and number as VRBs, but can be mapped to different
subcarriers to according to certain rules defined by 3GPP. Mapping to different subcarriers can be useful to use the resource grid more efficiently.
1 Subframe (1 ms) = x slots, x depends on subcarrier spacing
Carrier Bandwidth (variable)
12 Subcarrier
12 Subcarrier
Resource Block
Resource Block
Slot 1 = 14 OFDM symbols
...
...
...
...
...
...
Resource Block
Resource Block
Slot x = 14 OFDM symbols
...
...
Figure 4-2: Basic slot structure of a 5G NR slot
51User Manual 1178.9103.02 ─ 04
Page 52

R&S®VSE-K144
Configuration
I/Q Measurement
The radio frame in a 5G NR signal is highly flexible. The location of the synchronization
signal is just as variable as the size and number of bandwidth parts and the configuration of each slot in the radio frame.
For more information about configuring the radio frame structure, refer to the following
topics.
●
Bandwidth parts
●
Slots
●
PUSCH
Measuring multiple radio frames
You can capture and analyze multiple radio frames. Each radio frame can have a different configuration.
Configuring component carriers
When you are doing measurements on aggregated carriers, you can configure each
carrier separately.
When available, each carrier in the dialog boxes is represented by an additional tab
labeled "CC<x>", with <x> indicating the number of the component carrier.
Note that the additional tabs are only added to the user interface after you have
selected more than "1" component carrier.
Frame Configuration..................................................................................................... 52
Effects of capturing multiple frames on results..............................................................53
Frame Configuration Management............................................................................... 53
Frame Configuration
The "# Frames To Configure" input field defines the number of radio frames with a different configuration. If you select more than one frame to configure, you can assign a
different slot configuration and PUSCH configuration for the frames. The bandwidth
part configuration is the same for all frames.
To configure a specific frame, enter the corresponding number in the "Selected Frame"
field. If you configure only one frame ("# Frames To Configure" = 1), all frames have
the same configuration.
After you have configured several frames, you can also select how many frames the
R&S VSE actually captures and analyzes with the "Number of Frames to Analyze"
property. If you capture more than the number of configurable frames, the frame configuration is repeated for the surplus frames.
Example:
The number of configurable frames is 2. The number of frames you have captured is 5.
In that case, the BWP configuration of frame 0 and 1 is repeated for frames 2 to 4.
If you capture less than the number of configurable frames, only the first frame configurations are applied.
52User Manual 1178.9103.02 ─ 04
Page 53

R&S®VSE-K144
Configuration
I/Q Measurement
Example:
The number of configurable frames is 3. The number of frames you have captured is 1.
In that case, the BWP configuration of frame 0 is used for analysis.
In addition, if the R&S VSE needs more than one capture to analyze all frames, for
example if the capture time is too small, the capture always starts with the configuration of the first frame.
Example:
The number of configurable frames is 3. The capture time is 20.1 ms. The number of
frames you have captured is 3.
The first capture contains 2 full frames with configuration of frame 0 and 1.
The second capture contains 1 frame, again with configuration of frame 0.
(If you want to capture a frame with the third configuration, you would have to define a
capture time of at least 30.1 ms.)
Remote command:
Configurable frames: CONFigure[:NR5G]:UL[:CC<cc>]:FTConfig on page 197
Frame selection: via suffix at FRAMe<fr>
Effects of capturing multiple frames on results
Analyzing multiple frames has the following effects on results.
●
Results in the result summary are either averaged over all frames or refer to a sin-
gle frame, depending on your selection.
●
All graphical results refer to a single frame.
If there is more than one frame in the capture buffer, you can select the frame you
want to display.
●
The R&S VSE can only display graphical results of the last data capture.
If the capture time is too small to capture all frames to analyze, the R&S VSE cap-
tures the signal in multiple capture buffers.
Note that this only applies to graphical results like EVM vs Carrier or the constella-
tion diagram. The result summary still averages over all analyzed frames.
Example:
The capture time is 20.1 ms. The number of frames to analyze is 3. Two data captures
are required to analyze all frames.
In that case, the first data capture analyzes the first two frames. The second data capture analyzes the third frame. However, you can only display the results for the third
frame in the graphical result displays.
If you analyze multiple component carriers, you can also display the results for a specific frame by assigning a frame to a view.
Remote command:
Select a frame: [SENSe:]NR5G[:CC<cc>]:FRAMe:SELect on page 306
Frame Configuration Management
The R&S VSE provides some tools to make frame configuration easier.
53User Manual 1178.9103.02 ─ 04
Page 54

R&S®VSE-K144
4.1.6 Bandwidth Part Configuration
Configuration
I/Q Measurement
●
"Copy Frame": Copies the bandwidth part configuration of the selected frame.
Note that this includes the slot configuration and PUSCH/PUCCH configuration of
that frame.
●
"Paste Frame": Applies the bandwidth part configuration in the cache to the
selected frame.
●
"Paste To All": Applies the bandwidth part configuration in the cache to all configu-
rable frames.
Remote command:
Copy: CONFigure[:NR5G]:UL[:CC<cc>]:FRAMe<fr>:COPY on page 196
Paste: CONFigure[:NR5G]:UL[:CC<cc>]:FRAMe<fr>:PASTe[:FRAMe]
on page 196
Paste to all: CONFigure[:NR5G]:UL[:CC<cc>]:FRAMe<fr>:PASTe:ALL
on page 196
Access: "Overview" > "Signal Description" > "Radio Frame Config" > "BWP Config"
One of the defining features of the 5G NR standard is bandwidth parts (BWP). Using
bandwidth parts, you can split the complete channel bandwidth into several smaller slices. A bandwidth part is defined as a contiguous set of physical resource blocks that
have the same subcarrier spacing (or numerology as the 3GPP standard calls it).
The numerology has several effects on the signal, like the symbol length and the number of slots in a subframe.
Table 4-1: Numerology in 5G NR
Numerology 0 1 2 3 4
Subcarrier spacing 15 kHz 30 kHz 60 kHz 120 kHz 240 kHz
Slot length 1 ms 0.5 ms 0.25 ms 0.125 ms 0.0625 ms
Number of slots in subframe 1 2 4 8 16
The number of bandwidth parts you can configure with the R&S VSE is limited to 12.
During transmission, each bandwidth part can be assigned to a specific user equipment (UE). Bandwidth parts can overlap, in which case UEs share the resource elements of a bandwidth part.
For measurements on signals with multiple bandwidth parts, it is sufficient to configure
only the active bandwidth part.
You can configure bandwidth parts in the bandwidth part configuration table. This table
contains the characteristics of all bandwidth parts in the currently selected frame. You
can add or remove bandwidth parts and configure them as you like.
Each row in the table corresponds to a bandwidth part.
54User Manual 1178.9103.02 ─ 04
Page 55

R&S®VSE-K144
Configuration
I/Q Measurement
Configuring component carriers
When you are doing measurements on aggregated carriers, you can configure each
carrier separately.
When available, each carrier in the dialog boxes is represented by an additional tab
labeled "CC<x>", with <x> indicating the number of the component carrier.
Note that the additional tabs are only added to the user interface after you have
selected more than "1" component carrier.
The remote commands required to configure the bandwidth parts are described in
Chapter 6.9.6, "Bandwidth Part Configuration", on page 197.
● BWP Configuration Table Management.................................................................. 55
● BWP Configuration Table........................................................................................56
4.1.6.1 BWP Configuration Table Management
The R&S VSE provides several tools to manage the configuration table and make the
configuration of bandwidth parts easier.
Bandwidth Part Selection..............................................................................................56
BWP Configuration Tools.............................................................................................. 56
55User Manual 1178.9103.02 ─ 04
Page 56

R&S®VSE-K144
Configuration
I/Q Measurement
Bandwidth Part Selection
You can select the bandwidth part you want to configure by entering its number in the
"Selected BWP" input field. In the configuration table, the selected bandwidth part is
highlighted blue.
You can also select bandwidth parts with the "Prev BWP" and "Next BWP" buttons.
Note that when you select a bandwidth part, the R&S VSE also selects that bandwidth
part in the Slot Config and PUSCH / PUCCH Config tabs and vice versa.
Remote command:
via suffix at BWPart<bwp>
BWP Configuration Tools
The BWP configuration table provides several management tools.
●
"Add": Adds a bandwidth part to the table.
●
"Remove": Deletes the selected (highlighted) bandwidth part.
●
"Clear": Removes all entries from the table.
●
"Duplicate": Copies the configuration of the selected bandwidth part to a new band-
width part.
Note that this includes the Slot Config and PUSCH / PUCCH Config.
Remote command:
Add BWP: CONFigure[:NR5G]:UL[:CC<cc>]:FRAMe<fr>:BWPart<bwp>:ADD
on page 197
Remove BWP: CONFigure[:NR5G]:UL[:CC<cc>]:FRAMe<fr>:BWPart<bwp>:
REMove on page 199
Clear table: CONFigure[:NR5G]:UL[:CC<cc>]:FRAMe<fr>:BWPart<bwp>:
CLEar on page 198
Duplicate BWP: CONFigure[:NR5G]:UL[:CC<cc>]:FRAMe<fr>:BWPart<bwp>:
DUPLicate on page 198
4.1.6.2 BWP Configuration Table
The bandwidth part configuration table consists of several rows, each of which corresponds to a bandwidth part. The size of the table therefore depends on the number of
bandwidth parts you have added to the table.
Note that all bandwidth parts must have the same subcarrier spacing.
Preview diagram
The preview diagram shows the distribution and location of the bandwidth parts. The xaxis represents the bandwidth part, the y-axis represent the frequency, with the point of
origin of the diagram being the first subcarrier. The color depends on the subcarrier
spacing selected for the corresponding bandwidth part.
The width of the bandwidth parts depends on the number of resource blocks it occupies. The location of the bandwidth part on the y-axis depends on the resource block
offset.
If two or more bandwidth parts overlap (share the same resource blocks), the corresponding parts of the bandwidth part are highlighted by black lines.
56User Manual 1178.9103.02 ─ 04
Page 57

R&S®VSE-K144
Configuration
I/Q Measurement
Unused parts of the spectrum remain gray.
Numerology
Next to the bandwidth part configuration table, the R&S VSE displays various information about the numerology in the currently selected bandwidth part.
●
"Numerology": Shows the numerology of the bandwidth part as defined by 3GPP.
●
"Slots per SF": Shows the number of slots in a subframe in the selected BWP. The
number of slots depends on the selected subcarrier spacing.
●
"Symbols Per Slot": Shows the number of symbols in a slot in the selected BWP.
●
"Bandwidth": Shows the width of the selected BWP in Hz.
●
"Delta To CF": Shows the frequency offset of the BWP relative to the center fre-
quency of the complete signal.
●
"Total # Slots": Shows the complete number of slots in the BWP over all subframes.
The number of slots depends on the selected subcarrier spacing.
●
"Max # RBs": Shows the maximum number of resource blocks that the bandwidth
part can have.
●
"FFT Size": Shows the FFT size in the selected BWP. The FFT size depends on
the selected subcarrier spacing.
BWP Number................................................................................................................ 57
Subcarrier Spacing (user data)..................................................................................... 57
# RBs............................................................................................................................ 58
RB Offset.......................................................................................................................58
Slot Config.....................................................................................................................58
BWP Number
The "BWP Number " shows the index number of the corresponding BWP.
The bandwidth part number is a consecutive index number that allows you to identify
each bandwidth part. The first bandwidth part has the index number 0.
Remote command:
not supported
Subcarrier Spacing (user data)
The "Subcarrier Spacing" selects the subcarrier spacing for the corresponding BWP.
The available subcarrier spacings depend on the frequency range you have selected.
●
FR1: 15 kHz, 30 kHz, 60 kHz
Note that 15 kHz is only available for channel bandwidths < 60 MHz.
●
FR2: 60 kHz, 120 kHz
Subcarrier spacings are indicated by different colors in the preview diagram.
●
●
●
●
: 15 kHz
: 30 kHz
: 60 kHz
: 120 kHz
57User Manual 1178.9103.02 ─ 04
Page 58

R&S®VSE-K144
Configuration
I/Q Measurement
For bandwidth parts with a 60 kHz subcarrier spacing, you can select if it has a normal
cyclic prefix (NCP) or an extended cyclic prefix (ECP). Note that the diagrams only
show results if you select the BWP with the extended cyclic prefix from the evaluation
range.
Remote command:
CONFigure[:NR5G]:UL[:CC<cc>]:FRAMe<fr>:BWPart<bwp>:SSPacing
on page 199
# RBs
The "# RBs" defines the number of physical resource blocks (PRB) the bandwidth part
occupies. The number of physical resource blocks also defines the frequency width of
the bandwidth part.
The maximum number of physical resource blocks for a bandwidth part depends on
the selected subcarrier spacing and the overall channel bandwidth, which in turn
depend on the selected frequency range. For a detailed overview, see 3GPP 38.104,
tables 5.3.2-1 and 5.3.2-2.
Bandwidth parts can share resource blocks.
Remote command:
CONFigure[:NR5G]:UL[:CC<cc>]:FRAMe<fr>:BWPart<bwp>:RBCount
on page 198
RB Offset
The "RB Offset" defines an offset of the first resource block that the bandwidth part
uses relative to the first resource block of the channel.
The resource block offset therefore defines the location (frequency) of the bandwidth
part in the NR channel.
Remote command:
CONFigure[:NR5G]:UL[:CC<cc>]:FRAMe<fr>:BWPart<bwp>:RBOFfset
on page 199
Slot Config
The "Configure" button opens the dialog box to configure the slots in the corresponding
bandwidth part.
For details, see Slot Config.
Remote command:
not supported
4.1.7 Slot Configuration
Access: "Overview" > "Signal Description" > "Radio Frame Config" > "Slot Config"
Slots
Slots are flexible entities in the 5G NR radio frame, whose characteristics depend on a
number of factors.
58User Manual 1178.9103.02 ─ 04
Page 59

R&S®VSE-K144
Configuration
I/Q Measurement
In the time domain, the length of a slot and the number of slots in a subframe depends
on the numerology.
Each slot contains 14 OFDM symbols. Each symbol can have a different scheduling
type to make scheduling during transmission as flexible as possible.
Slot configuration table
The slot configuration table represents the frame structure in the time domain. Each
row corresponds to one slot, and each slot can have a different configuration.
Selecting the bandwidth part to configure
► Enter the number of the bandwidth part you want to configure in the "Bandwidth
Part Number" field.
The R&S VSE selects the corresponding bandwidth part.
Note that when you select bandwidth part here, the R&S VSE also selects that
bandwidth part in the BWP Config tab and vice versa.
Configuring component carriers
When you are doing measurements on aggregated carriers, you can configure each
carrier separately.
When available, each carrier in the dialog boxes is represented by an additional tab
labeled "CC<x>", with <x> indicating the number of the component carrier.
Note that the additional tabs are only added to the user interface after you have
selected more than "1" component carrier.
59User Manual 1178.9103.02 ─ 04
Page 60

R&S®VSE-K144
4.1.7.1 General Slot Configuration
Configuration
I/Q Measurement
The remote commands required to configure the slots are described in Chapter 6.9.7,
"Slot Configuration", on page 200.
● General Slot Configuration......................................................................................60
● Slot Configuration Table..........................................................................................61
● Sounding Reference Signal.................................................................................... 63
The slot configuration table contains a variable number of rows, depending on the
bandwidth parts configuration.
Selected Slot.................................................................................................................60
Number of Configurable Slots.......................................................................................60
Slot Configuration Tools................................................................................................ 60
Selected Slot
You can select the slot you want to configure by entering its number in the "Selected
Slot" input field. In the configuration table, the selected slot is highlighted blue.
You can also select slots with the "Prev Slot" and "Next Slot" buttons.
Note that when you select a slot, the R&S VSE also selects that slot in the PUSCH /
PUCCH Config tab and vice versa.
Remote command:
via suffix at SLOT<sl>
Number of Configurable Slots
You can configure each slot in the radio frame individually, but when more slots have
the same configuration (for example each subframe has the same slot configurations),
you can configure just a certain number of slots and repeat this configuration on other
slots.
The slots you can edit ("# User Configurable Slots") are always the first slots in the
table. For example, if the number of configurable slots is "4", you can edit the first four
rows in the table. The cells of slots you can edit are white.
The slot configuration is repeated for all other slots. For example, if you can edit the
first four slots, the subsequent four slots have the same configuration and so on. The
configuration that a specific slot uses is indicated in the last column of the slot configuration table.
The "Periodicity" shown next to the slot configuration table indicates the length of all
customized slots. For example, a periodicity of 1 ms in a BWP with a 30 kHz subcarrier
spacing indicates that the first two slots have a custom configuration which is repeated
every 1 ms.
Remote command:
CONFigure[:NR5G]:UL[:CC<cc>]:FRAMe<fr>:BWPart<bwp>:CSLot
on page 201
Slot Configuration Tools
The R&S VSE provides some tools to make slot configuration easier.
●
"Copy Slot": Copies the slot configuration of the selected slot.
60User Manual 1178.9103.02 ─ 04
Page 61

R&S®VSE-K144
Configuration
I/Q Measurement
Note that this includes the PUSCH / PUCCH configuration of that slot.
●
"Paste Slot": Applies the slot configuration in the cache to the selected slot.
●
"Paste To": Applies the slot configuration to a set of configurable slots.
– Paste to "Slots": Paste to specific slots or range of slots (e.g. 1,2,5-8)
– Paste to "Data": Paste to all data slots.
– Paste to "Unused": Paste to all unused slots (they will turn into data slots).
– Paste to "Custom": Paste to selected slots according to a certain logic (period /
duration).
●
"Paste To All": Applies the slot configuration in the cache to all configurable slots.
●
"Reset Slot Config": Restores the default slot configuration (including the PDSCH/
PDCCH configuration).
Remote command:
Copy: CONFigure[:NR5G]:UL[:CC<cc>]:FRAMe<fr>:BWPart<bwp>:
SLOT<sl>:COPY on page 202
Paste: CONFigure[:NR5G]:UL[:CC<cc>]:FRAMe<fr>:BWPart<bwp>:
SLOT<sl>:PASTe[:SLOT] on page 207
Paste to all: CONFigure[:NR5G]:UL[:CC<cc>]:FRAMe<fr>:BWPart<bwp>:
SLOT<sl>:PASTe:ALL on page 203
Paste to selected: CONFigure[:NR5G]:UL[:CC<cc>]:FRAMe<fr>:
BWPart<bwp>:SLOT<sl>:PASTe:TO on page 205
Reset: CONFigure[:NR5G]:UL[:CC<cc>]:FRAMe<fr>:BWPart<bwp>:
SLOT<sl>:PRESet on page 207
4.1.7.2 Slot Configuration Table
The slot configuration table contains the configuration of all slots in the currently
selected bandwidth part. The number of rows (slots) depends on the subcarrier spac-
ing in the selected bandwidth part.
The complete number of slots in the selected bandwidth part is indicated next to the
table ("n Slots in BWP x").
Slot preview
The slot preview shows the scheduling of the OFDM symbols in the selected slot.
Figure 4-3: Preview of symbol usage for slot format 38 as defined in 3GPP 38.211, table 4.3.2-3
The scheduling depends on the selected slot format.
61User Manual 1178.9103.02 ─ 04
Page 62

R&S®VSE-K144
Configuration
I/Q Measurement
Subframe Number.........................................................................................................62
Slot Number.................................................................................................................. 62
Slot Allocation............................................................................................................... 62
Slot Format....................................................................................................................62
PUSCH Allocations....................................................................................................... 63
Repeated Slot No..........................................................................................................63
Ref Signals....................................................................................................................63
Subframe Number
The "Subframe Number" shows the index number (0 to 9) of the subframe that the slot
belongs to.
The number of subframes is always 10, the number of slots in a subframe varies,
depending on the subcarrier spacing / numerology. The first subframe always has the
index 0.
Remote command:
not supported
Slot Number
The "Slot Number" shows the index number (0 to n) of the corresponding slot.
The selected slot is highlighted blue.
The number of slots in the frame varies, depending on the subcarrier spacing / numer-
ology. The first slot always has the index 0.
Remote command:
not supported
Slot Allocation
The "Slot Allocation" selects the usage of the corresponding slot.
●
"Data": Slot is used for user data transmission.
●
"Unused": Slot is not used.
Remote command:
CONFigure[:NR5G]:UL[:CC<cc>]:FRAMe<fr>:BWPart<bwp>:SLOT<sl>:
ATYPe on page 201
Slot Format
The "Slot Format" selects one of the slot formats defined by 3GPP for the corresponding slot.
The slot format defines the usage of the OFDM symbols in a slot. Possible symbol usages are:
●
Uplink: Symbol carries uplink information.
●
Downlink: Symbol carries downlink information.
●
Flexible: Symbol usage is undefined and can carry uplink or downlink information.
The symbol usage of the selected slot format is indicated in the slot preview.
For a comprehensive list of all supported slot formats, see 3GPP 38.211, table 4.3.2-3:
"Slot formats".
62User Manual 1178.9103.02 ─ 04
Page 63

R&S®VSE-K144
Configuration
I/Q Measurement
Remote command:
CONFigure[:NR5G]:UL[:CC<cc>]:FRAMe<fr>:BWPart<bwp>:SLOT<sl>:
FORMat on page 202
PUSCH Allocations
The "Configure" button opens the dialog box to configure the PUSCH or PUCCH allocations in the corresponding slot.
For details, see Chapter 4.1.8, "PUSCH and PUCCH Configuration", on page 66.
Remote command:
not supported
Repeated Slot No
The "Repeated Slot No" shows the slot number on which the configuration of a slot is
based on.
If the table cell says "User", the slot is configured manually.
If the table cell contains a number, the slot configuration is the same as the slot indica-
ted by that number. For example, if the cell contains the number "1", the slot configuration is the same as the slot with the index number 1.
Remote command:
not supported
Ref Signals
Opens a dialog box to configure reference signals transmitted in the corresponding
slot.
For details, see Chapter 4.1.7.3, "Sounding Reference Signal", on page 63.
Remote command:
not supported
4.1.7.3 Sounding Reference Signal
The sounding reference signal (SRS) is an uplink reference signal transmitted by the
user equipment. The base station uses the SRS to estimate the uplink channel quality
for each user.
In the time domain, the SRS occupies 1, 2 or 4 OFDM symbols with a variable starting
position. In the frequency domain, the SRS uses only portions of the overall channel
bandwidth in a bandwidth part. The subcarriers occupied by the SRS depend on various frequency hopping and tranmission comb techniques.
You can define various parameters to describe the physical attributes and structure of
the SRS, for example where it is located in the resource grid or how often it occurs in
the signal.
The SRS configuration is specific to a bandwidth part. If you assign a SRS to more
than one slot in the bandwidth part (repeated transmission), the configuration is the
same for each instance of the SRS.
The SRS uses antenna port 1000.
63User Manual 1178.9103.02 ─ 04
Page 64

R&S®VSE-K144
Configuration
I/Q Measurement
All settings available for the sounding reference signal are based on and specified in
detail in 3GPP 38.211.
The remote commands required to configure the CSI reference signal are described in
Chapter 6.9.8, "SRS Configuration", on page 207.
SRS State..................................................................................................................... 64
Slot Config.....................................................................................................................64
Start Pos....................................................................................................................... 64
No. Sym........................................................................................................................ 65
Freq Pos........................................................................................................................65
Freq Shift.......................................................................................................................65
Freq Hopping................................................................................................................ 65
Rep. Factor................................................................................................................... 65
Transmission Comb / Sequence Comb.........................................................................65
No Ports........................................................................................................................ 66
Rel Power......................................................................................................................66
SRS State
Turns the sounding reference signal on and off.
Remote command:
CONFigure[:NR5G]:UL[:CC<cc>]:FRAMe<fr>:BWPart<bwp>:SRS:STATe
on page 215
Slot Config
Opens a dialog box to configure in which slots the sounding reference signal appears.
The transmission is always periodic. The "Periodicity" selects the slot numbers the
SRS appears in. For example, a periodicity of 2 slots assigns the SRS to every other
slot.
The "Offset" defines the first slot the SRS appears in.
Remote command:
Periodicity: CONFigure[:NR5G]:UL[:CC<cc>]:FRAMe<fr>:BWPart<bwp>:SRS:
SLOT:PERiodicity on page 213
Offset: CONFigure[:NR5G]:UL[:CC<cc>]:FRAMe<fr>:BWPart<bwp>:SRS:
SLOT:POFFset on page 214
Start Pos
Defines the starting position of the sounding reference signal in the time domain in
terms of OFDM symbols.
Remote command:
CONFigure[:NR5G]:UL[:CC<cc>]:FRAMe<fr>:BWPart<bwp>:SRS:SPOS
on page 214
64User Manual 1178.9103.02 ─ 04
Page 65

R&S®VSE-K144
Configuration
I/Q Measurement
No. Sym
Selects the number of OFDM symbols used by the sounding reference signal (1, 2 or
4).
Remote command:
CONFigure[:NR5G]:UL[:CC<cc>]:FRAMe<fr>:BWPart<bwp>:SRS:NSYMbols
on page 211
Freq Pos
Defines the starting position of the SRS allocation in the frequency domain.
Remote command:
CONFigure[:NR5G]:UL[:CC<cc>]:FRAMe<fr>:BWPart<bwp>:SRS:FPOS
on page 209
Freq Shift
Defines an offset of the sounding reference signal resource elements in the frequency
domain relative to the first subcarrier.
Remote command:
CONFigure[:NR5G]:UL[:CC<cc>]:FRAMe<fr>:BWPart<bwp>:SRS:FSHift
on page 210
Freq Hopping
Opens a dialog box to configure in the frequency hopping parameters ("B-SRS", "CSRS" and "B-Hop").
"B-SRS" and "C-SRS" define the bandwidth and length of the SRS sequence.
"B-Hop" defines the frequency hopping bandwidth of the SRS. Note that frequency
hopping is disabled if "B-Hop" > "B-SRS".
Remote command:
B
: CONFigure[:NR5G]:UL[:CC<cc>]:FRAMe<fr>:BWPart<bwp>:SRS:
SRS
FHOPping:BSRS on page 208
C
: CONFigure[:NR5G]:UL[:CC<cc>]:FRAMe<fr>:BWPart<bwp>:SRS:
SRS
FHOPping:CSRS on page 209
B
: CONFigure[:NR5G]:UL[:CC<cc>]:FRAMe<fr>:BWPart<bwp>:SRS:
Hop
FHOPping:BHOP on page 208
Rep. Factor
Defines how many times the sounding reference signal is repeated.
Remote command:
CONFigure[:NR5G]:UL[:CC<cc>]:FRAMe<fr>:BWPart<bwp>:SRS:RFACtor
on page 211
Transmission Comb / Sequence Comb
Opens a dialog box to configure the transmission comb and the cylic shift sequence.
These settings define the subcarriers the sounding reference signal is transmitted on.
The "Transmission Comb" value selects the number of subcarriers the sounding reference signal occupies. It also defines the maximum number of cylic shifts. You can also
define an "Offset" for the resource elements used by the SRS (odd or even subcarriers).
65User Manual 1178.9103.02 ─ 04
Page 66

R&S®VSE-K144
Configuration
I/Q Measurement
The group of sequence settings define the sequence of the sounding reference signal.
"Cyclic Shift" defines the number of cyclic shifts.
The "Sequence ID" defines the pseudo-random seed value for the SRS sequence gen-
eration.
The sounding reference signal supports frequency hopping. You can select the hop-
ping method from the "Group Or Seq Hopping" dropdown menu.
Remote command:
Transmission comb: CONFigure[:NR5G]:UL[:CC<cc>]:FRAMe<fr>:
BWPart<bwp>:SRS:TCOMb[:VALue] on page 216
Offset: CONFigure[:NR5G]:UL[:CC<cc>]:FRAMe<fr>:BWPart<bwp>:SRS:
TCOMb:OFFSet on page 215
Cyclic shift: CONFigure[:NR5G]:UL[:CC<cc>]:FRAMe<fr>:BWPart<bwp>:SRS:
SEQuence:CSHift on page 212
Sequence ID: CONFigure[:NR5G]:UL[:CC<cc>]:FRAMe<fr>:BWPart<bwp>:
SRS:SEQuence:ID on page 213
Hopping: CONFigure[:NR5G]:UL[:CC<cc>]:FRAMe<fr>:BWPart<bwp>:SRS:
SEQuence:HOPPing on page 212
No Ports
Selects the number of antenna ports the sounding reference signal uses.
Remote command:
CONFigure[:NR5G]:UL[:CC<cc>]:FRAMe<fr>:BWPart<bwp>:SRS:NPORts
on page 210
Rel Power
Defines the relative power of the sounding reference signal in dB.
Remote command:
CONFigure[:NR5G]:UL[:CC<cc>]:FRAMe<fr>:BWPart<bwp>:SRS:POWer
on page 211
4.1.8 PUSCH and PUCCH Configuration
Access: "Overview" > "Signal Description" > "Radio Frame Config" > "PUSCH /
PUCCH Config"
Each slot assigned to carry user data contains one or more resource allocations.
Resource allocations are the physical channels that carry user data or information
about it. The size of an allocation in the resource grid is variable. An allocation covers
one or more physical resource blocks.
The physical uplink shared channel (PUSCH) carries the general user data and is
therefore the most prominent channel in a radio frame that occupies the most resources.
The physical uplink control channel (PUCCH) carries the uplink control information.
66User Manual 1178.9103.02 ─ 04
Page 67

R&S®VSE-K144
Configuration
I/Q Measurement
The remote commands required to configure the PUSCH and PUCCH are described in
Chapter 6.9.9, "PUCCH Allocation Configuration", on page 216.
● General PUSCH / PUCCH Configuration................................................................67
● PUSCH / PUCCH Configuration Table....................................................................68
● Enhanced PUCCH Settings.................................................................................... 71
● Enhanced PUSCH Settings: DMRS........................................................................74
● Enhanced PUSCH Settings: PTRS.........................................................................77
● Enhanced PUSCH Settings: Scrambling / Coding..................................................79
4.1.8.1 General PUSCH / PUCCH Configuration
The allocations in the table refer to a specific bandwidth part and slot.
Selecting the bandwidth part to configure
► Enter the number of the bandwidth part you want to configure in the "Bandwidth
Part Number" field.
The R&S VSE selects the corresponding bandwidth part.
Note that when you select bandwidth part here, the R&S VSE also selects that
bandwidth part in the BWP Config tab and vice versa.
Selecting the slot to configure
► Enter the number of the slot you want to configure in the "Selected Slot" field.
Note that when you select a slot here, the R&S VSE also selects that slot in the
Slot Config tab and vice versa.
67User Manual 1178.9103.02 ─ 04
Page 68

R&S®VSE-K144
4.1.8.2 PUSCH / PUCCH Configuration Table
Configuration
I/Q Measurement
Defining the number of PUSCH and PUCCH allocations
The R&S VSE allows you to allocate up to 100 individual PUSCH and PUCCH allocations to a slot.
► Enter the number of allocations in the "# PUSCH Allocations" or "# PUSCH Alloca-
tions" field.
The R&S VSE expands the configuration table accordingly.
When you add a PUCCH, the new PUCCH is added after the last existing PUCCH
and before the first PUSCH allocation. New PUSCH allocations are always added
at the end of the table.
Remote command (PUSCH allocations): CONFigure[:NR5G]:UL[:CC<cc>]:
FRAMe<fr>:BWPart<bwp>:SLOT<sl>:ALCount on page 223
Remote command (PUCCH allocations): CONFigure[:NR5G]:UL[:CC<cc>]:
FRAMe<fr>:BWPart<bwp>:SLOT<sl>:UCCCount on page 222
The configuration table contains the PUSCH and PUCCH allocations. Each row corresponds to an allocation. The first part of the table shows the PUCCH allocations, the
second part of the table the PUSCH allocations.
Reusing PDSCH allocations
If you are measuring multiple slots with a different configuration, you can copy allocations to other slots once you have defined them in the first slot.
Prerequisite: # of configurable slots > 1
1. Select "Copy To" to copy the allocation configuration to the clipboard.
The R&S VSE opens a dialog to select the target slots.
2. From the "Copy To" menu, select:
● "Slots" to copy the allocation to a number of selected slots.
● "Custom" to copy the allocation to slots based on a certain logic.
3. "Copy To": "Slots":
Select the slots you want to to copy the allocation to.
● Enter a comma-separated list of slots (for example: 1,4,5,7)
● Enter a range of slots (for example: 3-6)
● Enter a combination of both (for example: 1,3-5,8)
4. "Copy To": "Custom":
Select the copy logic.
●
"Period": Copy the allocation to every nth slot.
Example: Period = 3 copies the allocation to every 3rd slot, beginning with slot
0 (if selected slot = 0, the copy appears in slots 3,6,9, etc.).
● "Duration": Copy the allocation to n slots in a row.
68User Manual 1178.9103.02 ─ 04
Page 69

R&S®VSE-K144
Configuration
I/Q Measurement
Example: Period = 3 and duration = 2 copies the allocation to two slots in a
row, every 3rd slot, beginning with slot 0 (if selected slot = 0, the copy appears
in slots 1,3,4,6,7,9,10 etc.)
The R&S VSE only copies the allocation to a slot if the slot configuration accepts a
manual configuration (and is not based on the configuration of another slot).
The remote commands required to configure the PUSCH and PUCCH allocations are
described in Chapter 6.9.9, "PUCCH Allocation Configuration", on page 216 and
Chapter 6.9.10, "PUSCH Allocation Configuration", on page 223.
ID...................................................................................................................................69
Allocation.......................................................................................................................69
Modulation.....................................................................................................................69
Enhanced Settings........................................................................................................70
Number of RBs..............................................................................................................70
Offset RB.......................................................................................................................70
Number of Symbols.......................................................................................................70
Offset Symbols..............................................................................................................71
Rel Power / dB.............................................................................................................. 71
Copy to..........................................................................................................................71
Conflicts........................................................................................................................ 71
ID
The "ID" column shows the unique identifier for the corresponding PUCCH or PUSCH
allocation.
The counter starts at 0.
Remote command:
not supported
Allocation
The "Allocation" column shows the allocation's channel type (PUCCH or PUSCH).
Remote command:
not supported
Modulation
The "Modulation" selects the modulation type for the corresponding allocation (channel).
"DMRS Only" analyzes the DMRS and ignores the payload data in the allocation.
The PUCCH modulation is always QPSK.
69User Manual 1178.9103.02 ─ 04
Page 70

R&S®VSE-K144
Configuration
I/Q Measurement
The PUSCH modulation is either QPSK, 16QAM, 64QAM or 256QAM.
If you turn on transform precoding, you can also select a pi/2-BPSK modulation for the
PUSCH.
Remote command:
PUCCH: not supported
PUSCH allocations: CONFigure[:NR5G]:UL[:CC<cc>]:FRAMe<fr>:
BWPart<bwp>:SLOT<sl>:ALLocation<al>:MODulation on page 227
Enhanced Settings
Opens the "Enhanced Settings" dialog box.
Enhanced settings for PUCCH allocations:
●
PUCCH DMRS
Enhanced settings for PUSCH allocations:
●
PUSCH DMRS
●
PTRS
●
Channel coding and PUSCH scrambling
Remote command:
not supported
Number of RBs
The "Number of RBs" defines the number of physical resource blocks that the allocation occupies in the resource grid.
Remote command:
PUCCH allocation: CONFigure[:NR5G]:UL[:CC<cc>]:FRAMe<fr>:
BWPart<bwp>:SLOT<sl>:PUCCh<cr>:RBCount on page 220
PUSCH allocation: CONFigure[:NR5G]:UL[:CC<cc>]:FRAMe<fr>:
BWPart<bwp>:SLOT<sl>:ALLocation<al>:RBCount on page 228
Offset RB
The "Offset RB" defines the first physical resource block that the allocation uses. The
offset is a value relative to the first resource block used by the bandwidth part the allocation is in.
Remote command:
PUCCH allocation: CONFigure[:NR5G]:UL[:CC<cc>]:FRAMe<fr>:
BWPart<bwp>:SLOT<sl>:PUCCh<cr>:RBOFfset on page 221
PUSCH allocation: CONFigure[:NR5G]:UL[:CC<cc>]:FRAMe<fr>:
BWPart<bwp>:SLOT<sl>:ALLocation<al>:RBOFfset on page 228
Number of Symbols
The "Number of Symbols" defines the number of symbols that the allocation uses.
The number of symbols a PUCCH can use is limited to 3.
Remote command:
PUCCH allocation: CONFigure[:NR5G]:UL[:CC<cc>]:FRAMe<fr>:
BWPart<bwp>:SLOT<sl>:PUCCh<cr>:SCOunt on page 221
PUSCH allocation: CONFigure[:NR5G]:UL[:CC<cc>]:FRAMe<fr>:
BWPart<bwp>:SLOT<sl>:ALLocation<al>:SCOunt on page 229
70User Manual 1178.9103.02 ─ 04
Page 71

R&S®VSE-K144
Configuration
I/Q Measurement
Offset Symbols
The "Offset Symbols" defines the first symbol that the allocation uses. The offset is a
value relative to the first symbol in the slot.
The location of a PUCCH in the resource grid is fix. The symbol offset for PUCCH is
always 0.
Remote command:
PUCCH allocation: CONFigure[:NR5G]:UL[:CC<cc>]:FRAMe<fr>:
BWPart<bwp>:SLOT<sl>:PUCCh<cr>:SOFFset on page 222
PUSCH allocation: CONFigure[:NR5G]:UL[:CC<cc>]:FRAMe<fr>:
BWPart<bwp>:SLOT<sl>:ALLocation<al>:SOFFset on page 229
Rel Power / dB
The "Rel Power / dB" defines the relative power of the corresponding allocation.
Remote command:
PUCCH allocation: CONFigure[:NR5G]:UL[:CC<cc>]:FRAMe<fr>:
BWPart<bwp>:SLOT<sl>:PUCCh<cr>:POWer on page 220
PUSCH allocation: CONFigure[:NR5G]:UL[:CC<cc>]:FRAMe<fr>:
BWPart<bwp>:SLOT<sl>:ALLocation<al>:POWer on page 228
Copy to
Opens a dialog to copy the allocation configuration to other slots.
For details, see "Reusing PDSCH allocations" on page 68.
Remote command:
PUSCH: CONFigure[:NR5G]:UL[:CC<cc>]:FRAMe<fr>:BWPart<bwp>:
SLOT<sl>:ALLocation<al>:COPY on page 225
PUCCH: CONFigure[:NR5G]:UL[:CC<cc>]:FRAMe<fr>:BWPart<bwp>:
SLOT<sl>:PUCCh<cr>:COPY on page 218
Conflicts
The R&S VSE indicates a conflict in the following cases.
●
If the allocation is located in a symbol reserved for uplink.
●
If two or more allocations use the same resource blocks (overlapping allocations).
●
If the total number of resource blocks over all allocations is greater than 273.
To remove a conflict, try to reduce the total number of resource blocks or change the
RB offset.
Remote command:
not supported
4.1.8.3 Enhanced PUCCH Settings
The enhanced PUCCH settings contain settings to configure the PUCCH demodulation
reference signal (PUCCH DMRS).
71User Manual 1178.9103.02 ─ 04
Page 72

R&S®VSE-K144
Configuration
I/Q Measurement
The remote commands required to configure the PUCCH are described in Chap-
ter 6.9.11, "Enhanced PUCCH Allocation Configuration", on page 230.
PUCCH Format.............................................................................................................72
PUCCH DMRS Rel Power............................................................................................ 72
Group Hopping..............................................................................................................72
Intra Slot Frequency Hopping....................................................................................... 73
Initial Cyclic Shift...........................................................................................................73
Time Domain OCC Index..............................................................................................73
PUCCH DMRS Sequence Generation..........................................................................73
PUCCH Format
3GPP defines several PUCCH format. The PUCCH format has an effect on several
PUCCH characteristics, like the mapping to physical resource blocks.
You can select a different PUCCH format for each PUCCH allocation.
Depending on the format, you can access different enhanced settings for the PUCCH.
Remote command:
CONFigure[:NR5G]:UL[:CC<cc>]:FRAMe<fr>:BWPart<bwp>:SLOT<sl>:
PUCCh<cr>:FORMat on page 236
PUCCH DMRS Rel Power
Available for all PUCCH formats.
Defines the power of the PUCCH DMRS relative to the power of the PUCCH resource
elements.
Remote command:
CONFigure[:NR5G]:UL[:CC<cc>]:FRAMe<fr>:BWPart<bwp>:SLOT<sl>:
PUCCh<cr>:DMRS:POWer on page 233
Group Hopping
Available for PUCCH formats 0 and 1.
Turns group and sequence hopping for the PUCCH demodulation reference signal on
and off.
●
Select "Neither" to use neither group nor sequence hopping.
●
Select "Enable" to use group hopping only.
●
Select "Disable" to use sequence hopping only.
The frequency hopping index n
used to calculate the sequence group if you turn on
hop
hopping depends on the intra slot frequency hopping configuration.
The hopping sequence depends on the "Hopping ID" parameter. 3GPP (38.211)
defines two methods by which the PUCCH hopping sequence can be calculated.
"n_ID^Cell":
72User Manual 1178.9103.02 ─ 04
Page 73

R&S®VSE-K144
Configuration
I/Q Measurement
Calculates the sequence based on the cell ID, if the higher layers provide no value.
"n_ID^Cell" has the same value as the cell ID.
"n_ID"
Calculates the sequence based on a pseudo-random seed value. You can define the
seed value in the input field that becomes available when you select this method.
Remote command:
State: CONFigure[:NR5G]:UL[:CC<cc>]:FRAMe<fr>:BWPart<bwp>:
SLOT<sl>:PUCCh<cr>:DMRS:GHOPping on page 230
Hopping ID method: CONFigure[:NR5G]:UL[:CC<cc>]:FRAMe<fr>:
BWPart<bwp>:SLOT<sl>:PUCCh<cr>:DMRS:HID on page 231
Seed value: CONFigure[:NR5G]:UL[:CC<cc>]:FRAMe<fr>:BWPart<bwp>:
SLOT<sl>:PUCCh<cr>:DMRS:NID on page 233
Intra Slot Frequency Hopping
Available for PUCCH formats 0 and 1.
Turns hopping of the PUCCH demodulation reference signal within a slot on and off.
The state of this parameter controls the value of the frequency hopping index n
hop
used
to calculate the group hopping sequence.
When you turn on intra slot frequency hopping, you can define the physical resource
block offset for the second hop ("Second Hop PRB").
Remote command:
State: CONFigure[:NR5G]:UL[:CC<cc>]:FRAMe<fr>:BWPart<bwp>:
SLOT<sl>:PUCCh<cr>:DMRS:ISFHopping on page 232
Second hop PRB: CONFigure[:NR5G]:UL[:CC<cc>]:FRAMe<fr>:
BWPart<bwp>:SLOT<sl>:PUCCh<cr>:DMRS:SHPRb on page 234
Initial Cyclic Shift
Available for PUCCH formats 0 and 1.
As defined in TS 38.211, the value is required to calculate the cyclic shift for the hop-
ping sequence and thus defines the frequency positions of the different hops.
Remote command:
CONFigure[:NR5G]:UL[:CC<cc>]:FRAMe<fr>:BWPart<bwp>:SLOT<sl>:
PUCCh<cr>:DMRS:ICSHift on page 232
Time Domain OCC Index
Defines the orthogonal sequence index I. As defined in TS 38.211, the value is
required to select the orthogonal sequence, used for the blockwise spreading.
Remote command:
CONFigure[:NR5G]:UL[:CC<cc>]:FRAMe<fr>:BWPart<bwp>:SLOT<sl>:
PUCCh<cr>:DMRS:TDOindex on page 235
PUCCH DMRS Sequence Generation
Available for PUCCH format 2.
3GPP (38.211) defines two methods by which the PUCCH DMRS sequence can be
calculated. You can select the method with the "Sequence Generation" parameter.
73User Manual 1178.9103.02 ─ 04
Page 74

R&S®VSE-K144
4.1.8.4 Enhanced PUSCH Settings: DMRS
Configuration
I/Q Measurement
"n_ID^DMRS":
Calculates the sequence based on a pseudo-random seed value. You can define the
seed value in the input field that becomes available when you select this method.
"n_ID^Cell":
Calculates the sequence based on the cell ID, if the higher layers provide no value.
"n_ID^Cell" has the same value as the cell ID.
Remote command:
Method: CONFigure[:NR5G]:UL[:CC<cc>]:FRAMe<fr>:BWPart<bwp>:
SLOT<sl>:PUCCh<cr>:DMRS:SGENeration on page 234
Seed value: CONFigure[:NR5G]:UL[:CC<cc>]:FRAMe<fr>:BWPart<bwp>:
SLOT<sl>:PUCCh<cr>:DMRS:SID on page 235
Access: "Overview" > "Signal Description" > "Radio Frame Config" > "PUSCH /
PUCCH Config" > "Enhanced Settings" > "PUSCH DMRS Config"
The remote commands required to configure the DMRS are described in Chap-
ter 6.9.12, "Enhanced PUSCH Settings: DMRS", on page 236.
User ID..........................................................................................................................74
PUSCH DMRS Location............................................................................................... 75
Multi Symbol DMRS......................................................................................................75
PUSCH DMRS Sequence Generation (Transform Precoding = Off)............................ 75
PUSCH DMRS Sequence Generation (Transform Precoding = On)............................ 76
PUSCH DMRS Rel Power............................................................................................ 76
Codeword to Layer Mapping.........................................................................................76
Antenna Port................................................................................................................. 77
CDM Groups w/o Data..................................................................................................77
User ID
Selects the radio network temporary identifier (RNTI) used to identify different users
currently accessing the network. The corresponding allocation and its configuration is
assigned specifically to the ID you select in this field.
By default, the RNTI is the same the bandwidth part index.
74User Manual 1178.9103.02 ─ 04
Page 75

R&S®VSE-K144
Configuration
I/Q Measurement
Remote command:
CONFigure[:NR5G]:UL[:CC<cc>]:FRAMe<fr>:BWPart<bwp>:SLOT<sl>:
ALLocation<al>:UEID on page 245
PUSCH DMRS Location
The "Config Type" defines the mapping of the DMRS to physical resources elements
as defined in 3GPP 38.211. You can select from configuration "Type 1" or "Type 2".
The "Mapping Type" defines the position of the first DMRS symbol in the resource grid.
Mapping "Type A" is a location relative to the start of the slot. Mapping "Type B" is a
location relative to th start of the PDSCH resources.
For mapping type A, you can select an additional parameter "Type A Pos" to select the
first symbol that the DMRS uses.
Remote command:
Configuration type: CONFigure[:NR5G]:UL[:CC<cc>]:FRAMe<fr>:
BWPart<bwp>:SLOT<sl>:ALLocation<al>:DMRS:CTYPe on page 239
Mapping type: CONFigure[:NR5G]:UL[:CC<cc>]:FRAMe<fr>:BWPart<bwp>:
SLOT<sl>:ALLocation<al>:DMRS:MTYPe on page 240
Type A position: CONFigure[:NR5G]:UL[:CC<cc>]:FRAMe<fr>:BWPart<bwp>:
SLOT<sl>:ALLocation<al>:DMRS:TAPos on page 244
Multi Symbol DMRS
The DMRS can be transmitted on one or two symbols, depending on the "DMRS
Length".
You can also add additional DMRS with the "DMRS Add Position Index".
Remote command:
Length: CONFigure[:NR5G]:UL[:CC<cc>]:FRAMe<fr>:BWPart<bwp>:
SLOT<sl>:ALLocation<al>:DMRS:MSYMbol:LENGth on page 240
Position Index: CONFigure[:NR5G]:UL[:CC<cc>]:FRAMe<fr>:BWPart<bwp>:
SLOT<sl>:ALLocation<al>:DMRS:MSYMbol:APOSition on page 239
PUSCH DMRS Sequence Generation (Transform Precoding = Off)
3GPP (38.211) defines two methods by which the PUSCH DMRS sequence can be
calculated when you turn off transform precoding. You can select the method with the
"Sequence Generation" parameter.
"n_ID^DMRS":
Calculates the sequence based on a pseudo-random seed value. You can define the
seed value in the input field that becomes available when you select this method.
"n_ID^Cell":
Calculates the sequence based on the cell ID, if the higher layers provide no value.
"n_ID^Cell" has the same value as the cell ID.
75User Manual 1178.9103.02 ─ 04
Page 76

R&S®VSE-K144
Configuration
I/Q Measurement
Remote command:
Method: CONFigure[:NR5G]:UL[:CC<cc>]:FRAMe<fr>:BWPart<bwp>:
SLOT<sl>:ALLocation<al>:DMRS:SGENeration on page 244
Seed value: CONFigure[:NR5G]:UL[:CC<cc>]:FRAMe<fr>:BWPart<bwp>:
SLOT<sl>:ALLocation<al>:DMRS:NID on page 241
Scrambling ID: CONFigure[:NR5G]:UL[:CC<cc>]:FRAMe<fr>:BWPart<bwp>:
SLOT<sl>:ALLocation<al>:DMRS:NSCid on page 243
PUSCH DMRS Sequence Generation (Transform Precoding = On)
3GPP (38.211) defines three methods by which the PUSCH DMRS sequence can be
calculated when you turn on transform precoding. You can select the method with the
"Sequence Generation" parameter.
"n_ID^Cell":
Calculates the sequence based on the cell ID, if the higher layers provide no value.
"n_ID^Cell" has the same value as the cell ID.
"n_ID^PUSCH":
Calculates the sequence based on a pseudo-random seed value. You can define the
seed value in the input field that becomes available when you select this method.
"n_ID^nSCID":
Calculates the sequence using the method defined for transform precoding = off
("Sequence Generation").
Remote command:
Method: CONFigure[:NR5G]:UL[:CC<cc>]:FRAMe<fr>:BWPart<bwp>:
SLOT<sl>:ALLocation<al>:DMRS:NIRS on page 242
Seed value: CONFigure[:NR5G]:UL[:CC<cc>]:FRAMe<fr>:BWPart<bwp>:
SLOT<sl>:ALLocation<al>:DMRS:NIRid on page 241
PUSCH DMRS Rel Power
Defines the power of the PUSCH DMRS relative to the power of the PUSCH resource
elements.
When you turn on transform precoding after a preset, the R&S VSE automatically
changes the relative power to 3 dB, according to 3GPP 38.214.
Remote command:
CONFigure[:NR5G]:UL[:CC<cc>]:FRAMe<fr>:BWPart<bwp>:SLOT<sl>:
ALLocation<al>:DMRS:POWer on page 243
Codeword to Layer Mapping
Selects the number of layers for a PUSCH allocation and the codebook index. The
combination of layers and number of codewords determines the layer mapping. Each
layer is transmitted on a separate antenna port.
The number of supported layers depends on:
●
DMRS configuration type
●
DMRS length
●
State of transform precoding
76User Manual 1178.9103.02 ─ 04
Page 77

R&S®VSE-K144
Configuration
I/Q Measurement
Remote command:
CONFigure[:NR5G]:UL[:CC<cc>]:FRAMe<fr>:BWPart<bwp>:SLOT<sl>:
ALLocation<al>:CLMapping on page 237
Antenna Port
Each layer of a PUSCH allocation is mapped to a certain antenna port. The "Antenna
Port" dropdown menu selects the antenna ports that are used for the transmission of
the PUSCH allocation.
Example:
●
DMRS configuration type = 1
●
DMRS length = 2
●
Transform precoding
●
Codeword to layer mapping = 4/1, which corresponds to 4 layers
For this configuration you can map the layers to antenna ports "0,1,4,5", "0,2,4,6" or
"2,3,6,7".
The antenna ports (layers) that are actually analyzed depends on the antenna port
configuration.
Remote command:
CONFigure[:NR5G]:UL[:CC<cc>]:FRAMe<fr>:BWPart<bwp>:SLOT<sl>:
ALLocation<al>:DMRS:AP on page 238
CDM Groups w/o Data
Selects the number of CDM groups that are reserved and contain no data. They are
therefore not used by the PUSCH for data transmission. In the resource grid, the
resource elements for CDM (between PUSCH DMRS resource elements) remain
empty.
Note that the different values for this parameter change the default values of the rela-
tive DMRS power according to 3GPP 38.214, table 4.1-1.
Remote command:
CONFigure[:NR5G]:UL[:CC<cc>]:FRAMe<fr>:BWPart<bwp>:SLOT<sl>:
ALLocation<al>:DMRS:CGWD on page 238
4.1.8.5 Enhanced PUSCH Settings: PTRS
Access: "Overview" > "Signal Description" > "Radio Frame Config" > "PUSCH /
PUCCH Config" > "Enhanced Settings" > "Phase-tracking RS Config"
77User Manual 1178.9103.02 ─ 04
Page 78

R&S®VSE-K144
Configuration
I/Q Measurement
The remote commands required to configure the DMRS are described in Chap-
ter 6.9.13, "Enhanced PUSCH Settings: PTRS", on page 245.
Functions in the "Scrambling / Coding" dialog box described elsewhere:
●
"User ID" on page 74
PTRS Configuration (Transform Precoding = Off).........................................................78
PTRS Configuration (Transform Precoding = On)........................................................ 79
PTRS Configuration (Transform Precoding = Off)
The phase tracking reference signal (PTRS) is a UE-specific reference signal that is
used to compensate for the phase noise of the oscillator. The PTRS is transmitted in
resource blocks used for the PUSCH.
If the PTRS "State" is on, you can define its "Power" relative to the PUSCH and its
location in the resource grid.
The parameters that define the PTRS location depend on the selected precoding
mode.
For "Transform Precoding" = "Off", the following parameters define the PTRS location.
The "L_PTRS" defines distance between the PTRS in terms of OFDM symbols (trans-
mission every 1, 2 or 4 OFDM symbols). If the subcarrier used by the PTRS also contains a DMRS, the distance can be larger.
The "K_PTRS" and "DL-PTRS-RE-Offset" define the location of the PTRS in the frequency domain. K
defines the distances between the PTRS in terms of subcarrier.
PTRS
You can also define an additional frequency offset for the PTRS relative to the first subcarrier.
Remote command:
State: CONFigure[:NR5G]:UL[:CC<cc>]:FRAMe<fr>:BWPart<bwp>:
SLOT<sl>:ALLocation<al>:PTRS[:STATe] on page 250
Power: CONFigure[:NR5G]:UL[:CC<cc>]:FRAMe<fr>:BWPart<bwp>:
SLOT<sl>:ALLocation<al>:PTRS:POWer on page 248
L
: CONFigure[:NR5G]:UL[:CC<cc>]:FRAMe<fr>:BWPart<bwp>:
PTRS
SLOT<sl>:ALLocation<al>:PTRS:L on page 246
K
: CONFigure[:NR5G]:UL[:CC<cc>]:FRAMe<fr>:BWPart<bwp>:
PTRS
SLOT<sl>:ALLocation<al>:PTRS:K on page 246
Offset: CONFigure[:NR5G]:UL[:CC<cc>]:FRAMe<fr>:BWPart<bwp>:
SLOT<sl>:ALLocation<al>:PTRS:REOFfset on page 249
78User Manual 1178.9103.02 ─ 04
Page 79

R&S®VSE-K144
Configuration
I/Q Measurement
PTRS Configuration (Transform Precoding = On)
The phase tracking reference signal (PTRS) is a UE-specific reference signal that is
used to compensate for the phase noise of the oscillator. The PTRS is transmitted in
resource blocks used for the PUSCH.
If the PTRS "State" is on, you can define its "Power" relative to the PUSCH and its
location in the resource grid.
The R&S VSE automatically selects the default power according to 3GPP 38.214, table
6.2.3.2-2. If required, you can also define a different level.
The parameters that define the PTRS location depend on the selected precoding
mode.
For "Transform Precoding" = "On", the following parameters define the PTRS location.
The "N_group^PTRS" defines the number of PTRS groups to transmit (2, 4 or 8).
The "N_samp^group" defines the number of samples allocated to an PTRS group (2 or
4). From the number of used samples in a PTRS group, you can deduct the number of
samples in a OFDM symbol.
The "L_PTRS" defines distance between the PTRS in terms of OFDM symbols (transmission every 1, 2 or 4 OFDM symbols). If the subcarrier used by the PTRS also contains a DMRS, the distance can be larger.
Remote command:
State: CONFigure[:NR5G]:UL[:CC<cc>]:FRAMe<fr>:BWPart<bwp>:
SLOT<sl>:ALLocation<al>:PTRS[:STATe] on page 250
Power: CONFigure[:NR5G]:UL[:CC<cc>]:FRAMe<fr>:BWPart<bwp>:
SLOT<sl>:ALLocation<al>:PTRS:POWer on page 248
N
: CONFigure[:NR5G]:UL[:CC<cc>]:FRAMe<fr>:BWPart<bwp>:
group
SLOT<sl>:ALLocation<al>:PTRS:NGRoups on page 247
N
: CONFigure[:NR5G]:UL[:CC<cc>]:FRAMe<fr>:BWPart<bwp>:
samp
SLOT<sl>:ALLocation<al>:PTRS:NSAMples on page 248
L
: CONFigure[:NR5G]:UL[:CC<cc>]:FRAMe<fr>:BWPart<bwp>:
PTRS
SLOT<sl>:ALLocation<al>:PTRS:L on page 246
4.1.8.6 Enhanced PUSCH Settings: Scrambling / Coding
Access: "Overview" > "Signal Description" > "Radio Frame Config" > "PUSCH /
PUCCH Config" > "Enhanced Settings" > "Scrambling / Coding"
79User Manual 1178.9103.02 ─ 04
Page 80

R&S®VSE-K144
Configuration
I/Q Measurement
The remote commands required to configure the channel coding and scrambling are
described in Chapter 6.9.14, "Enhanced PUSCH Settings: Scrambling / Coding",
on page 250.
Functions in the "Scrambling / Coding" dialog box described elsewhere:
●
"User ID" on page 74
Channel Coding............................................................................................................ 80
PUSCH Scrambling.......................................................................................................81
Channel Coding
Channel coding parameters determine the code rate of the PUSCH, which is the ratio
between transmitted bits and maximum possible bits in a subframe (or 1 ms transport
block). Because the number of bits in a subframe is variable, the target code rate has
to be derived from the modulation order in combination with an index I
MCS
.
You can select the modulation order for the PUSCH (one of several tables, one for
each modulation type) from the "MCS Table" dropdown menu and select the corresponding index value (defined in the tables) in the "I_MCS" input field. The target code
rates for modulation order and index are defined in 3GPP 38.214, chapter 5.1.3.
In addition to the modulation order and I
, the number of transmitted bits depends on
MCS
the "Redundancy Version Index", which is used to re-transmit data in case of transmission errors. Depending on the redundancy version index, the PUSCH contains a different amount of parity bits for error detection: Index 0 adds 1 sequence of parity bits,
index 1 adds two sequences of parity bits etc.
Because redundancy version 1 and 2 do not transmit a complete set of data (only new
bits that have not been transmitted correctly before), it is not possible to decode such
signals, even if the signal-to-noise ration is perfect. Only redundancy version 3 transmits a complete set of data, and can therefore be decoded without the knowledge of
previous data.
80User Manual 1178.9103.02 ─ 04
Page 81

R&S®VSE-K144
Configuration
I/Q Measurement
Remote command:
Modulation order: CONFigure[:NR5G]:UL[:CC<cc>]:FRAMe<fr>:
BWPart<bwp>:SLOT<sl>:ALLocation<al>:CCODing:MCSTable on page 251
MCS index: CONFigure[:NR5G]:UL[:CC<cc>]:FRAMe<fr>:BWPart<bwp>:
SLOT<sl>:ALLocation<al>:CCODing:IMCS on page 250
Redundancy version: CONFigure[:NR5G]:UL[:CC<cc>]:FRAMe<fr>:
BWPart<bwp>:SLOT<sl>:ALLocation<al>:CCODing:RVINdex on page 251
PUSCH Scrambling
3GPP (38.211) defines two methods by which the PUSCH scrambling can be calculated. You can select the method with the "Scrambling" parameter.
●
"Data-Scrambling-ID"
Scrambles the PUSCH based on a pseudo-random seed value. You can define the
seed value in the input field that becomes available when you select this method.
●
"n_ID^Cell"
Scrambles the PUSCH based on the cell ID, if the higher layers provide no value
for "DMRS-Scrambling-ID". "n_ID^Cell" has the same value as the cell ID.
Remote command:
Method: CONFigure[:NR5G]:UL[:CC<cc>]:FRAMe<fr>:BWPart<bwp>:
SLOT<sl>:ALLocation<al>:SCRambling on page 252
Seed value: CONFigure[:NR5G]:UL[:CC<cc>]:FRAMe<fr>:BWPart<bwp>:
SLOT<sl>:ALLocation<al>:SCRambling:DSID on page 252
4.1.9 Antenna Port Configuration
Access: "Overview" > "Signal Description" > "Ant Port Mapping"
Antenna ports are not physical antennas, but rather are a logical concept. Each
antenna port carries certain signal components (= physical channels) that should be
transmitted under the same conditions. Physical channels can be transmitted on a single antenna port, or on several antenna ports. Each antenna port in turn can be mapped to one of the physical antennas. Typically, one physical antenna combines several
antenna ports. However, one specific antenna port can also be transmitted on more
than one physical antenna.
The dialog is designed as a table with two rows representing the physical antennas
("Config 1" and "Config 2").
The columns represent the physical channels.
The "Ant Port Mapping" dialog box allows you to map the antenna ports used by the
various physical channels defined by 3GPP to up to eight layer configurations.
81User Manual 1178.9103.02 ─ 04
Page 82

R&S®VSE-K144
Configuration
I/Q Measurement
The remote commands required to configure the antenna ports are described in Chap-
ter 6.9.15, "Antenna Port Configuration", on page 253.
State..............................................................................................................................82
PUSCH..........................................................................................................................82
PUCCH......................................................................................................................... 82
SRS...............................................................................................................................83
State
Turns the corresponding antenna port configuration on and off and applies it to the
measurement.
Note that you can currently measure only one of the two configurations (physical
antenna). If you turn on one configuration, the other is automatically turned off.
Remote command:
CONFigure[:NR5G]:UL[:CC<cc>]:PAMapping<cf>:STATe on page 254
PUSCH
Selects the antenna ports that transmit the PUSCH. You can assign the PUSCH to
multiple antenna ports (1000 to 1011).
To select the antenna port that transmits the PUSCH, select the PUSCH DMRS
antenna port. Selecting the PUSCH DMRS antenna port (0 to 11) automatically
assigns the PUSCH to the corresponding antenna ports (ports 1000 to 1011). For
example, mapping the PUSCH DMRS to AP 3, maps the PUSCH to AP 1003.
When you select the table cell, the R&S VSE opens another dialog box in which you
can turn the transmission of the PUSCH on certain antenna ports on and off.
By default, the PUSCH is transmitted on antenna port 1000 (for physical antenna 1)
and antenna port 1001 (for physical antenna 2).
Thus, the PUSCH DMRS is transmitted on antenna ports 0 and 1, by default.
Remote command:
PUSCH (DMRS): CONFigure[:NR5G]:UL[:CC<cc>]:PAMapping<cf>:PUSCh:
AP<ap> on page 253
PUCCH
Shows the antenna ports that transmit the PUCCH.
82User Manual 1178.9103.02 ─ 04
Page 83

R&S®VSE-K144
4.1.10 Advanced Settings
Configuration
I/Q Measurement
The PUCCH is assumed to be transmitted on antenna port 2000.
Remote command:
not supported
SRS
Shows the antenna ports that transmit the PUCCH.
The SRS is assumed to be transmitted on antenna port 1000.
Remote command:
not supported
Access: "Overview" > "Signal Description" > "Advanced Settings"
Advanced settings contain settings that are independent of the radio frame configuration.
● Global Settings........................................................................................................83
● Reference Point A...................................................................................................86
4.1.10.1 Global Settings
Access: "Overview" > "Signal Description" > "Advanced Settings" > "Global Settings"
The global settings contain various settings that have an effect on how the R&S VSE
analyzes the signal.
83User Manual 1178.9103.02 ─ 04
Page 84

R&S®VSE-K144
Configuration
I/Q Measurement
The remote commands required to configure the global settings are described in Chap-
ter 6.9.16, "Advanced Settings: Global", on page 254.
Handling of Carrier Leakage......................................................................................... 84
Transform Precoding.....................................................................................................84
Frame Number n_f........................................................................................................85
PUSCH Hopping........................................................................................................... 85
PUSCH Frequency Hopping......................................................................................... 85
RF Upconversion.......................................................................................................... 85
Extreme Conditions.......................................................................................................86
Handling of Carrier Leakage
Controls the way the DC carrier is handled during signal analysis.
You can either leave the DC carrier as it is, remove it from the analysis or compensate
for carrier leakage effects.
Removing the DC carrier or compensating leakage effects is useful if the DC carrier is
located on a subcarrier, which would have a negative effect on the EVM.
●
If you leave the DC carrier as it is, the R&S VSE includes the DC carrier in all
results.
●
If you ignore the DC carrier, the R&S VSE removes the DC carrier from all results
by ignoring the corresponding subcarriers. The DC carrier is assumed to be in the
center of the channel bandwidth.
●
If you compensate for carrier leakage, the R&S VSE includes the subcarriers used
by the DC carrier in the result analysis, but compensates them mathematically.
If you turn on transform precoding, "Ignore DC" is unavailable.
Remote command:
CONFigure[:NR5G]:UL[:CC<cc>]:IDC on page 255
Transform Precoding
5G NR supports two channel access methods for uplink signals, CP-OFDM and DFT-sOFDM. Depending on the use case, one or the other has advantages over the other.
For DFT-s-OFDM, an additional signal processing stage, transform precoding, is
applied. Transform precoding is the term for the digital Fourier transformation (DFT)
used in the 5G NR standard.
CP-OFDM:
DFT-s-OFDM:
Figure 4-4: Signal processing depending on channel access scheme
Transform
precoding
Subcarrier
mapping
Subcarrier
mapping
IFFT
IFFT
Add
cyclic prefix
Add
cyclic prefix
With the "Transform Precoding" parameter, you can select which channel access
method is analyzed.
●
"On": Analysis of the signal with precoding operation (DFT-s-OFDM).
●
"Off": Analysis of the signal without precoding operation (CP-OFDM).
84User Manual 1178.9103.02 ─ 04
Page 85

R&S®VSE-K144
Configuration
I/Q Measurement
Note that the state of the "Transform Precoding" affects the settings available for the
PUSCH PTRS.
●
Without precoding: "PTRS Configuration (Transform Precoding = Off)" on page 78
●
With precoding: "PTRS Configuration (Transform Precoding = On)" on page 79
Remote command:
CONFigure[:NR5G]:UL[:CC<cc>]:TPRecoding on page 257
Frame Number n_f
Defines the system frame number nf in the capture buffer. For multiple frame analysis it
defines the system frame number of the first frame you are analyzing.
Remote command:
CONFigure[:NR5G]:UL[:CC<cc>]:FNNF on page 254
PUSCH Hopping
Selects a hopping mode for the PUSCH DMRS sequence as defined in 3GPP 38.211:
6.4.1.1.1.2 "Sequence Generation when Transform Precoding is Enabled".
When you turn on transform precoding, you can select one of the following hopping
modes.
●
"None" (no hopping)
●
"Group Hopping"
●
"Sequence Hopping"
Remote command:
CONFigure[:NR5G]:UL[:CC<cc>]:PUSCh:HOPPing on page 255
PUSCH Frequency Hopping
Selects the PUSCH frequency hopping mode.
●
"Disabled": PUSCH always uses the same frequency.
●
"Intra-Slot Hopping": PUSCH changes the frequency within a slot.
Intra-slot hopping requires exactly one PUSCH allocation in the signal. Using intra-slot
hopping adds a secondary PUSCH allocation, which corresponds to the second hop.
The secondary allocation has the same characteristics as the primary PUSCH allocation.
You can control the hopping frequencies in terms of the resource blocks the allocation
is using.
Note that the DMRS length is always "1" when you turn on intra-slot hopping.
Remote command:
CONFigure[:NR5G]:UL[:CC<cc>]:PUSCh:FHOPping on page 255
RF Upconversion
It is necessary to upconvert the baseband signal to the radio frequency. The upconversion requires a frequency related phase compensation after each symbol according to
3GPP 38.211: 5.4 "Modulation and Upconversion".
When you turn off "Phase Compensation", the R&S VSE assumes that the applied signal is not phase-compensated and analyzes the signal accordingly.
85User Manual 1178.9103.02 ─ 04
Page 86

R&S®VSE-K144
Configuration
I/Q Measurement
When you turn on "Phase Compensation", the R&S VSE assumes that the applied signal is already phase-compensated for a specific frequency. This frequency is either the
current center frequency ("CF") or an arbitrary frequency ("Manual)". You can define
the frequency in the corresponding input field.
Remote command:
State: CONFigure[:NR5G]:UL[:CC<cc>]:RFUC:STATe on page 257
Mode: CONFigure[:NR5G]:UL[:CC<cc>]:RFUC:FZERo:MODE on page 256
Frequency: CONFigure[:NR5G]:UL[:CC<cc>]:RFUC:FZERo:FREQuency
on page 256
Extreme Conditions
Turns extreme conditions on and off.
If you turn the extreme conditions on, the R&S VSE adjusts the limits for the limit check
of the spectrum flatness evaluation.
Available for deployments in FR1.
Note that the state of this paramater is the same for all component carriers - when you
change it for one component carrier, the state is automatically adjusted in the other
component carriers.
Remote command:
CONFigure[:NR5G]:UL[:CC<cc>]:SFLatness:ECONditions on page 257
4.1.10.2 Reference Point A
Access: "Overview" > "Signal Description" > "Advanced Settings" > "Reference Point
A"
Point A, as defined in 3GPP 38.211: 4.4.4.2 "Point A", is a reference point with a fixed
frequency. The resource block grid for each subcarrier spacing is defined relative to the
reference point A. It is aligned with the center of subcarrier 0 of common resource
block 0, independent of the numerology.
86User Manual 1178.9103.02 ─ 04
Page 87

R&S®VSE-K144
Configuration
I/Q Measurement
The remote commands required to configure the reference point A are described in
Chapter 6.9.16, "Advanced Settings: Global", on page 254.
k_0................................................................................................................................ 87
Reference Point A.........................................................................................................87
k_0
The k_0 defines an additional (subcarrier) offset of the resource grid with a specific
subcarrier spacing relative to the reference point A.
You can select the offset you require from the "SCS <x> kHz" dropdown menus. Note
that the dropdown menus are only available if you are using a bandwidth part with the
corresponding subcarrier spacing.
Remote command:
SCS 15 kHz: CONFigure[:NR5G]:UL[:CC<cc>]:RPA:KZERo:SCFT on page 258
SCS 30 kHz: CONFigure[:NR5G]:UL[:CC<cc>]:RPA:KZERo:SCTT on page 259
SCS 60 kHz: CONFigure[:NR5G]:UL[:CC<cc>]:RPA:KZERo:SCST on page 259
SCS 120 kHz: CONFigure[:NR5G]:UL[:CC<cc>]:RPA:KZERo:SCOT on page 259
Reference Point A
You can define the location of the reference point relative to the center frequency of the
carrier with the "Relative to CF" parameter.
The value range is limited, depending on various parameters like channel bandwidth or
used subcarrier spacing. You can change it in steps of 12 times the largest subcarrier
spacing.
The R&S VSE also displays absolute frequency location of the reference point A.
Remote command:
Center frequency: CONFigure[:NR5G]:UL[:CC<cc>]:RPA:RTCF on page 260
Absolute frequency: CONFigure[:NR5G]:UL[:CC<cc>]:RPA:AFRequency?
on page 258
4.1.11 Selecting the Input and Output Source
The application supports several input sources and outputs.
The supported input sources depend on the connected instrument. Refer to the documentation of the instrument in use for a comprehensive description of input sources.
● RF Input.................................................................................................................. 87
● I/Q File Input............................................................................................................89
4.1.11.1 RF Input
Functions to configure the RF input described elsewhere:
●
" Input Coupling " on page 95
●
" Impedance " on page 95
87User Manual 1178.9103.02 ─ 04
Page 88

R&S®VSE-K144
Configuration
I/Q Measurement
Note that the actual functions to configure the RF input depend on the configuration of
the connected instrument.
High Pass Filter 1 to 3 GHz ..........................................................................................88
YIG-Preselector ............................................................................................................88
Capture Mode............................................................................................................... 88
Oscilloscope Sample Rate............................................................................................89
High Pass Filter 1 to 3 GHz
Activates an additional internal high-pass filter for RF input signals from 1 GHz to
3 GHz. This filter is used to remove the harmonics of the analyzer to measure the harmonics for a DUT, for example.
This function may require an additional hardware option on the connected instrument.
(Note: for RF input signals outside the specified range, the high-pass filter has no
effect. For signals with a frequency of approximately 4 GHz upwards, the harmonics
are suppressed sufficiently by the YIG-preselector, if available.)
Remote command:
INPut<ip>:FILTer:HPASs[:STATe] on page 261
YIG-Preselector
Enables or disables the YIG-preselector, if available on the connected instrument.
Note that the YIG-preselector is active only on frequencies greater than 8 GHz. There-
fore, switching the YIG-preselector on or off has no effect if the frequency is below that
value.
In order to make use of the optional 90 GHz frequency extension (R&S VSE-B90G),
the YIG-preselector must be disabled.
Remote command:
INPut<ip>:FILTer:YIG[:STATe] on page 262
Capture Mode
Determines how data from an oscilloscope is input to the R&S VSE software.
This function is only available for a connected R&S oscilloscope with a firmware ver-
sion 3.0.1.1 or higher (for other versions and instruments the input is always I/Q data).
"I/Q"
"Waveform"
The measured waveform is converted to I/Q data directly on the R&S
oscilloscope (requires option K11), and input to the R&S VSE software as I/Q data.
For data imports with small bandwidths, importing data in this format
is quicker. However, the maximum record length is restricted by the
R&S oscilloscope. (Memory options on the R&S oscilloscope are not
available for I/Q data.)
The data is input in its original waveform format and converted to I/Q
data in the R&S VSE software. No additional options are required on
the R&S oscilloscope.
For data imports with large bandwidths, this format is more convenient as it allows for longer record lengths if appropriate memory
options are available on the R&S oscilloscope.
88User Manual 1178.9103.02 ─ 04
Page 89

R&S®VSE-K144
Configuration
I/Q Measurement
"Auto"
Remote command:
INPut<ip>:RF:CAPMode on page 262
Oscilloscope Sample Rate
Determines the sample rate used by the connected oscilloscope.
This setting is only available if an R&S oscilloscope is used to obtain the input data,
either directly or via the R&S FSW.
"10 GHz"
"20 GHz"
"40 GHz"
Uses "I/Q" mode when possible, and "Waveform" only when required
by the application (e.g. Pulse measurement, Oscilloscope Baseband
Input).
Default for waveform Capture Mode (not available for I/Q Capture
Mode); provides maximum record length
Achieves a higher decimation gain, but reduces the record length by
half.
Only available for R&S oscilloscope models that support a sample
rate of 20 GHz (see data sheet).
For R&S oscilloscopes with an analysis bandwidth of 4 GHz or larger,
a sample rate of 20 GHZ is always used in waveform Capture Mode
Provides a maximum sample rate.
Only available for I/Q Capture Mode, and only for R&S RTP13/RTP16
models that support a sample rate of 40 GHz (see data sheet)
Remote command:
Input source R&S FSW via oscilloscope:
SYSTem:COMMunicate:RDEVice:OSCilloscope:SRATe on page 265
Input source oscilloscope waveform mode:
INPut<ip>:RF:CAPMode:WAVeform:SRATe on page 264
Input source oscilloscope I/Q mode:
INPut<ip>:RF:CAPMode:IQ:SRATe on page 263
4.1.11.2 I/Q File Input
Or: "Input & Output" > "Input Source" > "I/Q File"
Loading a file via drag&drop
You can load a file simply by selecting it in a file explorer and dragging it to the
R&S VSE software. Drop it into the "Measurement Group Setup" window or the channel bar for any channel. The channel is automatically configured for file input, if necessary. If the file contains all essential information, the file input is immediately displayed
in the channel. Otherwise, the "Recall I/Q Recording" dialog box is opened for the
selected file so you can enter the missing information.
If the file contains data from multiple channels (e.g. from LTE measurements), it can be
loaded to individual input sources, if the application supports them.
The "Input Source" settings defined in the "Input" dialog box are identical to those configured for a specific channel in the "Measurement Group Setup" window.
89User Manual 1178.9103.02 ─ 04
Page 90

R&S®VSE-K144
Configuration
I/Q Measurement
If the Frequency Response Correction option (R&S VSE-K544) is installed, the 5G NR
measurement application also supports frequency response correction using Touchstone (.snp) files or .fres files.
Encrypted .wv files can also be imported. Note, however, that traces resulting from
encrypted file input cannot be exported or stored in a saveset.
Input Type (Instrument / File)........................................................................................90
Input File....................................................................................................................... 90
Zero Padding.................................................................................................................90
Input Type (Instrument / File)
Selects an instrument or a file as the type of input provided to the channel.
Note: External mixers are only available for input from a connected instrument.
Remote command:
INSTrument:BLOCk:CHANnel[:SETTings]:SOURce<si> on page 264
INPut<ip>:SELect on page 262
Input File
Specifies the I/Q data file to be used for input.
Select "Select File" to open the "Load I/Q File" dialog box.
Zero Padding
Enables or disables zero padding for input from an I/Q data file that requires resampling. For resampling, a number of samples are required due to filter settling. These
samples can either be taken from the provided I/Q data, or the software can add the
required number of samples (zeros) at the beginning and end of the file.
90User Manual 1178.9103.02 ─ 04
Page 91

R&S®VSE-K144
4.1.12 Frequency Configuration
Configuration
I/Q Measurement
If enabled, the required number of samples are inserted as zeros at the beginning and
end of the file. The entire input data is analyzed. However, the additional zeros can
effect the determined spectrum of the I/Q data. If zero padding is enabled, a status
message is displayed.
If disabled (default), no zeros are added. The required samples for filter settling are
taken from the provided I/Q data in the file. The start time in the R&S VSE Player is
adapted to the actual start (after filter settling).
Note: You can activate zero padding directly when you load the file, or afterwards in
the "Input Source" settings.
Remote command:
INPut<ip>:FILE:ZPADing on page 260
Access: "Overview" > "Input / Frontend" > "Frequency"
Frequency settings define the frequency characteristics of the signal at the RF input.
They are part of the "Frequency" tab of the "Signal Characteristics" dialog box.
The remote commands required to configure the frequency are described in Chap-
ter 6.9.19, "Frequency Configuration", on page 265.
Signal Frequency.......................................................................................................... 91
└ Center Frequency........................................................................................... 91
└ Frequency Stepsize........................................................................................ 92
Signal Frequency
For measurements with an RF input source, you have to match the center frequency
of the analyzer to the frequency of the signal.
Center Frequency ← Signal Frequency
Defines the center frequency of the signal and thus the frequency the R&S VSE tunes
to.
The frequency range depends on the hardware configuration of the analyzer you are
using.
Remote command:
Center frequency: [SENSe:]FREQuency:CENTer[:CC<cc>] on page 265
Frequency offset: [SENSe:]FREQuency:CENTer[:CC<cc>]:OFFSet on page 266
91User Manual 1178.9103.02 ─ 04
Page 92

R&S®VSE-K144
4.1.13 Amplitude Configuration
Configuration
I/Q Measurement
Frequency Stepsize ← Signal Frequency
In addition to the frequency itself, you can also define a frequency stepsize. The frequency stepsize defines the extent of a frequency change if you change it, for example
with the rotary knob.
You can define the stepsize in two ways.
●
= Center
One frequency step corresponds to the current center frequency.
●
Manual
Define any stepsize you need.
Remote command:
Frequency stepsize: [SENSe:]FREQuency:CENTer:STEP on page 266
Access: "Overview" > "Input / Frontend" > "Amplitude"
Amplitude settings define the expected level characteristics of the signal at the RF
input.
Level characteristics are available when you capture data with an instrument. In addition, the functions that are available depend on the configuration of the connected
instrument.
The remote commands required to configure the amplitude are described in Chap-
ter 6.9.20, "Amplitude Configuration", on page 267.
Reference Level............................................................................................................93
└ Auto Level.......................................................................................................93
└ Reference Level Offset................................................................................... 93
Attenuating the Signal...................................................................................................93
└ RF Attenuation................................................................................................94
└ Electronic Attenuation.....................................................................................94
Preamplifier ..................................................................................................................94
Input Coupling ..............................................................................................................95
Impedance ................................................................................................................... 95
92User Manual 1178.9103.02 ─ 04
Page 93

R&S®VSE-K144
Configuration
I/Q Measurement
Reference Level
The reference level is the power level the analyzer expects at the RF input. Keep in
mind that the power level at the RF input is the peak envelope power for signals with a
high crest factor like 5G NR.
To get the best dynamic range, you have to set the reference level as low as possible.
At the same time, make sure that the maximum signal level does not exceed the reference level. If it does, it will overload the A/D converter, regardless of the signal power.
Measurement results can deteriorate (e.g. EVM), especially for measurements with
more than one active channel near the one you are trying to measure (± 6 MHz).
Note that the signal level at the A/D converter can be stronger than the level the application displays, depending on the current resolution bandwidth. This is because the
resolution bandwidths are implemented digitally after the A/D converter.
The reference level is a value in dBm.
Remote command:
Reference level: DISPlay[:WINDow<n>]:TRACe<t>:Y[:SCALe]:RLEVel<ant>
on page 267
Auto Level ← Reference Level
Automatically determines the ideal reference level. The automatic leveling process
measures the signal and defines the ideal reference signal for the measured signal.
Automatic level detection also optimizes RF attenuation.
Auto leveling slightly increases the measurement time, because of the extra leveling
measurement prior to each sweep. By default, the R&S VSE automatically defines the
time for auto leveling, but you can also define it manually ([Auto Set] > "Auto Level
Config" > "Meas Time").
Remote command:
Automatic: [SENSe:]ADJust:LEVel on page 189
Auto level mode: [SENSe:]ADJust:CONFigure:LEVel:DURation:MODE
on page 188
Auto level time: [SENSe:]ADJust:CONFigure:LEVel:DURation on page 188
Reference Level Offset ← Reference Level
The reference level offset is an arithmetic level offset. A level offset is useful if the signal is attenuated or amplified before it is fed into the analyzer. All displayed power level
results are shifted by this value. Note however, that the reference value ignores the
level offset. Thus, it is still mandatory to define the actual power level that the analyzer
has to handle as the reference level.
Remote command:
DISPlay[:WINDow<n>]:TRACe<t>:Y[:SCALe]:RLEVel<ant>:OFFSet
on page 267
Attenuating the Signal
Attenuation of the signal becomes necessary if you have to reduce the power of the
signal that you have applied. Power reduction is necessary, for example, to prevent an
overload of the input mixer.
For a comprehensive information about signal attenuation, refer to the user manual of
the R&S VSE.
93User Manual 1178.9103.02 ─ 04
Page 94

R&S®VSE-K144
Configuration
I/Q Measurement
The 5G NR measurement application provides several attenuation modes.
RF Attenuation ← Attenuating the Signal
Controls the RF (or mechanical) attenuator at the RF input.
If you select automatic signal attenuation, the attenuation level is coupled to the refer-
ence level.
If you select manual signal attenuation, you can define an arbitrary attenuation (within
the supported value range).
Positive values correspond to signal attenuation and negative values correspond to
signal gain.
Remote command:
State: INPut<ip>:ATTenuation<ant>:AUTO on page 268
Level: INPut<ip>:ATTenuation<ant> on page 268
Electronic Attenuation ← Attenuating the Signal
Controls the optional electronic attenuator.
If you select automatic signal attenuation, the attenuation level is coupled to the refer-
ence level.
If you select manual signal attenuation, you can define an arbitrary attenuation (within
the supported value range).
Positive values correspond to signal attenuation and negative values correspond to
signal gain.
Note that the frequency range must not exceed the specification of the electronic
attenuator for it to work.
Remote command:
Electronic attenuation: INPut<ip>:EATT<ant>:STATe on page 271
Electronic attenuation: INPut<ip>:EATT<ant>:AUTO on page 271
Electronic attenuation: INPut<ip>:EATT<ant> on page 270
Preamplifier
If the (optional) internal preamplifier hardware is installed, a preamplifier can be activated for the RF input signal.
If the (optional) internal preamplifier hardware is installed on the connected instrument,
a preamplifier can be activated for the RF input signal.
You can use a preamplifier to analyze signals from DUTs with low output power.
Note that if an optional external preamplifier is activated, the internal preamplifier is
automatically disabled, and vice versa.
For R&S VSE8, 13, and 26 models, the following settings are available:
"Off"
"15 dB"
"30 dB"
Depending on the connected instrument, different settings are available. See the
instrument's documentation for details.
Deactivates the preamplifier.
The RF input signal is amplified by about 15 dB.
The RF input signal is amplified by about 30 dB.
94User Manual 1178.9103.02 ─ 04
Page 95

R&S®VSE-K144
Configuration
I/Q Measurement
Remote command:
INPut<ip>:GAIN<ant>:STATe on page 269
INPut<ip>:GAIN<ant>[:VALue] on page 269
Input Coupling
The RF input of the R&S VSE can be coupled by alternating current (AC) or direct current (DC).
The RF input of the connected instrument can be coupled by alternating current (AC)
or direct current (DC).
AC coupling blocks any DC voltage from the input signal. This is the default setting to
prevent damage to the instrument. Very low frequencies in the input signal may be distorted.
However, some specifications require DC coupling. In this case, you must protect the
instrument from damaging DC input voltages manually. For details, refer to the data
sheet.
Remote command:
INPut<ip>:COUPling<ant> on page 268
Impedance
For some measurements, the reference impedance for the measured levels of the connected instrument can be set to 50 Ω or 75 Ω.
Select 75 Ω if the 50 Ω input impedance is transformed to a higher impedance using a
75 Ω adapter of the RAZ type. (That corresponds to 25Ω in series to the input impedance of the instrument.) The correction value in this case is 1.76 dB = 10 log (75Ω/
50Ω).
Remote command:
INPut<ip>:IMPedance<ant> on page 270
4.1.14 Trigger Configuration
Access: "Overview" > "Trig / Sig Capture" > "Trigger"
A trigger allows you to capture those parts of the signal that you are really interested
in.
While the application runs freely and analyzes all signal data in its default state, no
matter if the signal contains information or not, a trigger initiates a measurement only
under certain circumstances (the trigger event).
For a comprehensive description of the available trigger settings not described here,
refer to the documentation of the connected instrument.
95User Manual 1178.9103.02 ─ 04
Page 96

R&S®VSE-K144
Configuration
I/Q Measurement
Trigger Source...............................................................................................................96
Trigger Source
The application supports several trigger modes or sources.
●
Free Run
Starts the measurement immediately and measures continuously.
When you analyze a signal from an I/Q file, then the trigger source is always to
"Free Run".
●
External <x>
The trigger event is the level of an external trigger signal. The measurement starts
when this signal meets or exceeds a specified trigger level at the trigger input.
Some measurement devices have several trigger ports. When you use one of
these, several external trigger sources are available.
●
I/Q Power
The trigger event is the magnitude of the sampled I/Q data. The measurement
starts when the magnitude of the I/Q data meets or exceeds the trigger level.
●
IF Power
The trigger event is the level of the intermediate frequency (IF). The measurement
starts when the level of the IF meets or exceeds the trigger level.
●
RF Power
The trigger event is the level measured at the RF input. The measurement starts
when the level of the signal meets or exceeds the trigger level.
●
Time
The trigger event is a certain time interval (every <x> seconds).
For all trigger sources, except "Free Run", you can define several trigger characteristics.
●
The trigger "Level" defines the signal level that initiates the measurement.
●
The trigger "Repetition Interval" defines the time interval that initiates a measurement for the time trigger.
●
The trigger "Offset" is the time that must pass between the trigger event and the
start of the measurement. This can be a negative value (a pretrigger).
●
The trigger "Drop-out Time" defines the time the input signal must stay below the
trigger level before triggering again.
●
The trigger "Slope" defines whether triggering occurs when the signal rises to the
trigger level or falls down to it.
●
The trigger "Holdoff" defines a time period that must at least pass between one trigger event and the next.
●
The trigger "Hysteresis" is available for the IF power trigger. It defines a distance to
the trigger level that the input signal must stay below to fulfill the trigger condition.
For a detailed description of the trigger parameters, see the user manual of the I/Q
analyzer.
96User Manual 1178.9103.02 ─ 04
Page 97

R&S®VSE-K144
4.1.15 Data Capture
Configuration
I/Q Measurement
Remote command:
Source: TRIGger[:SEQuence]:SOURce<ant> on page 279
Level (external): TRIGger[:SEQuence]:LEVel<ant>[:EXTernal<tp>]
on page 276
Level (I/Q power): TRIGger[:SEQuence]:LEVel<ant>:IQPower on page 277
Level (IF power): TRIGger[:SEQuence]:LEVel<ant>:IFPower on page 276
Level (RF power): TRIGger[:SEQuence]:LEVel<ant>:RFPower on page 277
Offset: TRIGger[:SEQuence]:HOLDoff<ant>[:TIME] on page 275
Hysteresis: TRIGger[:SEQuence]:IFPower:HYSTeresis on page 276
Drop-out time: TRIGger[:SEQuence]:DTIMe on page 275
Slope: TRIGger[:SEQuence]:SLOPe on page 279
Holdoff: TRIGger[:SEQuence]:IFPower:HOLDoff on page 275
Access: "Overview" > "Trigger / Signal Capture" > "Signal Capture"
The data capture settings contain settings that control various aspects of the data capture.
The "Maximum Number of Subframes per Frame to Analyze" setting available in older
firmware versions is no longer supported.
The remote commands required to configure the data capture are described in Chap-
ter 6.9.21, "Data Capture", on page 271.
Capture Time.................................................................................................................98
Long Capture................................................................................................................ 98
Swap I/Q....................................................................................................................... 98
Overall Frame Count.....................................................................................................98
Auto According to Standard.......................................................................................... 99
97User Manual 1178.9103.02 ─ 04
Page 98

R&S®VSE-K144
Configuration
I/Q Measurement
Number of Frames to Analyze...................................................................................... 99
Maximum Number of Slots per Frame to Analyze........................................................ 99
Signal Repeats Max No of Slots to Analyze..................................................................99
Capture Time
The "Capture Time" corresponds to the time of one measurement. Therefore, it defines
the amount of data the application captures during a single measurement (or sweep).
By default, the application captures 20.1 ms of data to make sure that at least one
complete 5G NR frame is captured in the measurement.
The maximum capture time is limited when you are only measuring slots repeatedly.
Remote command:
[SENSe:]SWEep:TIME on page 274
Long Capture
Turns a limitation of the capture time on and off.
When you turn off the long capture, the capture time is limited to 50.1 ms (maximum of
5 frames).
To capture more frames, turn on the long capture. The long capture allows you to cap-
ture data up to 1 s. However, the long capture has the following limitations.
●
The long capture captures several frames, but analyzes only one. The analyzed
frame is indicated by a horizontal green bar in the capture buffer. The analyzed
frame depends on your selection.
●
Multiple frame configurations are not possible, because every frame must have the
same configuration.
●
The frame count settings (overall frame count etc.) are unavailable.
●
Averaging results over several frames is not supported.
Therefore, the R&S VSE does not evaluate EVM limits for long captures.
●
Component carrier measurements are not supported.
Remote command:
[SENSe:]SWEep:LCAPture on page 274
Swap I/Q
Swaps the real (I branch) and the imaginary (Q branch) parts of the signal.
Remote command:
[SENSe:]SWAPiq on page 273
Overall Frame Count
The "Overall Frame Count" turns the manual selection of the number of frames to capture (and analyze) on and off.
When you turn on the overall frame count, you can define the number of frames to cap-
ture and analyze. The measurement runs until all frames have been analyzed, even if it
takes more than one capture.
When you turn off the overall frame count, the application analyzes all 5G NR frames
found in one capture buffer.
For more information about the effects on the results of capturing more frames than fit
in the capture buffer, see Chapter 4.1.5, "Radio Frame Configuration", on page 50.
98User Manual 1178.9103.02 ─ 04
Page 99

R&S®VSE-K144
Configuration
I/Q Measurement
PRACH analysis: Instead of capturing frames, PRACH analysis measurements capture preambles. For PRACH analysis, the "Overall Preamble Count" therefore allows
you to turn manual selection of the number of preambles to capture on and off. Turn on
this parameter to analyze all preambles in the capture buffer and off to select a certain
number of preambles to capture.
Remote command:
[SENSe:]NR5G:FRAMe:COUNt:STATe on page 272
Auto According to Standard
Turns automatic selection of the number of frames to capture and analyze on and off.
When you turn on this feature, the R&S VSE captures and evaluates a number of
frames the 3GPP standard specifies for EVM tests.
If you want to analyze an arbitrary number of frames, turn off the feature.
This parameter is not available when the overall frame count is inactive.
PRACH analysis: Selects if the number of preambles to analyze is based on the num-
ber defined by 3GPP or an arbitrary number.
Remote command:
[SENSe:]NR5G:FRAMe:COUNt:AUTO on page 272
Number of Frames to Analyze
Defines the number of frames you want to capture and analyze.
If the number of frames you have set last longer than a single measurement, the appli-
cation continues the measurement until all frames have been captured.
The parameter is read only in the following cases:
●
If you turn off the overall frame count.
●
If you capture the data according to the standard.
PRACH analysis: Because PRACH analysis analyzes preambles instead of frames,
the "Number of Preambles to Analyze" allows to define the number of preambles you
want to analyze.
Remote command:
[SENSe:]NR5G:FRAMe:COUNt on page 272
Maximum Number of Slots per Frame to Analyze
Selects the number of slots that the application analyzes.
You can select to analyze "All" slots, or a certain number of slots - select the number
from the dropdown menu and enter the number of slots to analyze. The maximum
number of slots you can analyze depends on the subcarrier spacing.
If you select a certain number of slots, the R&S VSE analyzes the first <x> slots in a
frame.
Reducing the number of slots to analyze improves measurement speed.
Remote command:
[SENSe:]NR5G:FRAMe:SLOT on page 273
Signal Repeats Max No of Slots to Analyze
Turns analysis of custom signals with repeating slots on and off.
99User Manual 1178.9103.02 ─ 04
Page 100

R&S®VSE-K144
Configuration
I/Q Measurement
You can use this setting to measure custom (shortened) signals that only contain a few
slots per frame. This setting is useful to achieve a high measurement and analysis
speed without trigger availability. Multiple frame analysis tailored to the custom signal
is also possible.
Example:
Slot 0 | Slot 0 | Slot 0 etc.
Slot 0 | Slot 1 | Slot 0 | Slot 1 etc.
Note that the slot sequence must start with slot number 0.
Measuring such signals is not possible with the standard signal capture settings without a trigger.
Instead, configure the R&S VSE like this.
●
Reduce the capture time based on the number of slots in the repeated signal and
the subcarrier spacing. Make sure that the slot sequence is contained at least once
in the capture buffer.
For example to measure 3 slots with a subcarrier spacing of 30 kHz (length of one
slot = 500 µs), reduce the capture time to 3.1 ms.
Capturing repeating slots limits the maximum allowed capture time based on the
maximum number of slots you are capturing.
●
Select a maximum number of slots to analyze that matches the number of slots in
your signal.
For example: if you have a sequence of three slots being repeated in your signal,
select 3 slots to analyze.
●
Turn on the "Signal Repeats Max No of Slots to Analyze" setting.
Remote command:
[SENSe:]NR5G:FRAMe:SRSLot on page 273
4.1.16 Tracking
Access: "Overview" > "Tracking"
Tracking settings contain settings that compensate various errors.
The remote commands required to configure error tracking are described in Chap-
ter 6.9.23, "Tracking", on page 280.
100User Manual 1178.9103.02 ─ 04
 Loading...