

Page 1
R&S®FPL1000
I/Q Analyzer
User Manual
(;ÜQä2)
1178338602
Version 10
Page 2

This manual applies to the following R&S®FPL1000 models with firmware version 1.60 and later:
●
R&S®FPL1003 (1304.0004K03) - FPL1000 with maximum frequency 3 GHz
●
R&S®FPL1007 (1304.0004K07) - FPL1000 with maximum frequency 7.5 GHz
In addition to the I/Q Analyzer application in the base unit, the following options are described:
●
R&S FPL1000-B5, Additional Interfaces (1323.1883.02)
●
R&S FPL1000-B40, Bandwidth extension 40 MHz (1323.1931.02)
●
R&S FPL1-K9 Power Sensor Support(1323.1754.02)
© 2020 Rohde & Schwarz GmbH & Co. KG
Mühldorfstr. 15, 81671 München, Germany
Phone: +49 89 41 29 - 0
Email: info@rohde-schwarz.com
Internet: www.rohde-schwarz.com
Subject to change – data without tolerance limits is not binding.
R&S® is a registered trademark of Rohde & Schwarz GmbH & Co. KG.
Trade names are trademarks of the owners.
1178.3386.02 | Version 10 | R&S®FPL1000
Throughout this manual, products from Rohde & Schwarz are indicated without the ® symbol, e.g. R&S®FPL is indicated as R&S
FPL.
Page 3

R&S®FPL1000
1.1 Documentation-Overview.............................................................................................5
1.2 Conventions Used in the Documentation...................................................................7
2.1 Starting the I/Q Analyzer Application..........................................................................9
2.2 Understanding the Display Information....................................................................10
4.1 Processing Analog I/Q Data from RF Input.............................................................. 17
4.2 Basics on FFT..............................................................................................................20
Contents
Contents
1 Preface.................................................................................................... 5
2 Welcome to the I/Q Analyzer Application............................................ 9
3 Measurement and Result Displays.....................................................13
4 Basics on I/Q Data Acquisition and Processing............................... 17
4.3 Basics on Input from I/Q Data Files...........................................................................26
4.4 I/Q Data Import and Export.........................................................................................26
5 Configuration........................................................................................28
5.1 Configuration Overview..............................................................................................28
5.2 Import/Export Functions............................................................................................ 30
5.3 Receiving Data Input and Providing Data Output.................................................... 33
5.4 Amplitude.....................................................................................................................44
5.5 Frequency Settings.....................................................................................................49
5.6 Trigger Settings...........................................................................................................51
5.7 Data Acquisition and Bandwidth Settings................................................................54
5.8 Display Configuration.................................................................................................60
5.9 Adjusting Settings Automatically..............................................................................61
6 Analysis................................................................................................ 64
6.1 Trace Settings..............................................................................................................64
6.2 Spectrogram Settings.................................................................................................68
6.3 Trace / Data Export Configuration.............................................................................73
6.4 Marker Usage...............................................................................................................76
7 How to Perform Measurements in the I/Q Analyzer Application..... 99
7.1 How to Capture Baseband (I/Q) Data as RF Input....................................................99
3User Manual 1178.3386.02 ─ 10
Page 4

R&S®FPL1000
7.2 How to Analyze Data in the I/Q Analyzer................................................................ 100
9.1 Introduction............................................................................................................... 103
9.2 Common Suffixes......................................................................................................108
9.3 Activating I/Q Analyzer Measurements...................................................................108
9.4 Configuring I/Q Analyzer Measurements................................................................ 113
9.5 Configuring the Result Display................................................................................154
9.6 Capturing Data and Performing Sweeps................................................................ 162
9.7 I/Q Analysis................................................................................................................168
9.8 Retrieving Results.....................................................................................................217
9.9 Importing and Exporting I/Q Data and Results...................................................... 227
Contents
8 How to Export and Import I/Q Data...................................................101
9 Remote Commands to Perform Measurements with I/Q Data....... 103
9.10 Programming Examples........................................................................................... 229
Annex.................................................................................................. 232
A Formats for Returned Values: ASCII Format and Binary Format.. 232
B Reference: Format Description for I/Q Data Files........................... 233
C I/Q Data File Format (iq-tar)...............................................................235
C.1 I/Q Parameter XML File Specification......................................................................236
C.2 I/Q Data Binary File................................................................................................... 239
List of Commands..............................................................................241
Index....................................................................................................248
4User Manual 1178.3386.02 ─ 10
Page 5

R&S®FPL1000
1 Preface
1.1 Documentation-Overview
1.1.1 Getting Started Manual
Preface
Documentation-Overview
This chapter provides safety-related information, an overview of the user documentation and the conventions used in the documentation.
This section provides an overview of the R&S FPL1000 user documentation. Unless
specified otherwise, you find the documents on the R&S FPL1000 product page at:
www.rohde-schwarz.com/manual/FPL1000
Introduces the R&S FPL1000 and describes how to set up and start working with the
product. Includes basic operations, typical measurement examples, and general information, e.g. safety instructions, etc.
A printed version is delivered with the instrument. A PDF version is available for download on the Internet.
1.1.2 User Manuals and Help
Separate user manuals are provided for the base unit and the firmware applications:
●
Base unit manual
Contains the description of all instrument modes and functions. It also provides an
introduction to remote control, a complete description of the remote control commands with programming examples, and information on maintenance, instrument
interfaces and error messages. Includes the contents of the getting started manual.
●
Firmware application manual
Contains the description of the specific functions of a firmware application, including remote control commands. Basic information on operating the R&S FPL1000 is
not included.
The contents of the user manuals are available as help in the R&S FPL1000. The help
offers quick, context-sensitive access to the complete information for the base unit and
the firmware applications.
All user manuals are also available for download or for immediate display on the Internet.
5User Manual 1178.3386.02 ─ 10
Page 6

R&S®FPL1000
1.1.3 Service Manual
1.1.4 Instrument Security Procedures
1.1.5 Printed Safety Instructions
Preface
Documentation-Overview
Describes the performance test for checking the rated specifications, module replacement and repair, firmware update, troubleshooting and fault elimination, and contains
mechanical drawings and spare part lists.
The service manual is available for registered users on the global Rohde & Schwarz
information system (GLORIS):
https://gloris.rohde-schwarz.com
Deals with security issues when working with the R&S FPL1000 in secure areas. It is
available for download on the Internet.
Provides safety information in many languages. The printed document is delivered with
the product.
1.1.6 Data Sheets and Brochures
The data sheet contains the technical specifications of the R&S FPL1000. It also lists
the firmware applications and their order numbers, and optional accessories.
The brochure provides an overview of the instrument and deals with the specific characteristics.
See www.rohde-schwarz.com/brochure-datasheet/FPL1000
1.1.7 Release Notes and Open Source Acknowledgment (OSA)
The release notes list new features, improvements and known issues of the current
firmware version, and describe the firmware installation.
The open-source acknowledgment document provides verbatim license texts of the
used open source software.
See www.rohde-schwarz.com/firmware/FPL1000
1.1.8 Application Notes, Application Cards, White Papers, etc.
These documents deal with special applications or background information on particular topics.
See www.rohde-schwarz.com/application/FPL1000
6User Manual 1178.3386.02 ─ 10
Page 7

R&S®FPL1000
1.1.9 Calibration Certificate
1.2 Conventions Used in the Documentation
1.2.1 Typographical Conventions
Preface
Conventions Used in the Documentation
The document is available on https://gloris.rohde-schwarz.com/calcert. You need the
device ID of your instrument, which you can find on a label on the rear panel.
The following text markers are used throughout this documentation:
Convention Description
"Graphical user interface elements"
[Keys] Key and knob names are enclosed by square brackets.
Filenames, commands,
program code
Input Input to be entered by the user is displayed in italics.
Links Links that you can click are displayed in blue font.
"References" References to other parts of the documentation are enclosed by quota-
All names of graphical user interface elements on the screen, such as
dialog boxes, menus, options, buttons, and softkeys are enclosed by
quotation marks.
Filenames, commands, coding samples and screen output are distinguished by their font.
tion marks.
1.2.2 Conventions for Procedure Descriptions
When operating the instrument, several alternative methods may be available to perform the same task. In this case, the procedure using the touchscreen is described.
Any elements that can be activated by touching can also be clicked using an additionally connected mouse. The alternative procedure using the keys on the instrument or
the on-screen keyboard is only described if it deviates from the standard operating procedures.
The term "select" may refer to any of the described methods, i.e. using a finger on the
touchscreen, a mouse pointer in the display, or a key on the instrument or on a keyboard.
1.2.3 Notes on Screenshots
When describing the functions of the product, we use sample screenshots. These
screenshots are meant to illustrate as many as possible of the provided functions and
possible interdependencies between parameters. The shown values may not represent
realistic usage scenarios.
7User Manual 1178.3386.02 ─ 10
Page 8

R&S®FPL1000
Preface
Conventions Used in the Documentation
The screenshots usually show a fully equipped product, that is: with all options installed. Thus, some functions shown in the screenshots may not be available in your particular product configuration.
8User Manual 1178.3386.02 ─ 10
Page 9

R&S®FPL1000
2 Welcome to the I/Q Analyzer Application
Welcome to the I/Q Analyzer Application
Starting the I/Q Analyzer Application
The R&S FPL1 I/Q Analyzer is a firmware application that adds functionality to perform
I/Q data acquisition and analysis to the R&S FPL1000.
The R&S FPL1 I/Q Analyzer features:
●
Acquisition of analog I/Q data
●
Import of stored I/Q data from other applications
●
Spectrum, magnitude, I/Q vector and separate I and Q component analysis of any
I/Q data on the instrument
●
Export of I/Q data to other applications
This user manual contains a description of the functionality that the application provides, including remote control operation.
All functions not discussed in this manual are the same as in the base unit and are
described in the R&S FPL1000 User Manual. The latest version is available for download at the product homepage http://www.rohde-schwarz.com/product/FPL1000.
Additional information
Several application notes discussing I/Q analysis are available from the Rohde &
Schwarz website:
1EF85: Converting R&S I/Q data files
1EF92: Wideband Signal Analysis
1MA257: Wideband mm-Wave Signal Generation and Analysis
1EF84: Differential measurements with Spectrum Analyzers and Probes
Installation
The R&S FPL1 I/Q Analyzer application is part of the standard base unit and requires
no further installation.
2.1 Starting the I/Q Analyzer Application
The I/Q Analyzer is an application on the R&S FPL1000.
To activate the I/Q Analyzer application
1. Select the [MODE] key.
A dialog box opens that contains all applications currently available on your
R&S FPL1000.
2. Select the "I/Q Analyzer" item.
9User Manual 1178.3386.02 ─ 10
Page 10

R&S®FPL1000
Welcome to the I/Q Analyzer Application
Understanding the Display Information
The R&S FPL1000 opens a new channel setup for the I/Q Analyzer application.
The measurement is started immediately with the default settings.
It can be configured in the I/Q Analyzer "Overview" dialog box, which is displayed
when you select the "Overview" softkey from any menu (see Chapter 5.1, "Configura-
tion Overview", on page 28).
Multiple Channel Setups and Sequencer Function
When you activate an application, a new channel setup is created which determines
the measurement settings for that application (channel setup). The same application
can be activated with different measurement settings by creating several channel setups for the same application.
The number of channel setups that can be configured at the same time depends on the
available memory on the instrument.
Only one measurement can be performed at any time, namely the one in the currently
active channel setup. However, in order to perform the configured measurements consecutively, a Sequencer function is provided.
If activated, the measurements configured in the currently defined channel setups are
performed one after the other in the order of the tabs. The currently active measurement is indicated by a
The result displays of the individual channel setups are updated in the tabs (as well as
the "MultiView" ) as the measurements are performed. Sequential operation itself is
independent of the currently displayed tab.
For details on the Sequencer function see the R&S FPL1000 User Manual.
symbol in the tab label.
2.2 Understanding the Display Information
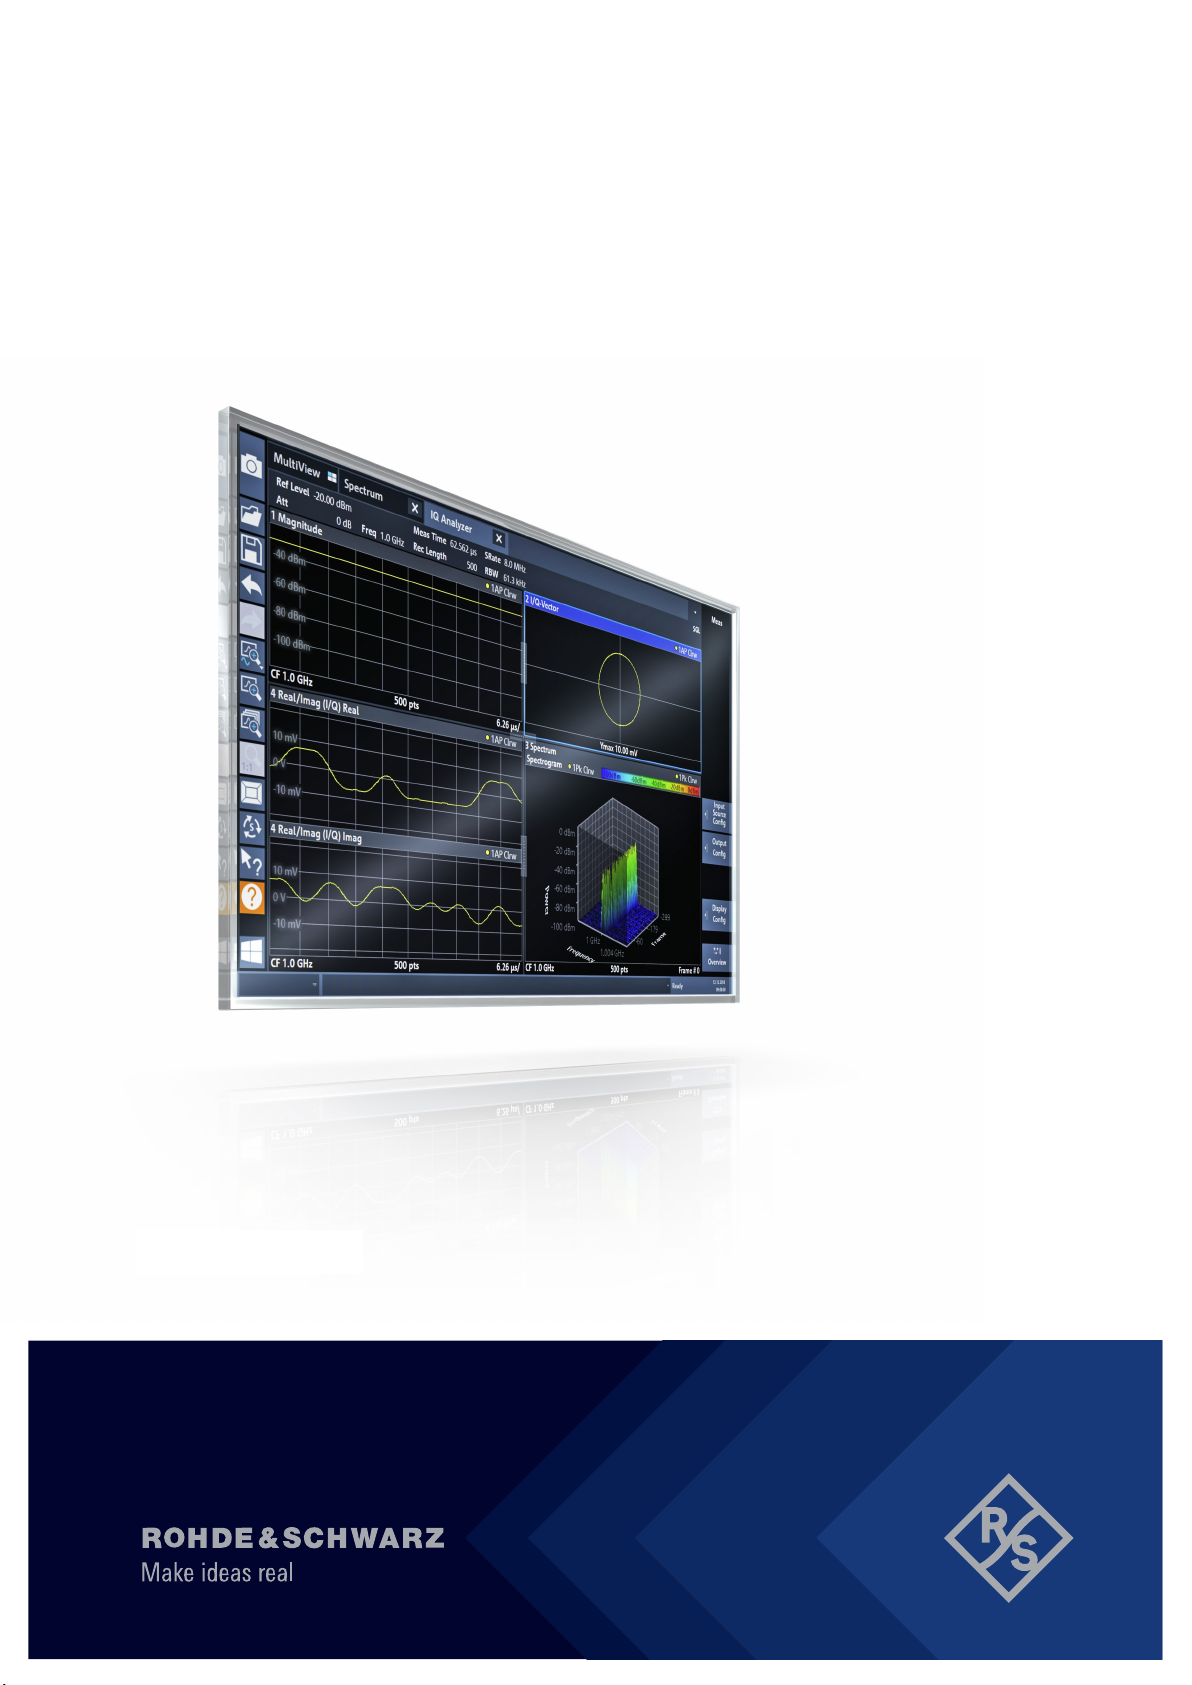
The following figure shows a measurement diagram during I/Q Analyzer operation. All
different information areas are labeled. They are explained in more detail in the following sections.
10User Manual 1178.3386.02 ─ 10
Page 11
R&S®FPL1000
Welcome to the I/Q Analyzer Application
Understanding the Display Information
1
2 3
4
5
Figure 2-1: Screen elements in the I/Q Analyzer application
1 = Channel Setup bar for firmware and measurement settings
2+3 = Window title bar with diagram-specific (trace) information
4 = Diagram area with marker information
5 = Diagram footer with diagram-specific information, depending on result display
6 = Instrument status bar with error messages and date/time display
6
Channel Setup bar information
In the I/Q Analyzer application, the R&S FPL1000 shows the following settings:
Table 2-1: Information displayed in the channel setup bar for the I/Q Analyzer application
Ref Level Reference level
(m.+el.)Att (Mechanical and electronic) RF attenuation
Ref Offset Reference level offset
Freq Center frequency
Meas Time Measurement time
Rec Length Defined record length (number of samples to capture)
SRate Defined sample rate for data acquisition
RBW (Spectrum evaluation only) Resolution bandwidth calculated from the
sample rate and record length
In addition, the channel setup bar also displays information on instrument settings that
affect the measurement results even though this is not immediately apparent from the
display of the measured values (e.g. transducer or trigger settings). This information is
displayed only when applicable for the current measurement. For details see the
R&S FPL1000 Getting Started manual.
11User Manual 1178.3386.02 ─ 10
Page 12

R&S®FPL1000
Welcome to the I/Q Analyzer Application
Understanding the Display Information
Window title bar information
For each diagram, the header provides the following information:
Figure 2-2: Window title bar information in the I/Q Analyzer application
1 = Window number
2 = Window type
3 = Trace color
4 = Trace number
5 = Detector
6 = Trace mode
Diagram footer information
The information in the diagram footer (beneath the diagram) depends on the evaluation:
●
Center frequency
●
Number of sweep points
●
Range per division (x-axis)
●
Span (Spectrum)
Status bar information
Global instrument settings, the instrument status and any irregularities are indicated in
the status bar beneath the diagram.
12User Manual 1178.3386.02 ─ 10
Page 13
R&S®FPL1000
3 Measurement and Result Displays
Measurement and Result Displays
Access: "Overview" > "Display Config"
Or: [MEAS] > "Display Config"
The I/Q Analyzer can capture I/Q data. The I/Q data that was captured by or imported
to the R&S FPL1000 can then be evaluated in various different result displays. Select
the result displays using the SmartGrid functions.
For details on working with the SmartGrid see the R&S FPL1000 Getting Started manual.
Result displays for I/Q data:
Magnitude .................................................................................................................... 13
Spectrum ......................................................................................................................13
I/Q-Vector .....................................................................................................................14
Real/Imag (I/Q) .............................................................................................................15
Marker Table ................................................................................................................ 15
Marker Peak List .......................................................................................................... 16
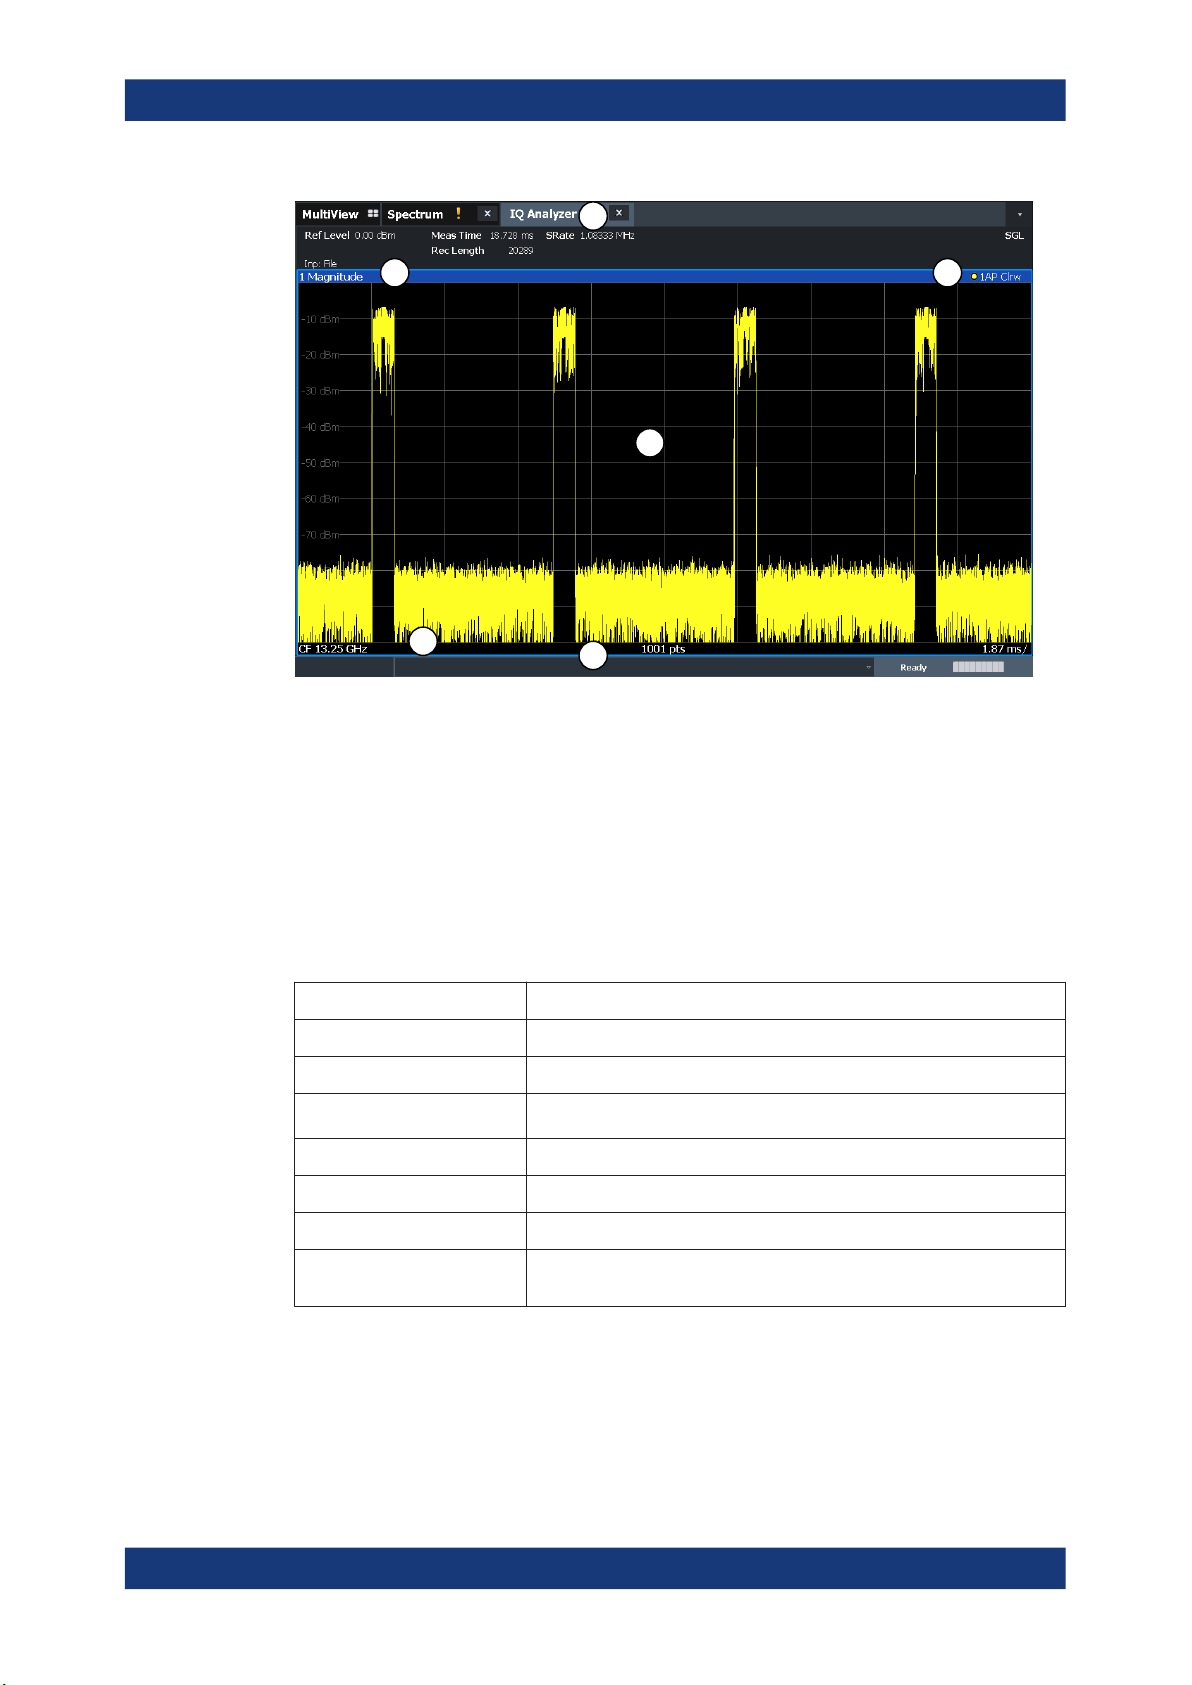
Magnitude
Shows the level values in time domain.
Remote command:
LAY:ADD:WIND? '1',RIGH,MAGN, see LAYout:ADD[:WINDow]? on page 155
Results:
TRACe<n>[:DATA]? on page 221
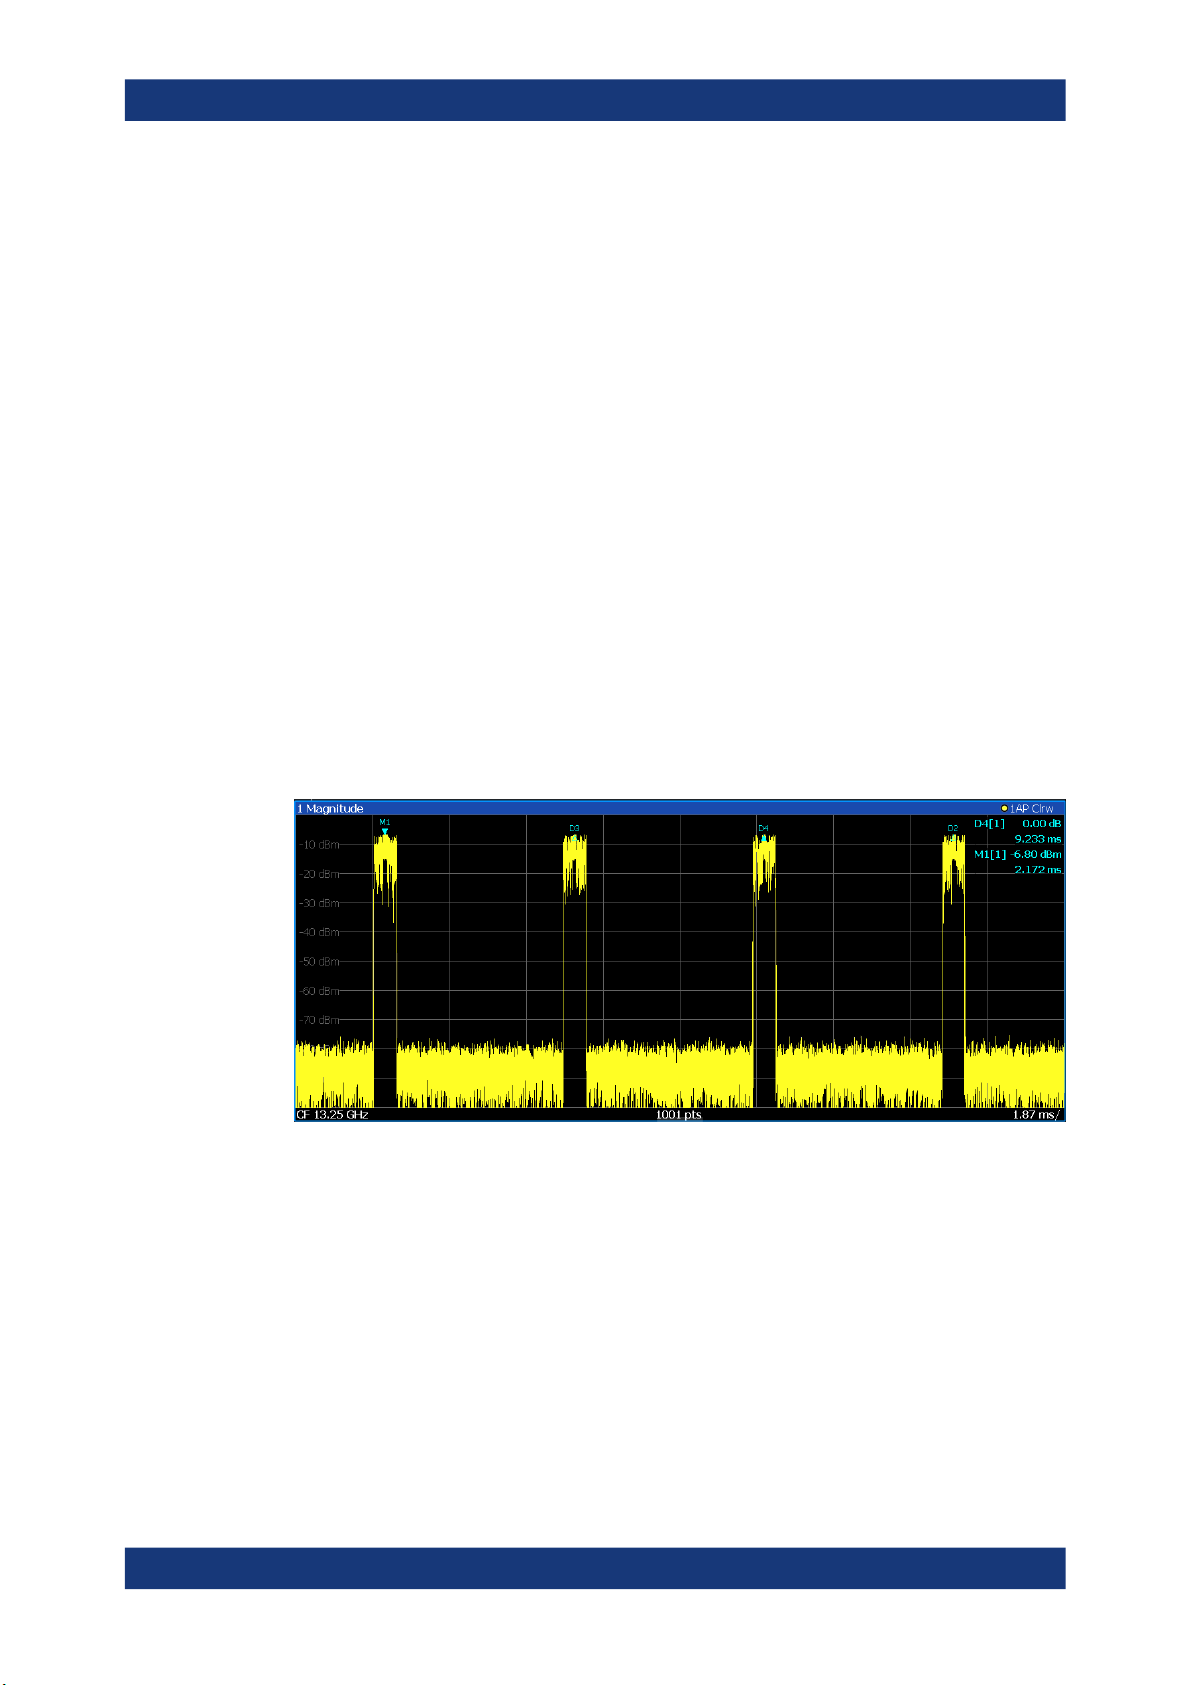
Spectrum
Displays the frequency spectrum of the captured I/Q samples.
13User Manual 1178.3386.02 ─ 10
Page 14
R&S®FPL1000
Measurement and Result Displays
The specified Analysis Bandwidth is indicated by vertical blue lines.
Note that a peak search is performed only within the indicated Analysis Bandwidth ,
unless you specify Search Limits ( Left / Right ) in the marker settings.
Remote command:
LAY:ADD:WIND? '1',RIGH,FREQ, see LAYout:ADD[:WINDow]? on page 155
Results:
TRACe<n>[:DATA]? on page 221
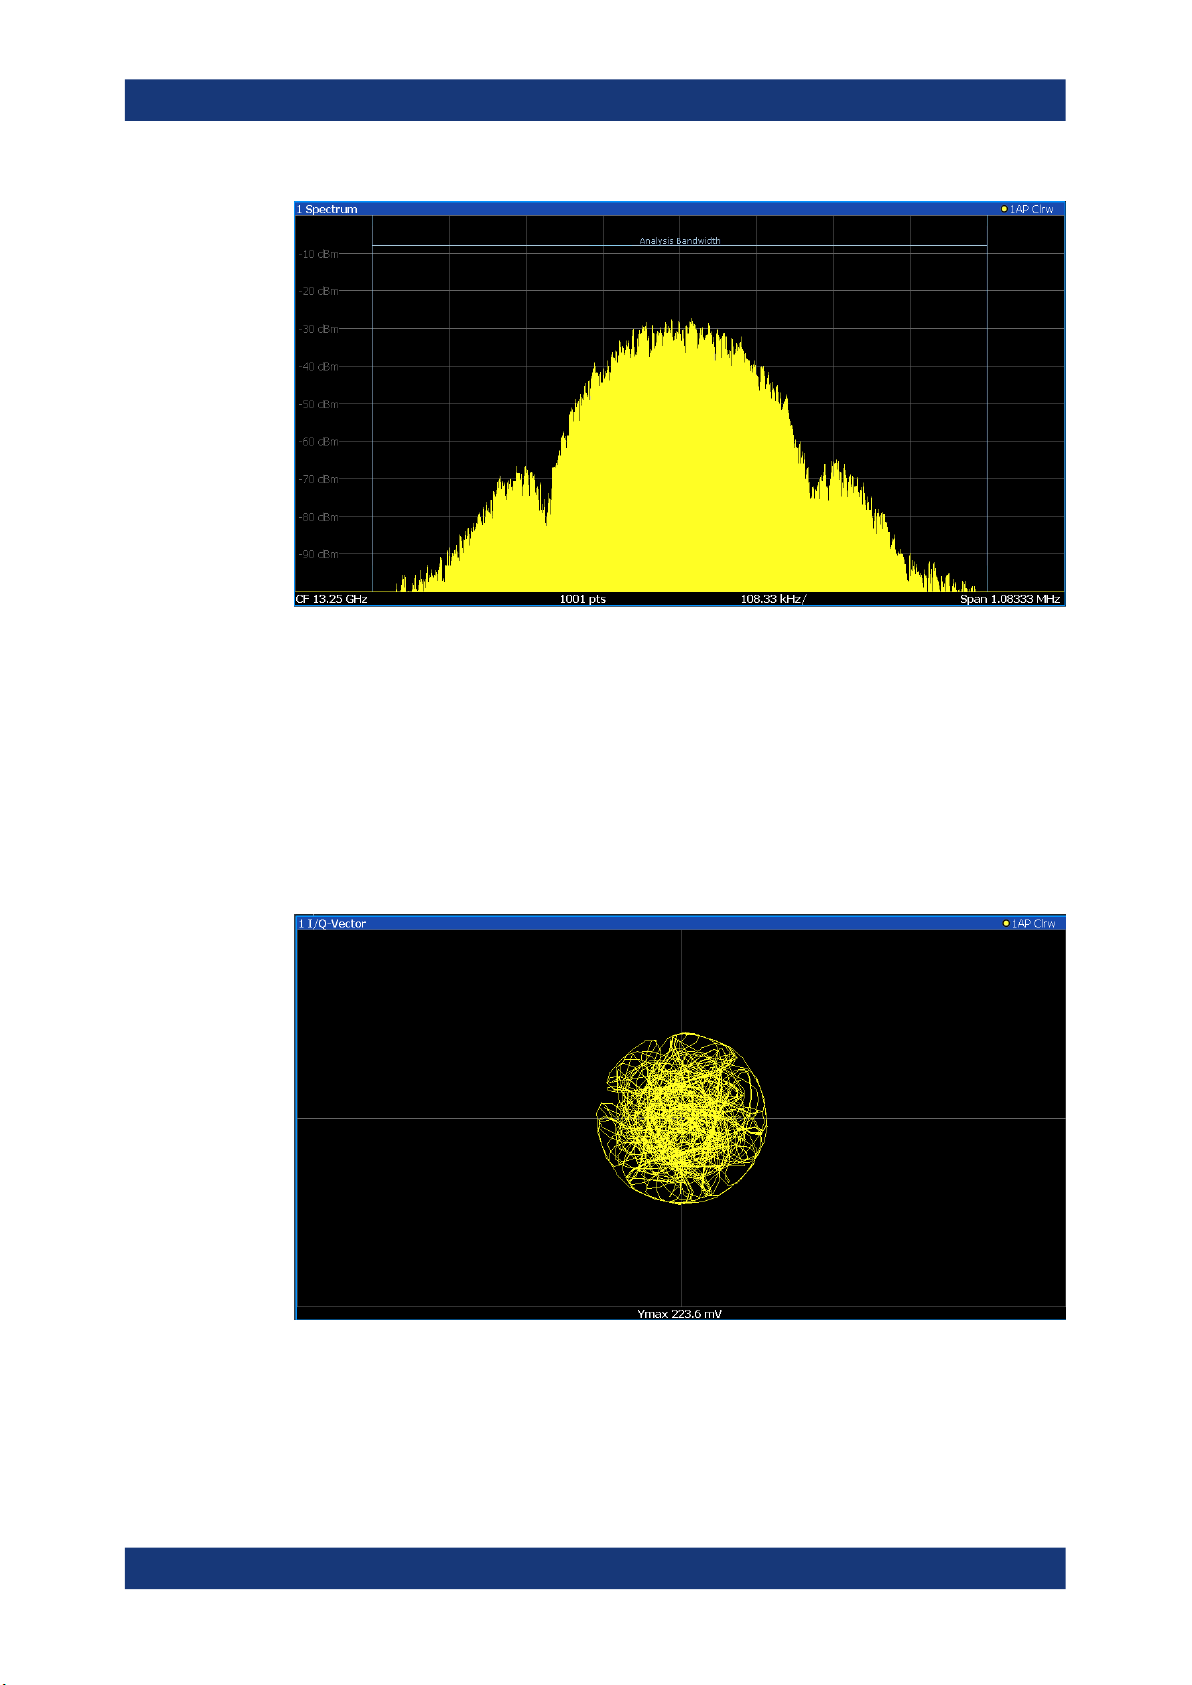
I/Q-Vector
Displays the captured samples in an I/Q-plot. The samples are connected by a line.
Note: For the I/Q vector result display, the number of I/Q samples to record ( "Record
Length" ) must be identical to the number of trace points to be displayed ("Sweep
Points"; for I/Q Analyzer: 10001). For record lengths outside the valid range of sweep
points the diagram does not show valid results.
14User Manual 1178.3386.02 ─ 10
Page 15
R&S®FPL1000
Measurement and Result Displays
Remote command:
LAY:ADD:WIND? '1',RIGH,VECT, see LAYout:ADD[:WINDow]? on page 155
Results:
TRACe<n>[:DATA]? on page 221
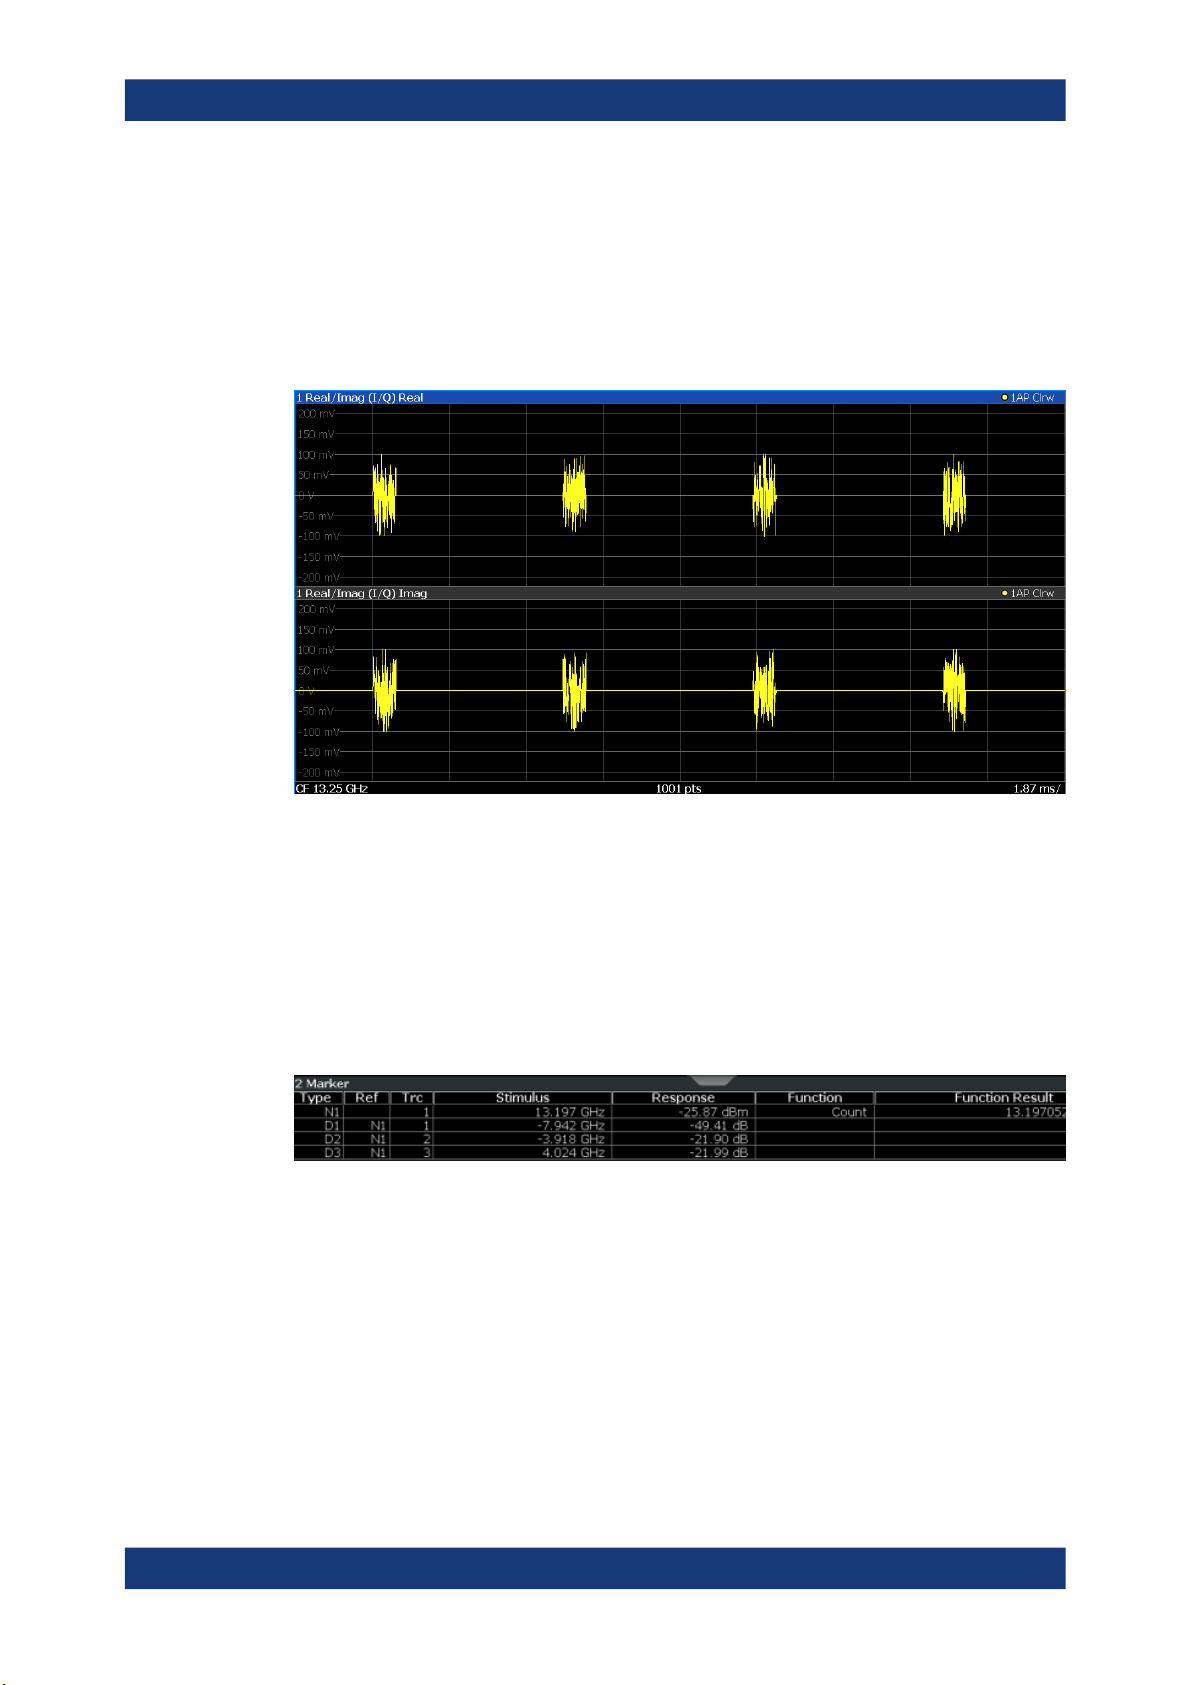
Real/Imag (I/Q)
Displays the I and Q values in separate diagrams.
Remote command:
LAY:ADD:WIND? '1',RIGH,RIM, see LAYout:ADD[:WINDow]? on page 155
Results:
TRACe<n>[:DATA]? on page 221
Marker Table
Displays a table with the current marker values for the active markers.
This table is displayed automatically if configured accordingly.
(See " Marker Table Display " on page 80).
Tip: To navigate within long marker tables, simply scroll through the entries with your
finger on the touchscreen.
Remote command:
LAY:ADD? '1',RIGH, MTAB, see LAYout:ADD[:WINDow]? on page 155
Results:
CALCulate<n>:MARKer<m>:X on page 187
CALCulate<n>:MARKer<m>:Y on page 226
15User Manual 1178.3386.02 ─ 10
Page 16
R&S®FPL1000
Measurement and Result Displays
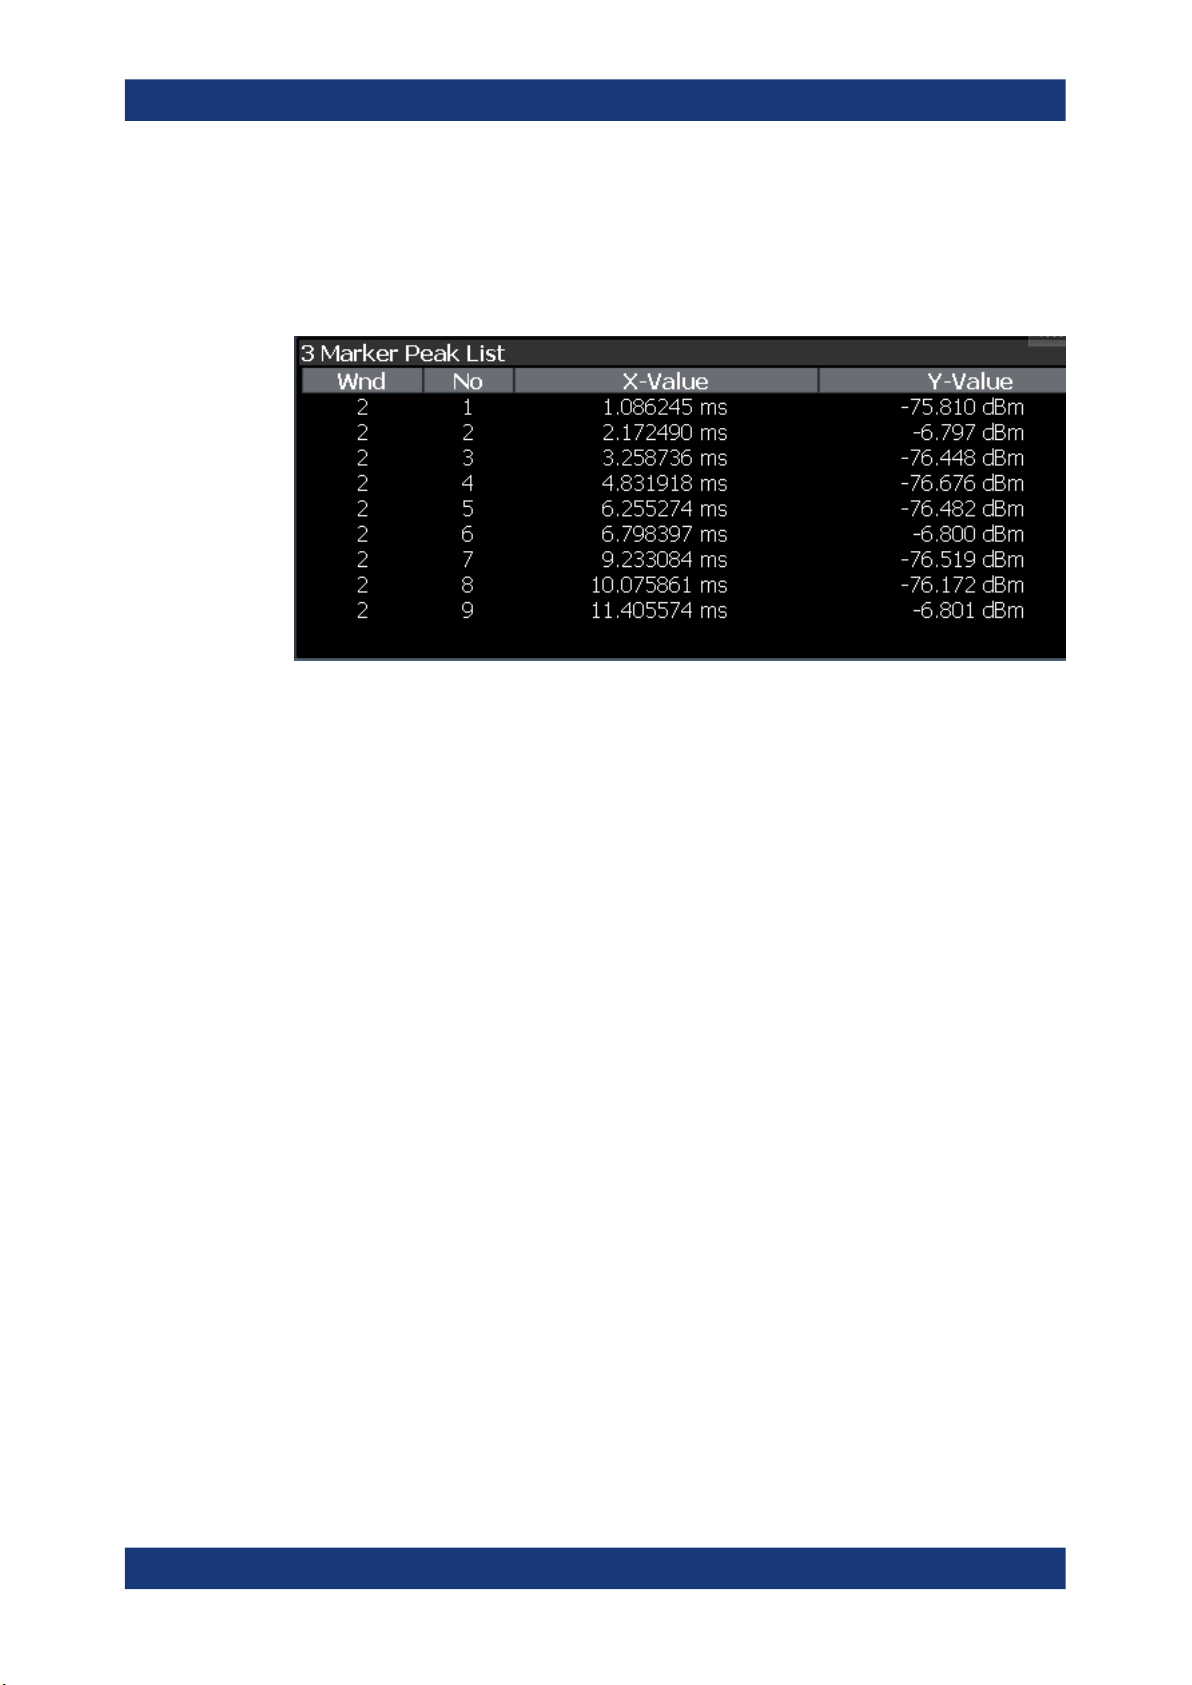
Marker Peak List
The marker peak list determines the frequencies and levels of peaks in the spectrum or
time domain. How many peaks are displayed can be defined, as well as the sort order.
In addition, the detected peaks can be indicated in the diagram. The peak list can also
be exported to a file for analysis in an external application.
Remote command:
LAY:ADD? '1',RIGH, PEAK, see LAYout:ADD[:WINDow]? on page 155
Results:
CALCulate<n>:MARKer<m>:X on page 187
CALCulate<n>:MARKer<m>:Y on page 226
16User Manual 1178.3386.02 ─ 10
Page 17

R&S®FPL1000
4 Basics on I/Q Data Acquisition and Pro-
Basics on I/Q Data Acquisition and Processing
Processing Analog I/Q Data from RF Input
cessing
Some background knowledge on basic terms and principles used when describing I/Q
data acquisition on the R&S FPL1000 in general, and in the I/Q Analyzer application in
particular, is provided here for a better understanding of the required configuration settings.
The I/Q Analyzer provides various possibilities to acquire the I/Q data to be analyzed:
●
Capturing analog I/Q data from the [RF Input] connector
●
Importing I/Q data from a file
Background information for all these scenarios and more is provided in the following
sections.
● Processing Analog I/Q Data from RF Input.............................................................17
● Basics on FFT.........................................................................................................20
● Basics on Input from I/Q Data Files........................................................................ 26
● I/Q Data Import and Export..................................................................................... 26
4.1 Processing Analog I/Q Data from RF Input
Complex baseband data
In the telephone systems of the past, baseband data was transmitted unchanged as an
analog signal. In modern phone systems and in radio communication, however, the
baseband data is modulated on a carrier frequency, which is then transmitted. The
receiver must demodulate the data based on the carrier frequency. When using modern modulation methods (e.g. QPSK, QAM etc.), the baseband signal becomes complex. Complex data (or: I/Q data) consists of an imaginary (I) and a real (Q) component.
Sweep vs sampling
The standard Spectrum application on the R&S FPL1000 performs frequency sweeps
on the input signal and measurements in the frequency and time domain. Other applications on the R&S FPL1000, such as the I/Q Analyzer, sample and process the individual I and Q components of the complex signal.
I/Q Analyzer - processing complex data from RF input
The I/Q Analyzer is a standard application used to capture and analyze I/Q data on the
R&S FPL1000. By default, it assumes the I/Q data is modulated on a carrier frequency
and input via the "RF Input" connector on the R&S FPL1000.
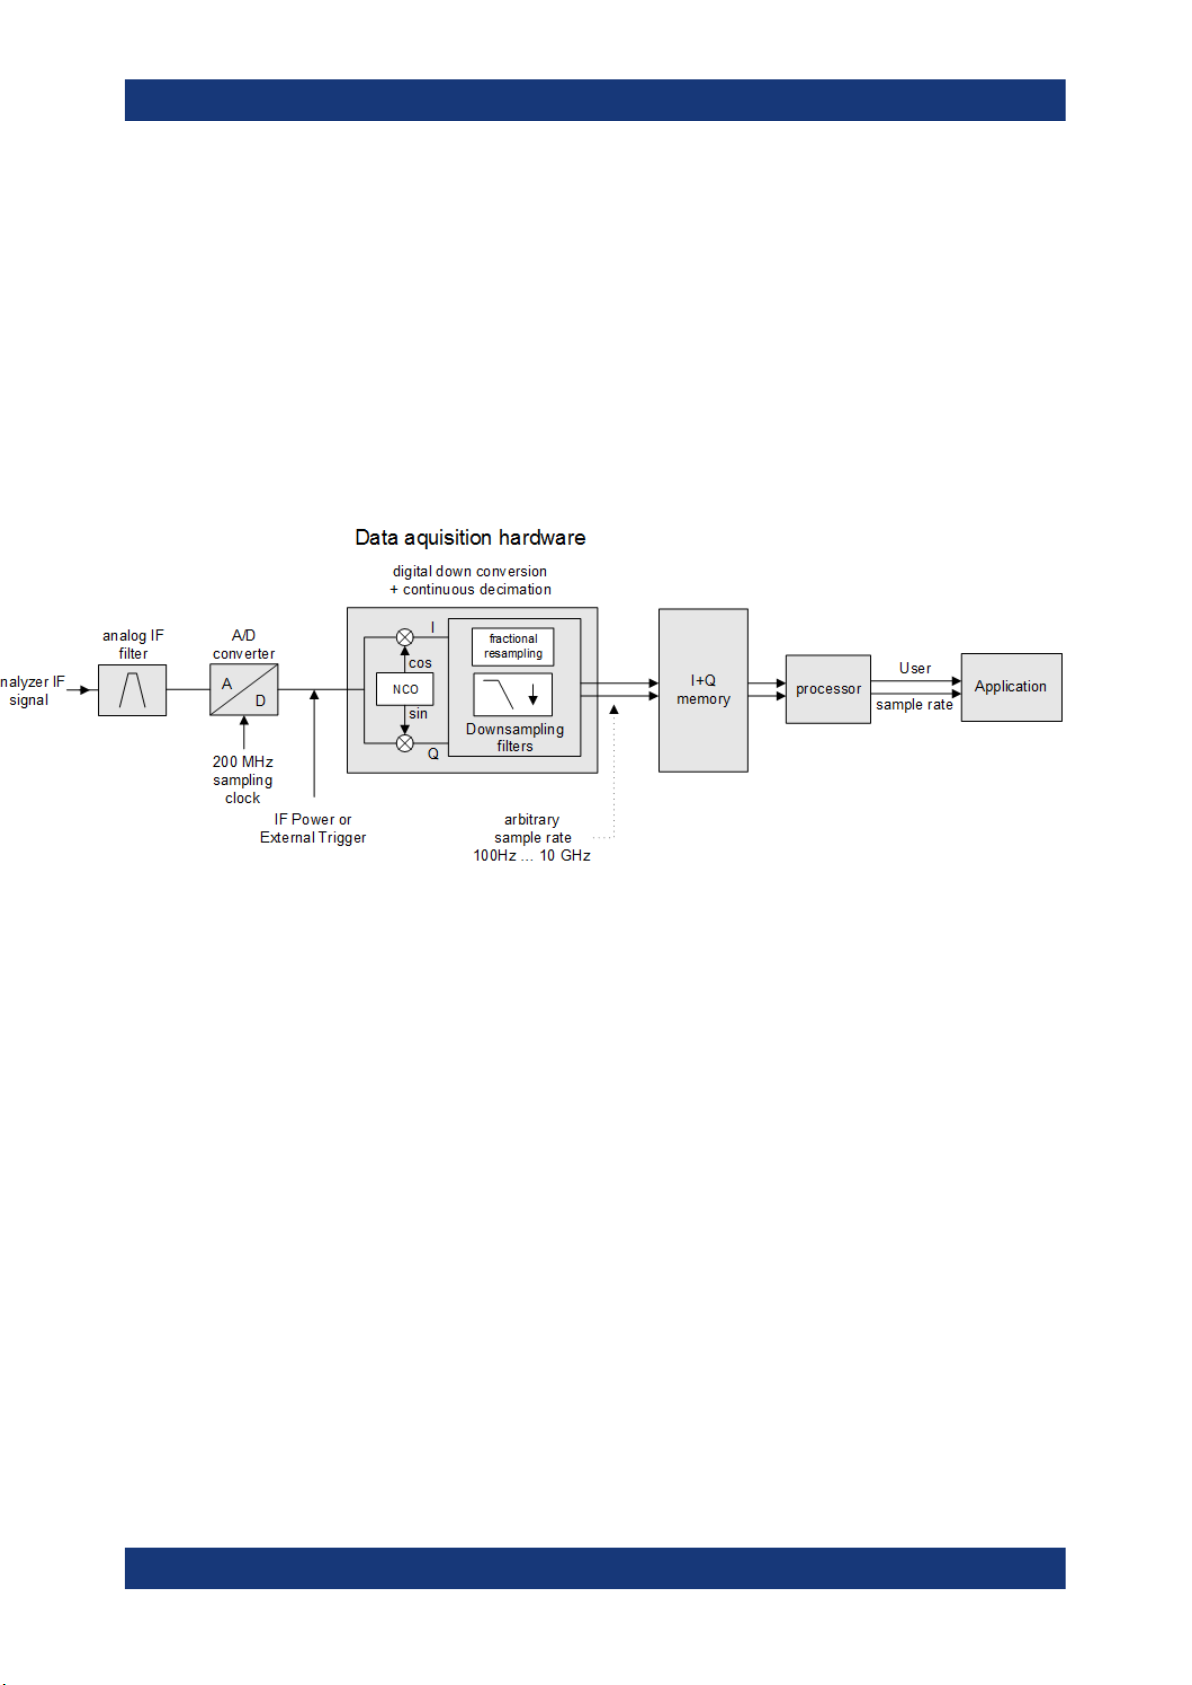
The A/D converter samples the IF signal at a rate of 100 MHz. The digital signal is
down-converted to the complex baseband, lowpass-filtered, and the sample rate is
17User Manual 1178.3386.02 ─ 10
Page 18
R&S®FPL1000
Basics on I/Q Data Acquisition and Processing
Processing Analog I/Q Data from RF Input
reduced. The analog filter stages in the analyzer cause a frequency response which
adds to the modulation errors. An equalizer filter before the resampler compensates
for this frequency response. The continuously adjustable sample rates are realized
using an optimal decimation filter and subsequent resampling on the set sample rate.
A dedicated memory (capture buffer) is available in the R&S FPL1000 for a maximum
of 25 Msamples (25*1000*1000) of complex samples (pairs of I and Q data). The number of complex samples to be captured can be defined (for restrictions refer to Chap-
ter 4.1.1, "Sample Rate and Maximum Usable I/Q Bandwidth for RF Input",
on page 18).
The block diagram in Figure 4-1 shows the analyzer hardware from the IF section to
the processor.
Figure 4-1: Block diagram illustrating the R&S FPL1000 signal processing for analog I/Q data (with-
out bandwidth extension options)
4.1.1 Sample Rate and Maximum Usable I/Q Bandwidth for RF Input
Definitions
●
Input sample rate (ISR): the sample rate of the useful data provided by the device
connected to the input of the R&S FPL1000
●
(User, Output) Sample rate (SR): the user-defined sample rate (e.g. in the "Data
Acquisition" dialog box in the "I/Q Analyzer" application) which is used as the basis
for analysis or output
●
Usable I/Q (Analysis) bandwidth: the bandwidth range in which the signal
remains undistorted in regard to amplitude characteristic and group delay; this
range can be used for accurate analysis by the R&S FPL1000
●
Record length: Number of I/Q samples to capture during the specified measurement time; calculated as the measurement time multiplied by the sample rate
For the I/Q data acquisition, digital decimation filters are used internally in the
R&S FPL1000. The passband of these digital filters determines the maximum usable
I/Q bandwidth. In consequence, signals within the usable I/Q bandwidth (passband)
18User Manual 1178.3386.02 ─ 10
Page 19

R&S®FPL1000
Basics on I/Q Data Acquisition and Processing
Processing Analog I/Q Data from RF Input
remain unchanged, while signals outside the usable I/Q bandwidth (passband) are
suppressed. Usually, the suppressed signals are noise, artifacts, and the second IF
side band. If frequencies of interest to you are also suppressed, try to increase the output sample rate, which increases the maximum usable I/Q bandwidth.
Bandwidth extension options
You can extend the maximum usable I/Q bandwidth provided by the R&S FPL1000 in
the basic installation by adding options. These options can either be included in the initial installation (B-options) or updated later (U-options). The maximum bandwidth provided by the individual option is indicated by its number, for example, B40 extends the
bandwidth to 40 MHz.
As a rule, the usable I/Q bandwidth is proportional to the output sample rate. Yet, when
the I/Q bandwidth reaches the bandwidth of the analog IF filter (at very high output
sample rates), the curve breaks.
● Relationship Between Sample Rate, Record Length and Usable I/Q Bandwidth... 19
4.1.1.1 Relationship Between Sample Rate, Record Length and Usable I/Q Bandwidth
Up to the maximum bandwidth, the following rule applies:
Usable I/Q bandwidth = 0.8 * Output sample rate
Regarding the record length, the following rule applies:
Record length = Measurement time * sample rate
Maximum record length for RF input
The maximum record length is the maximum number of samples that can be captured.
Table 4-1: Maximum record length
Sample rate Maximum record length
100 Hz to 100 MHz 25 Msamples
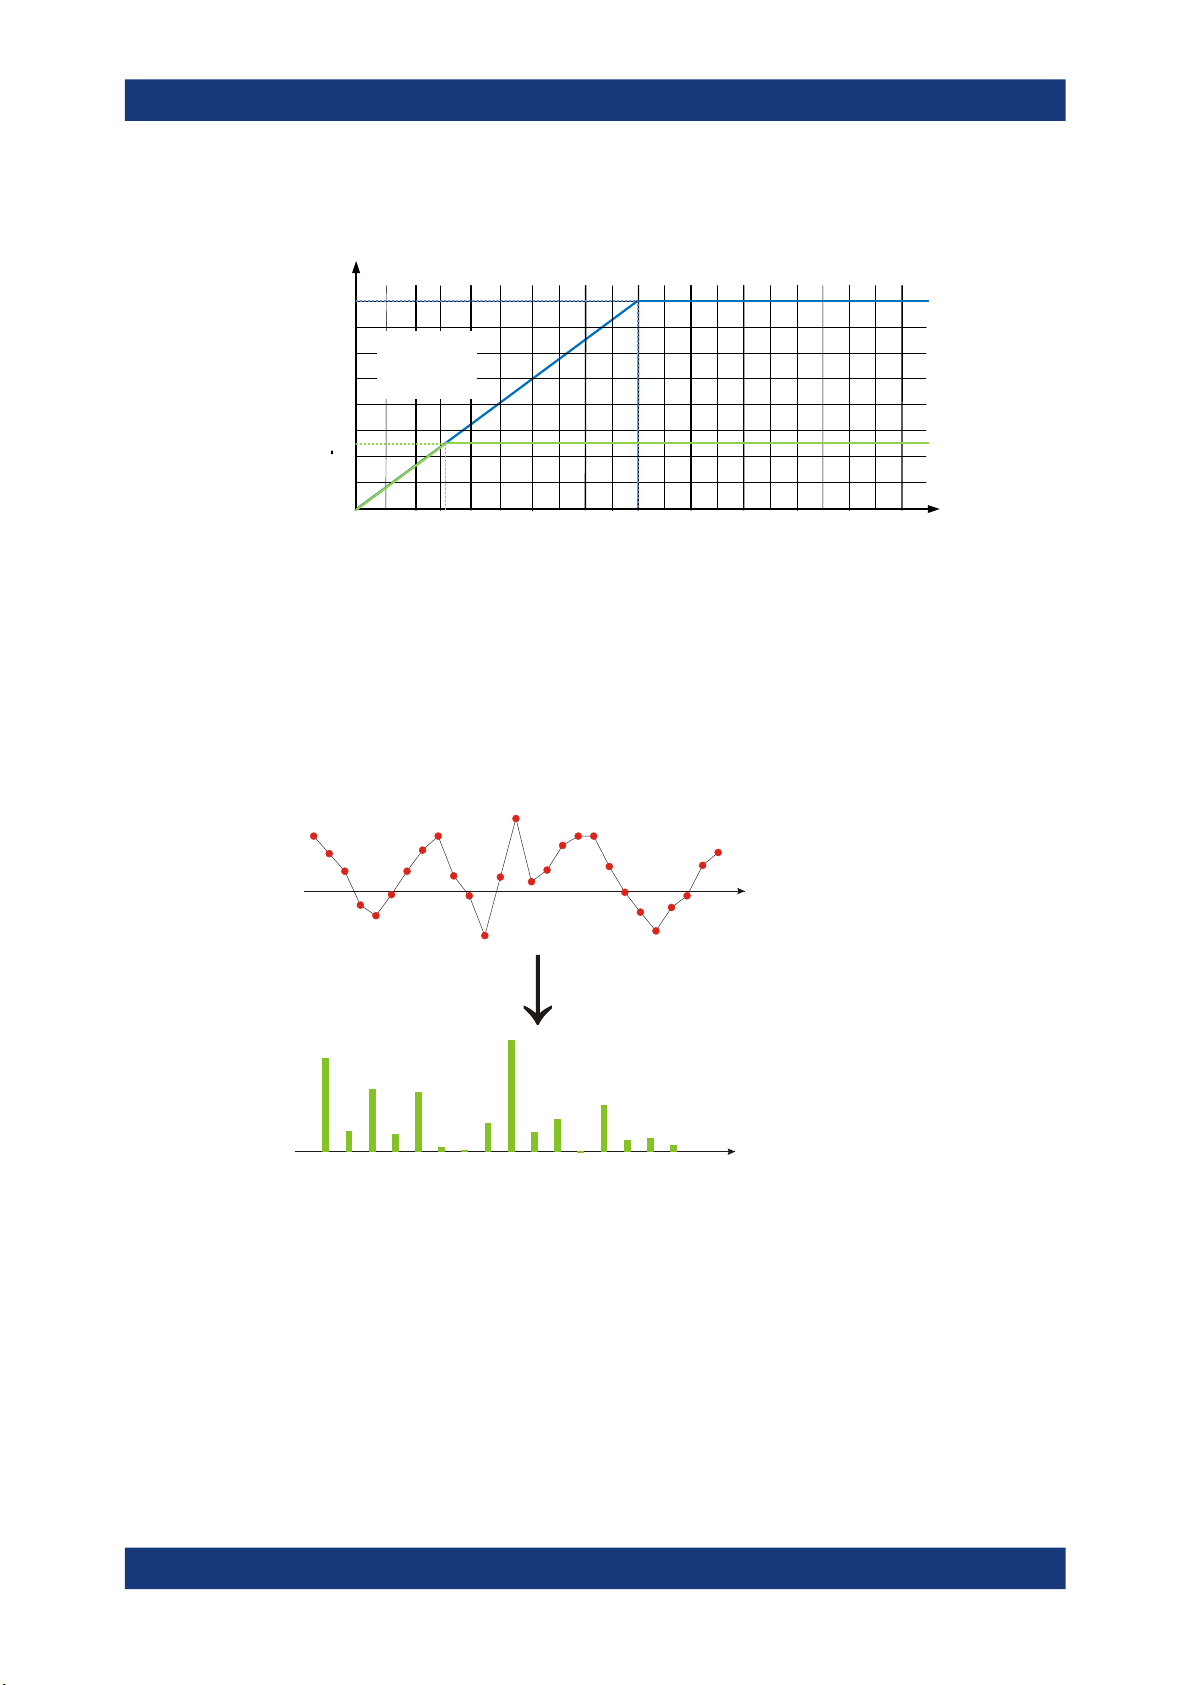
The Figure 4-2 shows the maximum usable I/Q bandwidths depending on the output
sample rates.
19User Manual 1178.3386.02 ─ 10
Page 20
R&S®FPL1000
4.2 Basics on FFT
Basics on I/Q Data Acquisition and Processing
Basics on FFT
Usable I/Q
bandwidth
[MHz]
40
35
30
25
20
15
12.8
10
5
Figure 4-2: Relationship between maximum usable I/Q bandwidth and output sample rate
RF-Input:
BW = 0.80 *
f
out
16
2010
30 40 50 60 70 80 90 100
With 40 MHz
bandwidth
ext. option
bandwidth
Output sample
rate f
Without
extension
[MHz]
out
The I/Q Analyzer measures the power of the signal input over time. To convert the time
domain signal to a frequency spectrum, an FFT (Fast Fourier Transformation) is performed which converts a vector of input values into a discrete spectrum of frequencies.
4.2.1 Window Functions
The Fourier transformation is not performed on the entire captured data in one step.
Only a limited number of samples is used to calculate an individual result. This process
is called windowing.
t[s]
FFT
f[Hz]
After sampling in the time domain, each window is multiplied with a specific window
function. Windowing helps minimize the discontinuities at the end of the measured signal interval and thus reduces the effect of spectral leakage, increasing the frequency
resolution.
20User Manual 1178.3386.02 ─ 10
Page 21

R&S®FPL1000
Basics on I/Q Data Acquisition and Processing
Basics on FFT
Various different window functions are provided in the R&S FPL1000 to suit different
input signals. Each of the window functions has specific characteristics, including some
advantages and some trade-offs. Consider these characteristics to find the optimum
solution for the measurement task.
Ignoring the window function - rectangular window
The rectangular window function is in effect not a function at all, it maintains the original sampled data. This may be useful to minimize the required bandwidth. However, be
aware that if the window does not contain exactly one period of your signal, heavy
sidelobes may occur, which do not exist in the original signal.
Table 4-2: Characteristics of typical FFT window functions
Window type Frequency
Rectangular Best Worst Worst No function applied.
Blackman-Harris
(default)
Gauss (Alpha
= 0.4)
Flattop Worst Best Good Accurate single tone measurements
5-Term Good Good Best Measurements with very high
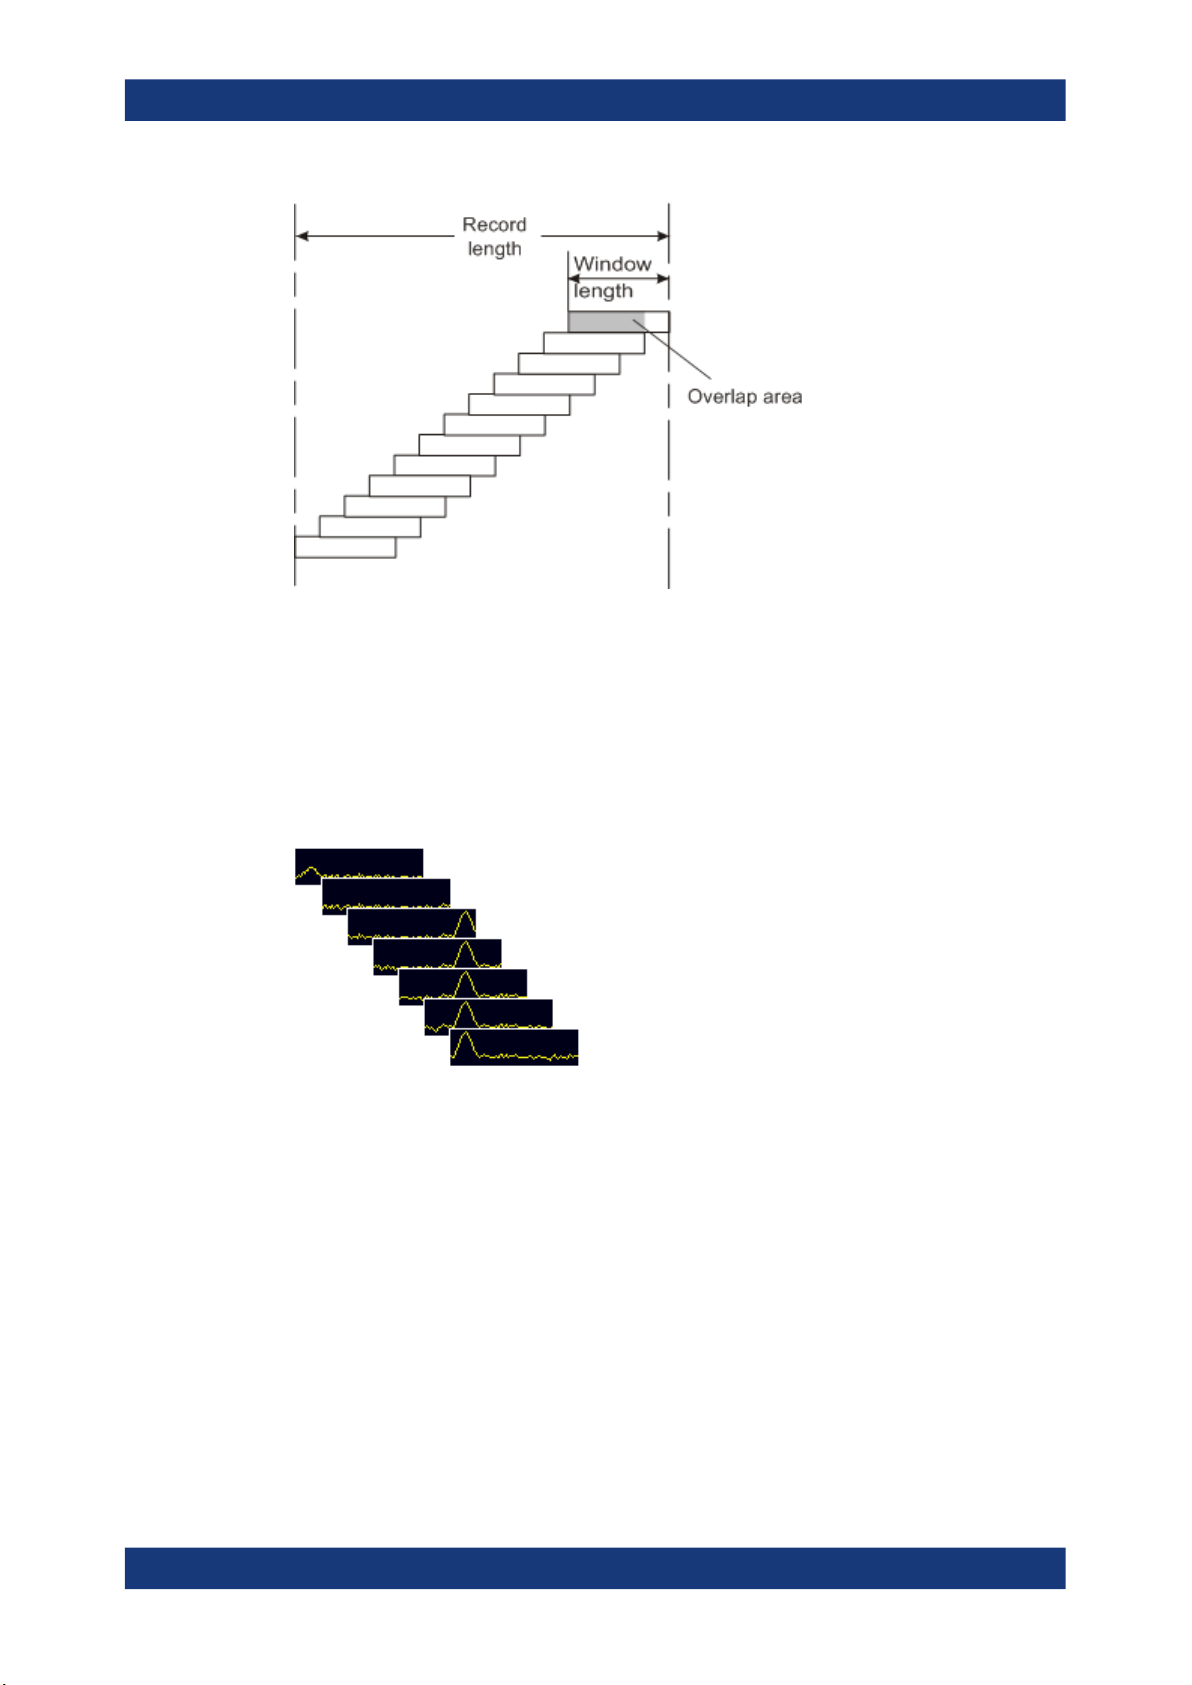
4.2.2 Overlapping
The I/Q Analyzer calculates multiple FFTs per measurement by dividing one captured
record into several windows. Furthermore, the I/Q Analyzer allows consecutive windows to overlap. Overlapping "reuses" samples that were already used to calculate the
preceding FFT result.
Magnitude
resolution
Good Good Good Harmonic detection and spurious
Good Good Good Weak signals and short duration
resolution
Sidelobe suppression
Measurement recommendation
Separation of two tones with almost
equal amplitudes and a small frequency distance
emission detection
dynamic range
21User Manual 1178.3386.02 ─ 10
Page 22
R&S®FPL1000
Basics on I/Q Data Acquisition and Processing
Basics on FFT
In advanced FFT mode with averaging, the overlapping factor can be set freely. The
higher the overlap factor, the more windows are used. This leads to more individual
results and improves detection of transient signal effects. However, it also extends the
duration of the calculation. The size of the window can be defined manually according
to the record length, the overlap factor, and the FFT length.
An FFT overlap of 67%, for example, means the second FFT calculation uses the last
67% of the data of the first FFT. It uses only 33% new data. The third FFT still covers
33% of the first FFT and 67% of the second FFT, and so on.
Figure 4-3: Overlapping FFTs
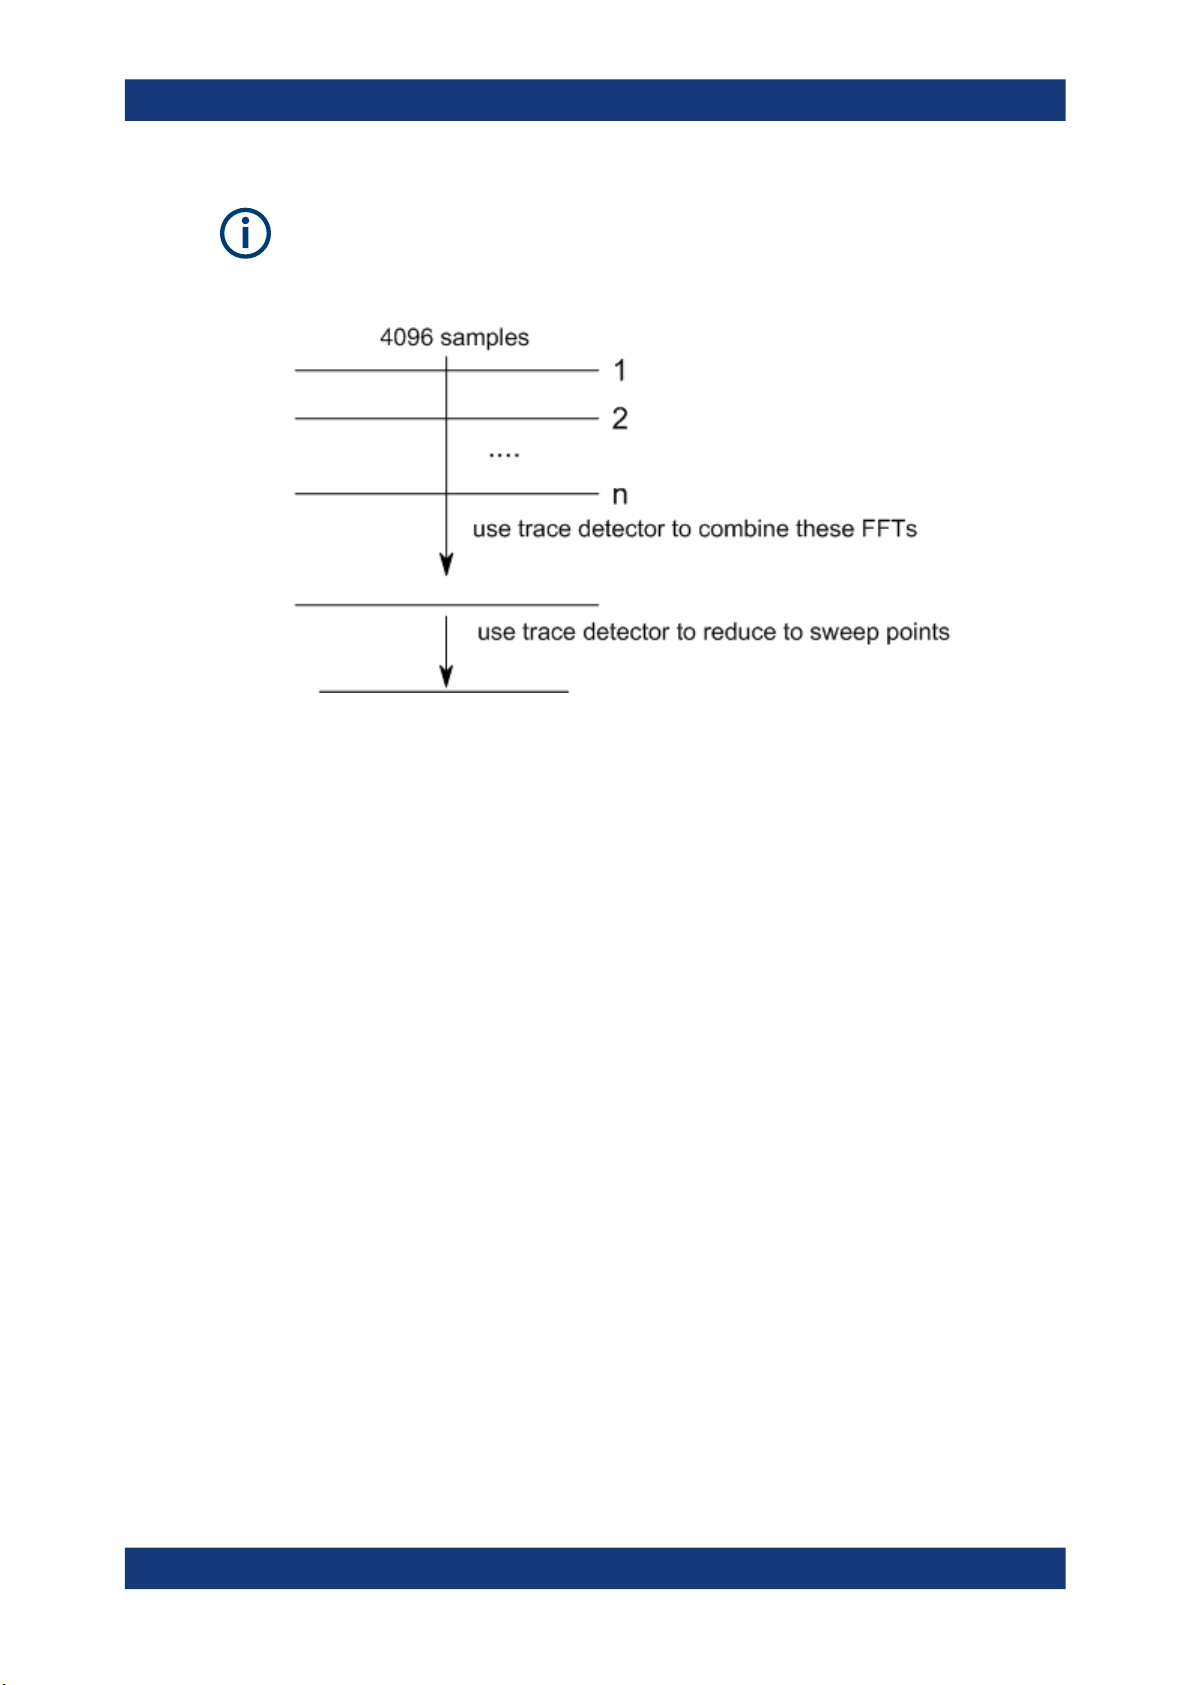
In "Manual" or "Auto" FFT mode, an FFT length of 4096 and a window length of 4096
(or the record length, if shorter) is used to calculate the spectrum.
Combining results - trace detector
If the record length permits, multiple overlapping windows are calculated and combined
to create the final spectrum using the selected trace detector. If necessary, the trace
detector is also used to reduce the number of calculated frequency points (defined by
the FFT length) to the defined number of sweep points. By default, the Autopeak trace
detector is used.
22User Manual 1178.3386.02 ─ 10
Page 23
R&S®FPL1000
Basics on I/Q Data Acquisition and Processing
Basics on FFT
Since the frequency points are reduced to the number of sweep points, using a detector other than "Auto Peak" and fewer than 4096 sweep points can lead to false level
results.
4.2.3 Dependencies Between FFT Parameters
FFT analysis in the R&S FPL1000 is highly configurable. Several parameters, including
the resolution bandwidth, record length, and FFT length, are user-definable. Note,
however, that several parameters are correlated and not all can be configured independently of the others.
Record Length
Defines the number of I/Q samples to capture. By default, the number of sweep points
is used. The record length is calculated as the measurement time multiplied by the
sample rate.
If you change the record length, the Meas Time is automatically changed, as well.
For FFTs using only a single window ( "Single" mode), the record length (which is then
identical to the FFT length) must not exceed 512k.
FFT Length
Defines the number of frequency points determined by each FFT calculation. The more
points are used, the higher the resolution in the spectrum becomes, but the longer the
calculation takes.
In "Auto" or "Manual" mode, an FFT length of 4096 is used.
If the FFT length is longer than the Window Length the sample data is filled up with
zeros up to the FFT length. The FFT is then performed using interpolated frequency
points.
For an FFT length that is not a power of 2, a DFT (discrete Fourier transform) is performed, which requires more time for calculation, but avoids the effects of interpolation.
23User Manual 1178.3386.02 ─ 10
Page 24

R&S®FPL1000
LengthWindow
RateSample
BandwidthNormalizedRBW
3
RateSample*BandwidthNormalized
RBW
max
Basics on I/Q Data Acquisition and Processing
Basics on FFT
To display all calculated frequency points (defined by the FFT length), the number of
sweep points is set to the FFT length automatically in advanced FFT mode.
Window Length
Defines the number of samples to be included in a single window in averaging mode.
(In single mode, the window length corresponds to the " Record Length "
on page 56.)
Values from 3 to 4096 are available in "Manual" mode; in "Advanced" FFT mode, values from 3 to 524288 are available. However, the window length must not be longer
than the FFT Length .
If the window length is shorter than the FFT Length , the sample data is filled up with
zeros up to the FFT length.
If the window length is longer than the Record Length (that is, not enough samples are
available), a window length the size of the Record Length is used for calculation.
The window length and the Window Overlap determine how many FFT calculations
must be performed for each record in averaging mode (see " Transformation Algorithm
" on page 57).
4.2.4 Frequency Resolution of FFT Results - RBW
The resolution bandwidth defines the minimum frequency separation at which the
individual components of a spectrum can be distinguished. Small values result in high
precision, as the distance between two distinguishable frequencies is small. Higher values decrease the precision, but increase measurement speed.
The RBW is determined by the following equation:
Equation 4-1: Definition of RBW
(Note: The normalized bandwidth is a fixed value that takes the noise bandwidth of the
window function into consideration.)
The maximum RBW is restricted by the Analysis Bandwidth , or by the following equation, whichever is higher:
If a higher spectral resolution is required, the number of samples must be increased by
using a higher sample rate or longer record length.
The minimum achievable RBW depends on the sample rate and record length, according to the following equation:
24User Manual 1178.3386.02 ─ 10
Page 25

R&S®FPL1000
LengthcordRe,4096min
RateSampleBandwidth*Normalized
RBW
min
Basics on I/Q Data Acquisition and Processing
Basics on FFT
To simplify operation, some parameters are coupled and automatically calculated, such
as record length and RBW.
RBW mode
Depending on the selected RBW mode, the resolution bandwidth is either determined
automatically or can be defined manually.
Auto mode:
This is the default mode in the I/Q Analyzer. The RBW is determined automatically
depending on the Sample Rate and Window Length , where the window length corresponds to the Record Length , or a maximum of 4096.
If the record length is larger than the window length, multiple windows are combined;
the FFT length is 4096.
A Flatop window function is used.
Manual mode:
The RBW is user-definable.
The Window Length is adapted to comply with Equation 4-1. Since only window
lengths with integer values can be employed, the Sample Rate is adapted, if necessary, to obtain an integer window length value.
If the record length is larger than the window length, multiple windows are combined;
the FFT length is 4096.
A Flatop window function is used.
Advanced FFT mode
The RBW is determined by the advanced FFT parameters, depending on the selected
FFT Calculation Methods method.
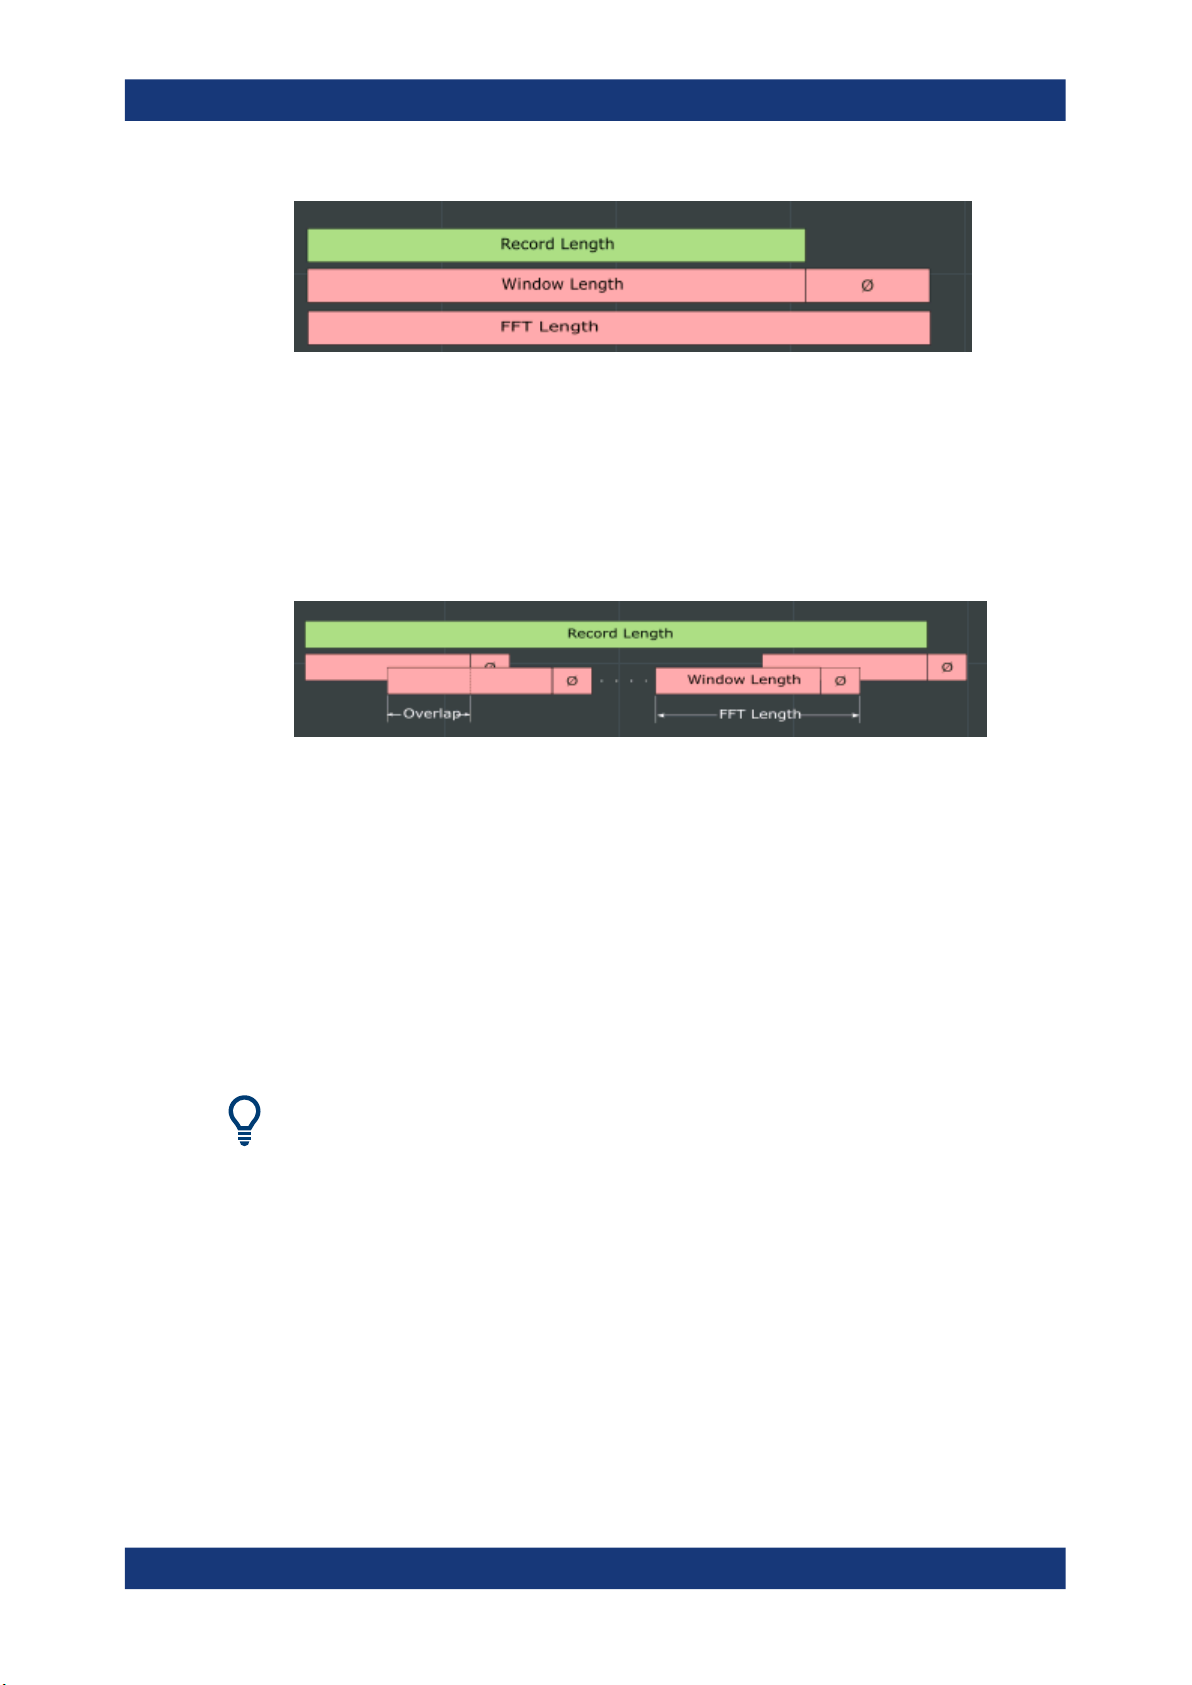
4.2.5 FFT Calculation Methods
FFT calculation can be performed using different methods.
Single
In single mode, one FFT is calculated for the entire record length, that means the window length is identical to the record length.
If the defined FFT Length is larger than the record length, zeros are appended to the
captured data to reach the FFT length.
25User Manual 1178.3386.02 ─ 10
Page 26
R&S®FPL1000
Basics on I/Q Data Acquisition and Processing
I/Q Data Import and Export
Figure 4-4: FFT parameters for single FFT calculation
Averaging
In averaging mode, several overlapping FFTs are calculated for each record; the
results are combined to determine the final FFT result for the record.
The number of FFTs to be combined is determined by the Window Overlap and the
Window Length .
Figure 4-5: FFT parameters for averaged FFT calculation
4.3 Basics on Input from I/Q Data Files
The I/Q data to be evaluated in a particular R&S FPL1000 application can not only be
captured by the application itself, it can also be loaded from a file, provided it has the
correct format. The file is then used as the input source for the application.
The I/Q data must be stored in a format with the file extension .iq.tar. For a detailed
description see Chapter C, "I/Q Data File Format (iq-tar)", on page 235.
An application note on converting Rohde & Schwarz I/Q data files is available from the
Rohde & Schwarz website:
1EF85: Converting R&S I/Q data files
When using input from an I/Q data file, the [RUN SINGLE] function starts a single measurement (i.e. analysis) of the stored I/Q data, while the [RUN CONT] function repeatedly analyzes the same data from the file.
4.4 I/Q Data Import and Export
Baseband signals mostly occur as so-called complex baseband signals, i.e. a signal
representation that consists of two channels; the in phase (I) and the quadrature (Q)
26User Manual 1178.3386.02 ─ 10
Page 27

R&S®FPL1000
Basics on I/Q Data Acquisition and Processing
I/Q Data Import and Export
channel. Such signals are referred to as I/Q signals. The complete modulation information and even distortion that originates from the RF, IF or baseband domains can be
analyzed in the I/Q baseband.
Importing and exporting I/Q signals is useful for various applications:
●
Generating and saving I/Q signals in an RF or baseband signal generator or in
external software tools to analyze them with the R&S FPL1000 later
●
Capturing and saving I/Q signals with an RF or baseband signal analyzer to analyze them with the R&S FPL1000 or an external software tool later
As opposed to storing trace data, which may be averaged or restricted to peak values,
I/Q data is stored as it was captured, without further processing. The data is stored as
complex values in 32-bit floating-point format. Multi-channel data is not supported. The
I/Q data is stored in a format with the file extension .iq.tar.
An application note on converting Rohde & Schwarz I/Q data files is available from the
Rohde & Schwarz website:
1EF85: Converting R&S I/Q data files
The import and export functions are available in the "Save/Recall" menu which is displayed when you select the
"Import/Export Functions", on page 30).
"Save" or "Open" icon in the toolbar (see Chapter 5.2,
27User Manual 1178.3386.02 ─ 10
Page 28

R&S®FPL1000
5 Configuration
Configuration
Configuration Overview
Access: [MODE] > "I/Q Analyzer"
The I/Q Analyzer is a special application on the R&S FPL1000.
For details see the "Applications, Measurement Channels, and Result Displays" chapter in the R&S FPL1000 User Manual.
When you switch to an I/Q Analyzer channel setup the first time, a set of parameters is
passed on from the currently active application. After initial setup, the parameters for
the channel setup are stored upon exiting and restored upon re-entering the channel
setup. Thus, you can switch between applications quickly and easily.
When you activate a channel setup for the I/Q Analyzer application, data acquisition
from the input signal is started automatically with the default configuration. The "I/Q
Analyzer" menu is displayed and provides access to the most important configuration
functions.
The remote commands required to perform these tasks are described in Chapter 9,
"Remote Commands to Perform Measurements with I/Q Data", on page 103.
Importing and Exporting I/Q Data
The I/Q data to be evaluated in the I/Q Analyzer application can not only be captured
by the I/Q Analyzer itself, it can also be imported to the R&S FPL1000, provided it has
the correct format. Furthermore, the captured I/Q data from the I/Q Analyzer can be
exported for further analysis in external applications.
For details see Chapter 4.4, "I/Q Data Import and Export", on page 26.
● Configuration Overview...........................................................................................28
● Import/Export Functions..........................................................................................30
● Receiving Data Input and Providing Data Output................................................... 33
● Amplitude................................................................................................................ 44
● Frequency Settings................................................................................................. 49
● Trigger Settings.......................................................................................................51
● Data Acquisition and Bandwidth Settings............................................................... 54
● Display Configuration..............................................................................................60
● Adjusting Settings Automatically.............................................................................61
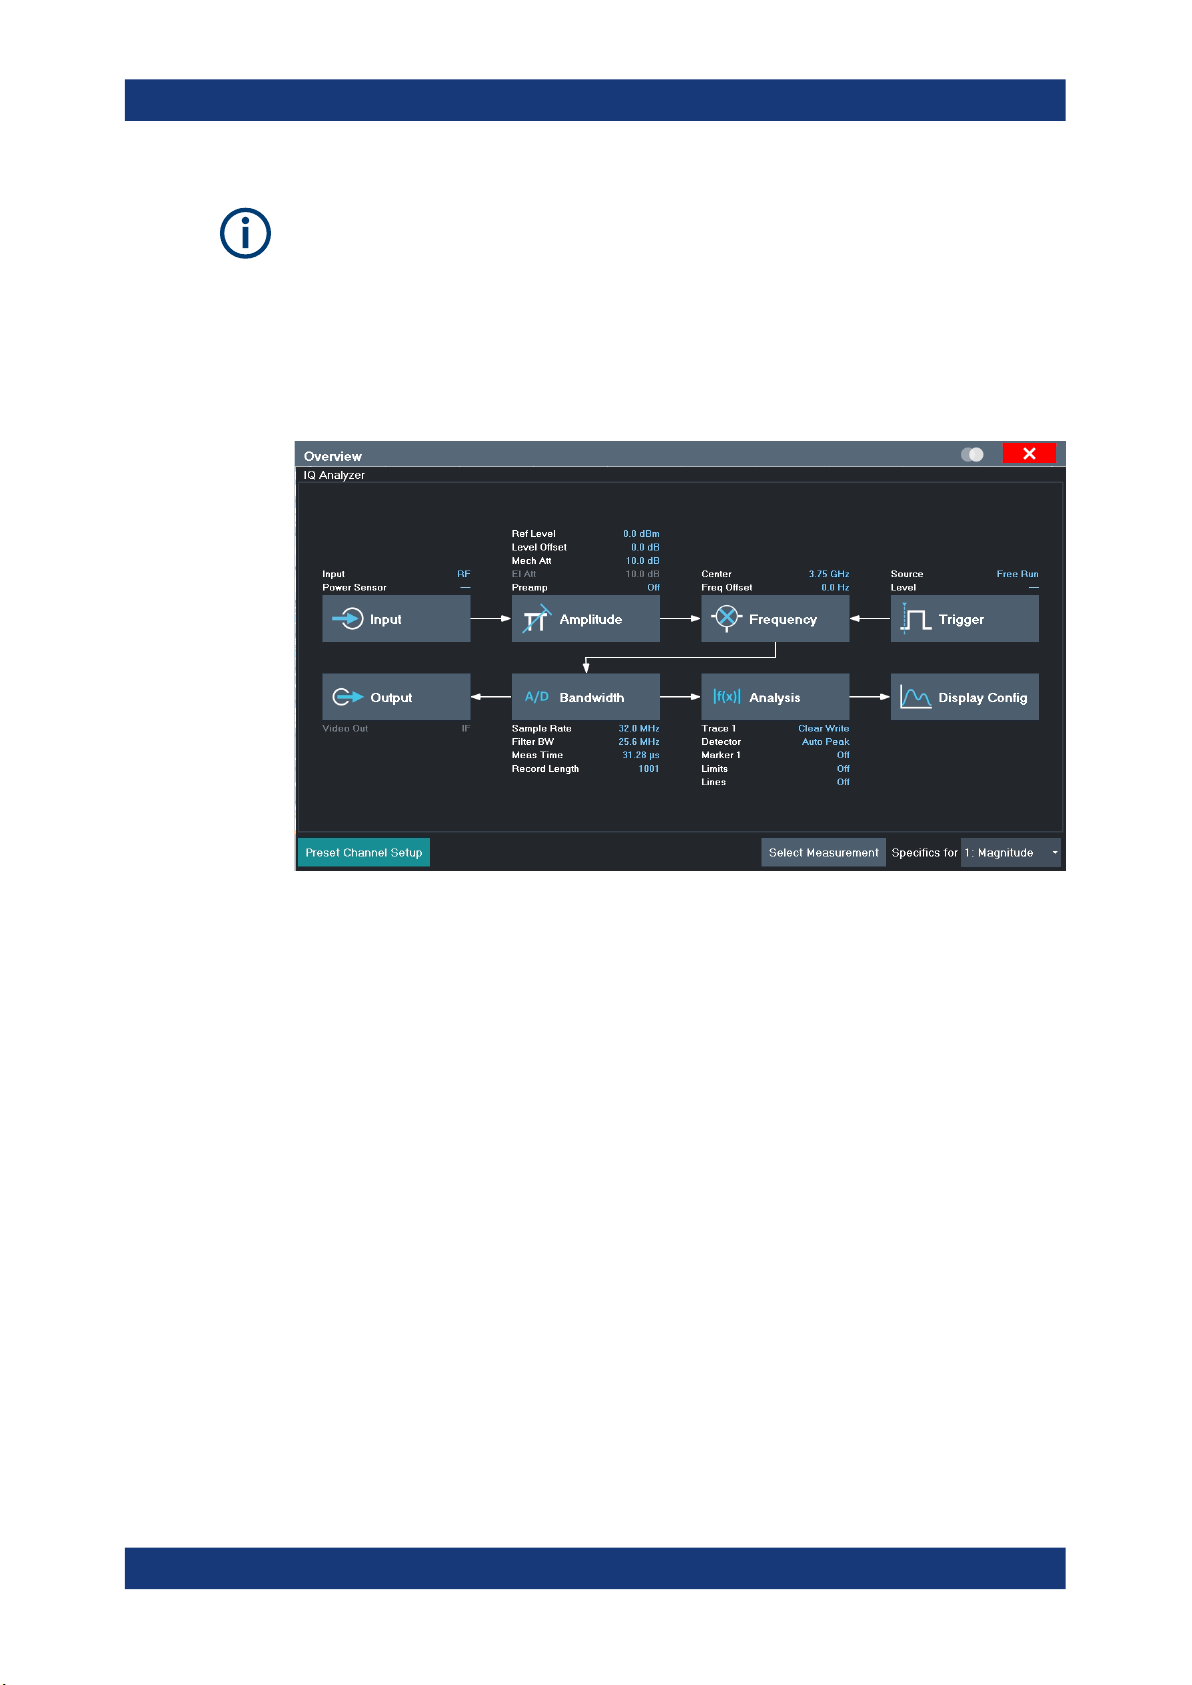
5.1 Configuration Overview
Access: all menus
Throughout the channel setup configuration, an overview of the most important currently defined settings is provided in the "Overview" .
28User Manual 1178.3386.02 ─ 10
Page 29
R&S®FPL1000
Configuration
Configuration Overview
Multiple access paths to functionality
The easiest way to configure a channel setup is via the "Overview" dialog box, which is
available from all menus.
Alternatively, you can access the individual dialog boxes from the corresponding menu
items, or via tools in the toolbars, if available.
In this documentation, only the most convenient method of accessing the dialog boxes
is indicated - usually via the "Overview" .
Figure 5-1: Configuration Overview for I/Q Analyzer Master
In addition to the main measurement settings, the "Overview" provides quick access to
the main settings dialog boxes. The individual configuration steps are displayed in the
order of the data flow. Thus, you can easily configure an entire channel setup from
input over processing to output and analysis by stepping through the dialog boxes as
indicated in the "Overview" .
The "Overview" for the I/Q Analyzer provides quick access to the following configuration dialog boxes (listed in the recommended order of processing):
1. Input settings
See Chapter 5.3.1, "Radio Frequency Input", on page 33
2. Amplitude settings
See Chapter 5.4, "Amplitude", on page 44
3. Frequency settings
See Chapter 5.5, "Frequency Settings", on page 49
4. Optionally, Trigger/Gate settings
See Chapter 5.6, "Trigger Settings", on page 51
5. Bandwidth settings
See Chapter 5.7, "Data Acquisition and Bandwidth Settings", on page 54
29User Manual 1178.3386.02 ─ 10
Page 30

R&S®FPL1000
Configuration
Import/Export Functions
6. Analysis settings and functions
See Chapter 6, "Analysis", on page 64
7. Display configuration
See Chapter 5.8, "Display Configuration", on page 60
To configure settings
► Select any button in the "Overview" to open the corresponding dialog box.
Select a setting in the channel bar (at the top of the channel setup tab) to change a
specific setting.
For step-by-step instructions on configuring I/Q Analyzer measurements, see Chap-
ter 7, "How to Perform Measurements in the I/Q Analyzer Application", on page 99.
Preset Channel Setup
Select the "Preset Channel" button in the lower left-hand corner of the "Overview" to
restore all measurement settings in the current channel setup to their default values.
Do not confuse the "Preset Channel" button with the [Preset] key, which restores the
entire instrument to its default values and thus closes all channel setups on the
R&S FPL1000 (except for the default channel setup)!
Remote command:
SYSTem:PRESet:CHANnel[:EXEC] on page 112
Specific Settings for
The channel setup may contain several windows for different results. Thus, the settings
indicated in the "Overview" and configured in the dialog boxes vary depending on the
selected window.
Select an active window from the "Specific Settings for" selection list that is displayed
in the "Overview" and in all window-specific configuration dialog boxes.
The "Overview" and dialog boxes are updated to indicate the settings for the selected
window.
5.2 Import/Export Functions
Access: "Save" / "Open" icon in the toolbar > "Import" / "Export"
The R&S FPL1000 provides various evaluation methods for the results of the performed measurements. However, you may want to evaluate the data with further, external applications. In this case, you can export the measurement data to a standard format file (ASCII or XML). Some of the data stored in these formats can also be reimported to the R&S FPL1000 for further evaluation later, for example in other applications.
The following data types can be exported (depending on the application):
●
Trace data
●
Table results, such as result summaries, marker peak lists etc.
30User Manual 1178.3386.02 ─ 10
Page 31

R&S®FPL1000
Configuration
Import/Export Functions
●
I/Q data
The following data types can be imported (depending on the application):
●
I/Q data
I/Q data can only be imported and exported in applications that process I/Q data, such
as the I/Q Analyzer or optional applications.
See the corresponding user manuals for those applications for details.
These functions are only available if no measurement is running.
In particular, if Continuous Sweep / Run Cont is active, the import/export functions are
not available.
Import ...........................................................................................................................31
└ I/Q Import .......................................................................................................31
└ File Explorer..........................................................................................31
Export ...........................................................................................................................31
└ Export Trace to ASCII File ............................................................................. 32
└ File Type ..............................................................................................32
└ Decimal Separator ...............................................................................32
└ File Explorer..........................................................................................33
└ Trace Export Configuration ............................................................................33
└ I/Q Export .......................................................................................................33
└ File Explorer..........................................................................................33
Import
Access: "Save/Recall" > Import
Provides functions to import data.
I/Q Import ← Import
Opens a file selection dialog box to select an import file that contains I/Q data. This
function is only available in single sweep mode and only in applications that process
I/Q data, such as the I/Q Analyzer or optional applications.
Input from I/Q data files is imported as it was stored, including any correction factors,
for example from transducers or SnP files. Any currently configured correction factors
at the time of import, however, are not applied.
Remote command:
MMEMory:LOAD:IQ:STATe on page 227
File Explorer ← I/Q Import ← Import
Opens the Microsoft Windows File Explorer.
Remote command:
not supported
Export
Access: "Save/Recall" > Export
Opens a submenu to configure data export.
31User Manual 1178.3386.02 ─ 10
Page 32

R&S®FPL1000
Configuration
Import/Export Functions
Export Trace to ASCII File ← Export
Saves the selected trace or all traces in the currently active result display to the specified file and directory in the selected ASCII format.
"File Explorer": Instead of using the file manager of the R&S FPL1000 firmware, you
can also use the Microsoft Windows File Explorer to manage files.
Remote command:
MMEMory:STORe<n>:TRACe on page 225
File Type ← Export Trace to ASCII File ← Export
Determines the format of the ASCII file to be imported or exported.
Depending on the external program in which the data file was created or is evaluated,
a comma-separated list (CSV) or a plain data format (DAT) file is required.
Remote command:
FORMat:DEXPort:FORMat on page 224
Decimal Separator ← Export Trace to ASCII File ← Export
Defines the decimal separator for floating-point numerals for the data export/import
files. Evaluation programs require different separators in different languages.
32User Manual 1178.3386.02 ─ 10
Page 33

R&S®FPL1000
Configuration
Receiving Data Input and Providing Data Output
Remote command:
FORMat:DEXPort:DSEParator on page 224
File Explorer ← Export Trace to ASCII File ← Export
Opens the Microsoft Windows File Explorer.
Remote command:
not supported
Trace Export Configuration ← Export
Opens the "Traces" dialog box to configure the trace and data export settings.
I/Q Export ← Export
Opens a file selection dialog box to define an export file name to which the I/Q data is
stored. This function is only available in single sweep mode.
It is not available in the Spectrum application, only in applications that process I/Q
data, such as the I/Q Analyzer or optional applications.
For details, see the description in the R&S FPL1000 I/Q Analyzer User Manual
("Importing and Exporting I/Q Data").
Note: Storing large amounts of I/Q data (several Gigabytes) can exceed the available
(internal) storage space on the R&S FPL1000. In this case, it can be necessary to use
an external storage medium.
Remote command:
MMEMory:STORe<n>:IQ:STATe on page 228
MMEMory:STORe<n>:IQ:COMMent on page 228
File Explorer ← I/Q Export ← Export
Opens the Microsoft Windows File Explorer.
Remote command:
not supported
5.3 Receiving Data Input and Providing Data Output
The R&S FPL1000 can analyze signals from different input sources and provide various types of output (such as noise source control signals).
● Radio Frequency Input............................................................................................33
● Settings for Input from I/Q Data Files......................................................................35
● Power Sensors........................................................................................................36
● Independent CW Source Settings...........................................................................42
● Output Settings....................................................................................................... 43
5.3.1 Radio Frequency Input
Access: "Overview" > "Input" > "Input Source" > "Radio Frequency"
33User Manual 1178.3386.02 ─ 10
Page 34

R&S®FPL1000
Configuration
Receiving Data Input and Providing Data Output
RF Input Protection
The RF input connector of the R&S FPL1000 must be protected against signal levels
that exceed the ranges specified in the data sheet. Therefore, the R&S FPL1000 is
equipped with an overload protection mechanism. This mechanism becomes active as
soon as the power at the input mixer exceeds the specified limit. It ensures that the
connection between RF input and input mixer is cut off.
The RF input connector of the R&S FPL1000 must be protected against signal levels
that exceed the ranges specified in the data sheet. Therefore, the R&S FPL1000 is
equipped with an overload protection mechanism for DC and signal frequencies up to
30 MHz. This mechanism becomes active as soon as the power at the input mixer
exceeds the specified limit. It ensures that the connection between RF input and input
mixer is cut off.
When the overload protection is activated, an error message is displayed in the status
bar ( "INPUT OVLD" ), and a message box informs you that the RF Input was disconnected. Furthermore, a status bit (bit 3) in the STAT:QUES:POW status register is set.
In this case you must decrease the level at the RF input connector and then close the
message box. Then measurement is possible again. Reactivating the RF input is also
possible via the remote command INPut<ip>:ATTenuation:PROTection:RESet.
The power sensor functions are described in the R&S FPL1000 User Manual.
Radio Frequency State ................................................................................................ 34
Impedance ................................................................................................................... 35
SAW filter...................................................................................................................... 35
Radio Frequency State
Activates input from the "RF Input" connector.
34User Manual 1178.3386.02 ─ 10
Page 35

R&S®FPL1000
Configuration
Receiving Data Input and Providing Data Output
Remote command:
INPut<ip>:SELect on page 115
Impedance
For some measurements, the reference impedance for the measured levels of the
R&S FPL1000 can be set to 50 Ω or 75 Ω.
Select 75 Ω if the 50 Ω input impedance is transformed to a higher impedance using a
75 Ω adapter of the RAZ type. (That corresponds to 25Ω in series to the input impedance of the instrument.) The correction value in this case is 1.76 dB = 10 log (75Ω/
50Ω).
This value also affects the unit conversion (see " Reference Level " on page 45).
This function is not available for input from the optional Digital Baseband Interface or
from the optional Analog Baseband Interface . For analog baseband input, an impedance of 50 Ω is always used.
Remote command:
INPut<ip>:IMPedance on page 115
SAW filter
The R&S FPL1000 hardware contains both a wide and a narrow IF path. Depending on
the used analysis bandwidth, the R&S FPL1000 determines which IF path to use automatically. The wide IF path allows for a smoother signal at the center frequency, while
the narrow IF path supresses possibly distorting signals further away from the center
frequency. Using this setting, you can affect which IF path is used.
"Auto"
"Off"
Remote command:
INPut<ip>:FILTer:SAW on page 114
The R&S FPL1000 determines which IF path to use automatically,
depending on the used analysis bandwidth.
The wide IF path is always used.
5.3.2 Settings for Input from I/Q Data Files
Access: "Overview" > "Input/Frontend" > "Input Source" > "I/Q File"
Or: [INPUT/OUTPUT] > "Input Source Config" > "Input Source" > "I/Q File"
35User Manual 1178.3386.02 ─ 10
Page 36

R&S®FPL1000
Configuration
Receiving Data Input and Providing Data Output
For details, see Chapter 4.3, "Basics on Input from I/Q Data Files", on page 26.
I/Q Input File State........................................................................................................ 36
Select I/Q data file ........................................................................................................36
I/Q Input File State
Enables input from the selected I/Q input file.
If enabled, the application performs measurements on the data from this file. Thus,
most measurement settings related to data acquisition (attenuation, center frequency,
measurement bandwidth, sample rate) cannot be changed. The measurement time
can only be decreased, to perform measurements on an extract of the available data
only.
Note: Even when the file input is disabled, the input file remains selected and can be
enabled again quickly by changing the state.
Remote command:
INPut<ip>:SELect on page 115
Select I/Q data file
Opens a file selection dialog box to select an input file that contains I/Q data.
The I/Q data must have a specific format (.iq.tar) as described in Chapter C, "I/Q
Data File Format (iq-tar)", on page 235.
The default storage location for I/Q data files is
C:\Users\Public\Documents\Rohde-Schwarz\Analyzer\user.
Remote command:
INPut<ip>:FILE:PATH on page 117
5.3.3 Power Sensors
The R&S FPL1000 can also analyze data from a connected power sensor.
The "Sensor" connector is provided by the "Additional Interfaces" option R&S FPL1B5. Additionally, the power sensor measurement requires the option R&S FPL1-K9.
● Basics on Power Sensors....................................................................................... 36
● Power Sensor Settings............................................................................................37
● How to Work With a Power Sensor.........................................................................41
5.3.3.1 Basics on Power Sensors
For precise power measurement, up to 4 power sensors can be connected to the
instrument via the optional power sensor interface (on the rear panel) or the USB connectors. Both manual operation and remote control are supported.
For a detailed list of supported sensors, see the data sheet.
36User Manual 1178.3386.02 ─ 10
Page 37

R&S®FPL1000
Configuration
Receiving Data Input and Providing Data Output
Signal
source
Figure 5-2: Power sensor support – standard test setup
Using the power sensor with several applications
The power sensor cannot be used from the R&S FPL1000 firmware and the R&S
Power Viewer Plus (virtual power meter for displaying results of the R&S NRP power
sensors) simultaneously.
Result display
The results of the power sensor measurements are displayed in the marker table. For
each power sensor, a row is inserted. The sensor index is indicated in the "Type" column.
5.3.3.2 Power Sensor Settings
Power
sensor
Signal
analyzer
Access: "Overview" > "Input" > "Power Sensor" tab
The power sensor measurement requires the option R&S FPL1-K9.
Each sensor is configured on a separate tab.
37User Manual 1178.3386.02 ─ 10
Page 38

R&S®FPL1000
Configuration
Receiving Data Input and Providing Data Output
State .............................................................................................................................38
Continuous Value Update ............................................................................................ 38
Select ........................................................................................................................... 38
Zeroing Power Sensor ................................................................................................. 39
Frequency Manual ....................................................................................................... 39
Frequency Coupling .....................................................................................................39
Unit/Scale .....................................................................................................................39
Meas Time/Average .....................................................................................................39
Setting the Reference Level from the Measurement Meas -> Ref ...............................40
Reference Value ...........................................................................................................40
Use Ref Level Offset ....................................................................................................40
Sensor Level Offset.......................................................................................................40
Average Count ( Number of Readings )........................................................................40
Duty Cycle ....................................................................................................................40
State
Switches the power measurement for all power sensors on or off. Note that in addition
to this general setting, each power sensor can be activated or deactivated individually
by the Select setting on each tab. However, the general setting overrides the individual
settings.
Remote command:
[SENSe:]PMETer<p>[:STATe] on page 124
Continuous Value Update
If activated, the power sensor data is updated continuously during a sweep with a long
sweep time, and even after a single sweep has completed.
This function cannot be activated for individual sensors.
Remote command:
[SENSe:]PMETer<p>:UPDate[:STATe] on page 125
Select
Selects the individual power sensor for usage if power measurement is generally activated ( State function).
The detected serial numbers of the power sensors connected to the instrument are
provided in a selection list. For each of the four available power sensor indexes
( "Power Sensor 1" ... "Power Sensor 4" ), which correspond to the tabs in the configuration dialog, one of the detected serial numbers can be assigned. The physical sensor
is thus assigned to the configuration setting for the selected power sensor index.
By default, serial numbers not yet assigned are automatically assigned to the next free
power sensor index for which "Auto Assignment" is selected.
Alternatively, you can assign the sensors manually by deactivating the "Auto" option
and selecting a serial number from the list.
Remote command:
[SENSe:]PMETer<p>[:STATe] on page 124
SYSTem:COMMunicate:RDEVice:PMETer<p>:DEFine on page 118
38User Manual 1178.3386.02 ─ 10
Page 39

R&S®FPL1000
Configuration
Receiving Data Input and Providing Data Output
SYSTem:COMMunicate:RDEVice:PMETer<p>:CONFigure:AUTO[:STATe]
on page 117
SYSTem:COMMunicate:RDEVice:PMETer<p>:COUNt? on page 118
Zeroing Power Sensor
Starts zeroing of the power sensor.
For details on the zeroing process refer to the R&S FPL1000 User Manual.
Remote command:
CALibration:PMETer<p>:ZERO:AUTO ONCE on page 119
Frequency Manual
Defines the frequency of the signal to be measured. The power sensor has a memory
with frequency-dependent correction factors. This allows extreme accuracy for signals
of a known frequency.
Remote command:
[SENSe:]PMETer<p>:FREQuency on page 122
Frequency Coupling
Selects the coupling option. The frequency can be coupled automatically to the center
frequency of the instrument or to the frequency of marker 1.
Remote command:
[SENSe:]PMETer<p>:FREQuency:LINK on page 122
Unit/Scale
Selects the unit with which the measured power is to be displayed. Available units are
dBm, dB, W and %.
If dB or % is selected, the display is relative to the reference value that is defined with
either the "Meas -> Ref" setting or the "Reference Value" setting.
Remote command:
UNIT<n>:PMETer<p>:POWer on page 125
UNIT<n>:PMETer<p>:POWer:RATio on page 125
Meas Time/Average
Selects the measurement time or switches to manual averaging mode. In general,
results are more precise with longer measurement times. The following settings are
recommended for different signal types to obtain stable and precise results:
"Short"
"Normal"
"Long"
"Manual"
Stationary signals with high power (> -40dBm), because they require
only a short measurement time and short measurement time provides
the highest repetition rates.
Signals with lower power or modulated signals
Signals at the lower end of the measurement range (<-50 dBm) or
Signals with lower power to minimize the influence of noise
Manual averaging mode. The average count is set with the Average
Count ( Number of Readings ) setting.
39User Manual 1178.3386.02 ─ 10
Page 40

R&S®FPL1000
Configuration
Receiving Data Input and Providing Data Output
Remote command:
[SENSe:]PMETer<p>:MTIMe on page 123
[SENSe:]PMETer<p>:MTIMe:AVERage[:STATe] on page 123
Setting the Reference Level from the Measurement Meas -> Ref
Sets the currently measured power as a reference value for the relative display. The
reference value can also be set manually via the Reference Value setting.
Remote command:
CALCulate<n>:PMETer<p>:RELative[:MAGNitude]:AUTO ONCE on page 120
Reference Value
Defines the reference value in dBm used for relative power meter measurements.
Remote command:
CALCulate<n>:PMETer<p>:RELative[:MAGNitude] on page 120
Use Ref Level Offset
If activated, takes the reference level offset defined for the analyzer into account for the
measured power (see " Shifting the Display ( Offset )" on page 45).
If deactivated, takes the Sensor Level Offset into account.
Remote command:
[SENSe:]PMETer<p>:ROFFset[:STATe] on page 124
Sensor Level Offset
Takes the specified offset into account for the measured power. Only available if Use
Ref Level Offset is disabled.
Remote command:
[SENSe:]PMETer<p>:SOFFset on page 124
Average Count ( Number of Readings )
Defines the number of readings (averages) to be performed after a single sweep has
been started. This setting is only available if manual averaging is selected ( Meas
Time/Average setting).
The values for the average count range from 0 to 256 in binary steps (1, 2, 4, 8, …).
For average count = 0 or 1, one reading is performed. The general averaging and
sweep count for the trace are independent from this setting.
Results become more stable with extended average, particularly if signals with low
power are measured. This setting can be used to minimize the influence of noise in the
power sensor measurement.
Remote command:
[SENSe:]PMETer<p>:MTIMe:AVERage:COUNt on page 123
Duty Cycle
Sets the duty cycle to a percent value for the correction of pulse-modulated signals and
activates the duty cycle correction. With the correction activated, the sensor calculates
the signal pulse power from this value and the mean power.
40User Manual 1178.3386.02 ─ 10
Page 41

R&S®FPL1000
5.3.3.3 How to Work With a Power Sensor
Configuration
Receiving Data Input and Providing Data Output
Remote command:
[SENSe:]PMETer<p>:DCYCle[:STATe] on page 121
[SENSe:]PMETer<p>:DCYCle:VALue on page 121
The following step-by-step instructions demonstrate how to set up a power sensor. For
details on individual functions and settings see Chapter 5.3.3.2, "Power Sensor Set-
tings", on page 37.
The remote commands required to perform these tasks are described in Chap-
ter 9.4.1.3, "Working with Power Sensors", on page 117.
How to Set Up a Power Sensor
Up to 4 external power sensors can be configured separately and used for precise
power measurement. All power sensors can be activated and deactivated individually.
The following procedure describes in detail how to configure and activate power sensors.
1. To display the "Power Sensor" tab of the "Input" dialog box, do one of the following:
● Select "Input" from the "Overview" .
● Select the [INPUT/OUTPUT] key and then the "Power Sensor Config" softkey.
2. Select the tab for the power sensor index you want to configure, e.g. "Power Sensor 1" .
3. Press "Select" to analyze the power sensor data according to the current configuration when power measurement is activated.
4. From the selection list with serial numbers of connected power sensors, select the
sensor you want to configure.
To have newly connected power sensors assigned to a tab automatically (default),
select "Auto" .
5. Define the frequency of the signal whose power you want to measure.
a) To define the frequency manually, select "Frequency Manual" and enter a fre-
quency.
b) To determine the frequency automatically, select "Frequency Coupling" and
then either "Center" , to use the center frequency, or "Marker" , to use the frequency defined by marker 1.
6. Select the unit for the power result display.
7. Select the measurement time for which the average is calculated, or define the
number of readings to average. To define the number of readings to be taken into
account manually, select "Manual" and enter the number in the "Number of Readings" field.
8. To activate the duty cycle correction, select "DutyCycle" and enter a percentage as
the correction value.
41User Manual 1178.3386.02 ─ 10
Page 42

R&S®FPL1000
Configuration
Receiving Data Input and Providing Data Output
9. If you selected "dB" or "%" as units (relative display), define a reference value:
a) To set the currently measured power as a reference value, press the "Meas ->
Ref" button.
b) Alternatively, enter a value manually in the "Reference Value" field.
c) Optionally, select the "Use Ref Level Offset" option to take the reference level
offset set for the analyzer into account for the measured power.
10. If necessary, repeat steps 3-10 for another power sensor.
11. Set the "Power Sensor State" at the top of the "Power Sensor" tab to "On" to activate power measurement for the selected power sensors.
The results of the power measurement are displayed in the marker table (Function:
"Sensor <1...4>" ).
How to Zero the Power Sensor
1. To display the "Power Sensor" tab of the "Input" dialog box, do one of the following:
● Select "Input" from the "Overview" .
● Select the [INPUT/OUTPUT] key and then the "Power Sensor Config" softkey.
2. Select the tab that is assigned to the power sensor you want to zero.
3. Press the "Zeroing Power Sensor" button.
A dialog box is displayed that prompts you to disconnect all signals from the input
of the power sensor.
4. Disconnect all signals sending input to the power sensor and press [ENTER] to
continue.
5. Wait until zeroing is complete.
A corresponding message is displayed.
5.3.4 Independent CW Source Settings
Access: Toolbar > "Generator Config"
The independent CW signal is available in all R&S FPL1000 applications if the optional
Internal Generator R&S FPL1-B9 is installed.
For details, see the R&S FPL1000 User Manual.
State..............................................................................................................................42
Level..............................................................................................................................43
Level Offset...................................................................................................................43
CW Frequency.............................................................................................................. 43
State
Enables or disables the internal generator. The generator signal is output at the GEN
Output 50 Ω connector on the front panel.
42User Manual 1178.3386.02 ─ 10
Page 43

R&S®FPL1000
Configuration
Receiving Data Input and Providing Data Output
Remote command:
OUTPut<up>[:STATe] on page 126
Level
Defines the output power of the internal generator.
The default output power is -20 dBm. The range is from -60 dBm to +10 dBm.
Remote command:
SOURce<si>:POWer[:LEVel][:IMMediate][:AMPLitude] on page 127
Level Offset
Defines an offset to the output power of the internal generator. Used to adapt the level
display, for example to cable loss.
Remote command:
SOURce<si>:POWer[:LEVel][:IMMediate]:OFFSet on page 127
CW Frequency
Defines the frequency of the internal generator signal as an independent CW source.
The step size depends on the measurement mode.
If the internal generator is used as a tracking generator, the frequency is coupled to the
frequency of the analyzer. Thus, this setting is not available.
Remote command:
SOURce<si>:INTernal:FREQuency on page 126
5.3.5 Output Settings
Access: "Overview" > "Output"
The R&S FPL1000 can provide signals to different output connectors.
These connectors are only available if the R&S FPL1-B5 option is installed.
For details on connectors, refer to the R&S FPL1000 Getting Started manual, "Front /
Rear Panel View" chapters.
Noise Source Control....................................................................................................44
43User Manual 1178.3386.02 ─ 10
Page 44

R&S®FPL1000
Configuration
Amplitude
Noise Source Control
The R&S FPL1000 provides a connector ("NOISE SOURCE CONTROL") with a 28 V
voltage supply for an external noise source. By switching the supply voltage for an
external noise source on or off in the firmware, you can enable or disable the device as
required.
This connector is only available if the R&S FPL1-B5 option is installed.
External noise sources are useful when you are measuring power levels that fall below
the noise floor of the R&S FPL1000 itself, for example when measuring the noise level
of an amplifier.
In this case, you can first connect an external noise source (whose noise power level is
known in advance) to the R&S FPL1000 and measure the total noise power. From this
value you can determine the noise power of the R&S FPL1000. Then when you measure the power level of the actual DUT, you can deduct the known noise level from the
total power to obtain the power level of the DUT.
Remote command:
DIAGnostic:SERVice:NSOurce on page 128
5.4 Amplitude
Access: "Overview" > "Amplitude"
Amplitude settings are identical to the Spectrum application, except for a new scaling
function for I/Q Vector and Real/Imag results (see " Y-Axis Max " on page 49).
For background information on amplitude settings see the R&S FPL1000 User Manual.
The "Auto Settings" are described in Chapter 5.9, "Adjusting Settings Automatically",
on page 61.
5.4.1 Amplitude Settings
Access: "Overview" > "Amplitude"
Amplitude settings determine how the R&S FPL1000 must process or display the
expected input power levels.
44User Manual 1178.3386.02 ─ 10
Page 45

R&S®FPL1000
Configuration
Amplitude
Reference Level ...........................................................................................................45
└ Shifting the Display ( Offset ).......................................................................... 45
└ Unit .................................................................................................................46
└ Setting the Reference Level Automatically ( Auto Level )...............................46
Attenuation Mode / Value ............................................................................................. 47
Impedance ................................................................................................................... 47
Preamplifier ..................................................................................................................47
Reference Level
Defines the expected maximum input signal level. Signal levels above this value may
not be measured correctly, which is indicated by the "IF Overload" status display
( "OVLD" for analog baseband or digital baseband input).
Defines the expected maximum reference level. Signal levels above this value may not
be measured correctly. This is indicated by an "IF Overload" status display.
The reference level can also be used to scale power diagrams; the reference level is
then used as the maximum on the y-axis.
Since the hardware of the R&S FPL1000 is adapted according to this value, it is recommended that you set the reference level close above the expected maximum signal
level. Thus you ensure an optimum measurement (no compression, good signal-tonoise ratio).
Remote command:
DISPlay[:WINDow<n>]:TRACe<t>:Y[:SCALe]:RLEVel on page 131
Shifting the Display ( Offset ) ← Reference Level
Defines an arithmetic level offset. This offset is added to the measured level. In some
result displays, the scaling of the y-axis is changed accordingly.
45User Manual 1178.3386.02 ─ 10
Page 46

R&S®FPL1000
Configuration
Amplitude
Define an offset if the signal is attenuated or amplified before it is fed into the
R&S FPL1000 so the application shows correct power results. All displayed power
level results are shifted by this value.
The setting range is ±200 dB in 0.01 dB steps.
Note, however, that the internal reference level (used to adjust the hardware settings to
the expected signal) ignores any "Reference Level Offset" . Thus, it is important to
keep in mind the actual power level the R&S FPL1000 must handle. Do not rely on the
displayed reference level (internal reference level = displayed reference level - offset).
Remote command:
DISPlay[:WINDow<n>]:TRACe<t>:Y[:SCALe]:RLEVel:OFFSet on page 132
Unit ← Reference Level
The R&S FPL1000 measures the signal voltage at the RF input.
In the default state, the level is displayed at a power level of 1 mW (= dBm). Via the
known input impedance (50 Ω or 75 Ω, see " Impedance " on page 35), conversion to
other units is possible.
The following units are available and directly convertible:
●
dBm
●
dBmV
●
dBμV
●
dBμA
●
dBpW
●
Volt
●
Ampere
●
Watt
Remote command:
INPut<ip>:IMPedance on page 115
CALCulate<n>:UNIT:POWer on page 131
Setting the Reference Level Automatically ( Auto Level ) ← Reference Level
Automatically determines a reference level which ensures that no overload occurs at
the R&S FPL1000 for the current input data. At the same time, the internal attenuators
are adjusted so the signal-to-noise ratio is optimized, while signal compression and
clipping are minimized.
To determine the required reference level, a level measurement is performed on the
R&S FPL1000.
If necessary, you can optimize the reference level further. Decrease the attenuation
level manually to the lowest possible value before an overload occurs, then decrease
the reference level in the same way.
You can change the measurement time for the level measurement if necessary (see "
Changing the Automatic Measurement Time ( Meastime Manual )" on page 63).
Remote command:
[SENSe:]ADJust:LEVel on page 154
46User Manual 1178.3386.02 ─ 10
Page 47

R&S®FPL1000
Configuration
Amplitude
Attenuation Mode / Value
The RF attenuation can be set automatically as a function of the selected reference
level (Auto mode). This ensures that no overload occurs at the RF Input connector for
the current reference level. It is the default setting.
In "Manual" mode, you can set the RF attenuation in 5 dB steps down to 0 dB (with
option R&S FPL1-B22: in 1 dB steps). Other entries are rounded to the next integer
value. The range is specified in the data sheet. If the defined reference level cannot be
set for the defined RF attenuation, the reference level is adjusted accordingly and the
warning "limit reached" is displayed.
NOTICE! Risk of hardware damage due to high power levels. When decreasing the
attenuation manually, ensure that the power level does not exceed the maximum level
allowed at the RF input, as an overload may lead to hardware damage.
Remote command:
INPut<ip>:ATTenuation on page 132
INPut<ip>:ATTenuation:AUTO on page 133
Impedance
For some measurements, the reference impedance for the measured levels of the
R&S FPL1000 can be set to 50 Ω or 75 Ω.
Select 75 Ω if the 50 Ω input impedance is transformed to a higher impedance using a
75 Ω adapter of the RAZ type. (That corresponds to 25Ω in series to the input impedance of the instrument.) The correction value in this case is 1.76 dB = 10 log (75Ω/
50Ω).
This value also affects the unit conversion (see " Reference Level " on page 45).
This function is not available for input from the optional Digital Baseband Interface or
from the optional Analog Baseband Interface . For analog baseband input, an impedance of 50 Ω is always used.
Remote command:
INPut<ip>:IMPedance on page 115
Preamplifier
If the (optional) internal preamplifier hardware is installed, a preamplifier can be activated for the RF input signal.
You can use a preamplifier to analyze signals from DUTs with low output power.
Note that if an optional external preamplifier is activated, the internal preamplifier is
automatically disabled, and vice versa.
The input signal is amplified by 20 dB if the preamplifier option is activated.
Remote command:
INPut<ip>:GAIN:STATe on page 133
5.4.2 Scaling the Y-Axis
The individual scaling settings that affect the vertical axis are described here.
Access: "Overview" > "Amplitude" > "Scale" tab
47User Manual 1178.3386.02 ─ 10
Page 48

R&S®FPL1000
Configuration
Amplitude
Or: [AMPT] > "Scale Config"
Range ...........................................................................................................................48
Ref Level Position ........................................................................................................ 48
Scaling ......................................................................................................................... 49
Y-Axis Max ................................................................................................................... 49
Range
Defines the displayed y-axis range in dB.
The default value is 100 dB.
Remote command:
DISPlay[:WINDow<n>]:TRACe<t>:Y[:SCALe] on page 134
Ref Level Position
Defines the reference level position, i.e. the position of the maximum AD converter
value on the level axis in %.
0 % corresponds to the lower and 100 % to the upper limit of the diagram.
Values from -120 % to +600 % are available. Larger values are useful for small scales,
such as a power range of 10 dB or 20 dB, and low signal levels, for example 60 dB
below the reference level. In this case, large reference level position values allow you
to see the trace again.
Remote command:
DISPlay[:WINDow<n>]:TRACe<t>:Y[:SCALe]:RPOSition on page 135
48User Manual 1178.3386.02 ─ 10
Page 49

R&S®FPL1000
Configuration
Frequency Settings
Scaling
Defines the scaling method for the y-axis.
"Logarithmic"
"Linear with
Unit"
"Linear Percent"
"Absolute"
"Relative"
Remote command:
DISPlay[:WINDow<n>][:SUBWindow<w>]:TRACe<t>:Y:SPACing on page 135
DISPlay[:WINDow<n>][:SUBWindow<w>]:TRACe<t>:Y[:SCALe]:MODE
on page 134
Logarithmic scaling (only available for logarithmic units - dB..., and A,
V, Watt)
Linear scaling in the unit of the measured signal
Linear scaling in percentages from 0 to 100
The labeling of the level lines refers to the absolute value of the reference level (not available for "Linear Percent" )
The scaling is in dB, relative to the reference level (only available for
logarithmic units - dB...). The upper line of the grid (reference level) is
always at 0 dB.
Y-Axis Max
Defines the maximum value of the y-axis in the currently selected diagram in either
direction (in Volts). Thus, the y-axis scale starts at -<Y-Axis Max> and ends at +<Y-Axis
Max>.
The maximum y-axis value depends on the current reference level. If the reference
level is changed, the "Y-Axis Max" value is automatically set to the new reference level
(in V).
This command is only available if the evaluation mode for the I/Q Analyzer is set to
"I/Q-Vector" or "Real/Imag (I/Q)" .
Remote command:
DISPlay[:WINDow<n>]:TRACe<t>:Y[:SCALe] on page 134
5.5 Frequency Settings
Access: "Overview" > "Frequency"
49User Manual 1178.3386.02 ─ 10
Page 50

R&S®FPL1000
Configuration
Frequency Settings
Center Frequency ........................................................................................................ 50
Center Frequency Stepsize ..........................................................................................50
Frequency Offset ..........................................................................................................50
Center Frequency
Defines the center frequency of the signal in Hertz.
The allowed range of values for the center frequency depends on the frequency span.
span > 0: span
f
and span
max
/2 ≤ f
min
depend on the instrument and are specified in the data sheet.
min
center
≤ f
– span
max
min
/2
Remote command:
[SENSe:]FREQuency:CENTer on page 136
Center Frequency Stepsize
Defines the step size by which the center frequency is increased or decreased using
the arrow keys.
The step size can be coupled to another value or it can be manually set to a fixed
value.
"= Center"
Sets the step size to the value of the center frequency. The used
value is indicated in the "Value" field.
"Manual"
Defines a fixed step size for the center frequency. Enter the step size
in the "Value" field.
Remote command:
[SENSe:]FREQuency:CENTer:STEP on page 137
Frequency Offset
Shifts the displayed frequency range along the x-axis by the defined offset.
This parameter has no effect on the instrument's hardware, or on the captured data or
on data processing. It is simply a manipulation of the final results in which absolute frequency values are displayed. Thus, the x-axis of a spectrum display is shifted by a
constant offset if it shows absolute frequencies. However, if it shows frequencies relative to the signal's center frequency, it is not shifted.
50User Manual 1178.3386.02 ─ 10
Page 51

R&S®FPL1000
5.6 Trigger Settings
Configuration
Trigger Settings
A frequency offset can be used to correct the display of a signal that is slightly distorted
by the measurement setup, for example.
The allowed values range from -1 THz to 1 THz. The default setting is 0 Hz.
Remote command:
[SENSe:]FREQuency:OFFSet on page 137
Access: "Overview" > "Trigger" ( > "Trigger In/Out" )
Trigger settings determine when the input signal is measured.
Conventional gating as in the Spectrum application is not available for the I/Q Analyzer; however, a special gating mode is available in remote control, see Chap-
ter 9.4.4.2, "Configuring I/Q Gating", on page 142.
For step-by-step instructions on configuring triggered measurements, see the
R&S FPL1000 User Manual.
Trigger Source ..............................................................................................................52
└ Trigger Source ............................................................................................... 52
└ Free Run ..............................................................................................52
└ External Trigger 1 ................................................................................ 52
└ IF Power .............................................................................................. 52
└ I/Q Power .............................................................................................52
└ Time .....................................................................................................53
└ Trigger Level ..................................................................................................53
└ Repetition Interval ..........................................................................................53
└ Drop-Out Time ............................................................................................... 53
└ Trigger Offset .................................................................................................53
└ Hysteresis ...................................................................................................... 53
└ Trigger Holdoff ............................................................................................... 54
└ Slope ..............................................................................................................54
51User Manual 1178.3386.02 ─ 10
Page 52

R&S®FPL1000
Configuration
Trigger Settings
Trigger Source
The trigger settings define the beginning of a measurement.
Trigger Source ← Trigger Source
Selects the trigger source. If a trigger source other than "Free Run" is set, "TRG" is displayed in the channel bar and the trigger source is indicated.
Remote command:
TRIGger[:SEQuence]:SOURce on page 141
Free Run ← Trigger Source ← Trigger Source
No trigger source is considered. Data acquisition is started manually or automatically
and continues until stopped explicitly.
Remote command:
TRIG:SOUR IMM, see TRIGger[:SEQuence]:SOURce on page 141
External Trigger 1 ← Trigger Source ← Trigger Source
Data acquisition starts when the TTL signal fed into the trigger input connector of the
R&S FPL1000 meets or exceeds the specified trigger level.
(See " Trigger Level " on page 53).
Remote command:
TRIG:SOUR EXT
See TRIGger[:SEQuence]:SOURce on page 141
IF Power ← Trigger Source ← Trigger Source
The R&S FPL1000 starts capturing data as soon as the trigger level is exceeded
around the third intermediate frequency.
For frequency sweeps, the third IF represents the start frequency. The trigger bandwidth at the third IF depends on the RBW and sweep type.
For measurements on a fixed frequency (e.g. zero span or I/Q measurements), the
third IF represents the center frequency.
This trigger source is only available for RF input.
For details on available trigger levels and trigger bandwidths, see the data sheet.
Remote command:
TRIG:SOUR IFP, see TRIGger[:SEQuence]:SOURce on page 141
I/Q Power ← Trigger Source ← Trigger Source
This trigger source is only available in the I/Q Analyzer application and in applications
that process I/Q data.
Triggers the measurement when the magnitude of the sampled I/Q data exceeds the
trigger threshold.
The trigger bandwidth corresponds to the bandwidth setting for I/Q data acquisition.
(See " Analysis Bandwidth " on page 55).
Remote command:
TRIG:SOUR IQP, see TRIGger[:SEQuence]:SOURce on page 141
52User Manual 1178.3386.02 ─ 10
Page 53

R&S®FPL1000
Configuration
Trigger Settings
Time ← Trigger Source ← Trigger Source
Triggers in a specified " Repetition Interval " on page 53.
Remote command:
TRIG:SOUR TIME, see TRIGger[:SEQuence]:SOURce on page 141
Trigger Level ← Trigger Source
Defines the trigger level for the specified trigger source.
For details on supported trigger levels, see the data sheet.
Remote command:
TRIGger[:SEQuence]:LEVel:IFPower on page 140
TRIGger[:SEQuence]:LEVel:IQPower on page 140
TRIGger[:SEQuence]:LEVel[:EXTernal<port>] on page 140
Repetition Interval ← Trigger Source
Defines the repetition interval for a time trigger. The shortest interval is 2 ns.
The repetition interval should be set to the exact pulse period, burst length, frame
length or other repetitive signal characteristic.
Remote command:
TRIGger[:SEQuence]:TIME:RINTerval on page 142
Drop-Out Time ← Trigger Source
Defines the time the input signal must stay below the trigger level before triggering
again.
Remote command:
TRIGger[:SEQuence]:DTIMe on page 138
Trigger Offset ← Trigger Source
Defines the time offset between the trigger event and the start of the sweep.
Offset > 0: Start of the sweep is delayed
Offset < 0: Sweep starts earlier (pretrigger)
Only possible for zero span (e.g. I/Q Analyzer application) and gated trigger switched off
Maximum allowed range limited by the sweep time:
Pretrigger
= sweep time
max
max
Tip: To determine the trigger point in the sample (for "External" or "IF Power" trigger
source), use the TRACe:IQ:TPISample? command.
For the "Time" trigger source, this function is not available.
Remote command:
TRIGger[:SEQuence]:HOLDoff[:TIME] on page 138
Hysteresis ← Trigger Source
Defines the distance in dB to the trigger level that the trigger source must exceed
before a trigger event occurs. Setting a hysteresis avoids unwanted trigger events
caused by noise oscillation around the trigger level.
53User Manual 1178.3386.02 ─ 10
Page 54

R&S®FPL1000
Configuration
Data Acquisition and Bandwidth Settings
This setting is only available for "IF Power" trigger sources. The range of the value is
between 3 dB and 50 dB with a step width of 1 dB.
Remote command:
TRIGger[:SEQuence]:IFPower:HYSTeresis on page 139
Trigger Holdoff ← Trigger Source
Defines the minimum time (in seconds) that must pass between two trigger events.
Trigger events that occur during the holdoff time are ignored.
Remote command:
TRIGger[:SEQuence]:IFPower:HOLDoff on page 139
Slope ← Trigger Source
For all trigger sources except time, you can define whether triggering occurs when the
signal rises to the trigger level or falls down to it.
For gated measurements in "Edge" mode, the slope also defines whether the gate
starts on a falling or rising edge.
Remote command:
TRIGger[:SEQuence]:SLOPe on page 141
5.7 Data Acquisition and Bandwidth Settings
Access: "Overview" > "Bandwidth"
● Data Acquisition...................................................................................................... 54
● Sweep Settings....................................................................................................... 58
5.7.1 Data Acquisition
Access: "Overview" > "Bandwidth" > "Data Acquisition" tab
The data acquisition settings define which parts of the input signal are captured for further evaluation in the applications.
54User Manual 1178.3386.02 ─ 10
Page 55

R&S®FPL1000
Configuration
Data Acquisition and Bandwidth Settings
Figure 5-3: Data acquisition settings with advanced FFT parameters
Sample Rate ................................................................................................................ 55
Analysis Bandwidth ......................................................................................................55
Meas Time ....................................................................................................................56
Record Length ..............................................................................................................56
Swap I/Q ...................................................................................................................... 56
RBW .............................................................................................................................56
Advanced FFT mode / Basic Settings ..........................................................................57
└ Transformation Algorithm ...............................................................................57
└ FFT Length .................................................................................................... 57
└ Window Function ........................................................................................... 57
└ Window Overlap .............................................................................................58
└ Window Length .............................................................................................. 58
Sample Rate
Defines the I/Q data sample rate of the R&S FPL1000. This value depends on the
defined Analysis Bandwidth .
Up to the maximum bandwidth (12.8 MHz without extension options), the following rule
applies:
sample rate = analysis bandwidth / 0.8
Remote command:
TRACe:IQ:SRATe on page 150
Analysis Bandwidth
Defines the flat, usable bandwidth of the final I/Q data. This value depends on the
defined Sample Rate .
55User Manual 1178.3386.02 ─ 10
Page 56

R&S®FPL1000
Configuration
Data Acquisition and Bandwidth Settings
Up to the maximum bandwidth (12.8 MHz without extension options), the following rule
applies:
analysis bandwidth = 0.8 * sample rate
Remote command:
TRACe:IQ:BWIDth on page 148
Meas Time
Defines the I/Q acquisition time. By default, the measurement time is calculated as the
number of I/Q samples ( "Record Length" ) divided by the sample rate. If you change
the measurement time, the Record Length is automatically changed, as well.
Remote command:
[SENSe:]SWEep:TIME on page 167
Record Length
Defines the number of I/Q samples to record. By default, the number of sweep points is
used. The record length is calculated as the measurement time multiplied by the sample rate. If you change the record length, the Meas Time is automatically changed, as
well.
Note: For the I/Q vector result display, the number of I/Q samples to record ( "Record
Length" ) must be identical to the number of trace points to be displayed ("Sweep
Points"). Thus, the sweep points are not editable for this result display. If the "Record
Length" is edited, the sweep points are adapted automatically.
Remote command:
TRACe:IQ:RLENgth on page 148
TRACe:IQ:SET on page 149
Swap I/Q
Activates or deactivates the inverted I/Q modulation. If the I and Q parts of the signal
from the DUT are interchanged, the R&S FPL1000 can do the same to compensate for
it.
On I and Q signals are interchanged
Inverted sideband, Q+j*I
Off I and Q signals are not interchanged
Normal sideband, I+j*Q
Remote command:
[SENSe:]SWAPiq on page 148
RBW
Defines the resolution bandwidth for Spectrum results. The available RBW values
depend on the sample rate and record length.
(See Chapter 4.2.4, "Frequency Resolution of FFT Results - RBW", on page 24).
Depending on the selected RBW mode, the value is either determined automatically or
can be defined manually. As soon as you enter a value in the input field, the RBW
mode is changed to "Manual" .
56User Manual 1178.3386.02 ─ 10
Page 57

R&S®FPL1000
Configuration
Data Acquisition and Bandwidth Settings
If the "Advanced Fourier Transformation Params" option is enabled, advanced FFT
mode is selected and the RBW cannot be defined directly.
Note that the RBW is correlated with the Sample Rate and Record Length (and possibly the Window Function and Window Length ). Changing any one of these parameters
may cause a change to one or more of the other parameters. For more information see
Chapter 4.2, "Basics on FFT", on page 20.
"Auto mode"
"Manual mode"
"Advanced
FFT mode"
Remote command:
[SENSe:]IQ:BWIDth:MODE on page 145
[SENSe:]IQ:BWIDth:RESolution on page 146
(Default) The RBW is determined automatically depending on the
Sample Rate and Record Length .
The RBW can be defined by the user.
The user-defined RBW is used and the Window Length (and possibly
Sample Rate ) are adapted accordingly.
This mode is used if the "Advanced Fourier Transformation Params"
option is enabled.
The RBW is determined by the advanced FFT parameters.
Advanced FFT mode / Basic Settings
Shows or hides the "Advanced Fourier Transformation" parameters in the "Data Acquisition" dialog box.
Note that if the advanced FFT mode is used, the RBW settings are not available.
Transformation Algorithm ← Advanced FFT mode / Basic Settings
Defines the FFT calculation method.
"Single"
"Averaging"
Remote command:
[SENSe:]IQ:FFT:ALGorithm on page 146
FFT Length ← Advanced FFT mode / Basic Settings
Defines the number of frequency points determined by each FFT calculation. The more
points are used, the higher the resolution in the spectrum becomes, but the longer the
calculation takes.
Note: If you enter the value manually, any integer value from 3 to 524288 is available.
Remote command:
[SENSe:]IQ:FFT:LENGth on page 147
One FFT is calculated for the entire record length; if the FFT Length
is larger than the record length, zeros are appended to the captured
data.
Several overlapping FFTs are calculated for each record; the results
are combined to determine the final FFT result for the record. The
number of FFTs to be averaged is determined by the Window Overlap
and the Window Length .
Window Function ← Advanced FFT mode / Basic Settings
In the I/Q analyzer you can select one of several FFT window types.
57User Manual 1178.3386.02 ─ 10
Page 58

R&S®FPL1000
Configuration
Data Acquisition and Bandwidth Settings
The following window types are available:
●
Blackman-Harris
●
Flattop
●
Gauss
●
Rectangular
●
5-Term
Remote command:
[SENSe:]IQ:FFT:WINDow:TYPE on page 147
Window Overlap ← Advanced FFT mode / Basic Settings
Defines the part of a single FFT window that is re-calculated by the next FFT calculation when using multiple FFT windows.
Remote command:
[SENSe:]IQ:FFT:WINDow:OVERlap on page 147
Window Length ← Advanced FFT mode / Basic Settings
Defines the number of samples to be included in a single FFT window in averaging
mode. (In single mode, the window length corresponds to the " Record Length "
on page 56.)
However, the window length may not be longer than the FFT Length .
Remote command:
[SENSe:]IQ:FFT:WINDow:LENGth on page 147
5.7.2 Sweep Settings
Access: "Overview" > "Bandwidth" > "Sweep" tab
Sweep Points................................................................................................................ 59
Sweep/Average Count ................................................................................................. 59
Continuous Sweep / Run Cont .....................................................................................59
Single Sweep / Run Single ...........................................................................................60
Continue Single Sweep ................................................................................................60
58User Manual 1178.3386.02 ─ 10
Page 59

R&S®FPL1000
Configuration
Data Acquisition and Bandwidth Settings
Sweep Points
In the I/Q Analyzer application, a specific frequency bandwidth is swept for a specified
measurement time. During this time, a defined number of samples (= "Record
Length" ) are captured. These samples are then evaluated by the applications. Therefore, in this case the number of sweep points does not define the amount of data to be
acquired, but rather the number of trace points that are evaluated and displayed in the
result diagrams.
Note: For some result displays, the sweep points may not be editable as they are
determined automatically, or restrictions may apply. For the I/Q vector result display,
the number of I/Q samples to record ( "Record Length" ) must be identical to the number of trace points to be displayed ("Sweep Points"). Thus, the sweep points are not
editable for this result display. If the "Record Length" is edited, the sweep points are
adapted automatically. For record lengths outside the valid range of sweep points, i.e.
less than 101 points or more than 100001 points, the diagram does not show valid
results.
Using fewer than 4096 sweep points with a detector other than "Auto Peak" may lead
to wrong level results. For details see "Combining results - trace detector" on page 22.
Remote command:
[SENSe:]SWEep[:WINDow<n>]:POINts on page 166
Sweep/Average Count
Defines the number of sweeps to be performed in the single sweep mode. Values from
0 to 200000 are allowed. If the values 0 or 1 are set, one sweep is performed.
The sweep count is applied to all the traces in all diagrams.
If the trace modes "Average" , "Max Hold" or "Min Hold" are set, this value also deter-
mines the number of averaging or maximum search procedures.
In continuous sweep mode, if "Sweep Count" = 0 (default), averaging is performed
over 10 sweeps. For "Sweep Count" =1, no averaging, maxhold or minhold operations
are performed.
Remote command:
[SENSe:]SWEep:COUNt on page 166
[SENSe:]AVERage<n>:COUNt on page 173
Continuous Sweep / Run Cont
After triggering, starts the sweep and repeats it continuously until stopped. This is the
default setting.
After triggering, starts the measurement and repeats it continuously until stopped.
While the measurement is running, the "Continuous Sweep" softkey and the [RUN
CONT] key are highlighted. The running measurement can be aborted by selecting the
highlighted softkey or key again. The results are not deleted until a new measurement
is started.
Note: Sequencer. If the Sequencer is active, the "Continuous Sweep" softkey only controls the sweep mode for the currently selected channel setup. However, the sweep
mode only takes effect the next time the Sequencer activates that channel setup, and
only for a channel-defined sequence. In this case, a channel setup in continuous
sweep mode is swept repeatedly.
59User Manual 1178.3386.02 ─ 10
Page 60

R&S®FPL1000
Configuration
Display Configuration
Furthermore, the [RUN CONT] key controls the Sequencer, not individual sweeps.
[RUN CONT] starts the Sequencer in continuous mode.
Remote command:
INITiate<n>:CONTinuous on page 163
Single Sweep / Run Single
After triggering, starts the number of sweeps set in "Sweep Count". The measurement
stops after the defined number of sweeps has been performed.
While the measurement is running, the "Single Sweep" softkey and the [RUN SINGLE]
key are highlighted. The running measurement can be aborted by selecting the highlighted softkey or key again.
Note: Sequencer. If the Sequencer is active, the "Single Sweep" softkey only controls
the sweep mode for the currently selected channel setup. However, the sweep mode
only takes effect the next time the Sequencer activates that channel setup, and only for
a channel-defined sequence. In this case, the Sequencer sweeps a channel setup in
single sweep mode only once.
Furthermore, the [RUN SINGLE] key controls the Sequencer, not individual sweeps.
[RUN SINGLE] starts the Sequencer in single mode.
If the Sequencer is off, only the evaluation for the currently displayed channel setup is
updated.
For details on the Sequencer, see the R&S FPL1000 User Manual.
Remote command:
INITiate<n>[:IMMediate] on page 164
Continue Single Sweep
After triggering, repeats the number of sweeps set in "Sweep Count", without deleting
the trace of the last measurement.
While the measurement is running, the "Continue Single Sweep" softkey and the [RUN
SINGLE] key are highlighted. The running measurement can be aborted by selecting
the highlighted softkey or key again.
Remote command:
INITiate<n>:CONMeas on page 163
5.8 Display Configuration
Access: "Overview" > "Display Config"
The captured signal can be displayed using various evaluation methods. All evaluation
methods available for the current application are displayed in the evaluation bar in
SmartGrid mode.
For a description of the available evaluation methods see Chapter 3, "Measurement
and Result Displays", on page 13.
60User Manual 1178.3386.02 ─ 10
Page 61

R&S®FPL1000
5.9 Adjusting Settings Automatically
Configuration
Adjusting Settings Automatically
Up to 6 evaluations can be displayed in the I/Q Analyzer at any time, including several
graphical diagrams, marker tables or peak lists.
The selected evaluation method not only affects the result display in a window, but also
the results of the trace data query in remote control (see TRACe<n>[:DATA]?
on page 221).
Access: "Overview" > "Amplitude" / "Frequency" > "Auto Settings"
Some settings can be adjusted by the R&S FPL1000 automatically according to the
current measurement settings. In order to do so, a measurement is performed. You can
configure this measurement.
Adjusting settings automatically during triggered measurements
When you select an auto adjust function, a measurement is performed to determine
the optimal settings. If you select an auto adjust function for a triggered measurement,
you are asked how the R&S FPL1000 should behave:
●
(default:) The measurement for adjustment waits for the next trigger
●
The measurement for adjustment is performed without waiting for a trigger.
The trigger source is temporarily set to "Free Run" . After the measurement is completed, the original trigger source is restored. The trigger level is adjusted as follows:
– For IF Power and RF Power triggers:
Trigger Level = Reference Level - 15 dB
– For Video trigger:
Trigger Level = 85 %
Remote command:
[SENSe:]ADJust:CONFigure:TRIGger on page 153
61User Manual 1178.3386.02 ─ 10
Page 62

R&S®FPL1000
Configuration
Adjusting Settings Automatically
Adjusting all Determinable Settings Automatically ( Auto All )...................................... 62
Adjusting the Center Frequency Automatically ( Auto Frequency ).............................. 62
Setting the Reference Level Automatically ( Auto Level ).............................................62
Resetting the Automatic Measurement Time ( Meastime Auto )...................................62
Changing the Automatic Measurement Time ( Meastime Manual ).............................. 63
Upper Level Hysteresis ................................................................................................63
Lower Level Hysteresis ................................................................................................63
Adjusting all Determinable Settings Automatically ( Auto All )
Activates all automatic adjustment functions for the current measurement settings.
This includes:
●
Auto Frequency
●
Auto Level
Remote command:
[SENSe:]ADJust:ALL on page 151
Adjusting the Center Frequency Automatically ( Auto Frequency )
The R&S FPL1000 adjusts the center frequency automatically.
The optimum center frequency is the frequency with the highest S/N ratio in the fre-
quency span. As this function uses the signal counter, it is intended for use with sinusoidal signals.
To set the optimal reference level, see " Setting the Reference Level Automatically
( Auto Level )" on page 46).
Remote command:
[SENSe:]ADJust:FREQuency on page 153
Setting the Reference Level Automatically ( Auto Level )
Automatically determines a reference level which ensures that no overload occurs at
the R&S FPL1000 for the current input data. At the same time, the internal attenuators
are adjusted so the signal-to-noise ratio is optimized, while signal compression and
clipping are minimized.
To determine the required reference level, a level measurement is performed on the
R&S FPL1000.
If necessary, you can optimize the reference level further. Decrease the attenuation
level manually to the lowest possible value before an overload occurs, then decrease
the reference level in the same way.
You can change the measurement time for the level measurement if necessary (see "
Changing the Automatic Measurement Time ( Meastime Manual )" on page 63).
Remote command:
[SENSe:]ADJust:LEVel on page 154
Resetting the Automatic Measurement Time ( Meastime Auto )
Resets the measurement duration for automatic settings to the default value.
Remote command:
[SENSe:]ADJust:CONFigure:LEVel:DURation:MODE on page 152
62User Manual 1178.3386.02 ─ 10
Page 63

R&S®FPL1000
Configuration
Adjusting Settings Automatically
Changing the Automatic Measurement Time ( Meastime Manual )
This function allows you to change the measurement duration for automatic setting
adjustments. Enter the value in seconds.
Note: The maximum possible measurement duration depends on the currently
selected measurement and the installed (optional) hardware. Thus, the measurement
duration actually used to determine the automatic settings may be shorter than the
value you define here.
Remote command:
[SENSe:]ADJust:CONFigure:LEVel:DURation:MODE on page 152
[SENSe:]ADJust:CONFigure:LEVel:DURation on page 151
Upper Level Hysteresis
When the reference level is adjusted automatically using the Auto Level function, the
internal attenuators and the preamplifier are also adjusted. To avoid frequent adaptation due to small changes in the input signal, you can define a hysteresis. This setting
defines an upper threshold the signal must exceed (compared to the last measurement) before the reference level is adapted automatically.
Remote command:
[SENSe:]ADJust:CONFigure:HYSTeresis:UPPer on page 153
Lower Level Hysteresis
When the reference level is adjusted automatically using the Auto Level function, the
internal attenuators and the preamplifier are also adjusted. To avoid frequent adaptation due to small changes in the input signal, you can define a hysteresis. This setting
defines a lower threshold the signal must fall below (compared to the last measurement) before the reference level is adapted automatically.
Remote command:
[SENSe:]ADJust:CONFigure:HYSTeresis:LOWer on page 152
63User Manual 1178.3386.02 ─ 10
Page 64

R&S®FPL1000
6 Analysis
6.1 Trace Settings
Analysis
Trace Settings
Access: "Overview" > "Analysis"
General result analysis settings concerning the trace, markers etc. are identical to the
analysis functions in the Spectrum application, except for the lines and special marker
functions, which are not available for I/Q data.
The remote commands required to perform these tasks are described in Chapter 6,
"Analysis", on page 64.
● Trace Settings.........................................................................................................64
● Spectrogram Settings..............................................................................................68
● Trace / Data Export Configuration...........................................................................73
● Marker Usage..........................................................................................................76
Access: "Overview" > "Analysis" > "Traces"
Or: [TRACE] > "Trace Config"
You can configure the settings for up to 6 individual traces.
Trace data can also be exported to an ASCII file for further analysis. For details see
Chapter 6.3, "Trace / Data Export Configuration", on page 73.
For I/Q Vector evaluation mode, only 1 trace is available and the detector is not editable.
64User Manual 1178.3386.02 ─ 10
Page 65

R&S®FPL1000
Analysis
Trace Settings
Trace 1 / Trace 2 / Trace 3 / Trace 4 / Trace 5 / Trace 6 ..............................................65
Trace Mode ..................................................................................................................65
Detector ........................................................................................................................66
Hold ..............................................................................................................................66
Smoothing ....................................................................................................................66
Average Mode ..............................................................................................................67
Predefined Trace Settings - Quick Config ....................................................................67
Trace 1 / Trace 2 / Trace 3 / Trace 4 (Softkeys)............................................................68
Copy Trace ...................................................................................................................68
Trace 1 / Trace 2 / Trace 3 / Trace 4 / Trace 5 / Trace 6
Selects the corresponding trace for configuration. The currently selected trace is highlighted.
Remote command:
Selected via numeric suffix of:TRACe<1...6> commands
DISPlay[:WINDow<n>][:SUBWindow<w>]:TRACe<t>[:STATe] on page 170
Trace Mode
Defines the update mode for subsequent traces.
"Clear/ Write"
"Max Hold"
"Min Hold"
Overwrite mode (default): the trace is overwritten by each sweep.
The maximum value is determined over several sweeps and dis-
played. The R&S FPL1000 saves each trace point in the trace memory only if the new value is greater than the previous one.
The minimum value is determined from several measurements and
displayed. The R&S FPL1000 saves each trace point in the trace
memory only if the new value is lower than the previous one.
65User Manual 1178.3386.02 ─ 10
Page 66

R&S®FPL1000
Analysis
Trace Settings
"Average"
"View"
"Blank"
Remote command:
DISPlay[:WINDow<n>]:TRACe<t>:MODE on page 168
Detector
Defines the trace detector to be used for trace analysis.
The trace detector is used to combine multiple FFT window results to create the final
spectrum. (Note: in previous versions of the R&S FPL1000, the I/Q Analyzer always
used the linear average detector.) If necessary, the trace detector is also used to
reduce the number of calculated frequency points (defined by the FFT length) to the
defined number of sweep points. By default, the Autopeak trace detector is used.
Note: Using a detector other than Auto Peak and fewer than 4096 sweep points may
lead to wrong level results. For details see "Combining results - trace detector"
on page 22.
"Auto"
"Type"
Remote command:
[SENSe:][WINDow<n>:]DETector<t>[:FUNCtion] on page 172
[SENSe:][WINDow<n>:]DETector<t>[:FUNCtion]:AUTO on page 173
The average is formed over several sweeps.
The Sweep/Average Count determines the number of averaging procedures.
The current contents of the trace memory are frozen and displayed.
Removes the selected trace from the display.
Selects the optimum detector for the selected trace and filter mode.
This is the default setting.
Defines the selected detector type.
Note: If the EMI (R&S FPL1-K54) measurement option is installed
and the filter type "CISPR" is selected, additional detectors are available, even if EMI measurement is not active.
Hold
If activated, traces in "Min Hold" , "Max Hold" and "Average" mode are not reset after
specific parameter changes have been made.
Normally, the measurement is started again after parameter changes, before the measurement results are analyzed (e.g. using a marker). In all cases that require a new
measurement after parameter changes, the trace is reset automatically to avoid false
results (e.g. with span changes). For applications that require no reset after parameter
changes, the automatic reset can be switched off.
The default setting is off.
Remote command:
DISPlay[:WINDow<n>][:SUBWindow<w>]:TRACe<t>:MODE:HCONtinuous
on page 169
Smoothing
If enabled, the trace is smoothed by the specified value (between 1 % and 50 %). The
smoothing value is defined as a percentage of the display width. The larger the
smoothing value, the greater the smoothing effect.
For more information see the R&S FPL1000 User Manual.
66User Manual 1178.3386.02 ─ 10
Page 67

R&S®FPL1000
Analysis
Trace Settings
Remote command:
DISPlay[:WINDow<n>][:SUBWindow<w>]:TRACe<t>:SMOothing[:STATe]
on page 171
DISPlay[:WINDow<n>][:SUBWindow<w>]:TRACe<t>:SMOothing:APERture
on page 171
Average Mode
Defines the mode with which the trace is averaged over several sweeps.
This setting is generally applicable if trace mode "Average" is selected.
For FFT sweeps, the setting also affects the VBW (regardless of whether or not the
trace is averaged).
(See the chapter on ACLR power measurements in the R&S FPL1000 User Manual.)
How many sweeps are averaged is defined by the " Sweep/Average Count "
on page 59.
"Linear"
The power level values are converted into linear units prior to averaging. After the averaging, the data is converted back into its original
unit.
"Logarithmic"
For logarithmic scaling, the values are averaged in dBm. For linear
scaling, the behavior is the same as with linear averaging.
"Power"
Activates linear power averaging.
The power level values are converted into unit Watt prior to averaging. After the averaging, the data is converted back into its original
unit.
Use this mode to average power values in Volts or Amperes correctly.
In particular, for small VBW values (smaller than the RBW), use
power averaging mode for correct power measurements in FFT
sweep mode.
Remote command:
[SENSe:]AVERage<n>:TYPE on page 171
Predefined Trace Settings - Quick Config
Commonly required trace settings have been predefined and can be applied very
quickly by selecting the appropriate button.
Function Trace Settings
Preset All Traces Trace 1: Clear Write
Traces 2-6: Blank
Set Trace Mode
Max | Avg | Min
Set Trace Mode
Max | ClrWrite | Min
Trace 1: Max Hold
Trace 2: Average
Trace 3: Min Hold
Traces 4-6: Blank
Trace 1: Max Hold
Trace 2: Clear Write
67User Manual 1178.3386.02 ─ 10
Page 68

R&S®FPL1000
Analysis
Spectrogram Settings
Function Trace Settings
Trace 3: Min Hold
Traces 4-6: Blank
Trace 1 / Trace 2 / Trace 3 / Trace 4 (Softkeys)
Displays the "Traces" settings and focuses the "Mode" list for the selected trace.
Remote command:
DISPlay[:WINDow<n>][:SUBWindow<w>]:TRACe<t>[:STATe] on page 170
Copy Trace
Access: "Overview" > "Analysis" > "Traces" > "Copy Trace"
Or: [TRACE] > "Copy Trace"
Copies trace data to another trace.
The first group of buttons (labeled "Trace 1" to "Trace 6" ) selects the source trace. The
second group of buttons (labeled "Copy to Trace 1" to "Copy to Tace 6" ) selects the
destination.
Remote command:
TRACe<n>:COPY on page 173
6.2 Spectrogram Settings
Access: [TRACE] > "Spectrogram Config"
The individual settings available for spectrogram display are described here. For settings on color mapping, see Chapter 6.2.2, "Color Map Settings", on page 71.
Settings concerning the frames and how they are handled during a sweep are provided
as additional sweep settings for spectrogram display.
See Chapter 5.7.2, "Sweep Settings", on page 58.
Search functions for spectrogram markers are described in Chapter 6.4.2.2, "Marker
Search Settings for Spectrograms", on page 84.
● General Spectrogram Settings................................................................................68
● Color Map Settings..................................................................................................71
6.2.1 General Spectrogram Settings
Access: [TRACE] > "Spectrogram Config"
This section describes general settings for spectrogram display.
68User Manual 1178.3386.02 ─ 10
Page 69

R&S®FPL1000
Analysis
Spectrogram Settings
State..............................................................................................................................69
3D Spectrogram State...................................................................................................69
Select Frame.................................................................................................................70
History Depth ............................................................................................................... 70
3-D Display Depth.........................................................................................................70
Time Stamp ..................................................................................................................70
Color Mapping ..............................................................................................................70
Continuous Sweep / Run Cont .....................................................................................70
Single Sweep / Run Single ...........................................................................................71
Clear Spectrogram .......................................................................................................71
State
Activates and deactivates a Spectrogram subwindow.
"On"
"Off"
Remote command:
CALCulate<n>:SPECtrogram:LAYout on page 177
3D Spectrogram State
Activates and deactivates a 3-dimensional spectrogram. As opposed to the common 2dimensional spectrogram, the power is not only indicated by a color mapping, but also
in a third dimension, the z-axis.
For details see the R&S FPL1000 User Manual.
Displays the Spectrogram as a subwindow in the original result display.
Closes the Spectrogram subwindow.
69User Manual 1178.3386.02 ─ 10
Page 70

R&S®FPL1000
Analysis
Spectrogram Settings
Remote command:
CALCulate<n>:SPECtrogram:THReedim[:STATe] on page 178
Select Frame
Selects a specific frame, loads the corresponding trace from the memory, and displays
it in the Spectrum window.
Note that activating a marker or changing the position of the active marker automatically selects the frame that belongs to that marker.
This function is only available in single sweep mode or if the sweep is stopped, and
only if a spectrogram is selected.
The most recent frame is number 0, all previous frames have a negative number.
For more details see the R&S FPL1000 User Manual.
Remote command:
CALCulate<n>:SPECtrogram:FRAMe:SELect on page 176
History Depth
Sets the number of frames that the R&S FPL1000 stores in its memory.
The maximum number of frames depends on the "Sweep Points" on page 59.
For an overview of the maximum number of frames depending on the number of
sweep points, see the R&S FPL1000 User Manual.
If the memory is full, the R&S FPL1000 deletes the oldest frames stored in the memory
and replaces them with the new data.
Remote command:
CALCulate<n>:SPECtrogram:HDEPth on page 177
3-D Display Depth
Defines the number of frames displayed in a 3-dimensional spectrogram.
For details see the R&S FPL1000 User Manual.
Time Stamp
Activates and deactivates the timestamp. The timestamp shows the system time while
the measurement is running. In single sweep mode or if the sweep is stopped, the
timestamp shows the time and date of the end of the sweep.
When active, the timestamp replaces the display of the frame number.
Remote command:
CALCulate<n>:SPECtrogram:TSTamp[:STATe] on page 179
CALCulate<n>:SPECtrogram:TSTamp:DATA? on page 179
Color Mapping
Opens the "Color Mapping" dialog.
For details see the R&S FPL1000 User Manual.
Continuous Sweep / Run Cont
After triggering, starts the sweep and repeats it continuously until stopped. This is the
default setting.
70User Manual 1178.3386.02 ─ 10
Page 71

R&S®FPL1000
Analysis
Spectrogram Settings
After triggering, starts the measurement and repeats it continuously until stopped.
While the measurement is running, the "Continuous Sweep" softkey and the [RUN
CONT] key are highlighted. The running measurement can be aborted by selecting the
highlighted softkey or key again. The results are not deleted until a new measurement
is started.
Note: Sequencer. If the Sequencer is active, the "Continuous Sweep" softkey only controls the sweep mode for the currently selected channel setup. However, the sweep
mode only takes effect the next time the Sequencer activates that channel setup, and
only for a channel-defined sequence. In this case, a channel setup in continuous
sweep mode is swept repeatedly.
Furthermore, the [RUN CONT] key controls the Sequencer, not individual sweeps.
[RUN CONT] starts the Sequencer in continuous mode.
Remote command:
INITiate<n>:CONTinuous on page 163
Single Sweep / Run Single
After triggering, starts the number of sweeps set in "Sweep Count". The measurement
stops after the defined number of sweeps has been performed.
While the measurement is running, the "Single Sweep" softkey and the [RUN SINGLE]
key are highlighted. The running measurement can be aborted by selecting the highlighted softkey or key again.
Note: Sequencer. If the Sequencer is active, the "Single Sweep" softkey only controls
the sweep mode for the currently selected channel setup. However, the sweep mode
only takes effect the next time the Sequencer activates that channel setup, and only for
a channel-defined sequence. In this case, the Sequencer sweeps a channel setup in
single sweep mode only once.
Furthermore, the [RUN SINGLE] key controls the Sequencer, not individual sweeps.
[RUN SINGLE] starts the Sequencer in single mode.
If the Sequencer is off, only the evaluation for the currently displayed channel setup is
updated.
For details on the Sequencer, see the R&S FPL1000 User Manual.
Remote command:
INITiate<n>[:IMMediate] on page 164
Clear Spectrogram
Resets the spectrogram result display and clears the history buffer.
This function is only available if a spectrogram is selected.
Remote command:
CALCulate<n>:SPECtrogram:CLEar[:IMMediate] on page 175
6.2.2 Color Map Settings
Access: "Overview" > "Analysis" > "Traces" > "Spectrogram" > "Color Mapping"
or: [TRACE] > "Spectrogram Config" > "Color Mapping"
71User Manual 1178.3386.02 ─ 10
Page 72

R&S®FPL1000
Analysis
Spectrogram Settings
In addition to the available color settings, the dialog box displays the current color map
and provides a preview of the display with the current settings.
Figure 6-1: Color Mapping dialog box
1 = Color map: shows the current color distribution
2 = Preview pane: shows a preview of the spectrogram with any changes that you make to the color
scheme
3 = Color curve pane: graphical representation of all settings available to customize the color scheme
4/5 = Color range start and stop sliders: define the range of the color map or amplitudes for the spectrogram
6 = Color curve slider: adjusts the focus of the color curve
7 = Histogram: shows the distribution of measured values
8 = Scale of the horizontal axis (value range)
Start / Stop ................................................................................................................... 72
Shape ...........................................................................................................................72
Hot / Cold / Radar / Grayscale ..................................................................................... 73
Auto ..............................................................................................................................73
Set to Default ............................................................................................................... 73
Close.............................................................................................................................73
Start / Stop
Defines the lower and upper boundaries of the value range of the spectrogram.
Remote command:
DISPlay[:WINDow<n>]:SPECtrogram:COLor:LOWer on page 180
DISPlay[:WINDow<n>]:SPECtrogram:COLor:UPPer on page 181
Shape
Defines the shape and focus of the color curve for the spectrogram result display.
"-1 to <0"
"0"
">0 to 1"
More colors are distributed among the lower values
Colors are distributed linearly among the values
More colors are distributed among the higher values
72User Manual 1178.3386.02 ─ 10
Page 73

R&S®FPL1000
Analysis
Trace / Data Export Configuration
Remote command:
DISPlay[:WINDow<n>]:SPECtrogram:COLor:SHAPe on page 181
Hot / Cold / Radar / Grayscale
Sets the color scheme for the spectrogram.
Remote command:
DISPlay[:WINDow<n>]:SPECtrogram:COLor[:STYLe] on page 181
Auto
Defines the color range automatically according to the existing measured values for
optimized display.
Set to Default
Sets the color mapping to the default settings.
Remote command:
DISPlay[:WINDow<n>]:SPECtrogram:COLor:DEFault on page 180
Close
Saves the changes and closes the dialog box.
6.3 Trace / Data Export Configuration
Access: "Save" > "Export" > "Trace Export Configuration"
Or: [TRACE] > "Trace Config" > "Trace / Data Export"
The R&S FPL1000 provides various evaluation methods for the results of the performed measurements. However, you may want to evaluate the data with other, external applications. In this case, you can export the measurement data to an ASCII file.
The standard data management functions (e.g. saving or loading instrument settings)
that are available for all R&S FPL1000 applications are not described here.
73User Manual 1178.3386.02 ─ 10
Page 74

R&S®FPL1000
Analysis
Trace / Data Export Configuration
Export all Traces and all Table Results ........................................................................74
Include Instrument & Measurement Settings ............................................................... 74
Trace to Export .............................................................................................................74
Decimal Separator ....................................................................................................... 75
Export Trace to ASCII File ............................................................................................75
└ File Type ........................................................................................................ 75
└ Decimal Separator ......................................................................................... 76
└ File Explorer....................................................................................................76
Export all Traces and all Table Results
Selects all displayed traces and result tables (e.g. Result Summary, marker table etc.)
in the current application for export to an ASCII file.
Alternatively, you can select one specific trace only for export (see Trace to Export ).
The results are output in the same order as they are displayed on the screen: window
by window, trace by trace, and table row by table row.
Remote command:
FORMat:DEXPort:TRACes on page 225
Include Instrument & Measurement Settings
Includes additional instrument and measurement settings in the header of the export
file for result data.
Remote command:
FORMat:DEXPort:HEADer on page 224
Trace to Export
Defines an individual trace to be exported to a file.
This setting is not available if Export all Traces and all Table Results is selected.
74User Manual 1178.3386.02 ─ 10
Page 75

R&S®FPL1000
Analysis
Trace / Data Export Configuration
Decimal Separator
Defines the decimal separator for floating-point numerals for the data export/import
files. Evaluation programs require different separators in different languages.
Remote command:
FORMat:DEXPort:DSEParator on page 224
Export Trace to ASCII File
Saves the selected trace or all traces in the currently active result display to the specified file and directory in the selected ASCII format.
"File Explorer": Instead of using the file manager of the R&S FPL1000 firmware, you
can also use the Microsoft Windows File Explorer to manage files.
Remote command:
MMEMory:STORe<n>:TRACe on page 225
File Type ← Export Trace to ASCII File
Determines the format of the ASCII file to be imported or exported.
Depending on the external program in which the data file was created or is evaluated,
a comma-separated list (CSV) or a plain data format (DAT) file is required.
75User Manual 1178.3386.02 ─ 10
Page 76

R&S®FPL1000
6.4 Marker Usage
Analysis
Marker Usage
Remote command:
FORMat:DEXPort:FORMat on page 224
Decimal Separator ← Export Trace to ASCII File
Defines the decimal separator for floating-point numerals for the data export/import
files. Evaluation programs require different separators in different languages.
Remote command:
FORMat:DEXPort:DSEParator on page 224
File Explorer ← Export Trace to ASCII File
Opens the Microsoft Windows File Explorer.
Remote command:
not supported
Access: "Overview" > "Analysis"
The following marker settings and functions are available in the I/Q Analyzer application.
For "I/Q-Vector" displays markers are not available.
In the I/Q Analyzer application, the resolution with which the frequency can be measured with a marker is always the filter bandwidth, which is derived from the defined
sample rate.
(See Chapter 4.1.1, "Sample Rate and Maximum Usable I/Q Bandwidth for RF Input",
on page 18).
● Marker Settings.......................................................................................................76
● Marker Search Settings and Positioning Functions................................................ 81
● Marker Search Settings for Spectrograms..............................................................89
● Marker Functions.................................................................................................... 92
6.4.1 Marker Settings
Or: [MKR] > "Marker Config"
The remote commands required to define these settings are described in Chap-
ter 9.7.3.1, "Setting Up Individual Markers", on page 182.
● Individual Marker Setup.......................................................................................... 77
● General Marker Settings......................................................................................... 80
76User Manual 1178.3386.02 ─ 10
Page 77

R&S®FPL1000
6.4.1.1 Individual Marker Setup
Analysis
Marker Usage
Up to 17 markers or delta markers can be activated for each window simultaneously.
Initial marker setup is performed using the "Marker" dialog box.
The markers are distributed among 3 tabs for a better overview. By default, the first
marker is defined as a normal marker, whereas all others are defined as delta markers
with reference to the first marker. All markers are assigned to trace 1, but only the first
marker is active.
Selected Marker ...........................................................................................................77
Marker State .................................................................................................................77
Marker Position X-value ...............................................................................................78
Frame (Spectrogram only)............................................................................................ 78
Marker Type .................................................................................................................78
Reference Marker ........................................................................................................ 78
Linking to Another Marker ............................................................................................78
Assigning the Marker to a Trace .................................................................................. 79
Select Marker ...............................................................................................................79
All Markers Off ..............................................................................................................79
Selected Marker
Marker name. The marker which is currently selected for editing is highlighted orange.
Remote command:
Marker selected via suffix <m> in remote commands.
Marker State
Activates or deactivates the marker in the diagram.
77User Manual 1178.3386.02 ─ 10
Page 78

R&S®FPL1000
Analysis
Marker Usage
Remote command:
CALCulate<n>:MARKer<m>[:STATe] on page 187
CALCulate<n>:DELTamarker<m>[:STATe] on page 185
Marker Position X-value
Defines the position (x-value) of the marker in the diagram. For normal markers, the
absolute position is indicated. For delta markers, the position relative to the reference
marker is provided.
Remote command:
CALCulate<n>:MARKer<m>:X on page 187
CALCulate<n>:DELTamarker<m>:X on page 185
Frame (Spectrogram only)
Spectrogram frame the marker is assigned to.
Remote command:
CALCulate<n>:MARKer<m>:SPECtrogram:FRAMe on page 195
CALCulate<n>:DELTamarker<m>:SPECtrogram:FRAMe on page 199
Marker Type
Toggles the marker type.
The type for marker 1 is always "Normal" , the type for delta marker 1 is always
"Delta" . These types cannot be changed.
Note: If normal marker 1 is the active marker, switching the "Mkr Type" activates an
additional delta marker 1. For any other marker, switching the marker type does not
activate an additional marker, it only switches the type of the selected marker.
"Normal"
"Delta"
Remote command:
CALCulate<n>:MARKer<m>[:STATe] on page 187
CALCulate<n>:DELTamarker<m>[:STATe] on page 185
Reference Marker
Defines a marker as the reference marker which is used to determine relative analysis
results (delta marker values).
If the reference marker is deactivated, the delta marker referring to it is also deactivated.
Remote command:
CALCulate<n>:DELTamarker<m>:MREFerence on page 184
A normal marker indicates the absolute value at the defined position
in the diagram.
A delta marker defines the value of the marker relative to the specified reference marker (marker 1 by default).
Linking to Another Marker
Links the current marker to the marker selected from the list of active markers. If the xaxis value of the initial marker is changed, the linked marker follows to the same position on the x-axis. Linking is off by default.
78User Manual 1178.3386.02 ─ 10
Page 79

R&S®FPL1000
Analysis
Marker Usage
Using this function you can set two markers on different traces to measure the difference (e.g. between a max hold trace and a min hold trace or between a measurement
and a reference trace).
Remote command:
CALCulate<n>:MARKer<ms>:LINK:TO:MARKer<md> on page 186
CALCulate<n>:DELTamarker<ms>:LINK:TO:MARKer<md> on page 183
CALCulate<n>:DELTamarker<m>:LINK on page 183
Assigning the Marker to a Trace
The "Trace" setting assigns the selected marker to an active trace. The trace determines which value the marker shows at the marker position. If the marker was previously assigned to a different trace, the marker remains on the previous frequency or
time, but indicates the value of the new trace.
If a trace is turned off, the assigned markers and marker functions are also deactivated.
Remote command:
CALCulate<n>:MARKer<m>:TRACe on page 187
Select Marker
The "Select Marker" function opens a dialog box to select and activate or deactivate
one or more markers quickly.
Remote command:
CALCulate<n>:MARKer<m>[:STATe] on page 187
CALCulate<n>:DELTamarker<m>[:STATe] on page 185
All Markers Off
Deactivates all markers in one step.
Remote command:
CALCulate<n>:MARKer<m>:AOFF on page 186
79User Manual 1178.3386.02 ─ 10
Page 80

R&S®FPL1000
6.4.1.2 General Marker Settings
Analysis
Marker Usage
Some general marker settings allow you to influence the marker behavior for all markers.
Marker Table Display ....................................................................................................80
Marker Info ...................................................................................................................80
Marker Stepsize ........................................................................................................... 81
Marker Table Display
Defines how the marker information is displayed.
"On"
"Off"
"Auto"
Remote command:
DISPlay[:WINDow<n>]:MTABle on page 188
Marker Info
Turns the marker information displayed in the diagram on and off.
Displays the marker information in a table in a separate area beneath
the diagram.
No separate marker table is displayed.
If Marker Info is active, the marker information is displayed within the
diagram area.
(Default) If more than two markers are active, the marker table is displayed automatically.
If Marker Info is active, the marker information for up to two markers
is displayed in the diagram area.
80User Manual 1178.3386.02 ─ 10
Page 81

R&S®FPL1000
6.4.2 Marker Search Settings and Positioning Functions
Analysis
Marker Usage
Remote command:
DISPlay[:WINDow<n>]:MINFo[:STATe] on page 188
Marker Stepsize
Defines the size of the steps that the marker position is moved using the rotary knob.
"Standard"
"Sweep
Points"
Remote command:
CALCulate<n>:MARKer<m>:X:SSIZe on page 189
The marker position is moved in steps of (Span/1000), which corresponds approximately to the number of pixels for the default display
of 1001 sweep points. This setting is most suitable to move the
marker over a larger distance.
The marker position is moved from one sweep point to the next. This
setting is required for a very precise positioning if more sweep points
are collected than the number of pixels that can be displayed on the
screen. It is the default mode.
Access: "Overview" > "Analysis" > "Marker" > "Search"
or: [MKR TO]
Several functions are available to set the marker to a specific position very quickly and
easily, or to use the current marker position to define another characteristic value. In
order to determine the required marker position, searches may be performed. The
search results can be influenced by special settings.
For more information on searching for signal peaks see Chapter 6.4.4.2, "Marker Peak
List", on page 95.
In I/Q Analyzer mode, the search settings for "Real/Imag (I/Q)" evaluation include an
additional parameter, see " Branch for Peaksearch " on page 84.
Note that in the Spectrum diagram in I/Q mode, a peak search is performed only within
the indicated Analysis Bandwidth , unless you specify Search Limits ( Left / Right ) in
the marker settings.
The remote commands required to define these settings are described in Chap-
ter 9.7.3.5, "Positioning the Marker", on page 203.
● Marker Search Settings...........................................................................................81
● Marker Search Settings for Spectrograms..............................................................84
● Positioning Functions..............................................................................................87
6.4.2.1 Marker Search Settings
Access: [MKR TO] > "Search Config"
81User Manual 1178.3386.02 ─ 10
Page 82

R&S®FPL1000
Analysis
Marker Usage
Markers are commonly used to determine peak values, i.e. maximum or minimum values, in the measured signal. Configuration settings allow you to influence the peak
search results.
For Spectrograms, special marker settings are available, see Chapter 6.4.2.2, "Marker
Search Settings for Spectrograms", on page 84.
Search Mode for Next Peak .........................................................................................82
Exclude LO ...................................................................................................................82
Peak Excursion ............................................................................................................ 83
Auto Max Peak Search / Auto Min Peak Search ..........................................................83
Search Limits ............................................................................................................... 83
└ Search Limits ( Left / Right )........................................................................... 83
└ Search Threshold ...........................................................................................83
└ Use Zoom Limits ............................................................................................84
└ Deactivating All Search Limits ....................................................................... 84
Branch for Peaksearch .................................................................................................84
Search Mode for Next Peak
Selects the search mode for the next peak search.
"Left"
"Absolute"
"Right"
Remote command:
Chapter 9.7.3.5, "Positioning the Marker", on page 203
Determines the next maximum/minimum to the left of the current
peak.
Determines the next maximum/minimum to either side of the current
peak.
Determines the next maximum/minimum to the right of the current
peak.
Exclude LO
If activated, restricts the frequency range for the marker search functions.
82User Manual 1178.3386.02 ─ 10
Page 83

R&S®FPL1000
Analysis
Marker Usage
"On"
"Off"
Remote command:
CALCulate<n>:MARKer<m>:LOEXclude on page 190
Peak Excursion
Defines the minimum level value by which a signal must rise or fall so that it is identified as a maximum or a minimum by the search functions.
Entries from 0 dB to 80 dB are allowed; the resolution is 0.1 dB. The default setting for
the peak excursion is 6 dB.
For Analog Modulation Analysis, the unit and value range depend on the selected
result display type.
For more information, see Chapter 6.4.4.2, "Marker Peak List", on page 95.
Remote command:
CALCulate<n>:MARKer<m>:PEXCursion on page 190
The minimum frequency included in the peak search range is ≥ 5 ×
resolution bandwidth (RBW).
Due to the interference by the first local oscillator to the first intermediate frequency at the input mixer, the LO is represented as a signal at 0 Hz. To avoid the peak marker jumping to the LO signal at 0
Hz, this frequency is excluded from the peak search.
No restriction to the search range. The frequency 0 Hz is included in
the marker search functions.
Auto Max Peak Search / Auto Min Peak Search
If activated, a maximum or minimum peak search is performed automatically for
marker 1 after each sweep.
For spectrogram displays, define which frame the peak is to be searched in.
Remote command:
CALCulate<n>:MARKer<m>:MAXimum:AUTO on page 203
CALCulate<n>:MARKer<m>:MINimum:AUTO on page 205
Search Limits
The search results can be restricted by limiting the search area or adding search conditions.
Search Limits ( Left / Right ) ← Search Limits
If activated, limit lines are defined and displayed for the search. Only results within the
limited search range are considered.
Remote command:
CALCulate<n>:MARKer<m>:X:SLIMits[:STATe] on page 191
CALCulate<n>:MARKer<m>:X:SLIMits:LEFT on page 192
CALCulate<n>:MARKer<m>:X:SLIMits:RIGHt on page 192
Search Threshold ← Search Limits
Defines an absolute threshold as an additional condition for the peak search. Only
peaks that exceed the threshold are detected.
83User Manual 1178.3386.02 ─ 10
Page 84

R&S®FPL1000
Analysis
Marker Usage
Remote command:
CALCulate<n>:THReshold on page 193
Use Zoom Limits ← Search Limits
If activated, the peak search is restricted to the active zoom area defined for a single
zoom.
Remote command:
CALCulate<n>:MARKer<m>:X:SLIMits:ZOOM[:STATe] on page 193
Deactivating All Search Limits ← Search Limits
Deactivates the search range limits.
Remote command:
CALCulate<n>:MARKer<m>:X:SLIMits[:STATe] on page 191
CALCulate<n>:THReshold:STATe on page 193
Branch for Peaksearch
Defines which data is used for marker search functions in I/Q data.
This function is only available for the display configuration "Real/Imag (I/Q)" (see "
Real/Imag (I/Q) " on page 15).
Note: The search settings apply to all markers, not only the currently selected one.
"Real"
Marker search functions are performed on the real trace of the I/Q
measurement.
"Imag"
Marker search functions are performed on the imaginary trace of the
I/Q measurement.
"Magnitude"
Marker search functions are performed on the magnitude of the I and
Q data.
Remote command:
CALCulate<n>:MARKer<m>:SEARch on page 191
6.4.2.2 Marker Search Settings for Spectrograms
Access: "Overview" > "Analysis" > "Markers" > "Search"
or: [MKR TO] > "Search Config"
Spectrograms show not only the current sweep results, but also the sweep history.
Thus, when searching for peaks, you must define the search settings within a single
time frame (x-direction) and within several time frames (y-direction).
These settings are only available for spectrogram displays.
84User Manual 1178.3386.02 ─ 10
Page 85

R&S®FPL1000
Analysis
Marker Usage
Search Mode for Next Peak in X-Direction .................................................................. 85
Search Mode for Next Peak in Y-Direction ...................................................................85
Marker Search Type .....................................................................................................86
Marker Search Area .....................................................................................................86
Peak Excursion ............................................................................................................ 86
Search Limits ............................................................................................................... 87
└ Search Limits ( Left / Right )........................................................................... 87
└ Search Threshold ...........................................................................................87
└ Use Zoom Limits ............................................................................................87
└ Deactivating All Search Limits ....................................................................... 87
Search Mode for Next Peak in X-Direction
Selects the search mode for the next peak search within the currently selected frame.
"Left"
"Absolute"
"Right"
Remote command:
Chapter 9.7.3.5, "Positioning the Marker", on page 203
Determines the next maximum/minimum to the left of the current
peak.
Determines the next maximum/minimum to either side of the current
peak.
Determines the next maximum/minimum to the right of the current
peak.
Search Mode for Next Peak in Y-Direction
Selects the search mode for the next peak search within all frames at the current
marker position.
"Up"
Determines the next maximum/minimum above the current peak (in
more recent frames).
85User Manual 1178.3386.02 ─ 10
Page 86

R&S®FPL1000
Analysis
Marker Usage
"Absolute"
"Down"
Remote command:
CALCulate<n>:MARKer<m>:SPECtrogram:Y:MAXimum:ABOVe on page 196
CALCulate<n>:DELTamarker<m>:SPECtrogram:Y:MAXimum:ABOVe
on page 201
CALCulate<n>:MARKer<m>:SPECtrogram:Y:MAXimum:BELow on page 196
CALCulate<n>:DELTamarker<m>:SPECtrogram:Y:MAXimum:BELow
on page 201
CALCulate<n>:MARKer<m>:SPECtrogram:Y:MAXimum:NEXT on page 197
CALCulate<n>:DELTamarker<m>:SPECtrogram:Y:MAXimum:NEXT on page 201
CALCulate<n>:MARKer<m>:SPECtrogram:Y:MINimum:ABOVe on page 197
CALCulate<n>:DELTamarker<m>:SPECtrogram:Y:MINimum:ABOVe
on page 202
CALCulate<n>:MARKer<m>:SPECtrogram:Y:MINimum:BELow on page 197
CALCulate<n>:DELTamarker<m>:SPECtrogram:Y:MINimum:BELow
on page 202
CALCulate<n>:MARKer<m>:SPECtrogram:Y:MINimum:NEXT on page 198
CALCulate<n>:DELTamarker<m>:SPECtrogram:Y:MINimum:NEXT on page 202
Determines the next maximum/minimum above or below the current
peak (in all frames).
Determines the next maximum/minimum below the current peak (in
older frames).
Marker Search Type
Defines the type of search to be performed in the spectrogram.
"X-Search"
"Y-Search"
"XY-Search"
Remote command:
Defined by the search function, see Chapter 9.7.3.4, "Marker Search (Spectrograms)",
on page 194
Marker Search Area
Defines which frames the search is performed in.
"Visible"
"Memory"
Remote command:
CALCulate<n>:MARKer<m>:SPECtrogram:SARea on page 195
CALCulate<n>:DELTamarker<m>:SPECtrogram:SARea on page 200
Peak Excursion
Defines the minimum level value by which a signal must rise or fall so that it is identified as a maximum or a minimum by the search functions.
Entries from 0 dB to 80 dB are allowed; the resolution is 0.1 dB. The default setting for
the peak excursion is 6 dB.
Searches only within the currently selected frame.
Searches within all frames but only at the current frequency position.
Searches in all frames at all positions.
Only the visible frames are searched.
All frames stored in the memory are searched.
For Analog Modulation Analysis, the unit and value range depend on the selected
result display type.
86User Manual 1178.3386.02 ─ 10
Page 87

R&S®FPL1000
Analysis
Marker Usage
For more information, see Chapter 6.4.4.2, "Marker Peak List", on page 95.
Remote command:
CALCulate<n>:MARKer<m>:PEXCursion on page 190
Search Limits
The search results can be restricted by limiting the search area or adding search conditions.
Search Limits ( Left / Right ) ← Search Limits
If activated, limit lines are defined and displayed for the search. Only results within the
limited search range are considered.
Remote command:
CALCulate<n>:MARKer<m>:X:SLIMits[:STATe] on page 191
CALCulate<n>:MARKer<m>:X:SLIMits:LEFT on page 192
CALCulate<n>:MARKer<m>:X:SLIMits:RIGHt on page 192
Search Threshold ← Search Limits
Defines an absolute threshold as an additional condition for the peak search. Only
peaks that exceed the threshold are detected.
Remote command:
CALCulate<n>:THReshold on page 193
Use Zoom Limits ← Search Limits
If activated, the peak search is restricted to the active zoom area defined for a single
zoom.
Remote command:
CALCulate<n>:MARKer<m>:X:SLIMits:ZOOM[:STATe] on page 193
Deactivating All Search Limits ← Search Limits
Deactivates the search range limits.
Remote command:
CALCulate<n>:MARKer<m>:X:SLIMits[:STATe] on page 191
CALCulate<n>:THReshold:STATe on page 193
6.4.2.3 Positioning Functions
Access: [MKR ->]
The following functions set the currently selected marker to the result of a peak search
or set other characteristic values to the current marker value.
Peak Search .................................................................................................................88
Search Next Peak ........................................................................................................ 88
Search Minimum .......................................................................................................... 88
Search Next Minimum ..................................................................................................88
Center Frequency = Marker Frequency ....................................................................... 88
Reference Level = Marker Level .................................................................................. 88
87User Manual 1178.3386.02 ─ 10
Page 88

R&S®FPL1000
Analysis
Marker Usage
Peak Search
Sets the selected marker/delta marker to the maximum of the trace. If no marker is
active, marker 1 is activated.
Remote command:
CALCulate<n>:MARKer<m>:MAXimum[:PEAK] on page 204
CALCulate<n>:DELTamarker<m>:MAXimum[:PEAK] on page 207
Search Next Peak
Sets the selected marker/delta marker to the next (lower) maximum of the assigned
trace. If no marker is active, marker 1 is activated.
Remote command:
CALCulate<n>:MARKer<m>:MAXimum:NEXT on page 204
CALCulate<n>:MARKer<m>:MAXimum:RIGHt on page 205
CALCulate<n>:MARKer<m>:MAXimum:LEFT on page 204
CALCulate<n>:DELTamarker<m>:MAXimum:NEXT on page 207
CALCulate<n>:DELTamarker<m>:MAXimum:RIGHt on page 208
CALCulate<n>:DELTamarker<m>:MAXimum:LEFT on page 207
Search Minimum
Sets the selected marker/delta marker to the minimum of the trace. If no marker is
active, marker 1 is activated.
Remote command:
CALCulate<n>:MARKer<m>:MINimum[:PEAK] on page 206
CALCulate<n>:DELTamarker<m>:MINimum[:PEAK] on page 208
Search Next Minimum
Sets the selected marker/delta marker to the next (higher) minimum of the selected
trace. If no marker is active, marker 1 is activated.
For spectrogram displays, define which frame the next minimum is to be searched in.
Remote command:
CALCulate<n>:MARKer<m>:MINimum:NEXT on page 206
CALCulate<n>:MARKer<m>:MINimum:LEFT on page 205
CALCulate<n>:MARKer<m>:MINimum:RIGHt on page 206
CALCulate<n>:DELTamarker<m>:MINimum:NEXT on page 208
CALCulate<n>:DELTamarker<m>:MINimum:LEFT on page 208
CALCulate<n>:DELTamarker<m>:MINimum:RIGHt on page 209
Center Frequency = Marker Frequency
Sets the center frequency to the selected marker or delta marker frequency. A peak
can thus be set as center frequency, for example to analyze it in detail with a smaller
span.
This function is not available for zero span measurements.
Remote command:
CALCulate<n>:MARKer<m>:FUNCtion:CENTer on page 136
Reference Level = Marker Level
Sets the reference level to the selected marker level.
88User Manual 1178.3386.02 ─ 10
Page 89

R&S®FPL1000
6.4.3 Marker Search Settings for Spectrograms
Analysis
Marker Usage
Remote command:
CALCulate<n>:MARKer<m>:FUNCtion:REFerence on page 130
Access: "Overview" > "Analysis" > "Markers" > "Search"
or: [MKR TO] > "Search Config"
Spectrograms show not only the current sweep results, but also the sweep history.
Thus, when searching for peaks, you must define the search settings within a single
time frame (x-direction) and within several time frames (y-direction).
These settings are only available for spectrogram displays.
Search Mode for Next Peak in X-Direction .................................................................. 89
Search Mode for Next Peak in Y-Direction ...................................................................90
Marker Search Type .....................................................................................................90
Marker Search Area .....................................................................................................90
Peak Excursion ............................................................................................................ 91
Search Limits ............................................................................................................... 91
└ Search Limits ( Left / Right )........................................................................... 91
└ Search Threshold ...........................................................................................91
└ Use Zoom Limits ............................................................................................91
└ Deactivating All Search Limits ....................................................................... 91
Search Mode for Next Peak in X-Direction
Selects the search mode for the next peak search within the currently selected frame.
"Left"
Determines the next maximum/minimum to the left of the current
peak.
89User Manual 1178.3386.02 ─ 10
Page 90

R&S®FPL1000
Analysis
Marker Usage
"Absolute"
"Right"
Remote command:
Chapter 9.7.3.5, "Positioning the Marker", on page 203
Search Mode for Next Peak in Y-Direction
Selects the search mode for the next peak search within all frames at the current
marker position.
"Up"
"Absolute"
"Down"
Remote command:
CALCulate<n>:MARKer<m>:SPECtrogram:Y:MAXimum:ABOVe on page 196
CALCulate<n>:DELTamarker<m>:SPECtrogram:Y:MAXimum:ABOVe
on page 201
CALCulate<n>:MARKer<m>:SPECtrogram:Y:MAXimum:BELow on page 196
CALCulate<n>:DELTamarker<m>:SPECtrogram:Y:MAXimum:BELow
on page 201
CALCulate<n>:MARKer<m>:SPECtrogram:Y:MAXimum:NEXT on page 197
CALCulate<n>:DELTamarker<m>:SPECtrogram:Y:MAXimum:NEXT on page 201
CALCulate<n>:MARKer<m>:SPECtrogram:Y:MINimum:ABOVe on page 197
CALCulate<n>:DELTamarker<m>:SPECtrogram:Y:MINimum:ABOVe
on page 202
CALCulate<n>:MARKer<m>:SPECtrogram:Y:MINimum:BELow on page 197
CALCulate<n>:DELTamarker<m>:SPECtrogram:Y:MINimum:BELow
on page 202
CALCulate<n>:MARKer<m>:SPECtrogram:Y:MINimum:NEXT on page 198
CALCulate<n>:DELTamarker<m>:SPECtrogram:Y:MINimum:NEXT on page 202
Determines the next maximum/minimum to either side of the current
peak.
Determines the next maximum/minimum to the right of the current
peak.
Determines the next maximum/minimum above the current peak (in
more recent frames).
Determines the next maximum/minimum above or below the current
peak (in all frames).
Determines the next maximum/minimum below the current peak (in
older frames).
Marker Search Type
Defines the type of search to be performed in the spectrogram.
"X-Search"
"Y-Search"
"XY-Search"
Remote command:
Defined by the search function, see Chapter 9.7.3.4, "Marker Search (Spectrograms)",
on page 194
Marker Search Area
Defines which frames the search is performed in.
"Visible"
Searches only within the currently selected frame.
Searches within all frames but only at the current frequency position.
Searches in all frames at all positions.
Only the visible frames are searched.
90User Manual 1178.3386.02 ─ 10
Page 91

R&S®FPL1000
Analysis
Marker Usage
"Memory"
Remote command:
CALCulate<n>:MARKer<m>:SPECtrogram:SARea on page 195
CALCulate<n>:DELTamarker<m>:SPECtrogram:SARea on page 200
Peak Excursion
Defines the minimum level value by which a signal must rise or fall so that it is identified as a maximum or a minimum by the search functions.
Entries from 0 dB to 80 dB are allowed; the resolution is 0.1 dB. The default setting for
the peak excursion is 6 dB.
For Analog Modulation Analysis, the unit and value range depend on the selected
result display type.
For more information, see Chapter 6.4.4.2, "Marker Peak List", on page 95.
Remote command:
CALCulate<n>:MARKer<m>:PEXCursion on page 190
Search Limits
The search results can be restricted by limiting the search area or adding search conditions.
Search Limits ( Left / Right ) ← Search Limits
If activated, limit lines are defined and displayed for the search. Only results within the
limited search range are considered.
Remote command:
CALCulate<n>:MARKer<m>:X:SLIMits[:STATe] on page 191
CALCulate<n>:MARKer<m>:X:SLIMits:LEFT on page 192
CALCulate<n>:MARKer<m>:X:SLIMits:RIGHt on page 192
All frames stored in the memory are searched.
Search Threshold ← Search Limits
Defines an absolute threshold as an additional condition for the peak search. Only
peaks that exceed the threshold are detected.
Remote command:
CALCulate<n>:THReshold on page 193
Use Zoom Limits ← Search Limits
If activated, the peak search is restricted to the active zoom area defined for a single
zoom.
Remote command:
CALCulate<n>:MARKer<m>:X:SLIMits:ZOOM[:STATe] on page 193
Deactivating All Search Limits ← Search Limits
Deactivates the search range limits.
Remote command:
CALCulate<n>:MARKer<m>:X:SLIMits[:STATe] on page 191
CALCulate<n>:THReshold:STATe on page 193
91User Manual 1178.3386.02 ─ 10
Page 92

R&S®FPL1000
6.4.4 Marker Functions
6.4.4.1 Measuring the Power in a Channel (Band Power Marker)
Analysis
Marker Usage
Some special marker functions are available in the I/Q Analyzer application.
Access: "Overview" > "Analysis" > "Marker Functions" > "Band Power" > "Band Power
Config"
or: [MKR] > "Select Marker Function" > "Band Power"
To determine the noise power in a transmission channel, you can use a noise marker
and multiply the result with the channel bandwidth. However, the results are only accurate for flat noise.
Band power markers allow you to measure the integrated power for a defined span
(band) around a marker (similar to ACP measurements). By default, 5 % of the current
span is used. The span is indicated by limit lines in the diagram. You can easily change
the span by moving the limit lines in the diagram. They are automatically aligned symmetrically to the marker frequency. They are also moved automatically if you move the
marker on the screen.
The results can be displayed either as a power (dBm) or density (dBm/Hz) value and
are indicated in the marker table for each band power marker.
Relative band power markers
The results for band power markers which are defined as delta markers and thus have
a reference value can also be calculated as reference power values (in dB).
In this case, the result of the band power deltamarker is the difference between the
absolute power in the band around the delta marker and the absolute power for the reference marker. The powers are subtracted logarithmically, so the result is a dB value.
[Relative band power (Delta2) in dB] = [absolute band power (Delta2) in dBm] - [absolute (band) power of reference marker in dBm]
The measured power for the reference marker may be an absolute power at a single
point (if the reference marker is not a band power marker), or the power in a band (if
the reference marker is a band power marker itself).
If the reference marker for the band power marker is also a delta marker, the absolute
power level for the reference marker is used for calculation.
For the I/Q Analyzer application, band power markers are only available for Spectrum
displays.
The entire band must lie within the display. If it is moved out of the display, the result
cannot be calculated (indicated by "- - -" as the "Function Result" ). However, the width
of the band is maintained so that the band power can be calculated again when it
returns to the display.
92User Manual 1178.3386.02 ─ 10
Page 93

R&S®FPL1000
Analysis
Marker Usage
All markers can be defined as band power markers, each with a different span. When a
band power marker is activated, if no marker is active yet, marker 1 is activated. Otherwise, the currently active marker is used as a band power marker (all other marker
functions for this marker are deactivated).
If the detector mode for the marker trace is set to "Auto" , the RMS detector is used.
The individual marker settings correspond to those defined in the "Marker" dialog box
(see Chapter 6.4.1.1, "Individual Marker Setup", on page 77). Any settings to the
marker state or type changed in the "Marker Function" dialog box are also changed in
the "Marker" dialog box and vice versa.
93User Manual 1178.3386.02 ─ 10
Page 94

R&S®FPL1000
Analysis
Marker Usage
Remote commands:
CALCulate<n>:MARKer<m>:FUNCtion:BPOWer[:STATe] on page 211
CALCulate<n>:MARKer<m>:FUNCtion:BPOWer:RESult? on page 210
Band Power Measurement State ................................................................................. 94
Span .............................................................................................................................94
Power Mode .................................................................................................................94
Switching All Band Power Measurements Off ..............................................................95
Band Power Measurement State
Activates or deactivates band power measurement for the marker in the diagram.
Band power markers are only available for standard frequency measurements (not
zero span) in the Spectrum application.
If activated, the markers display the power or density measured in the band around the
current marker position.
For details see Chapter 6.4.4.1, "Measuring the Power in a Channel (Band Power
Marker)", on page 92.
Remote command:
CALCulate<n>:MARKer<m>:FUNCtion:BPOWer[:STATe] on page 211
CALCulate<n>:DELTamarker<m>:FUNCtion:BPOWer[:STATe] on page 212
Span
Defines the span (band) around the marker for which the power is measured.
The span is indicated by lines in the diagram. You can easily change the span by mov-
ing the limit lines in the diagram. They are automatically aligned symmetrically to the
marker frequency. They are also moved automatically if you move the marker on the
screen.
Remote command:
CALCulate<n>:MARKer<m>:FUNCtion:BPOWer:SPAN on page 210
CALCulate<n>:DELTamarker<m>:FUNCtion:BPOWer:SPAN on page 212
Power Mode
Defines the mode of the power measurement result.
For Analog Modulation Analysis, the power mode is not editable for AM, FM, or PM
spectrum results. In this case, the marker function does not determine a power value,
but rather the deviation within the specified span.
"Power"
"Relative
Power"
The result is an absolute power level.
The power unit depends on the Unit setting.
This setting is only available for a delta band power marker.
The result is the difference between the absolute power in the band
around the delta marker and the absolute power for the reference
marker (see " Reference Marker " on page 78). The powers are subtracted logarithmically, so the result is a dB value.
[Relative band power (Delta2) in dB] = [absolute band power (Delta2)
in dBm] - [absolute (band) power of reference marker in dBm]
For details see "Relative band power markers" on page 92
94User Manual 1178.3386.02 ─ 10
Page 95

R&S®FPL1000
Analysis
Marker Usage
"Density"
Remote command:
CALCulate<n>:MARKer<m>:FUNCtion:BPOWer:MODE on page 209
CALCulate<n>:DELTamarker<m>:FUNCtion:BPOWer:MODE on page 211
Switching All Band Power Measurements Off
Deactivates band power measurement for all markers.
Remote command:
CALCulate<n>:MARKer<m>:FUNCtion:BPOWer[:STATe] on page 211
CALCulate<n>:DELTamarker<m>:FUNCtion:BPOWer[:STATe] on page 212
6.4.4.2 Marker Peak List
Access: "Overview" > "Analysis" > "Marker Functions" > "Marker Peak List"
Or: [MKR] > "Select Marker Function" > "Marker Peak List"
A common measurement task is to determine peak values, i.e. maximum or minimum
signal levels. The R&S FPL1000 provides various peak search functions and applications:
●
Setting a marker to a peak value once (Peak Search)
●
Searching for a peak value within a restricted search area (Search Limits)
●
Creating a marker table with all or a defined number of peak values for one sweep
(Marker Peak List)
●
Updating the marker position to the current peak value automatically after each
sweep (Auto Peak Search)
The result is a power level in relation to the bandwidth, displayed in
dBm/Hz.
Peak search limits
The peak search can be restricted to a search area. The search area is defined by limit
lines which are also indicated in the diagram. In addition, a minimum value (threshold)
can be defined as a further search condition.
When is a peak a peak? - Peak excursion
During a peak search, for example when a marker peak table is displayed, noise values may be detected as a peak if the signal is very flat or does not contain many
peaks. Therefore, you can define a relative threshold ( "Peak Excursion" ). The signal
level must increase by the threshold value before falling again before a peak is detected. To avoid identifying noise peaks as maxima or minima, enter a peak excursion
value that is higher than the difference between the highest and the lowest value measured for the displayed inherent noise.
Effect of peak excursion settings (example)
The following figure shows a trace to be analyzed.
95User Manual 1178.3386.02 ─ 10
Page 96

R&S®FPL1000
Analysis
Marker Usage
Figure 6-2: Trace example
The following table lists the peaks as indicated by the marker numbers in the diagram
above, as well as the minimum decrease in amplitude to either side of the peak:
Marker # Min. amplitude decrease to either side of the signal
1 80 dB
2 80 dB
3 55 dB
4 39 dB
5 32 dB
In order to eliminate the smaller peaks M3, M4 and M5 in the example above, a peak
excursion of at least 60 dB is required. In this case, the amplitude must rise at least
60 dB before falling again before a peak is detected.
Marker peak list
The marker peak list determines the frequencies and levels of peaks in the spectrum. It
is updated automatically after each sweep. How many peaks are displayed can be
defined, as well as the sort order. In addition, the detected peaks can be indicated in
the diagram. The peak list can also be exported to a file for analysis in an external
application.
96User Manual 1178.3386.02 ─ 10
Page 97

R&S®FPL1000
Analysis
Marker Usage
Remote commands:
CALCulate<n>:MARKer<m>:FUNCtion:FPEaks:STATe on page 215
TRAC? LIST, see TRACe<n>[:DATA]? on page 221
Peak List State .............................................................................................................97
Sort Mode .....................................................................................................................97
Maximum Number of Peaks .........................................................................................98
Peak Excursion ............................................................................................................ 98
Display Marker Numbers ..............................................................................................98
Export Peak List ...........................................................................................................98
Peak List State
Activates/deactivates the marker peak list. If activated, the peak list is displayed and
the peaks are indicated in the trace display.
For each listed peak the frequency/time ( "X-value" ) and level ( "Y-Value" ) values are
given.
Remote command:
CALCulate<n>:MARKer<m>:FUNCtion:FPEaks:STATe on page 215
Sort Mode
Defines whether the peak list is sorted according to the x-values or y-values. In either
case the values are sorted in ascending order.
97User Manual 1178.3386.02 ─ 10
Page 98

R&S®FPL1000
Analysis
Marker Usage
Remote command:
CALCulate<n>:MARKer<m>:FUNCtion:FPEaks:SORT on page 215
Maximum Number of Peaks
Defines the maximum number of peaks to be determined and displayed.
Remote command:
CALCulate<n>:MARKer<m>:FUNCtion:FPEaks:LIST:SIZE on page 214
Peak Excursion
Defines the minimum level value by which a signal must rise or fall so that it is identified as a maximum or a minimum by the search functions.
Entries from 0 dB to 80 dB are allowed; the resolution is 0.1 dB. The default setting for
the peak excursion is 6 dB.
For Analog Modulation Analysis, the unit and value range depend on the selected
result display type.
For more information, see Chapter 6.4.4.2, "Marker Peak List", on page 95.
Remote command:
CALCulate<n>:MARKer<m>:PEXCursion on page 190
Display Marker Numbers
By default, the marker numbers are indicated in the diagram so you can find the peaks
from the list. However, for large numbers of peaks the marker numbers may decrease
readability; in this case, deactivate the marker number display.
Remote command:
CALCulate<n>:MARKer<m>:FUNCtion:FPEaks:ANNotation:LABel[:STATe]
on page 213
Export Peak List
The peak list can be exported to an ASCII file (.DAT) for analysis in an external application.
Remote command:
MMEMory:STORe<n>:PEAK on page 216
FORMat:DEXPort:DSEParator on page 224
6.4.4.3 Deactivating All Marker Functions
Access: "Overview" > "Analysis" > "Marker Functions" > "All Functions Off"
Or: [MKR] > "All Functions Off"
All special marker functions can be deactivated in one step.
Remote command:
98User Manual 1178.3386.02 ─ 10
Page 99

R&S®FPL1000
7 How to Perform Measurements in the I/Q
7.1 How to Capture Baseband (I/Q) Data as RF Input
How to Perform Measurements in the I/Q Analyzer Application
How to Capture Baseband (I/Q) Data as RF Input
Analyzer Application
The following step-by-step instructions demonstrate how to capture I/Q data on the
R&S FPL1000 and how to analyze data in the I/Q Analyzer application.
● How to Capture Baseband (I/Q) Data as RF Input..................................................99
● How to Analyze Data in the I/Q Analyzer..............................................................100
By default, the I/Q Analyzer assumes the I/Q data is modulated on a carrier frequency
and input via the "RF Input" connector on the R&S FPL1000.
1. Select the [MODE] key and select the "I/Q Analyzer" application.
2. Select the "Overview" softkey to display the "Overview" for an I/Q Analyzer mea-
surement.
3. Select the "Input" button to select and configure the "RF Input" signal source.
4. Select the "Amplitude" button to define the attenuation, reference level or other set-
tings that affect the input signal's amplitude and scaling.
5. Select the "Frequency" button to define the input signal's center frequency.
6. Optionally, select the "Trigger" button and define a trigger for data acquisition, for
example an I/Q Power trigger to start capturing data only when a specific power is
exceeded.
7. Select the "Bandwidth" button and define the bandwidth parameters for data acqui-
sition:
● "Sample Rate" or "Analysis Bandwidth" the span of the input signal to be captured for analysis, or the rate at which samples are captured (both values are
correlated)
● "Measurement Time" how long the data is to be captured
● "Record Length" : the number of samples to be captured (also defined by sample rate and measurement time)
8. Select the "Display Config" button and select up to six displays that are of interest
to you.
Arrange them on the display to suit your preferences.
9. Exit the SmartGrid mode.
10. Start a new sweep with the defined settings.
a)
Select the Sequencer icon (
b) Set the Sequencer state to "Off" .
) from the toolbar.
99User Manual 1178.3386.02 ─ 10
Page 100

R&S®FPL1000
7.2 How to Analyze Data in the I/Q Analyzer
How to Perform Measurements in the I/Q Analyzer Application
How to Analyze Data in the I/Q Analyzer
c) Select the [RUN SINGLE] key.
1. Select the [MODE] key and select the "I/Q Analyzer" application.
2. Select the "Overview" softkey to display the "Overview" for an I/Q Analyzer measurement.
3. Select the "Display Config" button and select up to six displays that are of interest
to you.
Arrange them on the display to suit your preferences.
4. Exit the SmartGrid mode and select the "Overview" softkey to display the "Overview" again.
5. Select the "Analysis" button in the "Overview" to make use of the advanced analysis functions in the displays.
● Configure a trace to display the average over a series of sweeps (on the
"Trace" tab; if necessary, increase the "Average Count" ).
● Configure markers and delta markers to determine deviations and offsets within
the signal (on the "Marker" tab).
100User Manual 1178.3386.02 ─ 10
 Loading...