

Page 1

R&S®FPC
Spectrum Analyzer
User Manual
(;ÜYN2)
1178413002
User Manual
Version 07
Page 2

This document describes the following R&S®FPC models and options:
●
R&S®FPC1000 (1328.6660.02)
●
R&S®FPC1500 (1328.6660.03)
●
R&S®FPC-B22 Preamplifier (1328.6690.02)
●
R&S®FPC-B200 Wi-Fi Support (1328.6990.02)
●
R&S®FPC-K7 AM, FM, ASK, FSK demodulation (1328.6748.02)
●
R&S®FPC-K42 Vector Network Analysis (1328.7396.02)
●
R&S®FPC-K43 Receiver (1328.6754.02)
●
R&S®FPC-K55 Advanced Measurements (1328.6760.02)
The contents of this manual correspond to firmware version 1.40 and later.
Page 3

1
Risk of injury and instrument damage
The instrument must be used in an appropriate manner to prevent
personal injury or instrument damage.
● Do not open the instrument casing.
● Read and observe the "Basic Safety Instructions" delivered as
printed brochure with the instrument.
● Read and observe the safety instructions in the following sections.
Note that the data sheet may specify additional operating conditions.
● Keep the "Basic Safety Instructions" and the product documentation
in a safe place and pass them on to the subsequent users.
Riesgo de lesiones y daños en el instrumento
El instrumento se debe usar de manera adecuada para prevenir
descargas eléctricas, incendios, lesiones o daños materiales.
● No abrir la carcasa del instrumento.
● Lea y cumpla las "Instrucciones de seguridad elementales"
suministradas con el instrumento como folleto impreso.
● Lea y cumpla las instrucciones de seguridad incluidas en las
siguientes secciones. Se debe tener en cuenta que las
especificaciones técnicas pueden contener condiciones adicionales
para su uso.
● Guarde bien las instrucciones de seguridad elementales, así como
la documentación del producto, y entréguelas a usuarios
posteriores.
Safety Instructions
Instrucciones de seguridad
Sicherheitshinweise
Consignes de sécurité
1171.1307.42 - 05
Page 4

2
Gefahr von Verletzungen und Schäden am Gerät
Betreiben Sie das Gerät immer ordnungsgemäß, um elektrischen
Schlag, Brand, Verletzungen von Personen oder Geräteschäden zu
verhindern.
● Öffnen Sie das Gerätegehäuse nicht.
● Lesen und beachten Sie die "Grundlegenden Sicherheitshinweise",
die als gedruckte Broschüre dem Gerät beiliegen.
● Lesen und beachten Sie die Sicherheitshinweise in den folgenden
Abschnitten; möglicherweise enthält das Datenblatt weitere
Hinweise zu speziellen Betriebsbedingungen.
● Bewahren Sie die "Grundlegenden Sicherheitshinweise" und die
Produktdokumentation gut auf und geben Sie diese an weitere
Benutzer des Produkts weiter.
Risque de blessures et d'endommagement de l'appareil
L'appareil doit être utilisé conformément aux prescriptions afin d'éviter
les électrocutions, incendies, dommages corporels et matériels.
● N'ouvrez pas le boîtier de l'appareil.
● Lisez et respectez les "consignes de sécurité fondamentales"
fournies avec l’appareil sous forme de brochure imprimée.
● Lisez et respectez les instructions de sécurité dans les sections
suivantes. Il ne faut pas oublier que la fiche technique peut indiquer
des conditions d’exploitation supplémentaires.
● Gardez les consignes de sécurité fondamentales et la
documentation produit dans un lieu sûr et transmettez ces
documents aux autres utilisateurs.
1171.1307.42 - 05
Page 5

Customer Support
Technical support – where and when you need it
For quick, expert help with any Rohde & Schwarz equipment, contact one of our Customer Support
Centers. A team of highly qualified engineers provides telephone support and will work with you to find a
solution to your query on any aspect of the operation, programming or applications of Rohde & Schwarz
equipment.
Up-to-date information and upgrades
To keep your instrument up-to-date and to be informed about new application notes related to your
instrument, please send an e-mail to the Customer Support Center stating your instrument and your wish.
We will take care that you will get the right information.
1171.0200.22-06.00
Page 6

R&S®FPC
Contents
Contents
1 Documentation Overview......................................................................7
2 Regulatory Information..........................................................................9
3 Preparing for Use.................................................................................10
3.1 Unpacking and Checking the Instrument................................................................. 11
3.2 Placing or Mounting the Instrument..........................................................................12
3.3 Connecting AC Power................................................................................................ 13
3.4 Turning the R&S FPC on and off................................................................................13
4 Instrument Tour....................................................................................15
4.1 Front Panel.................................................................................................................. 15
4.2 Rear Panel....................................................................................................................17
5 Operation.............................................................................................. 19
5.1 Manual Operation........................................................................................................19
5.2 Screen Layout............................................................................................................. 22
5.3 Remote Operation....................................................................................................... 25
6 Firmware Update..................................................................................32
7 Firmware Options.................................................................................34
8 Preset.................................................................................................... 37
9 Instrument Setup..................................................................................39
9.1 BNC Connector Usage................................................................................................39
9.2 Network Configuration............................................................................................... 39
9.3 Date and Time..............................................................................................................41
9.4 Regional Settings........................................................................................................42
9.5 Display Settings.......................................................................................................... 43
9.6 Audio Settings.............................................................................................................43
9.7 Power Settings............................................................................................................ 44
10 Data Management................................................................................ 46
11 Signal Source Configuration...............................................................52
12 Calibration............................................................................................ 54
3User Manual 1178.4130.02 ─ 07
Page 7

R&S®FPC
Contents
13 Measurement Wizard........................................................................... 59
14 The Spectrum Application...................................................................66
14.1 Configuration Overview..............................................................................................66
14.2 Measurements and Result Displays..........................................................................68
14.3 Frequency Configuration........................................................................................... 93
14.4 Amplitude Configuration............................................................................................ 98
14.5 Bandwidth Configuration......................................................................................... 106
14.6 Sweep Configuration................................................................................................ 109
14.7 Trigger Configuration................................................................................................112
14.8 Trace Configuration.................................................................................................. 113
14.9 Marker Configuration................................................................................................ 119
14.10 Marker Functions...................................................................................................... 125
14.11 Display Lines.............................................................................................................129
14.12 Limit Lines................................................................................................................. 130
15 The Receiver Application.................................................................. 134
15.1 Measurements and Result Displays........................................................................134
15.2 Frequency Configuration......................................................................................... 138
15.3 Amplitude Configuration.......................................................................................... 142
15.4 Bandwidth Configuration......................................................................................... 143
15.5 Sweep Configuration................................................................................................ 144
15.6 Trace Configuration.................................................................................................. 144
15.7 Limit Lines................................................................................................................. 145
15.8 Marker Configuration................................................................................................145
16 Analog Demodulation........................................................................147
16.1 Measurements and Result Displays........................................................................147
16.2 Frequency Configuration......................................................................................... 150
16.3 Amplitude Configuration.......................................................................................... 150
16.4 Bandwidth Configuration......................................................................................... 151
16.5 Sweep Configuration................................................................................................ 155
16.6 Limits..........................................................................................................................156
17 Digital Demodulation......................................................................... 158
17.1 Measurements and Result Displays........................................................................158
4User Manual 1178.4130.02 ─ 07
Page 8

R&S®FPC
Contents
17.2 Measurement Configuration.................................................................................... 163
17.3 Frequency Configuration......................................................................................... 166
17.4 Amplitude Configuration.......................................................................................... 167
17.5 Sweep Configuration................................................................................................ 168
17.6 Trigger Configuration............................................................................................... 169
18 Vector Network Analyzer...................................................................170
18.1 Measurements and Result Displays........................................................................170
18.2 Frequency Configuration......................................................................................... 179
18.3 Amplitude Configuration.......................................................................................... 181
18.4 Bandwidth Configuration......................................................................................... 182
18.5 Sweep Configuration................................................................................................ 183
18.6 Trace Configuration.................................................................................................. 184
18.7 Marker Configuration................................................................................................184
18.8 Limit Line Configuration...........................................................................................186
19 Remote Control.................................................................................. 187
19.1 Remote Control Basics.............................................................................................187
19.2 Common Commands................................................................................................ 202
19.3 Preset......................................................................................................................... 206
19.4 Network Connection................................................................................................. 207
19.5 System Configuration...............................................................................................209
19.6 Display Settings........................................................................................................ 215
19.7 Audio Settings...........................................................................................................215
19.8 Data Management..................................................................................................... 216
19.9 Signal Source Configuartion....................................................................................226
19.10 Calibration................................................................................................................. 228
19.11 Applications...............................................................................................................231
19.12 Remote Commands of the Spectrum Application................................................. 232
19.13 Remote Commands of the Receiver Application................................................... 295
19.14 Remote Commands of the Analog Demodulation................................................. 303
19.15 Remote Commands of the Digital Demodulation...................................................313
19.16 Remote Commands of the VNA Application.......................................................... 323
19.17 Status Reporting System......................................................................................... 341
5User Manual 1178.4130.02 ─ 07
Page 9

R&S®FPC
Contents
20 Function Reference............................................................................355
20.1 Function Reference: Setup...................................................................................... 355
20.2 Function Reference: Data Management..................................................................358
20.3 Function Reference: Mode Selection...................................................................... 359
20.4 Function Reference: Spectrum Application........................................................... 360
20.5 Function Reference: Receiver Application.............................................................377
20.6 Function Reference: Analog Demodulation........................................................... 387
20.7 Function Reference: Digital Demodulation............................................................ 391
20.8 Function Reference: Vector Network Analyzer...................................................... 395
List of Commands..............................................................................406
Index....................................................................................................413
6User Manual 1178.4130.02 ─ 07
Page 10

R&S®FPC
Documentation Overview
1 Documentation Overview
This section provides an overview of the R&S FPC user documentation. You can find it
on the product page at:
www.rohde-schwarz.com/manual/fpc
Getting started manual
Introduces the R&S FPC and describes how to set up and start working with the product. A printed version is included in the delivery.
User manual
The user manual contains the description of all instrument modes and functions. It also
provides an introduction to remote control, a complete description of the remote control
commands with programming examples, and information on maintenance, instrument
interfaces and error messages.
In addition to the R&S FPC user manual, there is a separate user manual for the
R&S InstrumentView software package. This manual contains a description of all features of the R&S InstrumentView software package.
The online version (html format) of the user manual provides the complete contents for
immediate display on the internet.
The user manual is also integrated into the firmware (.chm format). You can export the
file to a memory stick ("Setup" > "User Preferences" > "Export Documentation". After
the export, you can connect the memory stick to a PC and read the .chm file.
Service manual
Describes the performance test for checking the rated specifications, module replacement and repair, firmware update, troubleshooting and fault elimination, and contains
mechanical drawings and spare part lists.
The service manual is available for registered users on the global Rohde & Schwarz
information system (GLORIS, https://gloris.rohde-schwarz.com).
Basic safety instructions
Contains safety instructions, operating conditions and further important information.
The printed document is included in the delivery.
Data sheet and brochure
The data sheet contains the technical specifications of the R&S FPC. It also lists the
options and their order numbers as well as optional accessories.
The brochure provides an overview of the R&S FPC and shows its specific characteristics.
7User Manual 1178.4130.02 ─ 07
Page 11

R&S®FPC
Documentation Overview
Release notes and open source acknowledgment
The release notes list new features, improvements and known issues of the current
firmware version, and describe the firmware installation.
The open source acknowledgment document provides verbatim license texts of the
used open source software.
www.rohde-schwarz.com/manual/fpc
The open source acknowledgement is also integrated into the firmware (.chm format).
You can export the file to a memory stick ("Setup" > "User Preferences" > "Export Documentation". After the export, you can connect the memory stick to a PC and read
the .chm file.
Application notes, application cards, white papers, etc.
These documents contain information about possible applications and background
information on various topics, see www.rohde-schwarz.com/appnotes.
Calibration certificates
The calibration certificates of your device are available online. Visit the R&S FPC product page and select the item to download the calibration certificate. You will be forwarded to a Gloris page.
https://gloris.rohde-schwarz.com/calcert
Enter the device ID of your R&S FPC and download the certificate. You can find the
device ID either in the "Setup" menu or on the label on the rear panel.
8User Manual 1178.4130.02 ─ 07
Page 12

R&S®FPC
Regulatory Information
2 Regulatory Information
You can access the regulatory information in the firmware of the R&S FPC.
1. Press the "Setup" key.
The R&S FPC opens the "Instrument Setup" menu.
2. Select the "Regulatory Information" menu item in the "WiFi" category with the
"Enter" key.
The R&S FPC shows the regulations it complies with.
9User Manual 1178.4130.02 ─ 07
Page 13

R&S®FPC
Preparing for Use
3 Preparing for Use
The R&S FPC is designated for use in industrial, administrative and laboratory environments. Use the R&S FPC only for its designated purpose. Observe the safety and
usage instructions documented in the operating manual, as well as the operating conditions and performance limits stated in the data sheet.
Make sure to consider the following information before using the R&S FPC for the first
time.
Risk of injury due to disregarding safety information
Observe the information on appropriate operating conditions provided in the data sheet
to prevent personal injury or damage to the instrument. Read and observe the basic
safety instructions provided with the instrument, in addition to the safety instructions in
the following sections. In particular:
●
Do not open the instrument casing.
Risk of instrument damage due to inappropriate operating conditions
Specific operating conditions are required to ensure accurate measurements and to
avoid damage to the instrument. Observe the information on appropriate operating
conditions provided in the basic safety instructions and the instrument's data sheet.
Instrument damage caused by electrostatic discharge
Electrostatic discharge (ESD) can damage the electronic components of the instrument
and the device under test (DUT). Electrostatic discharge is most likely to occur when
you connect or disconnect a DUT or test fixture to the instrument's test ports. To prevent electrostatic discharge, use a wrist strap and cord and connect yourself to the
ground, or use a conductive floor mat and heel strap combination.
10User Manual 1178.4130.02 ─ 07
Page 14

R&S®FPC
Preparing for Use
Unpacking and Checking the Instrument
Risk of instrument damage during operation
An unsuitable operating site or test setup can damage the instrument and connected
devices. Ensure the following operating conditions before you switch on the instrument:
●
The instrument is dry and shows no sign of condensation.
●
The instrument is positioned as described in the following sections.
●
The ambient temperature does not exceed the range specified in the data sheet.
●
Signal levels at the input connectors are all within the specified ranges.
●
Signal outputs are correctly connected and are not overloaded.
EMI impact on measurement results
Electromagnetic interference (EMI) may affect the measurement results.
To suppress generated electromagnetic interference (EMI):
●
Use suitable shielded cables of high quality. For example, use double-shielded RF
and LAN cables.
●
Always terminate open cable ends.
●
Note the EMC classification in the data sheet.
3.1 Unpacking and Checking the Instrument
Unpack the R&S FPC carefully and check the contents of the package.
●
Check if all items listed on the delivery note, including the getting started manual,
are included in the delivery.
●
Check the R&S FPC for any damage.
If the contents are damaged, immediately contact the carrier who delivered the
package.
●
Keep the box and packing material.
11User Manual 1178.4130.02 ─ 07
Page 15

R&S®FPC
Preparing for Use
Placing or Mounting the Instrument
Risk of instrument damage during transportation and shipment
Insufficient protection against mechanical and electrostatic effects during transportation
and shipment can damage the instrument.
●
Always make sure that sufficient mechanical and electrostatic protection is provided.
●
When shipping an instrument, use the original packaging. If it is not available, allow
for sufficient padding to prevent the instrument from moving around inside the box.
Pack the instrument in antistatic wrap to protect it from electrostatic charging.
●
Secure the instrument to prevent any movement and other mechanical effects during transportation.
Packing material
Retain the original packing material. If the instrument needs to be transported or shipped later, you can use the material to protect the control elements and connectors.
3.2 Placing or Mounting the Instrument
The R&S FPC is designed for use under laboratory conditions, either on a bench top or
in a rack.
Benchtop operation
If the R&S FPC is operated on a bench top, the surface should be flat. The instrument
can be used in horizontal position, standing on its feet, or with the support feet on the
bottom extended.
Mounting the R&S FPC in a rack
The R&S FPC can be installed in the 19" rack mount kit R&S ZZA-FPC1 (order no.
1328.7080.02). The installation instructions are part of the adapter kit.
12User Manual 1178.4130.02 ─ 07
Page 16

R&S®FPC
Preparing for Use
Turning the R&S
Risk of injury if feet are folded out
The feet can fold in if they are not folded out completely or if the instrument is shifted.
This can cause damage or injury.
●
Fold the feet completely in or out to ensure stability of the instrument. Never shift
the instrument when the feet are folded out.
●
When the feet are folded out, do not work under the instrument or place anything
underneath.
●
The feet can break if they are overloaded. The overall load on the folded-out feet
must not exceed 200 N.
F
max
FPC on and off
3.3 Connecting AC Power
The AC power connector on the rear panel of the R&S FPC allows you to connect it to
the primary power supply.
Included in the delivery of the R&S FPC are several common power plug types.
1. Select the cable with the plug type you need and firmly connect it to the R&S FPC.
2. Connect the AC plug to the power outlet to supply the R&S FPC with power.
The R&S FPC is assembled in line with the specifications for safety class
EN61010. Therefore, it may only be connected to an outlet that has a ground contact.
The AC power supply has the following characteristics.
● Line voltage: 100 V AC to 240 V AC
● Line frequency: 50 Hz to 60 Hz; 400 Hz
● Current: 0.6 A to 0.4 A
3.4 Turning the R&S FPC on and off
After you have established a connection to the power supply, you can turn on the
R&S FPC.
13User Manual 1178.4130.02 ─ 07
Page 17

R&S®FPC
Preparing for Use
Turning the R&S FPC on and off
Turning on the R&S FPC
► Turn on the main AC power switch on the rear panel of the R&S FPC (position "I").
The instrument is now supplied with AC power.
● "Power" key is highlighted orange: R&S FPC is in standby mode (main AC
power switch is in position "I").
● "Power" key is highlighted green: R&S FPC is running and ready for operation.
Turning off the R&S FPC
► Turn off the main AC power switch on the rear panel of the R&S FPC (position
"O").
The instrument is no longer supplied with AC power.
Changing the AC supply fuse
Only fuses of the type 2A T IEC60127-2/V should be used.
1. Disconnect the power cable.
2. Open the flap covering the voltage selector using a small screwdriver (or similar).
3. Remove the cylinder labeled with the nominal voltages. Remove the fuse and
install the new one. Reinsert the cylinder so that the value visible through the hole
in the cover flap is the same nominal voltage as before.
4. Close the flap.
14User Manual 1178.4130.02 ─ 07
Page 18

R&S®FPC
Instrument Tour
Front Panel
4 Instrument Tour
The R&S FPC has various connectors on the front and rear panel.
4.1 Front Panel
1 632 5 74
Figure 4-1: Front panel of the R&S FPC
1 = USB ports (type A)
2 = Headphone jack
3 = Softkeys
4 = Signal source output
5 = Function keys and alphanumeric keypad
6 = RF input
7 = Power switch
Instrument damage caused by cleaning agents
Cleaning agents contain substances such as solvents (thinners, acetone, etc.), acids,
bases, or other substances. Solvents can damage the front panel labeling, plastic
parts, or screens, for example.
Never use cleaning agents to clean the outside of the instrument. Use a soft, dry, lintfree dust cloth instead.
Power switch
The power switch turns the R&S FPC on and off when it is supplied with power.
For more information, see Chapter 3.4, "Turning the R&S FPC on and off", on page 13.
15User Manual 1178.4130.02 ─ 07
Page 19

R&S®FPC
Instrument Tour
Front Panel
RF input
The RF input with an impedance of 50 Ω allows you to connect a DUT to the
R&S FPC. Typically, you connect the DUT with a cable and an appropriate connector
(for example a male N connector).
The frequency range of the RF input is specified in the datasheet.
The attenuation range is between 0 dB and 40 dB.
Risk of instrument damage
Make sure not to overload the RF input and keep within the maximum allowed signal
levels. Refer to the datasheet for the maximum allowed signal levels.
A DC input voltage of 50 V must never be exceeded.
Signal source output
Available on the R&S FPC1500.
The "Signal Source" output allows you to generate a signal that can be fed into the
DUT or other external accessories like frequency dividers or amplifiers. You can connect the DUT or accessories with a cable that has a male N connector.
Risk of instrument damage
The maximum supported reverse power is 23 dBm. Make sure that this value is not
exceeded to avoid damage to the R&S FPC.
Headphone jack
The female headphone jack allows you to connect headphones (or external speakers)
with a miniature jack plug.
You can control the output voltage with the volume control integrated into the firmware.
Refer to the user manual for details.
If you connect headphones or external speakers, the R&S FPC automatically turns off
the internal speaker.
Risk of hearing damage
Before putting on the headphones, make sure that the volume setting is not too high to
protect your hearing.
16User Manual 1178.4130.02 ─ 07
Page 20

R&S®FPC
Instrument Tour
Rear Panel
USB ports (type A)
The two USB 2.0 ports on the front panel (type A) allow you to connect devices like
memory sticks.
Function keys and alphanumeric keypad
The function keys provide access to the measurement settings and functions. The
alphanumeric keypad allows you to enter alphanumeric data if necessary.
Refer to the user manual for a comprehensive description of the function keys.
Softkeys
The softkeys allow you to access measurement settings and functions.
Softkeys are dynamic. A different list of softkeys is displayed depending on the
selected function key. A list of softkeys for a certain function key is also called a menu.
Softkeys can either perform a specific function or open a dialog box.
Refer to the user manual for a comprehensive description of the function keys.
4.2 Rear Panel
Figure 4-2: Rear panel of the R&S
1 = Trigger input / external reference
2 = LAN
3 = USB port (type B)
4 = Power supply
FPC
1 432
17User Manual 1178.4130.02 ─ 07
Page 21

R&S®FPC
Instrument Tour
Rear Panel
Power supply
The AC power supply and main power switch are located in a unit on the rear panel of
the instrument.
The main power switch has the following states.
●
Position "1": The instrument is supplied with power.
●
Position "0": The instrument is disconnected from the power supply.
Trigger input / external reference
This female BNC connector allows you to connect an external trigger signal or an
external reference signal.
When you are using the connector as a trigger input, you can trigger measurements
with an external trigger. For more information about triggered measurements, refer to
the user manual.
Alternatively, you can use the connector to connect a 10 MHz reference signal to synchronize the frequency with the external reference. Note that the reference signal must
be stronger than 0 dBm.
LAN
The LAN interface allows you to connect the R&S FPC to a local network for remote
control, printouts or data transfer. The assignment of the RJ-45 connector supports
twisted-pair category 5 UTP/STP cables in a star configuration (UTP stands for
unshielded twisted pair, and STP for shielded twisted pair).
USB port (type B)
The USB port (type B) allows you to connect the R&S FPC to a computer and establish
a remote control connection.
18User Manual 1178.4130.02 ─ 07
Page 22

R&S®FPC
Operation
Manual Operation
5 Operation
You can operate the R&S FPC manually with the keys available on its front panel, or
remotely from another computer.
● Manual Operation....................................................................................................19
● Screen Layout.........................................................................................................22
● Remote Operation...................................................................................................25
5.1 Manual Operation
The front panel of the R&S FPC provides various types of buttons (or keys) on its front
panel that allow you operate it manually.
Using function keys
Function keys are the group of keys with a light grey background.
Figure 5-1: Function keys
Pressing one of the function keys opens a list of parameters on the display that contains settings that thematically belong together. This list of parameters is also referred
to as a menu.
For example, pressing the "Freq" key opens the "Frequency" menu that contains
parameters to configure the frequency characteristics of the measurement.
The contents of the menu depend on the measurement application that you are using.
For example, the "Frequency" menu in the spectrum application looks different than the
"Frequency" menu of the analog demodulation application.
Exceptions are the "Preset" key and the camera key. These do not open a menu, but
initiate an action (performing a preset and taking a screenshot, respectively).
You can modify a specific parameter (menu item) with one of the softkeys.
Using softkeys
Softkeys are the group of keys to the right of the display.
Pressing one of the softkeys allows you to modify the properties of the parameter that
is displayed next to it. The parameter assigned to each softkey is variable and depends
on the function key that you pressed last.
For example, when you press the "Freq" function key in the spectrum application, the
first item in the menu is the "Center Frequency". When you press the softkey next to
19User Manual 1178.4130.02 ─ 07
Page 23

R&S®FPC
Operation
Manual Operation
that menu item, the R&S FPC opens an input field that allows you to change the center
frequency.
Depending on the parameter, pressing a softkey has one of the following effects.
●
It opens an input field that allows you to modify a parameter by entering a specific
value. When an input field is open, the corresponding menu item turns orange.
Example: Pressing the "Freq" key and selecting the "Center Frequency" menu item
opens an input field.
Figure 5-2: Softkey turns orange when an input field is open
Pressing the softkey again, closes the input field. If you have changed the value in
the input field, the new value is adopted.
Figure 5-3: Softkey turns grey when the input field is closed
●
It opens a submenu which contains another list of parameters that thematically
belong together.
A softkey that opens a submenu shows an arrow (">") in its label.
Example: Pressing the "Freq" key opens the "Frequency" menu. The second softkey in the list ("Center Freq Step Size") opens a submenu.
Figure 5-4: Softkey with an arrow opens a submenu
●
It initiates some kind of action.
Example: Pressing the "Span" key and selecting the "Full Span" menu item
restores the full frequency span.
●
It changes the state of something (like a toggle button).
The corresponding menu item turns light blue when its state is "on".
Example: Pressing the "BW" key and selecting the "RBW: Auto" menu item turns
automatic selection of the resolution bandwidth on and off.
Figure 5-5: Softkey in the "on" (left) and "off" (right) state
●
It opens a dialog box that contains additional settings.
Example: Pressing the "Setup" key and selecting the "Instrument Setup" menu item
opens a dialog box to configure general instrument properties like date and time.
Using input keys
Input keys are the group of keys with a dark grey background.
20User Manual 1178.4130.02 ─ 07
Page 24

R&S®FPC
Operation
Manual Operation
Figure 5-6: Input keys
The input keys only have an effect when any kind of input field is active on the display.
There are several types of input keys.
●
Alphanumeric keys
The alphanumeric keys allow you to enter numeric values or characters: the numbers from 0 to 9, the alphabet, a minus and plus sign and a dot. Pressing the number 0 repeatedly allows you to enter an empty space and an underscore.
Press the corresponding key to enter a numeric value. In case of numeric values,
each key covers just the number that is printed on it. You can enter negative values
with the minus sign key and enter values that contain decimal places with the dot
key.
Example: Press the "Freq" key and select the "Center Frequency" menu item.
Enter a number with the alphanumeric keys.
If you need to enter a character (for example for file names), the key assignment
changes. Each key covers one number and more than one character with the first
choice being a lower case character. If you need to enter a character, press the key
several times until the character you require is selected.
Example: Press the "Freq" key and select the "User Preference" menu item. In the
dialog box, select the "Site Name" menu item and enter some characters (for
"Home", for example, press 6x"4", 3x"6", 1x"6" and 2x"9").
An empty space or special characters like _ ! @ # $ % ^ & * = ? are available by
pressing the "0" key several times.
●
Unit keys
The unit keys confirm entries of values that have a unit. The units assigned to each
key are indicated on the key itself or next to the key.
Example: Press the "Freq" key and select the "Center Frequency" menu item. To
define a center frequency of 100 MHz, enter "100" and confirm with the [MHz] key.
●
Escape key
The "Esc" key cancels entries and closes the input field. The firmware does not
adopt the entry you have made.
●
Backspace key
The "Backspace" key ( ) moves the cursor one position backwards and deletes
the character / number that was in that place.
Tip: If an input field is visible, the backspace key toggles between the last two
entries. Using this feature, you can, for example, quickly toggle between two center
frequencies.
●
"Enter" key ("✓")
The "✓" key confirms an entry you have made.
21User Manual 1178.4130.02 ─ 07
Page 25

R&S®FPC
Operation
Screen Layout
If you confirm a value that has a unit with the "✓" key, the R&S FPC always uses
the highest possible unit (for example GHz or s).
In addition, the group of input keys also contains cursor keys and the rotary knob.
Using the cursor keys
The cursor keys do several things, depending on the situation when you use them.
●
The cursor keys navigate through dialog boxes.
●
The up and down keys increase or decrease any kind of numeric value if an input
field is active.
The cursor keys change numeric values with a fix step size.
●
The up and down keys move markers around.
The step size is fix.
●
The left and right keys move the cursor in an input field in the corresponding direction.
Using the rotary knob
The rotary knob does several things, depending on the situation when you use it.
●
The rotary knob works like a cursor key in dialog boxes. In that case, you can navigate to one of the items with the rotary knob. If the dialog box covers more than
one screen page, it also scrolls through the dialog box.
Turning it to the right corresponds to a downward movement. Moving it to the left to
an upward movement.
●
The rotary knob increases or decreases any kind of numeric value if an input field
is active.
Turning it to the right corresponds to an increase, turning it to the left to a decrease
of a numeric value.
The rotary knob changes numeric values with a fix step size.
●
The rotary knob moves markers around in the diagram area.
To do so, you have to select a marker first. The step size is fix.
●
Pressing the rotary knob has the same effect as pressing the "✓" key and confirms
an entry or selection.
5.2 Screen Layout
The following image shows the screen layout in the spectrum application. It shows all
elements that are the same in all applications of the R&S FPC. If an application or
measurement has a completely different layout or elements, the differences are noted
in the description of those.
22User Manual 1178.4130.02 ─ 07
Page 26

R&S®FPC
Operation
Screen Layout
1 2 3
4
5
6
7
8
9
10 11 12 13 14 10
Figure 5-7: Screen layout in the spectrum application
1 = Title bar
2 = Input field
3 = Softkeys
4 = Measurement settings
5 = Trace information
6 = Marker information
7 = Limit line information
8 = Diagram area
9 = X-axis information
10 = Sweep count
11 = Trace
12 = Delta marker
13 = Limit line
14 = Marker
15 = Star icon
Title bar
The title bar shows the application that you are currently using as well as the date and
time.
Input field
An input field opens when you select a feature that requires you to enter a value. The
header of the input field shows the name of the softkey menu you have currently
selected. If no input field is open, the R&S FPC just shows the name of the softkey
menu you have currently selected.
Softkey menu
Softkeys provide access to measurement settings and functions. They are dynamic: a
different list of softkeys is displayed depending on the selected function key. A list of
softkeys for a certain function key is also called a menu.
23User Manual 1178.4130.02 ─ 07
Page 27

R&S®FPC
Operation
Screen Layout
Softkeys can either perform a specific function or open an input field or dialog box.
Measurement settings bar
The measurement settings bar contains information about the current measurement
settings. A blue dot in front of a setting indicates that automatic selection for that setting has been turned off.
Trace information
The trace information indicates the current trace configuration for each active trace
(trace color, trace number, trace mode and detector).
Table 5-1: Overview of trace modes
Abbreviation Detector
Clrw Clear / write trace mode
Max Max hold trace mode
Min Min hold trace mode
Avg Average trace mode
View View trace mode
No label Blank trace mode (trace is off)
Table 5-2: Overview of detectors
Abbreviation Detector
AP Auto peak detector
Pk Max peak detector
Mi Min peak detector
Rm RMS detector
Sa Sample detector
QP Quasipeak detector (receiver only)
Marker information
The marker information indicates the position of each active marker. If a marker function is active, it also shows the result for that marker function.
Limit line information
The limit line information indicates the characteristics of any active limit line (type of
limit line, name of limit line etc.), including the result of a limit check (pass or fail).
Diagram area
The diagram area contains the graphical representation of the measurement results.
24User Manual 1178.4130.02 ─ 07
Page 28

R&S®FPC
Operation
Remote Operation
The diagram area can contain additional information.
●
The sweep count indicates the process of trace averaging. The first number is the
current measurement, the second number the total number of measurements included in the trace averaging.
●
The trace indicates the characteristics of the measured spectrum.
●
The position of markers or delta markers is indicated by a straight horizontal line
(markers) or a dotted line (delta markers). In addition, the marker position is also
indicated by an icon at the bottom of the diagram area.
●
The position and shape of a limit line is indicated by a red vertical line.
●
The star icon (
current measurement settings. The star will appear, for example, when you change
settings after a single measurement is done.
X-axis information
The x-axis information indicates the current scale and range of the x-axis.
) indicates that the displayed results no longer correspond to the
5.3 Remote Operation
There are various tools that allow you to operate the R&S FPC remotely from another
computer (for example PC or tablet).
To use the R&S FPC this way, you have to establish a connection between both devices via the LAN, Wi-Fi or USB interfaces of the R&S FPC.
Remote desktop (R&S InstrumentView)
R&S InstrumentView is a software that contains various useful tools, including a
remote desktop application. You can download the software, including a user manual,
from the Rohde & Schwarz website.
1. Install the software on a desktop PC or notebook.
2. Connect the R&S FPC to the computer with a LAN cable or a USB cable.
3. Start the software on the computer (use the desktop icon, or search for "InstrumentView" in the start menu).
4. Establish a connection to the R&S FPC in the "Connection Manager".
a) Select the "LAN" tab to configure the LAN properties.
b)
Select the pencil icon ( ).
c) Enter the IP address of the R&S FPC you want to connect to.
d) Confirm with the "Connect" button.
You can connect to as many instruments as you like (including other supported
instruments like R&S FSH or R&S FPH). To do so, simply "Add Another
Device" and define the network properties for them.
25User Manual 1178.4130.02 ─ 07
Page 29

R&S®FPC
Operation
Remote Operation
Alternatively, you can establish a connection via USB in the "USB" tab of the "Connection Manager".
5. Select "Instrument" > "Remote Display".
The software shows a live simulation of the R&S FPC, including all keys available
on the front panel.
Everything you do in the remote desktop application is also done on the connected
R&S FPC.
For a comprehensive description of the R&S InstrumentView software, refer to its
user manual.
Tip: Lab display. The lab display allows you to access several instruments at the
same time via the remote desktop. For more information, refer to the documentation of the R&S InstrumentView software.
Remote desktop (R&S MobileView)
R&S MobileView is an app that allows you to remote control the R&S FPC from a tablet or smartphone. It basically works like the remote desktop application built into the
R&S InstrumentView software.
You can download the app from the Google Play Store (Android based devices) or the
AppStore (iOS devices). A search for "Rohde Schwarz MobileView" should find the
app.
1. Start the R&S FPC.
2. Configure your tablet or phone as a hotspot for an ad-hoc connection (usually in
the phone settings).
3. Connect the R&S FPC to the mobile device.
a) Press the "Setup" key to open the instrument setup menu.
b) Select "WiFi": "On" to turn on the Wi-Fi functionality.
c) Select the "Connect" menu item to start a search for Wi-Fi networks in the
area.
The R&S FPC starts a search for all Wi-Fi networks it can find (mobile devices,
routers etc.).
d) Select the network you want to connect to.
e) Enter the password of the network with the alphanumeric keys. The network
password should be displayed in the hotspot settings of the mobile device.
The R&S FPC establishes the connection.
4. Start the R&S MobileView app on your mobile device.
The app shows a list of all R&S FPC devices that are connected to the hotspot.
5. Select the R&S FPC you want to connect to.
The app shows a live simulation of the R&S FPC, including all keys available on
the front panel.
Everything you do in the app is also done on the connected R&S FPC.
26User Manual 1178.4130.02 ─ 07
Page 30

R&S®FPC
Operation
Remote Operation
Note: If you have a device that does not support ad-hoc connections, you have to
connect both devices to an existing wireless infrastructure (for example through a
router). When you connect both the mobile device and the R&S FPC to the infrastructure, you can use the app just like with an ad-hoc connection.
Remote operation (SCPI commands)
Remote operation with SCPI commands is a method to automate measurements by
writing scripts or programs that contain all instructions required for the measurement.
When you start the program, the measurement is done automatically from start to finish. Manual configuration of a measurement with function keys, softkeys or apps is no
longer necessary.
Remote operation is thus a useful tool for measurements that you perform repeatedly
and for which you know the configuration and for which the configuration is always the
same. Testing devices during production is an example for such measurement tasks.
Each device needs to be tested under the same conditions.
You can operate an instrument remotely using SCPI commands (Standard Commands
for Programmable Instruments). Sending a SCPI command initiates one or more
actions on the instrument, for example change the state of a parameter or start a measurement. Usually, each parameter available in the firmware has a corresponding SCPI
command.
Example: The SCPI command to change the center frequency is
[SENSe:]FREQuency:CENTer.
When you send a succession of these commands, you can configure and perform
complete measurements.
There are several tools that allow you to connect to an instrument, send an individual
(or more) command(s) and compile automated test sequences.
One of these tools is delivered with the R&S VISA library that is available for download
on the Rohde & Schwarz website (search term: "r&s visa"). The VISA library itself provides input and output functions that are required to communicate with the instrument.
Another tool with more complex scripting functions is R&S Forum, also available for
download on the Rohde & Schwarz website (search term: "forum"). It allows you to run
and edit example script sequences and to write your own script files, as well as on-thefly remote control of instruments. Script files can range from simple command sequences (Winbatch syntax) to complex programs using the programming language Python.
User documentation and background information is available for both tools. If you want
to learn more about their features, refer to the corresponding user manuals and application notes.
The following basic introduction to remote control is based on the tool that is delivered
with the R&S VISA.
1. Install R&S VISA on a desktop PC or notebook.
2. Connect the R&S FPC to the computer with a LAN cable or a USB cable.
3. Start the RsVisaTester software (search for "tester" in the start menu). Use the 32bit or 64-bit version, depending on your operating system.
27User Manual 1178.4130.02 ─ 07
Page 31

R&S®FPC
Operation
Remote Operation
The user interface of the RsVisaTester opens.
4. Establish a connection to the R&S FPC.
a) In the "Resource" field, enter the IP address of the R&S FPC you want to con-
nect to.
The form is tcpip::<ipaddress>[::protocol][::instrument], you
can leave out the parts in brackets for now. Just enter tcpip::<ipaddress>.
b) Confirm the entry with the "Connect" button.
After a successful connection, you can see in the left pane that the software
already sent the commands necessary to open the connection.
5. Enter a command in the input field in the "Basics" tab, for example *idn? (make
sure to add the question mark). Then select the "Query" button.
The *IDN? (identity) command queries information about the connected product.
In this case, it should return a string similar to this:
Rohde&Schwarz,FPC1000,1328.6660K02/111111,1.00.
"Query" button: whenever you want to retrieve information from the instrument
(query), use this button.
Tip: See Chapter 19.1, "Remote Control Basics", on page 187 for a comprehen-
sive description about the remote command syntax and the ways you can send a
command.
6. For the following command sequence, make sure that the spectrum application is
the active one.
Enter the command instrument:select spec. Then select the "Write" button.
The command selects the spectrum application.
7. At the beginning of a command sequence, you should always preset the instrument settings to their default values. You can do a preset with the *RST command.
Enter the command in the input field and select the "Write" button.
28User Manual 1178.4130.02 ─ 07
Page 32

R&S®FPC
Operation
Remote Operation
The R&S FPC resets the settings to their default value.
"Write" button: whenever you want to send information to the instrument, use this
button.
8. Enter another command, one that changes an instrument setting, for example
sense:frequency:center 100mhz or the short form freq:cent 100MHZ.
Then select the "Write" button.
The new state of the setting you want to change is defined by a parameter that you
add behind the command.
The SENSe:FREQuency:CENTer command changes the center frequency of the
R&S FPC.
After a preset, the center frequency is half of the supported frequency range
(500 MHz for 1 GHz instruments).
When you send the command, the center frequency changes to 100 MHz. You can
observe this change on the instrument display.
9. Send the command again, this time as a query. To query the state of a setting, add
a question mark instead of a parameter (sense:frequency:center?). Then
select the "Query" button.
The command returns the current state of the parameter you have queried (in this
example the return value should be 100 MHz as you have just changed it to that
value).
29User Manual 1178.4130.02 ─ 07
Page 33

R&S®FPC
Operation
Remote Operation
Note that unless stated otherwise, a query always returns a numeric value in the SI
derived unit (Hz in case of a frequency, not in kHz, MHz or GHz) and with several
decimal places (usually six).
Commands like SENSe:FREQuency:CENTer work a setting and a query. Other
commands do not work both ways. *IDN, for example, is only allowed as a query
(setting anything is not possible). *RST, for example, is only allowed as a setting (a
query is not possible). Information about how you can use command is included in
the command description.
10. Send a succession of commands to measure the spectrum around the center frequency of 100 MHz.
initiate:continuous off
a)
This command selects single sweep mode, recommended for remote measurements.
initiate:immediate;*wai
b)
You can write two commands into one command line, but have to separate
them with a semicolon (;). The first command (INITiate:IMMediate) initiates the measurement. The second command (*wai) instructs the program to
wait until the preceding command (INITiate:IMMediate) has been executed before any subsequent commands are sent. This synchronization to the
end of the measurement is important, because it makes sure that the measurement is done before taking another action.
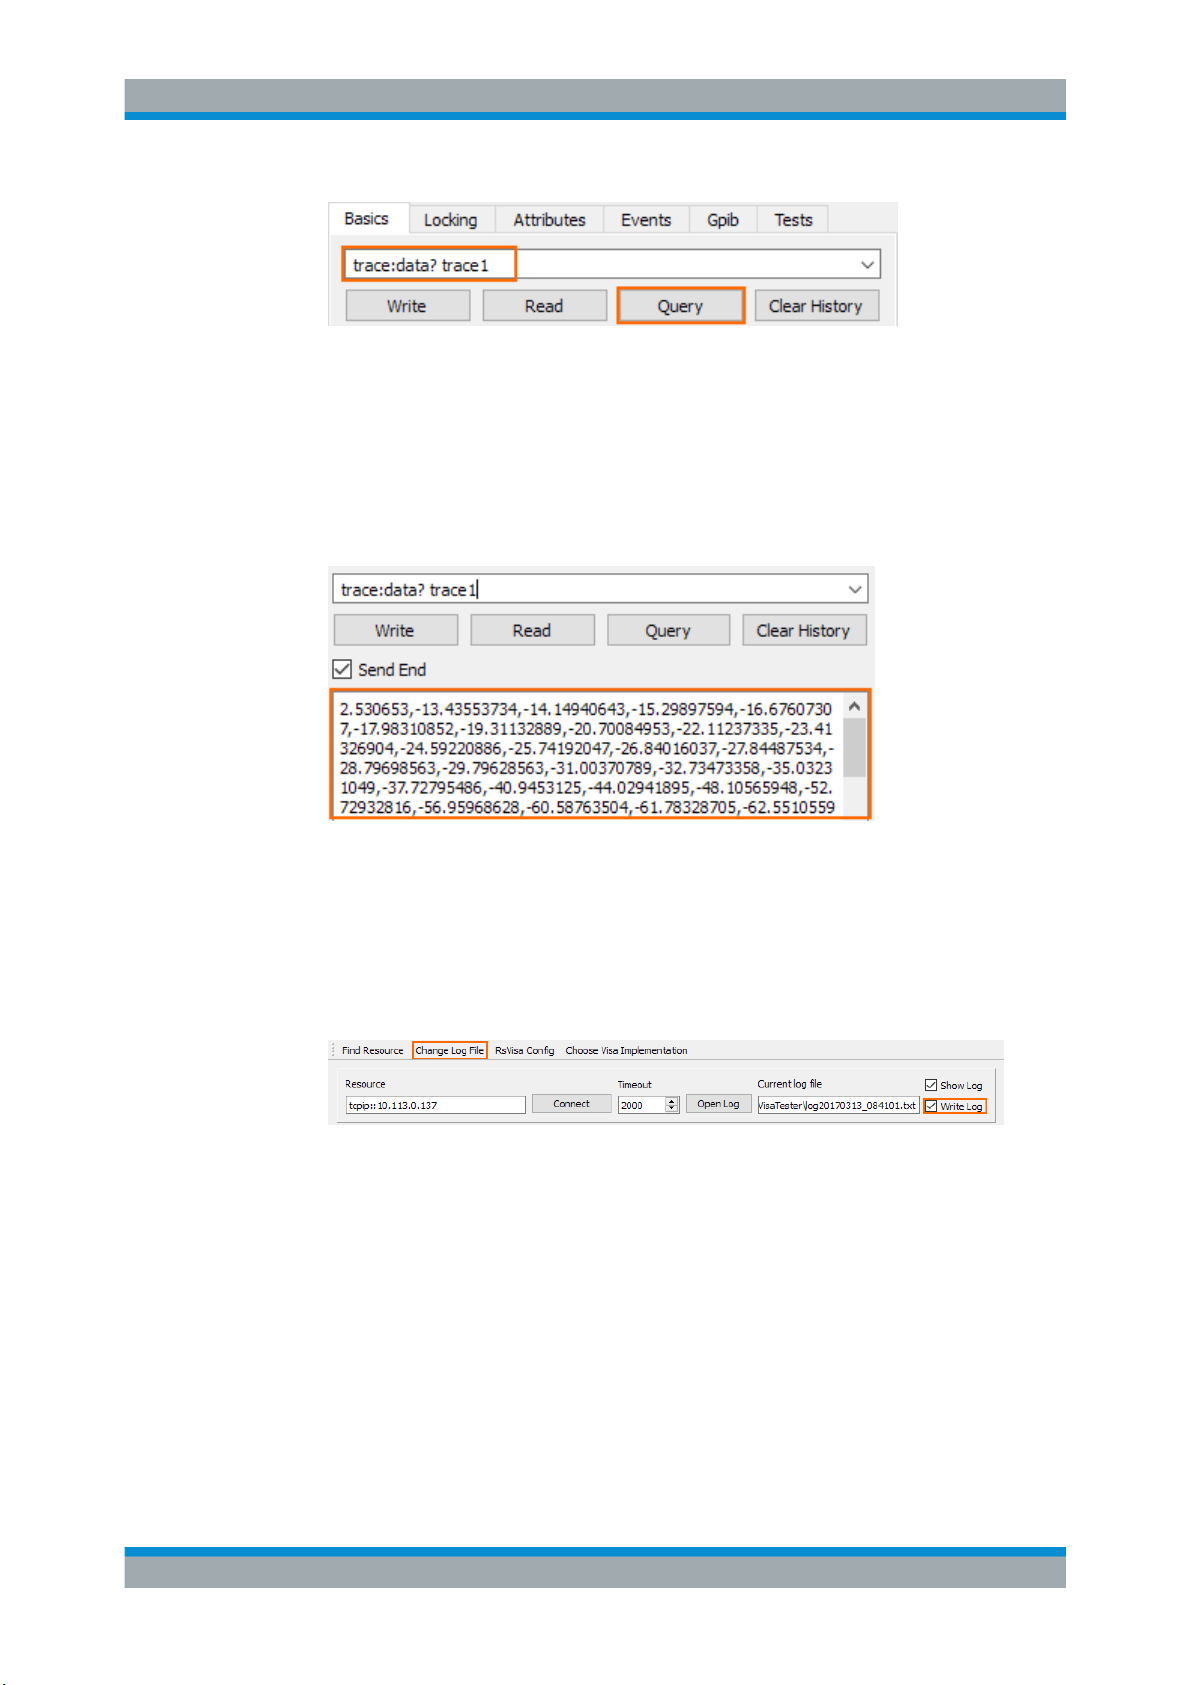
11. When the measurement is done, you can query the measurement results (trace
data).
Send the query trace:data? trace1 to do so.
30User Manual 1178.4130.02 ─ 07
Page 34
R&S®FPC
Operation
Remote Operation
TRACe:DATA is a query, but you have to state a parameter in that case. The
parameter defines which data is returned (in this case, the data of trace 1; you
could also display a second trace whose data you could query with TRACe:DATA
TRACE2).
The trace data contains 1183 level values (one value for each pixel of the display).
The unit of the values is dBm. The values are shown in the message box of the
user interface.
You can copy the trace data from the message box and paste it into a text file,
spreadsheet etc. for further evaluation. (There are also SCPI commands that automatically copy that data into a file, so you do not have to do that manually.)
Tip: Logging commands. You can save all commands you have sent with RsVisaTester into a log file (.txt file type) and reuse it later on.
To do so, turn on the "Write Log" feature and select a folder to save the file in
("Change Log File" menu item).
Figure 5-8: Logging feature in the VISA tester application
This was a short example of how to use SCPI commands to measure a signal.
Depending on your measurement task you can expand the succession of commands as you like, write it into a script and automate a measurement.
31User Manual 1178.4130.02 ─ 07
Page 35

R&S®FPC
Firmware Update
6 Firmware Update
New firmware versions usually contain new features, improvements of existing functionality, bug fixes etc. When a new firmware version is available, it is recommended to
replace the old firmware with the new one.
Updating the firmware
The latest firmware version is available for download on the internet:
www.rohde-schwarz.com/firmware/fpc
Before you update the firmware, you should make a backup of the data that you have
stored on the R&S FPC (datasets, screenshots, transducer factors etc.). You can make
a backup with the tools available in the R&S InstrumentView software package.
The firmware update itself does not delete or modify that data, but it is recommended
to perform a factory reset after the firmware update to update predefined limit lines,
channel tables etc. The factory reset, however, does delete user data.
1. Download the firmware installer from the internet.
The firmware comes in a single .exe file.
2. Save the file to the root directory of a memory stick.
3. Run the .exe file to unpack the self-extracting zip archive.
The following files are extracted.
FPC_bootloader_<version>.bin
●
FPC_osimage_<version>.bin
●
FPC_updater_<version>.bin
●
FPC_xmegaloadfiles_<version>.bin
●
Make sure that only these files are present in the root directory of the memory
stick.
4. Turn off the R&S FPC.
5. Connect the memory stick to one of the USB interfaces of the R&S FPC.
6. Press the "Preset" key and the number "8" key simultaneously.
7. Turn on the R&S FPC and keep pressing the two keys for at least 5 seconds after
the startup screen appears.
8. Release the keys.
32User Manual 1178.4130.02 ─ 07
Page 36

R&S®FPC
Firmware Update
The booting process continues. After a couple of seconds, the R&S FPC asks you
if you really want to update the firmware.
9. Press the "Enter" ("✓") key to update the firmware.
(You can cancel the firmware update with the "Esc" key.)
The firmware update takes several minutes. The R&S FPC shows a message
when the firmware update is done.
Note: Do not turn off the R&S FPC during the firmware update.
10. Turn off the R&S FPC.
11. Turn on the R&S FPC.
The R&S FPC boots with the new firmware version.
12. Optional: It is recommended to perform a factory reset after a firmware update to
replace the predefined limit lines, channel tables and other data with the latest
updates.
Note: Before you start a factory rest, make sure to make a backup of your data that
you have saved on the R&S FPC. Otherwise that data is deleted.
33User Manual 1178.4130.02 ─ 07
Page 37

R&S®FPC
Firmware Options
7 Firmware Options
You can equip the R&S FPC with optional functionality or firmware options like the analog demodulation application or the receiver application. These firmware options
expand the functionality of the R&S FPC with new measurement functions settings etc.
Installing firmware options
To install a new firmware option, you have to enter a license key for validation.
The license key is included in the delivery of the firmware option.
1. Press the "Setup" key to enter the instrument setup menu.
2. Select the "Installed Options" menu item.
The R&S FPC shows a list of all options that are currently installed on your
R&S FPC.
3. Select the "Install Option" button and press the "Enter" key.
The R&S FPC opens an input field.
4. Enter the license key with the alphanumeric keys and confirm the entry with the
"Enter" key.
The license key is a 32-digit number.
The R&S FPC confirms a successful installation.
If the R&S FPC shows an "Invalid Key Code" message, try to enter the license key
again.
Using the R&S LicenseManager (online registration)
You can use the R&S License Manager to manage options with a web browser (Microsoft Internet Explorer, Mozilla Firefox etc.) from a PC.
To use the R&S License Manager, you have to connect the R&S FPC to a local area
network (LAN). See Chapter 9.2, "Network Configuration", on page 39 for more information about how to connect the R&S FPC to a LAN.
After you have connected the R&S FPC, open the web browser.
Make sure to allow the execution of mixed-mode scripts, for example allow in Google
Chrome the loading of scripts from unsafe sources.
► Enter the IP address of the R&S FPC in the address bar of the web browser.
The web browser opens the R&S License Manager. In this part of the
R&S License Manager, you can install, activate and register licenses on the
R&S FPC.
34User Manual 1178.4130.02 ─ 07
Page 38

R&S®FPC
Firmware Options
This page contains three areas.
●
The first area shows the details of the connected device, including the device ID
and the IP address.
●
The second area provides functionality to install and activate licenses.
– "Install Registered License Keys And Activate License"
Follow this link if you have purchased a registered license. Registered licenses
only work in a combination with a specific device ID.
– "Register License, Install License Keys and Activate Licenses"
Follow this link if you have purchased an unregistered license. Unregistered
licenses are not linked to a specific device ID.
– "Reboot Device"
Follow this link to reboot the R&S FPC.
–
Opens an online help of the corresponding topic.
●
The third area provides hints on using the license manager when you move the
mouse over one of the options.
The R&S License Manager also provides functionality to managed licenses of options
that you have already installed on a R&S FPC.
► Select the "Manage Licenses" button.
The web browser opens another part of the R&S License Manager. In this part of
the R&S License Manager, you can manage licenses already installed on your
R&S FPC.
This page contains two areas.
●
The first area provides functionality to manage licenses.
– "Register Licenses"
35User Manual 1178.4130.02 ─ 07
Page 39

R&S®FPC
Firmware Options
Follow this link if you have purchased an unregistered license and want to register it.
– "Unregister License"
Follow this link if you have installed a portable license. Portable licenses can be
used with several device IDs. However, you have to unregister it on one device
before you can use it on another.
– "Move Portable License"
Follow this link if you want to move a portable license. Moving a portable
license is possible without unregistering the license.
–
Opens an online help of the corresponding topic.
●
The second area provides hints on using the license manager when you move the
mouse over one of the options.
After you have followed one of the links, follow the instructions displayed in the web
browser. If you encounter any issues during the licensing procedure, you can access
the online help at any time with the icon. The online help contains an extensive
description of all functionality that the license manager features.
36User Manual 1178.4130.02 ─ 07
Page 40

R&S®FPC
8 Preset
Access: "Preset"
Access (preset configuration): "Setup" > "User Preference"
Access (factory reset): "Setup" > "Instrument Setup"
Remote commands required to preset the system:
●
Chapter 19.3, "Preset", on page 206
Before you prepare a measurement, it is recommended to preset the R&S FPC. During
a preset, the R&S FPC resets all settings to their default state. Restoring the default
configuration has the advantage that old settings do not affect measurements.
The default setup depends on the application you are using.
Presetting the system
1. Press the "Preset" key to restore the default instrument configuration.
Preset
You can also define your own default settings via a dataset. The R&S FPC restores
the configuration stored in the dataset after you press the "Preset" key instead of
the factory defaults.
2. Press the "Setup" key to open the setup menu.
3. Select the "User Preference" menu item to open the user preference dialog box.
4. Select the "Preset Mode" menu item to select the preset mode.
● "Default"
Restores the factory default configuration.
● "User"
Restores custom default values taken from a dataset. In that case, you have to
select a dataset that contains the default values.
5. Select the "Preset Dataset" menu item to select a dataset.
When you preset the R&S FPC, it applies the configuration of the dataset.
For more information about the "Discard Calibration Data" menu item, see "Per-
forming a default calibration" on page 56.
In addition to the preset, you can also reset the system to the condition it had when it
was delivered (factory reset).
Potential data loss
Note that when you reset the R&S FPC to the factory state, all files you have saved on
the internal memory of the R&S FPC will be deleted. Only the files that were included
in the delivery will be kept.
Resetting the system
1. Press the "Setup" key to open the setup menu.
37User Manual 1178.4130.02 ─ 07
Page 41

R&S®FPC
Preset
2. Select the "Instrument Setup" menu item to open the setup menu.
3. Select the "Reset To Factory Settings" menu item.
The R&S FPC initiates the reset process and will ask you to confirm the reset.
When you select "Yes", the system will be reset.
38User Manual 1178.4130.02 ─ 07
Page 42

R&S®FPC
Instrument Setup
Network Configuration
9 Instrument Setup
Access: "Setup" > "Instrument Setup"
The "Instrument Setup" dialog box contains general properties of the R&S FPC that
are independent of the measurement application you are using.
● BNC Connector Usage............................................................................................39
● Network Configuration.............................................................................................39
● Date and Time.........................................................................................................41
● Regional Settings....................................................................................................42
● Display Settings...................................................................................................... 43
● Audio Settings.........................................................................................................43
● Power Settings........................................................................................................44
9.1 BNC Connector Usage
Remote commands required to configure the BNC connector:
●
Chapter 19.5, "System Configuration", on page 209
You can use the BNC connector on the rear panel of the R&S FPC for several applications. Before you can use it in the corresponding way, you have to configure it accordingly.
Selecting the BNC connector usage
1. Press the "Setup" key to open the setup menu.
2. Select the "Instrument Setup" menu item to open the instrument setup dialog box.
3. Select the "BNC" menu item in the "Hardware" category.
4. Select one of the menu items.
● "Trigger Input"
You can connect an external trigger source and trigger measurements.
● "Reference Input"
You can connect an external frequency reference and synchronize the frequency of the R&S FPC with the external reference.
9.2 Network Configuration
Remote commands required to configure the network properties:
●
Chapter 19.4, "Network Connection", on page 207
You can connect the R&S FPC to a local area network (LAN) with a standard LAN
cable. Alternatively, you can connect the R&S FPC to a wireless LAN (WLAN or WiFi).
This is useful, for example, for remote control operation or if you would like to control
the R&S FPC with the R&S InstrumentView software package.
39User Manual 1178.4130.02 ─ 07
Page 43

R&S®FPC
Instrument Setup
Network Configuration
LAN
When you are connecting the R&S FPC to a wired network (LAN), connect the
R&S FPC with a standard LAN cable to a LAN port. The LAN port of the R&S FPC is
on its rear panel.
In case of a wired connection, you have to define several network properties to establish a network connection.
You can either fetch the R&S FPC network properties automatically from a DHCP
server (Dynamic Host Configuration Protocol) or manually assign a fixed address. With
manual allocation, a fixed IP address and subnet mask must be assigned to the
R&S FPC.
MAC address
The MAC address is the unique identifier of the network adapter built into the
R&S FPC.
You can see the MAC address of your R&S FPC in a read-only field in the "LAN" category of the "Instrument Setup" dialog box.
Using a DHCP server
In networks with a DHCP server, the network automatically allocates the network properties (IP address, subnet mask and gateway).
1. Press the "Setup" key to open the setup menu.
2. Select the "Instrument Setup" menu item to open the instrument setup dialog box.
3. Select the "DHCP" menu item in the "LAN" category.
4. Select "On" to activate DHCP.
The R&S FPC automatically writes the network properties in the corresponding
fields ("IP Address", "Subnet Mask" and "Gateway"). This can take several seconds.
Connecting the R&S FPC to a LAN
If you want to configure the network properties manually, you need a free IP address in
your network that you can assign to your R&S FPC. Kindly ask your IT system administrator to provide you with an unused IP address (and the other network information
you need).
1. Press the "Setup" key to open the setup menu.
2. Select the "Instrument Setup" menu item to open the instrument setup dialog box.
3. Select the "DHCP" menu item from the "LAN" category.
4. Select "Off" to deactivate DHCP.
When you turn off DHCP, you can define the "IP Address", "Subnet Mask" and
"Gateway" in the corresponding input fields.
40User Manual 1178.4130.02 ─ 07
Page 44

R&S®FPC
Instrument Setup
Date and Time
Connecting the R&S FPC to a WLAN
Instead of connecting to a LAN, you can also connect the R&S FPC to a Wi-Fi network.
You can use the Wi-Fi functionality to connect the R&S FPC to a hotspot (for example
a router or mobile device configured as a hotspot) and operate it remotely.
1. Press the "Setup" key to open the setup menu.
2. Select the "Instrument Setup" menu item to open the instrument setup dialog box.
3. Turn on the Wi-Fi functionality with the "WiFi" menu item in the "WiFi" category.
4. Select the "Scan WiFi Networks" menu item from the "WiFi" category.
The R&S FPC opens a dialog box that contains a list of all available Wi-Fi net-
works.
5. Select the network you would like to connect to.
The R&S FPC asks you to enter a password to access the network.
(In case of an open or public Wi-Fi, a password is not required. Using an open WiFi poses security risks, however, so be cautious when connecting to an open WiFi.)
6. Enter the password of the Wi-Fi network.
Tip: Regulatory information. You can view all regulations the R&S FPC complies
with by selecting the "Regulatory Information" menu item.
9.3 Date and Time
Remote commands required to configure the date and time:
●
Chapter 19.5, "System Configuration", on page 209
The R&S FPC has an internal system clock. A time stamp is added to various applications (for example when you create a file like a screenshot).
Setting the date
1. Press the "Setup" key to open the setup menu.
2. Select the "Instrument Setup" menu item to open the instrument setup dialog box.
3. Select the "Set Date" menu item in the "Date and Time" category.
4. Enter the date you want with the numeric keys.
The sequence depends on the date format you have selected.
If you enter an invalid date, the R&S FPC highlights the invalid part and does not
accept the input until you enter a valid date.
Setting the system time
1. Press the "Setup" key to open the setup menu.
41User Manual 1178.4130.02 ─ 07
Page 45

R&S®FPC
Instrument Setup
Regional Settings
2. Select the "Instrument Setup" menu item to open the instrument setup dialog box.
3. Select the "Set Time" menu item in the "Date and Time" category.
4. Enter the time you want with the numeric keys.
If you enter an invalid time, the R&S FPC highlights the invalid part and does not
accept the input until you enter a valid time.
Selecting a time zone
The displayed time represents the system time (UTC by default). If you need to create
a different time stamp without changing the system time, you can define an offset that
is added or subtracted to the system time.
1. Press the "Setup" key to open the setup menu.
2. Select the "Instrument Setup" menu item to open the instrument setup dialog box.
3. Select the "Time Zone" menu item in the "Date and Time" category.
4. Enter the time offset you want with the numeric keys.
Note: We recommended that you select the time zone before you define the sys-
tem time.
9.4 Regional Settings
Remote commands required to configure regional settings:
●
Chapter 19.5, "System Configuration", on page 209
Selecting the user interface language
The R&S FPC supports several user interface languages. When you change the language, all user interface elements that contain text are translated into the corresponding language.
Note that the "Language" menu item remains English, regardless of the language you
select.
1. Press the "Setup" key to open the setup menu.
2. Select the "Instrument Setup" menu item to open the instrument setup dialog box.
3. Select the "Language" menu item in the "Regional" category.
4. Select the language of your choice.
Selecting the date format
The date format defines the way that the date is displayed.
1. Press the "Setup" key to open the setup menu.
2. Select the "Instrument Setup" menu item to open the instrument setup dialog box.
42User Manual 1178.4130.02 ─ 07
Page 46

R&S®FPC
Instrument Setup
Audio Settings
3. Select the "Date Format" menu item in the "Regional" category.
4. Select the date format of your choice.
● "dd/mm/yyyy": day/month/year
● "mm/dd/yyyy": month/day/year
Selecting the length unit
1. Press the "Setup" key to open the setup menu.
2. Select the "Instrument Setup" menu item to open the instrument setup dialog box.
3. Select the "Length Unit" menu item in the "Regional" category.
4. Select the length unit of your choice.
● "Meter": metric length unit
● "Feet": imperial length unit
9.5 Display Settings
Remote commands required to configure the display:
●
Chapter 19.6, "Display Settings", on page 215
Adjusting the display backlight
The display backlight defines the brightness of the display.
You can adjust the backlight intensity of the display to get a good viewing experience
depending on the lighting conditions of your surroundings.
1. Press the "Setup" key to open the setup menu.
2. Select the "Instrument Setup" menu item to open the instrument setup dialog box.
3. Select the "Display Backlight" menu item in the "Display" category.
4. Select the backlight intensity that you prefer.
The backlight intensity is a percentage from 0 % to 100 % with 100 % being the
brightest.
9.6 Audio Settings
Remote commands required to configure the audio output:
●
Chapter 19.7, "Audio Settings", on page 215
43User Manual 1178.4130.02 ─ 07
Page 47

R&S®FPC
Instrument Setup
Power Settings
Defining the key click volume
The key click volume defines the volume of the sound that the R&S FPC produces
when you press a key or softkey.
1. Press the "Setup" key to open the setup menu.
2. Select the "Instrument Setup" menu item to open the instrument setup dialog box.
3. Select the "Key Click Volume" menu item in the "Audio" category.
4. Select the volume that you prefer.
The volume is a percentage from 0 % to 100 % with 100 % being the loudest.
Defining the system beeper volume
The system beeper volume defines the volume of the system beeper. The system
beeper produces a sound, for example, if a message box turns up.
1. Press the "Setup" key to open the setup menu.
2. Select the "Instrument Setup" menu item to open the instrument setup dialog box.
3. Select the "System Beeper Volume" menu item in the "Audio" category.
4. Select the volume that you prefer.
The volume is a percentage from 0 % to 100 % with 100 % being the loudest.
Turning audio output in case of a power overload on and off
If the R&S FPC detects an overload at one of its inputs, you can configure it to make a
sound.
1. Press the "Setup" key to open the setup menu.
2. Select the "Instrument Setup" menu item to open the instrument setup dialog box.
3. Select the "Beep On Power Overload" menu item in the "Audio" category.
4. Select the setting you prefer.
If on, the R&S FPC makes a sound every time it detects an overload.
9.7 Power Settings
Turning automatic system boot on and off
1. Press the "Setup" key to open the setup menu.
2. Select the "Instrument Setup" menu item to open the instrument setup dialog box.
3. Select the "Auto Power Up On AC" menu item in the "Power" category.
4. Select the setting of your choice.
44User Manual 1178.4130.02 ─ 07
Page 48

R&S®FPC
Instrument Setup
Power Settings
● "On": The R&S FPC automatically boots when you use the main power switch
on the rear panel.
● "Off": After using the main power switch, the R&S FPC is in stand-by mode.
You have to turn it on with the power button on the front panel.
45User Manual 1178.4130.02 ─ 07
Page 49

R&S®FPC
10 Data Management
Access (save and recall datasets): "Save Recall"
Access (file manager): "Save Recall" > "File Manager"
Access (user preferences): "Setup" > "User Preferences"
Remote commands required for data management:
●
Chapter 19.8, "Data Management", on page 216
The R&S FPC provides several tools to manage data related to your measurement
tasks. Data related to measurements can come in different forms and formats, like limit
lines, channel tables, specific measurement setups, measurement results or screenshots. All this data is usually stored in a file whose characteristics and file extension
depend on the data type. Channel tables, for example, are stored in files with the
extension .chntab while measurement configurations are stored in files with the
extension .set.
Some data types like limit lines, transducer factors or channel tables, should already
be available before you perform a measurement (for example limit lines, transducers or
channel tables). This data is also referred to as templates. Other data types like measurement setups or screenshots are only created during the measurement or when the
measurement is done. This data is also referred to as datasets.
Data Management
Templates and datasets
Templates are measurement or analysis tools that you usually apply to measurement
and that have an effect on the measurement results. A typical template that you might
use regularly is a limit line or transducer factor. The R&S FPC already provides several
predefined templates. If you need to create custom templates, you have to use the
R&S InstrumentView software package.
Templates come in different forms and formats. Each type of template thus has a different file extension. Examples: .chntab (channel table), rellim, abslim (relative and
absolute limit lines) or pritrd and sectrd (primary and secondary transducer factors).
You can load templates into a measurement in the corresponding context menus.
●
Loading limit lines: see Chapter 14.12, "Limit Lines", on page 130.
●
Loading channel tables: see Chapter 14.3.3, "Channel Tables", on page 97.
●
Loading transducer factors: see Chapter 14.4.4, "Transducers", on page 104.
For more information about creating and editing templates, refer to the user manual of
the R&S InstrumentView software package.
Datasets on the other hand are an image of the measurement configuration and result.
Typically, you will only create them during or after the measurement and they include
information if a template is used in the measurement. They are useful, for example, to
recreate the context of the measurement, for documentation purposes or a more
detailed analysis with another tool later on. You can also use a dataset to create a cus-
tom preset state.
46User Manual 1178.4130.02 ─ 07
Page 50

R&S®FPC
Data Management
Storage devices
You can store all this data on the internal memory of the R&S FPC or on external storage devices like memory sticks that you can connect to one of the USB ports of the
R&S FPC.
The default storage device depends on which devices are connected.
●
If a memory stick is connected, datasets are always stored there first.
●
The internal memory is used only if no memory stick is connected.
Note that the internal memory of the R&S FPC is limited to several Mbytes. Therefore it
is recommended that you use an external memory device like a USB stick to save
measurement data or screenshots and only keep templates and datasets that you
require regularly on the internal memory.
If you use an external storage device, the available disk space is limited only by the
size of the storage device.
Free space of the internal memory
You can find out the disk space that is left on the internal memory of the R&S FPC in
the file manager.
Open the file manager ("Save Recall" > "File Manager"). The free disk space is indicated at the top of the dialog box.
Folder structure of the internal memory
The internal memory has a given folder structure. Basically, each data type has its own
designated folder.
For example, there is a folder labeled \Channel Tables that contains all channel
tables that are delivered with the firmware. Another folder is labeled \Datasets that is
the default folder for saving a dataset.
Of course, you can save a dataset in the \Limit Lines folder, but for a good file
organization, it is recommended not to mix up file types.
Using in the file manager
The file manager is a tool that provides functionality to manage the files in the internal
memory or on external storage devices.
1. Press the "Save Recall" key to open the file menu.
2. Select the "File Manager" menu item to open the file manager.
The R&S FPC shows the contents of the root directory of the internal memory.
Use the rotary knob or the cursor keys to navigate through the folder contents.
Press the "✓" key or the rotary knob twice to access the contents of the folder you
have selected.
3. Apply one of the actions to the selected file or folder.
● "Preview"
See "Previewing a dataset" on page 50.
47User Manual 1178.4130.02 ─ 07
Page 51

R&S®FPC
Data Management
● "Load"
See "Restoring datasets" on page 50.
● "Sort"
Sorts the folder contents by certain criteria: alphabetically ("Sort on Name"),
chronologically ("Sort by Date / Time") or by file size ("Sort on Size)".
● "Show Compatible"
Filters the folder contents by their compatibility to the current measurement
configuration.
● "Show All Files"
Removes the compatibility filter that you have previously applied.
● "Edit"
Allows you to edit the file or folder (item).
– "Mark": Selects the item. You can recognize a selected item by the check
mark in front of the item name.
– "Rename": Allows you to rename an item.
– "Cut": Allows you to move an item to another location.
– "Copy": Copies an item to another location.
– "Paste": Inserts the cut or copied item into the new location.
– "Delete": Deletes the selected item.
– "Refresh": Refreshes the folder contents.
Read-only files
If a file is labeled with a lock symbol in the "Stat" column of the file manager, it is readonly and therefore cannot be edited.
You can remove the read-only attribute in several ways.
●
Connect the R&S FPC to a PC and start the R&S InstrumentView software.
In the software, start "Instrument" > "File Transfer", select a file and lock or unlock
the file with the "Lock" feature.
●
Copy the file to a computer and remove the attribute with the Windows functionality
(right click on the file, select "Properties" and remove the check from the
"Readonly" checkbox.
●
Use the SYSTem:SET:UNLock command to remove the read-only attribute. Note
that you might have to select the correct directory first with
MMEMory:CDIRectory.
Saving datasets
A dataset contains all kinds of information about the current measurement, like the
measurement configuration and the measurement results.
1. Press the "Save Recall" key to open the file menu.
2. Select the "Save" menu item to open the file manager.
When you save a dataset, the R&S FPC automatically opens the \Datasets
folder.
48User Manual 1178.4130.02 ─ 07
Page 52

R&S®FPC
Data Management
3. If you want to save the dataset in a different folder or an external memory device,
navigate to the folder you like.
4. Enter the file name in the "Save As" input field.
The default file name for datasets is Dataset###.set with a new number in
ascending order for each new dataset. The file extension for datasets is .set. If
necessary, you can change the default file name for datasets.
If you enter another name, the R&S FPC uses that name and assigns a new number to the file name if you save the data set the next time. This function allows you
to assign consecutive dataset file names without entering a new name every time
you want to save a dataset.
You can enter the file name with the alphanumeric keypad. Each key covers more
than one character. To get the character you want, press the key in question the
appropriate number of times.
5. Confirm saving the dataset with the "Save" menu item.
Defining meta information for datasets
You can include various meta information in datasets that you save. This meta information is then included in measurement reports that you create with the R&S InstrumentView software.
1. Press the "Setup" key to open the setup menu.
2. Select the "User Preferences" menu item.
3. Select one of the items in the "Site" category.
● "Site Name": Enter the location where the measurement takes place.
● "User": Enter the name of person who does the measurement.
● "Comments": Enter any comment about the measurement (note that the length
of the comment is limited).
The R&S FPC adds the information you have entered to any dataset you save from
now on.
Changing the default directory to store data
The R&S FPC provides several predefined directories in which it stores a specific file
type. For example, the R&S FPC automatically stores screenshots in the
\Public\Screen Shots\ directory. If you want to save a dataset, it automatically
opens the \Public\Datasets\ directory, and so on.
If you prefer to store all your data, regardless of file type, in a custom directory, you can
change the default directory.
1. Press the "Setup" key to open the setup menu.
2. Select the "User Preferences" menu item.
3. Select the "Working Directory" menu item.
The R&S FPC opens the file manager.
49User Manual 1178.4130.02 ─ 07
Page 53

R&S®FPC
Data Management
4. Select your preferred directory to store data in.
5. Confirm your selection with "Load".
6. Select the "Using Working Directory" menu item and turn it "On".
Screenshots are automatically stored in the working directory you have selected.
When you save a dataset, the R&S FPC automatically opens the file manager at
the working directory.
Changing the default file name for datasets
1. Press the "Setup" key to open the setup menu.
2. Select the "User Preference" menu item.
3. Select the "Default Dataset Name" menu item in the "Dataset" category.
4. Enter the default file name you like.
From now on, the R&S FPC will save datasets with the file name you have
entered. It will still add a consecutive number to the file name (Result001,
Result002 etc.).
Restoring datasets
1. Press the "Save Recall" key to open the file menu.
2. Select the "Recall" menu item to open the file manager.
When you restore a dataset, the R&S FPC automatically opens the \Datasets
folder.
3. If you want to restore the dataset from a different folder or an external memory
device, navigate to the folder with the dataset.
4. Confirm your selection with the "Load" menu item.
Previewing a dataset
Before you restore a dataset, you can preview the dataset. This can be useful, if you
are not sure which dataset you want to restore and view all available datasets first.
The preview is like a screenshot and lets you take a quick look at that measurement
and its settings. The R&S FPC does not yet activate the measurement settings of that
dataset.
1. Press the "Save Recall" key to open the file menu.
2. Select the "Recall" menu item to open the file manager.
When you want to preview a dataset, the R&S FPC automatically opens the
\Datasets folder.
3. If you want to preview the dataset from a different folder or an external memory
device, navigate to the folder with the dataset.
4. Confirm your selection with the "Preview" menu item.
50User Manual 1178.4130.02 ─ 07
Page 54

R&S®FPC
Data Management
You can preview all available datasets in the selected folder with the "Prev" and
"Next" menu items.
When you have found a dataset that you would like to restore, you can restore it
directly with the "Recall" menu item.
Taking screenshots
You can take and store a screenshot of the current screen anytime with the camera
key.
If available, the R&S FPC stores the screenshot on an external storage device (USB
memory stick). If it can find no external memory, the R&S FPC stores the screenshot
on the internal memory.
By default, the screenshot is a .png file and has the filename Measurementxxx.png,
with xxx being a consecutive number. You can change the file type and default filename.
1. Press the "Setup" key to open the setup menu.
2. Select the "User Preference" to open the user preference menu.
3. Select the "Default Filename" menu item to change the default filename.
Enter any filename you like with the alphanumeric keys, for example "Screenshot".
Every screenshot that you take from now on will have that name.
4. Select the "Filename Counter Starts At" menu item to change the numbering of
screenshots.
Enter any number you like with the alphanumeric keypad, for example "100". The
next screenshot you take will begin with the number 100. All subsequent screenshot will have a number starting from 100.
5. Select the "Capture Screen Format" menu item to select the file type for the
screenshot. You can save screenshots as a .png or .jpg.
Previewing screenshots
You can have a look at screenshots you took on the R&S FPC.
1. Press the "Save Recall" key top open the file menu.
2. Select the "Recall Screenshot" menu item to open the file manager.
3. Navigate to the screenshot you would like to view.
4. Confirm your selection with the "Preview" menu item.
51User Manual 1178.4130.02 ─ 07
Page 55

R&S®FPC
11 Signal Source Configuration
Access: "Meas" > "Source"
Remote commands to configure the signal source:
●
Chapter 19.9, "Signal Source Configuartion", on page 226
Available for the R&S FPC1500 and in the spectrum and VNA applications.
The signal source settings control the signal output on the corresponding RF connector
on the front panel of the R&S FPC. You can use the signal source for transmission
measurements, for example. The frequency and level of the generated signal is variable.
Selecting the output frequency
The output frequency depends on the mode you have selected.
1. Press the "Meas" key.
Signal Source Configuration
2. Select the "Source" menu item to open the signal source menu.
3. Select one of the signal source modes.
● "Off"
Turns off the signal source. No signal is output on the RF connector.
● "CW"
Opens an input field that allows you to define the output frequency. The output
signal is a continuous wave signal whose frequency remains the same throughout the measurement.
● "CW Coupled"
The output signal is a continuous wave signal whose frequency is coupled to
the center frequency. When you change the center frequency, the R&S FPC
adjusts the output signal accordingly.
● "Tracking Generator"
The output signal is a continuous wave signal whose frequency is coupled to
the measurement frequency.
For time domain measurements (span = 0), use either mode "CW" or "CW
Coupled".
For frequency domain measurements (span > 0), the R&S FPC automatically
adjusts the frequency of the generated signal to the current measurement frequency. The number of frequency changes thus depends on the number of
measurement points.
You can define an additional frequency offset for the output signal. The
R&S FPC opens the "TG Offset" input field when you turn on the tracking generator. An offset of 1 MHz, for example, generates a signal that is 1 MHz above
the measurement frequency.
Defining an offset is possible only when the frequency span is smaller than the
full span (max. span = full span - TG offset). You have to reduce the full span
52User Manual 1178.4130.02 ─ 07
Page 56

R&S®FPC
Signal Source Configuration
by the offset, for example if the full span of your R&S FPC is 1 GHz, and you
want an offset of 200 MHz, you have to reduce the span to 800 MHz.
Defining the output level
Risk of damage to the instrument or DUT
Make sure that the DUT can handle the signal power that you output via the signal
source. Power levels that are too high can damage the DUT.
Make also sure that the reflected power does not exceed 20 dBm. Power levels higher
than that can damage or destroy the signal source output.
1. Press the "Meas" key.
2. Select the "Source" menu item to open the signal source menu.
3. Select the "Level" menu item.
The R&S FPC opens an input field to define the level of the output signal.
53User Manual 1178.4130.02 ─ 07
Page 57

R&S®FPC
12 Calibration
Access: "Meas" > "Source" > "Normalization"
Remote commands to calibrate measurements:
●
not supported
Available for the R&S FPC1500 and in the spectrum and VNA applications.
Before you measure S-parameters, you should calibrate the measurement. Calibration
or system error correction is a separate measurement that determines systematic,
reproducible errors. Determining these errors allows you to remove those errors from
the actual measurement results, which in turn improves the accuracy of the measurement.
The calibration requires a calibration standard (or calibration kit), whose response
characteristics (magnitude, phase and frequency) are known. During calibration, the
R&S FPC compares the measurement results of the standards with their known, ideal
response. The difference is used to calculate the system errors and derive a set of system error correction data.
Calibration
For successful and valid calibration, you connect the calibration standard at the reference plane. The reference plane is usually the output of the RF measurement cable.
Calibration remains valid after turning off the R&S FPC or changing into another application as calibration data is saved in the internal memory of the R&S FPC. If you save
the measurement in a dataset, calibration data is part of that dataset. When you
restore the dataset and repeat the same measurement, you do not have to recalibrate
the R&S FPC.
Before you calibrate the R&S FPC for the current measurement, you should set the frequency parameters, reference level and attenuation levels. If you change one of these
parameters after a successful calibration, it can become invalid.
Calibration states
The R&S FPC can have one of several calibration states as indicated in the trace information of the diagram header. The possible states depend on the calibration type.
●
"(dcal)"
The R&S FPC uses default calibration. For details, see "Performing a default cali-
bration" on page 56.
●
"(uncal)"
The measurement is not calibrated. The uncorrected measurement results are displayed.
●
"(norm)"
The measurement has been calibrated with the normalization calibration type.
Measurement results are corrected accordingly.
●
"(cal)"
The measurement has been calibrated with one of the 1-port calibration types.
Measurement results are corrected accordingly.
●
"(cal int)"
54User Manual 1178.4130.02 ─ 07
Page 58

R&S®FPC
Calibration
The correction data between the reference points of the calibration is interpolated.
Interpolation is used when you change one of the frequency parameters (start, stop
or center frequency). In that case, the distribution of the measurement points is different to the distribution during calibration. This could result in an increasing measurement uncertainty.
Calibration types
●
Normalize S21
Normalization is a simple way to calibrate the measurement using one calibration
standard only. The correction data is deducted from this measurement. As only one
calibration standard is used, the isolation between the test ports is ignored. A possible cross-talk between the test ports is therefore not eliminated.
Available for the following measurements: transmission S21, spectrum measurements with signal source.
Required calibration standards: through.
●
Full 1-Port
Test port 1 is calibrated for reflection measurements over the complete frequency
range of the R&S FPC. The calibration requires the calibration standards open,
short and load to be connected one after another.
Available for the following measurements: reflection S11, 1-port cable loss, DTF.
Required calibration standards: open, short, load.
●
Easy 1-Port
Test port 1 is calibrated for measurements on that port. The calibration requires no
calibration standards as the R&S FPC tests an open only.
●
1-Port Selective Span
Test port 1 is calibrated for reflection measurements over the currently selected frequency range (span). The calibration requires the calibration standards open, short
and load to be connected one after another.
Available for the following measurements: reflection S11, 1-port cable loss, DTF.
Required calibration standards: open, short, load.
Selecting a calibration kit
Every calibration kit has different phase characteristics. Therefore, you have to specify
the calibration kit you are using to avoid phase errors during calibration. The R&S FPC
then corrects the measurement results accordingly.
You can either use one of the calibration kits designed for use with the R&S FPC, for
example the R&S FSH-Z28 and -Z29 calibration kits. Those kits provide an "Open",
"Short" and "Load" calibration standard in one piece. The characteristics of these calibration kits are already stored in the R&S FPC firmware.
In addition, you can create and edit calibration kits with the R&S InstrumentView software package and then transfer them to the R&S FPC.
When you use calibration kits, make sure that the electrical length of the calibration kit
is similar to that of the R&S FSH‑Z28 or ‑Z29. The electrical length of the "Open" and
"Short" of these calibration kits is 5.27 mm. If the electrical length is different, an additional phase error can occur.
1. Press the "Meas" key to enter the measurement menu.
55User Manual 1178.4130.02 ─ 07
Page 59

R&S®FPC
Calibration
2. Select the "Calibrate" menu item to enter the calibration menu.
3. Select the "Calibration Kits <x>" menu item.
The R&S FPC opens a dialog box that contains a list of all calibration kit specifica-
tions stored on the R&S FPC.
4. Select the calibration kit you are using.
After you have selected the calibration kit, you can calibrate the measurement.
Performing a default calibration
You can do a full 1-port calibration and save the correction data as the default calibration. The default calibration is then restored after a preset. A default calibration can be
useful, for example, if you repeat the same measurement several times.
A certain default calibration remains in the memory of the R&S FPC until you perform
another default calibration.
1. Press the "Setup" key to open the setup menu.
2. Select the "Instrument Setup" menu item to open the instrument setup dialog box.
3. Select the calibration kit you are using for the default calibration ("Calibration Kit"
menu item).
4. Start the calibration with the "Perform Default Calibration" button.
The R&S FPC initiates the calibration. Follow the instructions on the display.
After the calibration is done, the R&S FPC shows the last calibration date, the last
calibration frequency and the calibration kit you have used in the read-only fields
below the "Calibrate" button.
From now on, the R&S FPC restores the default calibration after a preset.
An exception to this rule is if you turn off the "Discard Calibration Data" feature.
5. Press the "Setup" key to open the setup menu.
6. Select the "User Preference" menu item to open the user preference dialog box.
7. Select the "Discard Calibration Data" menu item.
● "On": Discards the current calibration data. If default calibration data is availa-
ble, the R&S FPC restores the default calibration.
● "Off": Keeps the current calibration data. The R&S FPC does not restore
default calibration in that case.
Calibrating a measurement
The procedure below shows a normalization calibration routine.
All other calibration methods basically work the same way, except for the type and
number of calibration standards you are going to need.
1. Disconnect the DUT from the RF cable.
The RF cable remains connected to the R&S FPC.
2. Press the "Meas" key to enter the measurement menu.
56User Manual 1178.4130.02 ─ 07
Page 60

R&S®FPC
Calibration
3. Select the "Signal Source" menu item to open the signal source menu.
4. Turn on the "Tracking Generator".
5. Select the "Normalize S21" menu item.
The R&S FPC asks you to set up a "Through" connection from port 1 to port 2.
6. Firmly connect the "Through" connection to port 1 and port 2.
7. Select the "Continue" menu item to start normalization.
After finishing the calibration, the R&S FPC shows that calibration is finished for a
short time ("Calibration Done").
The status line now contains the corresponding status label.
Activating correction
After you have normalized or calibrated the measurement, you have to activate the
correction of the measurement results.
If you do not activate the correction of the results, the R&S FPC displays the uncorrected results.
1. In the spectrum application:
Press the "Meas" key to enter the measurement menu.
2. Select the "Signal Source" menu item to open the signal source menu.
3. Select the "Normalization S21" menu item.
The R&S FPC applies the correction values (menu item turns light blue).
4. In the VNA application:
Press the "Meas" key to enter the measurement menu.
5. Select the "Calibration" menu item to open the calibration menu.
6. Select the "User Cal" menu item.
57User Manual 1178.4130.02 ─ 07
Page 61

R&S®FPC
Calibration
The R&S FPC applies the correction values (menu item turns light blue).
If you have a default calibration, default calibration is applied if you do not activate
user calibration.
58User Manual 1178.4130.02 ─ 07
Page 62

R&S®FPC
13 Measurement Wizard
The measurement wizard is a tool that allows you to combine several individual measurement configurations to a sequence of measurements (or measurement set). Each
individual measurement configuration is based on a dataset that you have previously
saved. Because all relevant parameters have been defined before the actual measurement and cannot be changed once the measurement procedure has begun, the wizard
is a good way to avoid mistakes and save time when setting up measurements.
This topic describes the functionality of the measurement wizard. For details on the
individual measurements you can perform with the wizard, refer to the corresponding
chapters.
●
Chapter 14, "The Spectrum Application", on page 66
●
Chapter 15, "The Receiver Application", on page 134
●
Chapter 16, "Analog Demodulation", on page 147
●
Chapter 17, "Digital Demodulation", on page 158
You can use the wizard for measurements in all available applications.
Measurement Wizard
Note that it is necessary to install and use the R&S InstrumentView software package if
you want to access and use the measurement wizard.
Before you can use the measurement wizard, you have to define a measurement set
with the R&S InstrumentView software package and transfer it to the R&S FPC.
The R&S InstrumentView software package is available for download on the R&S FPC
website at www.rohde-schwarz.com/manual/fpc.
Creating a measurement set
A measurement set consists of several datasets. A dataset is a file that contains the
settings of a specific R&S FPC configuration, for example frequency, scaling etc. To
get hold of a dataset, set up the R&S FPC as you need and save the configuration or
use one of the predefined datasets.
For more information about how to create measurement sets, see "Saving datasets"
on page 48.
1. Start the R&S InstrumentView software on your PC.
2. Open the "Wizard Set" editor in the software ("Preparation" > "Wizard Sets").
The R&S InstrumentView opens a dialog that provides all functionality to manage
measurement sets.
3. Create a new measurement set from scratch or open an existing measurement set
to edit that set.
Define global characteristics of the measurement set in the "Global" category.
59User Manual 1178.4130.02 ─ 07
Page 63

R&S®FPC
Measurement Wizard
Figure 13-1: Global measurement set settings
4. Define a "Measurement Set Name" and, if you like, a measurement "Description".
5. Optional: Select a different "Measurement Font".
The measurement font selects the type of font used to display the instructions on
the R&S FPC.
6. Optional: Turn on the "Variable Number of Sequence Steps" feature.
When you turn this on, you can reduce the number of individual measurements in a
measurement sequence.
7. Optional: Turn on the "Allow Skip Measurements & Finish Wizard Sequence" feature.
When you turn this on, you can skip a measurement and continue with the next
one.
8. Optional: Protect the measurement set from unauthorized access with a password
("Encryption" category).
When you protect the measurement set with a password, you can edit the contents
of the measurement set only after you have entered the correct password.
In addition, you can control who is using the measurement sets by limiting its
access to a particular set of R&S FPC serial numbers only. All other devices will
not be able to process these wizard files.
9. Add one or more datasets to the measurement sets.
You can preview datasets with the "View" button to check the configuration of that
dataset. In the preview pane, you can also apply analysis tools to the measured
data, like markers and limit lines or change the scale of the y-axis, if necessary.
After you have added at least one dataset (an individual measurement), you can
define various properties for that measurement in the "Measurement Settings" tab.
60User Manual 1178.4130.02 ─ 07
Page 64

R&S®FPC
Measurement Wizard
Figure 13-2: Measurement settings for a dataset
Do that for all datasets you have added to the measurement set.
10. Define the "Measurement Name" and instructions for that measurement.
You can add instructions as text and as an image.
11. Optional: Configure the "Hardware Settings".
12. "Save" the measurement set (the file extension for measurement sets is .mdf).
Uploading measurement sets to the R&S FPC
After you have created a measurement set, you have to upload it to the R&S FPC.
When you have uploaded the measurement set, you can perform the actual measurement sequence you have defined with the R&S FPC.
1. Open the "File Transfer" dialog box in the R&S InstrumentView software ("Instrument" > "File Transfer").
2. Select the "Wizard Sets" folder on both the R&S FPC (left pane) and the PC (right
pane).
3. Select the measurement set you would like to transfer.
4. Transfer the file to the R&S FPC with the "<<" button.
Alternatively, you can use a memory stick to access a measurement set on the
R&S FPC.
Using the measurement wizard
After you have uploaded a measurement set to the R&S FPC, you can start the measurement sequence.
1. Press the "Save Recall" key.
2. Select the "Wizard" menu item to open the wizard menu.
3. Select the "Load Measurement Set" menu item.
4. Select the folder that contains the measurement set and select it with the "Load"
menu item.
61User Manual 1178.4130.02 ─ 07
Page 65

R&S®FPC
Measurement Wizard
The R&S FPC shows the measurement specification. The measurement specification contains a list of the individual measurements (datasets) defined for the measurement set, and their current state ("<done>" or "<not done>").
Figure 13-3: Measurement specification shows the measurement sequence
You can access the measurement specification with the "Measurement Specification" menu item.
5. Optional: Select one of the measurements. You can view and configure various
properties of the measurement set with the "Measurement Setting" menu item.
Figure 13-4: Measurement settings show the details of the measurements in the measurement
sequence
● "Measurement Definition"
Shows the name of the measurement set as defined with the R&S InstrumentView software.
● "User"
Enter the name of the person that performs the measurement.
● "No of Steps to Perform"
Enter the number of measurements you want to perform.
The field allows you to reduce the number of individual measurements and perform only those measurements that are really necessary. If you reduce the
number of measurements, the R&S FPC omits the last measurements in the
sequence.
You can edit this field only if you have turned on the "Allow Variable Number of
Sequence Steps" in the "Wizard Set" editor of the R&S InstrumentView software.
● "Measurement Description"
Shows the short description of the measurement as defined with the
R&S InstrumentView software.
● "Site Name"
Enter the location of the measurement.
● "Comments"
Enter any comments about the measurement, for example the external conditions during the measurement.
62User Manual 1178.4130.02 ─ 07
Page 66

R&S®FPC
Measurement Wizard
6. Start the measurement sequence with the "Start Measurement" menu item.
The R&S FPC starts to go through the measurements that are part of the measure-
ment set. The sequence of the measurement is as defined with the R&S InstrumentView software.
Note that it is not possible to change any measurement parameters while using the
measurement wizard. Marker functionality and scaling parameters are, however,
available.
Before each measurement, the wizard shows a message box that contains the
instructions for that measurement.
Figure 13-5: Prepare the measurement as described when this message shows up
7. Prepare the measurements as instructed. When you are done, you can start the
measurement.
8. You have several options before you start a measurement.
● "Continue"
Finishes the current measurement and begins with the next measurement by
showing the necessary preparations.
● "Repeat Measurement"
Repeats the current measurement. Repeating a measurement can be useful,
for example, if the results do not match your expectations and you want to validate the results.
● "Interrupt"
Interrupts the sequence of measurements. Interrupting a measurement can
become necessary if the measurement does not yield the expected results (for
example violated limit lines).
In that case, you can interrupt the measurement sequence and try to find the
origin of the problem by using different settings or measurements than those
defined in the wizard.
When you interrupt the wizard sequence, the complete functionality is available
as if you would not use the wizard. Results of finished measurements remain in
the memory.
When you are finished reconfiguring the measurement, enter the measurement
wizard and resume the measurement sequence with the "Resume Sequence"
menu item.
● "Skip"
Skips a single measurement and initiates the subsequent measurement.
Skipping individual measurements is possible when you turn on "Allow to skip
measurements and finish wizard sequence" in the "Wizard Set" editor of the
R&S InstrumentView software.
● "Finish Wizard"
Ends the measurement sequence. The results of finished measurements
remain in the memory.
63User Manual 1178.4130.02 ─ 07
Page 67

R&S®FPC
Measurement Wizard
Ending a measurement sequence is possible when you turn on "Allow to skip
measurements and finish wizard sequence" in the "Wizard Set" editor of the
R&S InstrumentView software.
● "Cancel"
Aborts the measurement sequence. The results of finished measurements are
lost.
When all measurements of the sequence are done, the R&S FPC shows a corresponding message.
Figure 13-6: On screen information that all measurements are done
When you have finished all measurements that are part of the measurement
sequence, the R&S FPC asks you if you want to save the measurement results.
9. Select the "Save Result" menu item to save the results.
If you do not want to keep the results, you can discard the results with the "Discard
Result" menu item.
Tip: Limited internal memory. If you have to store the results on the internal memory, make sure that it has enough space left to store them. Else the results might
get lost. If the space is not enough, you can delete old data with the file manager.
For more information, see "Using in the file manager" on page 47.
The results for a measurement set consist of several files, each file corresponding
to one of the measurements. For easy evaluation, the R&S FPC includes the name
of the measurement as defined in the wizard dialog or R&S InstrumentView in the
file name.
All result files that belong to a measurement set are stored in the same directory.
The directory is named after the measurement name and site. The syntax is 'sitename_measurement_#'
The R&S FPC adds numbers in ascending order to files as well as directories if you
perform a measurement or measurement set more than once.
Evaluating results
The R&S InstrumentView software provides functionality to evaluate results and compile measurement reports. However, before you can start to evaluate the results you
have to download the results to your computer.
1. Open the "File Transfer" dialog box in the R&S InstrumentView software ("Instrument" > "File Transfer").
2. Select the "Wizard Sets" folder on both the R&S FPC (left pane) and the PC (right
pane).
3. Select the measurement set you would like to transfer.
4. Transfer the file to the R&S FPC with the ">>" button.
Alternatively, you can use a memory stick to access a measurement set on the
R&S FPC.
64User Manual 1178.4130.02 ─ 07
Page 68

R&S®FPC
Measurement Wizard
Now that the results are available, you can start to compile a measurement report
with the R&S InstrumentView software.
5. Start the "Report Generator".
With the report editor, you can create measurement reports for the full measure-
ment set or a selection of dataset only. You can also perform simple tasks like activating or deactivating markers that have been set during the measurement.
6. Add the results you want to include in the report by setting a checkmark or removing the checkmark in the report pane.
7. Select the report format you would like.
8. Create the report with the "Generate" button.
65User Manual 1178.4130.02 ─ 07
Page 69

R&S®FPC
The Spectrum Application
Configuration Overview
14 The Spectrum Application
The spectrum analyzer application is the base application of the R&S FPC. It provides
conventional spectrum analyzer functionality. In addition to basic frequency and time
domain measurements, it also features several more sophisticated measurements like
the channel power measurement or the OBW measurement (occupied bandwidth).
The spectrum application also provides a wide range of settings and tools to configure
and analyze spectrum measurements.
Selecting the spectrum application
1. Press the "Mode" key to open the mode menu.
2. Select the "Spectrum" menu item.
● Configuration Overview...........................................................................................66
● Measurements and Result Displays........................................................................68
● Frequency Configuration.........................................................................................93
● Amplitude Configuration..........................................................................................98
● Bandwidth Configuration.......................................................................................106
● Sweep Configuration.............................................................................................109
● Trigger Configuration.............................................................................................112
● Trace Configuration...............................................................................................113
● Marker Configuration.............................................................................................119
● Marker Functions.................................................................................................. 125
● Display Lines.........................................................................................................129
● Limit Lines.............................................................................................................130
14.1 Configuration Overview
The configuration overview provides quick access to the most important measurement
settings in a single dialog box.
The contents of the configuration overview are arranged in the order of the data flow,
and thus the way you usually configure a measurement, from configuring the input over
data processing to data analysis. When you use the configuration overview, you can
easily configure an entire measurement in a single dialog box without having to access
each softkey menu.
66User Manual 1178.4130.02 ─ 07
Page 70

R&S®FPC
The Spectrum Application
Configuration Overview
Figure 14-1: Configuration overview in the spectrum application
Accessing the configuration overview
1. Press the "Setup" key to open the setup menu.
2. Select the "Config Overview" menu item to open the configuration overview dialog
box.
Each pane contains several main measurement settings that you can change
directly in the configuration overview.
3. Select one of the panes in the dialog box with the cursor keys or the rotary knob.
4. Confirm your selection with the "✓" key.
The R&S FPC opens a dialog box that contains the settings.
5. Select the setting you want to change with the cursor keys or the rotary knob.
When you confirm your selection with the "✓" key, you can change that setting.
6. You can exit the configuration overview any time with the "Exit" menu item.
The configuration overview contains several panes, each of which contains settings
that thematically belong together.
●
"Input"
For more information about the contents of the "Input" pane, see Chapter 14.4,
"Amplitude Configuration", on page 98.
●
"Amplitude"
For more information about the contents of the "Amplitude" pane, see Chap-
ter 14.4, "Amplitude Configuration", on page 98.
●
"Frequency"
For more information about the contents of the "Frequency" pane, see Chap-
ter 14.3, "Frequency Configuration", on page 93.
●
"Bandwidth"
For more information about the contents of the "Bandwidth" pane, see Chap-
ter 14.5, "Bandwidth Configuration", on page 106.
67User Manual 1178.4130.02 ─ 07
Page 71

R&S®FPC
Measurements and Result Displays
●
"Analysis"
For more information about the contents of the "Analysis" pane, see Chapter 14.8,
"Trace Configuration", on page 113.
●
"Trigger"
For more information about the contents of the "Trigger" pane, see Chapter 14.7,
"Trigger Configuration", on page 112.
14.2 Measurements and Result Displays
The R&S FPC allows you to measure a signal in the frequency domain or the time
domain.
You can also equip the R&S FPC with optional extended measurement functions like
harmonic distortion or OBW measurements. These measurements provide settings
and tools for special measurement tasks.
Measuring basic spectrum characteristics
The Spectrum Application
Basic spectrum measurements require no optional equipment on the R&S FPC.
1. Connect a DUT to the RF input of the R&S FPC.
2. Turn on the R&S FPC.
The R&S FPC measures the characteristics of the DUT in the frequency domain
with the default configuration. It shows the results as a line trace in the diagram
shown on the display.
Figure 14-2: Display of a signal in the frequency domain
Alternatively, you can measure the DUT characteristics in the time domain.
68User Manual 1178.4130.02 ─ 07
Page 72

R&S®FPC
The Spectrum Application
Measurements and Result Displays
Frequency domain measurements
In the frequency domain, the R&S FPC analyzes the input signal characteristics over a
certain frequency span. You can use it, for example, to obtain basic measurement
results like peak levels and the shape of the spectrum.
The horizontal axis shows the frequency, the vertical axis shows the signal levels.
The measurement in the frequency domain is the default measurement mode.
Time domain measurements
In the time domain, the R&S FPC analyzes the characteristics of a signal at a particular
frequency over time. The span during time domain measurements is 0 (zero span
mode). You can use time domain measurements, for example to monitor the character-
istics of a signal and its behavior over time.
Figure 14-3: Display of a signal in the time domain
The horizontal axis shows the time, the vertical axis shows the signal levels.
You have to select the zero span mode deliberately to measure signal characteristics in
the time domain.
Selecting an advanced measurement function
In addition to these basic measurement functions, you can equip the R&S FPC with
optional advanced measurements.
1. Press the "Meas" key to open the measurement menu.
2. Select one of the menu items.
Selecting "Spectrum" returns to the basic spectrum analysis.
● Measuring the Channel Power of Continuously Modulated Signals....................... 70
● Third Order Intermodulation....................................................................................74
● Power Measurements on TDMA Signals................................................................ 75
● Measuring the Harmonic Distortion.........................................................................78
69User Manual 1178.4130.02 ─ 07
Page 73

R&S®FPC
14.2.1 Measuring the Channel Power of Continuously Modulated Signals
The Spectrum Application
Measurements and Result Displays
● Measuring the AM Modulation Depth......................................................................79
● Measuring the Occupied Bandwidth....................................................................... 81
● Working with the Spectrogram Result Display........................................................84
Access (measurement menu): "Meas" > "Measurement Mode" > "Channel Power"
Remote commands to control channel power measurements:
●
Chapter 19.12.1, "Measurements and Result Displays", on page 232
Available with the optional "Advanced Measurements" application.
The channel power measurement selectively measures the power of modulated signals. Unlike a power meter that performs measurements over its entire frequency
range, the channel power measurement measures the power of a specific transmission
channel. Other signals in the frequency spectrum don't show in the results.
When measuring the spectrum within a channel, the R&S FPC uses a resolution bandwidth that is small compared to the channel bandwidth. It then determines the total
power of the channel by integrating the results on the trace.
That means that you can compare the result to the result that would have been
obtained from a thermal power meter. The small resolution bandwidth acts like a narrow channel filter and so prevents out-of-channel emissions from affecting the result.
Selecting the channel power measurement
1. Press the "Meas" key to open the measurement menu.
2. Select the "Measurement Mode" menu item to select the measurement.
3. Select the "Channel Power" menu item.
The R&S FPC starts to measure the channel power.
Two vertical lines indicate the channel bandwidth.
The channel power measurement shows the results and various other information
about the measurement in the diagram header.
●
Power / Max Power
Shows the power level measured within the channel. The label changes depending
on the power mode you have selected.
●
Channel BW
Shows the currently selected channel bandwidth.
The diagram footer shows the currently selected center frequency and span.
● About the Measurement..........................................................................................71
● Configuration...........................................................................................................71
70User Manual 1178.4130.02 ─ 07
Page 74

R&S®FPC
14.2.1.1 About the Measurement
14.2.1.2 Configuration
The Spectrum Application
Measurements and Result Displays
The following prerequisites and settings are necessary to obtain correct results for the
channel power measurement.
●
Define the correct channel bandwidth.
Only the signal to be measured should be visible in the diagram. An additional signal would falsify the measurement.
●
Define a sufficient resolution bandwidth.
●
Select the RMS detector.This ensures that the power measurement is always correct irrespective of the waveform being investigated.
Define a sufficient span.
The span is always coupled to the channel bandwidth (span = 1.2 to 5 x channel bandwidth, depending on the channel bandwidth). When you change the channel bandwidth, the R&S FPC automatically adjusts the span, but not the other way around.
Access: "Meas"
The channel bandwidth measurement supports several settings exclusive to that measurement. These are available in the measurement menu.
Defining the channel bandwidth
The channel bandwidth is the bandwidth of the signal that you are measuring.
Note that the channel bandwidth and frequency span are coupled. When you select a
channel bandwidth, the R&S FPC automatically defines an appropriate span for the
channel bandwidth you have defined (span = 1.2 x channel bandwidth). This mechanism ensures correct channel power measurements.
1. Press the "Meas" key to open the measurement menu.
2. Select the "Chan Bandwidth" menu item.
The R&S FPC opens an input field to define the channel bandwidth.
3. Enter the channel bandwidth you need.
Note: The minimum channel bandwidth that you can set is 833 Hz at a span of
1 kHz.
Measuring the maximum channel power
If signal levels fluctuate significantly, you can measure the maximum channel power
with the max hold function.
1. Press the "Meas" key to open the measurement menu.
2. Select the "Power Display" menu item.
3. Select the "Max Hold" menu item.
71User Manual 1178.4130.02 ─ 07
Page 75

R&S®FPC
The Spectrum Application
Measurements and Result Displays
The displayed result shows the highest channel power that has been measured
(indicated by the "Max Power" result in the diagram header.
4. You can return to the normal power display by selecting the "Clear / Write" menu
item instead.
Measuring the channel power density
By default, the R&S FPC the channel power result corresponds to the complete channel bandwidth you have selected. You can also display the channel power that corresponds to a bandwidth of 1 Hz. In that case, the results are no longer displayed in
dBm, but in dBm/Hz.
Using this evaluation method, you can measure the signal / noise power density, for
example.
1. Press the "Meas" key to open the measurement menu.
2. Select the "Power Display" menu item.
3. Select the "Channel Power / Hz" menu item.
The displayed result shows the channel power measured in a bandwidth of 1 Hz
(indicated by the different unit in the channel power result in the diagram header).
4. You can return to the normal power display by selecting the "Channel Power / Hz"
menu item again.
Selecting the unit for power display
The R&S FPC can apply different units to the power output.
1. Press the "Meas" key to open the measurement menu.
2. Select the "Power Unit" menu item to open the power unit menu.
3. Select the unit you want.
The R&S FPC displays the signal level in the selected unit.
Note: The default unit is dBm.
Selecting a standard
You can store the main measurement settings as a standard file. When you load such
a standard file, the R&S FPC automatically configures the measurement regarding
channel and general measurement settings.
Standard files for common telecommunications standards are already provided with
the R&S FPC firmware.
If you want to measure a different standard, you can also create custom standard definition files with the R&S InstrumentView software and transfer them to the R&S FPC.
For more information, refer to the documentation of the R&S InstrumentView.
1. Press the "Meas" key to open the measurement menu.
2. Select the "Standard" menu item.
72User Manual 1178.4130.02 ─ 07
Page 76

R&S®FPC
The Spectrum Application
Measurements and Result Displays
The R&S FPC opens a dialog box to select the standard.
3. Select one of the available standards.
The R&S FPC loads the configuration of the selected standard. It automatically
sets the span, resolution bandwidth, video bandwidth, sweep time and detector
required by the standard.
If the measurement is not according to the selected standard anymore (for example if you change a parameter), the R&S FPC shows a blue dot in front of the standard display.
Defining the reference level
The reference level is the power level that the R&S FPC expects at the RF input. When
you select the reference level, make sure that you do not overload the R&S FPC by
applying a signal whose power exceeds the maximum reference level.
As the power is measured with a small resolution bandwidth compared to the signal
bandwidth, it is still possible to overload the R&S FPC, even if the trace is within the
measurement diagram. To prevent an overload, measure the occupied bandwidth with
the largest resolution bandwidth possible using the peak detector. If you set these
parameters, it is not possible for the trace to exceed the reference level.
To simplify operation and to prevent incorrect measurements, the R&S FPC has an
automatic routine for setting the reference level.
1. Press the "Meas" key to open the measurement menu.
2. Select the "Level Adjust" menu item.
The R&S FPC performs a measurement to determine the optimal reference level.
It uses a resolution bandwidth of 1 MHz, a video bandwidth of 1 MHz and the peak
detector. After finishing the automatic measurement, the R&S FPC sets the optimal
reference level.
Changing the span
Usually, the span that the R&S FPC selects yields optimal results. But sometimes you
also need to see the spectrum outside the current span to detect other signal components that you need to include in the measurement. Therefore, you can adjust the span
to up to ten times the channel bandwidth and hence still be able to see the spectrum
outside the measurement channel.
1. Press the "Span" key to open the span menu.
2. Select the "Manual Span" menu item.
The R&S FPC opens an input field to define the span.
3. Enter the span you need.
Note: The largest possible span for the channel power measurement is ten times
the channel bandwidth. At larger spans, the result of the channel power measurement would be increasingly imprecise, because too few points of the trace would
be in the channel you are measuring.
73User Manual 1178.4130.02 ─ 07
Page 77

R&S®FPC
14.2.2 Third Order Intermodulation
The Spectrum Application
Measurements and Result Displays
Access: "Meas" > "Measurement Mode" > "Occupied Bandwidth"
Remote commands to control the third order intermodulation measurement:
●
Chapter 19.12.1.3, "Third Order Intermodulation", on page 238
Available with the optional "Advanced Measurements" application.
Intermodulation is an effect that occurs when you transmit signals on two or more frequencies close to each other. An ideal DUT would output the same signals that you
apply to its input. In reality, however, DUTs (like an amplifier or mixer) are nonlinear.
This nonlinearity produces additional signals at different frequencies, which can have
negative effects on the system, for example interference in a radio transmission.
●
Harmonics, which are a multiple of the fundamental frequency (f*x).
●
Intermodulation products, which are the sum and difference frequencies of the fundamentals (fx + fy and fy-fx).
Fundamentals
nd
2
order products
Power
rd
3
order products
f1f
2
-f
f
2
Figure 14-4: Overview of intermodulation products
-f
2*f
1
2
1
2*f
-f
1
2
2*f12*f
+f
f
2
1
3*f
2
2*f
1
1
3*f
2
Frequency
+f
+f
2*f
2
1
2
The third order intermodulation products are of special interest, because:
●
Their signal level is comparatively large.
●
They occur near the carrier frequency and are thus difficult to filter out.
In addition, the level of the intermodulation products increases when you increase the
input level in a ratio of 3:1: Increasing the level of the input signal by 1 dB increases
the level of the third order intermodulation product by 3 dB. Eventually, the level of the
intermodulation product exceeds the level of the input signal. The point where the two
meet is the third order intercept point (IP3).
IP3
Output power
P
f
P
IM3
Input power
74User Manual 1178.4130.02 ─ 07
Page 78

R&S®FPC
The Spectrum Application
Measurements and Result Displays
The third order intermodulation (TOI) measurement analyzes the intermodulation products that occur at the output of the DUT and calculates the third order intercept point.
The IP3 is the theoretical intercept point of the DUTs desired output level and the level
of the intermodulation products. It is thus a measure of the DUTs linearity.
To perform the TOI measurement, you need two signals with the same level on slightly
different frequencies, combine them and feed them into the RF input of the R&S FPC.
Signal 1
AnalyzerDUT
Signal 2
Combiner
Selecting the TOI measurement
1. Press the "Meas" key to open the measurement menu.
2. Select the "Measurement Mode" menu item to select the measurement.
3. Select the "Third Order Intermod." menu item.
The R&S FPC starts to measure the third order intermodulation.
To do this, the R&S FPC places two markers (marker 1 and marker 2) on the signal
peaks (assumed to be the fundamentals) and two markers (marker 3 and marker 4)
on the third order intermodulation products. The R&S FPC calculates the third
order intercept point from the level difference between the first 2 markers and the
markers 3 and 4 and displays the result in the diagram header.
Searching for signals
A signal search is an easy way to update the marker position and thus the measurement results (for example if the signal frequencies have changed).
1. Press the "Meas" key to open the measurement menu.
2. Select the "Search Signals" menu item.
The R&S FPC does a signal search, positions the marker accordingly and updates
the TOI results.
14.2.3 Power Measurements on TDMA Signals
Access: "Meas" > "Measurement Mode" > "TDMA Power"
Remote commands required to configure power measurements on TDMA signals:
●
Chapter 19.12.1.5, "TDMA Power", on page 241
Available with the optional "Advanced Measurements" application.
TDMA (time division multiple access) is a channel access method in which several
users share a channel. The channel is divided into several time slots (a period of time).
Each user is assigned to a certain time slot. GSM is a transmission standard that uses
TDMA, for example.
75User Manual 1178.4130.02 ─ 07
Page 79

R&S®FPC
The Spectrum Application
Measurements and Result Displays
The TDMA power measurement is a time domain measurement that determines the
power of one of the time slots or the power of a burst.
Selecting the TDMA power measurement
1. Press the "Meas" key to open the measurement menu.
2. Select the "Measurement Mode" menu item to select the measurement.
3. Select the "TDMA Power" menu item.
The R&S FPC starts to measure the time domain power.
When you start a TDMA measurement, the R&S FPC automatically reduces the span
to 0 Hz.
To prevent incorrect power measurements in the time domain, make sure that the
whole signal is within the selected resolution bandwidth. If the resolution bandwidth is
too small, the displayed power will be lower than the actual power.
The TDMA power measurement shows the results and various other information about
the measurement in the diagram header.
●
Power
Shows the power of the measured burst in dBm.
●
Burst Length
Shows the length of the measured burst in seconds.
Selecting a standard
A quick way to configure a measurement is to store a certain measurement configuration in a file and later restore it. This way is especially useful, for example, if you test a
signal against the test scenarios of a telecommunications standard.
Configurations for common telecommunications standards are already provided with
the R&S FPC firmware.
If you want to measure a different standard, you can also create custom configuration
files with the R&S InstrumentView software and transfer them to the R&S FPC. For
more information, refer to the documentation of the R&S InstrumentView.
1. Press the "Meas" key to open the measurement menu.
2. Select the "Standard" menu item.
3. Select one of the available standards from the dialog box.
The R&S FPC loads the configuration of the selected standard.
Depending on the selected file, the R&S FPC automatically selects the span, resolution bandwidth, video bandwidth, sweep time and detector required by the standard.
If you change the configuration, and one of the parameters differs from the configuration in the active file, the R&S FPC shows a blue dot in front of the standard display.
76User Manual 1178.4130.02 ─ 07
Page 80

R&S®FPC
The Spectrum Application
Measurements and Result Displays
Defining the reference level
The reference level is the power level that the R&S FPC expects at the RF input. When
you select the reference level, make sure that you do not overload the R&S FPC by
applying a signal whose power exceeds the maximum reference level.
As the power is measured with a small resolution bandwidth compared to the signal
bandwidth, it is still possible to overload the R&S FPC, even if the trace is within the
measurement diagram. To prevent an overload, measure the occupied bandwidth with
the largest resolution bandwidth possible using the peak detector. If you set these
parameters, it is not possible for the trace to exceed the reference level.
To simplify operation and to prevent incorrect measurements, the R&S FPC has an
automatic routine for setting the reference level.
1. Press the "Meas" key to open the measurement menu.
2. Select the "Level Adjust" menu item.
The R&S FPC performs a measurement to determine the optimal reference level.
It uses a resolution bandwidth of 1 MHz, a video bandwidth of 1 MHz and the peak
detector. After finishing the automatic measurement, the R&S FPC sets the optimal
reference level.
Defining the burst length
The burst length or measurement time defines the expected length of the burst. The
measurement time is the time period over which the signal power is measured.
The minimum burst time is the time corresponding to one trace pixel. The maximum
burst time corresponds to the current sweep time (with the sweep time being the complete time displayed on the x-axis).
The burst time must be equal or less than the sweep time. If you define a burst time
that is longer than the sweep time, the R&S FPC selects a burst equal to the current
sweep time. To measure a longer burst, you have to increase the sweep time first.
1. Press the "Meas" key to open the measurement menu.
2. Select the "Burst Length" menu item.
The R&S FPC opens an input field to define the burst length.
3. Enter the expected length of the burst.
The R&S FPC analyzes the power of the burst. The current burst length is indica-
ted by two blue vertical lines in the diagram (the first line indicating the beginning of
the burst is usually at the origin of the x-axis).
Using a trigger
Using a trigger is the best method to measure bursts, as it keeps the display of the
burst stable. You can use either the video trigger or an external trigger (if the DUT has
some sort of trigger equipment). The functionality of both trigger sources is similar to
the functionality in the spectrum application.
1. Connect the DUT trigger output to the R&S FPC trigger input.
77User Manual 1178.4130.02 ─ 07
Page 81

R&S®FPC
14.2.4 Measuring the Harmonic Distortion
The Spectrum Application
Measurements and Result Displays
2. Press the "Sweep" key to open the sweep menu.
3. Select the "Trigger" menu item to open the trigger menu.
4. Select the trigger source ("Video" or "External Rise / Fall"
5. Select either the "External Rise" or "External Fall" menu item (rising or falling
edge).
The R&S FPC activates the trigger and shows the results of the measurement.
Access: "Meas" > "Measurement Mode" > "Harmonic distortion"
Remote commands required to configure harmonic distortion measurements:
●
Chapter 19.12.1.6, "Harmonic Distortion", on page 241
Available with the optional "Advanced Measurements" application.
The harmonic distortion measurement is an easy way to identify the harmonics of a
signal and their characteristics.
Ideally, a signal would show as a single peak in the spectrum. In the real world, however, systems contain imperfections, like nonlinearities, which add spectral components to the initial signal (the fundamental, corresponding to the center frequency of
the analyzer). Among these additional spectral components are harmonics (also called
overtones), signals with higher frequencies than the fundamental, which show as
whole number multiples of the fundamental in the spectrum. Each harmonic has a
lower level than the fundamental, but they still affect the signal as a whole.
The harmonic distortion is designed to detect the harmonics of the signal you are measuring. When you start a measurement, the R&S FPC looks for the first harmonic of
the signal (= the highest signal) in the frequency range you have defined. The number
of harmonics it looks for depends on the number of harmonics you have defined. It
then adjusts the frequency axis so that all harmonics are visible.
In addition, the R&S FPC also calculates the total harmonic distortion (THD). The THD
is the root mean square of all harmonics in relation to the power of the fundamental
frequency.
Selecting the harmonic distortion measurement
1. Press the "Meas" key to open the measurement menu.
2. Select the "Measurement Mode" menu item to select the measurement.
3. Select the "Harmonic Distortion" menu item.
The R&S FPC starts to measure the harmonic distortion and position a marker on
each harmonic it has detected.
It also calculates the THD and shows the result in the diagram header.
78User Manual 1178.4130.02 ─ 07
Page 82

R&S®FPC
The Spectrum Application
Measurements and Result Displays
Defining the number of harmonics
The R&S FPC supports measurements on up to six harmonics.
By default, the R&S FPC shows the signal's fundamental and its first harmonic. The
fundamental and its harmonics are indicated by a marker that the R&S FPC places on
the detected peaks. Note that all markers that have been set are normal markers that
show the absolute frequency of the harmonic.
At the same time, the R&S FPC also calculates the values for the total harmonic distortion (THD) and shows the results in a box above the trace diagram. The values are
output in % and in dB.
1. If you want to analyze more than one harmonic, press the "Meas" key to open the
measurement menu.
2. Select the "Harmonics" menu item.
3. Enter the number of harmonics you would like to see.
The R&S FPC updates the measurement accordingly.
Optimizing measurement settings
1. Press the "Meas" key to open the measurement menu.
2. Select the "Adjust Settings" menu item.
The R&S FPC adjusts the reference level, frequency and span to display all har-
monics in the best way.
14.2.5 Measuring the AM Modulation Depth
Access: "Meas" > "Measurement Mode" > "AM Modulation Depth"
Remote commands required to configure AM modulation depth measurements:
●
Chapter 19.12.1.7, "AM Modulation Depth", on page 244
Amplitude modulation (AM) is a modulation scheme that varies the amplitude of the
carrier based on the waveform of the transmitted signal.
The AM modulation depth measurement analyzes amplitude modulated signals and
shows the spectral signal characteristics. It also analyzes the modulation depth of the
signal using the measurement results. The AM modulation depth indicates how much
the modulated signal varies around the carrier amplitude. The AM modulation depth m
is calculated as follows.
m = peak signal amplitude / unmodulated carrier amplitude
For example, for m = 0.5, the carrier amplitude varies by 50 % above and below its
unmodulated level.
For m = 1, it varies by 100 %.
Note that the measurement works properly only if you apply an AM modulated signal.
79User Manual 1178.4130.02 ─ 07
Page 83

R&S®FPC
The Spectrum Application
Measurements and Result Displays
Selecting the AM modulation depth measurement
1. Press the "Meas" key to open the measurement menu.
2. Select the "Measurement Mode" menu item to select the measurement.
3. Select the "AM Modulation Depth" menu item.
The R&S FPC measures the modulation depth by placing three markers on the
trace.
The first marker is placed on the peak level - the R&S FPC assumes that the highest level is the carrier. The second and third markers are delta markers. These
markers are placed symmetrically on the adjacent peak values to the left and right
of the carrier.
From the values of the markers, the R&S FPC then calculates the AM modulation
depth. The AM modulation depth is the ratio between the power values at the reference marker and at the delta markers. When the powers of the two AM side bands
are not the same, the R&S FPC uses the mean value of the two sideband values.
If the R&S FPC is unable to find any AM modulated carriers, it shows a message
that the measurement is not possible.
Moving the markers
You can move the markers manually and individually to other positions, if necessary.
1. Press the "Meas" key to open the measurement menu.
2. Select one of the "Marker <x>" menu items to select the corresponding marker.
3. Move the marker to a new position.
Defining a threshold
1. Press the "Meas" key to open the measurement menu.
2. Select the "Threshold" menu item.
The R&S FPC opens an input field to define a threshold.
3. Enter the threshold value you need.
The threshold is represented as a horizontal blue line in the diagram area. Signals
below that threshold are not interpreted as sideband signals.
Optimizing the measurement settings
In order to get the best results, you can use the automatic adjustment routine that the
R&S FPC offers.
1. Press the "Meas" key to open the measurement menu.
2. Select the "Adjust Settings" menu item.
The R&S FPC performs a measurement to determine the ideal reference level, fre-
quency and span to display all harmonics.
80User Manual 1178.4130.02 ─ 07
Page 84

R&S®FPC
14.2.6 Measuring the Occupied Bandwidth
The Spectrum Application
Measurements and Result Displays
Access: "Meas" > "Measurement Mode" > "Occupied Bandwidth"
Remote commands to control the occupied bandwidth measurement:
●
Chapter 19.12.1, "Measurements and Result Displays", on page 232
Available with the optional "Advanced Measurements" application.
An important characteristic of a modulated signal is its occupied bandwidth (OBW). In
a radio communications system, for example, the occupied bandwidth must be limited
to enable distortion-free transmission in adjacent channels. The occupied bandwidth is
defined as the bandwidth containing a defined percentage of the total transmitted
power.
You can define a percentage between 10 % and 99 %. Numerous standards require an
occupied bandwidth of 99 %.
After entering the channel bandwidth, the R&S FPC automatically selects the measurement parameters so that you can attain the best result.
Selecting the OBW measurement
1. Press the "Meas" key to open the measurement menu.
2. Select the "Measurement Mode" menu item to select the measurement.
3. Select the "Occupied Bandwidth" menu item.
The R&S FPC starts to measure the occupied bandwidth.
Two vertical lines show the occupied bandwidth.
The occupied bandwidth measurement shows the results and various other information
about the measurement in the diagram header.
●
Occupied bandwidth
Shows the occupied bandwidth in Hz.
●
Standard
Shows the selected standard when you have selected one.
●
% power BW
Shows the power percentage of the occupied bandwidth.
●
Channel BW
Shows the channel bandwidth.
The diagram footer shows the currently selected center frequency and span.
● About the Measurement..........................................................................................81
● Configuration...........................................................................................................82
14.2.6.1 About the Measurement
The following prerequisites and settings are necessary to obtain correct results for the
occupied bandwidth.
●
Define the correct channel bandwidth.
81User Manual 1178.4130.02 ─ 07
Page 85

R&S®FPC
14.2.6.2 Configuration
The Spectrum Application
Measurements and Result Displays
Only the signal to be measured should be visible in the diagram. An additional signal would falsify the measurement.
●
Define a sufficient resolution bandwidth.
The resolution bandwidth should be between 1 % and 4 % of the channel bandwidth. This ensures that the occupied bandwidth is measured with high accuracy.
●
Define a sufficient video bandwidth.
The video bandwidth must be at least three times the resolution bandwidth. This
prevents incorrect results due to the compression of signal peaks by the video filter.
●
Select the RMS detector.This ensures that the power measurement is always correct irrespective of the waveform being investigated.
Some of the measurement specifications (for example PDC, RCR STD-27B)
require measurement of the occupied bandwidth with a peak detector. The detector
setting has to be changed accordingly in those cases.
●
Select a sufficient sweep time.
Access: "Meas"
The occupied bandwidth measurement supports several settings exclusive to that
measurement. These are available in the measurement menu.
Defining the percentage of the occupied bandwidth
The default power percentage to be evaluated inside the occupied bandwidth is 99 %,
a value most standards require. If your measurement requires a different power percentage, you can change that value.
1. Press the "Meas" key to open the measurement menu.
2. Select the "% Power Bandwidth" menu item.
The R&S FPC opens an input field to define the power percentage.
3. Enter the power percentage the measurement requires.
The R&S FPC now displays the occupied bandwidth graphically in the trace win-
dow and numerically above the trace window.
Note: The value you enter here is the power percentage that has to be inside the
channel bandwidth relative to the power over the total span (the percentage of the
total power).
Defining the channel bandwidth
The channel bandwidth is the bandwidth of the signal that you are measuring.
Note that the R&S FPC always selects a frequency span that equals the channel bandwidth
1. Press the "Meas" key to open the measurement menu.
2. Select the "Chan Bandwidth" menu item.
82User Manual 1178.4130.02 ─ 07
Page 86

R&S®FPC
The Spectrum Application
Measurements and Result Displays
The R&S FPC opens an input field to define the channel bandwidth.
3. Enter the channel bandwidth you need.
Note: The minimum channel bandwidth that you can set is 2 kHz at a span of
1 kHz.
Selecting a standard
You can store the main measurement settings as a standard file. When you load such
a standard file, the R&S FPC automatically configures the measurement regarding
channel and general measurement settings.
Standard files for common telecommunications standards are already provided with
the R&S FPC firmware.
If you want to measure a different standard, you can also create custom standard definition files with the R&S InstrumentView software and transfer them to the R&S FPC.
For more information, refer to the documentation of the R&S InstrumentView.
1. Press the "Meas" key to open the measurement menu.
2. Select the "Standard" menu item.
The R&S FPC opens a dialog box to select the standard.
3. Select one of the available standards.
The R&S FPC loads the configuration of the selected standard. It automatically
sets the span, resolution bandwidth, video bandwidth, sweep time and detector
required by the standard.
If the measurement is not according to the selected standard anymore (for example if you change a parameter), the R&S FPC shows a blue dot in front of the standard display.
Defining the reference level
The reference level is the power level that the R&S FPC expects at the RF input. When
you select the reference level, make sure that you do not overload the R&S FPC by
applying a signal whose power exceeds the maximum reference level.
As the power is measured with a small resolution bandwidth compared to the signal
bandwidth, it is still possible to overload the R&S FPC, even if the trace is within the
measurement diagram. To prevent an overload, measure the occupied bandwidth with
the largest resolution bandwidth possible using the peak detector. If you set these
parameters, it is not possible for the trace to exceed the reference level.
To simplify operation and to prevent incorrect measurements, the R&S FPC has an
automatic routine for setting the reference level.
1. Press the "Meas" key to open the measurement menu.
2. Select the "Level Adjust" menu item.
The R&S FPC performs a measurement to determine the optimal reference level.
83User Manual 1178.4130.02 ─ 07
Page 87

R&S®FPC
The Spectrum Application
Measurements and Result Displays
It uses a resolution bandwidth of 1 MHz, a video bandwidth of 1 MHz and the peak
detector. After finishing the automatic measurement, the R&S FPC sets the optimal
reference level.
Changing the span
Usually, the span that the R&S FPC selects yields optimal results. But sometimes you
also need to see the spectrum outside the current span to detect other signal components that you need to include in the measurement. Therefore, you can adjust the span
to up to ten times the channel bandwidth and hence still be able to see the spectrum
outside the measurement channel.
1. Press the "Span" key to open the span menu.
2. Select the "Manual Span" menu item.
The R&S FPC opens an input field to define the span.
3. Enter the span you need.
Note: The largest possible span for the channel power measurement is ten times
the channel bandwidth. At larger spans, the result of the channel power measurement would be increasingly imprecise, because too few points of the trace would
be in the channel you are measuring.
14.2.7 Working with the Spectrogram Result Display
Access (measurement menu): "Meas" > "Measurement Mode" > "Spectrogram"
Access (measurement menu): "Meas" > "Measurement Mode" > "Spectrogram Play-
back"
Remote commands to control the spectrogram:
●
not supported
Available with the optional "Advanced Measurements" application.
The spectrogram result display shows the spectral density of a signal in the frequency
domain and over time simultaneously.
Like other result displays, the x-axis represents the frequency span. The y-axis represents time. Time in the spectrogram runs chronologically from top to bottom. Therefore,
the top of the diagram is the present. A third dimension shows the amplitude for each
frequency by mapping different colors to every power level.
The color the R&S FPC assigns to a power level that was measured depends on:
●
The color table you have selected.
●
The spectrogram reference level.
●
The spectrogram level range.
The spectrogram consists of horizontal lines, each one pixel high, that are called
frames. In the default state, a frame is added to the spectrogram after each sweep.
This means that the amount of data in a frame depends on the sweep time. Because
the spectrogram in the R&S FPC runs from top to bottom, the outdated time line(s)
84User Manual 1178.4130.02 ─ 07
Page 88

R&S®FPC
The Spectrum Application
Measurements and Result Displays
move down one position, so that the present frame is always on top of the diagram.
Therefore, the sequence of frames is chronological.
Selecting the spectrogram result display
1. Press the "Meas" key to open the measurement menu.
2. Select the "Measurement Mode" menu item to open the measurement mode menu.
3. Select the "Spectrogram" menu item.
The R&S FPC starts the recording of the spectrogram.
By default, the spectrogram result display is made up out of two windows. The upper
window shows the measured spectrum as a line trace. The lower window shows the
measurement results in a spectrogram. The amount of information in the spectrogram
is restricted by the internal memory of the R&S FPC. The R&S FPC can store up to
1024 frames (= line traces). When the measurement runs longer, the oldest frames are
deleted. As the height of the display is smaller than 1024 pixels, some of the data
becomes invisible after a time (but remains in the memory).
● Spectrogram Recording.......................................................................................... 85
● Color Definition........................................................................................................87
● Spectrogram Playback............................................................................................90
14.2.7.1 Spectrogram Recording
When you are in continuous sweep mode, the R&S FPC starts to record spectrogram
data when you enter the spectrogram mode. You can see that the spectrogram result
display fills up, as each sweep adds an additional line to the spectrogram.
When you are in single sweep mode, the R&S FPC does not add a line to the spectrogram until you initiate the next single sweep.
Controlling the spectrogram update
In continuous sweep mode, you can interrupt the spectrogram recording.
1. Press the "Meas" key to open the measurement menu.
2. Select the "Hold" menu item.
The spectrogram recording stops. No more new lines are added to the spectro-
gram.
The measurement itself, however, does not stop. The line trace in the spectrum
display is still updated continuously. If you want to stop the measurement completely, you have to stop it by selecting single sweep mode. In that case, the
R&S FPC finishes the current sweep and stops the measurement. It keeps the
spectrogram data that has already been recorded.
3. Select the "Hold" menu item again.
The R&S FPC resumes updating the spectrogram.
85User Manual 1178.4130.02 ─ 07
Page 89

R&S®FPC
The Spectrum Application
Measurements and Result Displays
The spectrogram result display is filled with new lines until you change a measurement setting.
When you change a setting (for example the center frequency), the spectrogram
clears and starts to fill again.
4. You can also clear the spectrogram manually. Press the "Meas" key.
5. Select the "Clear" menu item.
Resetting the spectrogram
The R&S FPC clears the spectrogram result display when you change a measurement
setting, for example one of the frequency settings or the resolution bandwidth.
You can also clear it deliberately.
1. Press the "Meas" key to open the measurement menu.
2. Select the "Clear" menu item.
The R&S FPC deletes the current spectrogram data and starts a new recording.
Displaying the spectrogram in full screen
By default, the spectrogram takes half of the diagram area, with the upper part showing
the results of the current sweep as a line trace. You can view more of the signal history
by displaying the spectrogram in full screen mode.
1. Press the "Meas" key to open the measurement menu.
2. Select the "Full Screen" menu item.
The R&S FPC now uses the full diagram area of the screen for the spectrogram.
The number of lines in the spectrogram and therefore the displayed time period
more than doubles.
Note: It can, however, be necessary that the spectrum result display is still visible
to evaluate measurement results. For this purpose, the spectrogram has an (invisible) scrollbar that you can use to scroll up and down the spectrogram to the frame
that you would like to see.
Scrolling through the spectrogram
As more and more lines are added to the spectrogram, older data is moved down until
it disappears from the visible spectrogram. The data itself is still available, but you
have to scroll through the spectrogram to see those parts of the spectrogram.
Arrows on the right side of the spectrogram indicate that more data than is visible on
the screen is available.
► Press the "Up" or "Down" cursor keys.
The R&S FPC scrolls through the spectrogram history.
The symbols on the right side of the spectrogram indicate the position of the spectrogram part currently displayed on the screen.
● A single down arrow in the right lower corner of the spectrogram indicates that
the uppermost frame still represents the most recently recorded trace.
86User Manual 1178.4130.02 ─ 07
Page 90

R&S®FPC
14.2.7.2 Color Definition
The Spectrum Application
Measurements and Result Displays
● Two arrows (one up, one down) indicate that the spectrogram area displayed is
somewhere in the middle of the available history.
● A single up arrow in the upper right corner of the spectrogram indicates that the
lowest line of the spectrogram represents the end of the history buffer.
Colors are an important element of the spectrogram. The R&S FPC provides various
features to customize the display for the best viewing results.
Selecting a color scheme
The first and most obvious way to adjust colors is to select a different color scheme.
1. Press the "Meas" key to open the measurement menu.
2. Select the "Settings" menu item to open the spectrogram settings menu.
3. Select the "Color Table" menu item to open the color table menu.
4. Select the color scheme you are most comfortable with.
The R&S FPC adjusts the screen colors according to your selection.
The following color schemes are available.
● Default
● Green-Yellow
● Green-Blue
● Black-White
● Red-Purple
● Blue-Black
Adjusting the color distribution
It is possible that the color distribution is not ideal in the default configuration. The
R&S FPC provides several settings to further enhance the color display in the spectrogram.
The following examples are based on the red-purple color scheme.
The first method is to cut the reference level. It eliminates amplitudes from the color
map that are not part of the signal.
Example: By default, the spectrogram reference level is -20 dBm.
That means that signal parts with an amplitude of -20 dBm would be red in the spectrogram, and signal parts with a very small amplitude would be purple. Everything in
between is a shade of the colors between. As the colors are distributed over a very
large range (about a 100 dBm or more), it is likely that you cannot distinguish details in
the signal.
87User Manual 1178.4130.02 ─ 07
Page 91

R&S®FPC
The Spectrum Application
Measurements and Result Displays
Therefore you can adjust the color map to the overall shape of the signal you are measuring. Let us say, for example, that the signal has an amplitude range of about 30 dB
with the maximum amplitude at about -80 dBm and the minimum amplitude at about
-120 dBm. With the default settings, the spectrogram is made up exclusively of red col-
ors and it is not easy to distinguish amplitude levels. That is because the purple color
shades are completely out of range.
To get a better result, change the spectrogram reference level to a level near the maximum power level that has been measured first.
1. Press the "Meas" key to open the measurement menu.
2. Select the "Level Range" menu item to open the level range menu.
3. Select the "Reference Level" menu item.
The R&S FPC opens an input field to enter the spectrogram reference level.
The reference level should be near the maximum level that has been measured
while the spectrogram was running. In the example, the reference level should be
at about -80 dBm.
4. Enter the reference level you need.
The R&S FPC now shifts the reference level of the spectrogram to the value you
have entered.
Note that the spectrogram reference level does not affect the reference level of the
spectrum analyzer itself. In the same way, the reference level of the spectrum analyzer does not affect the spectrogram. The spectrum trace therefore remains
exactly the same.
88User Manual 1178.4130.02 ─ 07
Page 92

R&S®FPC
The Spectrum Application
Measurements and Result Displays
The changes however, still do not show signal differences in detail. The only thing
that happened is that the colors have shifted, in the example to purple, because
the color that corresponds to the reference level has shifted from red to purple. All
other colors that are part of the color scheme are still unused, because the spectrogram level range is still the same (100 dB).
5. Select the "Level Range" menu item.
The R&S FPC opens an input field to enter the spectrogram level range.
In the example, the level range of the signal is from about -80 dBm to about
-120 dBm.
6. Therefore, set the level range to 40 dB to cover the complete level range of the signal.
As the level range is now adjusted, the R&S FPC is able to map its complete color
range to the level range of the signal.
This means that signal parts with a low amplitude are in a shade of red while signal
parts with a high amplitude are purple.
89User Manual 1178.4130.02 ─ 07
Page 93

R&S®FPC
The Spectrum Application
Measurements and Result Displays
The best way to display a spectrogram is therefore to reduce the level range until
the lowest signal part is mapped to the lower end of the color map and the highest
signal part to the upper end of the color map.
Note: You can also use the "Auto Range" menu item to adjust the displayed level
range. In that case, the R&S FPC selects a level range that best suits the currently
measured signal.
In a last step, you can configure the spectrogram in a way that it only shows signal
peaks in color and the noise floor in black. To get a result like that you have to
reduce the level range, until the noise floor is outside the displayed range.
7. Instead of entering a level range of 40 dB, enter a level range of 30 dB or even
25 dB.
This provides a high contrast between signal parts that are above the noise floor,
and the noise floor, which is drawn in black.
To show details of the noise floor, and exclude the peak levels you have to lower
the spectrogram reference level, until it is just above the noise floor.
The R&S FPC then displays the signal parts that are above the reference level in
only one color, which is the color at the upper border of the color map.
14.2.7.3 Spectrogram Playback
Saving spectrogram data
You can save the data of the spectrogram for documentation or for further analysis of
the recorded data.
1. Press the "Meas" key to open the measurement menu.
2. Select the "Save" menu item to open the file manager.
3. Enter the name of the spectrogram with the alphanumeric keys.
By default, the R&S FPC saves the spectrogram as Spectrogram### with
ascending numbers. The file extension for spectrogram data is *.spm.
90User Manual 1178.4130.02 ─ 07
Page 94

R&S®FPC
The Spectrum Application
Measurements and Result Displays
4. Select the "Save" softkey to store the spectrogram.
Now that you have saved the spectrogram, you can replay it any time you want.
The number of spectrograms that you can store on the R&S FPC internal memory
depends on the other datasets that are currently on the R&S FPC.
Playback of a spectrogram
If you have recorded a spectrogram and have saved it in internal memory or a memory
stick, you can view the results of that measurement later.
1. Press the "Meas" key to open the measurement menu.
2. Select the "Measurement Mode" menu item.
3. Select the "Spectrogram Playback" menu item.
The R&S FPC enters the spectrogram playback mode. In playback mode, it no lon-
ger records any data. Only the data that has been recorded already is displayed.
Restoring a spectrogram
You can restore a spectrogram that you recorded some other time and saved in the
internal memory of the R&S FPC or on a memory stick.
1. Press the "Meas" key to open the measurement menu.
2. Select the "Recall" menu item.
The R&S FPC opens the file manager.
3. Select the file you need. The file extension for spectrogram data is *.spm.
The R&S FPC loads the spectrogram and shows the data in the display.
Basically, you can do the same things in spectrogram playback mode as in the
spectrogram recording mode, for example customize the display to your needs.
In addition to that functionality, it is possible to view not only the spectrum that
belongs to the currently selected spectrogram frame, but also the spectrums of all
frames that have been recorded.
Working with time lines in playback mode
To find a particular point in time and display the corresponding spectrum, you can use
two time lines.
When you enter the playback mode, the R&S FPC displays two time lines in the spectrogram.
Both time lines (T1 and T2) correspond to an absolute time value, whose position
refers to the most recent time frame (top of the diagram). Both time lines are positioned
on the most recent spectrogram line at the top of the result display.
You can now select a specific spectrogram frame that is in the memory of the
R&S FPC.
1. Press the "Meas" key to open the measurement menu.
91User Manual 1178.4130.02 ─ 07
Page 95

R&S®FPC
The Spectrum Application
Measurements and Result Displays
2. Select the "Time Line <x>" menu item.
The R&S FPC opens an input field to define the position of the corresponding time
line (T1 or T2).
3. Position the time line by entering a number or moving it with the rotary knob.
Entering 0 sets the time line marker on the most recent frame. The maximum value
that you can enter is 1024 (the maximum number of frames the R&S FPC can
store in its memory).
Figure 14-5: Time lines in the spectrogram
Note that not all frames are visible on the screen. If a frame is part of the history
outside the visible area, the time line is also not visible and you have to scroll
through the spectrogram to be able to see it again.
The upper window displays the spectrum of the frame at the time line position. By
moving the time line, you can thus browse through the history of spectra stored in
memory.
In the marker information field, the R&S FPC shows the time stamp of the time line.
The time stamp of the first time line T1 is always referred to the top-most frame. A
time stamp of 00:00:50:000, for example, means that the data was measured
50 seconds prior to the topmost frame).
In addition to the time line (horizontal marker), you can also use (vertical) markers
in the spectrogram.
With the help of the marker and the time line, you are able to find the exact
moment when a specific event has occurred in the spectrum.
4. Press the "Marker" key.
The R&S FPC activates a marker and sets it on the peak level of the currently dis-
played spectrum.
5. Use the rotary knob or the cursor keys to move the marker on the x-axis to the frequency you want to analyze, or enter the frequency directly with the number keys.
6. Select the "Time Line" softkey and browse through the spectrums using the rotary
knob or the cursor keys until the spectrum of interest is displayed in the upper window.
The time stamp of the selected time line (displayed in a field above the diagram
area) gives you a precise indication on when the event shown in the spectrum
occurred.
92User Manual 1178.4130.02 ─ 07
Page 96

R&S®FPC
The Spectrum Application
Frequency Configuration
Figure 14-6: Time lines and markers in the spectrogram
Switching back to active spectrogram recording
You can presume the spectrogram recording from playback mode.
1. Press the "Meas" key to open the measurement menu.
2. Select the "Live Update" menu item.
The R&S FPC switches back to a live measurements.
14.3 Frequency Configuration
Access (frequency menu): "Freq"
Access (span menu): "Span"
Access: "Setup" > "Config Overview" > "Frequency" (selected settings)
Remote commands to configure the frequency:
●
Chapter 19.12.2, "Frequency", on page 245
The main application of a spectrum analyzer is to measure the frequency and the
power level of a signal and show these signal characteristics in a diagram. The x-axis
of the diagram usually contains the frequency information of the signal, while the y-axis
usually contains the level information.
Regarding the frequency information, a typical measurement task does not require you
to measure the characteristics of the complete frequency range supported by the
R&S FPC. Instead, it is usually sufficient to measure the characteristics of a limited frequency range only.
The R&S FPC provides several settings to control the frequency range it actually
measures.
You can define the frequency range in various ways.
●
In terms of a center frequency and the span around it.
93User Manual 1178.4130.02 ─ 07
Page 97

R&S®FPC
14.3.1 Measurement Frequency
The Spectrum Application
Frequency Configuration
●
In terms of a start and stop frequency from which the center frequency is automatically derived.
●
In terms of a channel table that contains (frequency) information about a set of
transmission channels.
● Measurement Frequency........................................................................................ 94
● Frequency Span......................................................................................................96
● Channel Tables....................................................................................................... 97
The measurement frequency (or center frequency) is the frequency that the spectrum
analyzer tunes to. It is represented by the frequency at the center of the x-axis in the
diagram area.
If you know the (approximate) frequency of the signal you are measuring, you can simply match the frequency of the DUT to the center frequency and define an appropriate
span.
If you are measuring unknown signals within a greater frequency range, for example
harmonics, it is better to define the frequency range based on start and stop frequen-
cies.
Defining a center frequency
1. Press the "Freq" key to open the frequency menu.
2. Select the "Center Freq" menu item.
The R&S FPC opens an input field to define the center frequency.
Tip: When you press the "Freq" key, the R&S FPC automatically opens an input
field to define the center frequency. If the input field is inactive, you can open it with
the "Center Freq" menu item.
3. Enter the required frequency.
The frequency you have entered becomes the new center frequency.
While adjusting the center frequency, you can obtain a value that is outside the
R&S FPC maximum span. If this happens, the R&S FPC automatically reduces the
span.
You can also define the frequency by selecting a specific transmission channel. In
that case, the frequency is defined in a channel table. For more information, see
"Working with channel tables" on page 97.
Defining a frequency step size
You can change the center frequency in fixed steps easily with the rotary knob or the
cursor keys.
94User Manual 1178.4130.02 ─ 07
Page 98

R&S®FPC
The Spectrum Application
Frequency Configuration
When you select the center frequency with the rotary knob or the cursor keys, the distance of each step that you take depends on the span. With the rotary knob, the smallest possible step is a pixel. With the cursor keys, the step is 10 % of the span or one
division of the grid.
1. Press the "Freq" key to open the frequency menu.
2. Select the "CF Step Size" menu item to open the frequency step size menu.
3. Select one of step size options.
● "0.1 x Span"
The step size equals 10 % of the span or 1 division of the horizontal axis.
● "= Center"
The step size equals the center frequency.
This step size is ideal for measurements on harmonics. When you increase or
decrease the center frequency, the center frequency automatically moves to
the next harmonic.
● "Manual <x> Hz"
Define any step size you want.
This step size makes it easy to investigate a spectrum with frequencies at constant intervals.
The R&S FPC adjusts the step size accordingly.
If you set the step size to 10 % of the span or to the center frequency, the
R&S FPC sets the step size internally. Manually defining the step size opens an
input field to define the step size.
Defining a frequency offset
A frequency offset allows you to shift the displayed frequency values by a certain
amount to a higher or lower frequency. This shift is an arithmetical operation only - the
measured frequency really remains the same.
Shifting the frequency to another value can be useful, for example, on frequency converting DUTs such as satellite downconverters. You are then able to display the original, unconverted input frequency of the DUT in the measurement results.
1. Press the "Freq" key to open the frequency menu.
2. Select the "Freq Offset" menu item.
The R&S FPC opens an input field to define the frequency offset.
3. Enter the required frequency offset.
TheR&S FPC adds the frequency offset to the center frequency you have defined.
A blue dot at the center frequency label indicates that a frequency offset is active.
You can define positive frequency offsets in the range from 1 Hz to 100 GHz in
steps of 1 Hz. The maximum negative frequency offset depends on the start frequency you have defined. The start frequency, taking the frequency offset into
account, is always ≥ 0 Hz.
95User Manual 1178.4130.02 ─ 07
Page 99

R&S®FPC
14.3.2 Frequency Span
The Spectrum Application
Frequency Configuration
The span is the frequency range that the measurement covers. You can measure the
full frequency range of the R&S FPC, or a smaller part of it. The span also defines
which frequency information is displayed in the measurement diagram - the span is the
frequency range around the center frequency that you have defined.
The available span for frequency domain measurements depends on the instrument
model.
The span you should select depends on the bandwidth of the signal you are measuring
and the type of measurement that you perform. A rule of thumb is to select a span that
is at least twice as large as the bandwidth occupied by the measured signal.
You can define the span directly or in terms of a start and stop frequency.
Defining the frequency span
1. Press the "Freq" key to open the frequency menu.
2. Select the "Manual Span" menu item.
The R&S FPC opens an input field to define the span.
Tip: When you press the "Span" key, the R&S FPC automatically opens an input
field to define the span. If the input field is inactive, you can open it with the "Manual Span" menu item.
3. Enter a span.
The R&S FPC adjusts the span of the horizontal axis to the value you have
entered.
Tip: If you define a span of 0 Hz (zero span), the R&S FPC measures in the time
domain.
In that state, the R&S FPC measures the signal at the current center frequency
only. Instead of displaying the spectrum, the R&S FPC shows the signal power
over a certain time period (like an oscilloscope). The horizontal axis becomes the
time axis. The display always starts at 0 s and stops after the current sweep time.
You can select time domain measurements without having to enter the value manually. Instead, select the "Zero Span" menu item to get a span of 0 Hz.
Full span measurements
You can restore the span that covers the complete frequency range supported by the
R&S FPC quickly and without having to enter the value manually with the "Full Span"
menu item.
If you need to switch back to a smaller span, you can restore the span that was last
selected with the "Last Span" menu item.
96User Manual 1178.4130.02 ─ 07
Page 100

R&S®FPC
The Spectrum Application
Frequency Configuration
Defining a start and stop frequency
Defining a start a stop frequency is best suited for example for measurements on harmonics or signals whose exact frequency is unknown. When you define a start and
stop frequency, the center frequency is automatically adjusted to be in the center of
start and stop frequency.
1. Press the "Freq" key to open the frequency menu.
2. Select the "Start Freq" menu item.
The R&S FPC opens an input field to define the start frequency.
3. Enter a start frequency.
4. Select the "Stop Freq" menu item.
The R&S FPC opens an input field to define the stop frequency.
5. Enter a stop frequency.
Tip: If you have entered a stop frequency that is outside the maximum frequency
range, the R&S FPC sets the stop frequency to the possible maximum.
The R&S FPC adjusts the horizontal axis according to your input, beginning with
the start frequency and ending with the stop frequency.
The label of the horizontal axis changes from "Center" and "Span" to "Start" and
"Stop".
14.3.3 Channel Tables
Working with channel tables
Almost all transmission systems divide their assigned frequency ranges into channels.
Each channel corresponds to a specific frequency. To keep the handling of such systems simple, you can use channel tables instead of entering frequencies manually.
The R&S FPC already comes with an assortment of channel tables that you can use
without doing anything. If you want to test transmission standards that are not listed,
you can also create your own channel tables with the "Channel Table Editor" of the
R&S InstrumentView software package. To use one of those, you just have to copy the
channel table to the R&S FPC.
For more information, refer to the R&S InstrumentView user manual.
1. Press the "Freq" key to open the frequency menu.
2. Select the "Frequency Mode" menu item to open the frequency mode.
3. Select the "Channel Downlink" or "Channel Uplink" menu item.
The R&S FPC opens a dialog to select a channel table.
4. Select one of the available channel tables.
97User Manual 1178.4130.02 ─ 07
 Loading...