

Page 1
Model 226
Submersion/Insertion Toroidal Sensor
Instruction Sheet
PN 51A-226/rev.D
December 2010
For additional information, visit our website
at www.emersonprocess.com/raihome/liquid/.
SUBMERSION
CODE - 80
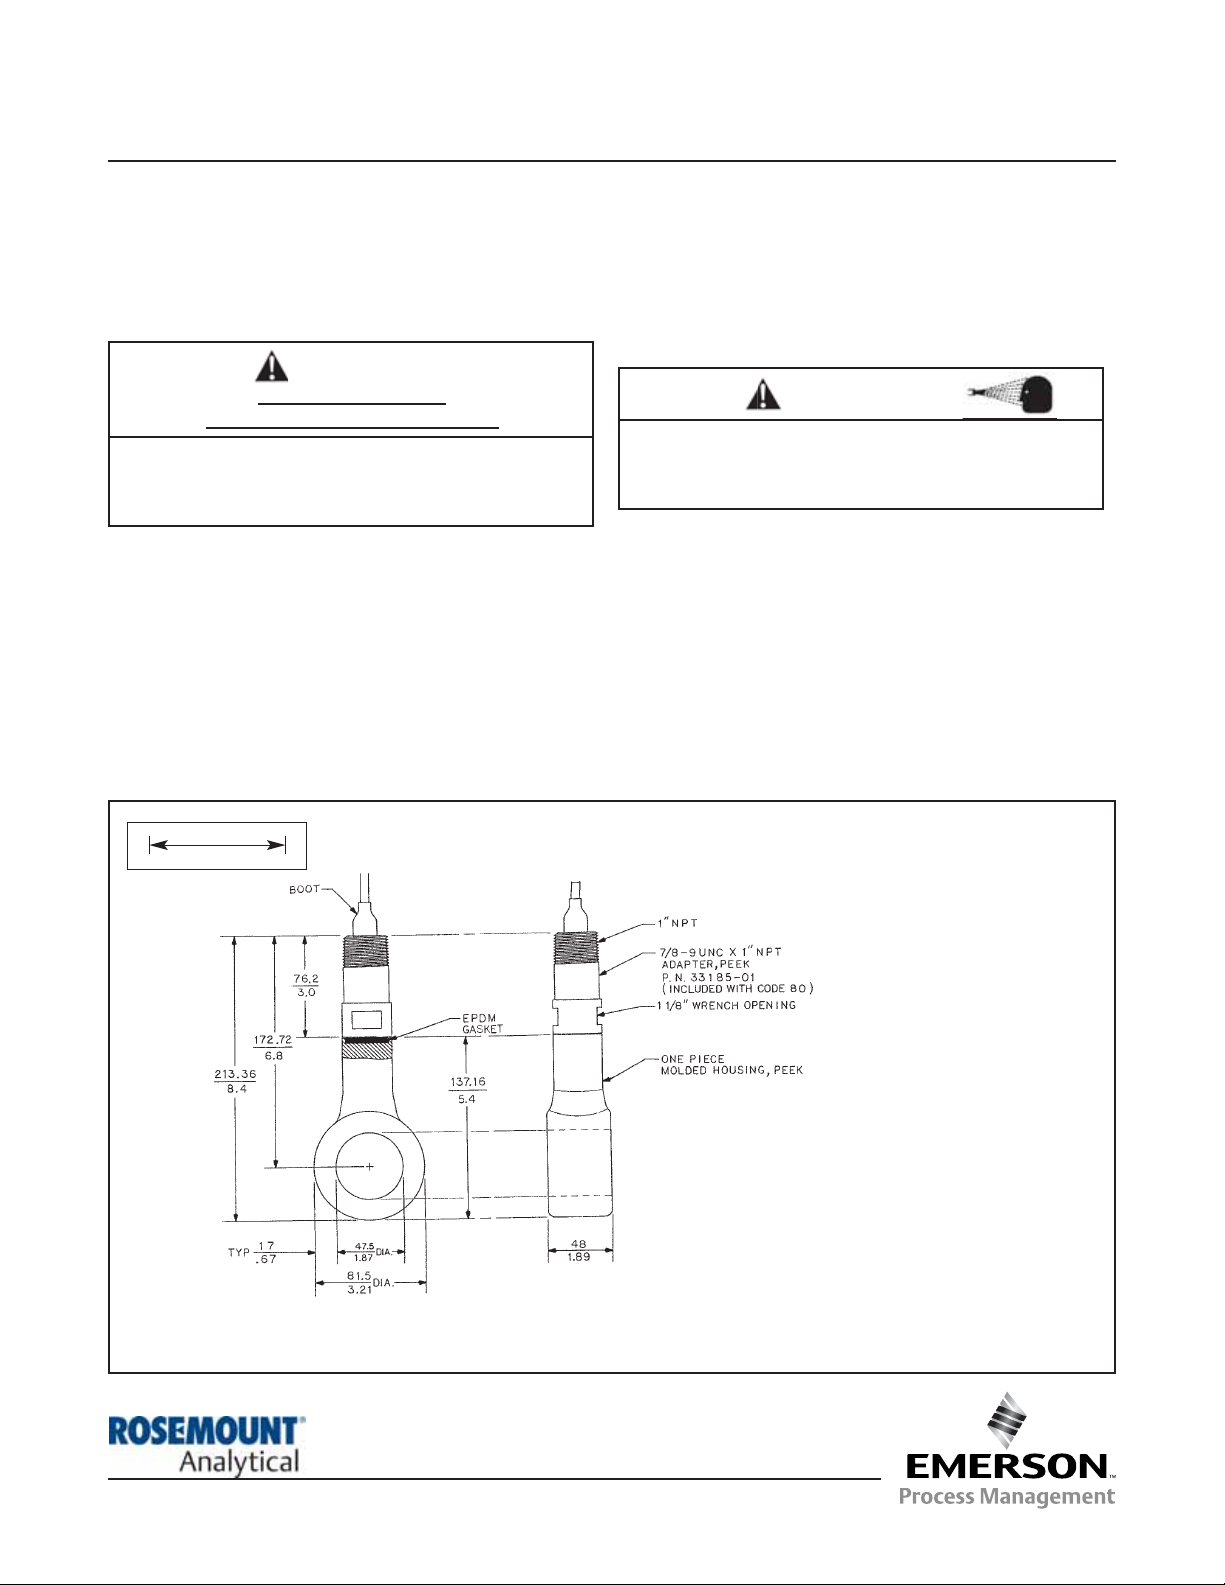
FIGURE 1. Submersion Installation Showing Mounting Hardware
Screw the rear facing thread of the PEEK adapter into the pipe. Do not let the back end of the sensor get wet.
SPECIFICATIONS
Wetted Material: PEEK (glass-filled), EPDM gasket
Temperature: 248°F (120°C) maximum
Pressure: 295 psig (2135 kPa abs)
INSTALLATION
Keep at least 1.5 in. (40 mm) between the sensor and pipe walls. If the clearance is too small, calibrate the sensor
in place. Ensure that the sensor is completely submerged in the liquid. Mounting the sensor in a vertical pipe run
with the flow from bottom to top is best. If the sensor must be installed in a horizontal pipe run, mount the sensor in
the 3 o’clock or 9 o’clock position.
MILLIMETER
INCH
WARNING
Before removing the sensor, be absolutely certain
that the process pressure is reduced to 0 psig and
the process temperature is lowered to a safe level!
CAUTION
The wetted sensor materials may not be compatible
with process com position and operating conditions.
Application compat ibility is entirely the
responsi-
bility of the user.
CAUTION
SENSOR/PROCESS
APPLICATION COMPATIBILITY
Page 2
MODEL 226 INSTALLATION
WIRING
Keep sensor wiring away from ac conductors and high current demanding equipment. Do not cut cable.
Cutting the cable may void the warranty.
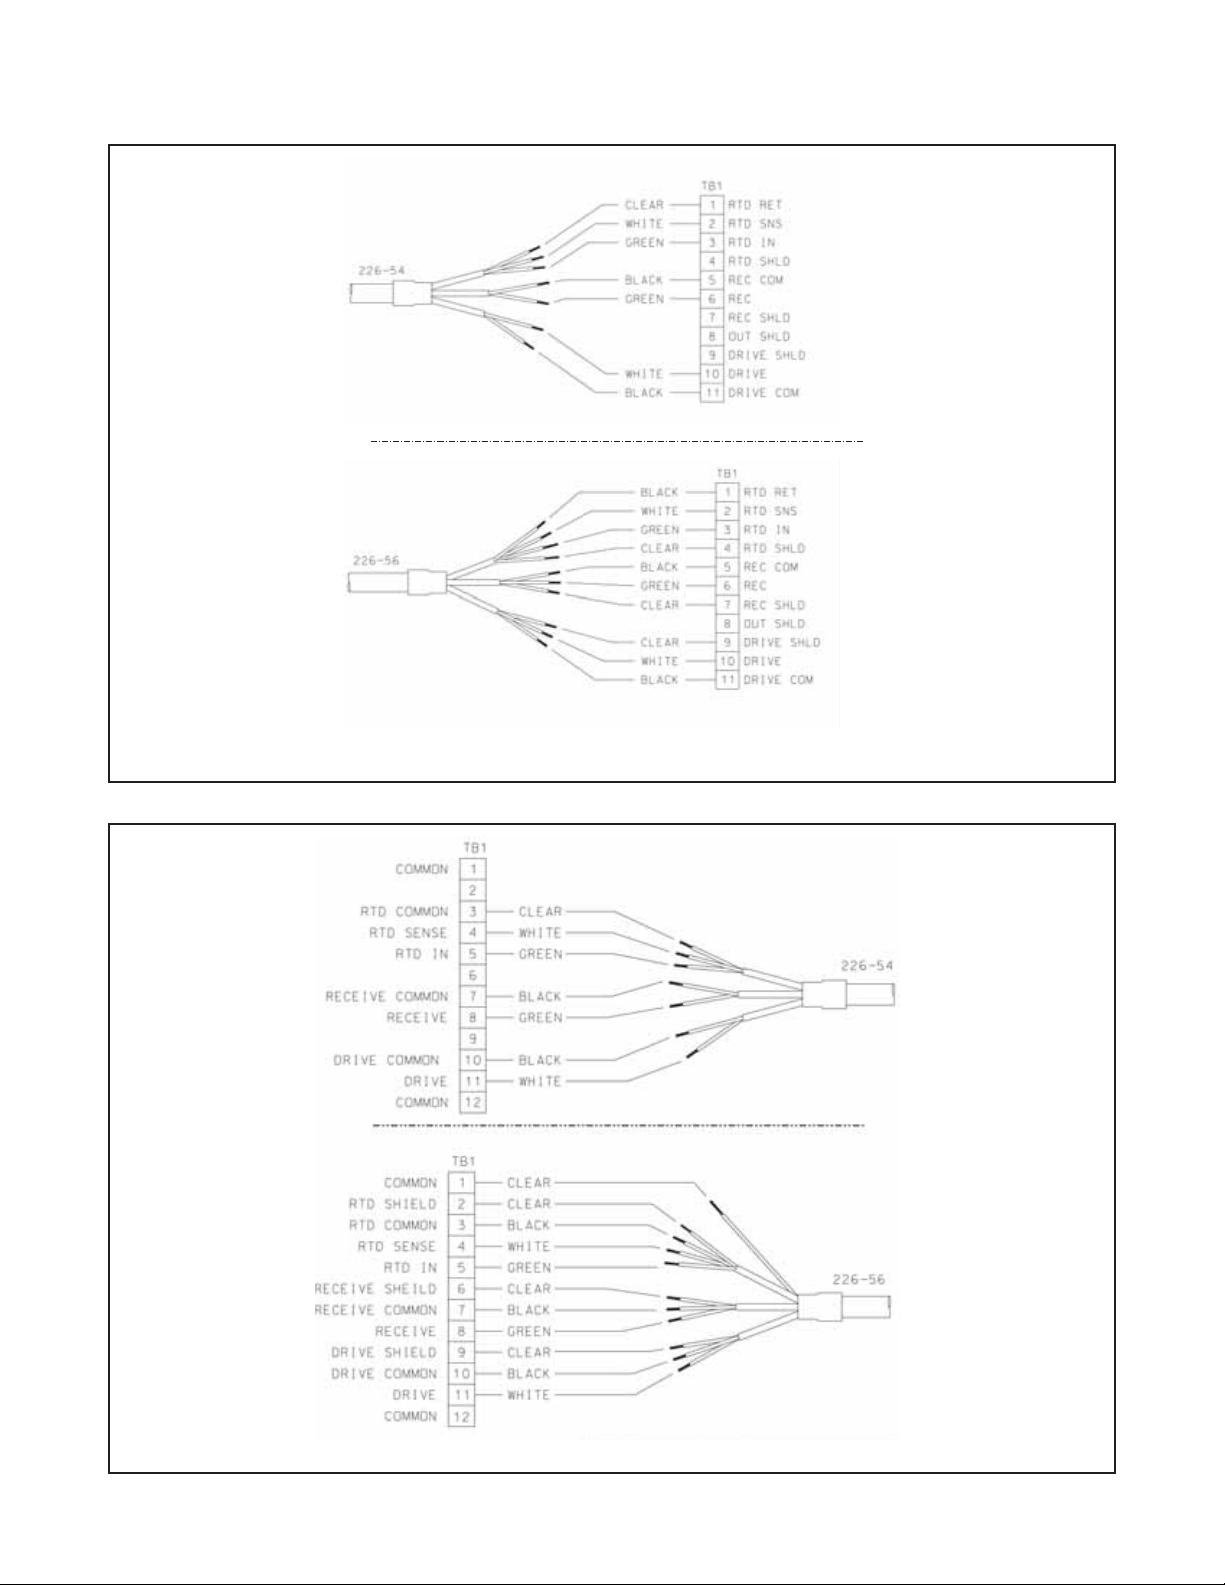
FIGURE 3. Wire Functions
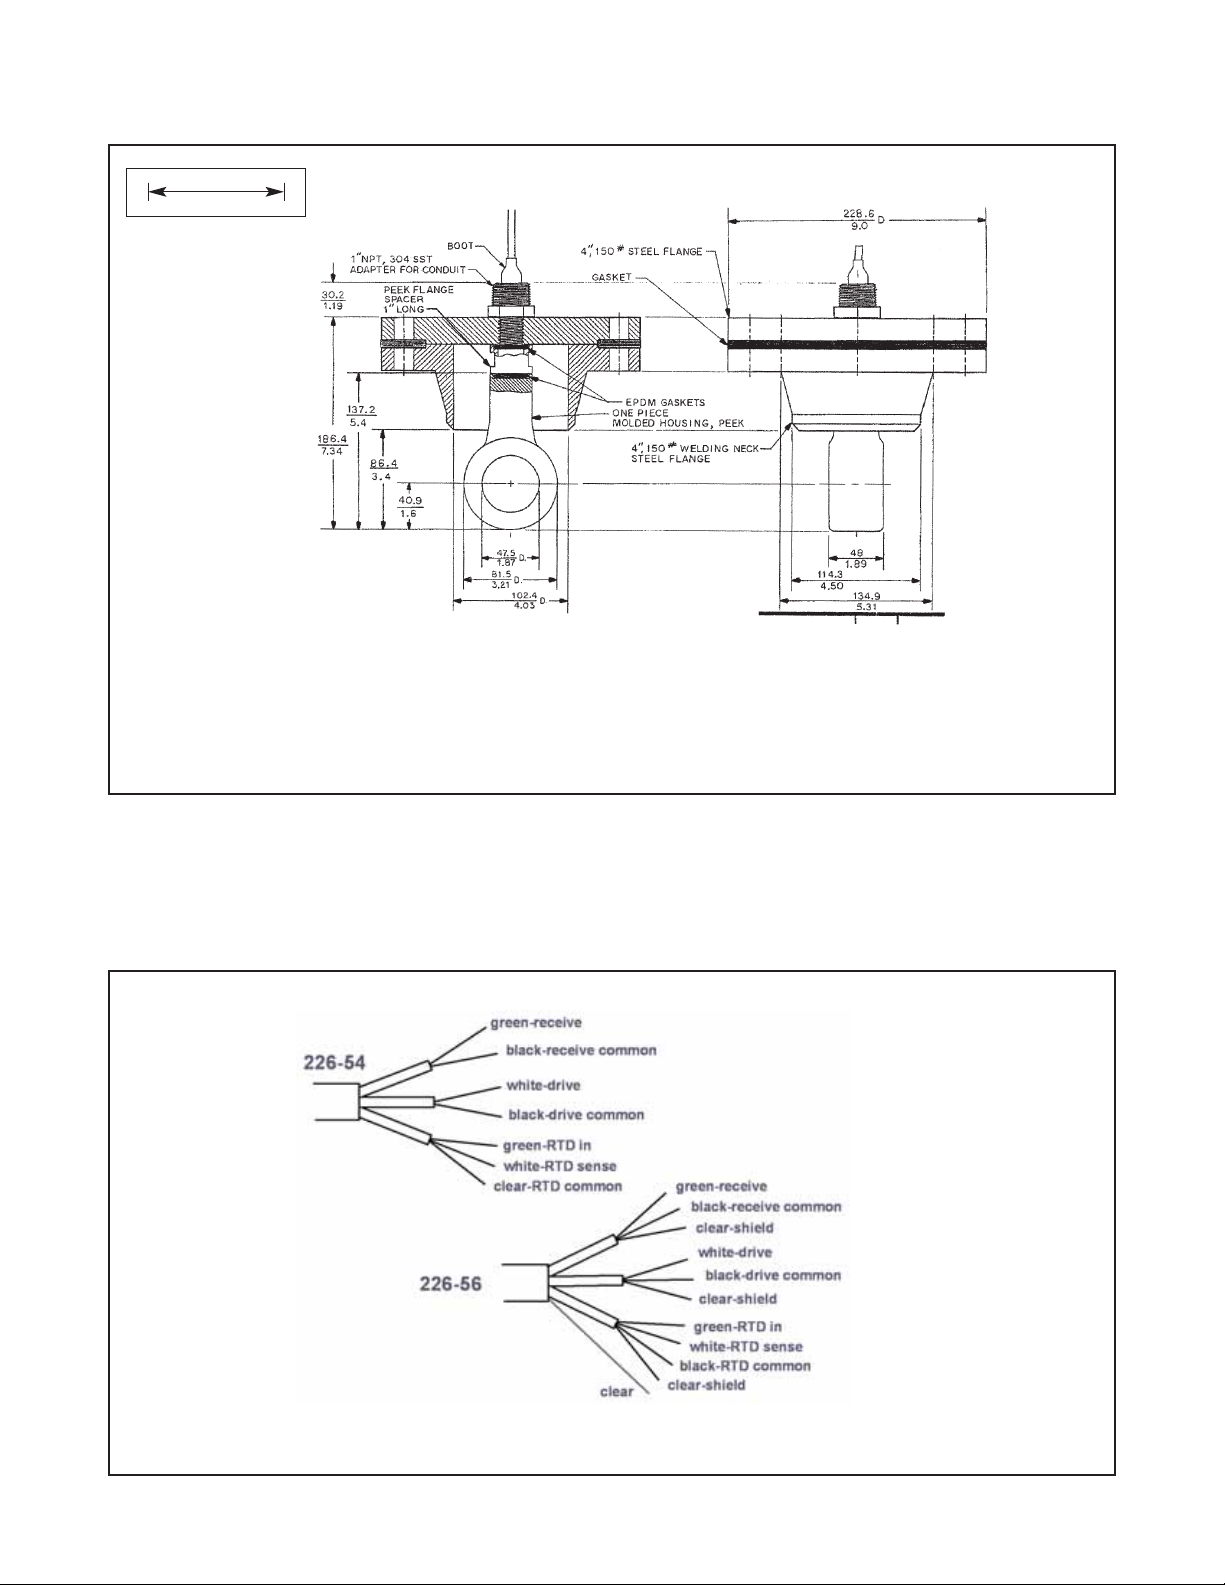
INSERTION
CODE - 81
MILLIMETER
INCH
FIGURE 2. Insertion Installation Showing Mounting Hardware
2
Page 3
3
MODEL 226 WIRING
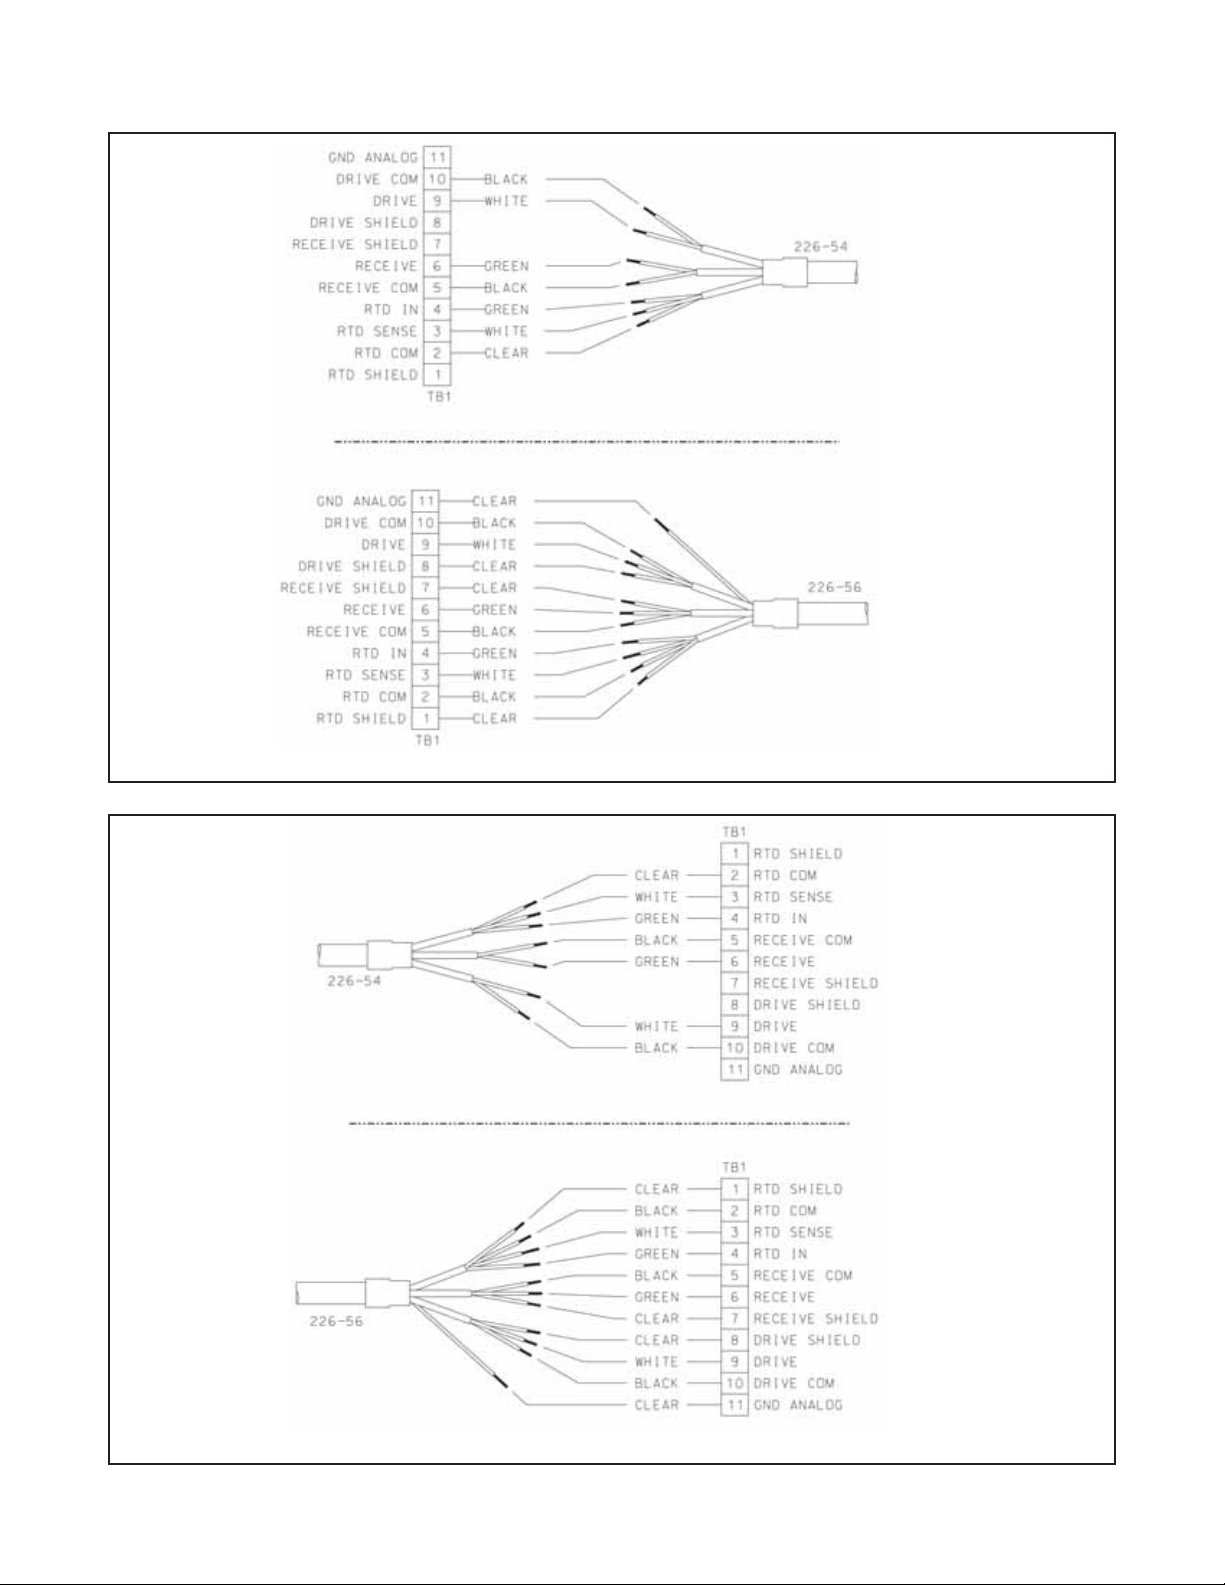
FIGURE 4. Wiring 226-54 and 226-56 sensors to Model 1056 and 56 analyzers
FIGURE 5. Wiring 226-54 and 226-56 sensors to Model 54eC analyzer
Page 4
MODEL 226 WIRING
FIGURE 6. Wiring 226-54 and 226-56 sensors to Model Xmt-T panel mount transmitter
FIGURE 7. Wiring 226-54 and 226-56 sensors to Model Xmt-T pipe/wall mount transmitter
4
Page 5

5
MODEL 226 WIRING
FIGURE 8. Wiring 226-54 and 226-56 sensors to Model 1066 transmitter
RCV B
RCV A
RSHLD
DRV B
226-54
RTN
SENSE
RTD IN
SHLD
CLEAR
WHITE
GREEN
BLACK
GREEN
BLACK
WHITE
DRV A
DSHLD
TB1TB2
FIGURE 9. Wiring 226-54 and 226-56 sensors to Model 5081-T transmitter
RCV B
RCV A
RSHLD
DRV B
226-56
RTN
SENSE
RTD IN
SHLD
BLACK
GREEN
WHITE
CLEAR
DRV A
DSHLD
CLEAR
BLACK
CLEAR
WHITE
GREEN
BLACK
TB1TB2
Page 6

MODEL 226 WIRING
FIGURE 10. Wiring sensors through a remote junction box
Wire sensors point to point. For wiring at the analyzer end, refer to the appropriate analyzer wiring diagram. For interconnecting
cable 23294-00, use the 2265-54 wiring diagram. For interconnecting cable 23294-04 and 23294-05, use the 226-56 wiring diagram.
FIGURE 11. Remote Junction Box (PN 23550-00)
WIRING THROUGH A REMOTE JUNCTION BOX
6
Page 7

7
MODEL 226 CALIBRATION
CALIBRATION
The nominal cell constant of the Model 226 sensor is
1.2/cm. The error in the cell constant is about ±10%, so
conductivity readings made using the nominal cell constant will have an error of at least ±10%. Wall effects,
discussed below, will likely make the error greater. For
higher accuracy, the sensor must be calibrated.
Wall effects arise from the interaction between the current induced in the sample by the sensor and nearby
pipe or vessel walls. As Figure 12 shows, the measured conductivity can either increase or decrease
depending on the wall material. Because wall effects
do not disappear until the Model 226 sensor is at least
1.5 inch (40 mm) away from the nearest wall, wall
effects are present in most installations. Correcting for
them is an important part of calibration.
Conductivity sensors are calibrated against a solution
of known conductivity (a standard) or against a previously calibrated referee sensor and analyzer. If wall
effects are present, calibrating a toroidal sensor with
a standard solution is possible only if the vessel holding the standard has exactly the same dimensions as
the process piping. If the Model 226 sensor is installed
in a tee, duplicating the process environment in the
laboratory or shop might be possible. Otherwise, cali-
bration against a standard solution is probably impractical. The alternative is to calibrate the sensor in place
against a referee sensor and analyzer, ideally while
both sensors are simultaneously measuring the same
process liquid. If this is not practical, calibrate the
process sensor against the results of a measurement
made on a grab sample.
For more information about calibrating toroidal conductivity sensors, refer to application sheet ADS 43-025
available on the Rosemount Analytical website.
MAINTENANCE
Generally, the only maintenance required is to keep
the opening of the sensor clear of deposits. Cleaning
frequency is best determined by experience.
FIGURE 12. Measured conductivity as a function
of clearance between sensor and walls
WARNING
Be sure sensor has been cleaned of process liquid
before handling.
CAUTION
Page 8

8
MODEL 226 MAINTENANCE
TROUBLESHOOTING
PROBLEM PROBABLE CAUSE SOLUTION
Off-scale reading Wiring is wrong. Verify and correct wiring.
RTD is open or shorted. Check the RTD for open or short circuits.
See Figure 13.
Sensor is not in process stream. Confirm that the sensor is fully submerged in
the process stream. See installation section.
Sensor is damaged. Perform isolation checks. See Figure 13.
Noisy reading Sensor is improperly installed in the Confirm that the sensor is fully submerged
process stream. in the process stream. See installation section.
Sensor cable is run near high voltage Move cable away from high voltage conductors.
conductors.
Sensor cable is moving. Keep sensor cable stationary.
Reading seems wrong (lower Bubbles are trapped in the sensor, Install the sensor in a vertical pipe run with the
or higher than expected) particularly in the toroid opening. flow against the toroid opening. Increase flow
if possible.
Sensor is not completely submerged in the Confirm that the sensor is fully submerged
process stream. in the process stream. See installation section.
Cell constant is wrong. Wall effects are Calibrate the sensor in place in the process
present. piping. See calibration section.
Wrong temperature correction algorithm Check that the temperature correction is
is being used. appropriate for the sample. See analyzer
manual for more information.
Temperature reading is inaccurate. Disconnect the RTD leads (Figure 13) and
measure the resistance between the in and
common leads. Resistance should be close
to the value in Table 1.
Slow temperature response to sudden Use an RTD in a metal thermowell for
changes in temperature. temperature compensation.
Sluggish response Sensor is installed in a dead area in the Move sensor to a location more representative
piping. of the process liquid.
Slow temperature response to sudden Use an RTD in a metal thermowell for
changes in temperature. temperature compensation.
Page 9

MODEL 226 MAINTENANCE
FIGURE 13. Resistance check. Disconnect leads from analyzer before measuring resistances.
TABLE 1.
Temperature Resistance
10°C 103.9 Ω
20°C 107.8 Ω
25°C 109.7 Ω
30°C 111.7 Ω
40°C 115.5 Ω
50°C 119.4 Ω
9
Page 10

NOTES:
10
Page 11

11
NOTES:
Page 12

Credit Cards for U.S. Purchases Only.
The right people,
the right answers,
right now.
ON-LINE ORDERING NOW AVAILABLE ON OUR WEB SITE
http://www.raihome.com
Emerson Process Management
2400 Barranca Parkway
Irvine, CA 92606 USA
Tel: (949) 757-8500
Fax: (949) 474-7250
http://www.raihome.com
© Rosemount Analytical Inc. 2010
8
 Loading...