

Page 1
Emerson Plantweb™ Insight
Reference Manual
00809-0100-4541, Rev GA
June 2020
Page 2

2
Page 3

Reference Manual Contents
00809-0100-4541 June 2020
Contents
Chapter 1 Introduction.............................................................................................................. 7
1.1 Using this manual........................................................................................................................ 7
1.2 Product recycling/disposal...........................................................................................................7
Chapter 2 Installation.................................................................................................................9
2.1 Safety messages.......................................................................................................................... 9
2.2 System requirements...................................................................................................................9
2.3 Installation procedure................................................................................................................10
2.4 Launching the application..........................................................................................................12
Chapter 3 Configuration...........................................................................................................15
3.1 Overview................................................................................................................................... 15
3.2 Safety messages........................................................................................................................ 15
3.3 Customize system settings........................................................................................................ 15
3.4 Application installation.............................................................................................................. 19
3.5 Application configuration.......................................................................................................... 19
Chapter 4 Version Upgrades.....................................................................................................25
4.1 Virtual machine upgrades..........................................................................................................25
4.2 Application upgrades.................................................................................................................25
4.3 Platform upgrades.....................................................................................................................25
Chapter 5 Modbus TCP Mapping.............................................................................................. 27
5.1 Setting up Modbus TCP from data system..................................................................................29
Chapter 6 Troubleshooting...................................................................................................... 33
6.1 Service support..........................................................................................................................33
6.2 Plantweb Insight: Unable to load Plantweb Insight Virtual Machine........................................... 34
6.3 Plantweb Insight: Virtual machine displaysv--IP Address Unknown--..........................................35
6.4 Plantweb Insight: OVF file error..................................................................................................36
6.5 Plantweb Insight: Web interface cannot be accesed...................................................................36
6.6 Plantweb Insight: Web interface login continues to spin after inputting email and password.....36
6.7 Plantweb Insight: Cannot connect to WirelessHART Gateway.....................................................37
6.8 Plantweb Insight: Click on application logo and nothings happens.............................................37
6.9 Steam trap application: Asset status displays "NoData/Error" after configuration....................... 38
6.10 Steam trap application: Asset status display "No Config".......................................................... 39
6.11 Steam trap application: Asset status in question......................................................................39
6.12 Pressure Relief Device Application: Numerous “No_Data/Error” events................................... 41
Appendix A Steam Trap Application configuration and information............................................ 43
A.1 Overview................................................................................................................................... 43
A.2 Global settings.......................................................................................................................... 43
Emerson.com/Plantweb 3
Page 4

Contents Reference Manual
June 2020 00809-0100-4541
A.3 Adding assets............................................................................................................................ 44
A.4 Calculated fields........................................................................................................................ 45
A.5 Modbus® TCP mapping..............................................................................................................47
Appendix B Pump Application configuration and information.....................................................49
B.1 Overview................................................................................................................................... 49
B.2 Global settings...........................................................................................................................49
B.3 Configuring assets..................................................................................................................... 49
B.4 Calculated fields........................................................................................................................ 52
B.5 Modbus TCP mapping................................................................................................................54
Appendix C Heat Exchanger Application configuration and information..................................... 55
C.1 Overview................................................................................................................................... 55
C.2 Global settings...........................................................................................................................55
C.3 Configuring assets.....................................................................................................................55
C.4 Calculated fields........................................................................................................................ 58
C.5 Modbus TCP mapping............................................................................................................... 60
Appendix D Wireless Pressure Gauge Application configuration and information........................61
D.1 Overview...................................................................................................................................61
D.2 Adding devices..........................................................................................................................61
D.3 Calculated fields........................................................................................................................61
Appendix E Air-Cooled Heat Exchanger Application configuration and information.................... 63
E.1 Overview....................................................................................................................................63
E.2 Global settings...........................................................................................................................63
E.3 Configuring assets..................................................................................................................... 63
E.4 Calculated fields.........................................................................................................................66
E.5 Modbus TCP mapping................................................................................................................68
Appendix F Pressure Relief Device (PRD) Application configuration and information.................. 69
F.1 Overview....................................................................................................................................69
F.2 Global settings...........................................................................................................................69
F.3 Adding assets.............................................................................................................................70
F.4 Baseline..................................................................................................................................... 70
F.5 Calculated fields.........................................................................................................................72
F.6 Modbus TCP mapping................................................................................................................74
Appendix G Cooling Tower Application configuration and information....................................... 75
G.1 Overview...................................................................................................................................75
G.2 Global settings.......................................................................................................................... 75
G.3 Adding assets............................................................................................................................76
G.4 Configuring assets.....................................................................................................................77
G.5 Calculated fields........................................................................................................................78
G.6 Modbus TCP mapping............................................................................................................... 79
Appendix H Network Management Application configuration and information...........................81
4 Emerson.com/Plantweb
Page 5

Reference Manual Contents
00809-0100-4541 June 2020
H.1 Overview...................................................................................................................................81
H.2 Global settings.......................................................................................................................... 81
Appendix I Power Module Application configuration and information....................................... 85
I.1 Overview.................................................................................................................................... 85
I.2 Global settings............................................................................................................................85
I.3 Adding power modules...............................................................................................................85
Appendix J Inline Corrosion application configuration and information......................................87
J.1 Overview.................................................................................................................................... 87
J.2 Global settings............................................................................................................................87
J.3 Adding devices........................................................................................................................... 90
J.4 Dashboard user interaction.........................................................................................................94
J.5 Device summary user interaction................................................................................................95
J.6 Event log user interaction........................................................................................................... 98
Emerson.com/Plantweb 5
Page 6

Contents Reference Manual
June 2020 00809-0100-4541
6 Emerson.com/Plantweb
Page 7

Reference Manual
00809-0100-4541 June 2020
Introduction
1 Introduction
1.1 Using this manual
This document is intended for system administrators and will provide details on how to set
up Plantweb Insight. For more details and configuration information on specific
applications, refer to the appropriate appendix sections.
It is recommended administrators complete all steps in the order described. An overview
of these steps is described below:
1.1.1
1.1.2
1.1.3
Install and launch
Procedure
1. Ensure system meets minimum requirements.
2. Install the Plantweb Insight virtual machine.
3. Launch Plantweb Insight web interface from a supported web browser.
Refer to Installation for more information.
Customize system settings
Procedure
1. Set up users for access.
2. Connect to Emerson Wireless Gateways and other data systems.
3. Backup and restore your system to avoid loss of settings.
Refer to Configuration for more information.
Application configuration
Procedure
1. Configure application specific global settings.
2. Add, edit, or delete assets via asset management.
Refer to Configuration for more information.
1.2 Product recycling/disposal
Recycling of equipment and packaging should be taken into consideration and disposed of
in accordance with local and national legislation/regulations.
Emerson.com/Plantweb 7
Page 8

Introduction Reference Manual
June 2020 00809-0100-4541
8 Emerson.com/Plantweb
Page 9

Reference Manual Installation
00809-0100-4541 June 2020
2 Installation
2.1 Safety messages
Procedures and instructions in this section may require special precautions to ensure the
safety of the personnel performing the operation. Information that raises potential safety
issues is indicated by a warning symbol ( ). Refer to the following safety messages before
performing an operation preceded by this symbol.
2.2 System requirements
Plantweb Insight is delivered as a fully developed virtual machine (e.g. .ova file). Users will
receive a complete virtual machine image to install in user provided virtualization software
or hypervisors.
The Plantweb Insight virtual machine contains a web server that can be accessed by any
web client with network access. All configuration and visualization will be completed from
the web browser user interface.
2.2.1
2.2.2
Plantweb Insight can be installed on a network server or PC/laptop. Both installations have
the same requirements and installation steps. Network connection settings can be made
subject to organization policies. Any pertinent Gateways must be accessible on the
network.
Before you begin, verify your system meets the minimum requirements.
Host operating system
Virtualization software/hypervisor
• VMware Workstation Pro™ 10 or higher (requirements can be found here)
• VMware vSphere® 5.5 or higher (requirements can be found here)
OR
• Contact Rosemount™ support if utilizing a different virtualization software (Microsoft
Hyper-V®)
®
Guest operating system
• Processors = 4
• Memory = 16 GB RAM minimum
• Hard drive = 100 GB of free space
Emerson.com/Plantweb 9
Page 10

Installation Reference Manual
June 2020 00809-0100-4541
2.2.3 Application
Browsers (recent versions supported)
• Chrome™ browser
• Microsoft Internet Explorer
®
2.2.4 Other requirements
• A DVD drive is required for installations
• A DHCP server is required to assign a valid IP address (static IP address can be
configured once connected to the Plantweb Insight web interface)
2.2.5
2.2.6
Gateway compatibility
Plantweb Insight is compatible with Emerson Wireless 1410/1420 Gateways on firmware
version 4.7.68 or higher. Plantweb Insight may experience calculation response issues on
certain applications when Gateway firmware is not up to date. These may effect the Pump,
Heat Exchanger, Air Cooled Heat Exchanger, and Pressure Relief Device applications.
Device compatibility
Emerson devices must be in Emerson Optimized burst configuration. If devices are not set
to this, change using a device configuration tool.
Devices without this capability must be in either of the two configuration modes to be
compatible with Plantweb Insight:
• command 9 and command 48
• command 3 and command 48
2.3 Installation procedure
Two DVDs will be supplied for installations.
Procedure
1. Exit/close all programs, including any running in the background.
2. Insert Disk 1 into the DVD drive.
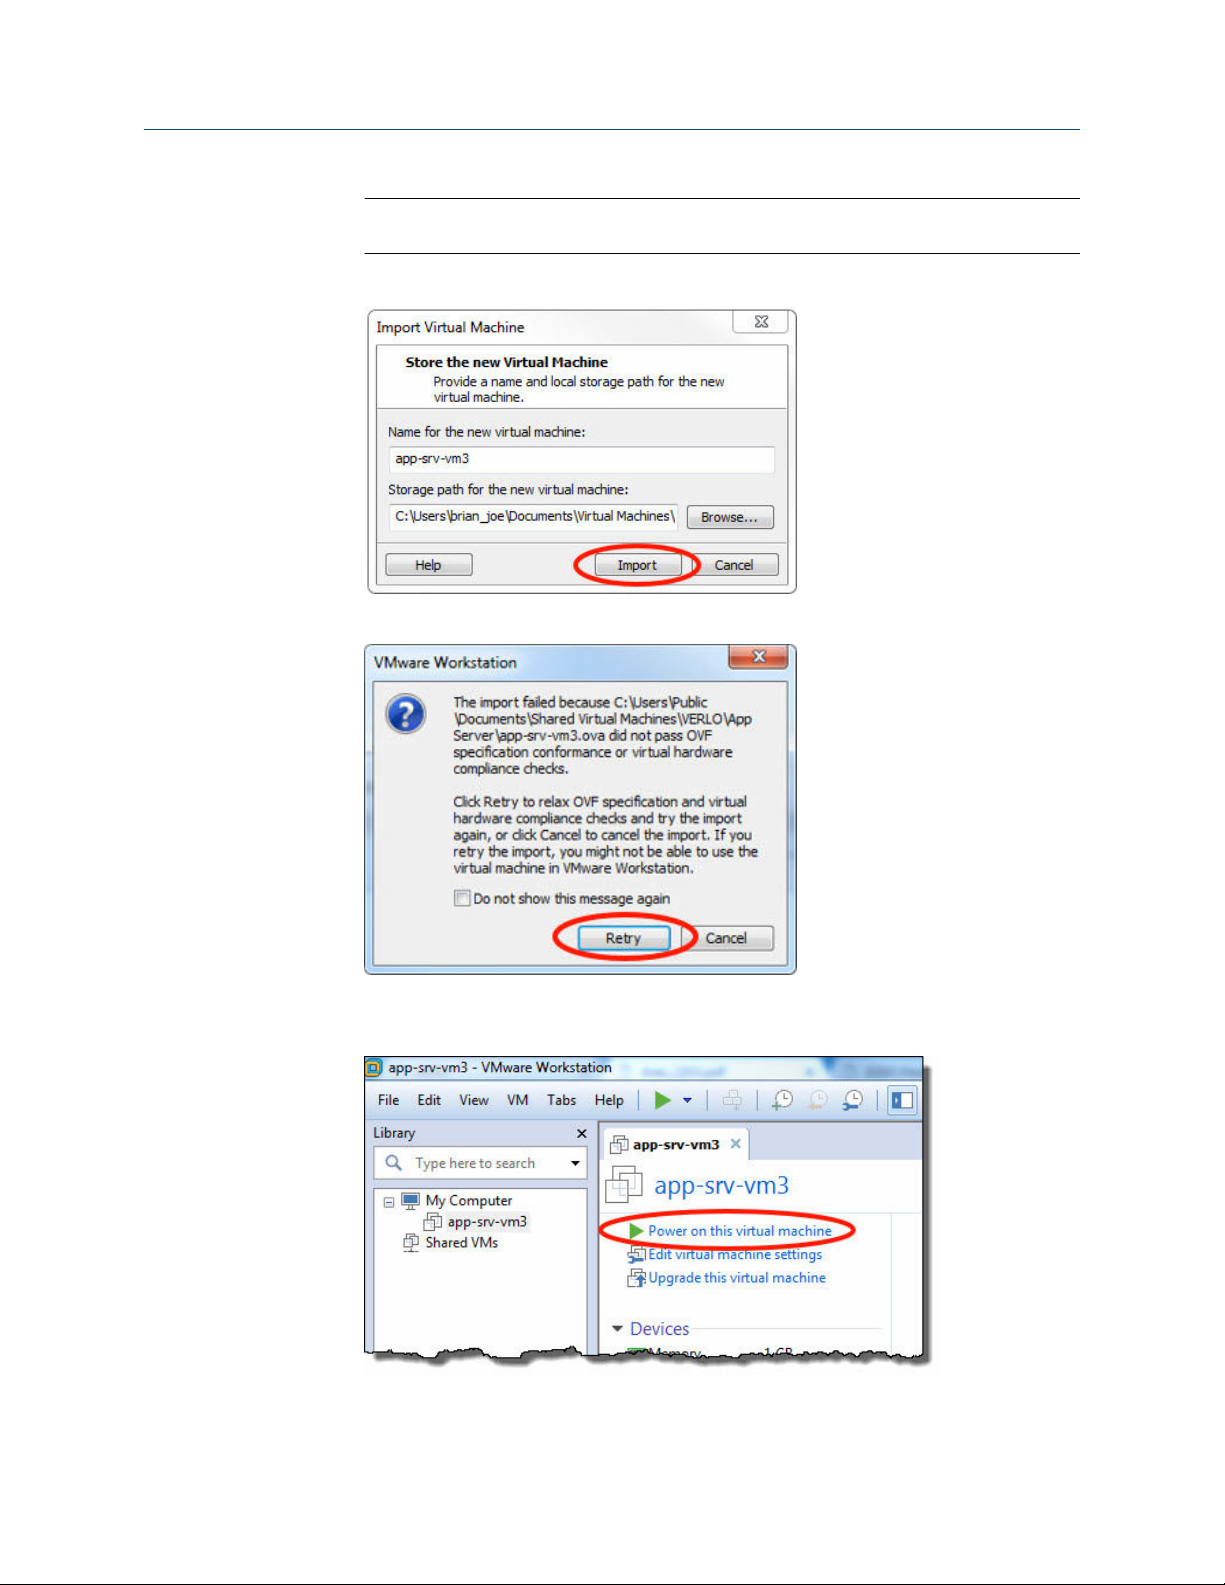
3. Open the .ova file. This file will prompt VMware Workstation/vSphere to open with
an Import Virtual Machine pop-up.
10 Emerson.com/Plantweb
Page 11
Reference Manual
Installation
00809-0100-4541 June 2020
Note
This file name may change based on version and type.
4. Name and store the new virtual machine, then select Import.
5. If the following message appears select,Retry.
6. Wait for the virtual machine to load.
7. Select Power on this virtual machine once the loading process is complete.
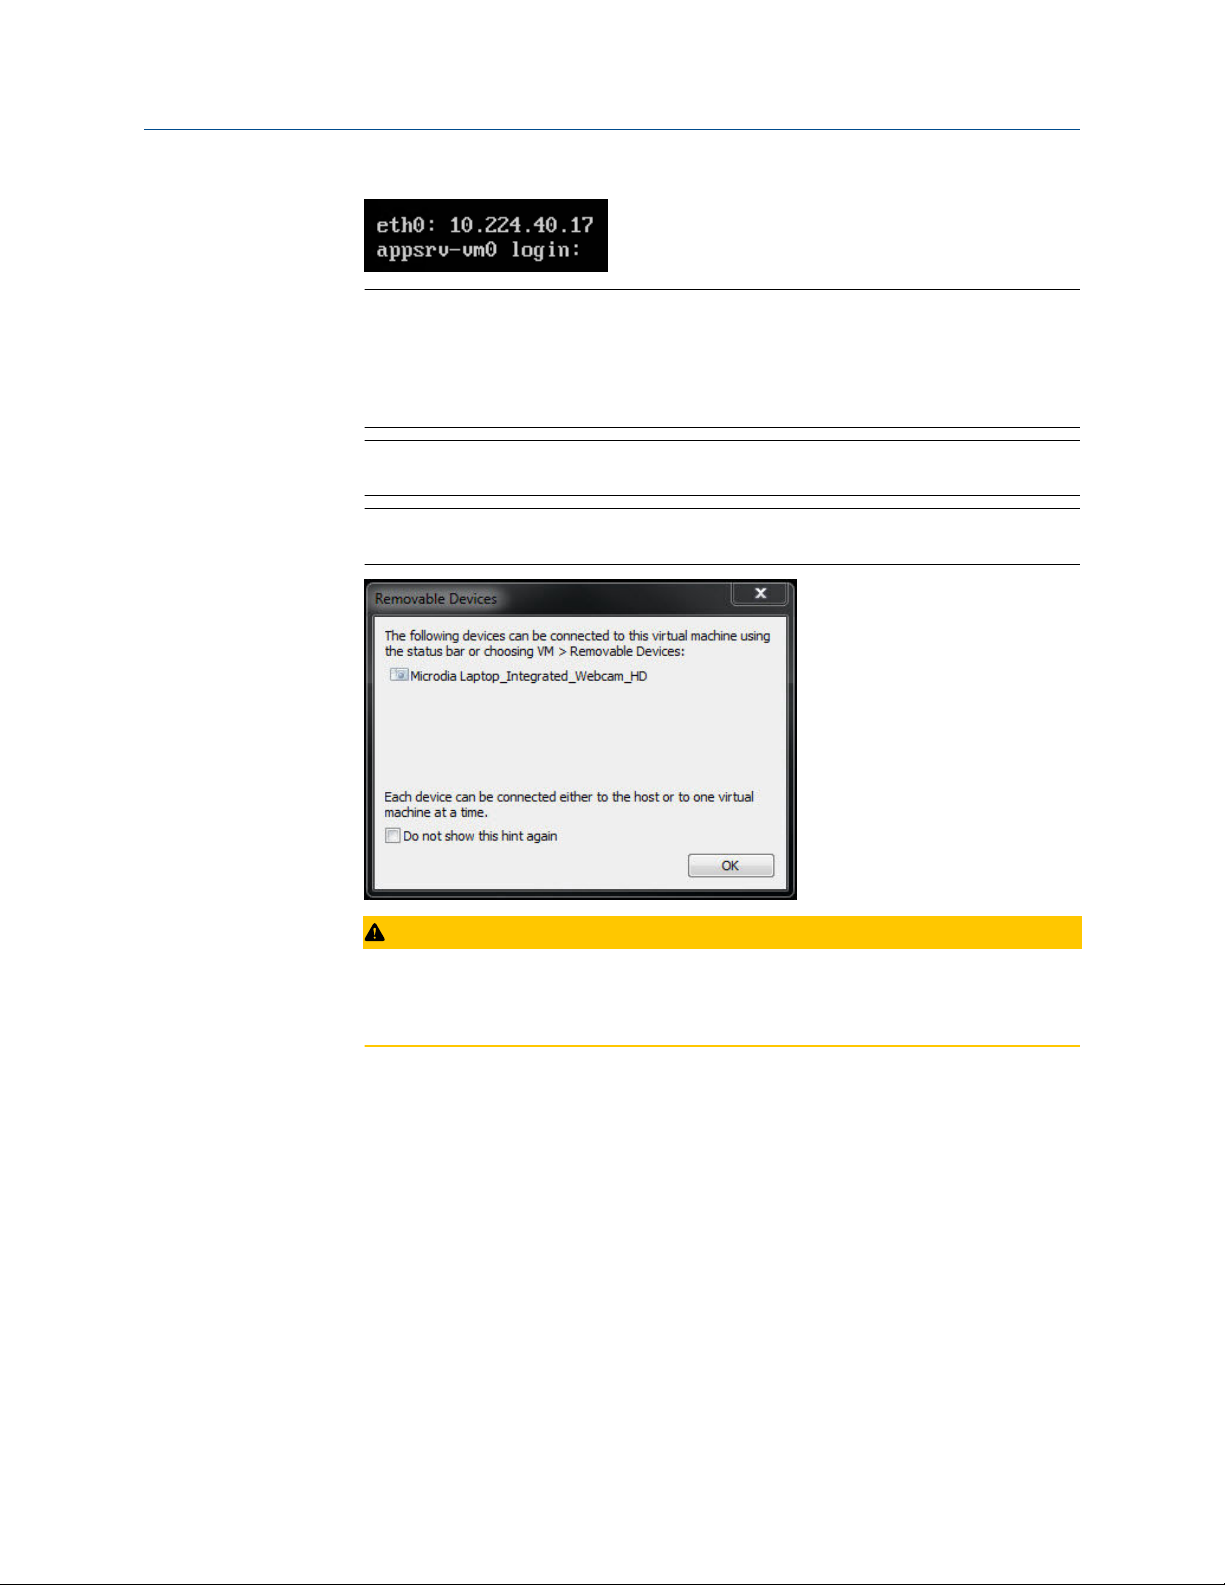
8. Find the IP address in the command window.
Emerson.com/Plantweb 11
Page 12
Installation
June 2020 00809-0100-4541
Note
This IP address will vary depending on installation. What is shown here will not be
your IP address.
A DHCP server will be required to assign an IP address. If no DHCP server is available,
contact Rosemount support (contact information on last page).
Note
The virtual machine login and password are not necessary and will not be provided.
Note
A message about features may pop up during the installation process; select OK.
Reference Manual
CAUTION
End users should not change any settings besides the ones outlined above.
Alterations could impact the performance and functionality of Plantweb Insight.
2.4 Launching the application
The Plantweb Insight web interface can be launched from any of the supported web
browsers shown in the system requirements.
Procedure
1. Open a supported web browser.
2. Beginning with “https://”, enter the IP address found in Step 8 of Installation
procedure.
3. Login with the following credentials:
• Email: admin@emerson.com
• Password: Default.1234
12 Emerson.com/Plantweb
Page 13

Reference Manual Installation
00809-0100-4541 June 2020
Note
Both the email and password are case sensitive.
4. Change your password as prompted (default settings are listed below and can be
changed in System Settings).
• Minimum length: 12
• Minimum lowercase: 1
• Minimum uppercase: 1
• Minimum numbers: 1
5. Login with the updated credentials.
Emerson.com/Plantweb 13
Page 14

Installation Reference Manual
June 2020 00809-0100-4541
14 Emerson.com/Plantweb
Page 15

Reference Manual Configuration
00809-0100-4541 June 2020
3 Configuration
3.1 Overview
This section contains information on customizing system settings and configuring
Plantweb Insight.
3.2 Safety messages
Procedures and instructions in this section may require special precautions to ensure the
safety of the personnel performing the operation. Information that raises potential safety
issues is indicated by a warning symbol ( ). Refer to the following safety messages before
performing an operation preceded by this symbol.
3.3 Customize system settings
3.3.1
System settings should be configured during the setup of Plantweb Insight.
Users
User accounts
Add users
Procedure
1. Navigate to System Settings → Users → User Accounts then select the Add User
Account button.
2. Enter the user’s email, role, and password then select Save.
Table 3-1: Roles and Privileges
User role Privileges
Admin Read and write
User Read
Edit users
Procedure
1. Navigate to System Settings → Users.
2. Select the button next to the user to be edited.
Note
If the user is disabled, you can enable the user in the modal window.
Emerson.com/Plantweb 15
Page 16

Configuration Reference Manual
June 2020 00809-0100-4541
3. Update the information and select Save.
Note
Users can be deleted by selecting the Delete this account box.
Password options
Password requirements and settings can be made in the Password Option page. These
settings include password limitations and requirements (e.g. uppercase letters, lowercase
letters, numbers, characters), session idle timeouts, and account locking details.
Change password
Login password can be changed in the Change Password page.
3.3.2
Data source configuration
Gateway connections
Add Gateway
Procedure
1. Navigate to System Settings → Data Sources → Gateway Connections.
2. Select the Add Gateway button.
3. Enter the IP Address, Port, and Description and select Save.
Note
HART-IP™ Port 5094. Ensure both HART-IP TCP and HART-IP UDP are enabled in the
Gateway.
Edit Gateway
Procedure
1. Navigate to System Settings → Data Sources → Gateway Connections.
2. Select the button next to the user to be edited.
3. Update the information and select Save.
Delete Gateway
Procedure
1. Select the check box/boxes next to the Gateway/s to be deleted.
2. Select red Delete Selected button.
16 Emerson.com/Plantweb
Page 17

Reference Manual Configuration
00809-0100-4541 June 2020
OPC UA Server Connection
Add OPC UA Server
Procedure
1. Navigate to System Settings → Data Sources → OPC UA Server Connections.
2. Select Add OPC UA Server button.
3. Enter the IP Address, Port, Tag, and Description and select Save.
Note
The OPC UA® Port in Plantweb Insight is designated as 4880 (the OPC UA Server
must be set up for this port). Plantweb Insight uses a opc.tcp:// connection to the
OPC UA Server. Tag and Description are used for explanatory reasons only.
The IP address field will only accept IP addresses and will not accept full URLs (it
assumes the opc.tcp://).The OPC UA Server must be configured to security
configuration “none” and “allow anonymous login”.
Edit OPC UA Server
3.3.3
Procedure
1. Navigate to System Settings → Data Sources → OPC UA Server Connections.
2. Select the button next to the Server to be edited.
3. Update the information and select Save.
Delete OPC UA Server
Procedure
1. Select the check box/boxes next to the Server/s to be deleted.
2. Select red Delete Selected button.
Network configuration (optional)
CAUTION
Use caution when making changes to IP network settings. If they are lost of improperly
configured, it may be difficult to log into the application. Contact the network
administrator for information on the proper IP network setting to apply.
Plantweb Insight contains two network interfaces. Only network interface 1 allows web
client access. Network interface 1 will be associated to network adapter 1 of the virtual
machine. Network interface 2 will be associated to network adapter 2 of the virtual
machine. Network interface 2 is non-routable.
The second network adapter needs to be configured in VMware Workstation/vSphere to
activate the functionality of the second network.
To change IP Network Settings:
Emerson.com/Plantweb 17
Page 18

Configuration Reference Manual
June 2020 00809-0100-4541
Procedure
1. Navigate to System Settings → Platform Settings → Ethernet Communication.
2. To change network interface 1, select Static IP Address.
3. Enter the following:
• Hostname
• IP Address
• Netmask
• Gateway
4. To enable network interface 2, select the enable check box.
5. Select Static IP Address.
6. Enter the following:
• IP Address
• Netmask
3.3.4
7. Select Save.
Platform settings
Plantweb Insight has a system backup and restore feature that saves all user configured
data. It is best practice that a system backup be performed periodically throughout the
installation and configuration process.
Save system backup
Procedure
1. Navigate to System Settings → Platform Settings → Backup and Restore.
2. Create a Passphrase then select Save Backup button.
18 Emerson.com/Plantweb
Page 19

Reference Manual Configuration
00809-0100-4541 June 2020
Note
Passphrase is required for restoring your system to these settings.
Restore system
Procedure
1. Navigate to System Settings → Platform Settings → Backup and Restore.
2. Enter the system backup passphrase.
3. Browse for the backup file then select Install button.
3.4 Application installation
Procedure
1. Insert Disk 2 into the DVD drive.
2. In the web interface navigate to System Settings → Platform Settings → Manage
Applications.
3. Under the Install App section, select the Browse button.
4. Navigate to Disk 2.
5. Select the pertinent .app file then select Open.
6. Select Install.
7. An action prompt will appear - select Restart Server if this is the last app to install.
Otherwise, select Resume and repeat Step 3-Step 6 for subsequent apps.
8. Navigate to Home and the apps installed will appear.
3.5 Application configuration
There are a few configuration steps that are consistent across specific Plantweb Insight
applications. These are briefly discussed below. More information about configuration can
be found in the specific Appendix.
Note
All configuration mentioned below is specific to Plantweb Insight. Changes will not be
communicated to the Gateway or devices.
Emerson.com/Plantweb 19
Page 20

Configuration Reference Manual
June 2020 00809-0100-4541
3.5.1 Global settings
Each application contains specific global settings that should be set before any asset
configuration. Global settings apply to all assets. These settings could include units used
for inputs (e.g. inlet pressure units), units used for calculations (e.g. currency), or key
performance indicators to be tracked on the dashboard (e.g. overall health index).
3.5.2 Adding assets
There are two ways to add assets. The options are discussed below. Configuration of
devices occurs during addition of assets.
Add an asset
Use this method to add a single asset.
Procedure
1. Navigate to the Asset Summary tab then select the Add an Asset button.
2. Complete all information on the New Asset modal window then select Save (field
descriptions can be found in the Appendix.
Add a measurement point
Wireless device from an Emerson Wireless Gateway
Depending on the application, wireless devices can either be added using a drop-down list
or a search function.
Procedure
1. For applications (Steam Trap application) requiring specific devices, the devices can
be added by selecting the appropriate device via a drop-down list. The drop-down
list will contain all devices with the pertinent device type.
2. For applications with generic measurements (pressure, temperature, flow, etc.) the
wireless devices can be added using the following:
a. Select Source: HART-IP
b. Begin to type the device tag. After a few characters, a dropdown list of
recognized devices will appear. Select the pertinent device.
c. Select the pertinent variable (ex: PV).
20 Emerson.com/Plantweb
Page 21

Reference Manual Configuration
00809-0100-4541 June 2020
OPC-UA tags
OPC-UA® tags can be set up for certain measurement points.
Procedure
1. Select Source: OPC-UA
2. Select the pertinent OPC-UA server.
3. Type in the complete path to the pertinent measurement point (ex: Objects/
Devices/OPC_Server1/3051S/PV).
• Use forward slashes, "/", for path breaks
• The entire path is case sensitive
Manual input
Manual inputs should be used sparingly for measurement points. They should only be
considered for known consistent conditions (motor speed).
Procedure
1. Select Source: Manual
2. Type in the manual value.
3. Select the pertinent units.
Note
Depending on the application, it will likely take time for the calculations to begin
processing. Certain applications require capturing a baseline. This process is
described in the Appendix.
Emerson.com/Plantweb 21
Page 22

Configuration Reference Manual
June 2020 00809-0100-4541
Import asset config
Use this method to add/edit multiple assets at the same time.
Procedure
1. Navigate to Asset Summary tab then select Import Asset Config button.
2. Select Download asset configuration to download the csv file.
Note
If there are no assets configured, select the Empty File box.
3. Complete the csv file and save files.
Note
Data fields have strict requirements for entries; these can be found in Import Specs
File.
Configuring device
For configuring the device, use the following guides.
For HART-IP™ from a WirelessHART® Gateway:
Entry tag Description Data type Values Example
XXXX_source Data source String HART-IP HART-IP
XXXX_tag Device tag String String 3051S
XXXX_value Device parameter String • PV
• SV
• TV
• QV
PV
For OPC UA data points:
Entry tag
XXXX_source Data source String OPC UA OPC UA
XXXX_tag Device tag String String 3051S.PV
Description Data type Values Example
For Manual data entry:
Entry tag
Description Data type Values Example
XXXX_source Data source String Manual Manual
XXXX_tag Parameter value Float Any value 100.00
Procedure
1. Browse and upload the csv file via the Import Asset Config modal window then select
Save.
22 Emerson.com/Plantweb
Page 23

Reference Manual Configuration
00809-0100-4541 June 2020
2. Check all assets were successfully downloaded.
3. If assets fail download, check all fields are filled out correctly and download again.
3.5.3 Editing assets
There are two ways to edit assets. The options are discussed below.
Edit singular asset
Procedure
1. Navigate to Asset Summary tab.
2. Select Asset to edit. The Details modal window will pop up with all fields to edit.
3. Select Save when complete.
Note
Assets can be deleted by selecting the Delete Asset button.
Import asset config
Procedure
1. Navigate to Asset Summary tab and select the Import Asset Config button.
2. Select Download asset configuration and download the csv file.
3. Edit the csv file and save files.
Note
Data fields have strict requirements for entries; these can be found in the
appropriate manual supplement.
4. Browse and upload the csv file via the Import Asset Config modal window and select
Save.
5. Check all assets were successfully downloaded.
6. If assets fail download, check all fields are filled out correctly and download again.
Emerson.com/Plantweb 23
Page 24

Configuration Reference Manual
June 2020 00809-0100-4541
24 Emerson.com/Plantweb
Page 25

Reference Manual Version Upgrades
00809-0100-4541 June 2020
4 Version Upgrades
Backup all files before installing a new version.
4.1 Virtual machine upgrades
Procedure
1. Ensure an up to date backup has been saved following the steps in the Save System
Backup procedure.
2. Install the new Plantweb Insight virtual machine following the steps in Installation
procedure.
3. Restore the backup file following the steps in the Restore System procedure.
4.2 Application upgrades
Procedure
1. Navigate to System Settings → Platform Settings → Manage Applications.
2. Install the new version following the steps in Application installation. You will
receive a prompt to replace the old version of the application.
3. If applicable, restore the system backup to retrieve configuration.
4.3 Platform upgrades
Procedure
1. Navigate to System Settings → Platform Settings → Manage Base Platform.
2. Browse and upload the pertinent upgrade file.
3. Select Update.
4. Select Restart Server.
5. If applicable, restore the system backup to retrieve configuration.
Emerson.com/Plantweb 25
Page 26

Version Upgrades Reference Manual
June 2020 00809-0100-4541
26 Emerson.com/Plantweb
Page 27
Reference Manual Modbus TCP Mapping
00809-0100-4541 June 2020
5 Modbus TCP Mapping
The following default Modbus® TCP ports are defined in Plantweb™ Insight:
Table 5-1: Modbus TCP Ports
Application Modbus TCP port
Steam trap 502
Pump 503
Heat exchanger 505
Air cooled heat exchanger 506
Pressure relief valve 507
Cooling tower 508
Registers and tags are prepopulated in specific Plantweb Insight applications and can be
accessed using the Download Modbus Mapping csv file in each application’s Settings
page. These registers and tags cannot be changed.
An example csv file will appear like the table shown below.
Function
1 0 ST-001.OOS
4 0 ST-001.STATE
4 1 ST-001.EMISSIONS
4 3 ST-001.COST
The function in the first column refers to the generic Modbus TCP function codes.
Emerson.com/Plantweb 27
Register Tag
Page 28

Modbus TCP Mapping Reference Manual
June 2020 00809-0100-4541
Function code Function Description
01 Read Coil Obtain status of one or more discrete
outputs
02 Read Discrete Input Obtain status of one or more discrete
inputs
03 Read Holding Registers Obtain value of one or more output
data registers
04 Read Input Registers Obtain value of one or more input
data registers
05 Write Single Coil Force a single discrete output
06 Write Single Holding Register Force a single data register to a
specified value
15 Write Multiple Coils Force multiple discrete outputs
16 Write Multiple Holding Registers Force multiple data registers to a
specified value
The second column refers to the register number (ex: ST-001.STATE uses function code 4
– read input registers, starting at 30000):
Function Register #s (Data
addresses)
Coil 00000-09999 FC01 FC05 FC15
Discrete Input 10000-19999 FC02 N/A N/A
Input Register 30000-39999 FC04 N/A N/A
Holding Register 40000-49999 FC03 FC06 FC16
Read Write single Write multiple
28 Emerson.com/Plantweb
Page 29
Reference Manual Modbus TCP Mapping
00809-0100-4541 June 2020
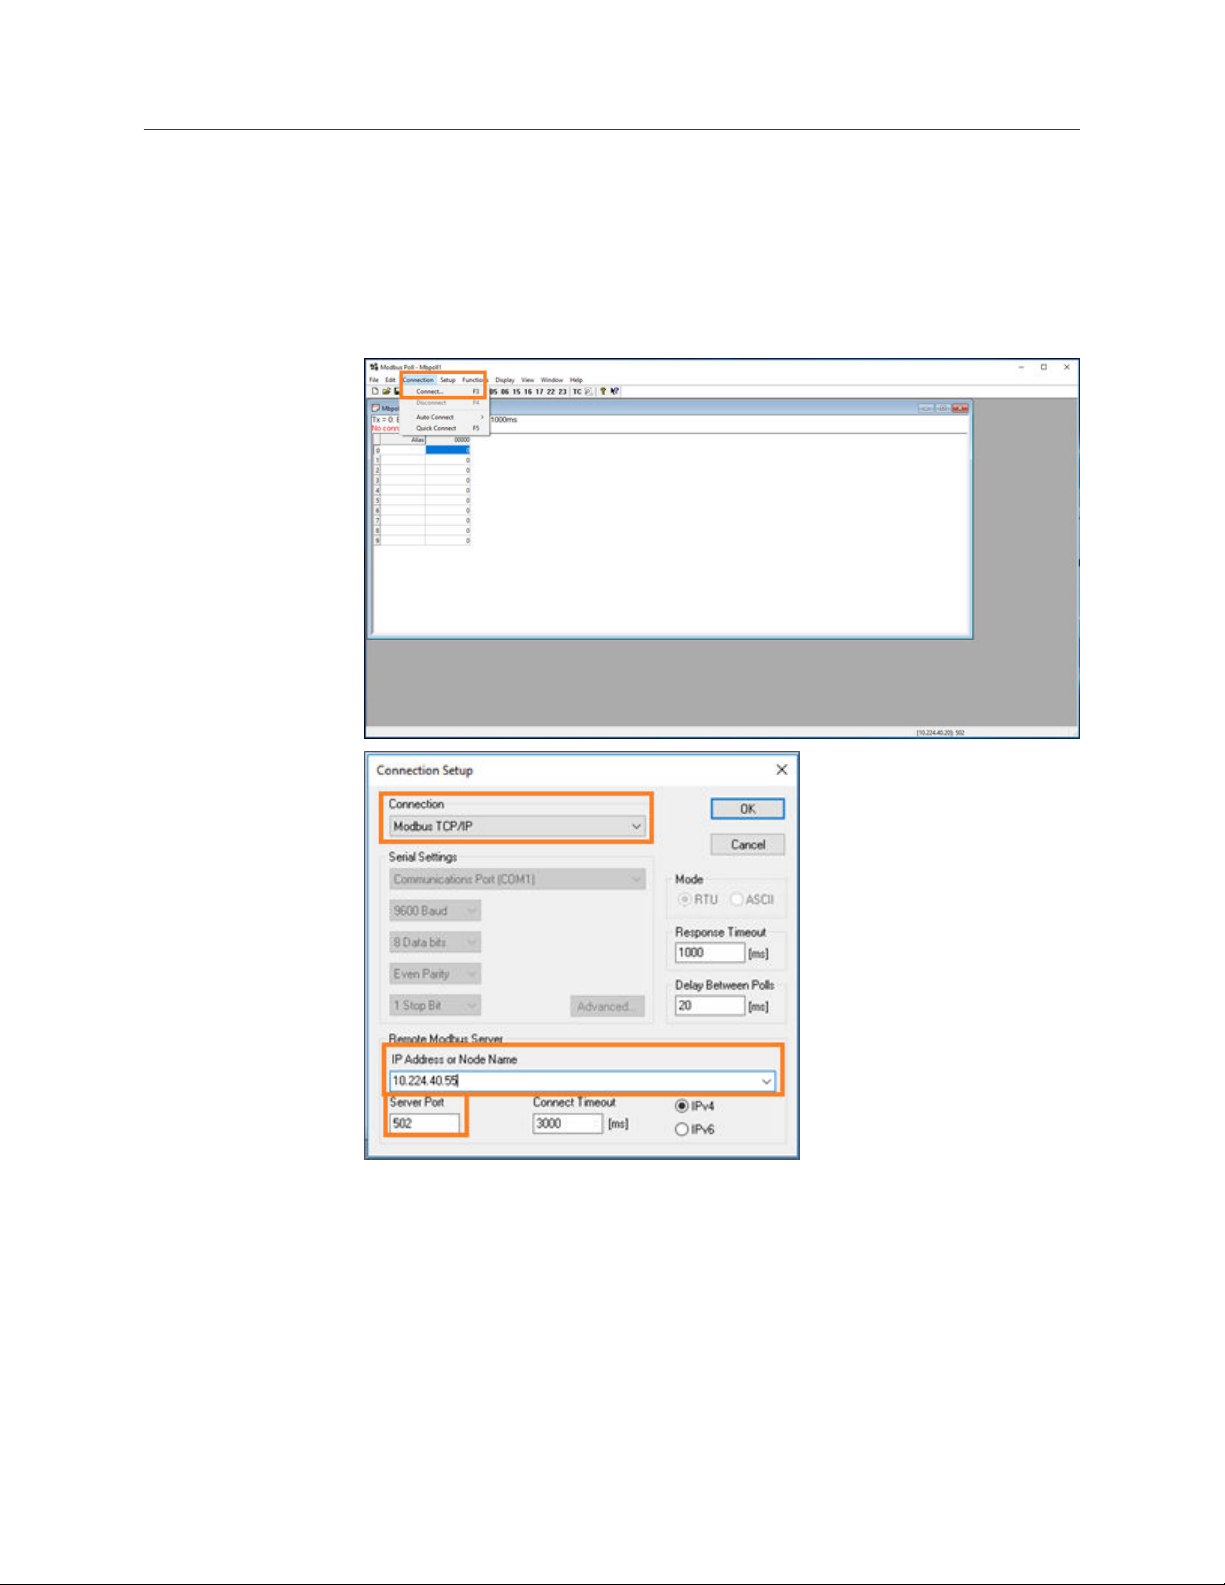
5.1 Setting up Modbus TCP from data system
Procedure
1. In the Modbus TCP enabled device, establish connection to Plantweb Insight. Select
Connection > Connect (F3)
Connection: Modbus TCP/IP
IP Address: IP address of Plantweb Insight
Server Port: TCP Port of the application being connected (ex: Steam Trap
application = 502)
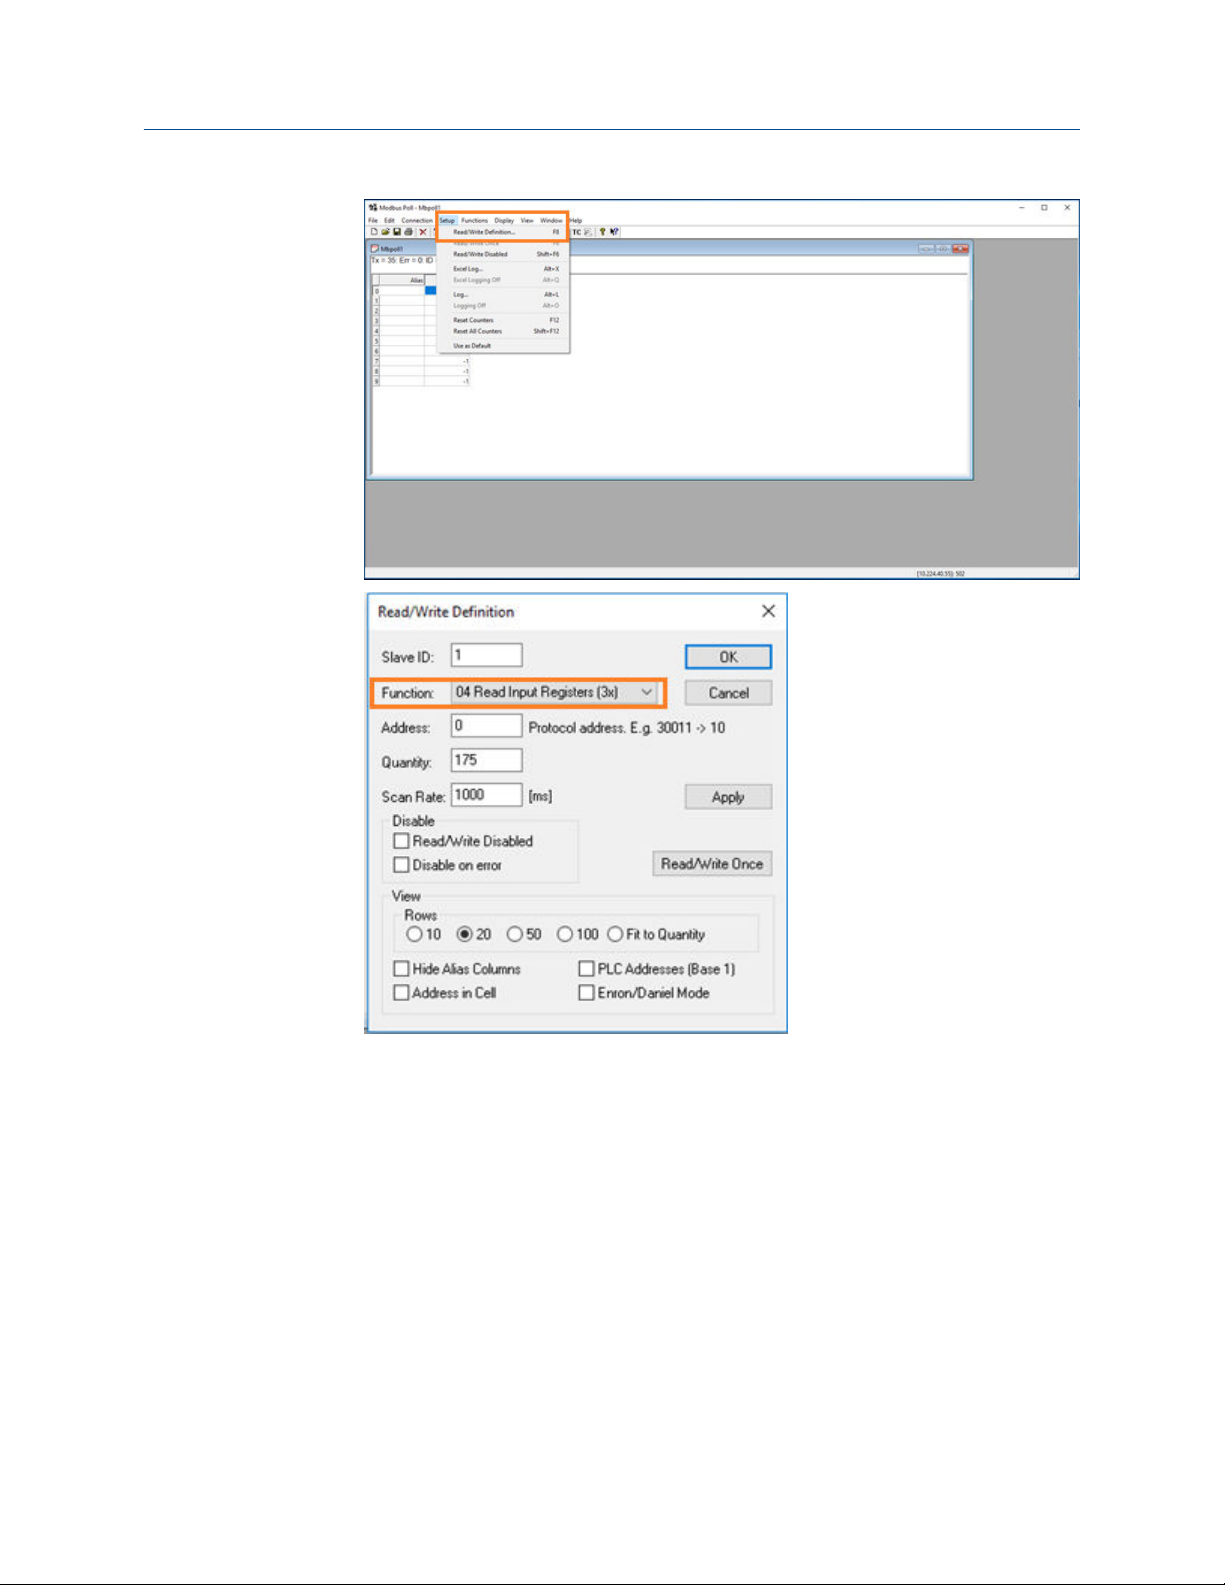
2. Configure the read/write definitions properly. Select Setup > Read/Write
Definition...
Emerson.com/Plantweb 29
Page 30
Modbus TCP Mapping Reference Manual
June 2020 00809-0100-4541
Function: 04 Read Input Registers (3x)
30 Emerson.com/Plantweb
Page 31

Reference Manual Modbus TCP Mapping
00809-0100-4541 June 2020
Result formats may need to be changed to match the following requirements:
See below example:
• State:
• Emissions:
Output Format
State 16-bit signed
Emissions 32-bit signed float big-endian
Cost 32-bit signed float big-endian
Health 32-bit signed float big-endian
Alert 16-bit signed
Emerson.com/Plantweb 31
Page 32

Modbus TCP Mapping Reference Manual
June 2020 00809-0100-4541
32 Emerson.com/Plantweb
Page 33

Reference Manual Troubleshooting
00809-0100-4541 June 2020
6 Troubleshooting
6.1 Service support
To expedite the return process outside of the United States, contact the nearest Emerson
representative.
Within the United States, call the Emerson Instrument and Valve Response Center using
the 1-800-654-RSMT (7768) toll-free number. This center, available 24 hours a day, will
assist you with any needed information or materials.
The center will ask for product model and serial numbers, and will provide a Return
Material Authorization (RMA) number. The center will also ask for the process material to
which the product was last exposed.
CAUTION
Individuals who handle products exposed to a hazardous substance can avoid injury if they
are informed of and understand the hazard. Returned products must include a copy of the
required Safety Data Sheet (SDS) for each substance.
Emerson Instrument and Valve Response Center representatives will explain the additional
information and procedures necessary to return goods exposed to hazardous substances.
NOTICE
Shipping considerations for wireless products.
• The unit was shipped to you without the Power Module installed. Please remove the
Power Module prior to shipping the unit.
• Each Power Module contains two "C" size primary lithium/thionyl chloride batteries.
Primary lithium batteries (charged or discharged) are regulated during transportation
by the U.S. Department of Transportation. They are also covered by IATA (International
Air Transport Association), ICAO (International Civil Aviation Organization), and ARD
(European Ground Transportation of Dangerous Goods). It is the responsibility of the
shipper to ensure compliance with these or any other local requirements. Consult
current regulations and requirements before shipping.
Emerson.com/Plantweb 33
Page 34

Troubleshooting Reference Manual
June 2020 00809-0100-4541
6.2 Plantweb Insight: Unable to load Plantweb Insight Virtual Machine
Possible cause: Intel VT-x is diabled
Recommended actions
1. Verify that the BIOS/firmware settings enable Intel VT-x and disable 'trusted
execution.'
2. Power-cycle the host if either of these BIOS/firmware settings have been
changed.
3. Power-cycle the host if you have not done so since installing VMware Player.
4. Update the host's BIOS/firmware to the latest version.
5. For more detailed information, see http://vmware.com/info?id=152.
Possible cause: System settings configuration
Recommended action
Follow the steps in the
have similar procedures.
video to resolve. Different operating systems and hardware will
34 Emerson.com/Plantweb
Page 35

Reference Manual Troubleshooting
00809-0100-4541 June 2020
6.3 Plantweb Insight: Virtual machine displaysv--IP Address Unknown--
Possible cause: No available DHCP server to assign a valid IP address
Recommended actions
1. Ensure the Plantweb Insight machine has access to a DHCP server.
2. Check both VMware Workstation Pro™/EXSi virtual network editor settings and
the Ethernet adapter settings.
3. Contact Rosemount Customer Central if a static IP address is necessary from
the start (static IP can be configured once into the web user interface).
VMware Workstation Pro does contain a native DHCP server. When utilizing this
program, the following procedure can be followed.
If there is no DHCP server available, VMware Workstation Pro contains a native
DHCP server through its NAT connections.
a. To utilize this, load the virtual machine and set the Network Adapter to
NAT.
b. Power on the virtual machine. It will return an IP address like the
following.
Emerson.com/Plantweb 35
Page 36

Troubleshooting Reference Manual
June 2020 00809-0100-4541
c. Type the IP address into a supported browser and begin the initial
configuration.
d. Configure a Static IP address using instructions found in Network
configuration (optional).
6.4 Plantweb Insight: OVF file error
Possible cause: Plantweb Insight virtual machine is installed in VMware vSphere
client
Recommended actions
Install the Plantweb Insight virtual machine in the VMware vSphere® Web Client or
ESXi Embedded Host Client.
6.5 Plantweb Insight: Web interface cannot be accesed
Recommended actions
1. Ping Plantweb Insight IP address to check for connection (ping is open).
2. Ensure client and Plantweb Insight are connected to the same subnet.
3. Ensure connection is through https://.
4. This could relate to a DHCP server related issue - Consult Rosemount Customer
Central.
6.6 Plantweb Insight: Web interface login continues to spin after inputting email and password
36 Emerson.com/Plantweb
Page 37

Reference Manual Troubleshooting
00809-0100-4541 June 2020
Recommended actions
External connections that are port forwarded to the Plantweb Insight platform will
likely cause issues - if this is necessary, consult Rosemount Customer Central.
6.7 Plantweb Insight: Cannot connect to WirelessHART Gateway
Recommended actions
After navigating to System Settings > Data Source Config > Gateway Connections,
theGateway IP Address, Port (5094), and description were inputted. The Inactive box is
stillchecked.
nsure WirelessHART® Gateway is upgraded to the most recent firmware
1. E
version.
2. Ensure HART-IP UDP and HART-IP TCP are both enabled in the Gateway.
a. In the Gateway, navigate to System Setting → Protocols → Protocols
and Ports
3. Ensure Plantweb Insight has access to the WirelessHART Gateway.
a.
The Plantweb Insight machine needs to be able to see and communicate
with the Gateway.
b. Both must be on the same subnet.
c. HART-IP traffic must be allowed through the communication channel.
6.8 Plantweb Insight: Click on application logo and nothings happens
After installing applications and navigating to the homepage the user selects an
application. Nothing occurs when the user clicks on the application.
Emerson.com/Plantweb 37
Page 38

Troubleshooting Reference Manual
June 2020 00809-0100-4541
Possible cause: Application installed is not compatible with the Plantweb Insight
version
Recommended actions
Check the compatibility matrix below. If a different application and/or platform is
required, contact Rosemount Customer Central.
6.9 Steam trap application: Asset status displays "NoData/Error" after configuration
Possible cause: The steam trap algorithm takes around 90 minutes to calculate a
status once it is configured
Recommended actions
1. Wait for 90 minutes until status populates.
2. To ensure this is the error, you may check the Device Health field and make sure
it has a “Good” status.
38 Emerson.com/Plantweb
Page 39

Reference Manual Troubleshooting
00809-0100-4541 June 2020
6.10 Steam trap application: Asset status display "No Config"
Possible cause: Failure configuration of the required inputs
Recommended actions
More information on a “No Config” error can be viewed on the “Device Health” field of the
Asset Details.
1. Configure these required inputs for the Steam Strap Application:
• Pressure inlet
• Pressure outlet
• Line size
• Orifice size
• Trap type
2. Ensure the Rosemount Wireless Acoustic 708 Transmitter update rate is
between one minute and five minutes.
6.11 Steam trap application: Asset status in question
Use the following table to troubleshoot asset status questions. If these do not resolve the
issue, contact Rosemount Customer Central.
Emerson.com/Plantweb 39
Page 40

Troubleshooting Reference Manual
June 2020 00809-0100-4541
Plantweb insight
asset status
Blowthrough Good • Check the outlet pressure user input. Keep in
Confirmed steam trap
status
Comments
mind this value is pertaining to the
condensate return line. If the trap is venting
to atmosphere, the pressure outlet should
be 0. Only if there is backpressure in the
condensate line should this value be greater
than 0.
• There is a possibility the steam trap is being
overused and registering a blowthrough
status due to excessive operation. This could
indicate the trap is undersize for its
application. Ensure this is not the case
before adjusting settings.
• The Rosemount 708 transmitter is indicating
a high acoustic count situation. If this is due
to background noise and not the steam trap,
there are two steps to alleviate:
— Change the steam trap configuration to
“medium” or “high” noise filter level to
account for background noise.
— Enable the “noise suppression” function
in the Rosemount 708.
Inactive
Good Blowthrough • Ensure all configuration inputs are current
Plugged/flooded Good • Ensure all configuration inputs are correct
• The Rosemount 708 transmitter is reading a
very low skin temperature of the steam pipe.
If this is incorrect, ensure the Rosemount
708 foot has flush contact to the steam pipe.
(inlet pressure, outlet pressure, etc.).
• The Rosemount 708 transmitter is reading
low acoustic counts. If this is incorrect,
ensure the Rosemount 708 foot has flush
contact to the steam pipe and ensure the
Rosemount 708 is installed according to
best practices (six inches from the inlet of
the steam trap).
(inlet pressure, outlet pressure, etc.).
• The Rosemount 708 transmitter is reading
relatively low skin temperature of the steam
pipe. If this is incorrect, ensure the
Rosemount 708 foot has flush contact to the
steam pipe.
40 Emerson.com/Plantweb
Page 41

Reference Manual Troubleshooting
00809-0100-4541 June 2020
6.12 Pressure Relief Device Application: Numerous “No_Data/Error” events
No_Data/Error events occur when data from the Rosemount 708 is not received in
Plantweb Insight in a reasonable time interval. It is designed to indicate when there is a
loss of visibility into the operation of a pressure relief device.
The Plantweb Insight platform does provide leeway for missed updates, however, if the
Rosemount 708 update rate is close to the minimum event duration of the PRD (ex: four
second update rate for the Rosemount 708 and four second minimum event duration)
there is an increased possibility of No_Data/Error events. To reduce the frequency of these
events, lengthen the minimum event duration or shorten the Rosemount 708 update rate
(keep network best practices in mind).
Note
Rule of thumb
Minimum event duration should be four times the Rosemount 708 update rate.
Emerson.com/Plantweb 41
Page 42

Troubleshooting Reference Manual
June 2020 00809-0100-4541
42 Emerson.com/Plantweb
Page 43

Reference Manual Steam Trap Application configuration and information
00809-0100-4541 June 2020
A Steam Trap Application configuration
and information
A.1 Overview
This document provides information on set up and configuration of the Steam Trap
Application within Plantweb™ Insight.
Prior to configuring your Steam Trap Application, be sure to complete all steps in the
Plantweb Insight Quick Start Guide. Some steps in the guide will be reiterated in this
document in more detail.
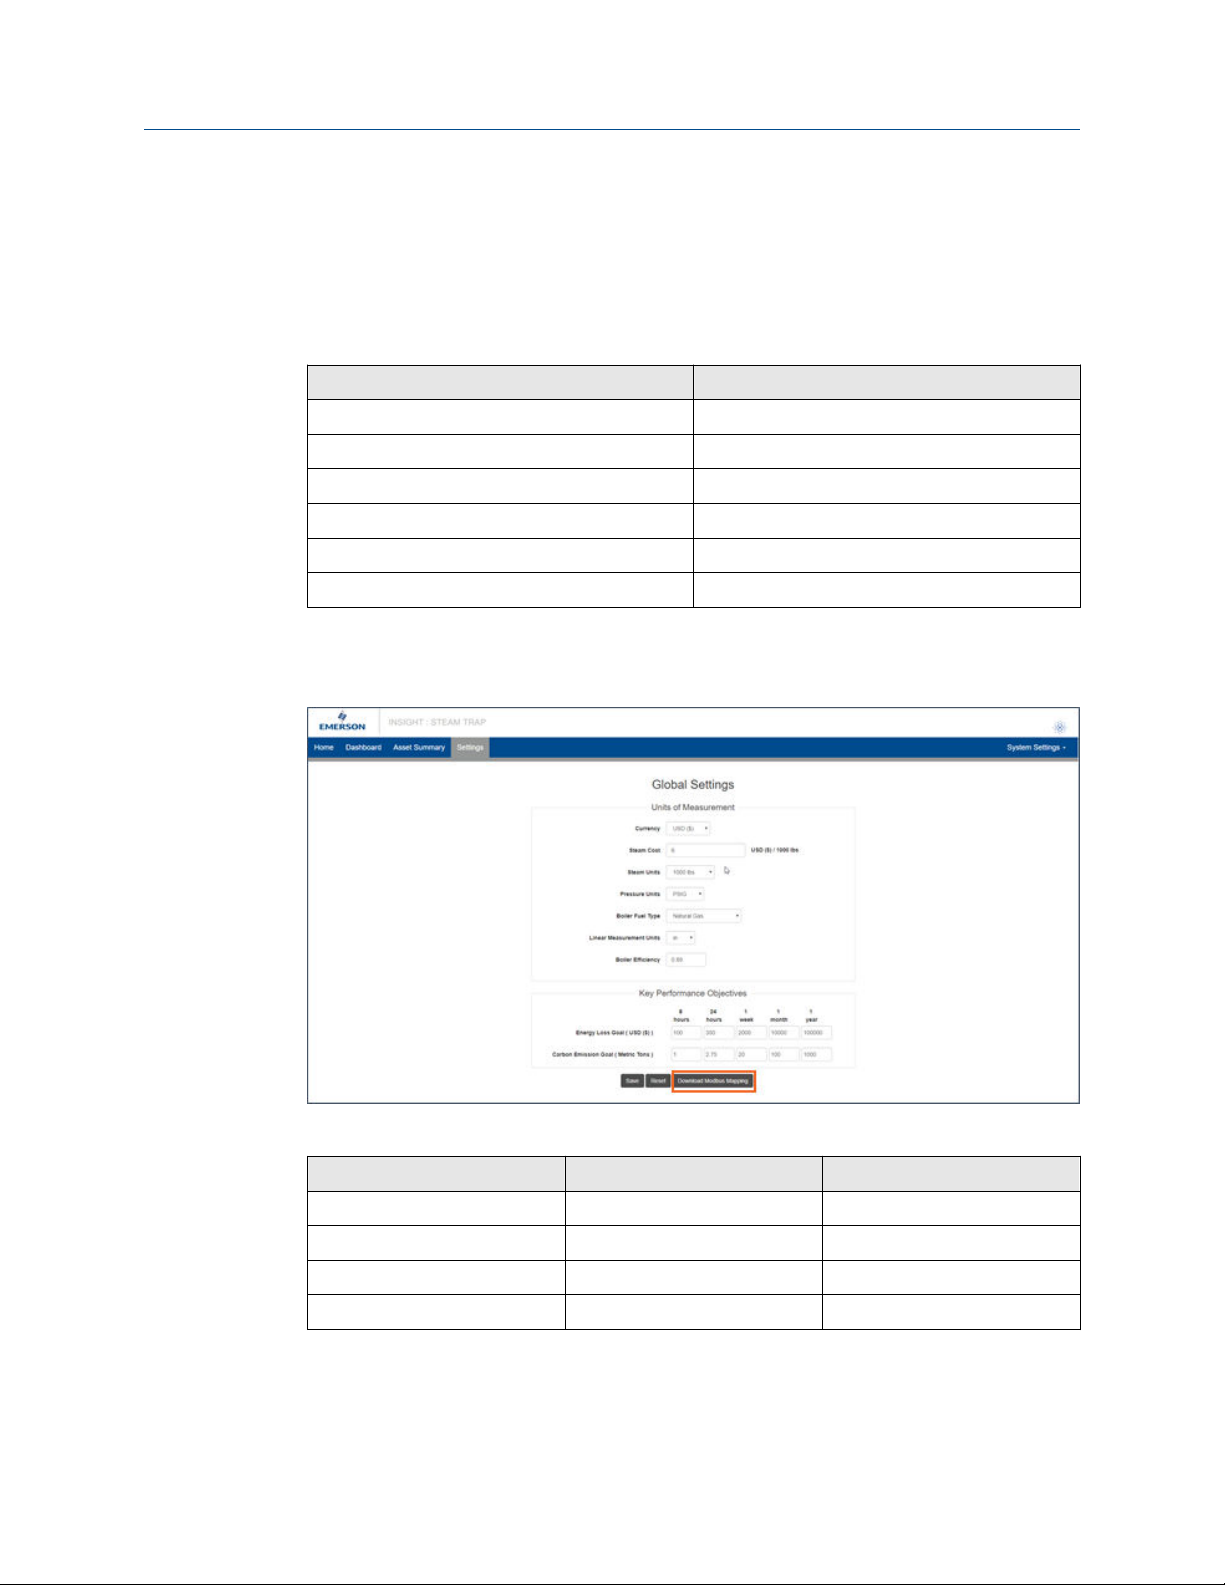
A.2 Global settings
Global settings should be set before any asset configuration is completed. These settings
apply to all assets within a specific application but do not change any settings within the
Gateway or devices. Changing any of these settings can be done in the Settings tab.
Table A-1: Units of Measurement
Field Input type Description/use
Currency Drop-down selection Used for determining the currency unit of your
energy costs
Steam cost Number entry Used for calculations
Steam units Drop-down selection Used for steam cost units
Pressure units Drop-down selection Used for inlet and outlet pressure entries
Boiler fuel type Drop-down selection Used for calculations
Linear measurement units Drop-down selection Used for orifice size and pipe size entries
Boiler efficiency Number entry (0–1) Used for calculations
Table A-2: Key Performance Objectives
Field Input type Description/use
Energy loss goal Number entry Used on dashboard for energy costs gauge goal
Carbon emissions goal Number entry Used on dashboard for carbon emissions gauge
goal
Emerson.com/Plantweb 43
Page 44

Steam Trap Application configuration and information Reference Manual
June 2020 00809-0100-4541
A.3 Adding assets
A.3.1 Fields of note
Pressure inlet
The inlet pressure can be tracked using a manual input, HART-IP™ variable, or OPC-UA
variable. To configure HART-IP and OPC-UA variables, follow the instructions from Adding
assets.
Orifice size
If orifice size information is not available, the table below can be used as a guide.
Table A-3: Orifice Specifications
Pressure (PSIG)
®
Line
size
(in.)
Pressure (BARG)
Line
size
(mm)
0 5 10 20 25 50 75 100 125 150 200 250
0
0.000 0.000
¼
3/8
½
¾
1
1½
1¾
2
0 0.3 0.7 1 2 3.5 5 7 8.5 11 15 20
0
0 0
5
10
15
20
0.125 0.125 0.125 0.094 0.094 0.094 0.094 0.094 0.094
0.188 0.188 0.125 0.125 0.125
0.250 0.250 0.188 0.156 0.156 0.125 0.125
0.375 0.313 0.250 0.219 0.188 0.156 0.125 0.125 0.125
0.500 0.438 0.344 0.313 0.281 0.250 0.219 0.188 0.188
0.500 0.469 0.438 0.375 0.375 0.344 0.313 0.281
0.500 0.469 0.438 0.438 0.375 0.344 0.344
0.500 0.500 0.500 0.469 0.438 0.375
3 3 3 2.5 2.5 2.5 2 2 2
5 5 4 3 3 2.5 2.5 2 2
7 7 5 4 3.5 3 3 3 2.5
10 9 7 6 5.5 5 4.5 4 3
25
40
45
50
44 Emerson.com/Plantweb
13 11 9 8 7.5 7 6 5.5 5
12.5 12 11 10.5 10 9 7.5 7
13 13 12 11.5 11 10 9.5 9
13 13 13 13 13 11 10 9.5
Page 45

Reference Manual Steam Trap Application configuration and information
00809-0100-4541 June 2020
Noise filter level
In noisy environments it may become necessary to filter out the surrounding noise so
sensitivity to leaking steam noise is restored. This can be accomplished by using the Noise
Filter Level advanced setting.
Temp deadband
Use Temperature Deadband settings to slow or contain state change “flipping”. Flipping
may occur when a trap is operating under “swinging” temperature conditions, including
heavy loads and rapidly modulating steam supply.
Temp rate alarm
Some critical steam systems require rapid indication of condensate accumulation. The
thermal mass of the trap and piping system introduce a significant thermal lag that can be
compensated through calculation. When Temp Rate Alarm is enabled, transition occurs
quickly.
A.4 Calculated fields
The Rosemount 708 Acoustic Transmitters update period must be between one and five
minutes due to polling and filtering considerations. The steam trap application will take at
least 90 minutes to complete its filtering and calculation cycle. During this time period,
the steam trap status will indicate “NO DATA/ERROR”.
A.4.1
Trap status
Trap state calculations are derived from ultrasonic amplitude (acoustic) and temperature
readings from the Rosemount 708 Acoustic Transmitters as well as static configuration
information. The following states are calculated.
Table A-4: State Descriptions
Value Name Description Action
0 GOOD Trap operating normally None
1 INACTIVE Trap is near room temperature None
2 UNUSED N/A N/A
3 BLOW-
THROUGH
4 NO DATA/
ERROR
Trap is within operational temperature limits and
is continuously allowing steam to escape into the
condensate return
The Rosemount 708 is not publishing data or is
publishing a fault condition
Investigate trap
Investigate Rosemount
708
5 NO CONFIG Critical user configuration information is missing Configure asset
6 OUT OF
SERVICE
(1)
7
Emerson.com/Plantweb 45
PLUGGED The trap is stuck in the closed position or there is
The trap is out of service (user writable) None
Investigate trap
a blockage in the trap inlet or outlet
Page 46

Steam Trap Application configuration and information Reference Manual
June 2020 00809-0100-4541
Table A-4: State Descriptions (continued)
Value Name Description Action
(1)
8
(1) To ensure safety, check trap temperature before performing maintenance on a cold trap.
FLOODED The trap temperature is below expected
operation limits but acoustic energy is present
(trap is operating)
Investigate trap sizing
and/or load conditions
A.4.2 Lost energy cost
When a steam trap is in a blow through state, unnecessary energy is used to produce
excess steam. There are different ways the lost energy costs can be viewed. One is a
accumulation of cost over the selected time period (8 hours, 24 hours, 1 week, 1 month, 1
year). Costs can also be viewed as an annual projection of the current state of the trap.
A.4.3
A.4.4
Emissions lost
When a steam trap is in a blow-through state, unnecessary emissions are expended to
produce excess steam. There are different ways the emissions loss can be viewed. One is a
accumulation of loss over the selected time period (8 hours, 24 hours, 1 week, 1 month, 1
year). Losses can also be viewed as an annual projection of the current state of the trap.
Device status
Table A-5: Device Status
Device health Description Action
GOOD Device operating normally None
POWER_MODULE_LOW Power module has low battery Prepare to replace
power module
POWER_MODULE_CRITICAL Power module has a critically low
battery
DEVICE_MALFUNCTION Device has a malfunction Investigate device
NO_DATA No polling data was found Investigate device
ASSET_OUT_OF_SERVICE The asset is set to out of service (user
writable)
DEVICE_NOT_FOUND The asset's device can not be found Investigate device
Replace power module
None
DEVICE_OUT_OF_SERVICE The asset's device is set to out of
service
GATEWAY_NOT_FOUND The Gateway associated with the
asset's device can not be found
GATEWAY_OUT_OF_SERVICE The Gateway associated with the
asset's device is set to out of service
NO_APP_TYPE The steam trap type is not configured Configure the steam
46 Emerson.com/Plantweb
None
Investigate Gateway
None
trap type
Page 47

Reference Manual Steam Trap Application configuration and information
00809-0100-4541 June 2020
Table A-5: Device Status (continued)
Device health Description Action
NO_O_SIZE The steam trap orifice size is not
configured
NO_L_SIZE The steam trap line size is not
configured
NO_P_IN The steam trap inlet pressure is not
configured
NO_P_OUT The steam trap outlet pressure is not
configured
UPDATE_RATE<60s The Rosemount 708 update rate is
less than 60 seconds
DATA_TOO_OLD Polling data period is longer than
anticipated
A.5 Modbus® TCP mapping
Procedure
1. There are three Modbus TCP outputs and one Modbus TCP input that are predefined in the steam trap app for every asset.
Configure the steam
trap orifice size
Configure the steam
trap line size
Configure the steam
trap inlet pressure
Configure the steam
trap outlet pressure
Configure the
Rosemount 708 update
rate to the
recommended 5
minutes
Investigate device
Input
Output Steam trap status (value described in Table A-4)
Output Lost energy cost
Output Emissions lost
Out of service
2. Modbus TCP registers and tags are pre-populated in Plantweb Insight and cannot be
changed.
3. Registers and codes can be found in each app by going to the app Settings (Global
Settings) and then selecting Download Modbus Mapping.
4. A csv file will open with the listed registers and tags.
Emerson.com/Plantweb 47
Page 48

Steam Trap Application configuration and information Reference Manual
June 2020 00809-0100-4541
48 Emerson.com/Plantweb
Page 49

Reference Manual Pump Application configuration and information
00809-0100-4541 June 2020
B Pump Application configuration and
information
B.1 Overview
This document provides information on set up and configuration of the pump application
within Plantweb™ Insight.
Prior to configuring your pump application, be sure to complete all steps in the Plantweb
Insight Quick Start Guide. Some steps in this guide will be reiterated in this document in
more detail.
B.2 Global settings
Global settings should be set before any configuration is completed. These settings apply
to all assets within a specific application but do not change any setting within the Gateway
or devices. Changing any of these settings can be done in the Settings tab.
B.2.1
B.2.2
Overall health index goal
Overall Health Index Goal is a number entry from 0–100 percent (100 percent =
completely healthy). It is used on the dashboard for the overall health index goal indicator.
Alert weights
Select the Alert Weights button on the Settings page.
Alert weights correspond to the severity of an alert (0 least severe, 100 most severe).
Defaults values are preconfigured for the application and can be changed at any time. The
most severe alert weight will be used for the health index indication for a given pump.
Alert Weight
0–15 Good
16–50 Warning
50+ Critical
Severity
B.3 Configuring assets
To finish configuring assets, navigate to the specific asset Details page by selecting the
asset from the Asset Summary page.
Emerson.com/Plantweb 49
Page 50

Pump Application configuration and information Reference Manual
June 2020 00809-0100-4541
B.3.1 Capture baseline
The pump application compares the current state of a pump against a baseline. The
baseline should be captured after all pertinent measurement points are configured and
the pump is in an ideal/typical operating state.
Once these criteria are met, the admin should capture a baseline using the following steps:
Procedure
1. Select the Capture Baseline button on the Details page. See Figure B-1.
Figure B-1: Capture Baseline
2. Ensure this is the indented baseline pump condition and select Yes.
50 Emerson.com/Plantweb
Page 51

Reference Manual Pump Application configuration and information
00809-0100-4541 June 2020
B.3.2 Editing alerts
After the baseline is captured, the pump application will automatically set alert thresholds
and limits for measurement points and calculations. Alerts will only be enabled when the
applicable measurement points are available. Use the below fault matrix to identify which
measurement points are required for which alerts. Alerts can be disabled and thresholds
can be manually configured.
Figure B-2: Pump Fault Matrix
Procedure
1. Select the Edit Alerts button on the Details page, as shown in the figure below.
Figure B-3: Edit Alerts
2. Use the Enable check boxes to enable/disable alerts.
3. Configure alert limits by manually filling in boxes. See figure below.
Emerson.com/Plantweb 51
Page 52

Pump Application configuration and information Reference Manual
June 2020 00809-0100-4541
Figure B-4: Asset Alert Details
Note
Some alerts may have complex calculations that do not allow configuration.
Note
Alerts can be reset to defaults at any time using the Reset to Default button.
B.4 Calculated fields
B.4.1 Measurement point thresholds
Based on the baseline capture, the pump application will automatically configure
thresholds for measurement points (Example: low pump flow, high DP across the strainer,
etc.). These thresholds are meant to alert the user to abnormal conditions pertaining to
the pump that could affect the overall health and performance.
B.4.2
Vibration and PeakVue increase
The “increase detected” and “SPC” (statistical performance calculation) alerts for both
vibration and PeakVue are used to identify statistically relevant changes in the vibration
measurements. These calculations use statistical analysis to detect an increase in vibration
readings over a period of time.
B.4.3
52 Emerson.com/Plantweb
Cavitation detection
Pump cavitation is detected from a significant increase in the discharge pressure (standard
deviation) and an increase in the PeakVue parameter of the pump. If the pump vibration is
not available, the standard deviation of the discharge pressure can be used to indicate
“precavitation” with less certainty.
Page 53

Reference Manual Pump Application configuration and information
00809-0100-4541 June 2020
B.4.4 Pump health index
The Pump Health Index is a 0–00 percent variable determined by the severity of pump
alerts. The pump health is 100 percent if there are not active alerts. Otherwise, the pump
health is calculated based on the following equation (100 percent – highest alert weight).
Therefore, pump status and health index are correlated to the alert weights. See Table B-1
and Table B-2.
Table B-1: Pump Health Index
Health index Pump status
86–100% Good
51–85% Warning
≤50% Critical
B.4.5 Pump status
Table B-2: Pump Status
Value Pump state Description
0 GOOD Pump health > 85%
4 NO DATA/ERROR There is not enough data for the pump state to
calculate
5 NO CONFIG Baseline has not been captured for the pump
6 OUT OF SERVICE Pump is out of service (user writable)
7 WARNING Pump health is between 50% and 85%
8 CRITICAL Pump health is < 50%
Emerson.com/Plantweb 53
Page 54

Pump Application configuration and information Reference Manual
June 2020 00809-0100-4541
B.5 Modbus TCP mapping
There are three Modbus® Transmission Control Protocol (TCP) outputs and one Modbus
TCP input that are predefined in the pump app for every asset. See table below.
Table B-3: Modbus TCP Definitions
Modbus TCP Definition
Input Out of service
Output Pump state (value described in Table B-2)
Output Pump alert
Output Pump health
Note
Modbus TCP registers and tags are automatically populated in Plantweb Insight and
cannot be changed.
Procedure
1. Registers and codes can be found in each app by going to the app Settings (Global
Settings) then select Download Modbus Mapping.
2. A csv file will open with the listed registers and tags.
54 Emerson.com/Plantweb
Page 55

Reference Manual Heat Exchanger Application configuration and information
00809-0100-4541 June 2020
C Heat Exchanger Application
configuration and information
C.1 Overview
This document provides information on set up and configuration of the Heat Exchanger
Application within Plantweb™ Insight.
Prior to configuring your Heat Exchanger Application, be sure to complete all steps in the
Emerson Plantweb Insight Quick Start Guide. Some steps in this guide will be reiterated in
this document in more detail.
C.2 Global settings
Global settings should be set before any configuration is completed. These settings apply
to all assets within a specific application but do not change any setting within the Gateway
or devices. Changing any of these settings can be done in the Settings tab.
C.2.1
C.2.2
Energy loss goal
Used in the dashboard for energy costs gauge goal.
Alert weights
Select the Alert Weights button on the Settings page.
Alert weights correspond to the severity of an alert (0 least severe, 100 most severe).
Defaults values are preconfigured for the application and can be changed at any time. The
most severe alert weight will be used for the health index indication for a given heat
exchanger.
Alert weight
0–15 Good
16–50 Warning
50+ Critical
Severity
C.3 Configuring assets
To finish configuring assets, navigate to the specific asset Details page by selecting the
asset from the Asset Summary page.
Emerson.com/Plantweb 55
Page 56

Heat Exchanger Application configuration and information Reference Manual
June 2020 00809-0100-4541
C.3.1 Capture baseline
The Heat Exchanger Application compares the current state of a heat exchanger against a
baseline. The baseline should be captured after all pertinent measurement points are
configured and the heat- exchanger is in an ideal/typical operating state (usually after
cleaning).
Once these criteria are met, the admin should capture a baseline using the following steps:
Procedure
1. Select the Capture Baseline button on the Details page. See Figure C-1.
2. Ensure this is the intended baseline heat exchanger condition and select Yes.
Figure C-1: Capture Baseline
56 Emerson.com/Plantweb
Page 57

Reference Manual Heat Exchanger Application configuration and information
00809-0100-4541 June 2020
C.3.2 Editing alerts
After the baseline is captured, the Heat Exchanger Application will automatically set alert
thresholds and limits for measurement points and calculations. Alerts will only be enabled
when the applicable measurement points are available. Use the below fault matrix to
identify which measurement points are required for which alerts. Alerts can be disabled
and thresholds can be manually configured.
Figure C-2: Heat Exchanger Fault Matrix
Procedure
1. Select the Edit Alerts button on the Details page, as shown in figure below.
Figure C-3: Edit Alerts
2. Use the Enable check boxes to enable/disable alerts
3. Configure alert limits by manually filling in boxes. See Figure C-4.
Note
Some alerts may have complex calculations that do not allow configuration.
Emerson.com/Plantweb 57
Page 58

Heat Exchanger Application configuration and information Reference Manual
June 2020 00809-0100-4541
Figure C-4: Asset Alert Details
Note
Alerts can be reset to defaults at any time using the Reset to Default button.
C.4 Calculated fields
C.4.1 Measurement point thresholds
Based on the baseline capture, the heat exchanger application will automatically configure
thresholds for measurement points (Example: low hot side flow, high cold side DP, etc.).
These thresholds are meant to alert the user to abnormal conditions pertaining to the heat
exchanger that could affect the overall health and performance.
C.4.2
Heat duty
Heat duty is calculated using flow, temperature, heat capacity, vapor fractions, and heat of
vaporization. It can be used as an indication of the amount of heat transferred from one
fluid to another. Heat duty is calculated for both the hot and cold sides as well as a delta to
check degradation.
58 Emerson.com/Plantweb
Page 59

Reference Manual Heat Exchanger Application configuration and information
00809-0100-4541 June 2020
C.4.3 Heat exchanger coefficient
The heat exchanger coefficient is an indication of current heat transfer coefficient.
C.4.4 Fouling factor
The current heat exchanger coefficient is compared to the baseline value to determine the
fouling factor. When the fouling rate is higher than anticipated, an alert will be triggered.
C.4.5 Lost energy cost/cost of degradation
The cost of degradation is an indication of the lost energy costs resulting from a fouled
heat exchanger.
C.4.6
C.4.7
Cleaning required indication
When multiple alarms are triggered (lost energy cost, fouling factor, dP) the “exchanger
cleaning required” alert will be shown.
Heat exchanger health index
The heat exchanger health index is a 0–100 percent variable determined by the severity of
heat exchanger alerts. The heat exchanger health is 100 percent if there are not active
alerts. Otherwise, the heat exchanger health is calculated based on the following equation
(100 percent– highest alert weight). Therefore, pump status and health index are
correlated to the alert weights. See Table C-1 and Table C-2.
Table C-1: Heat Exchanger Health Index
Health index Heat exchanger status
86–100% Good
51–85% Warning
≤ 50% Critical
Emerson.com/Plantweb 59
Page 60

Heat Exchanger Application configuration and information Reference Manual
June 2020 00809-0100-4541
C.4.8 Heat exchanger status
Table C-2: Heat Exchanger Status
Value State Description
0 GOOD Heat exchanger health > 85%
4 NO DATA/ERROR There is not enough data for the heat exchanger state
to calculate
5 NO CONFIG Baseline has not been captured for the heat exchanger
or required inputs are not entered
6 OUT OF SERVICE Heat exchanger is out of service (user writable)
7 WARNING Heat exchanger health is between 50% and 85%
8 CRITICAL Heat exchanger health is < 50%
C.5 Modbus TCP mapping
Procedure
1. There are four Modbus® Transmission Control Protocol (TCP) outputs and one
Modbus TCP input that are predefined in the heat exchanger app for every asset.
See table below.
Table C-3: Modbus TCP Definitions
Modbus TCP Definition
Input Out of service
Output Heat exchanger state (value described on the table in section 5.8)
Output Heat exchanger alert
Output Heat exchanger health
Output Heat exchanger lost energy costs
2. Modbus TCP registers and tags are automatically populated in Plantweb Insight and
cannot be changed. The Modbus TCP port for the Heat Exchanger Application is
505.
3. Registers and codes can be found in each app by going to the app Settings (Global
Settings) and then selecting Download Modbus Mapping.
4. A csv file will open with the listed registers and tags.
60 Emerson.com/Plantweb
Page 61

Reference Manual Wireless Pressure Gauge Application configuration and information
00809-0100-4541 June 2020
D Wireless Pressure Gauge Application
configuration and information
D.1 Overview
This document provides information on set up and configuration of the Emerson Wireless
Pressure Gauge Application within Plantweb™ Insight.
Prior to configuring your Wireless Pressure Gauge Application, be sure to complete all
steps in the Emerson Plantweb Insight Quick Start Guide. Some steps in this guide will be
reiterated in this document in more detail.
D.2 Adding devices
Pressure threshold alerts
When pressure drops below or rises above the configured limit, a pressure threshold alert
is triggered.
Low pressure warning limit
User configurable low pressure threshold. When the pressure drops below this value, a
Low Pressure Warning alert will be triggered.
High pressure warning limit
User configurable high pressure threshold. When the pressure rises above this value, a
High Pressure Warning alert will be triggered.
D.3 Calculated fields
D.3.1 Pressure status
The wireless pressure gauge application within Plantweb Insight calculates the following
pressure value (PV) states, shown below.
Table D-1: Calculated Pressure Status
Status Description
NORMAL Pressure is within the anticipated range
LOW PRESSURE WARNING Pressure is below the anticipated range
HIGH PRESSURE WARNING Pressure is above the anticipated range
OVERPRESSURE NOTIFICATION Pressure exceeded 105% of the maximum working pressure of
the device. Physical device must be reset.
Emerson.com/Plantweb 61
Page 62

Wireless Pressure Gauge Application configuration and information Reference Manual
June 2020 00809-0100-4541
62 Emerson.com/Plantweb
Page 63

Reference Manual Air-Cooled Heat Exchanger Application configuration and information
00809-0100-4541 June 2020
E Air-Cooled Heat Exchanger
Application configuration and
information
E.1 Overview
This document provides information on set up and configuration of the Air-Cooled Heat
Exchanger Application within Plantweb™ Insight.
Prior to configuring your Air-Cooled Heat Exchanger Application, be sure to complete all
steps in the Emerson Plantweb Insight Quick Start Guide. Some steps in this guide will be
reiterated in this document in more detail.
E.2 Global settings
E.2.1
E.2.2
Global settings should be set before any configuration is completed. These settings apply
to all assets within a specific application but do not change any setting within the Gateway
or devices. Changing any of these settings can be done in the Settings tab.
Overall health index goal
Overall Health Index Goal is a number entry from 0–100 percent (100 percent =
completely healthy). It is used on the dashboard for the overall health index goal indicator.
Alert weights
Select the Alert Weights button on the Settings page.
Alert weights correspond to the severity of an alert (0 least severe, 100 most severe).
Defaults values are preconfigured for the application and can be changed at any time. The
most severe alert weight will be used for the health index indication for a given air-cooled
heat exchanger.
Alert weight
0–15 Good
16–50 Warning
50+ Critical
Severity
E.3 Configuring assets
To finish configuring assets, navigate to the specific asset Details page by selecting the
asset from the Asset Summary page.
Emerson.com/Plantweb 63
Page 64

Air-Cooled Heat Exchanger Application configuration and information Reference Manual
June 2020 00809-0100-4541
E.3.1 Capture baseline
The Air-Cooled Heat Exchanger Application compares the current state of a heat
exchanger against a baseline. The baseline should be captured after all pertinent
measurement points are configured and the air-cooled heat exchanger is in an ideal/
typical operating state (usually after cleaning).
Once these criteria are met, the admin should capture a baseline using the following steps:
Procedure
1. Select the Capture Baseline button on the Details page. See Figure E-1.
2. Ensure this is the indented baseline air-cooled heat exchanger and select Yes.
Figure E-1: Capture Baseline
E.3.2
64 Emerson.com/Plantweb
Editing alerts
After the baseline is captured, the Air-Cooled Heat Exchanger Application will
automatically set alert thresholds and limits for measurement points and calculations.
Alerts will only be enabled when the applicable measurement points are available. Use the
below fault matrix to identify which measurement points are required for which alerts.
Alerts can be disabled and thresholds can be manually configured.
Page 65

Reference Manual Air-Cooled Heat Exchanger Application configuration and information
00809-0100-4541 June 2020
Figure E-2: Air-Cooled Heat Exchanger Fault Matrix
Procedure
1. Select the Edit Alerts button on the Details page, as shown in Figure E-3.
Figure E-3: Edit Alerts
2. Use the Enable check boxes to enable/disable alerts.
3. Configure alert limits by manually filling in boxes. See Figure E-4, as an example.
Note
Some alerts may have complex calculations that do not allow configuration.
Emerson.com/Plantweb 65
Page 66

Air-Cooled Heat Exchanger Application configuration and information Reference Manual
June 2020 00809-0100-4541
Figure E-4: Asset Alert Details
Note
Alerts can be reset to defaults at any time using the Reset to Default button.
E.4 Calculated fields
E.4.1 Measurement point thresholds
Based on the baseline capture, the Air-Cooled Heat Exchanger Application will
automatically configure thresholds for measurement points (e.g. high vibration, low
process flow, etc.). These thresholds are meant to alert the user to abnormal conditions
pertaining to the air-cooled heat exchanger that could affect the overall health and
performance.
E.4.2
Reverse fan suggestions
If the inlet air temp falls below the low temperature inlet threshold (stop), a stop fan
suggestion alert will be triggered.
66 Emerson.com/Plantweb
Page 67

Reference Manual Air-Cooled Heat Exchanger Application configuration and information
00809-0100-4541 June 2020
E.4.3 Stop fan operation suggestion
If the inlet air temp falls below the low temperature inlet threshold (stop), a stop fan
suggestion alert will be triggered.
E.4.4 Fouling detected
If the differential temperature of the air temperature falls below the minimum differential
temperature, a fouling alert will be triggered.
E.4.5 Excessive cooling
If the differential temperature of the process fluid exceeds the maximum differential
temperature, an excessive cooling alert will be triggered.
E.4.6
E.4.7
E.4.8
Louver defect
A mismatch between the implied and actual louver position can imply a louver mechanical
defect. If both variables are available, a comparison between the two will be performed.
Pitch defect
A mismatch between the implied and actual louver position can imply a pitch actuator
mechanical defect. If both variables are available, a comparison between the two will be
performed.
Air-cooled heat exchanger health index
The air-cooled heat exchanger health index is a 0–100 percent variable determined by the
severity of pump alerts. The air-cooled heat exchanger health is 100 percent if there are
not active alerts. Otherwise, the air-cooled heat exchanger health is calculated based on
the following equation (100 percent – highest alert weight). Therefore, air-cooled heat
exchanger status and health index are correlated to the alert weights.
Table E-1: Air-Cooled Heat Exchanger Health Index
Health index Air-cooled heat exchanger status
86–100% Good
51–85% Warning
≤ 50% Critical
Emerson.com/Plantweb 67
Page 68

Air-Cooled Heat Exchanger Application configuration and information Reference Manual
June 2020 00809-0100-4541
E.4.9 Air-cooled heat exchanger status
Value State Description
0 GOOD Air-cooled heat exchanger health >85%
4 NO DATA/ERROR There is not enough data for the air-cooled heat
exchanger state to calculate
5 NO CONFIG Baseline has not been captured for the air-cooled heat
exchanger
6 OUT OF SERVICE Air-cooled heat exchanger is out of service (user
writable)
7 WARNING Air-cooled heat exchanger health is between 50 and
85%
8 CRITICAL Air-cooled heat exchanger health is <50%
E.5 Modbus TCP mapping
There are four Modbus® Transmission Control Protocol (TCP) outputs and one Modbus
TCP input that are predefined in the Air-Cooled Heat Exchanger Application for every
asset. See table below.
Table E-2: Modbus TCP Definitions
Modbus TCP Definition
Input Out of service
Output Air-Cooled heat exchanger state (value described in #unique_145/
unique_145_Connect_42_table_nqc_qlz_4hb)
Output Air-Cooled Heat Exchanger alert
Output Air-Cooled Heat Exchanger health
Note
Modbus TCP registers and tags are automatically populated in Plantweb Insight and
cannot be changed.
Procedure
1. Registers and codes can be found in each app by going to the app Settings (Global
Settings) and then selecting Download Modbus Mapping.
2. A csv file will open with the listed registers and tags.
68 Emerson.com/Plantweb
Page 69

Reference Manual Pressure Relief Device (PRD) Application configuration and information
00809-0100-4541 June 2020
F Pressure Relief Device (PRD)
Application configuration and
information
F.1 Overview
This document provides information on set up and configuration of the Pressure Relief
Device Application within Plantweb™ Insight.
Prior to configuring your Pressure Relief Device Application, be sure to complete all steps
in the Emerson Plantweb Insight Quick Start Guide. Some steps in the guide will be
reiterated in this document in more detail.
F.2 Global settings
Global settings should be set before any asset configuration is completed. These settings
apply to all assets within a specific application but do not change any settings within the
Gateway or devices. Changing any of these settings can be done in the Settings tab.
Table F-1: Unit of Measurement
Field Input type Description/use
Currency Drop-down selection Used for determining the currency unit of
production costs
Gas units Used for calculations
Pressure units Used for pressure inlet and set pressure
entries
Temperature units Used for gas temperature entry
Linear measurement units Used for orifice size entry
Table F-2: Key Performance Objectives
Field Input type Description/use
Number of releases Number entry Used on dashboard for number of releases
horseshoe goal
Total release duration goal dd:hh:mm Used on dashboard for release duration
horseshoe goal
Lost emissions goal Number entry Used on dashboard for lost emissions
horseshoe goal
Lost product cost goal Used on dashboard for lost product cost
horseshoe goal
Emerson.com/Plantweb 69
Page 70

Pressure Relief Device (PRD) Application configuration and information Reference Manual
June 2020 00809-0100-4541
F.3 Adding assets
F.3.1 Add an asset
Fields of note
Temperature consideration
If enabled, temperature will be considered when determining whether a PRD is releasing.
This can be used when multiple PRDs are in close proximity. This should be activated for
situations such as shared headers.
F.4 Baseline
F.4.1 Capturing baseline
Once assets are configured within the Pressure Relief Device application the user needs to
complete a baseline. The baseline is used to characterize background noise from the PRD
surroundings. To capture a baseline, first ensure the PRD does not release for the extent of
the baseline. This allows the application algorithm to correctly identify and characterize
releases. If a release does occur, the baseline can be stopped and restarted or can be
deleted later. To capture a baseline, complete the following steps:
Procedure
1. Navigate to Asset Summary tab and select Baseline button.
2. Under Awaiting Baseline section, select a baseline time frame for all assets or
individually for each asset.
Note
The longer the baseline, the more accurate the release algorithm. Allowing the
baseline to run longer helps characterize background noise to its full extent.
3. Select the baseline button for each individual asset, or select baseline all to run all
baselines.
70 Emerson.com/Plantweb
Page 71

Reference Manual Pressure Relief Device (PRD) Application configuration and information
00809-0100-4541 June 2020
Figure F-1: Baseline Page
The baseline page shows the user's progress through the baseline process.
F.4.2
Selecting minimum event duration
Once baselines are completed, the user must select a minimum event duration. The
minimum event duration is the quickest release the PRD application will detect. For
example, if the user is only receiving data every eight seconds from the acoustic
transmitter, it is impossible to detect to a four-second release. A rule of thumb is to
multiply the Rosemount 708 Acoustic Transmitter update rate by four to get the shortest
available release length. To select a minimum event duration, complete the following
steps:
Procedure
1. Navigate to Asset Summary tab and select Baseline button.
2. Under Baseline Complete section, select the minimum event duration individually for
each asset or select the Minimum for All button.
Note
Selecting a longer minimum event duration increases the confidence interval of the
algorithm by allowing it to analyze more data over a possible release.
Emerson.com/Plantweb 71
Page 72

Pressure Relief Device (PRD) Application configuration and information Reference Manual
June 2020 00809-0100-4541
Figure F-2: Baseline Complete
F.5 Calculated fields
F.5.1 PRD status
PRD state calculations are derived from ultrasonic amplitude (acoustic) readings from the
Rosemount 708 Acoustic Transmitters and the built-in Plantweb Insight algorithm. The
following states are calculated.
Table F-3: State Descriptions
Value Name Description Action
0 NORMAL
OPERATION
1 RELEASE Plantweb Insight has recognized a potential
4 NO DATA/
ERROR
5 NO CONFIG Critical user configuration information is
6 OUT OF
SERVICE
7 BASELINE_
NEEDED
PRD operating normally None
PRD release
The Rosemount 708 is not publishing data or
is publishing a fault condition
missing
The PRD is set to out of service (user
writable)
PRD Asset it configured and is waiting for the
user to prompt a baseline
Investigate event log
and/or PRD
Investigate Rosemount
708
Configure asset
None
Run baseline function
(see Trap status)
72 Emerson.com/Plantweb
Page 73

Reference Manual Pressure Relief Device (PRD) Application configuration and information
00809-0100-4541 June 2020
Table F-3: State Descriptions (continued)
Value Name Description Action
8 CAPTURING_B
ASELINE
9 AWAITING_
EVENT_
DURATION
F.5.2 Emissions loss
When a PRD is releasing, excess emissions are lost. The emissions loss value represents the
total aggregated emissions due to releasing PRDs over the selected time period.
F.5.3
F.5.4
Lost production cost
When a PRD is releasing, production materials may be lost. The lost production costs value
represents the total aggregated production loss due to releasing PRDs over the selected
time period.
Device status
Device health Description Action
GOOD Device operating normally None
POWER_MODULE_LOW Power module has a low battery Prepare to replace
Baseline is being captured None
Baseline is complete and asset is awaiting a
minimum event duration to be selected
Select minimum event
duration (see Lost
energy cost)
power module
POWER_MODULE_CRITICAL Power module has a critically low
battery
DEVICE_MALFUNCTION Devide has a malfunction Investigate device
NO_DATA No polling data was found
DEVICE_NOT_FOUND The asset’s device cannot be found
DEVICE_OUT_OF_SERVICE The asset's device is set to out of
service
GATEWAY_NOT_FOUND The Gateway associated with the
asset’s device cannot be found
GATEWAY_OUT_OF_SERVICE The Gateway associated with the
asset’s device is set to out of service
Replace power module
None
Investigate Gateway
None
Emerson.com/Plantweb 73
Page 74

Pressure Relief Device (PRD) Application configuration and information Reference Manual
June 2020 00809-0100-4541
F.6 Modbus TCP mapping
Procedure
1. There are three Modbus® TCP outputs and one Modbus TCP input that are predefined in the app for every asset.
Modbus TCP Definition
Input Out of service
Output PRD status (value described in Table F-3)
Lost energy cost
Emissions lost
2. Modbus TCP registers and tags are pre-populated in Plantweb Insight and cannot be
changed.
3. Registers and codes can be found in each app by going to app Settings (Global
Settings) then select Download Modbus Mapping.
74 Emerson.com/Plantweb
Page 75

Reference Manual Cooling Tower Application configuration and information
00809-0100-4541 June 2020
G Cooling Tower Application
configuration and information
G.1 Overview
This document provides information on set up and configuration of the Cooling Tower
Application within Plantweb™ Insight.
Prior to configuring your Cooling Tower Application, be sure to complete all steps in the
Emerson Plantweb Insight Quick Start Guide. Some steps in this guide will be reiterated in
this document in more detail.
G.2 Global settings
Global settings should be set before any configuration is completed. These settings apply
to all assets within a specific application but do not change any setting within the Gateway
or devices. Changing any of these settings can be done in the Settings tab.
G.2.1
G.2.2
Overall Health Index Goal
Overall Health Index Goal is a number entry from 0-100 percent (100% = completely
healthy). It is used on the dashboard for the overall health index goal indicator.
Alert weights
Select the Alert Weights button on the Settings page.
Alert weights correspond to the severity of an alert (0 least severe, 100 most severe).
Defaults values are preconfigured for the application and can be changed at any time. The
most severe active alert weight will be used for the health index indication for a given
cooling tower. See below table.
Alert weight
0-15 Good
16-50 Warning
50+ Critical
Severity
Emerson.com/Plantweb 75
Page 76

Cooling Tower Application configuration and information Reference Manual
June 2020 00809-0100-4541
G.3 Adding assets
Fields of note
Asset link
The Cooling Tower application links to other Plantweb Insight applications to provide a
holistic view into the Cooling Tower health. The Cooling Tower application can link to
assets within both the Cooling Tower and ACHE (fan) applications. To accomplish this, use
the following instructions.
Procedure
1. Navigate to the New Asset page.
2. Under the Asset Link section, select the “+” button for the corresponding asset
(recirculation Cooling Tower, supply Cooling Tower, or fan).
3. Type in the asset tag and select the asset.
76 Emerson.com/Plantweb
Page 77

Reference Manual Cooling Tower Application configuration and information
00809-0100-4541 June 2020
G.4 Configuring assets
To finish configuring assets, navigate to the specific asset Details page by selecting the
asset from the Asset Summary page.
G.4.1 Capture baseline
The Cooling Tower application compares the current state of a Cooling Tower against a
baseline. The baseline should be captured after all pertinent measurement points are
configured and the Cooling Tower is in an ideal/typical operating state. Once these criteria
are met, the admin should capture a baseline:
Procedure
1. Select the Capture Baseline button on the Details page.
2. Ensure this is the intended baseline Cooling Tower condition and select Yes.
Emerson.com/Plantweb 77
Page 78

Cooling Tower Application configuration and information Reference Manual
June 2020 00809-0100-4541
G.4.2 Editing alerts
After the baseline is captured, the Cooling Tower application will automatically set alert
thresholds and limits for measurement points and calculations. Alerts can only be enabled
when the applicable measurement points are available. Use the below fault matrix to
identify which measurement points are required for which alerts.
Alerts can be disabled and thresholds can be manually configured.
Procedure
1. Select the Alerts button on the Details page.
2. Use the Enable check boxes to enable/disable alerts.
3. Configure alert limits by manually filling in boxes (some alerts may have complex
calculations that do not allow configuration).
Note
Alerts can be reset to defaults at any time using the Reset to Default button.
G.5 Calculated fields
G.5.1 Measurement point thresholds
Based on the baseline capture, the Cooling Tower application will automatically configure
thresholds for measurement points (ex: low flow, high pH, etc.). These thresholds are
meant to alert the user to abnormal conditions pertaining to the cooling tower that could
affect the overall health and performance.
78 Emerson.com/Plantweb
Page 79

Reference Manual Cooling Tower Application configuration and information
00809-0100-4541 June 2020
G.5.2 Efficiency
Plantweb Insight uses temperature throughout the a water cycle to determine the
efficiency of the cooling tower.
G.5.3 Cooling Tower health index
The Cooling Tower health index is a 0-100 percent variable determined by the severity of
cooling tower alerts. The Cooling Tower Health is 100 percent if there are not active alerts.
Otherwise, the Cooling Tower health is calculated based on the following equation (100
percent – highest alert weight). Therefore, cooling tower status and health index are
correlated to the alert weights.
Table G-1: Cooling Tower Health Index
Health index Cooling Tower status
86–100% Good
51–85% Warning
≤ 50% Critical
G.5.4 Cooling Tower status
Table G-2: Cooling Tower Status
Value State Description
0 GOOD Cooling Tower health > 85%
4 NO DATA/ERROR There is not enough data for the Cooling Tower state to
5 NO CONFIG Baseline has not been captured for the Cooling Tower
6 OUT OF SERVICE Cooling Tower is out of service (user writable)
7 WARNING Cooling Tower health is between 50% and 85%
8 CRITICAL Cooling Tower health is less than 50%
G.6 Modbus TCP mapping
Procedure
1. There are four Modbus® Transmission Control Protocol (TCP) outputs and one
Modbus TCP input that are predefined in the Cooling Tower Application for every
asset. See table below.
Table G-3: Modbus TCP Definitions
calculate
Modbus TCP Definition
Input Out of service
Output Cooling tower state (value described on the table in section 5.8)
Emerson.com/Plantweb 79
Page 80

Cooling Tower Application configuration and information Reference Manual
June 2020 00809-0100-4541
Table G-3: Modbus TCP Definitions (continued)
Modbus TCP Definition
Output Cooling tower alert
Output Cooling tower health
Output Cooling tower lost energy costs
2. Modbus TCP registers and tags are automatically populated in Plantweb Insight and
cannot be changed. The Modbus TCP port for the Cooling Tower Application is 508.
3. Registers and codes can be found in each app by going to the app Settings (Global
Settings) then select Download Modbus Mapping.
4. A csv file will open with the listed registers and tags.
80 Emerson.com/Plantweb
Page 81

Reference Manual Network Management Application configuration and information
00809-0100-4541 June 2020
H Network Management Application
configuration and information
H.1 Overview
This document provides information on set up and configuration of the Network
Management application within Plantweb™ Insight.
Prior to configuring the application, be sure to complete all steps in the Emerson Plantweb
Insight Quick Start Guide. Some steps in the guide will be reiterated in this document in
more detail.
H.2 Global settings
Global settings should be in place before any application configuration is completed.
These settings apply to all networks within the application but do not change any settings
within the Gateway or devices. Changing any of these settings can be done in the Settings
tab.
H.2.1
Alert weights
Alert weights correspond to the severity of an alert (informational, warning, critical).
Defaults values are preconfigured for the application and can be changed at any time.
Alerts from the Network Management application come from the Gateway Syslog server.
This Syslog server must be connected to Plantweb Insight. To do so: navigate to the
Gateway user interface System Settings > Logging page. The Plantweb Insight IP address
should be inputted as the Remote Server IP address. Other settings should match below:
Emerson.com/Plantweb 81
Page 82

Network Management Application configuration and information Reference Manual
June 2020 00809-0100-4541
H.2.2 Calculated fields
Network status
Network Status is based on a pre-defined network reliability calculation. This is different
than the reliability displayed in Gateway web page.
Name
GOOD Operating normally None
WARNING Network reliability is below best
CRITICAL Network reliability is severely below best
Description Action
practices.
practices.
Investigate Network Details for areas of
improvement
82 Emerson.com/Plantweb
Page 83

Reference Manual Network Management Application configuration and information
00809-0100-4541 June 2020
Device status
Device status is based on the reliability of the device.
Name Description Action
GOOD Operating normally None
H.2.3
PROBLEM Device reliability is below
expected.
UNREACHA
BLE
Device has dropped off the
network.
Investigate Network Details and diagram for areas of
improvement
Locate device to troubleshoot. Possible power module
replacement
Network load index
Based on the network load of each Gateway. Results are categorized into high, medium,
and low load networks.
Gateway best practices (details page)
Total live devices
Each network should contain at least five active devices.
Gateway neighbors
25 percent of active devise should be direct gateway neighbors.
Device neighbors
Every device should have at least three neighbors with 70 percent path stability or higher.
Hops (fast sampling)
Fast sampling devices (eight-second update rate or faster) should have fewer than two
hops to the gateway
Hops (regular sampling)
Regular sampling devise (more than eight-second update rate) should have fewer than
seven hops to the Gateway.
H.2.4
Emerson.com/Plantweb 83
Network diagram
A network diagram for each network will be available in the Network Management
Application. The following navigation tools are available.
Drag and drop
Select and hold a device or gateway to move around the diagram
Device details
Hover over a device to see more information (device name, device type, etc.)
Page 84

Network Management Application configuration and information Reference Manual
June 2020 00809-0100-4541
Device neighbors
Double click a device to highlight the device's neighbors. Double click again on the device
to display the normal view.
84 Emerson.com/Plantweb
Page 85

Reference Manual Power Module Application configuration and information
00809-0100-4541 June 2020
I Power Module Application
configuration and information
I.1 Overview
This document provides information on set up and configuration of the Power Module
Management application within Plantweb™ Insight.
Prior to configuring the application, be sure to complete all steps in the Emerson Plantweb
Insight Quick Start Guide. Some steps in the guide will be reiterated in this document in
more detail.
I.2 Global settings
Global settings should be in place before any Power Module configuration is completed.
These settings apply to all Power Modules within this application but do not change any
settings within the Gateway or devices. Changing any of these settings can be done in the
Settings tab.
I.2.1
I.2.2
Estimated remaining life
The estimated remaining life configuration is used to set the second dashboard donut.
Estimated total lifespan
The estimated total lifespan configuration is used to set the third dashboard donut.
I.3 Adding power modules
I.3.1 Add power modules
Use this method to add power modules with default settings.
Procedure
1. Navigate to Power Module Summary tab and select Add Power Modules button. The
Power Module Configuration will appear.
2. Select Power Modules to add then select Add Selected button or select Add All
button.
3. Select Save and OK.
4. After adding power modules, ensure the installation date is correct. This field is
used for calculations and should be set to the date the power module was installed.
Emerson.com/Plantweb 85
Page 86

Power Module Application configuration and information Reference Manual
June 2020 00809-0100-4541
Calculated fields
Power module status
Power module status is determined using the supply voltage symptoms.
Name Description Action
GOOD Operating normally None
LOW Device is in a low power condition. Replace power module
CRITICAL Device is in a critical power condition.
Estimated remaining life
Based on the conditions of the power module and the installation date, the remaining
estimated life of the power module can be determined. This is a high-level estimate and
should be treated as such, but can provide an indication for maintenance planning.
Estimate total lifespan
Based on the current configuration of the device (update rate, etc.), a total lifespan can be
estimated. This is a high-level estimate designed to notify the users of power modules that
will need to be replace frequently.
Note
Whenever new power modules are installed, the user must configure the device as such.
To do so, reference the specific device manual. This process can be accomplished using a
Field Communicator or device manager (e.g. Service Tools → Maintenance → Other →
Install New Power Module)
86 Emerson.com/Plantweb
Page 87

Reference Manual Inline Corrosion application configuration and information
00809-0100-4541 June 2020
J Inline Corrosion application
configuration and information
J.1 Overview
This document provides information on set up and configuration for the Inline Corrosion
application within Plantweb™ Insight.
Prior to configuring your inline corrosion application, be sure to complete all steps in the
Emerson Plantweb Insight Quick Start Guide. Some steps in this guide will be reiterated in
this document in more detail.
J.2 Global settings
The global settings should be in place before any internal corrosion monitoring device
configuration is completed. These settings apply to all installed corrosion monitoring
devices within the application and do not change the settings within the gateway or
devices. Changing any of these settings can be done in the Settings tab.
J.2.1
Default thresholds
Each new device created in the application will have defaulted thresholds, that further can
be changed for each device according to its process requirements.
In the Threshold Tab, the user can setup the threshold values for an alert to be triggered in
the application. The thresholds are:
• Low Battery Level: An alert is triggered when the battery reaches the pre-defined
voltage level, notifying the user that the device or tag needs a battery replacement.
• Probe Device Lifespan: An alert is triggered when the probe reaches the pre-defined
lifespan, notifying the user that the device or tag needs a probe replacement.
• Fluid Corrosion Rate Limit: An alert is triggered when the process corrosivity level
reaches the pre-defined limit, notifying the user.
• No Data: An alert is triggered when no data is received from the transmitter within the
time set in this field.
Table J-1: Defaulted Thresholds
Category Unit Min Max
Low battery level
Probe lifespan
Corrosivity rate
Volts 5.5 7 6
% of half the
thickness of the
element
mm/year 0.0125 0.25 0.25
0 100 85
Defualted
thresholds
Emerson.com/Plantweb 87
Page 88

Inline Corrosion application configuration and information Reference Manual
June 2020 00809-0100-4541
Table J-1: Defaulted Thresholds (continued)
Category Unit Min Max
No data interval
The user can also select if the defaulted thresholds shall be used or not, to trigger an alert
by clicking in the Enable button on the right side of the threshold table.
Click Update to save threshold settings.
Figure J-1: Global Settings-Default Thresholds
Minutes 15 4320 480
Defualted
thresholds
J.2.2 Adding sites
Sites are used in the application for tracking the primary location where the inline
corrosion monitoring device is installed. The user can add as many Sites as required.
Suggested Sites can be units, systems or parts of the customer’s plant. For example, in a
refinery plant, a common site would be “Crude Oil Distillation Unit (CDU)”, which has
various internal locations that will be further configured in the Locations Tab in the Global
Settings.
To add a Site, navigate to the Sites tab then click on the Add Site button.
88 Emerson.com/Plantweb
Page 89

Reference Manual Inline Corrosion application configuration and information
00809-0100-4541 June 2020
Figure J-2: Global Settings-Sites Tab
In the Site adding screen, the user shall name the Site and include a short Site description
for internal reference. Click Save to add a site.
J.2.3
Figure J-3: Global Settings-Site Adding Screen
Adding locations
After adding the site(s), the user can add the Locations inside of each site to specify with
more details where the Inline Corrosion Monitoring Device is located. Following the
previous example, in a refinery plant, a common site would be “Crude Oil Distillation Unit
(CDU)” and a common Location would be “Outlet Line of the Distillation Tower”. Each site
can have as many locations as required.
To add a Location, navigate to the Locations tab then click on the Add Location button.
Emerson.com/Plantweb 89
Page 90

Inline Corrosion application configuration and information Reference Manual
June 2020 00809-0100-4541
Figure J-4: Global Settings-Locations Tab
In the location adding screen, the user shall select from a drop-down list in the respective
site that this location is part of. After selecting the site, the user shall name the location
and include a short location description for internal reference, for example; the line
number or P&ID. Click save to add Location.
Figure J-5: Global Settings-Location Adding Screen
J.3 Adding devices
To add a Corrosion Monitoring Device in the application, navigate to the Device Summary
tab and click the Add a Device button.
Figure J-6: Device Summary Screen
90 Emerson.com/Plantweb
Page 91

Reference Manual Inline Corrosion application configuration and information
00809-0100-4541 June 2020
When clicking the button, an Add a Device Screen will appear. For each corrosion
monitoring device, the user shall input the required information regarding location details,
probe details, instrument details, installation details, and thresholds for the Device being
added. The user is required to select from a drop-down menu or manually fill in all required
fields. Click Save to add the Device.
Figure J-7: Add a Device Screen
J.3.1 Location details
In the location details table, the user shall setup the identification information about the
corrosion monitoring device. The location details include:
• Device Tag: The Device Tag refer to the unique identification number configured in the
device WirelessHART settings during the instrument commissioning. It is the Long Tag
of each instrument that is communicating with the gateway. The user shall select the
correct Device Tag identification number from a drop down menu, respective of the
device being added in the application. The user can manually change the Tag name if
required directly in the gateway or using a handheld or AMS.
• Site: Select the applicable site from the drop-down list containing all the Sites
previously added in the Global Settings (see Adding sites).
• Location: The Location inside of the Site where the tag is installed. Select the Location
from the drop-down menu containing all the Locations of the selected Site, previously
added in the Global Settings (see Adding locations).
• Location Details: This field will show the Location description previously added when
adding the Location. (see Adding locations).
Emerson.com/Plantweb 91
Page 92

Inline Corrosion application configuration and information Reference Manual
June 2020 00809-0100-4541
J.3.2 Probe details
In the Probe Details table, the user shall setup the details of the corrosion probe being
used for the Device or Tag that is being added. The probe details include:
• Type of Probe: Select from a pre-defined drop-down menu, the technology type of the
probe, that can be: Electrical Resistance (ER) or Linear Polarization Resistance(LPR) with 2
or 3 electrodes.
• Pressure Load: Select the probe's pressure design probe from the drop-down menu;
Low Pressure Design (also known as Retractable Type) or High Pressure Design (also known
as Retrievable Type).
• Type of Instrument: Select the type of instrument being used from the drop-down
menu for the tag that is being added.
• Element Thickness: Input the sensing Element Thickness of the probe. Only applicable
if ER probes type is selected.
• Model Code: Recommended to add model code for future reference.
When type of Probe and Pressure Load are selected, a reference picture will be shown in
the upper-right side of the Add a Device Screen.
J.3.3
J.3.4
Instrument details
In the Instrument Details table, the user shall set up the details of the instrument being
used for the tag that is being added. The instrument details include:
• Manufacturer: Emerson. This field cannot be edited.
• Model: Input the transmitter model code
• Serial Number: Input the transmitter serial number
Installation details
In the Installation Details table, the user shall set up the details of the installation of the
corrosion probe. The installation details include:
• Installation Date: The date when the corrosion probe was installed.
• Integration Period: The time expected for the corrosion probe to adapt to the process
fluids for the reading to stabilize. The integration period is fixed at 7 days.
• Add a reason for why the probe was installed.
92 Emerson.com/Plantweb
Page 93

Reference Manual Inline Corrosion application configuration and information
00809-0100-4541 June 2020
J.3.5 Tesholds for notifications
When adding a device, the user can choose to use the Default Thresholds (see Default
thresholds) or to set up specific Thresholds for the tag being added. To change the
Thresholds, the user shall click on the check-box on the left side of the table and add the
desired values.
Figure J-8: Add Device Screen-Thresholds for Notifications
The user can select to trigger alerts based on the specific threshold values by clicking on
the right sliding bars.
J.3.6
Device notes
Each tag has a free-text field on the lower right side of the Add a Device Screen where the
user can add any important note related to the specific Tag. Suggested information that
can be added in this field are, for example, the probe installation position (6 or 12 o’clock),
the monitoring position (top of line, middle of line, bottom of line), process connection
type (flanged, threaded or flareweld, etc.)
Figure J-9: Add a Device Screen - Notes
Emerson.com/Plantweb 93
Page 94

Inline Corrosion application configuration and information Reference Manual
June 2020 00809-0100-4541
J.4 Dashboard user interaction
The Plantweb Insight Inline Corrosion application is designed for continuous analysis and
corrosion monitoring trends for installed wireless corrosion probes. The application
delivers insight to instrument health and provide alerts on pre-set thresholds for high
corrosivity, probe life-span, low battery level and more. An intuitive heatmap is displayed
with intelligence on corrosivity of fluid levels based on the NACE standard. (Ref. NACE
SP0775-2013).
J.4.1 KPIs
The Inline Corrosion application dashboard features a 3 key performance indicators (KPI)
section for easy visualization of the user’s asset health. The 3- KPI section gives the user an
insight of:
• Corrosivity of Fluids: The left icon on the dashboard classifies the devices that are
sensing different levels of corrosivity.
• Device Status: The middle icon on the dashboard provides information related to
device health. The devices that are not functioning will be shown in this icon.
J.4.2
• Alert: The right icon on the dashboard shows the number of alerts on-going.
Heat map interaction
In the right-upper side of the heat map, the user can select to show data of three different
time periods: 1 Week, 1 Month or 3 Months.
Figure J-10: Inline Corrosion Dashboard
The corrosivity levels shown in the heat map are classified based on the international
standard NACE SP0775-2013.
94 Emerson.com/Plantweb
Page 95

Reference Manual Inline Corrosion application configuration and information
00809-0100-4541 June 2020
Table J-2:
Color coding Level Corrosion rate
Gray Low <0.025 mm/year; <1
mpy
Yellow Moderate 0.025 to 0.12 mm/
year; 1 to 5 mpy
Orange High 0.13 to 0.25 mm/year;
5 to 10 mpy
Red Severe >0.25 mm/year; >10
mpy
J.4.3 Alert log
In the dashboard, the user can see the last five recent alerts by clicking on the Log button
on top of the heat map.
Figure J-11: Alert Log
J.5 Device summary user interaction
In the Device Summary tab, the user has access to all the corrosion monitoring devices
being monitored by the application.
Emerson.com/Plantweb 95
Page 96

Inline Corrosion application configuration and information Reference Manual
June 2020 00809-0100-4541
Figure J-12: Device Summary Tab
The Device Summary tab brings the following information of each tag:
• Device tag: The Device tag refer to the unique identification number configured in the
device WirelessHART settings during the instrument commissioning. It is the long tag
of each instrument that is communicated to the Gateway. The user shall select for each
device being add into the application the correct Device tag from a drop-down list
containing all tags received from the Gateway.
• Site: Select the applicable site from a drop-down list containing all the Sites previously
added in the Global Settings (see Adding sites).
• Location: The Location is within the respected Site where the tag is installed. The user
can select the Location from a drop-down menu containing all the Locations of the
selected Site, previously added in the Global Settings (see Adding locations).
J.5.1
Device Status
•
Description of Probe
•
Corrosivity
•
Corrosivity Level
•
(see Table J-2).
Alert
•
•
•
•
•
•
: Indicates if the tag has one or more on-going alerts.
Alert Start Date
Alert Duration
Flag
: The tag can be flagged in the event of highlighting the importance of an event for
that specific tag.
Notes
: The icon shows if the tag has a note. (see Device notes).
Actions
button or to Delete the Device by clicking on the Delete button. (see Device details and
Delete device).
: Indicate the status of the tag instrument (working or not-working).
: Indicates the type of corrosion probe being used within the tag.
: The last value measured by the tag.
: Indicates in what level of corrosivity which the tag is being classified.
: Indicates what is the starting date of the last on-going Alert.
: Indicates for how long the last on-going Alert is active.
: In this column the user can open the Device Detail Screen by clicking on the Edit
Export device summary
The user can export the entire device summary in .xlsx or CSV file by clicking on the Export
button on top of the device table.
96 Emerson.com/Plantweb
Page 97

Reference Manual Inline Corrosion application configuration and information
00809-0100-4541 June 2020
Figure J-13: Device Summary Export Button
J.5.2 Device details
The user can view all the details of a corrosion monitoring device by clicking on the tag
number.
The Device Screen will be open, and the user can see the summary of the device and the
setup information.
Figure J-14: Device Screen
The user can edit the device parameters from the same screen when a probe is replaced, in
order to keep traceability of any changes for that specific tag.
When a change has been made, select the date and insert reason for the change before
clicking the Update button.
J.5.3
Emerson.com/Plantweb 97
Delete device
The admin user can delete a corrosion monitoring device if required by clicking in the
Delete button on the right side of the device table or by clicking the Delete button on top
of the device screen.
Note
When a device is deleted, the configuration and history of the tag is lost.
Page 98

Inline Corrosion application configuration and information Reference Manual
June 2020 00809-0100-4541
J.6 Event log user interaction
The Event Log table shows the alert history of all the corrosion monitoring devices within
the application. In this screen the user has access to up to 1 year of alerts history, that can
be filtered by different time periods: Last 8 Hours, Last 24 Hours, Last 1 Week, Last 1 Month
or Last 1 Year.
Figure J-15: Event Log
J.6.1
J.6.2
Each event will be logged with an Alert Type, Event Start Date, Event End Date and Duration
of the vvent.
Alerts type
The inline corrosion application provide five types of alerts, these are sorted based on
priority. (The top alert has highest priority):
• No Data: This alert is triggered when a device is not sending data for a period longer
than set Thresholds (see Default thresholds).
• Corrosivity level exceeded: This alert is triggered when a device is measuring
Corrosion rates above the limit setup in the Thresholds (see Default thresholds).
• Low Battery: This alert is triggered when a device’s battery show voltage below the
limit setup in the Thresholds (see Default thresholds).
• Probe Lifespan: This alert is applicable only for ER probes. The alert is triggered when
the probe lifespan is below the limit setup in the Thresholds (see Default thresholds).
• No Alert: A device that does not have any alerts triggered will show up in this category.
If all probes have a triggered alert, this field will be hidden.
Acknowledge function
An alert that is triggered in the event log indicates that a possible action is required from
the user or personnel responsible for the corrosion monitoring devices, and for actions
tracking purposes the application allows the user to acknowledge the alert.
The user may click in the Acknowledge check-box at the Event log table when an action is
starting for fixing the alert. When clicking the check-box, the Acknowledge details screen
98 Emerson.com/Plantweb
Page 99

Reference Manual Inline Corrosion application configuration and information
00809-0100-4541 June 2020
will appear, where the user can see details about the alert and allows the user to input
valuable information about the actions being taken.
Figure J-16: Acknowledge Details Screen
The user can still acknowledge an alert that ended in order to include details about the
actions taken to fix the alert.
Emerson.com/Plantweb 99
Page 100

00809-0100-4541
Rev. GA
2020
Global Headquarters
Emerson Automation Solutions
6021 Innovation Blvd.
Shakopee, MN 55379, USA
+1 800 999 9307 or +1 952 906 8888
+1 952 204 8889
RFQ.RMD-RCC@Emerson.com
Latin America Regional Office
Emerson Automation Solutions
1300 Concord Terrace, Suite 400
Sunrise, FL 33323, USA
+1 954 846 5030
+1 954 846 5121
RFQ.RMD-RCC@Emerson.com
Asia Pacific Regional Office
Emerson Automation Solutions
1 Pandan Crescent
Singapore 128461
+65 6777 8211
+65 6777 0947
Enquiries@AP.Emerson.com
North America Regional Office
Emerson Automation Solutions
8200 Market Blvd.
Chanhassen, MN 55317, USA
+1 800 999 9307 or +1 952 906 8888
+1 952 204 8889
RMT-NA.RCCRFQ@Emerson.com
Europe Regional Office
Emerson Automation Solutions Europe
GmbH
Neuhofstrasse 19a P.O. Box 1046
CH 6340 Baar
Switzerland
+41 (0) 41 768 6111
+41 (0) 41 768 6300
RFQ.RMD-RCC@Emerson.com
Middle East and Africa Regional Office
Emerson Automation Solutions
Emerson FZE P.O. Box 17033
Jebel Ali Free Zone - South 2
Dubai, United Arab Emirates
+971 4 8118100
+971 4 8865465
RFQ.RMTMEA@Emerson.com
Linkedin.com/company/Emerson-Automation-Solutions
Twitter.com/Rosemount_News
Facebook.com/Rosemount
Youtube.com/user/RosemountMeasurement
©
2020 Emerson. All rights reserved.
Emerson Terms and Conditions of Sale are available upon request. The Emerson logo is a
trademark and service mark of Emerson Electric Co. Rosemount is a mark of one of the
Emerson family of companies. All other marks are the property of their respective owners.
 Loading...