


MODEL 1000
GAS CHROMATOGRAPH
HARDWARE REFERENCE MANUAL
Applies to both
Daniel Danalyzer Model 1000
Rosemount Analytical Model 1000
Part Number 3-9000-541
Revision B
SEPTEMBER 2005


MODEL 1000 SEP 2005
MODEL 1000 GAS CHROMATOGRAPH
HARDWARE REFERENCE MANUAL
NOTICE
DANIEL MEASUREMENT AND CONTROL, INC. AND ROSEMOUNT ANALYTICAL, INC. (COLLECTIVELY,
“SELLER”) SHALL NOT BE LIABLE FOR TECHNICAL OR EDITORIAL ERRORS IN THIS MANUAL OR
OMISSIONS FROM THIS MANUAL. SELLER MAKES NO WARRANTIES, EXPRESSED OR IMPLIED,
INCLUDING THE IMPLIED WARRANTIES OF MERCHANTABILITY AND FITNESS FOR A PARTICULAR
PURPOSE WITH RESPECT TO THIS MANUAL AND, IN NO EVENT, SHALL SELLER BE LIABLE FOR ANY
SPECIAL OR CONSEQUENTIAL DAMAGES INCLUDING, BUT NOT LIMITED TO, LOSS OF PRODUCTION,
LOSS OF PROFITS, ETC.
PRODUCT NAMES USED HEREIN ARE FOR MANUFACTURER OR SUPPLIER IDENTIFICATION ONLY AND
MAY BE TRADEMARK S/REGISTERED TRA DEMARKS OF THESE COM PANIES.
THE CONTENTS OF THIS PUBLICATION ARE PRESENTED FOR INFORMATIONAL PURPOSES ONLY, AND
WHILE EVERY EFFORT HAS BEEN MADE TO ENSURE THEIR ACCURACY, THEY ARE NOT TO BE
CONSTRUED AS WARRANTIES OR GUARANTEES, EXPRESSED OR IMPLIED, REGARDING THE
PRODUCTS OR SERVICES DESCRIBED HEREIN OR THEIR USE OR APPLICABILITY. WE RESERVE THE
RIGHT TO MODIFY OR IMPROVE THE DESIGNS OR SPECIFICATIONS OF SUCH PRODUCTS AT ANY TIME.
SELLER DOES NOT ASSUME RESPONSIBILITY FOR THE SELECTION, USE OR MAINTENANCE OF ANY
PRODUCT. RESPONSIBILITY FOR PROPER SELECTION, USE AND MAINTENANCE OF ANY SELLER
PRODUCT REMAINS SOLELY WITH THE PURCHASER AND END-USER. DANIEL AND THE DANIEL LOGO
ARE REGISTERED TRADEMARKS OF DANIEL INDUSTRIES, INC. THE ROSEMOUNT AND ROSEMOUNT
ANALYTICAL LOGO THE ARE REGISTERED TRADEMARKS OF ROSEMOUNT ANALYTICAL, INC. THE
EMERSON LOG O IS A TRADEMARK AN D SERVICE MARK OF EMERSON ELECTRIC CO.
COPYRIGHT © 2005
BY DANIEL MEASUREMENT AND CONTROL, INC.,
HOUSTON, TEXAS,
U.S.A.
All rights reserved. No part of this work may be reproduced or
copied in any form or by any means - graphic, electronic, or
mechanical — without first receiving the written permission of
Daniel Measurement and Control, Inc. Houston, Texas, U.S.A.
PREFACE
i

SEP 2005 MODEL 1000
WARRANTY
1. LIMITED WARRANTY: Subject to the limitations contained in Section 2 herein and except as otherwise expressly
provided herein, Daniel Measurement and Control, Inc. and Rosemount Analytical, Inc., (collectively “Seller”) warrants
that the firmware will execute the programming instructions provided by Seller, and that the Goods manufactured or
Services provided by Seller will be free from defects in materials or workmanship under normal use and care until the
expiration of the applicable warranty period. Goods are warranted for twelve (12) months from the date of initial
installation or eighteen (18) months from the date of shipment by Seller, whichever period expires first. Consumables
and Services are warranted for a period of 90 days from the date of shipment or completion of the Services. Products
purchased by Seller from a third party for resale to Buyer ("Resale Products") shall carry only the warranty extended by
the original m anufacturer. Buyer agrees that Seller has no liability for Resale Products beyond making a reasonable
commercial effort to arrange for procurement and shipping of the Resale Products. If Buyer discovers any warranty
defects and notifies Seller thereof in writing during the applicable warranty period, Seller shall, at its option, promptly
correct any errors that are found by Seller in the firmware or Services, or repair or replace F.O.B. point of manufacture
that portion of the Goods or firmware found by Seller to be defective, or refund the purchase price of the defective
portion of the Goods/Services. All replacements or repairs necessitated by inadequate maintenance, normal wear and
usage, unsuitable power sources, unsuitable environmental conditions, accident, misuse, improper installation,
modification, repair, storage or handling, or any other cause not the fault of Seller are not covered by this limited
warranty, and shall be at Buyer's expense. Seller shall not be obligated to pay any costs or charges incurred by Buyer
or any other party except as may be agreed upon in writing in advance by an authorized Seller representative. All costs
of dismantling, reinstallation and freight and the time and expenses of Seller's personnel for site travel and diagnosis
under this warranty clause shall be borne by Buyer unless accepted in writing by Seller. Goods repaired and parts
replaced during the warranty period shall be in warranty for the remainder of the original warranty period or ninety (90)
days, whichever is longer. This limited warranty is the only warranty made by Seller and can be amended only in a
writing signed by an authorized representative of Seller. Except as otherwise expressly provided in the Agreement,
THERE ARE NO REPRESENTATIONS OR WARRANTIES OF ANY KIND, EXPRESSED OR IMPLIED, AS TO
MERCHANTABILITY, FITNESS FOR PARTICULAR PURPOSE, OR ANY OTHER MATTER WITH RESPECT
TO ANY OF THE GOODS OR SERVICES. It is understood that corrosion or erosion of materials is not covered
by our guarantee.
2. LIMITATION OF REMEDY AND LIABILITY: SELLER SHALL NOT BE LIABLE FOR DAMAGES CAUSED
BY DELAY IN PERFORMANCE. THE SOLE AND EXCLUSIVE REMEDY FOR BREACH OF WARRANTY
HEREUND ER SHALL BE LIMITED TO REPAIR, CORRECTION , REPLACEM ENT OR REFUND OF PUR CHASE
PRICE UNDER THE LIMITED WARRANTY CLAUSE IN SECTION 1 HEREIN. IN NO EVENT, REGARDLESS
OF THE FORM OF THE CLAIM OR CAUSE OF A CTION (WHETHER BASED IN CONTRACT, INFRINGEMENT,
NEGLIGENCE, STRICT LIABILITY, OTHER TORT OR OTHERWISE), SHALL SELLER'S LIABILITY TO
BUYER AND/OR ITS CUSTOMERS EXCEED THE PRICE TO BUYER OF THE SPECIFIC GOODS
MANUFACTURED OR SERVICES PROVIDED BY SELLER GIVING RISE TO THE CLAIM OR CAUSE OF
ACTION. BUYER AGREES THAT IN NO EVENT SHALL SELLER'S LIABILITY TO BUYER AND/OR ITS
CUSTOMERS EXTEND TO INCLUDE INCIDENTAL, CONSEQUENTIAL OR PUNITIVE DAMAGES. THE
TERM "CONSEQUENTIAL DAMAGES" SHALL INCLUDE, BUT NOT BE LIMITED TO, LOSS OF
ANTICIPATED PROFITS, LOSS OF USE, LOSS OF REVENUE AND COST OF CAPITAL.
ii
PREFACE

MODEL 1000 SEP 2005
TABLE OF CONTENTS
1.0 PURPOSE OF THIS MANUAL ......................................1-1
1.1 PURPOSE OF THIS MANUAL ......................................1-1
1.2 INTROD UCTION .................................................. 1-3
1.3 FUNCTIONAL DESCRIPTION ......................................1-5
1.4 MINIMUM PC REQUIREMENTS ...................................1-7
1.5 MODES OF OPERATION ..........................................1-9
1.5.1 User Interfaces .....................................................1-9
1.5.2 Capabilities ............... ............ ......... ............ .......1-10
1.6 THEORY OF OPERATION ........................................1-11
1.6.1 The Analyzer Detector ..............................................1-11
1.6.2 Data Acquisition ...................................................1-13
1.6.3 Peak Detection ....................................................1-14
1.6.4 Basic Analysis Computations .........................................1-16
1.7 GLOSSARY ...................................................... 1-19
2.0 EQUIPMENT DESCRIPTION .......................................2-1
2.1 SAMPLING SYSTEM ..............................................2-2
2.1.1 Sampling Point Location ..............................................2-2
2.1.2 Sample Volume and Flow Rate.........................................2-2
2.1.3 Sample Conditioning .................................................2-3
2.1.4 Contamination Precautions ............................................2-3
2.1.5 Valving ............... ............ ............ ......... ..........2-4
2.1.6 Calibration Gas .....................................................2-4
TABLE OF CONTENTS
iii

SEP 2005 MODEL 1000
2.2 ANALYZER ...................................................... 2-5
2.2.1 Physical Description .................................................2-5
2.2.2 Chromatograph Valves ...............................................2-7
2.2.2.1 Primary Plate ....................................................2-8
2.2.2.2 Actuating Subassemblies ...........................................2-8
2.2.2.3 Operation ............ ......... ............ ............ ......... . 2-8
2.2.3 Detector Subsystem ..................................................2-8
2.2.4 Analyzer Preamplifier Unit ............................................2-8
2.2.5 Analyzer Specifications ..............................................2-9
2.2.6 Utility Gas Requirements ............................................2-10
2.3 CONTROLLER ..................................................2-10
2.3.1 Controller Hardware Configurations . . . . . . . . . . . . . . . . . . . . . . . . . . . . . . . . . . . . 2-11
2.3.1.1 Analog Inputs and Outputs .........................................2-12
2.3.1.2 Digital Inputs and Outputs .........................................2-13
2.3.1.3 Communications........................ ............... ..........2-13
2.3.1.4 Driver Outputs ..................................................2-14
2.3.1.5 General Controller Specifications . . . . . . . . . . . . . . . . . . . . . . . . . . . . . . . . . . . 2-14
2.3.1.6 Electrical / Mechanical Safety and Integrity -
Certifications and Classifications: ...................................2-15
2.3.1.7 GC Controller Circuit Board List ....................................2-16
2.3.2 Optional Keyboard and Display .......................................2-21
2.3.2.1 Key Pad .......................................................2-21
2.3.2.2 Display ......... ............... ............... ............... .. 2-21
2.3.3 Alarm Specifications ................................................2-21
2.3.3.1 Status Indicators .................................................2-22
3.0 INSTALLATION AND SETUP .......................................3-1
3.1 PRECAUTIONS AND WARNINGS ...................................3-4
3.1.1 Hazardous Environments .............................................3-4
3.1.2 Power Source Wiring ................................................3-6
3.1.3 Signal Wiring ...................................................... 3-7
3.1.4 Electrical and Signal Ground ..........................................3-9
3.1.5 Electrical Conduit ..................................................3-11
3.1.6 Sample Systems Requirements ........................................3-13
iv
TABLE OF CONTENTS

MODEL 1000 SEP 2005
3.2 PREPARATION .................................................. 3-14
3 . 2 . 1 I n t r o d u c t io n ....................................................... 3-14
3.2.2 Site Selection ......................................................3-14
3.2.3 Unpacking the Unit .................................................3-15
3.2.4 Necessary Tools and Components .....................................3-16
3.2.5 Optional Tools and Components .......................................3-18
3.3 INSTALLING THE ANALYZER ....................................3-20
3.3.1 Point-to-Point Wiring Guide, Analyzer-Controller . . . . . . . . . . . . . . . . . . . . . . . . . 3-20
3.3.2 Analyzer AC-Power Wiring ..........................................3-27
3.3.3 Sample and Gas Lines ...............................................3-29
3.4 INSTALLING THE GC CONTROLLER .............................3-32
3.4.1 Modbus Slave Address (COM ID) Setup . . . . . . . . . . . . . . . . . . . . . . . . . . . . . . . . 3-32
3.4.2 Controller-Analyzer Wiring ..........................................3-36
3.4.3 Controller-PC Wiring (Serial Connections) . . . . . . . . . . . . . . . . . . . . . . . . . . . . . . 3-38
3.4.3.1 Before Connecting ...............................................3-38
3.4.3.2 PC-to-GC, Front Panel Quick and Easy RS-232 . . . . . . . . . . . . . . . . . . . . . . . . 3-41
3.4.3.3 PC-to-GC, Permanent Cable Connection for Short Distance RS-232 . . . . . . . . 3-42
3.4.3.4 PC-to-GC, Long Distance with RS-422 or RS-485 . . . . . . . . . . . . . . . . . . . . . . 3-44
3.4.4 CPU and COM4A Serial Communications Setups . . . . . . . . . . . . . . . . . . . . . . . . . 3-46
3.4.4.1 CPU RS-232/RS-422/RS-485 Configurations . . . . . . . . . . . . . . . . . . . . . . . . . . 3-50
3.4.4.2 CPU RS-232 Configuration ........................................3-51
3.4.4.3 CPU RS-422 Configuration ........................................3-53
3.4.4.4 CPU RS-485 Configuration ........................................3-57
3.4.4.5 CPU COM1/COM2, Keyboard and Printer Output Header . . . . . . . . . . . . . . . . 3-59
3.4.4.6 CPU COM3/COM4 Output Header ..................................3-59
3.4.4.7 COM4A RS-232/RS-422/RS-485 Configuration . . . . . . . . . . . . . . . . . . . . . . . . 3-60
3.4.4.8 COM4A RS-232 Configuration .....................................3-65
3.4.4.9 COM4A RS-422 Configuration .....................................3-69
3.4.4.10 COM4A RS-485 Configuration .....................................3-71
3.4.4.11 Parallel Printer Interface ...........................................3-73
3.4.4.12 P/C104 Bus Interface .............................................3-74
3.4.4.13 Silicon Disk Configuration.........................................3-75
3.4.4.14 Multi-I/O Connector ..............................................3-77
3.4.4.15 Parallel I/O Configuration .........................................3-78
3.4.5 Controller-Printer Wiring ............................................3-81
3.4.6 Discrete (Digital) I/O Wiring .........................................3-83
3.4.7 Analog I/O Wiring ................................................. 3-86
TABLE OF CONTENTS
v

SEP 2005 MODEL 1000
3.4.8 Controller AC-Power Wiring .........................................3-88
3.5 ANALYZER LEAK CHECKS AND
PURGING FOR FIRST CALIBRATION .............................3-90
3.5.1 Analyzer Leak Checks ..............................................3-91
3.5.2 Purging Carrier Gas Lines ............................................3-94
3.5.3 Purging Calibration Gas Lines ........................................3-98
3.6 SYSTEM START-UP ..............................................3-96
4.0 OPERATION FROM LOCAL KEYBOARD AND DISPLAY . . . . . . . . . . . . . 4-1
4.1 INTERFACE COMPONENTS
FOR LOCAL DATA DISPLAY AND ENTRY ..........................4-3
4.1.1 Light Emitting Diode (LED) Indicators . . . . . . . . . . . . . . . . . . . . . . . . . . . . . . . . . . 4-3
4.1.2 Liquid Crystal Display (LCD) .........................................4-4
4.1.3 Keypad .............................. ............ ......... ........4-4
4.2 LOGGING ON TO VIEW OR EDIT DATA ............................4-7
4.2.1 First Time Log-On ..................................................4-7
4.2.2 Subsequent Log-On..................................................4-8
4.2.3 Start / Halt an Auto Sequence Analysis . . . . . . . . . . . . . . . . . . . . . . . . . . . . . . . . . . 4-9
4.2.4 Editing Procedures .................................................4-11
4.2.5 Validity Checks of Data Entries .......................................4-13
4.3 LOCAL DISPLAY MENUS .........................................4-14
4.3.1 Main Menu .......................................................4-15
4.3.2 Hardware Menu....................................................4-15
4.3.3 Operator Entries Menu ..............................................4-16
4.3.4 Alarms Menu......................................................4-16
4.3.5 Chromatogram Menu ...............................................4-17
4.3.6 GC Control Menu ..................................................4-17
4.3.7 Data Records Menu .................................................4-18
4.3.8 Config Rpt - Maint. Log Menu ........................................4-18
vi
TABLE OF CONTENTS

MODEL 1000 SEP 2005
5.0 MAINTENANCE .................................................. 5-1
5.1 TROUBLESHOOTING AND REPAIR CONCEPT ......................5-3
5.2 ROUTINE MAINTENANCE .........................................5-3
5.2.1 GC System Maintenance Checklist ......................................5-4
5.2.2 Routine Maintenance Procedures .......................................5-5
5.2.3 Contract Service ....................................................5-5
5.3 LOCATING AND GAINING ACCESS TO EQUIPMENT ELEMENTS ....5-6
5.3.1 Analyzer Electrical/Electronic Units . . . . . . . . . . . . . . . . . . . . . . . . . . . . . . . . . . . . . 5-6
5.3.2 Detector Elements, Heater Elements, Valves and Columns . . . . . . . . . . . . . . . . . . . 5-7
5.4 PRECAUTIONS FOR HANDLING PRINTED CIRCUIT ASSEMBLIES ...5-8
5.5 SERVICE, TROUBLESHOOTING, AND REPAIR INSTRUCTIONS ......5-9
5.5.1 Preamplifier .............................. ........................ . 5-11
5.5.2 Temperature Control ................................................5-11
5.5.3 Decoder .............................. ............... .............5-11
5.5.3.1 Fuse Replacement................................................5-11
5.5.3.2 Instructions for Removing the Decoder Board . . . . . . . . . . . . . . . . . . . . . . . . . . 5-11
5.5.3.3 Instructions for Reinstalling the Decoder Board . . . . . . . . . . . . . . . . . . . . . . . . 5-13
5.5.4 Analyzer Troubleshooting Guide ......................................5-14
5.5.4.1 Flow Balance Check..............................................5-14
5.5.4.2 Temperature ......... ............... ............... .............5-14
5.5.4.3 Baseline Drift ...................................................5-15
5.5.4.4 Leak-Checking the Analyzer .......................................5-18
5.5.4.5 Plugged Lines, Columns, or Valves . . . . . . . . . . . . . . . . . . . . . . . . . . . . . . . . . . 5-24
5.5.5 Chromatograph Valves ..............................................5-25
5.5.5.1 Valve Cleaning ..................................................5-25
5.5.5.2 Valve Overhaul..................................................5-25
5.5.5.3 Valve Overhaul Instructions ........................................5-25
5.5.6 Detector Bridge Balance .............................................5-26
5.5.7 Temperature Measurements ..........................................5-27
5.5.8 Measure Vent Flow (MV) ............................................5-29
5.5.9 Analog Inputs .....................................................5-29
TABLE OF CONTENTS
vii

SEP 2005 MODEL 1000
5.6 GC CONTROLLER MAINTENANCE ...............................5-31
5.6.1 GC Controller Access ...............................................5-31
5.7 COMMUNICATIONS .............................................5-33
5.7.1 GC Controller Address Change .......................................5-34
5.8 ANALOG INPUTS AND OUTPUTS .................................5-34
5.8.1 Analog Output Dialog Description .....................................5-35
5.8.2 Changing a Variable ................................................5-37
5.8.3 Changing the Bargraph ..............................................5-38
5.8.4 Performing an Manual Calibration .....................................5-40
5.8.5 Performing an Automated Calibration . . . . . . . . . . . . . . . . . . . . . . . . . . . . . . . . . . 5-42
5.8.6 Analog Loopback Test Circuits .......................................5-44
5.8.7 Upgrading Analog Outputs ...........................................5-46
5.9 DISCRETE (DIGITAL) INPUTS AND OUTPUTS .....................5-47
5.9.1 Digital Loopback Test Circuit .........................................5-47
5.10 FUSE PROTECTION ..............................................5-48
5.11 ANALYZER-CONTROLLER INTERCONNECT ......................5-49
5.11.1 Function Codes ....................................................5-51
6.0 RECOMMENDED SPARE PARTS ...................................6-1
6.1 ANALYZER SPARES ..............................................6-1
6.1.1 Printed Circuit Card Assemblies (Analyzer) . . . . . . . . . . . . . . . . . . . . . . . . . . . . . . . 6-1
6.1.2 Electrical and Mechanical Assemblies (Analyzer) . . . . . . . . . . . . . . . . . . . . . . . . . . 6-2
6.2 GC CONTROLLER SPARES ........................................6-3
6.2.1 Printed Circuit Card Assemblies (GC Controller) . . . . . . . . . . . . . . . . . . . . . . . . . . 6-3
6.2.2 Electrical and Mechanical Components (GC Controller) . . . . . . . . . . . . . . . . . . . . . 6-4
viii
TABLE OF CONTENTS

MODEL 1000 SEP 2005
APPENDICES
Appendix Page
A SUPPLEMENTAL WIRING GUIDE - SERIAL COMMUNICATIONS .... A-1
A.1 GC Serial Port and Cable Configurations for RS-232 . . . . . . . . . . . . . . . . . . . . . . A-2
A.2 RS-232 Connection from GC Controller to PC . . . . . . . . . . . . . . . . . . . . . . . . . . . A-4
A.2.1 DB-9 Serial Port of GC to DB-9 Port of PC . . . . . . . . . . . . . . . . . . . . . . . . . . . A-4
A.2.2 DB-9 Serial Port of GC to DB-25 Port of PC . . . . . . . . . . . . . . . . . . . . . . . . . . A-5
A.2.3 Phoenix Plug Port of GC to DB-9 Port of PC . . . . . . . . . . . . . . . . . . . . . . . . . . A-6
A.2.4 Phoenix Plug Port of GC to DB-25 Port of PC . . . . . . . . . . . . . . . . . . . . . . . . . A-7
A.3 RS-232 Connection from GC Controller to External Modem . . . . . . . . . . . . . . . . A-8
A.3.1 DB-9 Serial Port of GC to DB-25 Port of Modem . . . . . . . . . . . . . . . . . . . . . . . A-8
A.3.2 Phoenix Plug Port of GC to DB-25 Port of Modem . . . . . . . . . . . . . . . . . . . . . . A-9
A.4 Example RS-422 Connection from PC to GC . . . . . . . . . . . . . . . . . . . . . . . . . . . . A-10
A.5 Example RS-485 Connection from PC to GC . . . . . . . . . . . . . . . . . . . . . . . . . . . . A-12
B MANIFOLD FOR TWO CARRIER GAS BOTTLES TO GC SYSTEM .... B-1
B.1 Illustration ............... ........................... .............. B-2
B.2 Installation and Line Purging ......................................... B-3
B.3 Replacing Carrier Cylinder ........................................... B-4
C GUIDE TO TRANSIENT PROTECTION MODULES .................. C-1
C.1 Purpose of the Transient Protection Modules . . . . . . . . . . . . . . . . . . . . . . . . . . . . . C-1
C.2 Part Applications, Numbers, and Descriptions . . . . . . . . . . . . . . . . . . . . . . . . . . . . C-2
C.3 Troubleshooting Transient Protection Modules . . . . . . . . . . . . . . . . . . . . . . . . . . . C-4
D INTERNAL MODEM FOR GC CONTROLLER ....................... D-1
E SETTING SOLENOID PURGE FLOWS .............................. E-1
F 2350 TO 2350A CPU RETROFIT INSTRUCTIONS . . . . . . . . . . . . . . . . . . . . F-1
F.1 2350A CPU Assembly Introduction .....................................F-1
F.2 Conversion Process ..................................................F-2
F.3 Basic 2350A Configuration............................................F-9
F.4 2350A Options ....................................................F-11
F.5 To Add a Modem ..................................................F-14
F.6 To Add an Ethernet Card ............................................F-17
TABLE OF CONTENTS
ix

SEP 2005 MODEL 1000
ADDENDA
Addendum Page
1 ANALYZER DRAWINGS ................................. Addendum 1-1
2 GC CONTROLLER DRAWINGS .......................... Addendum 2-1
x
TABLE OF CONTENTS

MODEL 1000 SEP 2005
1.0 DESCRIPTION
1.1 PURPOSE OF THIS MANUAL
The Emerson Process M anagement Model 1000 Gas Chromatograph System Hardware Reference
Manual (P/N 3-9000-541) is intended as a user's guide to accompany the MODEL 1000 GAS
CHROMATOGRAPH SYSTEM.
For software operation instructions, see the MON2000 Software for Gas Chromatographs
User Manual (P/N 3-9000-522).
This manual provides the following information:
Section 1 Description
- A general description of the Model 1000 Gas Chromatograph (GC) System and its
components, their configurations and functions.
- A brief description of the GC System's software, user interfaces, and capabilities.
- Introduction to GC theory of operation and terminology.
Section 2 Equipment Description
- Guidelines for sampling system and gas connections.
- Descriptions of Analyzer subsystems and components.
- Descriptions of GC Controller subsystems and components.
Section 3 Installation and Startup
- Instructions for installing the GC System hardware.
DESCRIPTION
1-1

SEP 2005 MODEL 1000
Section 4 Operation
- Instructions for operating the GC System by means of its built-in keyboard and liquid crystal
display (LCD), if provided.
Section 5 Maintenance
- Instructions for regular maintenance and care of the GC System hardware.
- Instructions for troubleshooting, repair, and service of the GC System hardware.
Section 6 Recommended Spare Parts
- List of boards, valves, and other components suggested as spare parts.
Appendices
- Appendices with additional, helpful reference materials and drawings.
1-2
DESCRIPTION

MODEL 1000 SEP 2005
1.2 INTRODUCTION
The Emerson Process Management Model 1000 Gas Chromatograph is a high-speed GC system that
is factory engineered to meet specific field application requirements based on stream composition
and the anticipated concentration of the components of interest. The GC System typically consists
of three major components, the Analyzer Assembly, the GC Controller, and the Sample Conditioning
System:
Analyzer Assembly (Model 1000 Series) - Located near the sample tap in a freeze-protected
shelter. The Analyzer includes GC columns, detectors, preamplifier, stream switching
valves, and solenoids.
GC Controller - Located either integrally in the upper enclosure or made for mounting on a
standard 19-inch rack in a nonhazardous protected area, with or without a built-in keyboard
and LCD. The GC Controller includes electronics and ports for signal processing, instrument
control, data storage, personal computer (PC) interface, and telecommunications.
Rack Mount - Suitable for use in a nonhazardous environment.
Sample Conditioning System (SCS) - Located between the process stream and the Analyzer
sample inlet, usually mounted on the lower portion of the Analyzer stand. The standard
configuration SCS includes a mounting plate, block (or shutoff) valves, and filters.
Optionally, the SCS can be configured with Genie bypass filters, liquid shut-off valves, and
®
optional solenoids for stream switching; all of which can be enclosed in an electric (heat tape
design) oven.
DESCRIPTION
1-3

SEP 2005 MODEL 1000
In its standard configuration, the Model 1000 series Analyzer can handle up to five streams:
typically, four for sample and one for calibration. With an optional stream switch assembly added,
the GC System can switch up to twelve streams, maximum.
The GC Controller, is designed to be operated primarily from a personal computer (PC) running the
MON2000 software package. This provides the user with the greatest capability, ease-of-use, and
flexibility. One PC running MON2000 can connect with up to 32 chromatographs (via RS-485 serial
communications links). The PC is used to display analysis chromatograms and reports, which can
then be stored to files on the PC hard drive, or printed from either the PC's printer port or the GC
Controller's printer port.
Also, each individual GC Controller can be operated from its built-in keyboard and LCD (if installed
in that configuration); however, this method offers more limited functions. Display of the
chromatograms on the LCD is accomplished in scrolling strip chart fashion.
Since neither the PC nor a normal printer can be placed in a hazardous area, serial port and Modbus
communications links are provided for connecting the GC System to the PC, other computers,
printers, chromatographs, and Controllers.
1-4
DESCRIPTION

MODEL 1000 SEP 2005
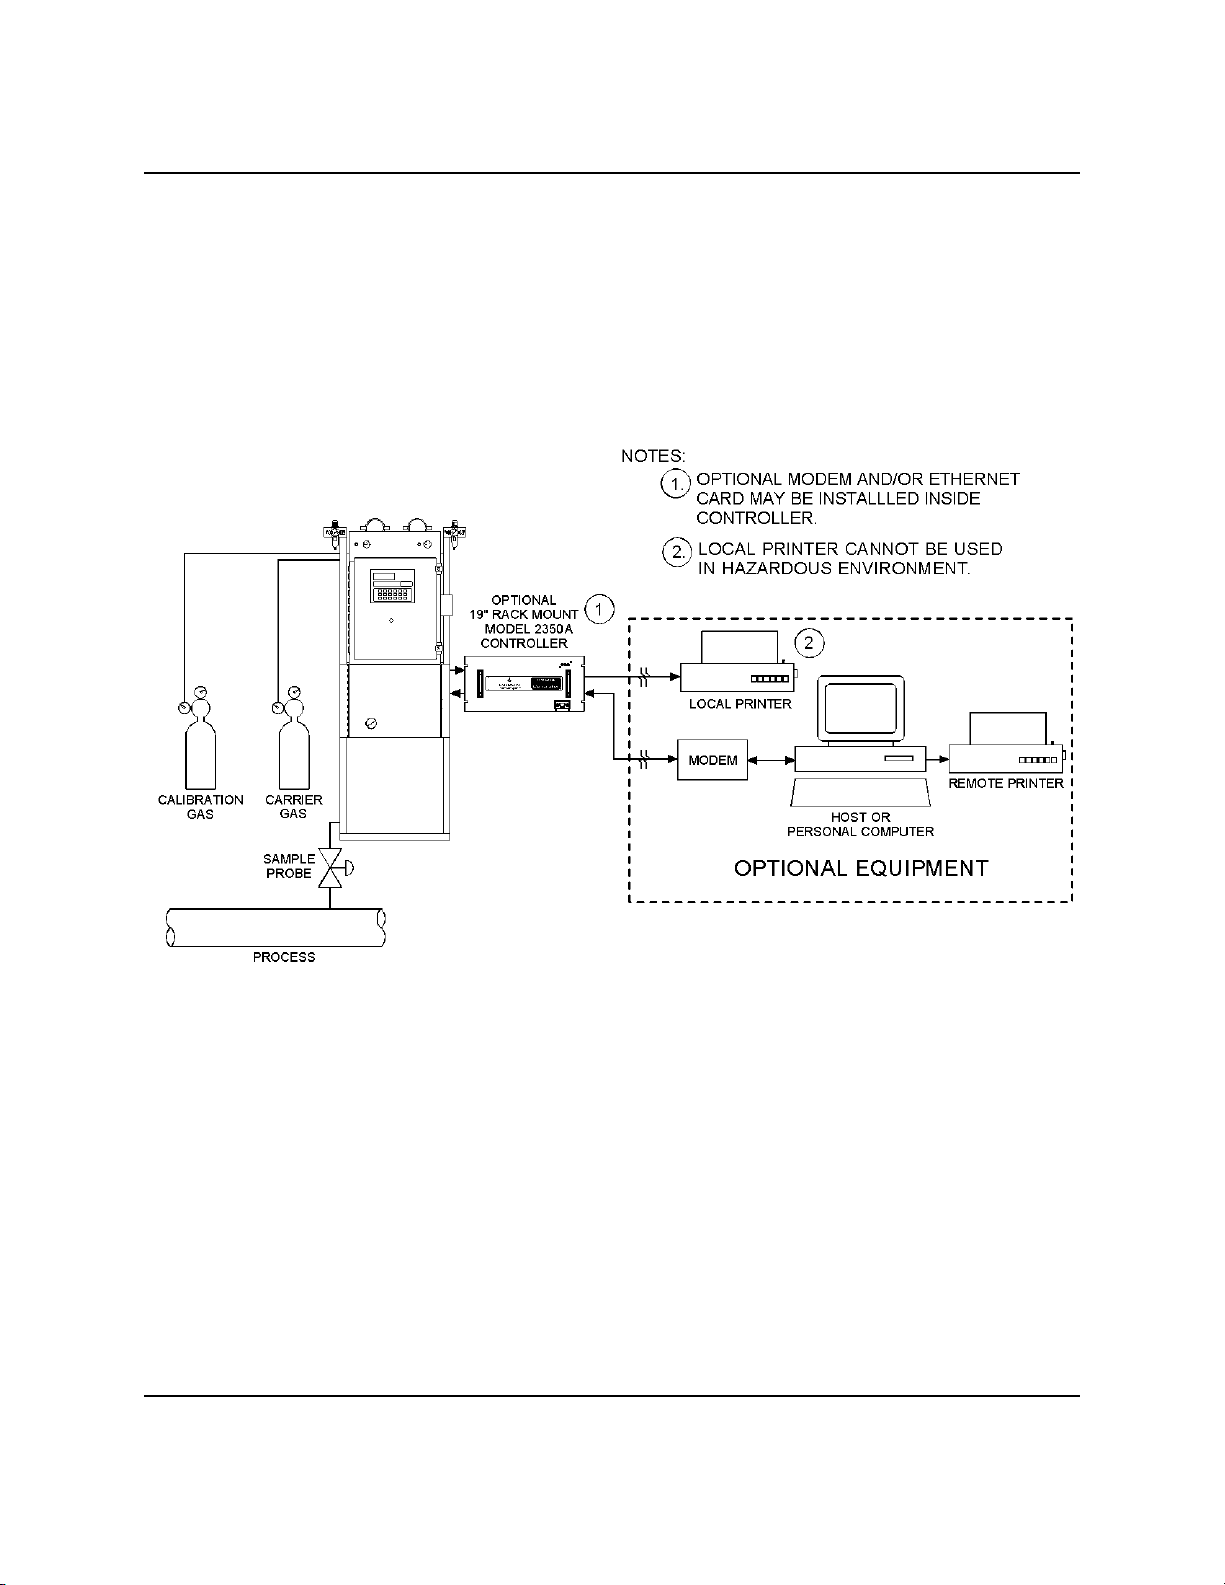
1.3 FUNCTIONAL DESCRIPTION
A functional block diagram of a typical GC System installation is shown in Figure 1-1. A sample
of the gas to be analyzed is taken from the process stream by a sample probe installed in the process
line. The sample passes through a sample line to the sample conditioning system where it is filtered
or otherwise conditioned. After conditioning, the sample flows to the Analyzer for separation and
detection of the components of the gas.
The chromatographic separation of the sample gas into its components is accomplished in the
Analyzer in the following manner. A precise volume of sample gas is injected into one of the unit's
analytical columns. The column contains a stationary phase (packing) that is either an active solid
(adsorption partitioning) or an inert solid support that is coated with a liquid phase (absorption
partitioning). The gas sample is moved through the column by means of a mobile phase (carrier
gas). Selective retardation of the components of the sample takes place in the column that causes
each component to move through the column at a different rate. This action separates the sample
into its constituent components.
A detector located at the outlet of the analytical column senses the elution of components from the
column and produces electrical outputs proportional to the concentration of each component.
Outputs from the Analyzer detectors are amplified in the Analyzer electronics, then transmitted to
the GC Controller for further processing. (See also, Section 1.6, "Theory of Operation.")
Output from the GC Controller is normally displayed on a remotely located personal computer (PC)
or a printer. Connection between the GC Controller and the PC can be accomplished via a direct
serial line or via the Modbus-compatible communication interface.
Multiple chromatograms may be displayed on the PC monitor, and compared or contrasted with
separate color schemes. This allows a stored chromatogram to be compared/contrasted with a
current or another stored chromatogram. This could be of great assistance when changing
parameters or isolating a problem.
Use of a PC for configuration and troubleshooting procedures is essential in most instances. (Basic
operations can also be performed from a keyboard and liquid crystal display that are built into certain
versions of the GC Controller.) The PC may be remotely connected via telephone, radio or satellite
communications. Once installed and configured, the GC System can operate independently for long
periods of time.
DESCRIPTION
1-5
SEP 2005 MODEL 1000
1-6
Figure 1-1. GC System Functional Block Diagram
DESCRIPTION

MODEL 1000 SEP 2005
1.4 MINIMUM PC REQUIREMENTS
To achieve maximum performance when running the MON2000 software, ensure your PC system
contains the following hardware and software equipment.
• PC with a 486/90 MHz or higher processor (Pentium/100MHz or higher recommended)
running:
- Windows® 95 (service pack 1 or better) or later
If running Windows® 95 with the optional Ethernet card, the user must download Socket 2
from www.microsoft.com/windows95/downloads to utilize MON2000’s Ethernet feature.
- Windows® 98 version 1 or later
- Windows® 2000 version 1 or later
- Windows® XP version 1 or later (see note for system requirements)
- Windows® NT version 4 (service pack 3 or later)
• 16 megabytes (MB) of RAM (32 MB or higher recommended)
• 5 MB of free hard disk space
• Super VGA monitor with 800x600 resolution
• Free serial port for remote/local connection to gas chromatograph (for online operations)
• Free parallel port for connection to printer
• Windows®-compatible modem (for remote connection only)
DESCRIPTION
1-7
SEP 2005 MODEL 1000
Microsoft Internet Explorer 5.0 is required to view spreadsheets or reports saved in HTML
format.
• Use the Settings>Control Panel>System>General Page menu path to check the system
version number.
- For Windows® 95, the version number should be 4.00.950A/B or later.
- For Windows® 98 or Windows® 2000, the version number should be 1 or later.
- To use Windows® XP you need, Computer/Processor PC with 300 MHz or higher
processor clock speed recommended; 233 MHz minimum required (single or dual
processor system);* Intel Pentium /Celeron® family, or AMD K6®/Athlon™/
®®
Duron™ family, or compatible processor recommended.
- Memory 128 MB of RAM or higher recommended (64 MB minimum supported; may
limit performance and some features)
- Hard Disk Minimum: 1.5 GB of available hard disk space
- For Windows NT4, the version number should be 4.00.1381 or later.
1-8
DESCRIPTION

MODEL 1000 SEP 2005
1.5 MODES OF OPERATION
1.5.1 User Interfaces
You have at least one, and optionally two, user interfaces from which to operate the gas
chromatograph (GC) system:
PC connected to the GC and running MON2000 - The PC connected to the GC and running the
MON2000 offers the greatest amount of capability and flexibility.
Find complete user instructions for MON2000 in the program’s online HELP screens and in
the program user’s manual, MON2000 Software for Gas Chromatographs User Manual (P/N
3-9000 -522).
or
The GC Controller’s built-in keyboard and LCD - The GC Controller’s optional built-in
keyboard and LCD offer essential startup and operation functions. They are useful in a
hazardous environment or if no PC is available.
See Section 4, this manual, for details on how to use the GC Controller’s built-in keyboard
and LCD for startup and routine operations in a hazardous environment.
DESCRIPTION
1-9

SEP 2005 MODEL 1000
1.5.2 Capabilities
Individual gas chromatograph Controller functions that can be initiated or controlled by the GC
System and its software, MON2000, include (but are not limited to) the following:
valve activations
timing adjustments
stream sequences
heater controls (when applicable)
calibrations
baseline runs
analyses
halt operation
stream/calculation assignments
diagnostics
alarm and event processing
event sequence changes
component table adjustments
calculation adjustments
alarm parameters adjustments
analog scale adjustments
stream/detector assignments
stream/component table assignments
Reports and logs that can be produced, depending upon the GC Application in use, include (but are
not limited to) the following:
configuration report
parameter list
analysis chromatogram
alarm log (unacknowledged and active)
event log
analysis raw data
chromatogram comparison
1-10
DESCRIPTION
MODEL 1000 SEP 2005
1.6 THEORY OF OPERATION
See Section 1.7, the “Glossary” section of this manual, for definitions of some of the
terminology used in the following explanations.
1.6.1 Analyzer Detector
The Analyzer detector subsystem is a thermal conductivity detector that consists of a balanced
bridge network with heat-sensitive thermistors in each leg of the bridge. Each thermistor is enclosed
in a separate chamber of the detector block. One thermistor is designated the reference element and
the other the measurement element. A schematic diagram of the thermal conductivity detector is
shown in Figure 1-2.
DESCRIPTION
Figure 1-2. Schematic Diagram of Analyzer Detector Bridge
1-11

SEP 2005 MODEL 1000
In the quiescent condition (prior to injecting a sample), both legs of the bridge are exposed to pure
carrier gas. In this condition, the bridge is balanced and the bridge output is electrically nulled. (The
bridge can be balanced by the fine and coarse adjustment potentiometers located on the preamplifier
circuit board.)
The analysis begins when a fixed volume of sample is injected into the column by operation of the
sample valve. The sample is moved through the column by the continuous flow of carrier gas. As
successive components elute from the column, the temperature of the measurement element changes.
The temperature change unbalances the bridge and produces an electrical output proportional to the
component concentration. The differential signal developed between the two thermistors is amplified
by the preamplifier.
Figure 1-3 illustrates the change in detector electrical output during elution of a component.
Figure 1-3. Detector output during component elution
1. Detector bridge balanced.
2. First component begins to elute from column and to be sensed by the measurement
thermistor.
3. Peak concentration of first component.
4. Second component begins to elute from column and to be sensed by the measurement
thermistor.
5. Peak concentration of second component.
In addition to amplifying the differential signal developed between the detector's two thermistors,
the preamplifier also supplies drive current to the detector bridge. The preamplifier also supplies
drive current to the detector bridge. The voltage signal is converted to a 4 to 20-milliamp (mA)
current loop for transmission to the GC Controller. The signal is proportional to the concentration
of a component detected in the gas sample. The preamplifier provides four different gain channels
as well as compensation for baseline drift. The signals from the preamplifier are sent to the GC
Controller for computation, recording on a printer, or viewing on a PC monitor or LCD.
1-12
DESCRIPTION

MODEL 1000 SEP 2005
1.6.2. Data Acquisition
Every second, exactly 40 equi-spaced data samples are taken for analysis by the GC Controller (i.e.,
once every 25 milliseconds). Each data sample, after having been precision-amplified, is subjected
to a twelve bit analog to digital (A/D) conversion. The sampling frequency of 40 Hertz (Hz) was
chosen to reduce 60 Hz normal mode noise.
After each point on the chromatograph signal is sampled, the resulting number is stored in a buffer
area in the GC Controller’s memory for processing. During the analysis, only the last 256 data
points are available for processing. Because the data analysis is done as the signal is sampled (in
real-time), only a limited number of past data samples is required to analyze any signal.
As a part of the data acquisition process, groups of incoming data samples are averaged together
before the result is stored to the Controller’s memory for processing. Non-overlapping groups of N
samples are averaged and stored, and thus reduce the effective incoming data rate to 40/N
samples/second. For example, if N = 5, then a total of 40/5 or 6 (averaged) data samples are stored
every second. The value for the variable N is determined by the selection of a Peak Width parameter
(PW). The relationship is:
N = PW seconds,
where PW is given in seconds. All the various details in the analysis process are independent of the
value of N. Allowable values of N are 1 to 63, which corresponds to values of PW from 2 to 63
seconds.
The variable N is known as the integration factor. This term is used because N determines how
many points are averaged or integrated to form a single value. The integration of data upon input,
before storing, serves two purposes. First, the statistical noise on the input signal is reduced by the
square root of N. In the case of N = 4, a noise reduction of two would be realized. Secondly, the
integration factor controls the bandwidth of the chromatograph signal. It is necessary to match the
bandwidth of the input signal to that of the analysis algorithms in the GC Controller. This prevents
small, short duration perturbations from being recognized as true peaks by the program. It is
therefore important to choose a Peak Width corresponding to the narrowest peak in a group under
consideration.
DESCRIPTION
1-13

SEP 2005 MODEL 1000
1.6.3 Peak Detection
For normal area or peak height concentration evaluation, the determination of a peak's start, peak
point, and end is automatic. The manual determination of start and end points is used only for area
calculations in the Forced Integration mode. Automatic determination of peak onset or start is
initiated whenever Integrate Inhibit is turned off. Analysis is started in a region of signal quiescence
and stability, such that the signal level and activity can be considered as baseline values. It is
important that this be the case because the assumption is made by the GC Controller software.
Having initiated a peak search by turning Inhibit off, the GC Controller performs a point by point
examination of the signal slope. This is achieved by using a digital slope detection filter which is
a combination low pass filter and differentiator. The output of this detector is constantly compared
to a system constant entered by the operator called Slope Sensitivity. A default value of 8 is assumed
if no entry is made. Lower values make peak onset detection more sensitive, and higher values make
detection less sensitive. Higher values (20 to 100) would be appropriate for noisy signals, e.g. high
amplifier gain.
Peak termination is determined by the same application of this detector to the signal, but in the
reverse sense. Onset is defined where the detector output exceeds the baseline constant, but
termination is defined subsequently where the detector output is less than the same constant.
Sequences of fused peaks are also automatically handled. This is done by testing each termination
point to see if the region immediately following it satisfies the criteria of a baseline. A baseline
region must have a slope detector value less than the magnitude of the baseline constant for a number
of sequential points. When a baseline region is found, this terminates a sequence of peaks.
A zero reference line for peak height and area determination is established by extending a line from
the point of the onset of the peak sequence to the point of the termination. The values of these two
points are found by averaging the four integrated points just prior to the onset point and just after the
termination points, respectively. The zero reference line will, in general, be non-horizontal, and thus
compensates for any linear drift in the system from the time the peak sequence starts until it ends.
1-14
DESCRIPTION

MODEL 1000 SEP 2005
In a single peak situation, peak area is the area of the component peak between the curve and the
zero reference line. The peak height is the distance from the zero reference line to the maximum
point on the component curve. The value and location of the maximum point is determined from
quadratic interpolation through the three highest points at the peak of the discrete valued curve stored
in the GC Controller.
For fused peak sequences, this interpolation technique is used both for peaks as well as valleys
(minimum points). In the latter case, lines are dropped from the interpolated valley points to the zero
reference line to partition the fused peak areas into individual peaks. The use of quadratic
interpolation improves both area and height calculation accuracy and eliminates the effects of
variations in the integration factor on these calculations.
For calibration, the GC Controller may average several analyses of the calibration stream.
DESCRIPTION
1-15
SEP 2005 MODEL 1000
1.6.4 Basic Analysis Computations
Two basic analysis algorithms are included in the GC Controller. These are:
Area Analysis - Calculates area under component peak
Peak Height Analysis - Measures height of component peak
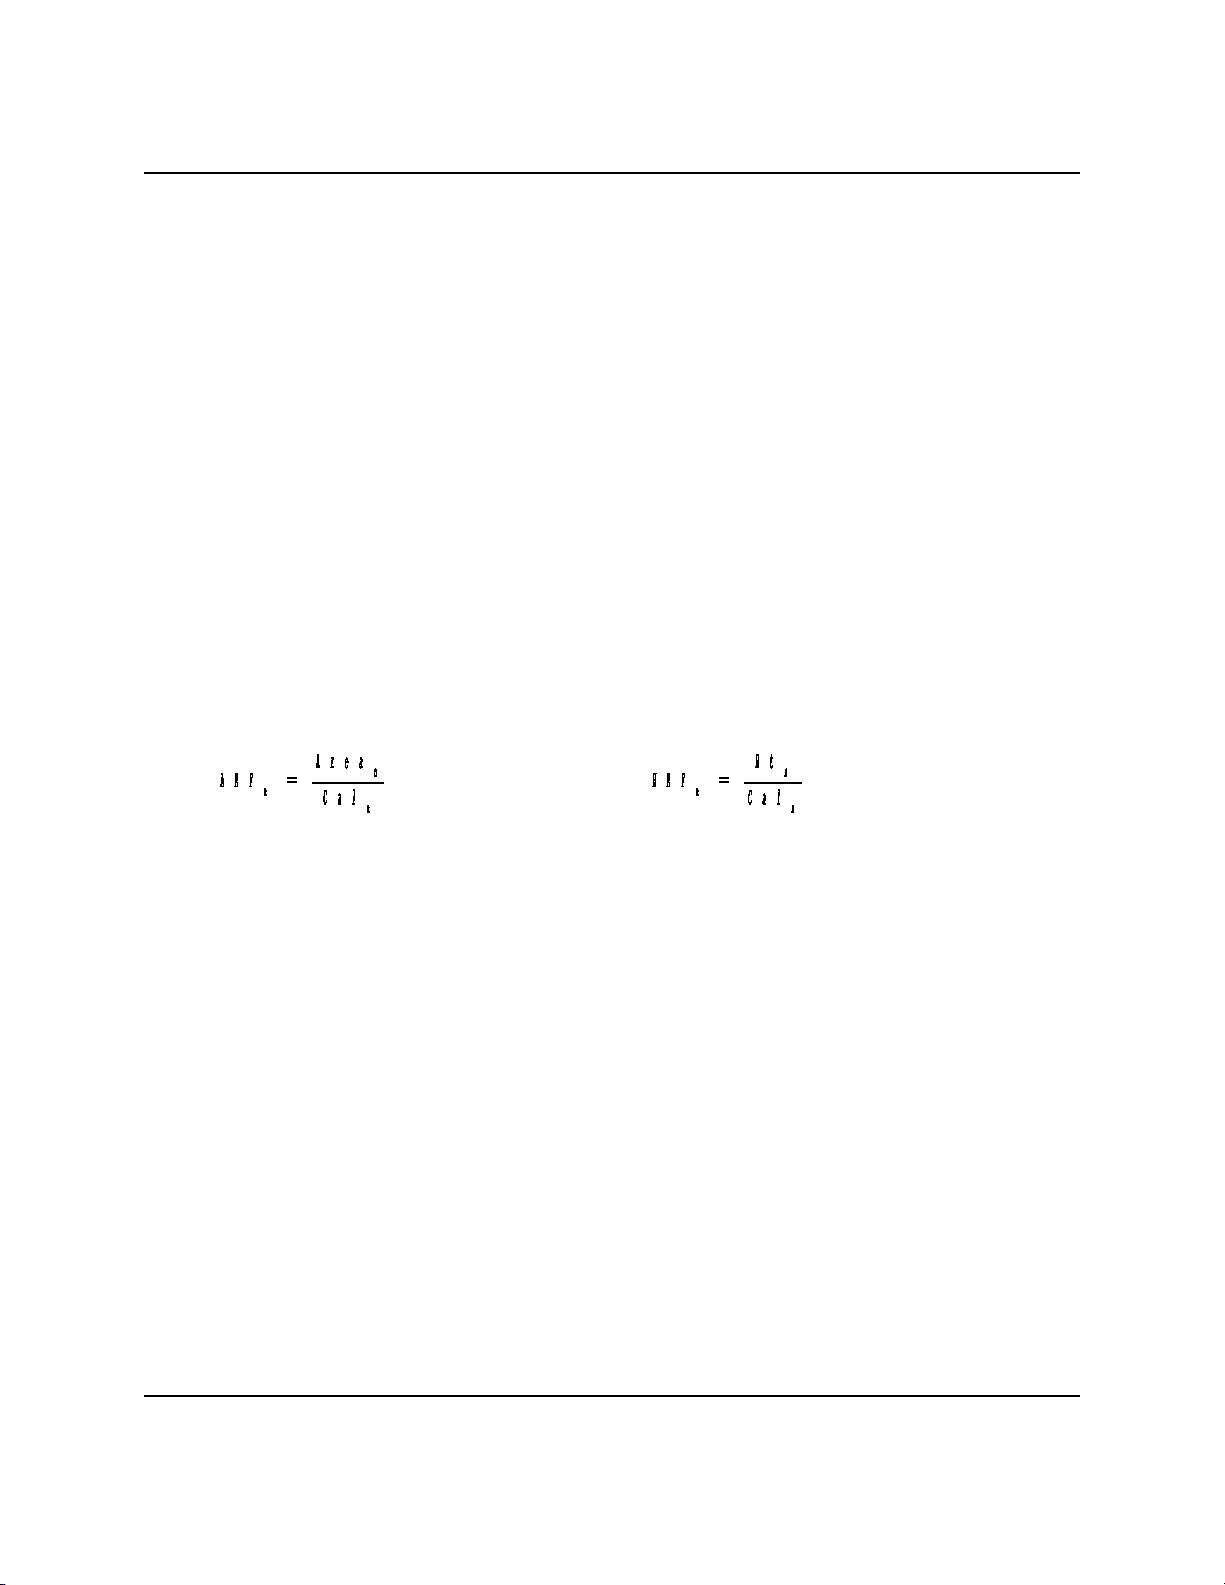
Concentration Analysis by Using Response Factor
Concentration calculations require a unique response factor for each component in an analysis.
These response factors may be manually entered by an operator or determined automatically by the
system through calibration procedures (with a calibration gas mixture that has known
concentrations).
Response factor calculation: (using the external standard)
or
Where:
ARF = Area response factor for component “n” in area per mole percent (%)
n
HRF = Height response factor for component “n”
n
Area = Area associated with component “n” in calibration gas
n
Ht = Height associated with component “n” in mole % in calibration gas
n
Cal = Amount of component “n” in mole % in calibration gas
n
Calculated response factors are stored by the GC Controller for use in the concentration calculations,
and are printed out in the configuration and calibration reports.
1-16
DESCRIPTION
MODEL 1000 SEP 2005
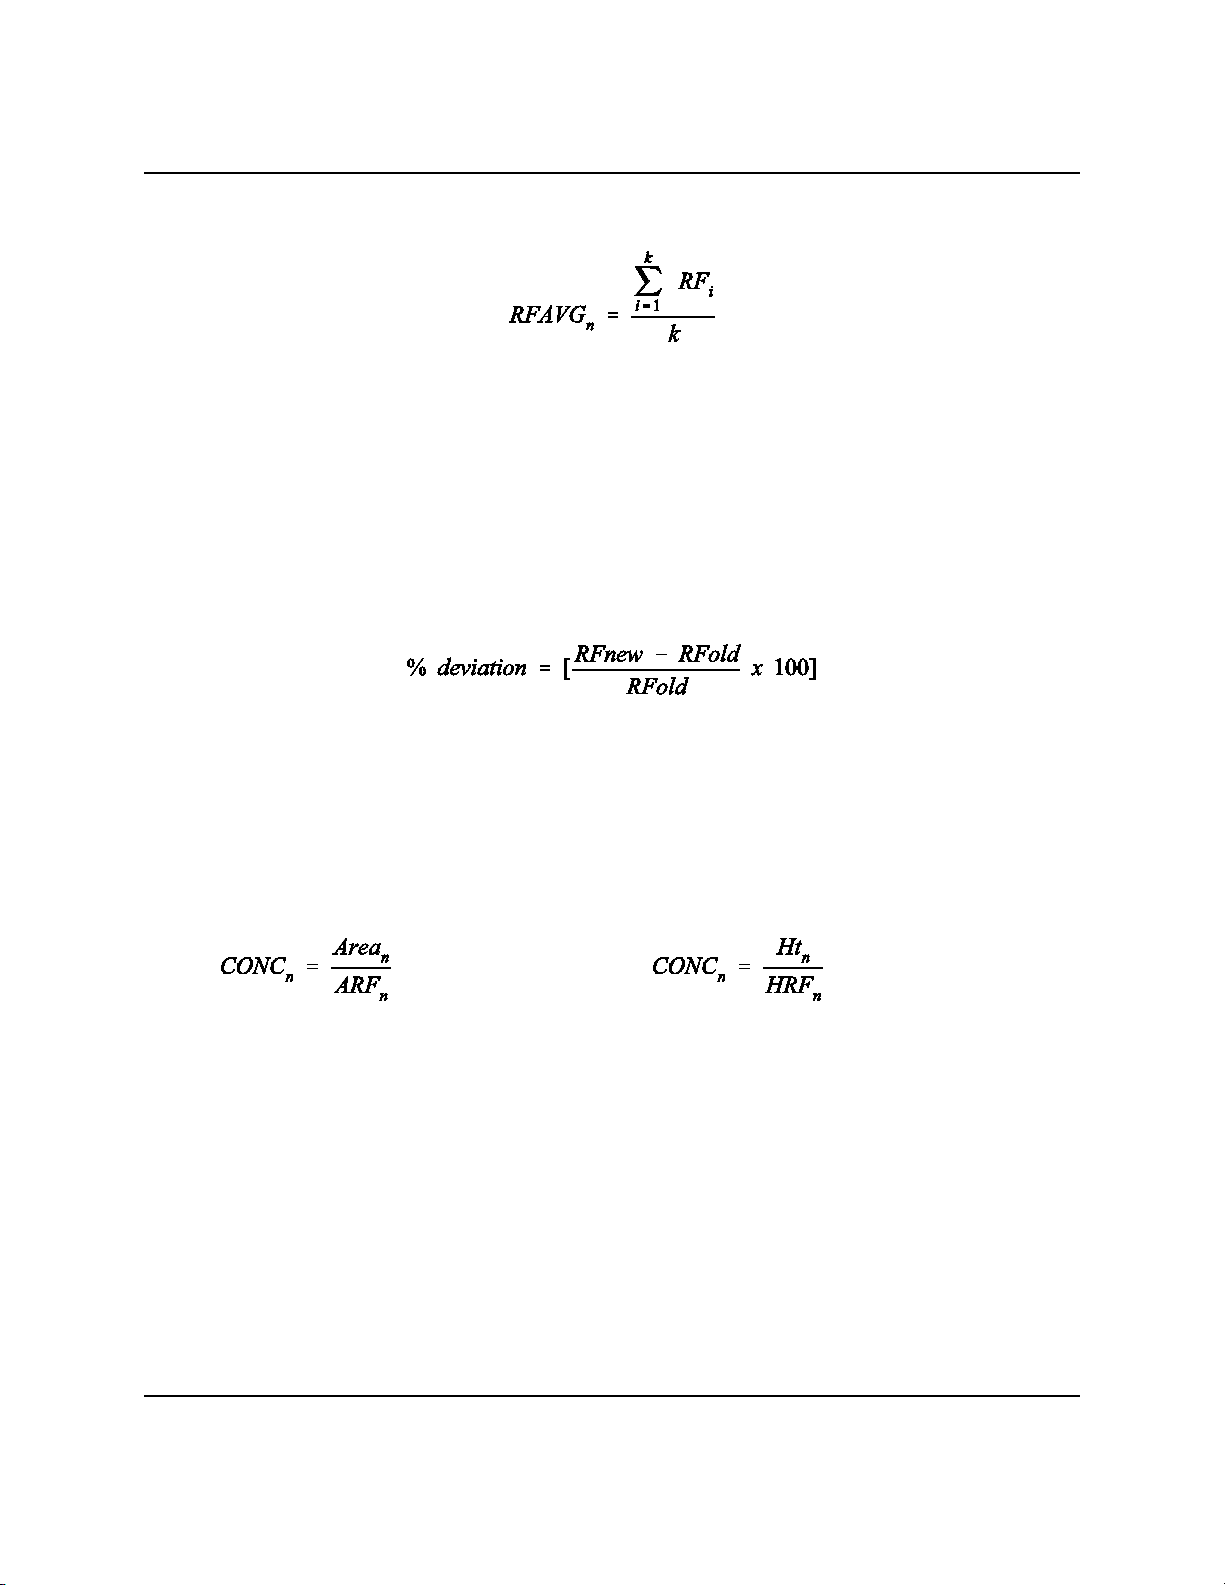
Average response factor is calculated as follows:
Where:
RFAVG = Area or height average response factor for component “n”
Rf = Area or height response factor for component “n” from the calibration
n
i
run
k = Number of calibration runs actually used to calculate the response
factors
The percent deviation of new RF averages from old RF average is calculated in the following
manner:
Where the absolute value of % deviation for alarm has been previously entered by the operator.
Concentration Calculations in Mole % without Normalization
Once response factors have been determined by the GC Controller or entered by the operator,
component concentrations are determined for each analysis by using the following equations:
or
Where:
CONC = Concentration of component “n” in mole %
Area = Area of component “n” in unknown sample
ARF = Response factor of component “n” calculated from area of calibration
n
n
n
sample. Units are area per mole %.
Ht = Peak height of component “n” in unknown sample
n
HRF = Response factor of component “n” calculated from peak height of
n
calibration sample. Units are height per mole %.
DESCRIPTION
1-17
SEP 2005 MODEL 1000
Note that the average concentration of each component will also be calculated when data averaging
is requested.
Component concentrations may be input through analog inputs 1 - 4 or may be fixed. If a fixed
value is used, the calibration for that component is the mole % that will be used for all analyses.
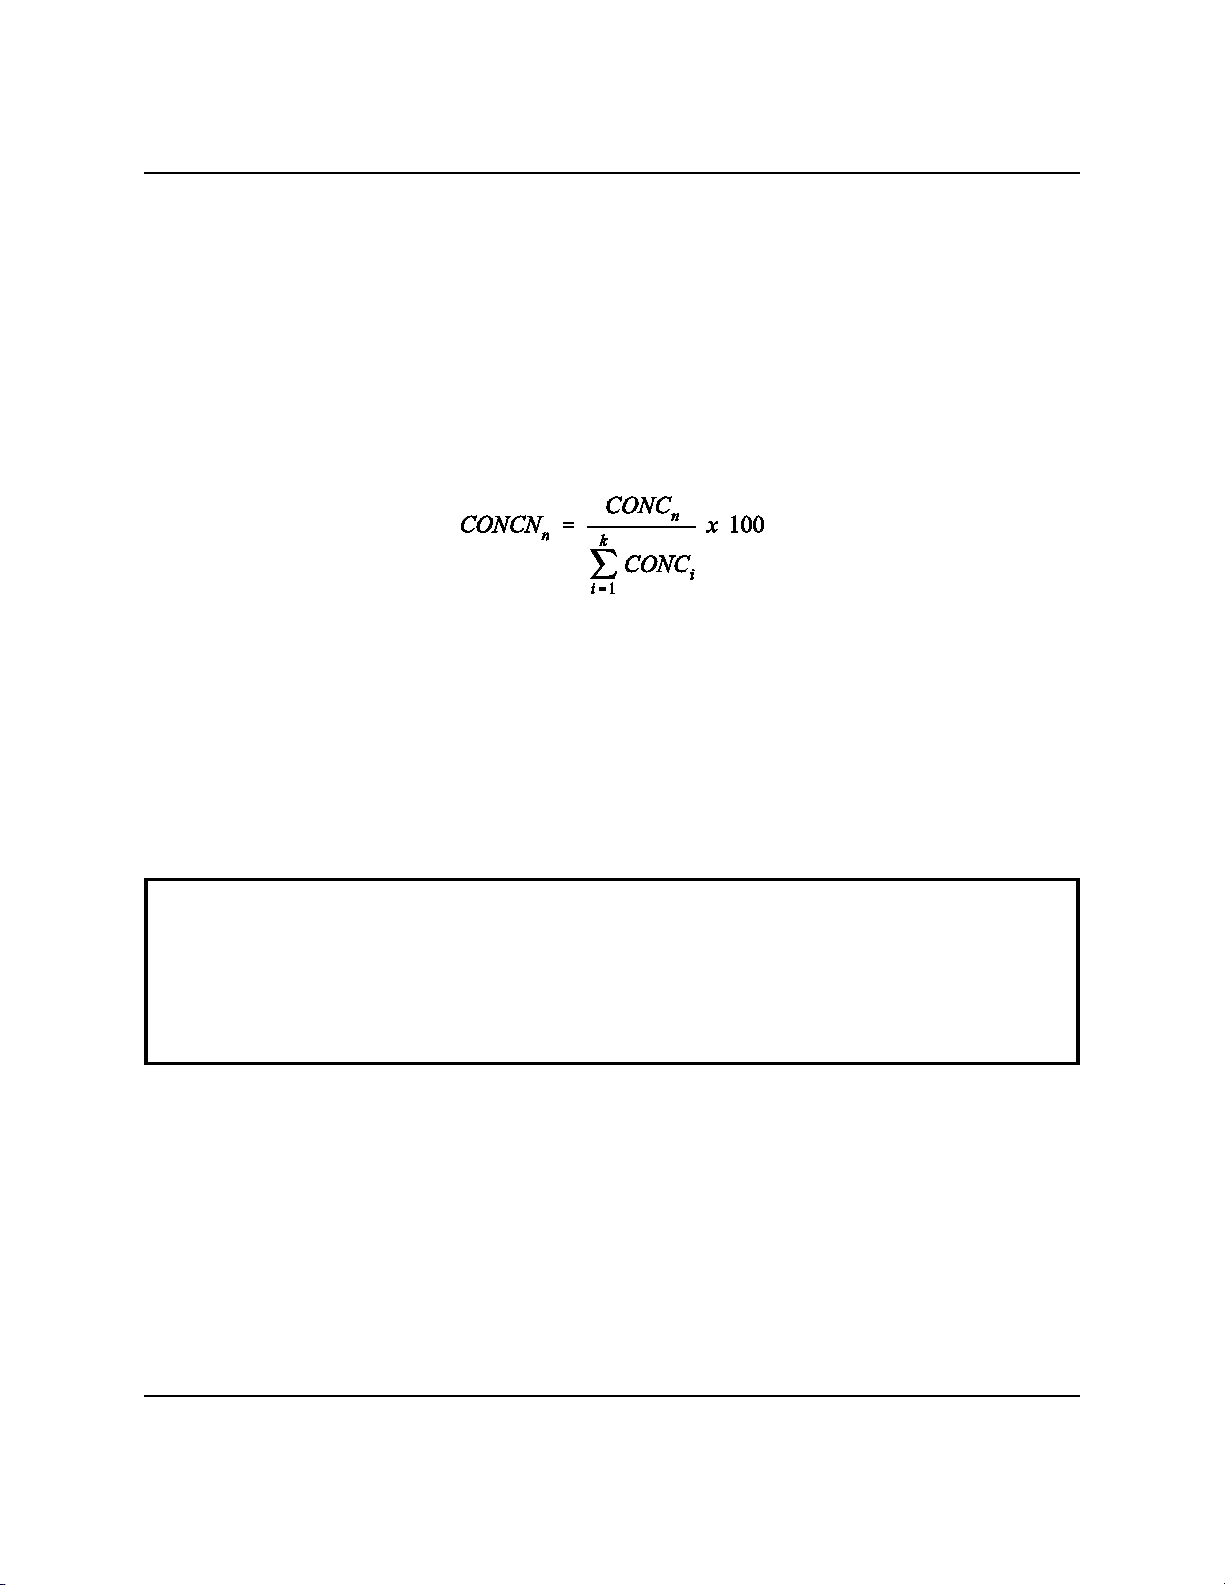
Concentration Calculations with Normalization
Where:
CONCN = Normalized concentration of component “n” in percent of total gas
n
concentration.
CONC = Non-normalized concentration of component “n” in mole %
CONC = Non-normalized concentration (in mole %) from each of the “k”
n
i
components to be grouped into this normalization
k = Number of components to be included in the normalization
For additional information about other calculations that are performed by the GC Controller
and software, see the MON2000 Software for Gas Chromatographs User Manual (P/N 39000-522).
1-18
DESCRIPTION
 Loading...